Attached files
| file | filename |
|---|---|
| EX-23.1 - CONSENT OF KPMG LLP - MSG NETWORKS INC. | msgexhibit231consentofkpmg.htm |
| EX-32.1 - CERTIFICATION BY THE CEO PURSUANT TO SECTION 906 OF THE SARBANES OXLEY ACT OF 02 - MSG NETWORKS INC. | msgexhibit321certification.htm |
| EX-21.1 - SUBSIDIARIES OF THE REGISTRANT - MSG NETWORKS INC. | msgexhibit211subsidiarieso.htm |
| EX-31.1 - CERTIFICATION BY THE CEO PURSUANT TO SECTION 302 OF THE SARBANES-OXLEY ACT OF 02 - MSG NETWORKS INC. | msgexhibit311certification.htm |
| EX-32.2 - CERTIFICATION BY THE CFO PURSUANT TO SECTION 906 OF THE SARBANES OXLEY ACT OF 02 - MSG NETWORKS INC. | msgexhibit322certification.htm |
| EXCEL - IDEA: XBRL DOCUMENT - MSG NETWORKS INC. | Financial_Report.xls |
| EX-31.2 - CERTIFICATION BY THE CFO PURSUANT TO SECTION 302 OF THE SARBANES OXLEY ACT OF 02 - MSG NETWORKS INC. | msgexhibit312certification.htm |
UNITED STATES SECURITIES AND EXCHANGE COMMISSION
WASHINGTON, D.C. 20549
FORM 10-K
(Mark One)
þ | ANNUAL REPORT PURSUANT TO SECTION 13 OR 15(d) OF THE SECURITIES EXCHANGE ACT OF 1934 |
For the fiscal year ended June 30, 2014
OR
o | TRANSITION REPORT PURSUANT TO SECTION 13 OR 15(d) OF THE SECURITIES EXCHANGE ACT OF 1934 [NO FEE REQUIRED] |
For the transition period from ___________ to _____________
Commission File Number | Registrant; State of Incorporation; Address and Telephone Number | IRS Employer Identification No. | ||
1-34434 | The Madison Square Garden Company | 27-0624498 | ||
Delaware
Two Pennsylvania Plaza
New York, NY 10121
(212) 465-6000
Securities registered pursuant to Section 12(b) of the Act: Title of each class: | Name of each Exchange on which Registered: | |
Class A Common Stock | The NASDAQ Stock Market LLC | |
Indicate by check mark if the Registrant is a well-known seasoned issuer, as defined in Rule 405 of the Securities Act. Yes þ No o
Indicate by check mark if the Registrant is not required to file reports pursuant to Section 13 or Section 15(d) of the Act. Yes o No þ
Indicate by check mark whether the Registrant (1) has filed all reports required to be filed by Section 13 or 15(d) of the Securities Exchange Act of 1934 during the preceding 12 months (or for such shorter period that the Registrant has been required to file such reports), and (2) has been subject to such filing requirements for the past 90 days. Yes þ No o
Indicate by check mark whether the registrant has submitted electronically and posted on its corporate Web site, if any, every Interactive Data File required to be submitted and posted pursuant to Rule 405 of Regulation S-T during the preceding 12 months (or for such shorter period that the registrant was required to submit and post such files). Yes þ No o
Indicate by a check mark if disclosure of delinquent filers pursuant to Item 405 of Regulation S-K is not contained herein, and will not be contained, to the best of the Registrant’s knowledge, in definitive proxy or information statements incorporated by reference in Part III of this Form 10-K or any amendment to this Form 10-K. þ
Indicate by check mark whether each Registrant is a large accelerated filer, accelerated filer, non-accelerated filer or smaller reporting company. See definition of large accelerated filer and accelerated filer in Exchange Act Rule 12b-2.
Large accelerated filer þ | Accelerated filer o | Non-accelerated filer o | Smaller reporting company o |
Indicate by check mark whether the Registrant is a shell company (as defined in Rule 12b-2 of the Exchange Act). Yes o No þ
Aggregate market value of the voting and non-voting common equity held by non-affiliates of The Madison Square Garden Company computed by reference to the price at which the common equity was last sold on The NASDAQ Stock Market LLC as of December 31, 2013, the last business day of the registrant's most recently completed second fiscal quarter, was approximately: $3,536,386,484.
Number of shares of common stock outstanding as of July 31, 2014:
Class A Common Stock — 63,606,819
Class B Common Stock — 13,588,555
Documents incorporated by reference — Certain information required for Part III of this report is incorporated herein by reference to the proxy statement for the 2014 annual meeting of the Company’s shareholders, expected to be filed within 120 days after the close of our fiscal year.
TABLE OF CONTENTS
Page | |
PART I
Item 1. Business
The Madison Square Garden Company is a Delaware corporation with our principal executive offices at Two Pennsylvania Plaza, New York, NY, 10121. Unless the context otherwise requires, all references to “we,” “us,” “our,” “Madison Square Garden” or the “Company” refer collectively to The Madison Square Garden Company, a holding company, and its direct and indirect subsidiaries through which substantially all of our operations are actually conducted. Our telephone number is 212-465-6000, our internet address is http://www.themadisonsquaregardencompany.com and the investor relations section of our web site is http://investor.msg.com. We make available, free of charge through the investor relations section of our web site, annual reports on Form 10-K, quarterly reports on Form 10-Q and current reports on Form 8-K and amendments to those reports filed or furnished pursuant to Section 13(a) or 15(d) of the Securities Exchange Act of 1934, as well as proxy statements, as soon as reasonably practicable after we electronically file such material with, or furnish it to, the Securities and Exchange Commission (“SEC”). References to our web site addressed in this report are provided as a convenience and the information contained on, or available through our web site is not part of this or any other report we file with or furnish to the SEC.
The Company was incorporated on July 29, 2009 as an indirect, wholly-owned subsidiary of Cablevision Systems Corporation (“Cablevision”). On January 12, 2010, Cablevision's board of directors approved the distribution of all of the outstanding common stock of the Company to Cablevision shareholders (the “Distribution”) and the Company thereafter acquired the subsidiaries of Cablevision that owned, directly and indirectly, all of the partnership interests in MSG Holdings, L.P. (“MSG L.P.”). MSG L.P. was the indirect, wholly-owned subsidiary of Cablevision through which Cablevision held the Madison Square Garden businesses until the Distribution occurred on February 9, 2010. MSG L.P. is now our wholly-owned subsidiary, through which we conduct substantially all of the business activities discussed in this Annual Report on Form 10-K.
3
Overview
The Company is a fully integrated sports, entertainment and media business comprised of dynamic and powerful assets and brands. Madison Square Garden's business grew from the legendary venue widely known as “The World's Most Famous Arena.” Drawing on its celebrated history, the Company builds iconic brands that set the standard for excellence and innovation while forging deep connections with diverse and passionate audiences. With an unparalleled portfolio of strategically aligned venues, content and distribution channels, the Company's three business segments — MSG Sports, MSG Media and MSG Entertainment — work together to deliver exceptional experiences that endure for generations.
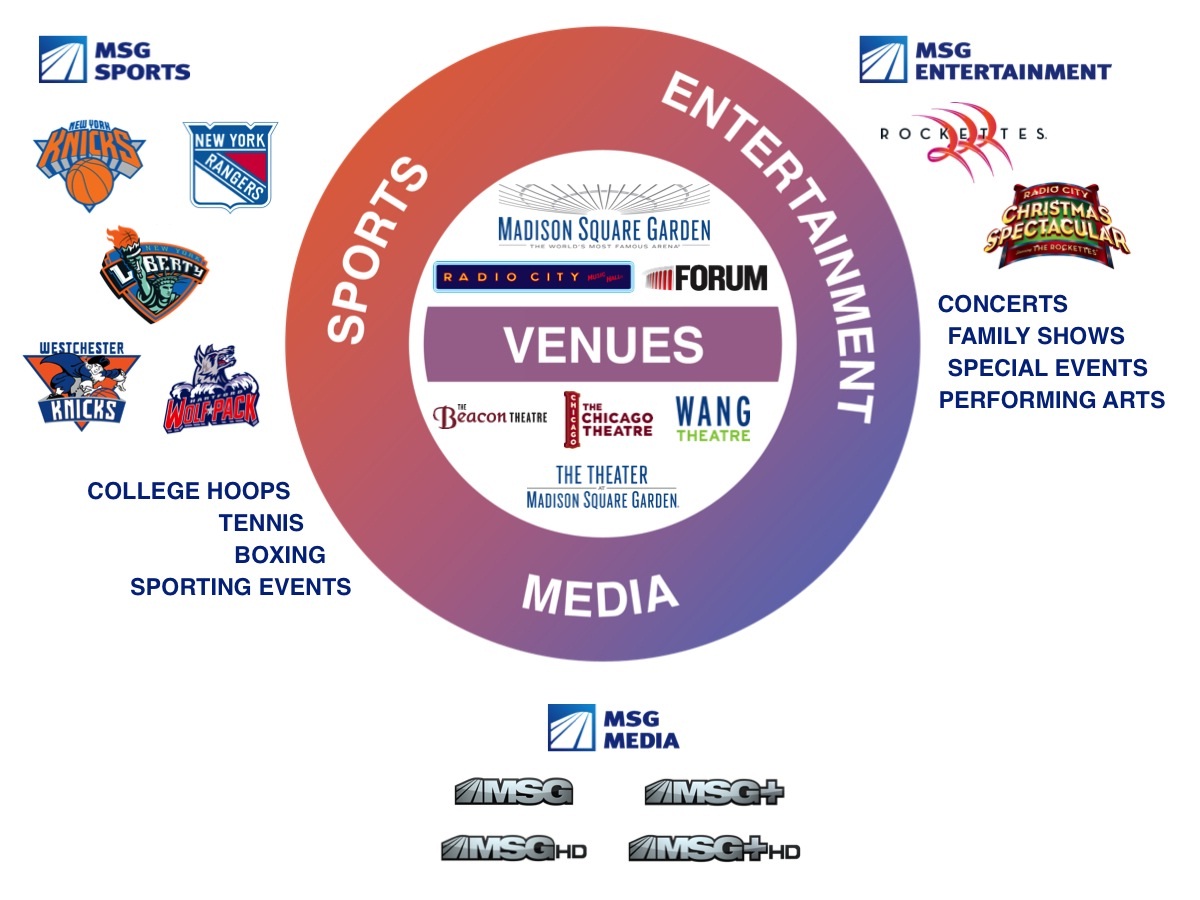
MSG Sports owns and operates the following sports franchises: the New York Knicks (the “Knicks”) of the National Basketball Association (the “NBA”), the New York Rangers (the “Rangers”) of the National Hockey League (the “NHL”), the New York Liberty (the “Liberty”) of the Women's National Basketball Association (the “WNBA”) and the Hartford Wolf Pack of the American Hockey League (the “AHL”). In March 2014, the Company acquired the rights to own and operate an NBA Development League (the “NBADL”) team, named the Westchester Knicks, which will launch its first season in November 2014. In addition, MSG Sports promotes, produces and/or presents a broad array of other live sporting events outside of Knicks, Rangers and Liberty games.
MSG Media is a leader in production and content development for multiple distribution platforms, including content originating from the Company's venues and is comprised of our regional sports networks, MSG Network and MSG+, collectively the “MSG Networks.” For all periods presented MSG Media also included Fuse, a national television network dedicated to music. On July 1, 2014, the Company completed the sale of Fuse to SiTV Media, Inc. for $226 million, subject to a working capital adjustment, and a 15 percent equity interest in SiTV Media, Inc., with the equity interest subject to potential reduction based on certain performance goals.
MSG Entertainment presents or hosts live entertainment events, including concerts, family shows, performing arts and special events, in our diverse collection of venues. Those venues include the Madison Square Garden Arena (which we also refer to as “The Garden”), The Theater at Madison Square Garden, Radio City Music Hall, the Beacon Theatre, The Chicago Theatre and the Wang Theatre. After purchasing the Forum in Inglewood, CA in 2012, the Company completed a successful renovation of the famed arena, which re-opened its doors in January 2014, adding yet another world-class venue to our portfolio. MSG
4
Entertainment also creates, produces and/or presents live productions, including the Radio City Christmas Spectacular, featuring the Radio City Rockettes (the “Rockettes”), that are performed in the Company's and other venues.
Our Strengths
Our key strengths are:
• | Owned sports franchises; |
• | Media assets, including affiliation agreements with distributors and exclusive sports programming rights; |
• | Iconic venues in top live entertainment markets; |
• | Diverse collection of marquee brands and content, including the Radio City Christmas Spectacular and the Rockettes; |
• | Powerful presence in the New York City metropolitan area with established core assets and expertise for strategic expansion; |
• | Unique ability to provide artists and productions with multiple distribution platforms to develop and promote their businesses; |
• | Strong industry relationships that create opportunities for new content and brand extensions; |
• | Deep connection with loyal and passionate fan bases that span a wide demographic mix; |
• | Extensive range of proprietary marketing assets, including an industry leading customer database that allows us to drive ticket sales and engagement with our brands; and |
• | Strong and seasoned management team. |
Our Strategy
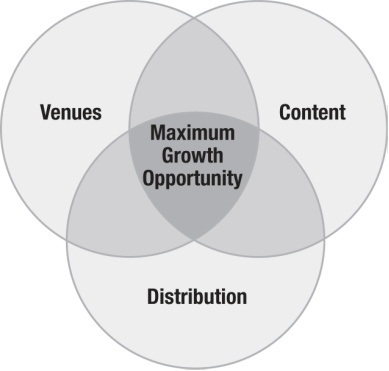
The Madison Square Garden Company pursues opportunities that capitalize on the combination of our iconic venues, our popular sports franchises, the distribution of our programming networks and our exclusive sports and entertainment content, as well as our marketing and sales expertise.
The core of MSG Sports' strategy is to develop teams that consistently compete for championships in their respective leagues. Leveraging the strength of its fan bases and the popularity of its teams, MSG Sports seeks to expand through the creation and/or acquisition of substantial, enduring sports properties and events that can be presented either inside or outside The Garden. Our extensive fan bases provide broad access to growth opportunities and new revenue streams.
Building on our iconic venues and the hallmark Radio City Christmas Spectacular and Rockettes brands, MSG Entertainment is focused on enhancing our existing productions, developing new productions and creating a network of venues in which we can deliver high-quality live content and increased bookings. We are pursuing a strategy of opportunistically acquiring, building or obtaining control of venues in key live entertainment markets. We own the Forum in Inglewood, CA and The Chicago Theatre in Chicago, and have a long-term booking agreement with respect to the Wang Theatre in Boston, which expands our geographic footprint outside of the New York City metropolitan area and provides multiple distribution outlets for our live entertainment content. Controlling and booking venues allows us to leverage our unique brands and marketing assets and increase utilization by working with artists and promoters to provide multi-market and multi-night engagements.
MSG Media has a strong foundation of recurring revenue streams supported by our ownership of Knicks, Rangers and Liberty rights, our multi-year rights for live-event coverage of the New York Islanders (the “Islanders”), the New Jersey Devils (the “Devils”), the Buffalo Sabres (the “Sabres”) and the New York Red Bulls (the “Red Bulls”), and our affiliation agreements for distribution of our programming networks. MSG Media's programming networks serve as powerful platforms through which athletes, artists and performers are connected to the nation's largest television market.
The Company believes that its competitive strength stems from combining opportunities across more than one of our segments and aligning these businesses to provide what no other organization can: sports and entertainment content derived from games and performances at our iconic venues and distributed through our programming networks.
5
Our ability to offer both marquee live performance venues and extensive public exposure through our significant marketing expertise and media platforms attracts world-class artists, performers and athletes to our businesses, and allows us to create with them relationships built on mutual benefit. We obtain quality sports and entertainment content, while the artists, performers and athletes gain unique opportunities to develop their brands. We have an expansive view of the power of this integrated approach and believe no other organization can offer athletes, artists, performers, fans and business partners comparable opportunities or experiences.
Examples of how we believe we have effectively implemented this integrated approach are:
• | Our MSG Sports and MSG Media businesses naturally complement each other — with MSG Sports providing valuable content and MSG Media serving as a vital distribution system and promotional platform. MSG Media, through MSG Networks, telecasts games of our Knicks, Rangers and Liberty teams, and we are continually exploring opportunities to enhance the relationship between MSG Sports and MSG Media through new events, both at our venues and elsewhere. In June 2014, in the weeks leading up to The Garden’s sold-out championship bout between Miguel Cotto and Sergio Martinez, MSG Network promoted the fight by featuring Cotto in a brand new episode of its original series, “The Game 365.” To generate excitement about the Men’s National Collegiate Athletic Association (“NCAA”) Basketball Tournament returning to The Garden for the first time in more than 50 years, MSG Network telecast an original program, “Hoopla: 80 Years of College Basketball at The Garden,” followed by three classic college basketball games held at Madison Square Garden. Additionally, in March 2014, these two segments paired up to, once again, take advantage of the interest and excitement of the BNP Paribas Showdown at The Garden by airing this event, featuring a match-up between top ranked tennis superstars Andy Murray and Novak Djokovic. |
• | MSG Media continues to seek opportunities to collaborate with MSG Entertainment to deliver programming that increases exposure of the Company’s brands, while differentiating our media offerings in a diverse and competitive environment. This includes MSG Network’s documentary on the historic transformation of The Garden. MSG Network already captured the first two phases of the three-year project in “The Garden Transformed: Year One” and Year Two and in December 2013, premiered the third and final installment of this original, award-winning series that takes a behind-the-scenes look at Madison Square Garden’s unprecedented, three-year, top-to-bottom transformation. January 2014 marked the start of monthly performances by the legendary Billy Joel at The Garden, with all currently announced shows running through December 2014 already sold out. MSG Network is helping to drive continued excitement and promotion for this partnership with programming throughout the summer that includes historic Billy Joel concerts, and a 30-minute special that gives fans a backstage pass to Billy Joel’s shows at The Garden, including interviews with Billy Joel and his band. This winter, MSG Network plans to unveil “The Garden’s Defining Moments,” 20, half-hour episodes that feature the iconic Garden moments currently on display in the arena as part of the newly transformed Garden, including “The Concert for New York City” and “12-12-12, The Concert for Sandy Relief.” |
• | Our integrated approach to the sale of marketing partnerships allows us to use and sell our broad array of assets in a complementary manner in order to maximize their collective value, both for the Company and for our marketing partners. Our “Marquee” marketing partnership with JPMorgan Chase and our “Signature” marketing partnerships with several other blue-chip companies integrate the assets of our venues and our three business segments. This ability to offer compelling, broad-based, integrated marketing platforms that we believe are unparalleled in sports and entertainment has enabled us to attract world-class partners, such as JPMorgan Chase, Anheuser-Busch, Coca-Cola, Delta Airlines, Kia Motors America, Lexus and SAP. |
6
• | We continue to forge deep direct-to-consumer relationships with customers and fans, with a focus on understanding how consumers interact with every aspect of the Company. A key component of this strategy is our large and growing proprietary customer database which drives revenue and engagement across segments, benefiting the Company through ticket sales, merchandise sales, sponsorship activation and viewership on television and online. This database provides us a greater opportunity to cross-promote our products and services, introducing customers to our wide range of assets and brands. For example, we have used our database to cross-promote MSG Networks' programming to fans of MSG Entertainment and MSG Sports, including the networks coverage of the Knicks, Rangers and Liberty, and its lineup of Billy Joel programming. We also continue to use our database to cross-promote events between MSG Entertainment and MSG Sports, including driving ticket sales to the Radio City Christmas Spectacular from fans of the Knicks, Rangers and Liberty. |
Our commitment to strengthening our core assets is also exemplified by the transformation of The Garden into a state-of-the-art facility (the “Transformation”) that enhances the experience of our customers, partners, athletes and entertainers and is designed to attract even more marquee events to the building, while enhancing our revenue streams (the Transformation is discussed in greater detail under “— Our Venues — The Madison Square Garden Arena Transformation”). The Transformation is designed to ensure The Garden's continued and lasting prominence as a sports and entertainment venue.
We believe the Company's unique combination of assets and integrated approach, the depth of our relationships within the sports, media and entertainment industries and strong connection with our diverse and passionate audiences, sets the Company apart in the industry and represents a substantial opportunity for growth.
At the same time, we continue to look externally for strategic opportunities to add compelling assets and brands that resonate with our customers and partners, fit with our core competencies and allow new opportunities for growth.
Our Business
MSG Sports
MSG Sports owns and operates sports franchises, as well as promotes, produces and/or presents a broad array of other live sporting events.
Our Sports Franchises
The Knicks and Rangers are two of the most recognized franchises in professional sports, with storied histories and passionate, multi-generational fan bases. These teams are major occupants of The Garden as they traditionally play a combined total of 82 regular season home games, often to at or near capacity attendance. The number of home games increases if our teams qualify for the playoffs. We did not host any preseason Rangers games in fiscal year 2014 at The Garden due to the final stage of the Transformation. The Liberty have historically played 17 regular season home games at The Garden. However, due to the final phase of the Transformation, they played their 2013 season at the Prudential Center in Newark, New Jersey before returning to The Garden for their 2014 season.
In addition to being valuable stand-alone businesses, the Knicks and Rangers provide core content for our MSG Media segment, with a total of 159 preseason, regular season and playoff games (both home and away) telecast on MSG Networks during the 2013-14 season, and generate significant audience demand for wrap-around and themed programming. As part of both team and league marketing and telecasts, our sports teams provide both regional and national visibility for the Company.
New York Knicks
As an original franchise of the NBA, the Knicks have a rich history that includes eight trips to the NBA Finals and two NBA Championships, as well as some of the greatest athletes to ever play the game. The Knicks are focused on continuing to field a championship contending team, while playing their exciting, energetic and entertaining style of basketball. The Knicks enjoy the fierce allegiance of generations of passionate and knowledgeable fans. In March 2014, Phil Jackson, who has an extraordinary history of success that includes 13 NBA championships, was named president of the Knicks. This was followed in June by Derek Fisher, a five-time NBA champion, being hired as the team's new head coach. The Knicks ranked in the top three in the NBA for ticket sales receipts for the 2013-14 regular season, which marked the fourth consecutive year that Knicks season tickets sold out.
New York Rangers
The Rangers hockey club is one of the “original six” franchises of the NHL. Winners of four Stanley Cup Championships, the Rangers have won eleven conference titles over their history. For the 2013-14 season, the Rangers, led by new coach Alain Vigneault, qualified for the playoffs for the eighth time in the last nine years and, after an inspirational run, ended the playoffs
7
as Eastern Conference Champions, having gone to the Stanley Cup Finals for the first time in twenty years. The Rangers are known to have one of the most passionate, loyal and enthusiastic fan bases in all of sports and ranked in the top three in the NHL for ticket sales receipts for the 2013-14 regular season.
New York Liberty
The Liberty was established in October 1996, when New York was selected as one of eight charter members of the WNBA. The Liberty have won three conference championships and appeared in the playoffs twelve times. The Liberty have a well-known tradition of on-court competitiveness supported by an enthusiastic and loyal fan base.
Westchester Knicks
In March 2014, the Company acquired the right to own and operate an NBADL team, which has been named the Westchester Knicks. The new team, which is the NBADL's 18th franchise, serves as the exclusive affiliate of the New York Knicks and will debut in the 2014-15 season, playing its home games at the Westchester County Center in White Plains, New York.
Hartford Wolf Pack
The Hartford Wolf Pack, a minor-league hockey team, is a player development team for the Rangers, and is also competitive in its own right in the AHL. The Rangers send draft picks and other players to the Hartford Wolf Pack for skill development and injury rehabilitation, and can call up players as needed for the Rangers roster to enhance the team's competitiveness. The Hartford Wolf Pack have reached the playoffs fourteen times out of seventeen seasons.
The Role of the Leagues in Our Operations
As franchises in professional sports leagues, our teams are members of their respective leagues and, as such, may be subject to certain limitations, under certain circumstances, on the control and management of their affairs. The respective league constitutions, under which each league is operated, together with the collective bargaining agreements (“CBAs”) each league has signed with its players' association, contain numerous provisions that, as a practical matter in certain circumstances, could impact the manner in which we operate our businesses. In addition, under the respective league constitutions, the commissioner of each league, either acting alone or with the consent of a majority (or, in some cases, a supermajority) of the other teams in the league, may be empowered in certain circumstances to take certain actions felt to be in the best interests of the league, whether or not such actions would benefit our teams and whether or not we consent or object to those actions.
While the precise rights and obligations of member teams vary from league to league, the leagues have varying degrees of control exercisable under certain circumstances over the length and format of the playing season, including preseason and playoff schedules; the operating territories of the member teams; national and international media and other licensing rights; admission of new members and changes in ownership; franchise relocations; indebtedness affecting the franchises; and labor relations with the players' associations, including collective bargaining, free agency, and rules applicable to player transactions, luxury taxes and revenue sharing. See “Part II — Item 7. Management's Discussion and Analysis of Financial Condition and Results of Operations — Business Overview — MSG Sports — Expenses.” From time to time, we may disagree with or challenge actions the leagues take or the power and authority they assert, although the leagues' governing documents and our agreements with the leagues purport to limit the manner in which we may challenge decisions and actions by a league commissioner or the league itself.
Other Sports Properties
MSG Sports also promotes, produces and/or presents a broad array of live sporting events outside of Knicks, Rangers and Liberty games. These events include, for example, professional boxing, college basketball, professional bull riding, tennis, and college wrestling. Our sports business includes events that have been among the most popular in our history, as well as perennial highlights on our annual calendar, and also features some of Madison Square Garden's longest-running associations.
Professional boxing, beginning with John L. Sullivan in 1882, has had a long association with The Garden, which has included hosting Muhammad Ali's and Joe Frazier's 1971 “Fight of the Century,” considered among the greatest sporting events in modern history, as well as bouts featuring dozens of other boxing greats. These have included Jack Dempsey, Roberto Duran, George Foreman, Emile Griffith, Willie Pep, Oscar De La Hoya, Sugar Ray Leonard, Lennox Lewis, Joe Louis, Rocky Marciano, Sugar Ray Robinson, Felix Trinidad, Roy Jones, Jr., Mike Tyson, Evander Holyfield and Miguel Cotto, who in June 2014 won his fourth world title at The Garden in front of approximately 20,000 fans.
College basketball has been a mainstay at The Garden for decades, with the sport's longest running holiday showcase, the Holiday Festival, first tipping off over 50 years ago. In addition to St. John's University calling The Garden its home away from home, the popular Big East Tournament celebrated its 32nd anniversary at The Garden in 2014. Popular college basketball
8
events also include visits from Duke University's Blue Devils, the annual Jimmy V Classic and the post-season NIT Finals. In March 2014, the East Regional Finals of The NCAA Division I Men's Basketball Championship returned to The Garden for the first time in more than 50 years. In February 2015, The Garden will welcome the 64th NBA All-Star Game, marking the fifth time the arena has hosted the illustrious professional basketball event. Additionally, The Garden hosts the annual BNP Paribas Showdown tennis event, which, since debuting in 2009, has featured tennis luminaries such as Pete Sampras, Roger Federer, Rafael Nadal, Novak Djokovic, Serena and Venus Williams and Maria Sharapova.
MSG Entertainment
Our MSG Entertainment business is one of the country's leaders in live entertainment. MSG Entertainment presents or hosts live entertainment events, including concerts, family shows, performing arts events and special events, in our diverse collection of venues. It also creates, produces and/or presents live productions that are performed in the Company's and other venues. This includes the Radio City Christmas Spectacular, featuring the Rockettes, which is the top grossing live holiday family show in North America. The venues we own or operate include The Garden, Radio City Music Hall, The Theater at Madison Square Garden, the Beacon Theatre, the Forum and The Chicago Theatre. In addition, we have a long-term exclusive booking agreement with respect to the Wang Theatre. The scope of our collection of venues enables us to showcase acts that cover a wide spectrum of genres and popular appeal. MSG Entertainment focuses on delivering unforgettable memories through spectacular productions, live events and unrivaled experiences in exceptional settings, creating demand for an association with our brands by artists and premier companies, and for our productions by the public. With a foundation of world-class expertise in live entertainment, including the historic traditions of The World's Most Famous Arena and Radio City Music Hall, as well as our other venues, MSG Entertainment has a proven ability to utilize the strength of its industry relationships, marketing assets, customer database and live event expertise, as well as the reach of MSG Media, to create performance, promotion and distribution opportunities for artists, events and productions, and to increase utilization of our venues.
Our Bookings and Other Entertainment Business Activities
MSG Entertainment is an established industry leader responsible for booking a wide variety of live entertainment events in our venues, which perennially include some of the biggest names in music and entertainment. Over the last several years, our venues have hosted artists such as Billy Joel, the Eagles, Madonna, Phish, Elton John, Eric Clapton, The Allman Brothers Band, Bruce Springsteen, Maroon 5, Taylor Swift, Justin Timberlake, Ed Sheeran, Armin Van Buuren, Sting and Paul Simon, Coldplay, One Direction, Jerry Seinfeld and Dave Chappelle; family shows such as Sesame Street Live, Yo Gabba Gabba Live and Disney Junior Live; special events such as the Tony Awards, “America's Got Talent” and appearances by His Holiness the Dalai Lama, along with graduations, upfronts and product launches; and theatrical productions such as A Christmas Story, How The Grinch Stole Christmas! and Cirque du Soleil's Zarkana.
Although we primarily license our venues to third-party promoters for a fee, we also promote or co-promote shows in which case we have economic risk relating to the event. MSG Entertainment currently does not promote or co-promote events outside of our venues other than our productions discussed below.
Our Productions
One of MSG Entertainment's core properties, the Radio City Christmas Spectacular, has been performed at Radio City Music Hall for 81 years and during the 2013 holiday season more than one million tickets were sold for performances there. Featuring the world-famous Rockettes, the critically acclaimed Radio City Christmas Spectacular features show-stopping performances, festive holiday scenes and state-of-the-art special effects. As part of our strategic commitment to invest in our core assets, the Company continues to seek opportunities to enhance the Radio City Christmas Spectacular. These enhancements include a new finale added in the 2013 holiday season, and the planned return of a fan favorite scene to the show in 2014.
Based on the success of the Radio City Christmas Spectacular at Radio City Music Hall, in 1994 the Radio City Christmas Spectacular franchise was expanded outside of New York City. During the 2014 holiday season, we expect to present the theater version of the show in targeted markets, including Omaha, Houston and, for the 13th year, at the Grand Ole Opry House in Nashville.
Since its inception, the Radio City Christmas Spectacular has played to over 70 million people in over 70 different cities. We acquired the rights to the Radio City Christmas Spectacular in 1997, and those rights are separate from, and do not depend on the continuation of, our lease of Radio City Music Hall. We also hold rights to the Rockettes in the same manner.
We continue to strengthen and broaden our Rockettes brand, targeting the most prominent and effective vehicles that elevate their visibility and underscore their reputation as beloved American cultural icons. The Rockettes have appeared or performed at high profile events, including Presidential Inaugurations, the annual Macy's Thanksgiving Day Parade, the New Year's Eve Times Square Ball Drop, the Super Bowl XLV numeral unveil, the Major League Baseball Home Run Derby, television shows
9
(“America's Got Talent,” “Project Runway,” “The Today Show,” “The Colbert Report,” “Late Night with Jimmy Fallon” and Home Shopping Network), and fashion events (Michael Kors Fashion's Night Out and Capezio Anniversary Gala), among many others. The Rockettes have established national partnerships with Zumba Fitness and Norwegian Cruise Lines, where the Rockettes were named Godmothers for the new 4,000 passenger ship, Norwegian Breakaway. In addition, the Rockettes continue to focus on dance education and training through programs in New York and other markets, including the Rockettes Summer Intensive and The Rockettes Experience. We continue to pursue carefully considered brand extension opportunities including television and public appearances, strategic partnerships, dance education and new merchandising lines.
We are investing in a new large-scale theatrical production for Radio City Music Hall featuring the Rockettes, which is expected to debut in the Spring of 2015.
MSG Media
MSG Media is a leader in production and content development for multiple distribution platforms and is comprised of our regional sports networks, MSG Network and MSG+, collectively the “MSG Networks.” These two regional networks provide a distribution outlet for content created, produced and/or presented by MSG Sports and MSG Entertainment, and thereby play a critical role in supporting, promoting and enhancing those businesses.
Over the past seven years, MSG Network has won 99 New York Emmy awards for live sports and original programming, more than any other single network or station in the region. MSG Network, MSG+ and msg.com have a combined total of 113 New York Emmy wins over the past seven years.
MSG Networks are home to seven professional sports teams, as well as critically acclaimed original programming. In addition to the Company's ownership of Knicks, Rangers and Liberty rights, MSG Networks have multi-year rights agreements with the Islanders, Devils, Sabres and Red Bulls. MSG Network and MSG+ are among the nation's largest regional cable networks and together typically telecast approximately 700 live sporting events and over 2,500 hours of live original programming each year, as well as college football and college basketball from top conferences, including the Atlantic Coast Conference (football and basketball), Big 12 (football and basketball), Conference USA (football and basketball) and the Big East (basketball).
MSG Networks continues to produce original programming that increases exposure for the Company's brands and builds on our library of compelling content. Examples include:
• | Special series such as “The Garden Transformed” and “The Garden’s Defining Moments,” which is planned to debut this winter; |
• | Critically acclaimed MSG Originals series, including “Four Courses with JB Smoove,” “Beginnings,” “The Game 365” and “The Lineup” and; |
• | Programming relating to the Knicks and Rangers, such as Knicks and Rangers coach’s shows, “MSG Profiles”, “Hockey Night Live” and dedicated pre- and post-game shows, all of which allow us to capitalize on the extraordinary enthusiasm of our teams' fans. |
MSG Network is also the official regional sports network of the New York Giants, delivering exclusive, special non-game coverage of the National Football League team, including Head Coach Tom Coughlin’s live weekly press conference. Additional programming on MSG+ includes a lineup of select NCAA college football and basketball games, the New York Racing Association horse racing, and international sports content such as Union of European Football Association league soccer, as well as original programming related to the network's professional teams. The average of the combined reach of MSG Network and MSG+ is approximately 7.8 million viewing subscribers, primarily in New York, New Jersey, and Connecticut.
Our Interactive Initiatives
The Company has a collection of web sites and mobile, video on demand and digital platforms, which are housed throughout Madison Square Garden's business segments. These interactive initiatives include more than 20 web sites, social networking sites and mobile applications for our properties. Web sites include msg.com, thegarden.com, radiocity.com, beacontheatre.com, fabulousforum.com, chicagotheatre.com, radiocitychristmas.com and rockettes.com, as well as sites dedicated to our sports teams (nyknicks.com, newyorkrangers.com, knicksnow.com, blueshirtsunited.com and newyorkliberty.com). Like our MSG Sports business, the online operations relating to our sports teams may, in certain circumstances, be subject to certain agreements, rules, policies, regulations and directives of the leagues in which the respective team operates. See “— Regulation — Regulation of Our Media Business.” These interactive properties also include the MSG Insider email, alert and mobile platform and a series of Madison Square Garden social network sites. This interactive business generates revenue for all of the
10
Company's segments via the sale of advertising and sponsorships on these digital properties. Additionally, it offers a strategic marketing asset that creates opportunities to market directly to our fans and cross-promote across our businesses.
Our Venues
The Company operates a mix of iconic venues that continue to build on their historic prominence as destinations for unforgettable experiences and events. Individually, these venues are each premier showplaces, with a passionate and loyal following of fans, performers and events. Taken together, we believe they represent an outstanding collection of venues.
We own or operate under long-term leases a total of six venues in New York City, Chicago and Inglewood, CA and have a long-term booking agreement with respect to the Wang Theatre in Boston. Our New York City venues are the Madison Square Garden Complex (which includes both The Garden and The Theater at Madison Square Garden), Radio City Music Hall and the Beacon Theatre. We also own the Forum in Inglewood, CA and the landmark Chicago Theatre.
Madison Square Garden Arena
The Madison Square Garden Arena has been a celebrated center of New York life since it first opened its doors in 1879. Over its 135-year history, there have been four Garden buildings, each known for showcasing the best of the era's live entertainment offerings. We believe that The Garden has come to epitomize the power and passion of live sports and entertainment to people around the world, with an appearance at The Garden often representing a pinnacle of an athlete's or performer's career. Known as “The World's Most Famous Arena,” The Garden has been the site of some of the most memorable events in sports and entertainment, and, along with The Theater at Madison Square Garden, has hosted hundreds of events and millions of visitors this past year. In 2009, Billboard Magazine ranked The Garden the number one venue of the decade in its respective class based upon gross ticket sales. Billboard Magazine also ranked The Garden the second highest-grossing entertainment venue of its size in the world based on the magazine's 2014 mid-year rankings. Music industry subscribers of the trade magazine Pollstar have voted The Garden “Arena of the Year” 18 out of the last 22 years.
The Garden is home to the Knicks, Rangers, and Liberty and is associated with countless “big events,” inspired performances and one-of-a-kind moments. The Garden's highlights include “The Fight of the Century” between Muhammad Ali and Joe Frazier in 1971 (considered among the greatest sporting events in history); the 1970 Knicks' NBA Championship; the Rangers' 1994 Stanley Cup Championship; three Democratic National Conventions and one Republican National Convention; a landmark visit from Pope John Paul II; Marilyn Monroe's famous birthday serenade to President John F. Kennedy; Frank Sinatra's “Main Event” concert in 1974; Elton John's record 64 performances; the only U.S. concerts from the reunited Cream; and the 25th Anniversary Rock and Roll Hall of Fame concerts. The Garden has also hosted four prominent benefit concerts, which galvanized the public to respond to national and global crises, including the first of its kind, The Concert for Bangladesh in 1972, as well as “The Concert for New York City,” following the events of 9/11; “From the Big Apple to the Big Easy”, held after Hurricane Katrina in 2005; and “12-12-12, The Concert for Sandy Relief”, in 2012.
January 2014 marked the start of monthly performances by the legendary Billy Joel at The Garden, with all currently announced shows running through December 2014 already sold out. Since Billy Joel’s first show at The Garden in 1978, the internationally acclaimed, six-time Grammy-winning New Yorker has played an important role in the venue’s iconic history that has included a record-breaking, sold-out run of 12 consecutive shows in 2006, and moving performances at both the “The Concert for New York City” and “12-12-12, The Concert for Sandy Relief” benefit concerts.
The current Madison Square Garden Complex, located between 31st and 33rd Streets and Seventh and Eighth Avenues on Manhattan's West Side, opened on February 11, 1968 with a salute to the U.S.O. hosted by Bob Hope and Bing Crosby. From a structural standpoint, the construction of the current Garden was considered an engineering wonder for its time, including its famous circular shape and unique, cable-supported ceiling, which contributes to its intimate feel. It was the first large structure built over an active railroad track. The builder, R.E. McKee, had a national reputation and was later recognized as a “Master Builder” by the construction industry. Architect Charles Luckman had one of the largest firms in the country and designed such buildings as the Prudential Tower in Boston, NASA's flight center in Houston and the Forum in Inglewood, CA.
We own the Madison Square Garden Complex, the platform on which it is built and development rights (including air rights) above our property. Madison Square Garden sits atop Pennsylvania Station, a major commuter hub in Manhattan, which is owned by the National Railroad Passenger Corporation (Amtrak). While the development rights we own would permit us to expand in the future, any such use of development rights would require various approvals from the City of New York. With the successful completion of the Transformation in October 2013, The Garden, once again, seats up to approximately 21,000 spectators for sporting and entertainment events. The Garden, along with The Theater at Madison Square Garden, contains approximately 1,100,000 square feet of floor space over 11 levels.
11
The Madison Square Garden Arena Transformation
October 25, 2013 marked the debut of a fully transformed Madison Square Garden Arena. The completion of The Garden’s three-year, top-to-bottom Transformation is driving growth across several categories, including tickets, suites, sponsorships, food, beverage and merchandise sales and will continue to have multiple benefits, including:
• | Providing a state-of-the-art venue that can continue to attract concerts, as well as other large, high-profile sports, entertainment and other special events which benefit our customers, as well as the New York City economy; |
• | Improving the experience of customers from the first row to the last; |
• | Increasing our attractiveness to free agents in basketball and hockey; |
• | Supporting our efforts to maximize our season ticket sales for our teams; |
• | Increasing the breadth of VIP offerings and venue-based opportunities available to marketing partners; |
• | Augmenting revenue streams; and |
• | Providing a new point of origination for programming for our MSG Networks studios. |
The Transformation is an example of our strategic commitment to invest in our core assets and continue to provide the kind of historic, unforgettable experiences that have long been a key component of our business. Focused on the total fan experience, the Transformation is designed to benefit everyone in attendance, whether they are first time visitors, season ticket subscribers, athletes, suite holders or marketing partners. Our customers now have access to a full list of amenities including: improved sightlines; additional entertainment and dining options; new concourses; upgraded hospitality areas; new technology; and a completely transformed interior, where the intimacy of the arena bowl and The Garden's world famous ceiling have been maintained. The Transformation of The Garden is intended to ensure that attending an event at The Garden is unlike anywhere else and is specifically highlighted by:
• | The new Chase Square Seventh Avenue entrance, which is nearly double the size of the previous entrance and features interactive kiosks, retail space, climate-controlled space, and broadcast area; |
• | Public concourses that are double or triple in width, some with spectacular city views; |
• | A new wide selection of food and beverage options, including exclusive food offerings from our MSG Signature Collection, featuring some of New York's top chefs; |
• | Improved upper bowl sightlines that put patrons over 17 degrees closer to the action; |
• | New bridges that provide one-of-a-kind views of the arena floor and offer a unique perspective for fans, which we refer to as the Chase Bridges; |
• | State-of-the-art lighting, sound and LED video systems in high definition, and new fiber-optic cabling throughout the building; |
• | Improved locker rooms, dressing rooms, green rooms and production offices; |
• | Additional restrooms with 50 percent more capacity; |
• | Unique exhibits throughout the building that celebrate the Garden’s storied history, including our Garden 366 visual retrospective and the Defining Moments exhibit on the Madison and Garden Concourse levels; and |
• | Corporate offerings that include: |
◦ | 21 Event Level suites that offer a lounge/entertaining atmosphere; |
◦ | 58 Madison Level suites that are 40 percent larger than our previous suite offerings and located as close as 23 rows up from the arena floor; |
◦ | 18 transformed 9th floor Signature Level suites; and |
12
◦ | Three new club spaces: the 1879 Club presented by J.P. Morgan, the Delta SKY360 Club on the Event Level and the Madison Club presented by Foxwoods on the 7th floor of The Garden. |
The Theater at Madison Square Garden
The Theater at Madison Square Garden, which has approximately 5,600 seats, opened as part of the fourth Madison Square Garden Complex in 1968, with seven nights of performances by Judy Garland. Since then, some of the biggest and most exciting names in live entertainment have played the theater, including The Who, Bob Dylan, Diana Ross, Elton John, James Taylor, Macklemore & Ryan Lewis, Ellie Goulding, Ricky Gervais, Neil Young, Radiohead, Jerry Seinfeld and Van Morrison. The Theater at Madison Square Garden has also hosted boxing events and the NBA Draft; award shows such as The Daytime Emmys and the Essence Awards; and other special events including Wheel of Fortune and audition shows for “America's Got Talent.” We also host a variety of theatrical productions, family shows and other special events in The Theater, including A Christmas Story, How The Grinch Stole Christmas!, Sesame Street Live and Disney's Phineas and Ferb. The Theater at Madison Square Garden is the fifth highest-grossing entertainment venue of its size in the world, based on Billboard Magazine's 2014 mid-year rankings.
Radio City Music Hall
Radio City Music Hall has a rich history as a national theatrical and cultural mecca since it was first built by theatrical impresario S.L. “Roxy” Rothafel in 1932. Known as “The Showplace of the Nation,” it was the first building in the Rockefeller Center complex and, at the time, the largest indoor theater in the world. Perhaps best known as home to the country's number one live holiday family show, the Radio City Christmas Spectacular, starring the world-famous Rockettes, Radio City Music Hall also hosts concerts, family shows and special events. See “— MSG Entertainment — Our Productions.” In 2009, Billboard Magazine ranked Radio City Music Hall the number one venue of the decade in its respective class based upon gross ticket sales. In 2013, Billboard Magazine presented Radio City Music Hall with the Top Venue (under 10,000 seats) award at its annual Billboard Touring Awards. Radio City Music Hall is the highest-grossing entertainment venue of its size in the world, based on Billboard Magazine's 2014 mid-year rankings.
In 1978, Radio City Music Hall was designated a New York City landmark by the NYC Landmarks Preservation Commission and a national landmark on the National Register of Historic Places. We acquired the lease in 1997, and in 1999, in another example of our commitment to invest in our core assets to help drive our long-term business, we invested in a complete restoration that returned the legendary theater to its original grandeur. Our acclaimed restoration included burnishing the ceilings of Radio City Music Hall with 720,000 sheets of gold and aluminum leaf, replacing the existing stage curtain with a new 112-foot wide golden silk curtain, and replacing its approximately 6,000 seats. All furniture, wall fabric, carpeting, lighting fixtures and appointments were cleaned, repaired or remade, and the three-story tall mural “The Fountain of Youth,” by Ezra Winter, which looms above the grand staircase, was cleaned of decades of grime, varnish and polyurethane. State-of-the-art sound systems, lighting and HDTV capabilities were also installed.
We lease Radio City Music Hall, located at Sixth Avenue and 50th Street in Manhattan, pursuant to a long-term lease agreement. The lease on Radio City Music Hall expires in 2023. We have the option to renew the lease for an additional ten years by providing two years' notice prior to the initial expiration date.
The Beacon Theatre
In November 2006, we entered into a long-term lease agreement to operate the legendary Beacon Theatre, a venue with approximately 2,800 seats, which sits on the corner of Broadway and 74th Street in Manhattan. The Beacon Theatre was conceived of by S. L. “Roxy” Rothafel and is considered the “older sister” to Radio City Music Hall. Designed by Chicago architect Walter Ahlschlager, the Beacon Theatre opened in 1929 as a forum for vaudeville acts, musical productions, drama, opera, and movies. The Beacon Theatre was designated a New York City landmark by the NYC Landmarks Preservation Commission in 1979 and a national landmark on the National Register of Historic Places in 1982. Over its history, the Beacon Theatre has been a venerable rock and roll room for some of the greatest names in music including The Allman Brothers Band, Steely Dan, Coldplay, Crosby Stills & Nash, Jackson Browne, Elton John, Tom Petty and the Heartbreakers and Eddie Vedder. The Beacon Theatre has also hosted film premieres and comedy events, including a five-night run from Eddie Izzard in 2014, along with numerous luminaries such as His Holiness the Dalai Lama in 2009 and 2013, and President Bill Clinton in 2006, when the Rolling Stones played a private concert in honor of his 60th birthday.
In order to ensure that we could deliver a first-class experience to customers and performers, in August of 2008 we closed the Beacon Theatre for a seven-month restoration project to return the theater to its original 1929 grandeur. The restoration of the Beacon Theatre focused on all historic, interior public spaces of the building, backstage and back-of-house areas, and was based on extensive historic research, as well as detailed, on-site examination of original, decorative painting techniques that had been covered by decades-old layers of paint. The Beacon Theatre has won several architectural awards recognizing its
13
outstanding restoration. The widely acclaimed, comprehensive restoration was similar to our restoration of Radio City Music Hall, and reflects our commitment to New York City. The Beacon Theatre was the second highest-grossing entertainment venue of its size in the world, based on Billboard Magazine's 2013 full year rankings.
Our lease on the Beacon Theatre expires in 2026.
The Forum
In June 2012, we expanded our geographic footprint even further with the purchase of the Forum in Inglewood, CA, which serves the Greater Los Angeles area. Following an extensive renovation of the historic venue, on January 15, 2014, the Forum re-opened with the first of six concerts by the legendary Eagles and is once again a thriving destination for both artists and music fans. The acquisition of the Forum establishes a significant West Coast presence for our Company and provides us with iconic arenas in each of the country's two largest entertainment markets.
With the successful completion of an extensive renovation, the Forum is now the only arena-sized venue in the country dedicated to music and entertainment, and offers something exceptional for everyone — artists, promoters, music fans, VIP customers and marketing partners. Architecturally, the interior of the bowl has been completely modernized and features superior acoustics, along with flexible seating that ranges from 7,000 seats to 17,800 seats — allowing the venue to accommodate a wide variety of premier events. Fans seated on the floor have access to one of the largest general admission floors in the country, with approximately 8,000 square feet of new event level hospitality offerings, including food and beverage, merchandise and restrooms. The new Forum also offers exclusive spaces for VIP customers, including the historic Forum Club, which has been completely re-imagined with thematic music-inspired detailing.
For artists, the Forum delivers a first-class experience that includes seven, star-caliber dressing rooms with upgraded amenities. Among the key features that were resurrected in an effort to replicate the original design is the exterior color of the venue, which has returned to the 1960's “California sunset red,” and is now officially known as “Forum Red.” Other outdoor features include the addition of a distinct and iconic Forum marquee that reflects the architecture of the venue and a 40,000 square foot terrace that surrounds the perimeter of the building and offers upgraded food and beverage amenities, elevating the guest experience.
The original Forum was designed by renowned architect, Charles Luckman, who also designed the Madison Square Garden Arena that opened in 1968. The historic West Coast venue, which opened in 1967, has played host to some of the greatest musical performers of all time, including The Rolling Stones, The Jackson 5, Bob Dylan, Led Zeppelin, Madonna, Van Halen, Foo Fighters, Coldplay and many others. In addition, the Forum was home to the Los Angeles Lakers and Los Angeles Kings until 1999.
Since re-opening in 2014, the Forum has hosted an impressive lineup of entertainers, including: the Eagles, Justin Timberlake, Paul Simon and Sting, Aerosmith, Queen with Adam Lambert, Steely Dan, Arcade Fire and Kings of Leon as well as His Holiness the Dalai Lama. In May 2014, the Forum also hosted its first boxing match since 2004, featuring Juan Manuel Marquez and Mike Alvarado, and looks forward to hosting the MTV Video Music Awards on August 24, 2014.
The Chicago Theatre
In October 2007, to extend our presence outside of New York and provide us with an anchor for content and distribution in a key market in the Midwest, we purchased the legendary Chicago Theatre, a venue with approximately 3,600 seats. The Chicago Theatre, which features its famous six-story-high “C-H-I-C-A-G-O” marquee, was built in 1921 and designed in the French Baroque style by architects Cornelius W. Rapp and George L. Rapp. It is the oldest surviving example of this architectural style in Chicago today, and was designated a Chicago landmark building in 1983 by the Mayor of Chicago and the Chicago City Council.
Today, The Chicago Theatre has become a highly attractive destination for concerts, comedy shows and other live events, hosting a wide range of entertainers, including Bob Dylan, Mumford & Sons, David Byrne, Neil Young, Steve Winwood, Jerry Seinfeld, The National, Kanye West, Conan O'Brien, Aziz Ansari, Barry Manilow and Steely Dan. The venue has also hosted theatrical tours, including A Christmas Story. The Chicago Theatre was ranked the ninth highest-grossing entertainment venue of its size in the world, based on Billboard Magazine's 2014 mid-year rankings.
The Wang Theatre
Since August 2008, we have had a booking agreement with respect to the historic Wang Theatre in Boston. Under the booking agreement, we have been utilizing our diverse relationships and experience in event production and entertainment marketing to maximize the quantity and diversity of performances staged at the Wang Theatre. These performances include theatrical productions and family shows, such as MSG Entertainment's Radio City Christmas Spectacular, Yo Gabba Gabba!, A Christmas Story, How The Grinch Stole Christmas! and concerts, such as multi-night runs by Steely Dan, Sting, Jerry Seinfeld,
14
and Furthur and performances from Leonard Cohen, Wilco, Tegan and Sara, John Legend and The Shins. The Wang Theatre seats approximately 3,600.
Our booking agreement expires in 2019. We have the option to renew the agreement at that time for an additional ten years.
Other Investments
We continue to explore additional opportunities to expand our presence and provide opportunities for growth beyond our core businesses and venues. In September 2013, the Company acquired a 50% interest in Azoff MSG Entertainment LLC (“Azoff-MSG”). The Azoff-MSG entity owns and operates businesses in the entertainment industry and is currently focused on music management, performance rights, comedy and productions, and strategic marketing.
In August 2013, the Company, in a new partnership with the owners of Brooklyn Bowl, invested in building a new venue in Las Vegas. Modeled after the successful Brooklyn Bowl destination in New York, the new Brooklyn Bowl Las Vegas opened in March 2014, bringing together live music, bowling, and a restaurant with food by the acclaimed Blue Ribbon Restaurant Group.
In March 2014, the Company announced that it purchased a 50 percent interest in Tribeca Enterprises LLC (“Tribeca Enterprises”), the company that owns and operates the acclaimed Tribeca Film Festival. The annual Festival supports and promotes both emerging and established directors and has attracted an international audience of more than 4.5 million attendees since it was founded in 2002. Tribeca Enterprises’ businesses also include Tribeca Digital Studios, a branded entertainment content business; Tribeca Cinemas, a unique event space; and Tribeca Film, an independent film distribution label.
On July 1, 2014, the Company completed the previously announced sale of Fuse to SiTV Media, Inc., the parent company of NUVOtv. NUVOtv is an English language entertainment network created for modern Latinos. As part of the transaction the Company received a 15% equity interest in SiTV Media, Inc., which is subject to potential reduction based on certain performance goals.
Garden of Dreams Foundation
Madison Square Garden has a close association with the Garden of Dreams Foundation, a non-profit charity. This foundation is dedicated to making dreams come true for children and their families facing obstacles. Working with 22 organizations in New York, New Jersey and Connecticut, including hospitals, wish organizations, homeless shelters, foster care organizations and community-based organizations, the Garden of Dreams Foundation utilizes the power and magic of The Madison Square Garden Company and its venues to bring joy and happiness to children who are facing everything from homelessness and extreme poverty, to illness and foster care. Through unique and unforgettable on-going events and programs, the foundation develops strong, long-term relationships that truly change lives. The Garden of Dreams Foundation activities include events with the Knicks, Rangers, Liberty and MSG Network; special celebrations and event attendance at The Garden, Radio City Music Hall and the Beacon Theatre; visits by Madison Square Garden celebrities; the Garden of Dreams Talent Show, where children perform on the Great Stage at Radio City Music Hall; a “Dream Week,” where children experience all areas of The Garden during a week in the summer; toy and coat drives; and the “Make A Dream Come True Program,” where children enjoy unforgettable experiences with celebrities and at events. Additionally, MSG Media hosts “classroom” programs that teach teens the inner workings of the television industry.
The depth of The Madison Square Garden Company's relationship with the Garden of Dreams Foundation, which is actively integrated with each of our business segments, reflects our commitment to positively impact our community. Since its inception in 2006 through fiscal year 2014, the Garden of Dreams Foundation and Madison Square Garden have created once-in-a-lifetime experiences for more than 250,000 tri-state area children facing obstacles.
Regulation
Regulation of Our Sports and Entertainment Businesses
Our sports and entertainment businesses are subject to legislation governing the sale and resale of tickets and consumer protection statutes generally.
In addition, many of the events produced or promoted by our sports and entertainment businesses are presented in our venues which are, like all public spaces, subject to building and health codes and fire regulations imposed by the state and local governments in the jurisdictions in which our venues are located. These venues are also subject to zoning and outdoor advertising regulations, which restrict us from making certain modifications to our facilities as of right or from operating certain types of businesses. These venues also require a number of licenses in order for us to operate, including occupancy permits, exhibition licenses, food and beverage permits, liquor licenses and other authorizations. In addition, our venues are
15
subject to the federal Americans with Disabilities Act, which requires us to maintain certain accessibility features at each of our facilities. See “Item 1A. Risk Factors — General Risks — We Are Subject to Extensive Governmental Regulation and Our Failure to Comply with These Regulations May Have a Material Negative Effect on Our Business and Results of Operations.”
The professional sports leagues in which we operate, primarily the NBA and NHL, claim the right under certain circumstances to regulate important aspects of our sports business and our team-related interactive businesses. See “— Our Business — MSG Sports — The Role of the Leagues in Our Operations.”
Regulation of Our Media Business
The Federal Communications Commission (“FCC”) imposes regulations directly on programming networks and also imposes regulations on cable television operators and satellite operators that affect programming networks indirectly. In addition, cable television programming networks, such as our MSG Networks, are also regulated by the FCC in certain respects because they are affiliated with a cable television operator like Cablevision. The rules, regulations, policies and procedures affecting our media business are subject to change.
Closed Captioning
Our programming networks must provide closed captioning of video programming for the hearing impaired. The FCC recently amended its closed captioning rules to provide for captioning quality standards and best practices regarding captioning that will become effective no earlier than January 15, 2015. We are also required to provide closed captioning on certain video content delivered via the Internet.
Commercial Loudness
FCC rules require multichannel video programming distributors to ensure that all commercials comply with specified volume standards, and certain of our affiliation agreements require us to certify compliance with such standards.
Advertising Restrictions on Children's Programming
Any of our programming and associated Internet web sites intended primarily for children under 12 years of age must comply with certain limits on commercial matter.
Obscenity Restrictions
Cable operators and other distributors are prohibited from transmitting obscene programming, and our affiliation agreements generally require us to refrain from including such programming on our networks.
Violent Programming
Some members of Congress have expressed concerns about the alleged effects of violent programming, which could lead to a renewal of interest in limiting the availability of such programming or prohibiting it.
Program Access
The “program access” provisions of the Federal Cable Act generally require satellite-delivered video programming in which a cable operator holds an attributable interest, as that term is defined by the FCC, to be made available to all multichannel video programming distributors, including satellite providers and telephone companies, on nondiscriminatory prices, terms and conditions, subject to certain exceptions specified in the statute and the FCC's rules. For purposes of these rules, the common directors and officers, and the five percent or greater stockholders of Cablevision and the Company are deemed to be cable operators with attributable interests in Madison Square Garden. As long as we continue to have common directors and major stockholders with Cablevision, our satellite-delivered video programming services will remain subject to the program access provisions.
In 2010, the FCC extended the program access rules to terrestrially-delivered programming by entities deemed affiliated with cable operators under those rules. The rules compel the licensing of such programming on nondiscriminatory price, terms and conditions in response to a complaint by a multichannel video programming distributor if the complainant can demonstrate that the lack of such programming, undue influence by the cable operator affiliate, or discrimination in the price, terms, or conditions for such programming constitutes an unfair act that significantly hinders or prevents the distributor from providing satellite cable programming.
The FCC allowed the rules that prohibited us from entering into exclusive contracts with cable operators for distribution of our satellite-delivered video programming services to sunset, and replaced them with a rule establishing a case-by-case consideration of exclusive contracts under the standard described above applicable to terrestrially-delivered programming. The
16
FCC also has solicited comment on whether its rules should be modified to address (i) treatment of volume price discounts under its anti-discrimination rules, (ii) uniform price increases by cable-affiliated programmers under its program access rules, (iii) buying group eligibility to file program access complaints, and (iv) a rebuttable presumption that certain practices engaged in by cable-affiliated programmers constitute an “unfair act.” The Company submitted its comments to the FCC in respect of the foregoing.
Program Carriage
In 2011, the FCC sought comment on proposed changes to the rules governing carriage agreements between cable programming networks and cable operators or other multichannel video distributors. Some of these changes could give an advantage to cable programming networks that are not affiliated with any distributor and make it easier for those programming networks to challenge a distributor's decision to terminate a carriage agreement or to decline to carry a network in the first place.
Wholesale “A La Carte”
The FCC has periodically considered whether cable programming networks require programming distributors to purchase and carry undesired programming in return for the right to carry desired programming and, if so, whether such arrangements should be prohibited. In May 2013, legislation was introduced in Congress that seeks to require, among other things, programmers to offer programming distributors the right to carry individual programming networks without the obligation to also carry other programming networks as part of a wholesale bundle. No action was taken on the proposed legislation.
Effect of “Must-Carry” Requirements
The FCC's implementation of the statutory “must-carry” obligations requires cable and satellite operators to give broadcasters preferential access to channel space. This may reduce the amount of channel space that is available for carriage of our networks by cable television systems and satellite operators.
Satellite Carriage
All satellite carriers must under federal law offer their service to deliver our and our competitors' programming networks on a nondiscriminatory basis (including by means of a lottery). A satellite carrier cannot unreasonably discriminate against any customer in its charges or conditions of carriage.
Media Ownership Restrictions
FCC rules set media ownership limits that restrict, among other things, the number of daily newspapers and radio and TV stations in which a single entity may hold an attributable interest as that term is defined by the FCC. The fact that the common directors and five percent or greater voting stockholders of Cablevision and the Company currently hold attributable interests in each of the companies for purposes of these rules means that these cross ownership rules may have the effect of limiting the activities or strategic business alternatives available to us, at least for as long as we continue to have common directors and major stockholders with Cablevision.
Web sites and Mobile Application Requirements
We maintain various web sites and mobile applications that provide information and content regarding our businesses, offer merchandise and tickets for sale and make available sweepstakes and/or contests. The operation of these web sites and applications may be subject to a range of federal, state and local laws such as privacy, accessibility for persons with disabilities and consumer protection regulations. The online and mobile operations relating to our sports teams may, in certain circumstances, be subject to certain agreements, rules, policies, regulations and directives of the leagues in which the respective team operates. See “— Our Business — MSG Sports — The Role of the Leagues in Our Operations.”
Competition
Competition in Our Sports Business
Our sports business operates in a market in which numerous sports and entertainment opportunities are available. In addition to the NBA, NHL and WNBA teams that we own and operate, the New York City metropolitan area is home to two Major League Baseball teams (the Yankees and the Mets), two National Football League teams (the Giants and the Jets), two additional NHL teams (the Islanders and the Devils), a second NBA team (the Nets) and two Major League Soccer franchises (the Red Bulls, and, beginning in 2015, the NYC FC). In addition, there are a number of other amateur and professional teams that compete in other sports, including at the collegiate and minor league levels. New York is also home to the U.S. Open tennis event each summer, as well as many other non-sports related entertainment options.
17
As a result of the large number of options available, we face strong competition for the general New York area sports fan. We must compete with these other sporting events in varying respects and degrees, including on the basis of the quality of the teams we field, their success in the leagues in which they compete, our ability to provide an entertaining environment at our games and the prices we charge for our tickets. In addition, for fans who prefer the unique experience of NHL hockey, we must compete with the Islanders and Devils as well as, in varying respects and degrees, with other NHL hockey teams and the NHL itself. Similarly, for those fans attracted to the equally unique experience of NBA basketball, we must compete with the Nets as well as, in varying respects and degrees, with other NBA teams and the NBA itself. In addition, we also compete to varying degrees with other productions and live entertainment events for advertising and sponsorship dollars.
See “Item 1A. — Risk Factors — Risks Relating to Our Sports Business — Our Sports Business Faces Intense and Wide-Ranging Competition, Which May Have a Negative Material Effect on Our Business and Results of Operations.”
Competition in Our Entertainment Business
Our entertainment business competes, in certain respects and to varying degrees, with other live performances, sporting events, movies, home entertainment (including the Internet and online services, television, home video and gaming devices) and the large number of other entertainment and public attraction options available to members of the public. Our businesses, such as our live productions and our sporting events, typically represent alternative uses for the public's entertainment dollar. The primary geographic area in which we operate, New York City, is among the most competitive entertainment markets in the world, with the world's largest live theater industry and extensive performing arts venues, twelve major professional sports teams, numerous museums, galleries and other attractions, and numerous movie theaters available to the public. In September 2012, a 19,000 seat arena opened in Brooklyn, New York. Our venues outside of New York City similarly compete with other entertainment options in their respective markets and elsewhere. We compete with these other entertainment options on the basis of the quality of our productions and the public's interest in our content, as well as on the price of our tickets and the quality and location of our venues.
We compete for bookings with a large number of other venues both in the cities in which our venues are located and in alternative locations capable of booking the same productions and events. Generally, we compete for bookings on the basis of the size, quality, expense and nature of the venue required for the booking.
In addition to competition for ticket sales and bookings, we also compete to varying degrees with other productions and sporting events for advertising and sponsorship dollars.
See “Item 1A. Risk Factors — Risks Relating to Our Entertainment Business — Our Entertainment Business Faces Intense and Wide-Ranging Competition Which May Have a Material Negative Effect on Our Business and Results of Operations.”
Competition in Our Media Business
Distribution of Programming Networks
The business of distributing programming networks to cable television systems and satellite, telephone and other multichannel video programming distributors (“Distributors”) is highly competitive. Our programming networks face competition from other programming networks for the right to be carried by a particular Distributor, and for the right to be carried on the service tier that will attract the most subscribers. Once our programming network is carried by a Distributor, that network competes for viewers not only with the other channels available through the Distributor, but also with television, pay-per-view channels and video on demand channels, as well as Internet and online services, mobile applications, radio, print media, motion picture theaters, DVDs, and other sources of information, sporting events and entertainment. Important to our success in each area of competition MSG Media faces are the prices we charge for our programming networks; the quantity, quality and variety of programming offered on our networks; and the effectiveness of our networks' marketing efforts.
Our ability to successfully compete with other programming networks for distribution may be hampered because the Distributors through which distribution is sought may be affiliated with other programming networks. In addition, because such affiliated Distributors may have a substantial number of subscribers, the ability of such programming networks to obtain distribution on affiliated Distributors may lead to increased subscriber and advertising revenue for such networks because of their increased penetration compared to our programming networks. Even if such affiliated Distributors carry our programming networks, there is no assurance that such Distributors would not place their affiliated programming network on a more desirable tier, thereby giving the affiliated programming network a competitive advantage over our own.
New or existing programming networks that are owned by or are affiliates of broadcast networks like NBC, ABC, CBS or FOX may also have a competitive advantage over our networks in obtaining distribution through the “bundling” of agreements to carry those programming networks with the agreements giving the cable system or other Distributor the right to carry a broadcast station affiliated with the network.
18
See “Item 1A. Risk Factors — Risks Relating to Our Media Business — Our Media Business Faces Intense and Wide-Ranging Competition Which May Have a Material Negative Effect on Our Business and Results of Operations.” See also “Part II — Item 7. Management's Discussion and Analysis of Financial Condition and Results of Operations — Business Overview — MSG Media — Revenue Sources” for a discussion of MSG Media customers.
Sources of Programming
We also compete with other programming networks to secure desired programming, including sports-related programming, although some of our programming is generated internally through our ownership of sports teams, our ownership and operation of venues and our efforts in original programming. Competition for programming will increase as the number of programming networks increases. Other programming networks that are affiliated with or otherwise have larger relationships with programming sources such as movie or television studios, film libraries, record labels or sports teams may have a competitive advantage over us in this area.
Competition for Sports Programming Sources
Because the loyalty of the sports viewing audience to a sports programming network is primarily driven by loyalty to a particular team or teams, access to adequate sources of sports programming is particularly critical to our sports networks. We own the programming rights to the Knicks, the Rangers and the Liberty. We also have in place multi-year rights agreements covering the media rights to the Islanders, Devils, Sabres and Red Bulls. Our rights with respect to these professional teams may be limited in certain circumstances. See “— Our Business — MSG Sports — The Role of the Leagues in Our Operations.” Our programming networks compete for telecast rights for other teams or events principally with national or regional cable networks that specialize in or carry sports programming; television “superstations” which distribute sports and other programming by satellite; local and national commercial broadcast television networks; and independent syndicators that acquire and resell such rights nationally, regionally and locally. Some of our competitors may own or control, or are owned or controlled by, sports teams, leagues or sports promoters, which gives them an advantage in obtaining telecast rights for such teams or sports. Distributors may also contract directly with the sports teams in their local service areas for the right to distribute games on their systems. Our programming networks may also compete with Internet and mobile-based distributors of sports programming.
The increasing amount of sports programming available on a national basis, including pursuant to national rights arrangements (e.g., NBA on ABC, ESPN, and TNT and NHL on NBC and NBC Sports Network), as part of league-controlled sports networks (e.g., NBA TV and NHL Network), and in out-of-market packages (e.g., NBA League Pass and NHL Center Ice), may have an adverse impact on our competitive position as our programming networks compete for distribution and for viewers.
Two professional sports teams located in New York have organized their own cable television networks featuring the games of their teams, which adversely affects the competitive position of MSG Networks by denying or limiting our access to those games for our own networks and subjecting our networks to competition from these team-owned networks. On the other hand, the competitive position of our programming networks is substantially enhanced by our ownership of the Knicks and Rangers.
Competition for Advertising Revenue
The financial success of our programming businesses also depends in part upon unpredictable and volatile factors beyond our control, such as viewer preferences, the strength of the advertising market, the quality and appeal of the competing programming and the availability of other entertainment activities.
Employees
As of June 30, 2014 we had approximately 1,500 full-time union and non-union employees and 7,500 part-time union and non-union employees. Approximately 66% of our employees were represented by unions as of June 30, 2014. Labor relations in general and in the sports and entertainment industry in particular can be volatile, though our current relationships with our unions taken as a whole are positive. We have from time to time faced labor action or had to make contingency plans because of threatened or potential labor actions.
The NHL players and the NBA players are covered by CBAs between the National Hockey League Players' Association (“NHLPA”) and the NHL and between the National Basketball Players Association (“NBPA”) and the NBA, respectively. Both the NHL and the NBA have experienced labor difficulties in the past and may have labor issues in the future. On June 30, 2011 the prior CBA between the NBA and NBPA expired and there was a work stoppage for approximately five months until a new CBA was entered into in December 2011. On September 15, 2012 the prior CBA between the NHL and NHLPA expired and there was a work stoppage for approximately four months until a new CBA was entered into in January 2013. See “Item 1A.
19
Risk Factors — General Risks — Organized Labor Matters May Have a Material Negative Effect on Our Business and Results of Operations.”
Financial Information about Segments and Geographic Areas
Substantially all revenues and assets of the Company's reportable segments are attributed to or located in the United States and are primarily concentrated in the New York City metropolitan area. Financial information by business segments for each of the years ended June 30, 2014, 2013, and 2012 is set forth in “Management's Discussion and Analysis of Financial Condition and Results of Operations,” and “Financial Statements and Supplementary Data,” which are in Part II, Items 7 and 8, respectively, of this Annual Report on Form 10-K.
20
Item 1A. Risk Factors
Risks Relating to Our Sports Business
Our Sports Business Faces Intense and Wide-Ranging Competition, Which May Have a Negative Material Effect on Our Business and Results of Operations.
The success of a sports business, like ours, is dependent upon the performance and/or popularity of its franchises. Our Knicks and Rangers and other sports franchises compete, in varying respects and degrees, with other live sporting events, and with sporting events delivered over television networks, radio, the Internet and online services, mobile applications and other alternative sources. For example, our sports teams compete for attendance, viewership and advertising with a wide range of alternatives available in the New York City metropolitan area. During some or all of the basketball and hockey seasons, our sports teams face competition, in varying respects and degrees, from professional baseball (including the Yankees and the Mets), professional football (including the Giants and the Jets) and each other. For fans who prefer the unique experience of NHL hockey, we must compete with two other hockey teams located in the New York City metropolitan area (the Islanders and the Devils) as well as, in varying respects and degrees, with other NHL hockey teams and the NHL itself. Similarly, for those fans attracted to the equally unique experience of NBA basketball, we must compete with another NBA team located in the New York City metropolitan area (the Nets) as well as, in varying respects and degrees, with other NBA teams and the NBA itself.
As a result of the large number of options available, we face strong competition to attract sports fans in the New York City metropolitan area, nationally and globally. We must compete with these other sports teams and sporting events, in varying respects and degrees, including on the basis of the quality of the teams we field, their success in the leagues in which they compete, our ability to provide an entertaining environment at our games, prices we charge for tickets and the viewing availability of our teams on multiple media alternatives. Given the nature of sports, there can be no assurance that we will be able to compete effectively, including with companies that may have greater resources than we have, and as a consequence, our business and results of operations may be materially negatively affected.
Our Basketball and Hockey Decisions, Especially Those Concerning Player Selection and Salaries, May Have a Material Negative Effect on Our Business and Results of Operations.
Creating and maintaining our sports teams' popularity and/or on-court and on-ice competitiveness is key to the success of our sports business. Accordingly, efforts to improve our revenues and earnings from operations from period to period may be secondary to actions that management believes will generate long-term value. As with other sports teams, the competitive positions of our sports teams depend primarily on our ability to develop, obtain and retain talented players, for which we compete with other professional sports teams. Our efforts in this regard may include, among other things, trading for highly compensated players, signing draft picks, free agents or current players to new contracts, engaging in salary arbitration with existing players and terminating and waiving players. Any of these actions could increase expenses for a particular period, subject to any salary cap restrictions contained in the respective leagues' collective bargaining agreements. There can be no assurance that any actions taken by management to increase our long-term value will be successful.
A significant factor in our ability to attract and retain talented players is player compensation. NBA and NHL player salaries have generally increased significantly and may continue to increase. Although collective bargaining agreements between the NBA and the NBPA and the NHL and the NHLPA generally cap league-wide player salaries at a prescribed percentage of league-wide revenues, we may pay our players different aggregate salaries and a different proportion of our revenues than other NBA or NHL franchises. Future collective bargaining agreements may increase the percentage of league-wide revenues to which NBA or NHL players are entitled or impose other conditions, which may further increase our costs. In addition, we may also be obligated to pay the NBA a luxury tax each year, the calculation of which is determined by a formula based on the aggregate salaries paid to our NBA players. We were a significant NBA luxury tax payer with respect to the 2013-14 season. See “Part II — Item 7. Management's Discussion and Analysis of Financial Condition and Results of Operations — Business Overview — MSG Sports — Expenses — Player Salaries, Escrow System/Revenue Sharing and Luxury Tax — NBA Luxury Tax.”
We have incurred, and may in the future incur, significant charges for costs associated with transactions relating to players on our sports teams for season-ending and career-ending injuries and for trades, waivers and contract terminations of players and other team personnel, including team executives. These transactions can result in significant charges as the Company recognizes the estimated ultimate costs of these events in the period in which they occur, although amounts due to these individuals are generally paid over their remaining contract terms. These expenses add to the volatility of the results of our MSG Sports segment.
21
The Actions of the Basketball and Hockey Leagues May Have a Material Negative Effect on Our Business and Results of Operations.
The governing bodies of the NBA (including the WNBA and NBA Development League) and the NHL have certain rights under certain circumstances to take actions that they deem to be in the best interests of their respective sports, which may not necessarily be consistent with maximizing our results of operations and which could affect our teams in ways that are different than the impact on other teams. Certain of these decisions by the NBA or the NHL could have a material negative effect on our business and results of operations. From time to time, we may disagree with or challenge actions the leagues take or the power and authority they assert. The following discussion highlights certain areas in which decisions of the NBA and the NHL could materially affect our businesses.
The NBA and the NHL may assert control over certain matters, under certain circumstances, that may affect our revenues such as the national and international rights to telecast the games of league members, including the Knicks and the Rangers, licensing of the rights to produce and sell merchandise bearing the logos and/or other intellectual property of our teams and the leagues, and the Internet activities of our teams. The NBA and NHL have each entered into agreements regarding the national and international telecasts of NBA and NHL games. We receive a share of the income the NBA and the NHL generate from these contracts, which expire from time to time. There can be no assurance that the NBA or the NHL will be able to renew these contracts following their expiration on terms as favorable to us as those in the current agreements or that we will continue to receive the same level of revenues in the future. Changes to national and international telecast rights could also impact the availability of games covered by our local telecast rights and could negatively affect our business and results of operations. The leagues have asserted control over certain other important decisions, under certain circumstances, such as the length and format of the playing season, including preseason and playoff schedules, the operating territories of the member teams, admission of new members, franchise relocations, labor relations with the players associations, collective bargaining, free agency, and luxury taxes and revenue sharing. Decisions on these matters, some of which are also subject to the terms of the relevant collective bargaining agreement, may materially negatively affect our business and results of operations. In addition, the NBA imposes a luxury tax and escrow system with respect to player salaries and a revenue sharing plan. For fiscal year 2014, the Knicks recorded approximately $23.1 million in estimated revenue sharing expenses, net of escrow receipts. The actual amounts for the 2013-14 season may vary significantly from the estimate based on actual operating results for the league and all teams for the season and other factors. For a discussion of the NBA luxury tax impacts, see “— Risks Relating to Our Sports Business — Our Basketball and Hockey Decisions, Especially Those Concerning Player Selection and Salaries, May Have a Material Negative Effect on Our Business and Results of Operations.”
The NBA and the NHL have imposed certain restrictions on the ability of owners to undertake some types of transactions in respect of teams, including a change in ownership, a relocation of a team and certain types of financing transactions. In certain instances, these restrictions could impair our ability to proceed with a transaction that is in the best interest of the Company and its stockholders if we were unable to obtain required league approvals in a timely manner or at all.
The leagues impose certain rules that define, under certain circumstances, the territories in which we operate, including the markets in which we telecast games. Changes to these rules could have a material negative effect on our business and results of operations.
Each league's governing body has imposed a number of rules, regulations, guidelines, bulletins, directives, policies and agreements upon its teams. Changes to these provisions may apply to our sports teams and their personnel, and the Company as a whole, regardless of whether we agree or disagree with such changes, have voted against such changes or have challenged them through other means, and it is possible that any such changes could materially negatively affect our business and results of operations to the extent they are ultimately determined to bind our teams. The commissioners of each of the NBA and NHL assert significant authority to take certain actions on behalf of their respective leagues under certain circumstances. Decisions by the commissioners of the NBA and the NHL, including on the matters described above, may materially negatively affect our businesses and results of operations. The leagues' governing documents and our agreements with the leagues purport to limit the manner in which we may challenge decisions and actions by a league commissioner or the league itself.
Injuries to Players on Our Sports Teams Could Hinder Our Success.
To the degree that our financial results are dependent on our sports teams' popularity and/or on-court and on-ice success, the likelihood of achieving such popularity or competitive success may, given the nature of sports, be substantially impacted by serious and/or untimely injuries to key players. Nearly all of our Knicks and Rangers players, including those with multi-year contracts, have partially or fully guaranteed contracts, meaning that in some cases (subject to the terms of the applicable player contract and collective bargaining agreement), a player or his estate may be entitled to receive his salary even if the player dies or is unable to play as a result of injury. These salaries represent significant financial commitments for our sports teams. We are generally insured against having to pay salaries in the event of a player's death and seek to obtain disability insurance policies
22
for substantially all of our material player contracts. In the event of injuries sustained resulting in lost services (as defined in the insurance policies), generally the insurance policies provide for payment to us of a portion of the player's salary for the remaining term of the contract or until the player can resume play, in each case following a deductible number of missed games. Such insurance may not be available in every circumstance or on terms that are commercially feasible or such insurance may contain significant dollar limits and/or exclusions from coverage for preexisting medical conditions. We may choose not to obtain (or may not be able to obtain) such insurance in some cases and we may change coverage levels (or be unable to change coverage levels) in the future.
In the absence of disability insurance, we may be obligated to pay all of an injured player's salary. In addition, player disability insurance policies do not cover any NBA luxury tax that we may be required to pay under the NBA CBA. For purposes of determining NBA luxury tax under the NBA CBA, salary payable to an injured player is included in team salary, unless and until that player's salary is removed from the team salary for purposes of calculating NBA luxury tax which, pursuant to the terms of the NBA CBA, requires a waiting period of one year and satisfaction of other conditions. Replacement of an injured player may result in an increase in salary and NBA luxury tax expense for us.
Risks Relating to Our Entertainment Business
Our Entertainment Business Faces Intense and Wide-Ranging Competition Which May Have a Material Negative Effect on Our Business and Results of Operations.
Our entertainment business competes, in certain respects and to varying degrees, with other leisure-time activities such as television, radio, motion pictures, sporting events, other live performances, the Internet, and online and mobile services, including sites for online content distribution, video on demand and other alternative sources of entertainment and information, in addition to competing for concerts and for event venues for total entertainment dollars in our marketplace. The success of our entertainment business is largely dependent on the continued success of our Radio City Christmas Spectacular, and, to a lesser extent, the availability of, and our venues' ability to attract concerts, family shows and other events, competition for which is intense and the ability of acts to attract strong attendance at our venues. For example, The Garden, The Theater at Madison Square Garden, Radio City Music Hall and the Beacon Theatre all compete with other entertainment options in the New York City metropolitan area. The Forum, The Chicago Theatre and the Wang Theatre face similar competition from other entertainment options in their respective markets and elsewhere.
Further, in order to maintain the competitive positions of The Garden and our other venues, we must invest on a continuous basis in state-of-the-art technology and facility maintenance while maintaining a competitive pricing structure for events that may be held in our venues, many of which have alternative venue options available to them in New York and other cities. In addition, we invest a substantial amount in our Radio City Christmas Spectacular and in new productions, including a new large-scale theatrical production for Radio City Music Hall, to continue to attract our audiences. We cannot assure you that such investments will generate revenues that are sufficient to justify our investment or even that exceed our expenses.
The Success of Our Entertainment Business Depends on the Continued Popularity of Our Live Productions, Particularly the Radio City Christmas Spectacular the Decline of Which Could Have a Material Negative Effect on Our Business and Results of Operations.
The financial results of our entertainment business are dependent on the popularity of our live productions, particularly the Radio City Christmas Spectacular. In particular, our entertainment business depends on the continuing popularity of the Radio City Christmas Spectacular at Radio City Music Hall, which represented 31% of our MSG Entertainment segment's revenues in fiscal year 2014. Should the popularity of the Radio City Christmas Spectacular decline, our revenues from ticket sales, and concession and merchandise sales would likely also decline, and we might not be able to replace the lost revenue with revenues from other sources.
Our Strategy for Our Entertainment Business Includes the Development of New Live Productions and the Possible Addition of New Venues, Each of Which Could Require Us to Make Considerable Investments for Which There Can Be No Guarantee of Success.
As part of our business strategy, we intend to develop new productions, and live entertainment events, which may include expansions or enhancements of our existing productions or relationships or the creation of entirely new live productions. Expansion or enhancement of productions and/or the development of new productions could require significant upfront investment in sets, staging, creative processes, casting and advertising and dislocation of other alternative sources of entertainment that may have played in our venues absent these productions. For example, we are investing in a new large-scale theatrical production for Radio City Music Hall. To the extent that any efforts at expanding or enhancing productions or creating new productions do not result in a viable live show, or to the extent that any such productions do not achieve expected levels of popularity among audiences, we may be subject to a write-down of all or a portion of such investments. In addition,
23
any delay in launching such productions or enhancements could result in the incurrence of operating costs which may not be recouped. For example, the Company postponed its new large-scale theatrical production designed for Radio City Music Hall, from its planned debut in March 2014. Our strategy also involves the possible investment in, or the operation or acquisition of, venues, in our current markets and major markets beyond New York, Los Angeles, Chicago and Boston. Any such additions may involve purchasing or acquiring control of, or an investment in, existing venues, renovating acquired venues or constructing new venues and could require significant investment. For example, in January 2014 we re-opened the Forum, the iconic arena in Inglewood, CA, which we acquired in June 2012. In pursuing such an expansion strategy, we will face risks, potentially including risks associated with the construction of new facilities or renovations of existing facilities, such as cost overruns and construction delays, risks associated with financing, such as the potential lack of available financing to commence or complete an acquisition, development or renovation, risks associated with operating in new or existing markets and the risk that we may lose all or a part of our investment in any additional venues.
Risks Relating to Our Media Business
Our Media Business Faces Intense and Wide-Ranging Competition Which May Have a Material Negative Effect on Our Business and Results of Operations.
Our media business competes, in certain respects and to varying degrees, for viewers and advertisers with other programming networks, pay-per-view, video on demand, and other content offered on cable television and other programming distribution systems. We also compete for viewers and advertisers with radio, motion pictures, home video, the Internet and broadband services, mobile media and other sources of information and entertainment and advertising services. Important competitive factors are the prices charged for programming, the quantity, quality (in particular, the on-court and on-ice performance of our sports teams as well as other teams whose media rights we control) and the variety of the programming offered and the effectiveness of marketing efforts.
The competitive environment in which our media business operates may be affected by technological developments. It is difficult to predict the future effect of technology on many of the factors affecting our competitive position. For example, data compression technology has made it possible for most programming distributors to increase their channel capacity, which may reduce the competition among programming networks and broadcasters for channel space. On the other hand, the addition of channel space could also increase competition for desired entertainment and sports programming and ultimately, for viewing by subscribers. As more channel space becomes available, maintaining and/or enhancing the position of our programming networks in the most favorable tiers of these distributors would be an important goal that we might not achieve.
With respect to advertising services, factors affecting the degree and extent of competition include prices, reach and audience demographics among others. Some of our competitors are large companies that have greater financial resources available to them than we do which could impact our programming viewership and the resulting advertising sales by our media business.
We May Not Be Able to Adapt to New Content Distribution Platforms and to Changes in Consumer Behavior Resulting from These New Technologies, Which May Have a Material Negative Effect on Our Business and Results of Operations.
We must successfully adapt to technological advances in our industry, including the emergence of alternative distribution platforms. Our ability to exploit new distribution platforms and viewing technologies will affect our ability to maintain or grow our business. Emerging forms of content distribution may provide different economic models and compete with current distribution methods in ways that are not entirely predictable. Such competition could reduce demand for our offerings. Accordingly, we must adapt to changing consumer behavior driven by advances such as digital video recorders (“DVRs”), video on demand, Internet-based and broadband content delivery and mobile devices. Such changes may impact the revenues we are able to generate from our traditional distribution methods, either by decreasing the viewership of our programming networks on cable and other multichannel video programming distribution systems or by making advertising on our programming networks less valuable to advertisers. If we fail to adapt our distribution methods and content to emerging technologies, our appeal to our targeted audiences might decline and there could be a material negative effect on our business and results of operations.
The Success of Our Media Business Also Depends on Affiliation Fees We Receive Under our Affiliation Agreements, the Loss of Which or Renewal of Which on Less Favorable Terms May Have a Material Negative Effect on Our Business and Results of Operations.
Our success is dependent upon the existence and terms of agreements between our programming networks and Distributors. Existing affiliation agreements of our programming networks expire at various dates. We cannot provide assurances that we will be able to renew these affiliation agreements, or obtain terms as attractive as our existing agreements in the event of a renewal. Affiliation fees constitute a significant majority of our media business’ revenues. Changes in affiliation fee revenues result from a combination of changes in rates and/or changes in subscriber counts, factors that may be largely out of our
24
control. For example, Distributors may introduce, market and/or modify tiers of programming networks that could impact the number of subscribers that receive our programming networks. The Company has experienced a decrease in subscribers which it believes is due to a migration of subscribers to lower-priced distributor tiers that do not include MSG Networks. A reduction in the license fees that we receive per subscriber or in the number of subscribers for which we are paid, including as a result of a loss or reduction in carriage of our programming networks, could adversely affect our affiliation fee revenue. Such a loss or reduction in carriage could also decrease the potential audience for our programming thereby adversely affecting our advertising revenues.
Our affiliation agreements generally require us to meet certain content criteria, such as minimum thresholds for professional event telecasts throughout the year for MSG Networks. If we were unable to meet these criteria, we could become subject to remedies available to the Distributors, which may include fee reductions, rebates or refunds and/or termination of these agreements in some cases.
In addition, under certain circumstances, an existing affiliation agreement may expire and the parties may have not finalized negotiations of either a renewal of that agreement or a new agreement for certain periods of time. In certain of these circumstances, the affiliate may continue to carry the service(s) until execution of definitive renewal or replacement agreements (or until we or the affiliate determine that carriage should cease).
The loss of any of our significant Distributors or, the failure to renew on terms as attractive as our existing agreements (or to do so in a timely manner) or disputes with our counterparties on the interpretation of their agreements with us could materially negatively affect our business and results of operations.
Further Consolidation Among Cable and Satellite Providers Could Adversely Affect Our Revenue and Profitability.
The pay television industry is highly concentrated, with a relatively small number of Distributors serving a significant percentage of pay television subscribers that receive our networks, thereby affording the largest Distributors significant leverage in their relationship with programming networks, including us. Substantially all of our distribution revenues come from our top ten Distributors. In addition to the pending Comcast and Time Warner Cable merger and the pending AT&T and DirecTV merger (each of which are subject to regulatory approval), further consolidation in the industry could reduce the number of Distributors available to distribute our programming services and increase the negotiating leverage of Distributors, which could adversely affect our revenue. In some cases, if a Distributor is acquired, the affiliation agreement of the acquiring Distributor will govern following the acquisition. In those circumstances, the acquisition of a Distributor that is a party to one or more affiliation agreements with us on terms that are more favorable to us could have a material negative impact on our business and results of operations.
We Derive Substantial Revenues from the Sale of Advertising Time and Those Revenues Are Subject to a Number of Factors, Many of Which Are Beyond Our Control.
Our media business is dependent on advertising revenues, which, in turn, depend on a number of factors, many of which are beyond our control, such as the health of the economy in the markets our businesses serve and in the nation as a whole, general economic trends in the advertising industry, the popularity of our programming, the activities of our competitors, including increased competition from other forms of advertising-based media (such as newspapers, cable television, Internet, mobile media and radio), technological developments (such as use of DVRs) and consumer adoption thereof, consumer budgeting and buying patterns, extent of distribution and team performance. A decline in the economic prospects of advertisers or the economy in general could alter current or prospective advertisers' spending priorities, which could cause our revenues and operating results to decline significantly in any given period. In addition, we cannot ensure that our programming will achieve favorable ratings. Our ratings depend partly upon unpredictable and volatile factors beyond our control, such as viewer preferences, the level of distribution of our programming, competing programming and the availability of other entertainment activities. A shift in viewer preferences could cause our advertising revenues to decline as a result of changes to the ratings for our programming and materially negatively affect our business and results of operations.
Our Rights Agreements with Various Professional Sports Teams that We Do Not Own Have Varying Durations and Renewal Terms and We May Be Unable to Renew Those Agreements on Acceptable Terms or Such Rights May Be Lost for Other Reasons.
In addition to carrying the games of the Knicks, Rangers and Liberty, our media business has rights agreements with other professional sports teams that we do not control. We may seek renewal of these contracts and, if we do, we may be outbid by competing networks for these contracts or the renewal costs could substantially exceed our costs under the current contracts. One or more of these teams may seek to establish their own programming network or join a competitor's network and, in certain circumstances, we may not have an opportunity to bid for the rights. Moreover, the value of these contracts may also be affected by various league decisions and/or league agreements that we may not be able to control, including a decision to alter the number of games played during a season. The value of these rights can also be affected, or we could lose such rights
25
entirely, if a team is liquidated, undergoes reorganization in bankruptcy or relocates to an area where it is not possible or commercially feasible for us to continue to distribute games. Any loss or diminution in the value of rights could impact the extent of the sports coverage offered by us and could materially negatively affect our business and results of operations. In addition, our distribution agreements typically include certain remedies in the event our MSG Networks fail to meet a minimum number of professional events, and, accordingly, any loss of rights could materially negatively affect our business and results of operations.
Each league's governing body has imposed a number of rules, regulations, guidelines, bulletins, directives, policies and agreements upon its teams, including the teams we carry on our MSG Networks. Changes to these provisions could materially negatively affect our business and results of operations.
We May Be Unable to Obtain Programming from Third Parties on Reasonable Terms or at All, Which Could Lead to Higher Costs.
We rely on third parties for sports and other programming for our networks. We compete with other distributors of programming, including other programming networks, to acquire the rights to distribute such programming. If we fail to continue to obtain sports and other programming for our networks on reasonable terms for any reason, including as a result of competition, we could be forced to incur additional costs to acquire such programming or look for alternative programming, which may have a material negative effect on our business and results of operations.
Our Business Depends on the Appeal of Our Programming Which May be Unpredictable and Increased Programming Costs May Have a Material Negative Effect on Our Business and Results of Operations.
Our business depends in part upon viewer preferences and audience acceptance of the programming on our networks. These factors are often unpredictable and subject to influences that are beyond our control, such as the quality and appeal of competing programming, general economic conditions and the availability of other entertainment options. We may not be able to successfully predict interest in proposed new programming and viewer preferences could cause new programming not to be successful or cause our existing programming to decline in popularity. An increase in our costs associated with programming, including original programming, may materially negatively affect our business and results of operations to the extent we do not predict accurately how audiences will respond to such programming.
General Risks
Our Business Has Been Adversely Impacted and May, in the Future, Be Materially Impacted by an Economic Downturn and Financial Instability.
Our businesses depend upon the ability and willingness of consumers and businesses to purchase tickets (including season tickets) or to license suites at our facilities and to spend on concessions and merchandise. In addition, our business is dependent upon advertising and sponsorship revenues. As a result, instability and weakness of the U.S. and global economies and the negative effects on consumers' discretionary spending may materially negatively affect our business and results of operations.
Severe Weather May Impact Events at our Venues and Disrupt Distributors' Ability to Offer Pay Television Service, Which May Have a Material Negative Effect on Our Business and Results of Operations.
Weather conditions in the New York metropolitan area and other locations in which we own or operate venues may affect patron attendance as well as sales of tickets, concessions and merchandise, among other things. Weather conditions may also require us to cancel or postpone events or prevent us or our Distributors from providing our programming to customers. Any of these events may have a material negative effect on our business and results of operations.
Our Business Could Be Adversely Affected by Terrorist Activity or the Threat of Terrorist Activity and Other Developments that Discourage Congregation at Prominent Places of Public Assembly.
The success of our businesses is dependent upon the willingness and ability of patrons to attend events at our venues. The venues we operate, like all prominent places of public assembly, could be the target of terrorist activities or other actions that discourage attendance. Any such activity at one of our venues could result in a material negative effect on our business and results of operations. In addition, terrorist activity or other actions that discourage attendance at other locations, or even the threat of such activity, could result in reduced attendance at our venues. Similarly, a major epidemic or pandemic, or the threat of such an event, could adversely affect attendance at our events.
26
Our Businesses Are Substantially Dependent on the Continued Popularity and/or Competitive Success of the Knicks and Rangers, Which Cannot Be Assured.
Our financial results have historically been dependent on, and are expected to continue to depend in large part on, the Knicks and Rangers remaining popular with our fan bases and, in varying degrees, on the teams achieving on-court and on-ice success, which can generate fan enthusiasm, resulting in sustained ticket, premium seating, suite, concession and merchandise sales during the regular season, greater shares of total viewership and increased advertising sales. Furthermore, success in the regular season may qualify a team for participation in post-season playoffs, which provides us with additional revenue by increasing the number of games played by our teams and, more importantly, by generating increased excitement and interest in our teams, which can improve attendance and viewership in subsequent seasons. There can be no assurance that any sports team, including the Knicks and Rangers, will compete in post-season play in the future.
We May Pursue Acquisitions and Other Strategic Transactions to Complement or Expand our Business that May Not be Successful; We Have Significant Investments in Businesses We Do Not Control.
From time to time, we may explore opportunities to purchase or invest in other businesses, venues or assets that could complement, enhance or expand our current business or that might otherwise offer us growth opportunities. Any transactions that we are able to identify and complete may involve risks, including the commitment of significant capital, the incurrence of indebtedness, the diversion of management’s attention and resources from our existing business to develop and integrate the acquired or combined business, the risk of not achieving the intended results and the exposure to losses if the underlying transactions or ventures are not successful. We have significant investments in businesses that we account for under the equity method of accounting. We do not control the day-to-day operations of these businesses. Additionally, these businesses are subject to laws, rules and other circumstances, and have risks in their operations, which may be similar to, or different from, those to which we are subject. To the extent that these investments are not successful, we may be subject to a write-down of all or a portion of such investments. Any of the foregoing risks could result in a material negative effect on our business and results of operations or adversely impact the value of our investments.
We Do Not Own All of Our Venues and Our Failure to Renew Our Leases or Booking Agreement on Economically Attractive Terms May Have a Material Negative Effect on Our Business and Results of Operations.
The lease on Radio City Music Hall expires in 2023. We have the option to renew the lease for an additional ten years by providing two years' notice prior to the initial expiration date. Similarly, we lease the Beacon Theatre pursuant to a lease that expires in 2026. We have entered into a booking agreement with respect to the Wang Theatre in Boston. Our booking agreement expires in 2019 and we have the option to renew the agreement at that time for an additional ten years. If we are unable to renew these leases or the booking agreement on economically attractive terms, our business could be materially negatively affected.
We Are Subject to Extensive Governmental Regulation and Our Failure to Comply with These Regulations May Have a Material Negative Effect on Our Business and Results of Operations.
Our operations are subject to federal, state and local laws and regulations.
Our programming business is subject to direct and indirect government regulation, in part as a result of federal communications laws and FCC regulations that apply because we have common directors, officers, and stockholders with Cablevision. For FCC purposes, the common directors and officers, and the five percent or greater stockholders of each of us and Cablevision are deemed to hold attributable interests in each of the companies. As a result, certain regulations applicable to a programming network affiliated with a cable television operator apply to us. This affiliation may also limit the activities or strategic business alternatives available to us, including the ability to own or operate media properties we do not presently own or operate.
Some FCC regulations apply to us directly and other FCC regulations, although imposed on cable television operators and satellite operators, affect programming networks indirectly. See “Item 1. Business — Regulation — Regulation of Our Media Business.” Legislative enactments, court actions, and federal regulatory proceedings could materially affect our programming business by modifying the rates, terms, and conditions under which we offer our programming services to distributors and the public, or otherwise materially affect the range of our activities or strategic business alternatives. We cannot predict the likelihood or results of any such legislative, judicial, or regulatory actions. Furthermore, to the extent that regulations and laws, either presently in force or proposed, hinder or stimulate the growth of the cable television and satellite industries, our programming business will be affected. The U.S. Congress and the FCC currently have under consideration, and may in the future adopt, new laws, regulations and policies regarding a wide variety of matters that could, directly or indirectly, affect our programming business. The regulation of cable television services and satellite carriers is subject to the political process and has been in constant flux over the past two decades. Further material changes in the law and regulatory requirements must be
27
anticipated. We cannot assure you that our programming business and our results of operations will not be materially negatively affected by future legislation, new regulation or deregulation.
We hold liquor licenses at each of our venues and are subject to licensing requirements with respect to the sale of alcoholic beverages in the jurisdictions in which we serve those beverages. Failure to receive or retain, or the suspension of, liquor licenses or permits could interrupt or terminate our ability to serve alcoholic beverages at the applicable venue and could have a material negative effect on our business and our results of operations. Additional regulation relating to liquor licenses may limit our activities in the future or significantly increase the cost of compliance, or both. In the jurisdictions in which our venues are located, we are subject to statutes that generally provide that serving alcohol to a visibly intoxicated or minor patron is a violation of the law. Our liability insurance coverage may not be adequate or available to cover any potential liability.
We and our venues are subject to environmental laws and regulations relating to the use, disposal, storage, emission and release of hazardous and non-hazardous substances, as well as zoning and noise level restrictions which may affect, among other things, the operations of our venues. Additionally, certain laws and regulations could hold us strictly, jointly and severally responsible for the remediation of hazardous substance contamination at our facilities or at third-party waste disposal sites, and could hold us responsible for any personal or property damage related to any contamination. Any requirements to dispose of, or remediate, such hazardous or non-hazardous materials and any associated costs and impact on operations of such efforts may be heightened as a result of the purchase, construction or renovation of a venue.
Our venues are subject to zoning and building regulations including permits relating to the operation of The Garden. In addition, the Garden requires a zoning special permit. The original permit was granted by the New York City Planning Commission in 1963 and renewed in July 2013 for 10 years. In connection with the renewal, certain government officials and special interest groups sought to use the renewal process to impose conditions on or otherwise pressure us to improve Penn Station or to relocate The Garden. There can be no assurance regarding the future renewal of the permit or the terms thereof.
Our businesses are, and may in the future be, subject to a variety of other laws and regulations, including licensing, permitting, and historic designation and similar requirements; working conditions, labor, immigration and employment laws; health, safety and sanitation requirements; compliance with the Americans With Disabilities Act; and privacy laws.
Our failure to comply with applicable governmental laws and regulations, or to maintain necessary permits or licenses, could have a material negative effect on our business and results of operations.
Our Properties Are Subject to, and Benefit from, Certain Easements, the Availability of Which May Not Continue on Terms Favorable to Us or at All.
Our properties are subject to, and benefit from, certain easements. For example, the “breezeway” into the Madison Square Garden Complex from Seventh Avenue in New York City is a significant easement that we share with other property owners. Our ability to continue to utilize this and other easements, including for advertising purposes, requires us to comply with a number of conditions. Moreover, certain adjoining property owners have easements over our property, which we are required to maintain so long as those property owners meet certain conditions. It is possible that we will be unable to continue to access or maintain any easements on terms favorable to us, or at all, which could have a material negative effect on our business and results of operations.
We May Be Exposed to Business, Reputational and Litigation Risk if there Is Loss, Disclosure or Misappropriation of or Access to Our Customers' or Employee's Personal Information or Other Breaches of Our Information Security.
Through our operations, we collect and store certain personal information and payment card information that our customers provide to make purchases, register on our web sites, or otherwise communicate and interact with us. These activities require the use of online services and centralized data storage, including through third party service providers. Our ability to safeguard our customers' personal information and other confidential information, including Company and employee data, is important to our business. We take these matters seriously and have taken significant steps to protect consumer, employee and confidential information. Nevertheless, our information technology and other systems that maintain and transmit consumer information may be compromised by a malicious penetration of our network security, or that of a third party service provider. As a result, our customers' or employees' personal information may be lost, disclosed, accessed or taken without their consent, and the security of our other confidential information may be compromised.
Any penetration of our network security or other misappropriation or misuse of personal consumer or employee information could subject us to business interruption and litigation and our reputation could be damaged, which could have an material negative effect on our business and results of operations.
28
A Change to or Withdrawal of New York City Real Estate Tax Exemption May Have a Material Negative Effect on Our Business and Results of Operations.
Many arenas, ballparks and stadiums nationally and in New York City have received significant public support, such as tax exempt financing, other tax benefits, direct subsidies and other contributions, including for public infrastructure critical to the facilities such as parking lots and transit improvements. Our Madison Square Garden Complex benefits from a more limited real estate tax exemption pursuant to an agreement with the City of New York, subject to certain conditions, and legislation enacted by the State of New York in 1982. For fiscal year 2014 this tax exemption resulted in an annual after-tax benefit to net income of approximately $9.6 million. Following the completion of the Transformation, New York City reassessed the complex and increased the assessed value significantly (thereby significantly increasing the value of the exemption). We are appealing the assessment. From time to time there have been calls to repeal or amend the tax exemption. Repeal or amendment would require legislative action by New York State. There can be no assurance that the tax exemption will not be amended in a manner adverse to us or repealed in its entirety, either of which could have a material negative effect on our business and results of operations.
We May Require Financing to Fund Our Ongoing Operations and Capital Expenditures, the Availability of Which Is Highly Uncertain.
The capital and credit markets can experience volatility and disruption. Such markets can exert extreme downward pressure on stock prices and upward pressure on the cost of new debt capital and can severely restrict credit availability for most issuers.
Our business has been characterized by significant expenditures for properties and businesses, for renovations and for productions. In the future we may engage in transactions that depend on our ability to obtain financing. We may also seek financing to fund our ongoing operations.
Although we have a credit facility (see “Part II — Item 7. Management's Discussion and Analysis of Financial Condition and Results of Operations — Liquidity and Capital Resources — Financing Agreements”), our ability to draw on such facility will depend on our ability to meet certain financial tests and other conditions. In addition, there can be no assurance that we will be able to refinance any such facility in the future or raise any required additional capital or do so on favorable terms. Depending upon conditions in the financial markets, we may not be able to raise additional capital on favorable terms, or at all. In addition, as described above, the leagues in which our sports teams compete may have, under certain circumstances, approval rights over certain financing transactions, and in connection with those rights, could affect our ability to obtain such financing. If we are unable to pursue our current and future spending programs, we may be forced to cancel or scale back those programs. Our choice of which spending programs to cancel or reduce may be limited, although we do not currently anticipate that unavailability of financing in any circumstances would materially affect our spending on player salaries in any respect. Failure to successfully pursue our capital expenditure and other spending plans could negatively affect our ability to compete effectively and have a material negative effect on our business and results of operations.
Our Business Is Subject to Seasonal Fluctuations.
The revenues of our MSG Sports and MSG Entertainment segments are seasonal. For example, 35% of our MSG Entertainment segment's revenues and 7% of our consolidated revenues in fiscal year 2014, were derived from our Radio City Christmas Spectacular franchise. Revenues of our MSG Entertainment segment are highest in the second quarter of our fiscal year when these performances primarily occur. As a result, MSG Entertainment earns a disproportionate amount of its revenue and operating income in the second quarter of each fiscal year. Similarly, because of the nature of the NBA and NHL playing seasons, revenues from our sports teams are concentrated in the second and third quarters of each fiscal year. Revenues from our business on a consolidated basis tend to be at their lowest in the first and fourth quarters of the fiscal year.
Organized Labor Matters May Have a Material Negative Effect on Our Business and Results of Operations.
Our business is dependent upon the efforts of unionized workers. Any labor disputes, such as strikes or lockouts, with the unions with which we have collective bargaining agreements could have a material negative effect on our business and results of operations (including our ability to produce or present concerts, theatrical productions, sporting events and television programming).
NBA players are covered by a CBA between the NBPA and the NBA. NHL players are covered by a CBA between the NHLPA and the NHL. Both the NHL and the NBA have experienced labor difficulties in the past and may have labor issues in the future. Labor difficulties may include players' strikes or management lockouts. For example, the NBA has experienced labor difficulties, including a lockout during the 1998-99 season, which resulted in the regular season being shortened from 82 to 50 games, and a lockout during the 2011-12 season, which resulted in the regular season being shortened from 82 games to 66 games. The current NBA CBA expires after the 2020-21 season (although the NBA and NBPA each have the right to terminate
29
the CBA effective following the 2016-17 season). The NHL has also experienced labor difficulties, including a lockout during the 1994-95 NHL season, which resulted in the regular season being shortened from 84 to 48 games, a lockout beginning in September 2004, which resulted in the cancellation of the entire 2004-05 NHL season and a lockout during the 2012-13 NHL season, which resulted in the regular season being shortened from 82 to 48 games. The current NHL CBA expires September 15, 2022 (although the NHL and NHLPA each have the right to terminate the CBA effective following the 2019-20 season).
The Unavailability of Satellites, Facilities and/or Systems upon Which We Rely May Have a Material Negative Effect on Our Business and Results of Operations.
We use satellite and other systems to transmit our program services to Distributors. The distribution facilities include uplinks, communications satellites and downlinks. Notwithstanding certain back-up and redundant systems, transmissions may be disrupted, including as a result of disasters that impair uplinks, downlinks or transmission facilities or the impairment of satellite or terrestrial facilities. Currently, there are a limited number of communications satellites available for the transmission of programming. If a disruption occurs, we may not be able to secure alternate distribution facilities in a timely manner. In addition, we rely upon various third-party software or systems in the operation of our business, including, with respect to ticket sales, credit card processing, point of sale transactions, database, inventory, human resource management and financial systems. From time to time, certain of these arrangements may not be covered by long-term agreements. The failure or unavailability of distribution facilities or these third-party services, depending upon its severity and duration, could have a material negative effect on our business and results of operations.
We May Become Subject to Infringement or Other Claims Relating to Our Content or Technology.
From time to time, third parties may assert against us alleged intellectual property (e.g., copyright, trademark and patent) or other claims relating to our programming, productions, technologies or other content or material, some of which may be important to our business. In addition, our programming and productions could potentially subject us to claims of defamation or similar types of allegations. Any such claims, regardless of their merit, could cause us to incur significant costs. In addition, if we are unable to continue use of certain intellectual property rights, our business and results of operations could be materially negatively impacted.
There Is the Risk of Personal Injuries and Accidents in Connection with Our Venues, Which Could Subject Us to Personal Injury or Other Claims; We are Subject to the Risk of Adverse Outcomes In Other Types of Litigation.
There are inherent risks associated with producing and hosting events and operating, maintaining or renovating our venues. As a result, personal injuries, accidents and other incidents have occurred and may occur from time to time, which could subject us to claims and liabilities. Incidents in connection with events at any of our venues could also reduce attendance at our events, and cause a decrease in our revenue and operating income. While we seek to obtain contractual indemnities for events at our venues and we maintain insurance policies that provide coverage for incidents in the ordinary course of business, there can be no assurance that such indemnities or insurance will be adequate at all times and in all circumstances.
From time to time, we become subject to other kinds of litigation. The outcome of litigation is inherently unpredictable. As a result, we could incur liability from litigation which could be material and for which we may have inadequate or no insurance coverage or be subject to other forms of relief which might adversely affect the Company.
We May Have a Significant Indemnity Obligation to Cablevision if the Distribution Is Treated as a Taxable Transaction.
Prior to the Distribution, Cablevision received a private letter ruling from the Internal Revenue Service (“IRS”) to the effect that, among other things, the Distribution and certain related transactions would qualify for tax-free treatment under the Internal Revenue Code of 1986, as amended (the “Code”).
Although a private letter ruling from the IRS generally is binding on the IRS, if the factual representations or assumptions made in the letter ruling request were untrue or incomplete in any material respect, Cablevision would not be able to rely on the ruling. Furthermore, the IRS will not rule on whether the Distribution satisfies certain requirements necessary to obtain tax-free treatment under the Code. Rather, the ruling was based upon representations by Cablevision that these conditions were satisfied, and any inaccuracy in such representations could invalidate the ruling.
If the Distribution does not qualify for tax-free treatment for U.S. federal income tax purposes, then, in general, Cablevision would be subject to tax as if it had sold the common stock of our Company in a taxable sale for its fair market value. Cablevision's shareholders would be subject to tax as if they had received a distribution equal to the fair market value of our common stock that was distributed to them. It is expected that the amount of any such taxes to Cablevision's shareholders and Cablevision would be substantial.
30
As part of the Distribution we have entered into a Tax Disaffiliation Agreement with Cablevision, which sets out each party's rights and obligations with respect to deficiencies and refunds, if any, of federal, state, local or foreign taxes for periods before and after the Distribution and related matters such as the filing of tax returns and the conduct of IRS and other audits. Pursuant to the Tax Disaffiliation Agreement, we are required to indemnify Cablevision for losses and tax liabilities of Cablevision that result from the breach of certain covenants that could cause the Distribution to be treated as a taxable transaction. If we are required to indemnify Cablevision under the circumstances set forth in the Tax Disaffiliation Agreement, we may be subject to substantial liabilities, which could have a material negative effect on our business and results of operations.
We Are Controlled by the Dolan Family.
We have two classes of common stock:
• | Class B Common Stock, which is generally entitled to ten votes per share and is entitled collectively to elect 75% of our Board of Directors, and |
• | Class A Common Stock, which is entitled to one vote per share and is entitled collectively to elect the remaining 25% of our Board of Directors. |
As of July 31, 2014, the Dolan family, including trusts for the benefit of members of the Dolan family, collectively own all of our Class B Common Stock, approximately 1.8% of our outstanding Class A Common Stock and approximately 69% of the total voting power of all our outstanding common stock. Of this amount, Charles F. Dolan, a director and the father of James L. Dolan, the Executive Chairman, and his spouse control approximately 59.4% of our outstanding Class B Common Stock, approximately 1% of our outstanding Class A Common Stock and approximately 41% of the total voting power of all our outstanding common stock. The members of the Dolan family holding Class B Common Stock have executed a voting agreement that has the effect of causing the voting power of the holders of our Class B Common Stock to be cast as a block with respect to all matters to be voted on by holders of Class B Common Stock. The Dolan family is able to prevent a change in control of our Company and no person interested in acquiring us will be able to do so without obtaining the consent of the Dolan family. Charles F. Dolan, members of his family and certain related family entities, by virtue of their stock ownership, have the power to elect all of our directors subject to election by holders of Class B Common Stock and are able collectively to control stockholder decisions on matters on which holders of all classes of our common stock vote together as a single class. These matters could include the amendment of some provisions of our certificate of incorporation and the approval of fundamental corporate transactions.
In addition, the affirmative vote or consent of the holders of at least 66 2/3% of the outstanding shares of the Class B Common Stock, voting separately as a class, is required to approve:
• | the authorization or issuance of any additional shares of Class B Common Stock, and |
• | any amendment, alteration or repeal of any of the provisions of our certificate of incorporation that adversely affects the powers, preferences or rights of the Class B Common Stock. |
As a result, Charles F. Dolan, members of his family and certain related family entities also collectively have the power to prevent such issuance or amendment.
We Have Elected to Be a “Controlled Company” for The NASDAQ Stock Market LLC Purposes Which Allows Us Not to Comply with Certain of the Corporate Governance Rules of The NASDAQ Stock Market LLC.
Charles F. Dolan, members of his family and certain related family entities have entered into a Stockholders Agreement relating, among other things, to the voting of their shares of our Class B Common Stock. As a result, we are a “controlled company” under the corporate governance rules of The NASDAQ Stock Market LLC (“NASDAQ”) and our Board of Directors, as permitted by NASDAQ rules, has elected not to comply with the corporate governance rules of NASDAQ requiring: a majority of independent directors on our Board and an independent corporate governance and nominating committee.
Future Stock Sales, Including as a Result of the Exercise of Registration Rights by Certain of Our Stockholders, Could Adversely Affect the Trading Price of Our Class A Common Stock.
Certain parties have registration rights covering a portion of our shares. We have entered into registration rights agreements with Charles F. Dolan, members of his family, certain Dolan family interests and the Dolan Family Foundations that provide them with “demand” and “piggyback” registration rights with respect to approximately 15 million shares of Class A Common Stock, including shares issuable upon conversion of shares of Class B Common Stock. Sales of a substantial number of shares
31
of Class A Common Stock could adversely affect the market price of the Class A Common Stock and could impair our future ability to raise capital through an offering of our equity securities.
Transfers and Ownership of Our Common Stock Are Subject to Restrictions Under Rules of the NBA and the NHL and Our Certificate of Incorporation Provides Us with Remedies Against Holders Who Do Not Comply with Those Restrictions.
The Company is the owner of professional sports franchises in the NBA and the NHL. As a result, transfers and ownership of our Common Stock are subject to certain restrictions under the constituent documents of the NBA and the NHL as well as the Company's consent agreements with the NBA and the NHL in connection with their approval of the Distribution. These restrictions are described under “Description of Capital Stock - Class A Common Stock and Class B Common Stock - Transfer Restrictions” in our registration statement on Form 10 filed with the Securities and Exchange Commission. In order to protect the Company and its NBA and NHL franchises from sanctions that might be imposed by the NBA or the NHL as a result of violations of these restrictions, our amended and restated certificate of incorporation provides that, if a transfer of shares of our Common Stock to a person or the ownership of shares of our Common Stock by a person requires approval or other action by a league and such approval or other action was not obtained or taken as required, the Company shall have the right by written notice to the holder to require the holder to dispose of the shares of Common Stock which triggered the need for such approval. If a holder fails to comply with such a notice, in addition to any other remedies that may be available, the Company may redeem the shares at 85% of the fair market value of those shares.
We Share Certain Executives with Cablevision Which Means Those Executives Do Not Devote Their Full Time and Attention to Our Affairs and the Overlap May Give Rise to Conflicts; Certain Directors Are Also Directors and/or Executives of each of Cablevision and AMC Networks Inc.
Our Executive Chairman, James L. Dolan, also serves as the Chief Executive Officer of Cablevision and our Vice Chairman, Hank J. Ratner also serves as a Vice Chairman of Cablevision. This arrangement is similar to the situation prior to the spin-off of the Company from Cablevision whereby Messrs. Dolan and Ratner served as executives of both companies. As a result, they do not devote their full time and attention to the Company's affairs. In addition, eight members of our Board of Directors are also directors of Cablevision, seven members of our Board of Directors are also directors of AMC Networks Inc., an affiliate of the Company, and several of our directors are employees or executives of Cablevision and AMC Networks Inc. concurrently with their service on our Board of Directors. These officers and directors may have actual or apparent conflicts of interest with respect to matters involving or affecting MSG and either Cablevision or AMC Networks Inc., as applicable. For example, the potential for a conflict of interest exists when we on the one hand, and Cablevision or AMC Networks Inc. on the other hand, look at acquisitions and other corporate opportunities that may be suitable for both companies. Also, conflicts may arise if there are issues or disputes under the commercial arrangements that exist between Cablevision or AMC Networks Inc. and us. In addition, certain of our directors and officers have Cablevision and/or AMC Networks Inc. stock options and/or or cash performance awards, including Messrs. Charles F. Dolan, James L. Dolan and Hank J. Ratner. These ownership interests could create actual, apparent or potential conflicts of interest when these individuals are faced with decisions that could have different implications for our Company and Cablevision or AMC Networks Inc. See “Certain Relationships and Potential Conflicts of Interest” in our Proxy Statement filed with the Securities and Exchange Commission on October 11, 2013 for a discussion of certain procedures we instituted to help ameliorate such potential conflicts with Cablevision and/or AMC Networks Inc. that may arise.
Our Overlapping Directors and Executive Officers with Cablevision and AMC Networks Inc. May Result in the Diversion of Corporate Opportunities and Other Conflicts to Cablevision and AMC Networks Inc. and Provisions in Our Amended and Restated Certificate of Incorporation May Provide Us No Remedy in That Circumstance.
The Company's amended and restated certificate of incorporation acknowledges that directors and officers of the Company may also be serving as directors, officers, employees, consultants or agents of Cablevision and its subsidiaries and that the Company may engage in material business transactions with such entities. The Company has renounced its rights to certain business opportunities and the Company's amended and restated certificate of incorporation provides that no director or officer of the Company who is also serving as a director, officer, employee, consultant or agent of Cablevision and its subsidiaries will be liable to the Company or its shareholders for breach of any fiduciary duty that would otherwise exist by reason of the fact that any such individual directs a corporate opportunity (other than certain limited types of opportunities set forth in our certificate of incorporation) to Cablevision or any of its subsidiaries instead of the Company, or does not refer or communicate information regarding such corporate opportunities to the Company. The Company's Board of Directors has adopted resolutions putting in place arrangements similar to the foregoing provisions on corporate opportunities with respect to directors and/or officers of the Company who are also directors or officers of AMC Networks Inc., a company which Cablevision spun off to its stockholders. Our amended and restated certificate of incorporation also expressly validates certain contracts, agreements, assignments and transactions (and amendments, modifications or terminations thereof) between the Company and Cablevision and/or any of its subsidiaries and, to the fullest extent permitted by law, provides that the actions of the overlapping directors or officers in connection therewith are not breaches of fiduciary duties owed to the Company, any of its subsidiaries or their
32
respective shareholders. See “Description of Capital Stock — Certain Corporate Opportunities and Conflicts” in our registration statement on Form 10 filed with the Securities and Exchange Commission.
Item 1B. Unresolved Staff Comments
None.
Item 2. Properties
We own the Madison Square Garden Complex (with a maximum capacity of approximately 21,000 seats in The Garden), including The Theater at Madison Square Garden (approximately 5,600 seats) in New York City, comprising approximately 1,100,000 square feet; a training center in Greenburgh, NY with approximately 105,000 square feet of space; The Chicago Theatre (approximately 3,600 seats) in Chicago comprising approximately 72,600 square feet; and the Forum (approximately 17,800 seats) in Inglewood, CA comprising approximately 307,000 square feet.
Significant properties that are leased in New York City include approximately 400,000 square feet housing Madison Square Garden's administrative and executive offices and certain studio space, approximately 577,000 square feet comprising Radio City Music Hall (approximately 6,000 seats) and approximately 57,000 square feet comprising the Beacon Theatre (approximately 2,800 seats). We also lease storage space in various other locations and parking locations in Inglewood, CA for the Forum. For more information on our venues, see “Item 1. Business — Our Venues.”
Our Madison Square Garden Complex is subject to and benefits from various easements, including the “breezeway” into Madison Square Garden from Seventh Avenue in New York City (which we share with other property owners). Our ability to continue to utilize this and other easements requires us to comply with certain conditions. Moreover, certain adjoining property owners have easements over our property, which we are required to maintain so long as those property owners meet certain conditions.
Item 3. Legal Proceedings
In March 2012, the Company was named as a defendant in two purported class action antitrust lawsuits brought in the United States District Court for the Southern District of New York against the NHL and certain NHL member clubs, regional sports networks and cable and satellite distributors. The complaints, which are substantially identical, primarily assert that certain of the NHL's current rules and agreements entered into by defendants, which are alleged by the plaintiffs to provide certain territorial and other exclusivities with respect to the television and online distribution of live hockey games, violate Sections 1 and 2 of the Sherman Antitrust Act. The complaints seek injunctive relief against the defendants' continued violation of the antitrust laws, treble damages, attorneys' fees and pre- and post-judgment interest. On July 27, 2012, the Company and the other defendants filed a motion to dismiss the complaints (which have been consolidated for procedural purposes). On December 5, 2012, the Court issued an Opinion and Order largely denying the motion to dismiss. On April 8, 2014, following the conclusion of fact discovery, all defendants filed motions for summary judgment seeking dismissal of the complaints in their entirety. On August 8, 2014, the Court denied the motions for summary judgment. The Company intends to vigorously defend the claims against the Company.
The Company is a defendant in various other lawsuits. Although the outcome of these other lawsuits cannot be predicted with certainty, management does not believe that resolution of these other lawsuits will have a material adverse effect on the Company.
33
PART II
Item 5. Market for the Registrant's Common Equity, Related Stockholder Matters and Issuer Purchases of Equity
Securities
Our Class A Common Stock is listed on NASDAQ under the symbol “MSG”.
Performance Graph
The following graph compares the relative performance of our Class A Common Stock, the Russell Midcap Index and the Russell 3000 Entertainment Index. This graph covers the period from February 9, 2010 (the first day our Class A Common Stock began trading on NASDAQ) through June 30, 2014. The stock price performance included in this graph is not necessarily indicative of future stock performance.
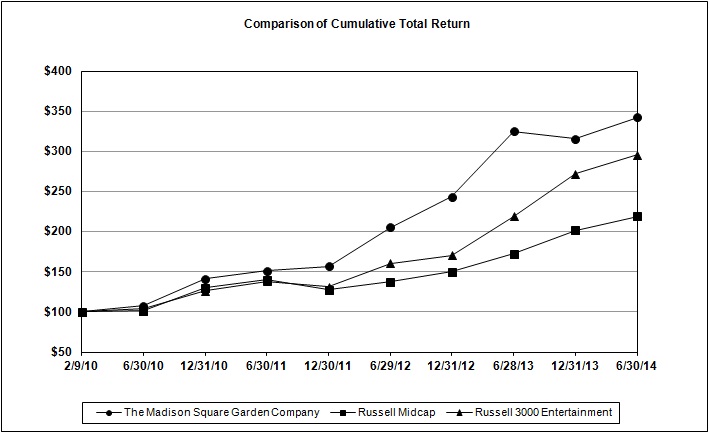
Base Period 2/9/10 | 06/30/10 | 12/31/10 | 06/30/11 | 12/30/11 | 06/29/12 | 12/31/12 | 06/28/13 | 12/31/13 | 06/30/14 | ||||||||||||||||||||||||||||||
The Madison Square Garden Company | $ | 100.00 | $ | 107.96 | $ | 141.49 | $ | 151.10 | $ | 157.19 | $ | 205.49 | $ | 243.41 | $ | 325.19 | $ | 316.03 | $ | 342.76 | |||||||||||||||||||
Russell Midcap Index | 100.00 | 101.31 | 129.79 | 140.28 | 127.78 | 137.97 | 149.86 | 173.02 | 201.96 | 219.48 | |||||||||||||||||||||||||||||
Russell 3000 Entertainment Index | 100.00 | 104.42 | 126.30 | 138.20 | 131.35 | 160.90 | 170.79 | 219.05 | 272.27 | 296.42 | |||||||||||||||||||||||||||||
This performance graph shall not be deemed “filed” for purposes of Section 18 of the Securities Exchange Act of 1934, as amended (the “Exchange Act”) or incorporated by reference into any of our filings under the Securities Act of 1933, as amended, or the Exchange Act, except as shall be expressly set forth by specific reference in such filing.
As of June 30, 2014, there were 1,179 holders of record of our Class A Common Stock. There is no public trading market for our Class B Common Stock, par value $.01 per share. As of June 30, 2014, there were 17 holders of record of our Class B Common Stock.
34
We did not pay any dividend on our common stock during the fiscal year 2014 and do not have any current plans to pay a cash dividend on our common stock for the foreseeable future.
Price Range of MSG Class A Common Stock
The following tables set forth for the periods indicated the intra-day high and low sales prices per share of our Class A Common Stock as reported on NASDAQ:
Year Ended June 30, 2014 | High | Low | |||||
For the Quarter ended September 30, 2013 | $ | 63.00 | $ | 54.28 | |||
For the Quarter ended December 31, 2013 | 61.58 | 54.00 | |||||
For the Quarter ended March 31, 2014 | 60.49 | 55.03 | |||||
For the Quarter ended June 30, 2014 | 62.60 | 48.16 | |||||
Year Ended June 30, 2013 | |||||||
For the Quarter ended September 30, 2012 | $ | 44.75 | $ | 34.36 | |||
For the Quarter ended December 31, 2012 | 45.99 | 39.04 | |||||
For the Quarter ended March 31, 2013 | 58.72 | 44.71 | |||||
For the Quarter ended June 30, 2013 | 63.44 | 54.66 | |||||
35
Item 6. Selected Financial Data
The operating and balance sheet data included in the following selected financial data table have been derived from the consolidated financial statements of The Madison Square Garden Company and its subsidiaries (which for periods prior to February 9, 2010 (the date of the Distribution), represent a combination of certain media, entertainment and sports businesses and assets that were historically owned and operated as parts of Cablevision). The financial information presented below for periods prior to the Distribution date does not necessarily reflect what our results of operations and financial position would have been if we had operated as a separate publicly-traded entity during those periods. The selected financial data presented below should be read in conjunction with the consolidated financial statements included in Item 8 of this Annual Report on Form 10-K and with Item 7. “Management’s Discussion and Analysis of Financial Condition and Results of Operations.”
Effective June 30, 2011, the Company changed its fiscal year-end from December 31st to June 30th to better align our financial planning and reporting cycles with the seasonality of our business, particularly our MSG Sports and MSG Entertainment segments.
Years Ended June 30, | Six Months Ended June 30, 2011 | Years Ended December 31, | |||||||||||||||||||||
2014 | 2013 | 2012 | 2010 | 2009 | |||||||||||||||||||
(in thousands, except per share data) | |||||||||||||||||||||||
Operating Data: | |||||||||||||||||||||||
Revenues | $ | 1,555,594 | $ | 1,340,818 | $ | 1,284,016 | $ | 564,287 | $ | 1,157,136 | $ | 1,062,417 | |||||||||||
Operating expenses: | |||||||||||||||||||||||
Direct operating | 899,383 | 691,029 | 714,362 | 331,306 | 686,442 | 682,337 | |||||||||||||||||
Selling, general and administrative | 365,148 | 309,568 | 304,624 | 143,179 | 279,263 | 273,712 | |||||||||||||||||
Depreciation and amortization (including impairments) | 106,950 | 89,132 | 87,503 | 44,926 | 56,907 | 61,336 | |||||||||||||||||
Operating income | 184,113 | 251,089 | 177,527 | 44,876 | 134,524 | 45,032 | |||||||||||||||||
Other income (expense): | |||||||||||||||||||||||
Equity in loss of nonconsolidated affiliates | (1,323 | ) | — | — | — | — | — | ||||||||||||||||
Interest expense, net | (4,898 | ) | (5,722 | ) | (4,752 | ) | (2,216 | ) | (3,457 | ) | (1,117 | ) | |||||||||||
Miscellaneous | (1,346 | ) | 3,497 | 7,072 | 5,561 | 3,924 | 2,000 | ||||||||||||||||
Income from operations before income taxes | 176,546 | 248,864 | 179,847 | 48,221 | 134,991 | 45,915 | |||||||||||||||||
Income tax expense | (61,478 | ) | (106,482 | ) | (73,302 | ) | (20,607 | ) | (51,611 | ) | (18,266 | ) | |||||||||||
Net income | $ | 115,068 | $ | 142,382 | $ | 106,545 | $ | 27,614 | $ | 83,380 | $ | 27,649 | |||||||||||
Basic earnings per common share (a) | $ | 1.49 | $ | 1.87 | $ | 1.42 | $ | 0.37 | $ | 1.13 | $ | 0.38 | |||||||||||
Diluted earnings per common share (a) | $ | 1.47 | $ | 1.83 | $ | 1.38 | $ | 0.36 | $ | 1.09 | $ | 0.38 | |||||||||||
Weighted-average number of common shares outstanding: (a) | |||||||||||||||||||||||
Basic | 77,142 | 76,268 | 74,938 | 74,350 | 73,864 | 73,309 | |||||||||||||||||
Diluted | 78,167 | 77,940 | 77,459 | 77,193 | 76,714 | 73,309 | |||||||||||||||||
Balance Sheet Data: | |||||||||||||||||||||||
Related party advances(b) | $ | — | $ | — | $ | — | $ | — | $ | — | $ | 190,000 | |||||||||||
Total assets | 2,925,961 | 2,732,214 | 2,524,684 | 2,280,256 | 2,197,807 | 2,041,499 | |||||||||||||||||
Capital lease obligations | 1,967 | 2,224 | 3,361 | 4,225 | 4,920 | 6,235 | |||||||||||||||||
Total stockholders’ equity | 1,604,444 | 1,478,935 | 1,320,013 | 1,205,885 | 1,170,924 | 1,106,103 | |||||||||||||||||
(a) | Common shares assumed to be outstanding during the year ended December 31, 2009 totaled 73,309, representing the shares issued to Cablevision shareholders on the Distribution date for purposes of calculating EPS. |
(b) | Represents outstanding non-interest bearing advances to a related party. On January 28, 2010, the intercompany advances were replaced with a promissory non-amortizing note having a principal amount of $190,000 with a maturity date of June 30, 2010 and allowed for prepayment without penalty at the borrower’s option. The note accrued interest at a rate of 3.25% per annum and was prepaid in March 2010. |
36
Item 7. Management's Discussion and Analysis of Financial Condition and Results of Operations
This Management's Discussion and Analysis of Financial Condition and Results of Operations, or MD&A, contains forward-looking statements within the meaning of the Private Securities Litigation Reform Act of 1995. In this MD&A, there are statements concerning the future operating and future financial performance of the Company and its segments, including the expected debut of the Company's new large-scale theatrical production, the benefit of the Madison Square Garden Arena (which we also refer to as “The Garden”), The Theater at Madison Square Garden and the Forum being available for events for a full fiscal year, expected growth in suite rental revenue and sponsorship and signage revenues, and increases in affiliation fee revenue. Words such as “expects,” “anticipates,” “believes,” “estimates,” “may,” “will,” “should,” “could,” “potential,” “continue,” “intends,” “plans,” and similar words and terms used in the discussion of future operating and future financial performance identify forward-looking statements. Investors are cautioned that such forward-looking statements are not guarantees of future performance or results and involve risks and uncertainties and that actual results or developments may differ materially from the forward-looking statements as a result of various factors. Factors that may cause such differences to occur include, but are not limited to:
• | the level of our revenues, which depends in part on the popularity and competitiveness of our sports teams and the level and popularity of the Radio City Christmas Spectacular and other entertainment events which are presented in our venues; |
• | costs associated with player injuries, and waivers or contract terminations of players and other team personnel; |
• | changes in professional sports teams' compensation, including the impact of signing of free agents and trades, subject to league salary caps; |
• | the demand for our programming among cable television systems and satellite, telephone and other multichannel video programming distributors (“Distributors”), and our ability to renew affiliation agreements with them, as well as the impact of consolidation among cable television systems and satellite providers; |
• | general economic conditions especially in the New York City metropolitan area where we conduct the majority of our operations; |
• | the demand for sponsorship arrangements and for advertising and viewer ratings for our programming; |
• | competition, for example, from other regional sports networks, other teams, other venues and other entertainment options; |
• | changes in laws, National Basketball Association (the “NBA”) or National Hockey League (the “NHL”) rules, regulations, guidelines, bulletins, directives, policies and agreements (including the leagues' respective collective bargaining agreements with their players' associations, salary caps, revenue sharing and NBA luxury tax thresholds) or other regulations under which we operate; |
• | the relocation or insolvency of professional sports teams with which we have a rights agreement; |
• | our ability to maintain, obtain or produce content for our MSG Media segment, together with the cost of such content; |
• | the successful development of new live productions or enhancements to existing productions and the investments associated with such development or enhancements |
• | the disposition of assets and/or the impact of, and our ability to, successfully pursue acquisitions or other strategic transactions; |
• | the costs associated with, and the outcome of, litigation and other proceedings to the extent uninsured; |
• | the impact of governmental regulations or laws, including the continued benefit of certain tax exemptions and the ability to maintain necessary permits or licenses; |
• | financial community and rating agency perceptions of our business, operations, financial condition and the industry in which we operate; and |
• | our ownership of professional sports franchises in the NBA and NHL and certain transfer restrictions on our common stock. |
37
We disclaim any obligation to update or revise the forward-looking statements contained herein, except as otherwise required by applicable federal securities laws.
All dollar amounts included in the following MD&A are presented in thousands, except as otherwise noted.
Introduction
MD&A is provided as a supplement to, and should be read in conjunction with, the audited consolidated financial statements and footnotes thereto included in this Annual Report on Form 10-K to help provide an understanding of our financial condition, changes in financial condition and results of operations. Our MD&A is organized as follows:
Business Overview. This section provides a general description of our business, as well as other matters that we believe are important in understanding our results of operations and financial condition and in anticipating future trends.
Results of Operations. This section provides an analysis of our results of operations for the years ended June 30, 2014, 2013 and 2012 on both a consolidated and segment basis. Our segments are MSG Media, MSG Entertainment and MSG Sports.
Liquidity and Capital Resources. This section provides a discussion of our financial condition, as well as an analysis of our cash flows for the years ended June 30, 2014, 2013 and 2012. The discussion of our financial condition and liquidity includes summaries of (i) our primary sources of liquidity and (ii) our contractual obligations and off balance sheet arrangements that existed at June 30, 2014.
Seasonality of Our Business. This section discusses the seasonal performance of our MSG Sports and MSG Entertainment segments.
Recently Issued Accounting Pronouncements and Critical Accounting Policies. This section includes a discussion of accounting policies considered to be important to our financial condition and results of operations and which require significant judgment and estimates on the part of management in their application. In addition, all of our significant accounting policies, including our critical accounting policies, are discussed in the notes to our consolidated financial statements included in Item 8 of this Annual Report on Form 10-K.
Business Overview
The Company is a fully-integrated sports, entertainment and media business comprised of dynamic and powerful assets and brands. The Company is comprised of three business segments: MSG Media, MSG Entertainment and MSG Sports, which are strategically aligned to work together to drive our overall business, which is built on a foundation of iconic venues and compelling content, including live sports and entertainment events that we create, produce, present and/or distribute through our programming networks and other media assets. The Company conducts a significant portion of its operations at venues that it either owns or operates under long-term leases. The Company owns The Garden and The Theater at Madison Square Garden in New York City, the Forum in Inglewood, CA and The Chicago Theatre in Chicago. In addition, the Company leases Radio City Music Hall and the Beacon Theatre in New York City, and has a booking agreement with respect to the Wang Theatre in Boston. A description of our segments follows:
MSG Media
MSG Media, which represented approximately 46% of our consolidated revenues for the year ended June 30, 2014, is a leader in production and content development for multiple distribution platforms, including content originating from the Company's venues. MSG Media is comprised of the Company's regional sports networks, MSG Network and MSG+, collectively the “MSG Networks.” For all periods presented, MSG Media also included Fuse, a national television network dedicated to music. On July 1, 2014, the Company completed the sale of Fuse to SiTV Media, Inc. for $226 million, subject to a working capital adjustment, and a 15 percent equity interest in SiTV Media, Inc., which interest is subject to potential reduction based on certain performance goals.
MSG Networks are home to seven professional sports teams: the New York Knicks (the “Knicks”), the New York Rangers (the “Rangers”), the New York Liberty (the “Liberty”), the New York Islanders (the “Islanders”), the New Jersey Devils (the “Devils”), the Buffalo Sabres (the “Sabres”) and the New York Red Bulls (the “Red Bulls”), as well as to our critically acclaimed original and other programming.
38
Revenue Sources
Our MSG Media segment earns revenues from two primary sources: affiliation fees and advertising. Affiliation fees, which are the fees we earn from Distributors that carry our programming, constitute the significant majority of the MSG Media segment revenues. Advertising revenue makes up a smaller portion of MSG Media segment overall revenues.
Affiliation Fee Revenue
Our MSG Media segment earns affiliation fee revenue from Distributors that carry our programming services. The fees we receive depend largely on the demand from subscribers for our programming. Affiliation fees from Cablevision accounted for more than 10% of the Company's consolidated revenues during the years ended June 30, 2014, 2013 and 2012.
Advertising Revenue
Our MSG Media segment earns revenues through the sale of commercial time to advertisers during our programming or through the sale of program sponsorship rights. We typically sell advertising time through our in-house staff and, to a lesser extent, through agencies.
Expenses
The principal expenses of our MSG Media segment are professional team rights fees, as well as rights fees to carry other programming content, other direct programming costs, as well as marketing and advertising costs. We also allocate a portion of our corporate expenses to the MSG Media segment.
Programming Acquisition Costs (Rights Fees)
In addition to the Company's ownership of Knicks, Rangers and Liberty rights, MSG Networks have multi-year rights agreements with the Islanders, Devils, Sabres and Red Bulls. The professional team rights acquired under license agreements to telecast various sporting events and other programming for exhibition on its networks are typically expensed on a straight-line basis over the term of the applicable contract or license period. We negotiate directly with the teams to determine the fee and other provisions of the rights arrangements. Rights fees for sports programming are influenced by, among other things, the size and demographics of the geographic area in which the programming is distributed, and the popularity and/or the on-court or on-ice competitiveness of a team. For purposes of reporting our segment information, the MSG Media segment recognizes rights expense for the licensing of team-related programming from the Company's MSG Sports segment. These inter-segment charges are generally recognized on a straight-line basis over the fiscal year and are eliminated in consolidation.
In addition to professional team rights, the MSG Media segment also acquires the rights to carry and/or produce other events or programming, such as other sporting events, movies, concerts or specials. The costs of this programming are amortized over the license period or projected useful life of the programming as the economic benefits are received.
Other Direct Programming Costs
Other direct programming costs include, but are not limited to the salaries of our on-air personalities, producers, directors, technicians, writers and other creative and technical staff, as well as expenses associated with location costs and maintaining studios and transmission facilities.
Certain owned original programming is produced for the Company's networks by independent production companies. Owned original programming costs are expensed as incurred and included in the other direct programming costs described above.
Marketing and Advertising Costs
We incur costs to market our media business and our programs through outdoor and newspaper advertisements, television and radio advertising and online marketing.
Factors Affecting Operating Results
The financial performance of our MSG Media segment is affected by the affiliation agreements we are able to negotiate with Distributors and also by the advertising rates we can charge advertisers. These factors in turn depend on the popularity and/or on-court and on-ice competitiveness of the professional sports teams carried on MSG Networks as well as the cost and the attractiveness of our programming content.
Due largely to our ownership of rights, multi-year rights agreements and the generally recurring nature of our affiliation agreements, the MSG Networks have consistently produced operating profits over a number of years. See “Part I — Item 1A.
39
Risk Factors — Risks Relating to Our Media Business — The Success of Our Media Business Also Depends on Affiliation Fees We Receive Under our Affiliation Agreements, the Loss of Which or Renewal of Which on Less Favorable Terms May Have a Material Negative Effect on Our Business and Results of Operations” for a discussion of risks associated with our affiliation agreements. Advertising revenues are less predictable and can vary based upon a number of factors, including general economic conditions.
Our MSG Media segment's future performance is also dependent on the U.S. and global economies, the impact of direct competition, and the relative strength of our current and future advertising customers. Weak economic conditions may lead to lower demand for television advertising. An economic downturn could adversely affect our business and results of operations. See “Part I — Item 1. Business — Regulation — Regulation of Our Media Business” for other factors that may affect operating results.
MSG Entertainment
Our MSG Entertainment segment, which represented approximately 19% of our consolidated revenues for the year ended June 30, 2014, is one of the country's leaders in live entertainment. MSG Entertainment presents or hosts live entertainment events, including concerts, family shows, performing arts and special events in our diverse collection of venues. Those venues include The Garden, The Theater at Madison Square Garden, Radio City Music Hall, the Beacon Theatre, The Chicago Theatre and the Wang Theatre. After purchasing the Forum in Inglewood, CA in 2012, the Company completed a successful renovation of the famed arena, which re-opened its doors in January 2014, adding yet another world-class venue to our portfolio. The scope of our collection of venues enables us to showcase acts that cover a wide spectrum of genres and popular appeal. Over the last several years, our venues have hosted artists such as Billy Joel, the Eagles, Madonna, Phish, Elton John, Eric Clapton, The Allman Brothers Band, Bruce Springsteen, Maroon 5, Taylor Swift, Justin Timberlake, Ed Sheeran, Armin Van Buuren, Sting and Paul Simon, Coldplay, One Direction, Jerry Seinfeld and Dave Chappelle; family shows such as Sesame Street Live, Yo Gabba Gabba Live and Disney Junior Live; special events such as the Tony Awards, America's Got Talent and appearances by His Holiness the Dalai Lama, along with graduations, upfronts and product launches; and theatrical productions such as A Christmas Story, How The Grinch Stole Christmas! and Cirque du Soleil's Zarkana. Although we primarily license our venues to third-party promoters for a fee, we also promote or co-promote shows in which case we have economic risk relating to the event. MSG Entertainment currently does not promote or co-promote events outside of our venues other than our productions discussed below.
MSG Entertainment also creates, produces and/or presents live productions, including the Radio City Christmas Spectacular, featuring the Rockettes, that are performed in the Company's and other venues. The Radio City Christmas Spectacular has been performed at Radio City Music Hall for 81 years and more than one million tickets were sold for performances during the 2013 holiday season. In addition, during the 2013 holiday season the Company presented the theater version of the show in Atlanta, West Palm Beach, Tampa and, for the 12th year, at the Grand Ole Opry House in Nashville.
Revenue Sources
Our primary sources of revenue in our MSG Entertainment segment are ticket sales to our live audiences for events that we produce or promote/co-promote and license fees for our venues paid by third-party promoters in connection with events that we do not produce or promote/co-promote. We also derive revenue from other sources, including facility and ticketing fees, concessions, sponsorships and signage, a portion of suite license fees at The Garden, merchandising and tours of our venues. The levels of revenue and expense we record in our MSG Entertainment segment for a given event depends to a significant extent on whether we are promoting or co-promoting the event or are licensing our venue to a third party.
Ticket Sales and Suite Licenses
For our productions and for entertainment events in our venues that we promote, we recognize revenues from the sale of tickets to our audiences. We sell tickets to the public through our box office, via our web sites and ticketing agencies and through group sales. The amount of revenue we earn from ticket sales depends on the number of shows and the mix of events that we promote, the seating capacity of the venue used, the extent to which we can sell to our seating capacity and our ticket prices.
The Garden has 21 Event Level suites, 58 Madison Level suites, and 18 9th floor Signature Level suites. Suite licenses at The Garden are generally sold to corporate customers pursuant to multi-year licenses. Under standard suite licenses, the licensees pay an annual license fee, which varies depending on the location of the suite. The license fee includes, for each seat in the suite, tickets for events at The Garden for which tickets are sold to the general public, subject to certain exceptions. In addition, suite holders pay for food and beverage service in their suites at The Garden. Revenues from the sale of suite licenses are shared between our MSG Entertainment and MSG Sports segments.
40
Venue License Fees
For entertainment events held at our venues that we do not produce, promote or co-promote, we earn venue license fees from the third-party promoter of the event. The amount of license fees we charge varies by venue, as well as by the size of the production and the number of days of the event, among other factors. Our fees include both the cost of renting space in our venues and costs for providing production services, such as front-of-house and back-of-house staffs, including stagehands, box office staff, ushers, security, staging, lighting and sound, and building services.
Whether we are promoting an event or licensing our venues to a third-party promoter has a significant impact on the level of revenues and the costs that we record in our MSG Entertainment segment.
Facility and Ticketing Fees
For all public and ticketed entertainment events held in our venues, we also earn additional revenues on substantially all tickets sold, whether we promote or co-promote the event or license the venue to a third party. These revenues are earned in the form of certain fees and assessments, including the facility fee we charge, on tickets we sell, and vary by venue.
Concessions
We sell food and beverages during substantially all entertainment events held at our venues. In addition to concession-style sales of food and beverages, which represent the majority of our concession revenues, we also provide catering for our suites at The Garden.
Merchandise
We earn revenues from the sale of merchandise relating to our proprietary productions and other live entertainment events that take place at our venues. The majority of our merchandise revenues are generated through on-site sales during performances of our productions and other live events. We also generate revenues from the sales of our Radio City Christmas Spectacular merchandise, such as ornaments and apparel, through traditional retail channels. Typically, revenues from our merchandise sales at our non-proprietary events relate to sales of merchandise provided by the artist, the producer or promoter of the event.
Venue Signage and Sponsorship
We earn revenues through the sale of signage space and sponsorship rights in connection with our venues, productions and other live entertainment events. Signage revenues generally involve the sale of advertising space at The Garden during entertainment events and otherwise in our venues.
Sponsorship rights may require us to use the name, logos and other trademarks of a sponsor in our advertising and in promotions for our venues, productions and other live entertainment events. Sponsorship arrangements may be exclusive within a particular sponsorship category or non-exclusive and generally permit a sponsor to use the name, logos and other trademarks of our productions, events and venues in connection with their own advertising and in promotions in our venues or in the community.
Expenses
Our MSG Entertainment segment's principal expenses are payments made to performers and promoters, staging costs and day-of-event costs associated with events, and advertising costs. We charge a portion of our actual expenses associated with the ownership, lease, maintenance and operation of our venues, along with a portion of our corporate expenses to our MSG Entertainment segment. However, the operating results of our MSG Entertainment segment benefit from the fact that no rent is charged to the segment for use of the Company's owned venues. We do not allocate to our segments any depreciation expense on property and equipment related to The Garden, The Theater at Madison Square Garden and the Forum.
Performer Payments
Our productions are performed by talented actors, dancers, singers, musicians and entertainers. In order to attract and retain this talent, we are required to pay our performers an amount that is commensurate both with their abilities and with demand for their services from other entertainment companies. Our productions, including the Radio City Christmas Spectacular, typically feature ensemble casts (such as the Rockettes), where there is no single “headline” performer. As a result, most of our performers are paid based on a standard “scale,” pursuant to collective bargaining agreements we negotiate with the performers' unions.
41
Staging Costs
Staging costs for our proprietary events as well as others that we promote include the costs of sets, lighting, display technologies, special effects, sound and all of the other technical aspects involved in presenting a live entertainment event. These costs vary substantially depending on the nature of the particular show, but tend to be highest for large-scale theatrical productions, such as the Radio City Christmas Spectacular. For concerts we promote, the performer usually provides a fully-produced show. As with performer salaries, the staging costs associated with a given production are an important factor in the determination of ticket prices.
Day-of-event Costs
For days on which MSG Entertainment stages its productions, promotes an event or provides one of our venues to a third-party promoter under a license fee arrangement, the event is charged the variable costs associated with such event, including box office personnel, stagehands, ticket takers, ushers, security, and other similar expenses. In situations where we provide our venues to a third-party promoter under a license fee arrangement, day-of-event costs are typically included in the license fees charged to the promoter.
Marketing and Advertising Costs
We incur significant costs promoting our productions and other events through outdoor and newspaper advertisements, television and radio advertising and social, digital and search advertising. In light of the intense competition for entertainment events, especially in the New York City metropolitan area, such expenditures are a necessity to drive interest in our productions and encourage members of the public to purchase tickets to our shows.
Touring Expenses
For productions that we take on the road, we must pay the logistical costs associated with travel and equipment, as well as fees and expenses, including the costs of venue staff, for the use of third-party venues.
Factors Affecting Operating Results
The operating results of our MSG Entertainment segment are largely dependent on our ability to attract concerts, family shows and other events to our venues, as well as the continuing popularity of the Radio City Christmas Spectacular at Radio City Music Hall. Our MSG Entertainment segment recognized operating losses during the years ended June 30, 2014, 2013 and 2012. These results reflect the impact of The Garden and the Theater at Madison Square Garden being shut down for the off-season following the Knicks' and Rangers' playoffs during these fiscal years.
Our MSG Entertainment segment's future performance is dependent in part on general economic conditions, and the effect of these conditions on our customers. Weak economic conditions may lead to lower demand for suite licenses and tickets to our live productions, concerts, family shows and other events, which would also negatively affect concession and merchandise sales, as well as lower levels of sponsorship and venue signage. These conditions may also affect the number of concerts, family shows and other events that take place in the future. An economic downturn could adversely affect our business and results of operations.
The Company is investing in a large-scale theatrical production for Radio City Music Hall, which is expected to debut in the Spring of 2015, and continues to explore additional opportunities to expand our presence in the entertainment industry. Any new investment may not initially contribute to operating income, but will be expected to become operationally profitable over time. Our results will also be affected by investments in, and the success of, new productions.
MSG Sports
Our MSG Sports segment, which, net of inter-segment revenues, represented approximately 35% of our consolidated revenues for the year ended June 30, 2014, owns and operates sports franchises, including the Knicks, a founding member of the NBA, and the Rangers, one of the “original six” franchises of the NHL. MSG Sports also owns and operates the Liberty of the Women's National Basketball Association (the “WNBA”), one of the league's founding franchises, and the Hartford Wolf Pack of the American Hockey League (the “AHL”), which is the primary player development team for the Rangers, and is also competitive in its own right in the AHL. In March 2014, the Company acquired the rights to own and operate an NBA Development League (the “NBADL”) team, named the Westchester Knicks, which will begin operations for the 2014-15 season and will play their home games at the Westchester County Center in White Plains, New York. The Knicks and Rangers play their home games at The Garden. The Liberty have historically played 17 regular season home games at The Garden. However, due to the final phase of the comprehensive transformation of The Garden into a state-of-the-art arena (the “Transformation”), they played their 2013 and 2012 seasons at the Prudential Center in Newark, New Jersey before returning to
42
The Garden for their 2014 season. Our sports business also features other sports properties, including the presentation of a wide variety of live sporting events including professional boxing, college basketball, professional bull riding, tennis and college wrestling.
Revenue Sources
We earn revenue in our MSG Sports segment from several primary sources: ticket sales and a portion of suite license fees at The Garden, our share of distributions from NHL and NBA league-wide national and international television contracts and other league-wide revenue sources, venue signage and other sponsorships, concessions and merchandising. We also earn venue license fees, primarily from the rental of The Garden to third-party promoters holding their sports events at our arena. The amount of revenue we earn is influenced by many factors, including the popularity and on-court or on-ice performance of our professional sports teams and general economic conditions. Our MSG Sports segment also earns substantial fees from our MSG Media segment for the right to telecast the games of our professional sports teams. These inter-segment revenues are eliminated in our consolidated financial statements.
Ticket Sales, Suite Licenses, Venue Licenses, Facility and Ticketing Fees
Ticket sales constitute the largest single source of revenue for our MSG Sports segment. We sell tickets to our sports teams' home games through season tickets, which are typically held by long-term season subscribers, through group sales, and through single-game tickets, which are purchased by fans either individually or in multi-game packages. The prices of our tickets vary, depending on the sports team and the location of the seats. We generally review and set the price of our tickets before the start of each team's season. We also earn revenue from the sale of tickets to live sporting events that we promote other than Knicks, Rangers and Liberty games.
Revenues from the sale of suite licenses are shared between our MSG Entertainment and MSG Sports segments. See “— Business Overview — MSG Entertainment — Revenue Sources” for further discussion.
In addition to Knicks and Rangers home games, we also present or host other live sporting events at our venues. When the Company acts as the promoter of such events, the Company earns revenues from ticket sales and incurs expenses associated with the event. When these events are promoted by third-party promoters, the Company earns venue license fees from the promoter for use of our venues. When licensing our venues, the amount recorded as revenue also includes the event's variable costs such as the costs of front-of-house and back-of-house staffs, including union laborers, box office staff, ushers, security and building services, which we pass along to the promoter. The mix of live sporting events, including whether we are the promoter of an event or license our venues to a third-party promoter, has a significant impact on the level of revenues and event related costs that we record in our MSG Sports segment.
Our MSG Sports segment also earns revenues in the form of certain fees and assessments added to ticket prices for events held at our venues, regardless of whether we act as promoter for such events. This currently includes a facility fee the Company charges on tickets it sells to all events at our venues, except for team season tickets and certain other limited exceptions.
Telecast Rights
We earn revenue from the sale of telecast rights for our sports teams' home and away games and also through the receipt of our share of fees paid for league-wide telecast rights, which are awarded under contracts negotiated and administered by each league.
Telecast rights for the Knicks and Rangers are held by MSG Networks, pursuant to inter-segment arrangements between our MSG Sports and MSG Media segments. The financial success of our MSG Sports segment is largely dependent on the rights fees we receive from our MSG Media segment in connection with the telecast of our Knicks and Rangers games. These inter-segment fees are eliminated in our consolidated financial statements.
National and international telecast arrangements differ by league. Fees paid by telecasters under these arrangements are pooled by each league and then generally shared equally among all teams.
Venue Signage and Sponsorships
We earn revenues through the sale of signage space and sponsorship rights at The Garden in connection with our sports teams and certain other sporting events. Our strategy is to develop marketing partnerships with world-class brands by creating customized platforms that achieve our partners' business objectives. Signage sales generally involve the sale of advertising space within The Garden during our teams' home games and include the sale of signage on the ice and on the boards of the hockey rink during Rangers games, courtside during Knicks and Liberty games, or on the various scoreboards and display panels at The Garden. We offer both television camera-visible and non-camera-visible signage space.
43
Sponsorship rights generally require us to use the name, logos and other trademarks of a sponsor in our advertising and in promotions for our sports teams and during our sports events. Sponsorship arrangements may be exclusive within a particular sponsorship category or non-exclusive and generally permit a sponsor to use the name, logos and other trademarks of our sports teams and venues in connection with their own advertising and in promotions on-court, on-ice or in the community.
Concessions
We sell food and beverages during all sporting events held at our venues. In addition to concession-style sales of food and beverages, which represent the majority of our concession revenues, we also provide higher-end dining at our full service restaurant and clubs and catering for suites at The Garden.
Merchandise
We earn revenues from the sale of our sports teams' merchandise both through the in-venue (and in some cases, online) sale of items bearing the logos or other marks of our sports teams and through our share of league distributions of royalty and other revenues from the league's licensing of team and league trademarks, which revenues are generally shared equally among the teams in the leagues. By agreement among the teams, each of the leagues in which we operate acts as agent for the teams to license their logos and other marks, as well as the marks of the leagues, subject to certain rights retained by the teams to license these marks within their arenas and the geographic areas in which they operate.
Expenses
The most significant expenses in our MSG Sports segment are player and other team personnel salaries and charges for transactions relating to players for career-ending and season-ending injuries, trades, and waivers and contract termination costs of players and other team personnel. We also incur costs for travel, player insurance, league operating assessments (including a 6% NBA assessment on regular season ticket sales), NHL and NBA revenue sharing and NBA luxury tax. We charge a portion of our actual expenses associated with the ownership, lease, maintenance and operation of our venues, along with a portion of our corporate expenses to our MSG Sports segment. However, the operating results of our MSG Sports segment benefit from the fact that no rent is charged to the segment for use of the Company's owned venues. We do not allocate to our segments any depreciation expense on property and equipment related to The Garden, The Theater at Madison Square Garden and the Forum.
Player Salaries, Escrow System/Revenue Sharing and NBA Luxury Tax
The amount we pay an individual player is determined by negotiation between the player (typically represented by an agent) and us, and is generally influenced by the player's individual playing statistics, by the amounts paid to players with comparable playing statistics by other sports teams and by restrictions in the collective bargaining agreements (“CBAs”), including the salary caps. The leagues' CBAs typically contain restrictions on when players may move between league clubs following expiration of their contracts and what rights their current and former clubs have. Our most significant player expenses generally come from signing unrestricted free agents because players are generally able to negotiate the highest salary when they become unrestricted free agents.
The NBA CBA was last negotiated in 2011 and expires after the 2020-21 season (although the NBA and the National Basketball Players Association (“NBPA”) each have the right to terminate the CBA following the 2016-17 season). The NBA CBA contains a “soft” salary cap (i.e., a cap on each team's aggregate player salaries but with certain exceptions that enable teams to pay more, sometimes substantially more, than the cap).
NBA Luxury Tax. Amounts in this paragraph are in thousands, except for luxury tax rates. The NBA CBA provides for a luxury tax that is applicable to all teams with aggregate player salaries exceeding a threshold that is set prior to each season based upon projected league-wide revenues (as defined under the CBA). A team's luxury tax for the 2011-12 and 2012-13 seasons generally equaled the amount by which the team's aggregate player salaries exceeded such threshold. Beginning with the 2013-14 season, the tax rates for teams with aggregate player salaries above such threshold start at $1.50 for each $1.00 of team salary above the threshold up to $5,000 and scale up to $3.25 for each $1.00 of team salary that is from $15,000 to $20,000 over the threshold, and an additional tax rate increment of $0.50 applies for each additional $5,000 (or part thereof) of team salary in excess of $20,000 over the threshold. In addition, for teams that are taxpayers in at least four of any five seasons beginning in 2011-12, the above tax rates are increased by $1.00 for each increment. Beginning with the 2012-13 season, 50% of the aggregate luxury tax payments are to be used as a funding source for the revenue sharing plan and the remaining 50% of such payments will be distributed in equal shares to non-taxpaying teams. The Knicks were a NBA luxury tax payer with respect to the 2012-13 and 2013-14 seasons, and we expect to be an NBA luxury tax payer in the 2014-15 season. Subsequent years beyond the 2014-15 season will be subject to contractual player payroll obligations and corresponding NBA luxury tax thresholds. The Company recognizes the estimated amount associated with luxury tax expense or the amount it expects to receive as a non-tax paying team, if applicable, on a straight-line basis over the NBA regular season as a component of direct
44
operating expenses. Our provision for the year ended June 30, 2014, including luxury tax provisions related to team personnel transactions, was approximately $38,100.
NBA Escrow System/Revenue Sharing. The NBA CBA also provides that players collectively receive a designated percentage of league-wide revenues (net of certain direct expenses) as compensation (approximately 50%), and the teams retain the remainder. The percentage of league-wide revenues paid as compensation and retained by the teams does not apply evenly across all teams and accordingly the Company may pay its players a higher or lower portion of the Knicks' revenues than other NBA teams. Throughout each season, NBA teams withhold 10% of each player's salary and contribute the withheld amounts to an escrow account. If the league's aggregate player compensation exceeds the designated percentage of league-wide revenues, some or all of such escrowed amounts are distributed equally to all NBA teams. In the event that the league's aggregate player compensation is below the designated percentage of league-wide revenues, the teams will remit the shortfall to the NBPA for distribution to the players.
The NBA also has instituted a revenue sharing plan that generally requires the distribution of a pool of funds to teams with below-average net revenues (as defined in the plan), subject to reduction or elimination based on individual team market size and profitability. The plan is funded by a combination of disproportionate contributions from teams with above-average net revenues, subject to certain profit-based limits (each as defined in the plan); 50% of aggregate league-wide luxury tax proceeds (see above); and, collective league sources, if necessary. Additional amounts may also be distributed on a discretionary basis, funded by assessments on playoff ticket revenues and through collective league sources.
We record our revenue sharing expense net of the amount we expect to receive from the escrow. Our net provision for these items for the year ended June 30, 2014 was approximately $23,100. The actual amounts for the 2013-14 season may vary significantly from the recorded provision based on actual operating results for the league and all NBA teams for the season and other factors.
NHL CBA. The NHL CBA expires September 15, 2022 (although the NHL and National Hockey League Players' Association (“NHLPA”) each have the right to terminate the CBA effective following the 2019-20 season). The NHL CBA provides for a “hard” salary cap (i.e., teams may not exceed a stated maximum that has been negotiated for the 2012-13 and 2013-14 seasons and is adjusted each season thereafter based upon league-wide revenues).
NHL Escrow System/Revenue Sharing. The NHL CBA provides that each season the players receive as player compensation 50% of that season's league-wide revenues, excluding the impact of agreed-upon aggregate transition payments of $300,000 to be paid on a deferred basis over three years beginning in 2014. Because the percentage to be paid to the players is based upon league-wide revenues and not on a team-by-team basis, the Company may pay its players a higher or lower portion of the Rangers' revenues than other NHL teams pay of their own revenues. In order to implement the salary cap system, NHL teams withhold a portion of each player's salary and contribute the withheld amounts to an escrow account. If the league's aggregate player compensation for a season exceeds the designated percentage (50%) of that season's league-wide revenues, the excess is retained by the league. For the shortened 2012-13 season, any such excess funds will be utilized or distributed by the NHL in its sole discretion. Beginning with the 2013-14 season, any such excess funds will be distributed to all teams in equal shares.
The NHL CBA provides for a revenue sharing plan. The plan generally requires the distribution of a pool of funds approximating 6.055% of league-wide revenues to certain qualifying lower-revenue teams and is funded as follows: (a) 50% from contributions by the top ten revenue earning teams (based on preseason and regular season revenues) in accordance with a formula; (b) then from payments by teams participating in the playoffs, with each team contributing 35% of its gate receipts for each home playoff game; and (c) the remainder from centrally-generated NHL sources. We record our revenue sharing expense net of the amount we expect to receive from the escrow. Our net provision for these items for the year ended June 30, 2014 was approximately $14,200 (including approximately $12,100 related to the playoffs). The actual amounts for the 2013-14 season may vary significantly from the recorded provision based on actual operating results for the league and all NHL teams for the season and other factors.
Other Team Operating Expenses
Our sports teams also pay expenses associated with day-to-day operations, including for travel, equipment maintenance and player insurance. Direct variable day-of-event costs incurred at The Garden, such as the costs of front-of-house and back-of-house staffs, including union laborers, box office staff, ushers, security, and event production are charged to our MSG Sports segment.
Operating costs of the Company's training facility in Greenburgh, New York and the operating and maintenance costs of the aircraft that the Company owns are also charged to our MSG Sports segment. The operation of the Hartford Wolf Pack is also a net Ranger player development expense for our MSG Sports segment.
45
As members of the NBA and NHL, the Knicks and Rangers, respectively are also subject to annual league assessments. The governing bodies of each league determine the amount of each season's league assessments that are required from each member team. The NBA imposes on each team a 6% assessment on regular season ticket revenue and an assessment of 45% or 52.5% (plus an additional 5% to fund the discretionary revenue sharing payment described above) on playoff ticket revenue, depending on the number of home games played.
Our MSG Sports segment also incurs costs associated with VIP amenities, which have come online as a result of the Transformation, provided to certain ticket holders.
Other Expenses
MSG Sports also incurs selling, general and administrative expenses.
Factors Affecting Operating Results
The operating results of our MSG Sports segment are largely dependent on the continued popularity and/or on-ice or on-court competitiveness of our Rangers and Knicks teams, which have a direct effect on ticket sales for the teams' home games, and are each team's largest single source of revenue as well as our ability to attract high caliber sporting events. As with other sports teams, the competitive positions of our sports teams depend primarily on our ability to develop, obtain and retain talented players, for which we compete with other professional sports teams. A significant factor in our ability to attract and retain talented players is player compensation. Our MSG Sports segment results reflect the impact of high costs for player salaries (including NBA luxury tax) and salaries of non-player team personnel. In addition, we have incurred significant charges for costs associated with transactions relating to players on our sports teams for season-ending and career-ending injuries and for trades, waivers and contract terminations of players and other team personnel, including team executives. Waiver and termination costs reflect our efforts to improve the competitiveness of our teams. These transactions can result in significant charges as the Company recognizes the estimated ultimate costs of these events in the period in which they occur, although amounts due to these individuals are generally paid over their remaining contract terms. For example, the expense for these items was $54,225 and $18,715 for fiscal years 2014 and 2013, respectively. These expenses add to the volatility of the results of our MSG Sports segment. We expect to continue to pursue opportunities to improve the overall quality of our teams and our efforts may result in continued significant expenses and charges. Such expenses and charges may result in future operating losses for our MSG Sports segment although it is not possible to predict their timing or amount. Our MSG Sports segment's performance has been, and may in the future be, impacted by work stoppages. See “Part I — Item 1A. Risk Factors — General Risks — Organized Labor Matters May Have a Material Negative Effect on Our Business and Results of Operations.”
In addition to our MSG Sports segment's future performance being dependent upon the continued popularity and/or on-ice or on-court competitiveness of our Rangers and Knicks teams, it is also dependent on general economic conditions, in particular those in the New York City metropolitan area, and the effect of these conditions on our customers. An economic downturn could adversely affect our business and results of operations as it may lead to lower demand for suite licenses and tickets to the games of our sports teams, which would also negatively affect merchandise and concession sales, as well as lower levels of sponsorship and venue signage revenues. These conditions may also affect the number of other live sporting events that this segment is able to present.
Corporate Expenses and Venue Operating Costs
The Company allocates certain corporate costs to all of its reportable segments. In addition, the Company allocates its venue operating expenses to its MSG Entertainment and MSG Sports segments. Allocated venue operating expenses include the non-event related costs of operating the Company's venues, and include such costs as rent for the Company's leased venues, real estate taxes, insurance, utilities, repairs and maintenance, and labor related to the overall management of the venues. Depreciation expense on property and equipment related to The Garden, The Theater at Madison Square Garden, and the Forum is not allocated to the reportable segments.
Investments in Nonconsolidated Affiliates
The Company’s equity method investments include investments in Azoff MSG Entertainment LLC (“Azoff-MSG”), Brooklyn Bowl Las Vegas, LLC (“BBLV”) and Tribeca Enterprises LLC (“Tribeca Enterprises”).
In September 2013, the Company acquired a 50% interest in Azoff-MSG. The Azoff-MSG entity owns and operates businesses in the entertainment industry and is currently focused on music management, performance rights, comedy and productions, and strategic marketing. As of June 30, 2014, the Company’s investment in Azoff-MSG was $125,677, inclusive of transaction costs related to the acquisition. In addition, as of June 30, 2014, Azoff-MSG had outstanding loans, including accrued interest, of $50,300 under the unsecured credit facility with the Company.
46
In August 2013, the Company acquired an interest in BBLV. In March 2014, BBLV opened a new venue in Las Vegas which brings together live music, bowling and a restaurant, and was modeled after the successful Brooklyn Bowl destination in New York. As of June 30, 2014 the Company's preferred equity investment in BBLV, together with transaction costs related to the acquisition, was $25,725. In addition, as of June 30, 2014, outstanding loans of $1,334 had been advanced by the Company to BBLV.
In March 2014, the Company acquired a 50% interest in Tribeca Enterprises. Tribeca Enterprises owns and operates the Tribeca Film Festival and certain other businesses. Tribeca Enterprises’ businesses also include Tribeca Digital Studios, a branded entertainment content business; Tribeca Cinemas, a unique event space; and Tribeca Film, an independent film distribution label. As of June 30, 2014, the Company’s investment in Tribeca Enterprises was $22,582, inclusive of transaction costs related to the acquisition.
Impact of Current Economic Conditions
The future performance of our business segments and our Company as a whole is dependent, to a large extent, on general U.S. and global economic conditions, including the degree to which audiences and fans are willing to attend events hosted at our venues, our relative strength of position in the marketplace with both suppliers and customers, the impact of direct competition, our ability to manage our businesses effectively, and capital market circumstances that may influence our pursuit of strategic initiatives.
Challenges to U.S. and global economic performance may lead to lower attendance at the games of our sports teams and at our live productions, lower demand for suite licenses, fewer sponsorship transactions, fewer event bookings at our venues and lower television advertising revenues. An economic downturn could adversely affect our business and results of operations.
47
Results of Operations
Comparison of the Year Ended June 30, 2014 versus the Year Ended June 30, 2013
Consolidated Results of Operations
The table below sets forth, for the periods presented, certain historical financial information and the percentage that those items bear to revenues.
STATEMENT OF OPERATIONS DATA
Years Ended June 30, | Increase (Decrease) in Net Income | ||||||||||||||||
2014 | 2013 | ||||||||||||||||
Amount | % of Revenues | Amount | % of Revenues | ||||||||||||||
Revenues | $ | 1,555,594 | 100 | % | $ | 1,340,818 | 100 | % | $ | 214,776 | |||||||
Operating expenses: | |||||||||||||||||
Direct operating | 899,383 | 58 | % | 691,029 | 52 | % | (208,354 | ) | |||||||||
Selling, general and administrative | 365,148 | 23 | % | 309,568 | 23 | % | (55,580 | ) | |||||||||
Depreciation and amortization | 106,950 | 7 | % | 89,132 | 7 | % | (17,818 | ) | |||||||||
Operating income | 184,113 | 12 | % | 251,089 | 19 | % | (66,976 | ) | |||||||||
Other income (expense): | |||||||||||||||||
Equity in loss of nonconsolidated affiliates | (1,323 | ) | NM | — | NM | (1,323 | ) | ||||||||||
Interest expense, net | (4,898 | ) | NM | (5,722 | ) | NM | 824 | ||||||||||
Miscellaneous | (1,346 | ) | NM | 3,497 | NM | (4,843 | ) | ||||||||||
Income from operations before income taxes | 176,546 | 11 | % | 248,864 | 19 | % | (72,318 | ) | |||||||||
Income tax expense | (61,478 | ) | (4 | )% | (106,482 | ) | (8 | )% | 45,004 | ||||||||
Net income | $ | 115,068 | 7 | % | $ | 142,382 | 11 | % | $ | (27,314 | ) | ||||||
___________________________________
NM – Percentage is not meaningful
The comparability of the results of operations of the Company and the MSG Media and MSG Sports segments for the year ended June 30, 2014 to the prior year was impacted by the prior year's NHL work stoppage, which delayed the start of the 2012-13 regular season by approximately three months until January 19, 2013 and led to a shortened 48 game regular season. As a result, the Rangers (as well as other NHL teams whose games are telecast on MSG Networks) played fewer regular season home and away games during the prior year as compared to the current year. During the year ended June 30, 2014, the Rangers played 82 regular season games, of which 41 were home games and 41 were away games, as compared to 48 regular season games in the prior year, of which 24 were home games and 24 were away games. In addition, the results for the year ended June 30, 2014 reflect the waiver of a Rangers player, which was the second and final compliance buyout allowed under the terms of the NHL CBA.
See “Business Segment Results” within each presented comparative financial period for a more detailed discussion relating to the operating results of our segments. The business segment results do not reflect inter-segment eliminations.
48
Revenues
Revenues for the year ended June 30, 2014 increased $214,776, or 16%, to $1,555,594 as compared to the prior year. The net increase is attributable to the following:
Increase in MSG Media segment revenues | $ | 36,781 | |
Increase in MSG Entertainment segment revenues | 48,803 | ||
Increase in MSG Sports segment revenues | 141,781 | ||
Increase in other revenues | 88 | ||
Inter-segment eliminations | (12,677 | ) | |
$ | 214,776 | ||
See above for a discussion of the NHL work stoppage during the 2012-13 season.
Direct operating expenses primarily include:
• | compensation expense for the Company's professional sports teams' players and certain other team personnel; |
• | cost of team personnel transactions for career- and season-ending player injuries, net of anticipated insurance recoveries, trades, and waivers/contract termination costs of players and other team personnel; |
• | NBA luxury tax, NBA and NHL revenue sharing and league assessments for the MSG Sports segment; |
• | cost of professional team rights acquired under license agreements to telecast various sporting events on our networks; |
• | other programming and production costs of our networks; |
• | event costs related to the presentation and production of our live entertainment and sporting events; |
• | venue lease, maintenance and other operating expenses; and |
• | the cost of concessions and merchandise sold. |
Direct operating expenses for the year ended June 30, 2014 increased $208,354, or 30%, to $899,383 as compared to the prior year. The net increase is attributable to the following:
Increase in MSG Media segment expenses | $ | 40,769 | |
Increase in MSG Entertainment segment expenses | 32,839 | ||
Increase in MSG Sports segment expenses | 147,793 | ||
Decrease in other expenses | (4 | ) | |
Inter-segment eliminations | (13,043 | ) | |
$ | 208,354 | ||
Selling, general and administrative expenses
Selling, general and administrative expenses primarily consist of administrative costs, including compensation, separation-related costs, professional fees, as well as sales and marketing costs, including non-event related advertising expenses. Selling, general and administrative expenses for the year ended June 30, 2014 increased $55,580, or 18%, to $365,148 as compared to the prior year. The net increase is attributable to the following:
Increase in MSG Media segment expenses | $ | 2,212 | |
Increase in MSG Entertainment segment expenses | 10,604 | ||
Increase in MSG Sports segment expenses | 19,151 | ||
Increase in other expenses | 23,247 | ||
Inter-segment eliminations | 366 | ||
$ | 55,580 | ||
49
The increase in other expenses was primarily due to executive management transition costs recorded during the third quarter of the current year.
Depreciation and amortization
Depreciation and amortization for the year ended June 30, 2014 increased $17,818, or 20%, to $106,950 as compared to the prior year primarily due to higher depreciation expense on property and equipment placed into service associated with the Transformation of The Garden and, to a lesser extent, assets placed in service as a result of the re-opening of the Forum.
Equity in loss of nonconsolidated affiliates
Equity in loss of nonconsolidated affiliates for the year ended June 30, 2014 reflects the Company's share of the net loss of nonconsolidated affiliates, inclusive of amortization expense for intangible assets associated with these investments. The Company's share of the earnings (loss) of its equity investments in Azoff-MSG, BBLV and Tribeca Enterprises are recorded on a three-month lag basis.
Miscellaneous income (expense)
Miscellaneous expense for the year ended June 30, 2014 primarily includes transaction costs related to the sale of Fuse, which was completed on July 1, 2014 (see Note 23 to the consolidated financial statements included in Item 8 of this Annual Report on Form 10-K). Miscellaneous income for the year ended June 30, 2013 includes a pre-tax gain of approximately $3,100 from the sale of all of the Company's holdings of Live Nation common stock (see Note 15 to the consolidated financial statements included in Item 8 of this Annual Report on Form 10-K).
Income taxes
Income tax expense for the year ended June 30, 2014 was $61,478. The effective tax rate of 34.8% differs from the statutory federal rate of 35% due principally to the benefit of the federal rehabilitation credit, the impact of the domestic production activities deduction, decreases in state tax rates enacted during the year, and the tax return to book provision adjustment in connection with the filing of the Company’s 2012 federal and state income tax returns. These benefits are mostly offset by state and local income taxes and the impact of non-deductible expenses. The amount of the rehabilitation tax credit benefit recognized in income tax expense was approximately $8,498. This federal rehabilitation credit is based on eligible expenditures incurred as a result of the renovation of the Forum.
Income tax expense for the year ended June 30, 2013 was $106,482. The effective tax rate of 42.8% differs from the statutory federal rate of 35% due principally to state and local income taxes, nondeductible expenses and an increase in federal income tax expense recorded in connection with the filing of the Company's 2011 income tax returns, reflecting a lower domestic production activity deduction, offset by the tax benefit resulting from the domestic production activities deduction in fiscal year 2013.
AOCF
The Company evaluates segment performance based on several factors, of which the key financial measure is their operating income (loss) before (i) depreciation, amortization and impairments of property and equipment and intangible assets, (ii) share-based compensation expense or benefit and (iii) restructuring charges or credits, which is referred to as adjusted operating cash flow (“AOCF”). The Company has presented the components that reconcile AOCF to operating income (loss), an accepted GAAP measure. The following is a reconciliation of operating income to AOCF:
Years Ended June 30, | Increase (Decrease) in AOCF | ||||||||||
2014 | 2013 | ||||||||||
Operating income | $ | 184,113 | $ | 251,089 | $ | (66,976 | ) | ||||
Share-based compensation | 21,750 | 15,340 | 6,410 | ||||||||
Depreciation and amortization | 106,950 | 89,132 | 17,818 | ||||||||
AOCF | $ | 312,813 | $ | 355,561 | $ | (42,748 | ) | ||||
50
AOCF for the year ended June 30, 2014 decreased $42,748, or 12%, to $312,813 as compared to the prior year. The net decrease is attributable to the following:
Decrease in AOCF of the MSG Media segment | $ | (6,009 | ) |
Increase in AOCF of the MSG Entertainment segment | 5,921 | ||
Decrease in AOCF of the MSG Sports segment | (23,439 | ) | |
Other net decreases | (19,221 | ) | |
$ | (42,748 | ) | |
Other net decreases were primarily due to executive management transition costs recorded during the third quarter of the current year.
See above for a discussion of the NHL work stoppage during the 2012-13 season.
Business Segment Results
MSG Media
The table below sets forth, for the periods presented, certain historical financial information and the percentage that those items bear to revenues for the Company's MSG Media segment.
Years Ended June 30, | Increase (Decrease) in Operating Income | ||||||||||||||||
2014 | 2013 | ||||||||||||||||
Amount | % of Revenues | Amount | % of Revenues | ||||||||||||||
Revenues | $ | 714,514 | 100 | % | $ | 677,733 | 100 | % | $ | 36,781 | |||||||
Direct operating expenses | 259,434 | 36 | % | 218,665 | 32 | % | (40,769 | ) | |||||||||
Selling, general and administrative expenses | 116,353 | 16 | % | 114,141 | 17 | % | (2,212 | ) | |||||||||
Depreciation and amortization | 15,559 | 2 | % | 16,358 | 2 | % | 799 | ||||||||||
Operating income | $ | 323,168 | 45 | % | $ | 328,569 | 48 | % | $ | (5,401 | ) | ||||||
The following is a reconciliation of operating income to AOCF:
Years Ended June 30, | Increase (Decrease) in AOCF | ||||||||||
2014 | 2013 | ||||||||||
Operating income | $ | 323,168 | $ | 328,569 | $ | (5,401 | ) | ||||
Share-based compensation | 4,770 | 4,579 | 191 | ||||||||
Depreciation and amortization | 15,559 | 16,358 | (799 | ) | |||||||
AOCF | $ | 343,497 | $ | 349,506 | $ | (6,009 | ) | ||||
Revenues
Revenues for the year ended June 30, 2014 increased $36,781, or 5%, to $714,514 as compared to the prior year. The net increase is attributable to the following:
Increase in affiliation fee revenue | $ | 47,293 | |
Increase in advertising revenue | 2,947 | ||
Other net decreases | (13,459 | ) | |
$ | 36,781 | ||
The increase in affiliation fee revenue was primarily attributable to higher affiliation rates and, to a lesser extent, the return to a full NHL regular season schedule partially offset by the impact of a small decrease in MSG Networks subscribers versus the prior year. The Company believes the decrease in subscribers is due to a small migration of subscribers to lower-priced distributor tiers that do not include MSG Networks.
51
The increase in advertising revenue was primarily due to higher revenues generated from the telecast of NHL games (largely due to the return to a full NHL regular season schedule) partially offset by lower Knicks-related advertising revenues (including the absence of the playoffs in the current year) and, to a lesser extent, lower Fuse advertising revenues.
Other net decreases primarily reflect revenues recognized in the prior year related to a short-term programming licensing agreement, which expired in April 2013 and, as expected, was not renewed.
See “— Comparison of the Year Ended June 30, 2014 versus the Year Ended June 30, 2013 — Consolidated Results of Operations” for a discussion of the NHL work stoppage during the 2012-13 season.
Direct operating expenses
Direct operating expenses for the year ended June 30, 2014 increased $40,769, or 19%, to $259,434 as compared to the prior year primarily due to higher programming acquisition costs (rights fees) and other programming costs due to the return to a full NHL regular season schedule. Programming acquisition costs include rights fees from the licensing of team related programming to MSG Media from the MSG Sports segment.
Selling, general and administrative expenses
Selling, general and administrative expenses for the year ended June 30, 2014 increased $2,212, or 2%, to $116,353 as compared to the prior year primarily due to higher allocated corporate general and administrative costs and employee compensation and related benefits partially offset by decreases in other expenses, including professional fees and marketing costs.
Depreciation and amortization
Depreciation and amortization for the year ended June 30, 2014 decreased $799, or 5%, to $15,559 as compared to the prior year primarily driven by lower amortization of intangible assets resulting from certain intangible assets becoming fully amortized during fiscal year 2013.
AOCF
AOCF for the year ended June 30, 2014 decreased $6,009, or 2%, to $343,497 as compared to the prior year primarily driven by an increase in direct operating expenses and, to a lesser extent, higher selling, general and administrative expenses, largely offset by an increase in revenues as discussed above.
See “— Comparison of the Year Ended June 30, 2014 versus the Year Ended June 30, 2013 — Consolidated Results of Operations” for a discussion of the NHL work stoppage during the 2012-13 season.
With respect to fiscal year 2015, year-over-year comparisons will be impacted by the sale of Fuse, with MSG Media results on a go-forward basis solely reflecting the results of MSG Networks. Fuse generated meaningful revenues in fiscal 2014 but did not have a material impact on MSG Media or total Company AOCF. In terms of MSG Networks, the Company expects continued revenue and AOCF growth, led by increases in affiliation fee revenue.
MSG Entertainment
The table below sets forth, for the periods presented, certain historical financial information and the percentage that those items bear to revenues for the Company's MSG Entertainment segment.
Years Ended June 30, | Decrease (Increase) in Operating Loss | ||||||||||||||||
2014 | 2013 | ||||||||||||||||
Amount | % of Revenues | Amount | % of Revenues | ||||||||||||||
Revenues | $ | 300,998 | 100 | % | $ | 252,195 | 100 | % | $ | 48,803 | |||||||
Direct operating expenses | 232,297 | 77 | % | 199,458 | 79 | % | (32,839 | ) | |||||||||
Selling, general and administrative expenses | 78,551 | 26 | % | 67,947 | 27 | % | (10,604 | ) | |||||||||
Depreciation and amortization | 9,900 | 3 | % | 9,522 | 4 | % | (378 | ) | |||||||||
Operating loss | $ | (19,750 | ) | (7 | )% | $ | (24,732 | ) | (10 | )% | $ | 4,982 | |||||
52
The following is a reconciliation of operating loss to AOCF:
Years Ended June 30, | Increase (Decrease) in AOCF | ||||||||||
2014 | 2013 | ||||||||||
Operating loss | $ | (19,750 | ) | $ | (24,732 | ) | $ | 4,982 | |||
Share-based compensation | 5,566 | 5,005 | 561 | ||||||||
Depreciation and amortization | 9,900 | 9,522 | 378 | ||||||||
AOCF | $ | (4,284 | ) | $ | (10,205 | ) | $ | 5,921 | |||
Revenues
Revenues for the year ended June 30, 2014 increased $48,803, or 19%, to $300,998 as compared to the prior year. The net increase is attributable to the following:
Increase in event-related revenues at The Garden | $ | 15,679 | |
Increase in event-related revenues at the Forum which re-opened in January 2014 | 10,405 | ||
Increase in event-related revenues at The Theater at Madison Square Garden | 8,326 | ||
Increase in venue-related sponsorship and signage and suite rental fee revenues | 7,451 | ||
Increase in revenues from the presentation of the Radio City Christmas Spectacular franchise | 6,425 | ||
Increase in event-related revenues at The Chicago Theatre | 2,748 | ||
Decrease in event-related revenues at Radio City Music Hall, excluding Radio City Christmas Spectacular | (5,158 | ) | |
Other net increases | 2,927 | ||
$ | 48,803 | ||
The increase in event-related revenues at The Garden was primarily due to the change in the mix of events including additional MSG Entertainment promoted events, as well as the overall increase in the number of events held at the venue during the year ended June 30, 2014 as compared to the prior year.
The increase in event-related revenues at The Theater at Madison Square Garden was primarily due to the increase in the number of events held at the venue during the year ended June 30, 2014 as compared to the prior year.
The increase in venue-related sponsorship and signage and suite rental fee revenues was primarily due to higher suite rental fee revenue as a result of new suite products which were unavailable for portions of the prior year combined with the impact of expanded inventory and new sponsor relationships as a result of the Transformation of The Garden and the re-opening of the Forum. These increases were partially offset by the planned reduction in certain suite products due to the Transformation and the impact of the off-season shutdowns.
The increase in revenues from the presentation of the Radio City Christmas Spectacular franchise was primarily due to higher attendance at the Radio City Music Hall production of the show and an increase in both average ticket price and attendance at the theatrical productions presented outside of New York. These increases were partially offset by a lower average ticket price at the Radio City Music Hall production. The Radio City Music Hall production of the show in the prior year was negatively impacted by Superstorm Sandy. During the 2013 holiday season more than one million tickets were sold for the Radio City Music Hall production, which represents a mid-single digit percentage increase as compared to the prior year.
The increase in event-related revenues at The Chicago Theatre was primarily due to the increase in the number of events held at the venue during the year ended June 30, 2014 as compared to the prior year.
The decrease in event-related revenues at Radio City Music Hall, excluding Radio City Christmas Spectacular, was primarily driven by the impact of the venue being utilized during the majority of the third quarter of the current year for the load-in and rehearsals of the Company's new large-scale theatrical production designed for Radio City Music Hall (the debut of which has been postponed from its original planned date of March 27, 2014 until the Spring of 2015). To a lesser extent this decrease also reflects the net impact from the absence of Cirque du Soleil's Zarkana which was presented at the venue during the prior year largely offset by the impact associated with NBC's America's Got Talent which was broadcast live from the venue during the current year.
53
Direct operating expenses
Direct operating expenses for the year ended June 30, 2014 increased $32,839, or 16%, to $232,297 as compared to the prior year. The net increase is attributable to the following:
Increase in event-related direct operating expenses at The Garden | $ | 12,466 | |
Increase in direct operating expenses associated with the Company's new large-scale theatrical production designed for Radio City Music Hall which was postponed until the Spring of 2015 | 8,568 | ||
Increase in event-related direct operating expenses at the Forum | 6,679 | ||
Increase in event-related direct operating expenses at The Theater at Madison Square Garden | 3,805 | ||
Increase in venue operating costs | 2,100 | ||
Increase in event-related direct operating expenses at The Chicago Theatre | 1,653 | ||
Decrease in direct operating expenses associated with the presentation of the Radio City Christmas Spectacular franchise | (3,144 | ) | |
Decrease in event-related direct operating expenses at Radio City Music Hall, excluding Radio City Christmas Spectacular | (2,096 | ) | |
Other net increases | 2,808 | ||
$ | 32,839 | ||
The decrease in direct operating expenses associated with the presentation of the Radio City Christmas Spectacular franchise was primarily due to the absence of a pre-tax impairment charge of $4,982 which was recorded during the prior year related to a theatrical production of the show presented outside of New York. This decline was partially offset by a write-off of deferred production costs of approximately $2,200 recorded during the current year related to the planned replacement of certain elements of a scene in the Radio City Music Hall production of the show.
Selling, general and administrative expenses
Selling, general and administrative expenses for the year ended June 30, 2014 increased $10,604, or 16%, to $78,551 as compared to the prior year primarily due to higher employee compensation and related benefits, including separation-related costs, and, to a lesser extent, increased costs associated with the re-opening of the Forum and the debut of the fully transformed Madison Square Garden Arena.
AOCF
AOCF loss improved for the year ended June 30, 2014 by $5,921, or 58%, to a loss of $4,284 as compared to the prior year primarily attributable to an increase in revenues which were largely offset by an increase in direct operating expenses and, to a lesser extent, higher selling, general and administrative expenses, as discussed above.
With respect to fiscal year 2015, the Company expects MSG Entertainment to benefit from The Garden, The Theater at Madison Square Garden and the Forum all being available for events for the full fiscal year, and to also reflect the results of the Company's new large-scale theatrical production at Radio City Music Hall.
MSG Sports
The table below sets forth, for the periods presented, certain historical financial information and the percentage that those items bear to revenues for the Company's MSG Sports segment.
Years Ended June 30, | Increase (Decrease) in Operating Income | ||||||||||||||||
2014 | 2013 | ||||||||||||||||
Amount | % of Revenues | Amount | % of Revenues | ||||||||||||||
Revenues | $ | 612,071 | 100 | % | $ | 470,290 | 100 | % | $ | 141,781 | |||||||
Direct operating expenses | 480,191 | 78 | % | 332,398 | 71 | % | (147,793 | ) | |||||||||
Selling, general and administrative expenses | 133,118 | 22 | % | 113,967 | 24 | % | (19,151 | ) | |||||||||
Depreciation and amortization | 12,225 | 2 | % | 10,451 | 2 | % | (1,774 | ) | |||||||||
Operating income (loss) | $ | (13,463 | ) | 2 | % | $ | 13,474 | 3 | % | $ | (26,937 | ) | |||||
54
The following is a reconciliation of operating income (loss) to AOCF:
Years Ended June 30, | Increase (Decrease) in AOCF | ||||||||||
2014 | 2013 | ||||||||||
Operating income (loss) | $ | (13,463 | ) | $ | 13,474 | $ | (26,937 | ) | |||
Share-based compensation | 4,813 | 3,089 | 1,724 | ||||||||
Depreciation and amortization | 12,225 | 10,451 | 1,774 | ||||||||
AOCF | $ | 3,575 | $ | 27,014 | $ | (23,439 | ) | ||||
Revenues
Revenues for the year ended June 30, 2014 increased $141,781, or 30%, to $612,071 as compared to the prior year. The net increase is attributable to the following:
Increase in professional sports teams’ pre/regular season ticket-related revenue | $ | 56,634 | |
Increase in suite rental fee revenue | 18,554 | ||
Increase in broadcast rights fees from MSG Media | 13,043 | ||
Increase in event-related revenues from other live sporting events | 12,566 | ||
Increase in professional sports teams' sponsorship and signage revenues | 12,519 | ||
Increase in professional sports teams' pre/regular season food, beverage and merchandise sales | 10,306 | ||
Increase in revenues from league distributions | 9,182 | ||
Increase in professional sports teams' playoff related revenues | 7,254 | ||
Other net increases | 1,723 | ||
$ | 141,781 | ||
The increase in professional sports teams' pre/regular season ticket-related revenue was primarily driven by the return to a full Rangers regular season schedule as well as higher average per-game revenue for all of the Company's professional sports teams, inclusive of the impact of the return to pre-Transformation seating capacity.
The increase in suite rental fee revenue was primarily due to the impact of new suite products which were unavailable for portions of the prior year and, to a lesser extent, the return to a full Rangers regular season schedule partially offset by the planned reduction in certain suite products due to the Transformation and the impact of the off-season shutdowns.
The increase in broadcast rights fees from MSG Media was primarily due to the return to a full Rangers regular season schedule.
The increase in event-related revenues from other live sporting events was primarily due to a change in the mix of events, as well as more events during the year ended June 30, 2014 as compared to the prior year. Event-related revenues from other live sporting events include ticket-related revenues, venue license fees we charge to promoters for the use of our venues, single night suite rental fees, and food, beverage and merchandise sales.
The increase in professional sports teams' sponsorship and signage revenues primarily reflects expanded inventory and new sponsor relationships as a result of the Transformation and the return to a full Rangers regular season schedule.
The increase in professional sports teams' pre/regular season food, beverage and merchandise sales was primarily due to the return to a full Rangers regular season schedule.
The increase in revenues from league distributions was primarily due to the return to a full NHL regular season schedule and, to a lesser extent, other league related increases.
The increase in professional sports teams' playoff related revenues was primarily due to seven additional Rangers home games, as the team advanced to the Stanley Cup Finals in the current year partially offset by the impact of the Knicks not making the playoffs in the current year versus playing six home games in the prior year.
See “— Comparison of the Year Ended June 30, 2014 versus the Year Ended June 30, 2013 — Consolidated Results of Operations” for a discussion of the NHL work stoppage during the 2012-13 season.
55
Direct operating expenses
Direct operating expenses for the year ended June 30, 2014 increased $147,793, or 44%, to $480,191 as compared to the prior year. The net increase is attributable to the following:
Increase in team personnel compensation | $ | 43,065 | |
Increase in net provisions for certain team personnel transactions (including the impact of NBA luxury tax) | 34,953 | ||
Increase in net provisions for NBA luxury tax (excluding the impact of team personnel transactions) and NBA and NHL revenue sharing expense (excluding playoffs) | 32,672 | ||
Increase in other team operating expenses | 23,676 | ||
Increase in event-related expenses associated with other live sporting events | 5,914 | ||
Increase in professional sports teams' pre/regular season expense associated with food, beverage and merchandise sales | 4,895 | ||
Decrease in professional sports teams' playoff related expenses | (1,250 | ) | |
Other net increases | 3,868 | ||
$ | 147,793 | ||
The increase in team personnel compensation was primarily due to the return to a full Rangers regular season schedule and overall salary increases, inclusive of the impact of roster changes at the Company's sports teams.
Net provisions for certain team personnel transactions (including the impact of NBA luxury tax) and for NBA luxury tax (excluding the impact of team personnel transactions) and NBA and NHL revenue sharing expense (excluding playoffs) were as follows:
Years Ended June 30, | Increase | ||||||||||
2014 | 2013 | ||||||||||
Net provisions for certain team personnel transactions (including the impact of NBA luxury tax) | $ | 53,394 | $ | 18,441 | $ | 34,953 | |||||
Net provisions for NBA luxury tax (excluding the impact of team personnel transactions) and NBA and NHL revenue sharing expense (excluding playoffs) | 53,510 | 20,838 | 32,672 | ||||||||
Team personnel transactions for the year ended June 30, 2014 reflect provisions recorded for player waivers/contract terminations and season-ending player injuries of $41,276 and $6,978, respectively, and player trades of $5,140. Team personnel transactions for the year ended June 30, 2013 reflect provisions recorded for player waivers/contract terminations and season-ending player injuries of $10,434 and $7,159, respectively, and player trades of $848.
The increase in net provisions for NBA luxury tax (excluding the impact of team personnel transactions) and NBA and NHL revenue sharing expense (excluding playoffs) reflects higher NBA luxury tax of $22,147 and higher net provisions for both NBA and NHL revenue sharing expense of $10,525. The increase in provisions for NBA luxury tax for the year ended June 30, 2014 was primarily due to the change in the luxury tax rate structure beginning with the 2013-14 season and, to a lesser extent, higher aggregate player salaries. The increase in net provisions for NBA and NHL revenue sharing expense (excluding playoffs) was primarily attributable to higher estimated NBA revenue sharing expense for the 2013-2014 season and, to a lesser extent, higher estimated NHL revenue sharing expense due to the return to a full Rangers regular season schedule which was partially offset by the impact of final assessments of prior seasons' revenue sharing expense recorded in the current year. The actual amounts for net provisions for NBA and NHL revenue sharing expense for the 2013-14 season may vary significantly from the recorded provisions based on actual operating results for each league and all teams within each league for the season and other factors.
The increase in other team operating expenses was primarily due to higher professional fees, the return to a full Rangers regular season schedule and, to a lesser extent, the absence of a league expense recoupment which was recorded during the prior year.
The decrease in professional sports teams’ playoff related expenses was primarily due to the impact of the Knicks not making the playoffs in the current year versus playing six home games in the prior year largely offset by the impact of seven additional Rangers home games in the current year as compared to the prior year.
56
Selling, general and administrative expenses
Selling, general and administrative expenses for the year ended June 30, 2014 increased $19,151, or 17%, to $133,118, as compared to the prior year. The increase was primarily driven by higher employee compensation and related benefits, increased marketing costs (primarily related to the impact of the playoffs), and higher allocated corporate general and administrative costs.
Depreciation and amortization
Depreciation and amortization for the year ended June 30, 2014 increased $1,774, or 17%, to $12,225, as compared to the prior year primarily driven by depreciation that was accelerated due to a change in the anticipated planned use of assets utilized by certain of the Company’s professional sports teams.
AOCF
AOCF for the year ended June 30, 2014 decreased $23,439, or 87%, to $3,575, as compared to the prior year primarily driven by an increase in direct operating expenses and, to a lesser extent, higher selling, general and administrative expenses, largely offset by an increase in revenues as discussed above.
See “— Comparison of the Year Ended June 30, 2014 versus the Year Ended June 30, 2013 — Consolidated Results of Operations” for a discussion of the NHL work stoppage during the 2012-13 season.
With respect to fiscal year 2015, as the Transformation is complete and The Garden is open year-round for events, it will host a full slate of Knicks and Rangers preseason home games this year. The Company also expects MSG Sports to benefit from continued growth in other key revenue categories such as suite rental fee revenue and sponsorship and signage revenues. In addition, MSG Sports benefited in fiscal 2014 from hosting a large-scale other live sporting event which is not returning in fiscal 2015 as the event rotates sites each year.
Comparison of the Year Ended June 30, 2013 versus the Year Ended June 30, 2012
Consolidated Results of Operations
The table below sets forth, for the periods presented, certain historical financial information and the percentage that those items bear to revenues.
STATEMENT OF OPERATIONS DATA
Years Ended June 30, | Increase (Decrease) in Net Income | ||||||||||||||||
2013 | 2012 | ||||||||||||||||
Amount | % of Revenues | Amount | % of Revenues | ||||||||||||||
Revenues | $ | 1,340,818 | 100 | % | $ | 1,284,016 | 100 | % | $ | 56,802 | |||||||
Operating expenses: | |||||||||||||||||
Direct operating | 691,029 | 52 | % | 714,362 | 56 | % | 23,333 | ||||||||||
Selling, general and administrative | 309,568 | 23 | % | 304,624 | 24 | % | (4,944 | ) | |||||||||
Depreciation and amortization (including impairments) | 89,132 | 7 | % | 87,503 | 7 | % | (1,629 | ) | |||||||||
Operating income | 251,089 | 19 | % | 177,527 | 14 | % | 73,562 | ||||||||||
Other income (expense): | |||||||||||||||||
Interest expense, net | (5,722 | ) | NM | (4,752 | ) | NM | (970 | ) | |||||||||
Miscellaneous | 3,497 | NM | 7,072 | 1 | % | (3,575 | ) | ||||||||||
Income from operations before income taxes | 248,864 | 19 | % | 179,847 | 14 | % | 69,017 | ||||||||||
Income tax expense | (106,482 | ) | (8 | )% | (73,302 | ) | (6 | )% | (33,180 | ) | |||||||
Net income | $ | 142,382 | 11 | % | $ | 106,545 | 8 | % | $ | 35,837 | |||||||
________________________________
NM – Percentage is not meaningful
57
The NHL CBA expired on September 15, 2012, and effective September 16, 2012, the NHL declared a lockout of NHL players. The delay in reaching an agreement with the NHLPA on the terms of a new CBA delayed the start of the 2012-13 NHL regular season by approximately three months until January 19, 2013. In addition to the delayed start, the resolution of the NHL work stoppage resulted in the 2012-13 regular season being shortened by 34 games, or approximately 41%, to a 48 game season.
As a result, the Rangers (as well as other NHL teams whose games are telecast on MSG Networks) played fewer regular season home and away games during the year ended June 30, 2013 as compared to the comparable period of the prior year. During fiscal year 2013, the Rangers played 48 regular season games, of which 24 were home games and 24 were away games, as compared to 82 regular season games in the prior year, of which 41 were home games and 41 were away games. While the NHL work stoppage and the waiver of a Rangers player which was allowed under the terms of the new NHL CBA, together, negatively impacted the Company's and the MSG Sports and MSG Media segments' revenues and the Company's and MSG Sports segment's AOCF, a non-GAAP measure, and operating income during fiscal year 2013, the NHL work stoppage contributed to an increase in AOCF and operating income in the MSG Media segment as compared to the prior year.
In addition, the comparability of the results of operations of the Company and the MSG Media and MSG Sports segments for the year ended June 30, 2013 as compared to the prior year was impacted by last year's NBA work stoppage, which resulted in a shortened 66-game 2011-12 regular season. As a result, the Knicks played more regular season home and away games during fiscal year 2013 as compared to the prior year. During fiscal year 2013, the Knicks played 82 regular season games, of which 41 were home games and 41 were away games, as compared to 66 regular season games in the prior year, of which 33 were home games and 33 were away games.
Revenues
Revenues for the year ended June 30, 2013 increased $56,802, or 4%, to $1,340,818 as compared to the prior year. The net increase is attributable to the following:
Increase in MSG Media segment revenues | $ | 63,565 | |
Decrease in MSG Entertainment segment revenues | (11,781 | ) | |
Increase in MSG Sports segment revenues | 5,564 | ||
Increase in other revenues | 293 | ||
Inter-segment eliminations | (839 | ) | |
$ | 56,802 | ||
See above for a discussion of the NHL work stoppage during the 2012-13 season and the NBA work stoppage during the 2011-12 season.
Direct operating expenses
Direct operating expenses for the year ended June 30, 2013 decreased $23,333, or 3%, to $691,029 as compared to the prior year. The net decrease is attributable to the following:
Decrease in MSG Media segment expenses | $ | (26,016 | ) |
Increase in MSG Entertainment segment expenses | 809 | ||
Increase in MSG Sports segment expenses | 2,767 | ||
Increase in other expenses | 4 | ||
Inter-segment eliminations | (897 | ) | |
$ | (23,333 | ) | |
58
Selling, general and administrative expenses
Selling, general and administrative expenses for the year ended June 30, 2013 increased $4,944, or 2%, to $309,568 as compared to the prior year. The net increase is attributable to the following:
Decrease in MSG Media segment expenses | $ | (2,384 | ) |
Increase in MSG Entertainment segment expenses | 2,971 | ||
Increase in MSG Sports segment expenses | 2,944 | ||
Increase in other expenses | 1,355 | ||
Inter-segment eliminations | 58 | ||
$ | 4,944 | ||
The increase in other expenses was primarily driven by higher charitable contributions.
Depreciation and amortization (including impairments)
Depreciation and amortization (including impairments) for the year ended June 30, 2013 increased $1,629, or 2%, to $89,132 as compared to the prior year due to higher depreciation and amortization expense on property and equipment significantly offset by lower amortization of intangible assets. The increase in depreciation and amortization expense on property and equipment was primarily due to the ongoing Transformation, which resulted in higher depreciation expense on property and equipment placed into service partially offset by lower depreciation expense of capitalized costs associated with asset retirement obligations (see Note 9 to the consolidated financial statements included in Item 8 of this Annual Report on Form 10-K). The decrease in amortization of intangible assets was due to lower amortization resulting from certain intangible assets becoming fully amortized and the absence of an impairment charge of $3,112 which was recorded during the year ended June 30, 2012 to write-off the remaining carrying value of certain intangible assets (see Note 5 to the consolidated financial statements included in Item 8 of this Annual Report on Form 10-K).
Miscellaneous income
Miscellaneous income for the year ended June 30, 2013 includes a pre-tax gain of approximately $3,100 from the sale of all of the Company's holdings of Live Nation common stock (see Note 15 to the consolidated financial statements included in Item 8 of this Annual Report on Form 10-K). Miscellaneous income for the year ended June 30, 2012 reflects approximately $7,000 related to the recovery of certain claims in connection with a third party bankruptcy proceeding.
Income taxes
Income tax expense for the year ended June 30, 2013 was $106,482. The effective tax rate of 42.8% differs from the statutory federal rate of 35% due principally to state and local income taxes, nondeductible expenses and an increase in federal income tax expense recorded in connection with the filing of the Company's 2011 income tax returns, reflecting a lower domestic production activity deduction, offset by the tax benefit resulting from the domestic production activities deduction in the current fiscal year.
Income tax expense for the year ended June 30, 2012 was $73,302. The effective tax rate of 40.8% differs from the statutory federal rate of 35% due to state income taxes and, to a lesser extent, the impact of nondeductible expenses partially offset by the impact of lower state tax rates on deferred tax liabilities, the reduction in the state income tax expense recorded in connection with the filing of the Company's 2010 income tax returns and the tax benefit resulting from the domestic production activities deduction.
AOCF
The following is a reconciliation of operating income to AOCF:
Years Ended June 30, | Increase (Decrease) in AOCF | ||||||||||
2013 | 2012 | ||||||||||
Operating income | $ | 251,089 | $ | 177,527 | $ | 73,562 | |||||
Share-based compensation | 15,340 | 18,205 | (2,865 | ) | |||||||
Depreciation and amortization (including impairments) | 89,132 | 87,503 | 1,629 | ||||||||
AOCF | $ | 355,561 | $ | 283,235 | $ | 72,326 | |||||
59
AOCF for the year ended June 30, 2013 increased $72,326, or 26%, to $355,561 as compared to the prior year. The net increase is attributable to the following:
Increase in AOCF of the MSG Media segment | $ | 90,907 | |
Decrease in AOCF of the MSG Entertainment segment | (15,500 | ) | |
Decrease in AOCF of the MSG Sports segment | (1,703 | ) | |
Other net decreases | (1,378 | ) | |
$ | 72,326 | ||
Other net decreases were primarily driven by higher charitable contributions.
See above for a discussion of the NHL work stoppage during the 2012-13 season and the NBA work stoppage during the 2011-12 season.
Business Segment Results
MSG Media
The table below sets forth, for the periods presented, certain historical financial information and the percentage that those items bear to revenues for the Company's MSG Media segment.
Years Ended June 30, | Increase in Operating Income | ||||||||||||||||
2013 | 2012 | ||||||||||||||||
Amount | % of Revenues | Amount | % of Revenues | ||||||||||||||
Revenues | $ | 677,733 | 100 | % | $ | 614,168 | 100 | % | $ | 63,565 | |||||||
Direct operating expenses | 218,665 | 32 | % | 244,681 | 40 | % | 26,016 | ||||||||||
Selling, general and administrative expenses | 114,141 | 17 | % | 116,525 | 19 | % | 2,384 | ||||||||||
Depreciation and amortization(including impairments) | 16,358 | 2 | % | 24,616 | 4 | % | 8,258 | ||||||||||
Operating income | $ | 328,569 | 48 | % | $ | 228,346 | 37 | % | $ | 100,223 | |||||||
The following is a reconciliation of operating income to AOCF:
Years Ended June 30, | Increase (Decrease) in AOCF | ||||||||||
2013 | 2012 | ||||||||||
Operating income | $ | 328,569 | $ | 228,346 | $ | 100,223 | |||||
Share-based compensation | 4,579 | 5,637 | (1,058 | ) | |||||||
Depreciation and amortization (including impairments) | 16,358 | 24,616 | (8,258 | ) | |||||||
AOCF | $ | 349,506 | $ | 258,599 | $ | 90,907 | |||||
Revenues
Revenues for the year ended June 30, 2013 increased $63,565, or 10%, to $677,733 as compared to the prior year. The net increase is attributable to the following:
Increase in affiliation fee revenue | $ | 46,041 | |
Increase in advertising revenue | 12,388 | ||
Other net increases | 5,136 | ||
$ | 63,565 | ||
The increase in affiliation fee revenue was primarily due to higher affiliation rates and, to a lesser extent, the impact of MSG Networks being carried by Time Warner Cable (“TWC”) for the entire fiscal year 2013 versus not being carried from January 1st through February 16th of fiscal year 2012, with the overall increase being partially offset by the net impact of recorded
60
provisions, principally related to the NHL work stoppage, and the impact of revenue recognized in fiscal year 2012 related to TWC's carriage of Fuse during calendar 2011 in connection with the TWC carriage agreement entered into in February 2012.
The increase in advertising revenue was primarily driven by higher advertising sales at both MSG Networks and Fuse. The increase at MSG Networks reflects higher Knicks per-game advertising revenue and more NBA telecasts as the Knicks returned to a full regular season schedule partially offset by the fewer NHL telecasts as a result of the NHL work stoppage.
Other net increases were primarily due to a short-term programming licensing agreement entered into during the third quarter of fiscal year 2012 for which revenue was recognized until the agreement expired in April 2013 and was not renewed.
See “— Comparison of the Year Ended June 30, 2013 versus the Year Ended June 30, 2012 — Consolidated Results of Operations” for a discussion of the NHL work stoppage during the 2012-13 season and the NBA work stoppage during the 2011-12 season.
Direct operating expenses
Direct operating expenses for the year ended June 30, 2013 decreased $26,016, or 11%, to $218,665 as compared to the prior year primarily driven by a decrease in programming acquisition costs (rights fees) and other programming costs due to the NHL work stoppage partially offset by the Knicks' return to a full regular season schedule. Programming acquisition costs include rights fees from the licensing of team related programming to MSG Media from the MSG Sports segment.
Selling, general and administrative expenses
Selling, general and administrative expenses for the year ended June 30, 2013 decreased $2,384, or 2%, to $114,141 as compared to the prior year primarily due to a decrease in marketing costs and lower employee compensation and related benefits partially offset by an increase in allocated corporate general and administrative costs. The decrease in marketing costs was primarily driven by the absence of certain marketing expenses related to an affiliate dispute which were incurred during the prior year period partially offset by higher marketing of programming initiatives.
Depreciation and amortization (including impairments)
Depreciation and amortization (including impairments) for the year ended June 30, 2013 decreased $8,258, or 34%, to $16,358 as compared to the prior year primarily due to lower amortization of intangible assets resulting from certain intangible assets becoming fully amortized and the absence of an impairment charge of $3,112 recorded during fiscal year 2012 to write-off the remaining carrying value of certain intangible assets (see Note 5 to the consolidated financial statements included in Item 8 of this Annual Report on Form 10-K.
AOCF
AOCF for the year ended June 30, 2013 increased $90,907, or 35%, to $349,506 as compared to the prior year primarily driven by an increase in revenues and lower direct operating expenses, as discussed above.
See “— Comparison of the Year Ended June 30, 2013 versus the Year Ended June 30, 2012 — Consolidated Results of Operations” for a discussion of the NHL work stoppage during the 2012-13 season and the NBA work stoppage during the 2011-12 season.
MSG Entertainment
The table below sets forth, for the periods presented, certain historical financial information and the percentage that those items bear to revenues for the Company's MSG Entertainment segment.
Years Ended June 30, | (Increase) Decrease in Operating Loss | ||||||||||||||||
2013 | 2012 | ||||||||||||||||
Amount | % of Revenues | Amount | % of Revenues | ||||||||||||||
Revenues | $ | 252,195 | 100 | % | $ | 263,976 | 100 | % | $ | (11,781 | ) | ||||||
Direct operating expenses | 199,458 | 79 | % | 198,649 | 75 | % | (809 | ) | |||||||||
Selling, general and administrative expenses | 67,947 | 27 | % | 64,976 | 25 | % | (2,971 | ) | |||||||||
Depreciation and amortization | 9,522 | 4 | % | 9,653 | 4 | % | 131 | ||||||||||
Operating loss | $ | (24,732 | ) | (10 | )% | $ | (9,302 | ) | (4 | )% | $ | (15,430 | ) | ||||
61
The following is a reconciliation of operating loss to AOCF:
Years Ended June 30, | Increase (Decrease) in AOCF | ||||||||||
2013 | 2012 | ||||||||||
Operating loss | $ | (24,732 | ) | $ | (9,302 | ) | $ | (15,430 | ) | ||
Share-based compensation | 5,005 | 4,944 | 61 | ||||||||
Depreciation and amortization | 9,522 | 9,653 | (131 | ) | |||||||
AOCF | $ | (10,205 | ) | $ | 5,295 | $ | (15,500 | ) | |||
Revenues
Revenues for the year ended June 30, 2013 decreased $11,781, or 4%, to $252,195 as compared to the prior year. The net decrease is attributable to the following:
Decrease in event-related revenues at Radio City Music Hall, excluding Radio City Christmas Spectacular | $ | (13,710 | ) |
Decrease in revenues from the presentation of the Radio City Christmas Spectacular franchise | (5,815 | ) | |
Decrease in event-related revenues at the Beacon Theatre | (2,883 | ) | |
Decrease in event-related revenues at The Garden | (1,808 | ) | |
Decrease in event-related revenues at The Chicago Theatre | (1,216 | ) | |
Increase in event-related revenues at The Theater at Madison Square Garden | 6,474 | ||
Increase in venue-related sponsorship and signage and suite rental fee revenues | 5,937 | ||
Other net increases | 1,240 | ||
$ | (11,781 | ) | |
The decrease in event-related revenues at Radio City Music Hall, excluding Radio City Christmas Spectacular, was primarily due to fewer scheduled performances of Cirque du Soleil's Zarkana partially offset by an increase in revenues associated with other events.
The decrease in revenues from the presentation of the Radio City Christmas Spectacular franchise, which reflects the Radio City Music Hall production of the show as well as the theatrical productions presented outside of New York, was primarily due to lower attendance partially offset by a higher average ticket price at the Radio City Music Hall. The Radio City Music Hall production of the show was significantly impacted by Superstorm Sandy, which occurred in late October 2012, about ten days prior to the start of the show's run. Nearly one million tickets were sold for the Radio City Music Hall production during the 2012 holiday season as compared to nearly one million one hundred thousand tickets during the 2011 holiday season.
The decrease in event-related revenues at the Beacon Theatre was primarily driven by the decrease in the number of events held at the venue during the year ended June 30, 2013 as compared to the prior year.
The decrease in event-related revenues at The Garden was primarily driven by a change in the mix of events held at the venue during the year ended June 30, 2013 as compared to the prior year.
The decrease in event-related revenues at The Chicago Theatre was primarily driven by the decrease in the number of events held at the venue during the year ended June 30, 2013 as compared to the prior year.
The increase in event-related revenues at The Theater at Madison Square Garden was primarily due to the increase in the number of events held at the venue during the year ended June 30, 2013 as compared to the prior year.
The increase in venue-related sponsorship and signage and suite rental fee revenues primarily reflects higher suite rental fee revenue as a result of new suite/club products which have come online combined with the impact of more sponsor relationships partially offset by the impact of the planned reduction in certain suite products as a result of the Transformation.
62
Direct operating expenses
Direct operating expenses for the year ended June 30, 2013 increased $809, less than 1%, to $199,458 as compared to the prior year. The net increase is attributable to the following:
Decrease in event-related direct operating expenses at Radio City Music Hall, excluding Radio City Christmas Spectacular | $ | (8,902 | ) |
Decrease in event-related direct operating expenses at The Garden | (1,994 | ) | |
Decrease in event-related direct operating expenses at the Beacon Theatre | (1,066 | ) | |
Decrease in event-related direct operating expenses at The Chicago Theatre | (734 | ) | |
Increase in venue operating costs, primarily associated with the Forum (which the Company acquired in June 2012) and Radio City Music Hall | 4,629 | ||
Increase in event-related direct operating expenses at The Theater at Madison Square Garden | 4,291 | ||
Increase in direct operating expenses associated with the presentation of the Radio City Christmas Spectacular franchise | 1,304 | ||
Other net increases, including higher costs associated with MSG Entertainment business development initiatives | 3,281 | ||
$ | 809 | ||
The increase in direct operating expenses associated with the presentation of the Radio City Christmas Spectacular franchise was primarily due to a pre-tax impairment charge of $4,982 recorded during the year ended June 30, 2013 related to a theatrical production of the show that played in three markets outside of New York during the 2012 holiday season. As a result of the financial performance of these markets, the Company recorded a pre-tax impairment charge for the remaining unamortized deferred costs of assets related to this theatrical production outside of New York. The impact of the impairment charge was largely offset by a decrease in direct operating expenses associated with the Radio City Music Hall production and the theatrical production of the show outside of New York.
Selling, general and administrative expenses
Selling, general and administrative expenses for the year ended June 30, 2013 increased $2,971, or 5%, to $67,947 as compared to the prior year primarily due to an increase in employee compensation and related benefits, which includes costs associated with MSG Entertainment business development initiatives.
AOCF
AOCF for the year ended June 30, 2013 decreased by $15,500, or 293%, to a loss of $10,205 as compared to the prior year primarily attributable to a decrease in revenues and higher selling, general and administrative expenses and direct operating expenses, as discussed above.
MSG Sports
The table below sets forth, for the periods presented, certain historical financial information and the percentage that those items bear to revenues for the Company's MSG Sports segment.
Years Ended June 30, | Increase (Decrease) in Operating Income | ||||||||||||||||
2013 | 2012 | ||||||||||||||||
Amount | % of Revenues | Amount | % of Revenues | ||||||||||||||
Revenues | $ | 470,290 | 100 | % | $ | 464,726 | 100 | % | $ | 5,564 | |||||||
Direct operating expenses | 332,398 | 71 | % | 329,631 | 71 | % | (2,767 | ) | |||||||||
Selling, general and administrative expenses | 113,967 | 24 | % | 111,023 | 24 | % | (2,944 | ) | |||||||||
Depreciation and amortization | 10,451 | 2 | % | 11,003 | 2 | % | 552 | ||||||||||
Operating income | $ | 13,474 | 3 | % | $ | 13,069 | 3 | % | $ | 405 | |||||||
63
The following is a reconciliation of operating income to AOCF:
Years Ended June 30, | Increase (Decrease) in AOCF | ||||||||||
2013 | 2012 | ||||||||||
Operating income | $ | 13,474 | $ | 13,069 | $ | 405 | |||||
Share-based compensation | 3,089 | 4,645 | (1,556 | ) | |||||||
Depreciation and amortization | 10,451 | 11,003 | (552 | ) | |||||||
AOCF | $ | 27,014 | $ | 28,717 | $ | (1,703 | ) | ||||
Revenues
Revenues for the year ended June 30, 2013 increased $5,564, or 1%, to $470,290 as compared to the prior year. The net increase is attributable to the following:
Increase in suite rental fee revenue | $ | 14,591 | |
Increase in professional sports teams’ sponsorship and signage revenues | 4,971 | ||
Increase in broadcast rights fees from MSG Media | 896 | ||
Increase in revenues from NHL and NBA distributions | 641 | ||
Decrease in professional sports teams’ pre/regular season ticket-related revenue | (6,185 | ) | |
Decrease in event-related revenues from other live sporting events | (4,964 | ) | |
Decrease in professional sports teams’ pre/regular season food, beverage and merchandise sales | (2,283 | ) | |
Decrease in professional sports teams’ playoff related revenues | (536 | ) | |
Other net decreases | (1,567 | ) | |
$ | 5,564 | ||
The increase in suite rental fee revenue was primarily due to new suite/club products which have come online partially offset by the impact of the planned reduction in certain suite products as a result of the Transformation and the NHL work stoppage.
The increase in professional sports teams' sponsorship and signage revenues primarily reflects expanded inventory and new sponsor relationships as a result of the Transformation and the Knicks' return to a full regular season schedule. These increases were partially offset by the impact of the NHL work stoppage.
The increase in broadcast rights fees from MSG Media was primarily due to the impact of the Knicks' return to a full regular season schedule offset by the impact of the NHL work stoppage.
The increase in revenues from NHL and NBA distributions was primarily due to the league related increases and the Knicks' return to a full regular season schedule largely offset by the impact of the NHL work stoppage.
The decrease in professional sports teams' pre/regular season ticket-related revenue was primarily driven by the impact of the NHL work stoppage. This decrease was largely offset by the Knicks' return to a full regular season schedule which resulted in more Knicks games played during the year ended June 30, 2013 as compared to the prior year and, to a lesser extent, higher average per-game revenue for our professional sports teams, inclusive of the impact of the temporary reduction in seating capacity due to the Transformation.
The decrease in event-related revenues from other live sporting events was primarily due to fewer events and a change in the mix of events during the year ended June 30, 2013 as compared to the prior year.
The decrease in professional sports teams' pre/regular season food, beverage and merchandise sales was primarily due to fewer NHL home games played, partially offset by more NBA home games played during the year ended June 30, 2013 as compared to the prior year, and, to a lesser extent, higher average spending per patron (per caps).
See “— Comparison of the Year Ended June 30, 2013 versus the Year Ended June 30, 2012 — Consolidated Results of Operations” for a discussion of the NHL work stoppage during the 2012-13 season and the NBA work stoppage during the 2011-12 season.
64
Direct operating expenses
Direct operating expenses for the year ended June 30, 2013 increased $2,767, or 1%, to $332,398 as compared to the prior year. The net increase is attributable to the following:
Increase in net provisions for NBA luxury tax and NBA and NHL revenue sharing expense (excluding playoffs) | $ | 3,846 | |
Increase in net provisions for certain team personnel transactions (including the impact of NBA luxury tax) | 2,127 | ||
Increase in team personnel compensation | 1,759 | ||
Decrease in event-related expenses associated with other live sporting events | (3,221 | ) | |
Decrease in professional sports teams' pre/regular season expense associated with food, beverage and merchandise sales | (671 | ) | |
Decrease in professional sports teams’ playoff related expenses | (513 | ) | |
Other net decreases | (560 | ) | |
$ | 2,767 | ||
Net provisions for NBA luxury tax, NBA and NHL revenue sharing expense (excluding playoffs) and certain team personnel transactions (including the impact of NBA luxury tax) were as follows:
Years Ended June 30, | Increase | ||||||||||
2013 | 2012 | ||||||||||
Net provisions for NBA luxury tax and NBA and NHL revenue sharing expense (excluding playoffs) | $ | 20,838 | $ | 16,992 | $ | 3,846 | |||||
Net provisions for certain team personnel transactions (including the impact of NBA luxury tax) | 18,441 | 16,314 | 2,127 | ||||||||
The increase in net provisions for NBA luxury tax (excluding the impact of team personnel transactions) and NBA and NHL revenue sharing expense (excluding playoffs) reflects higher NBA luxury tax of $6,103 partially offset by lower net provisions for NBA and NHL revenue sharing expense of $2,257. The increase in provisions for NBA luxury tax for the year ended June 30, 2013 was due to the Knicks not being a gross luxury tax payer for the 2011-12 season whereas the Knicks were a luxury tax payer for the 2012-13 season. The decrease in net provisions for NBA and NHL revenue sharing expense (excluding playoffs) was primarily attributable to the impact of the NHL work stoppage and an adjustment to the 2011-12 season revenue sharing expense partially offset by higher estimated NBA revenue sharing for the 2012-13 season as a result of the Knicks' return to a full regular season schedule.
Team personnel transactions for the year ended June 30, 2013 reflect provisions recorded for player waivers/contract terminations and season-ending player injuries of $10,434 and $7,159, respectively, and player trades of $848. Team personnel transactions for the year ended June 30, 2012 primarily reflect provisions recorded for player waivers/contract terminations and season-ending player injuries of $15,832 and $407, respectively.
The increase in team personnel compensation was primarily due to the impact of the Knicks' return to a full regular season schedule, and overall salary increases and the impact of roster changes largely offset by the NHL work stoppage.
Other net decreases include the impact on team operating expenses from the NHL work stoppage and, to a lesser extent, a league expense recoupment, which was recorded during the year ended June 30, 2013 that is not expected to be recurring offset by the impact of the Knicks' return to a full regular season schedule, as well as other team operating expense increases.
Selling, general and administrative expenses
Selling, general and administrative expenses for the year ended June 30, 2013 increased $2,944, or 3%, to $113,967, as compared to the prior year. This increase is primarily attributable to higher professional fees and employee compensation and related benefits, including separation-related costs, partially offset by a decrease in marketing costs.
AOCF
AOCF for the year ended June 30, 2013 decreased $1,703, or 6%, to $27,014, as compared to the prior year primarily due to higher revenues largely offset by an increase in selling, general and administrative expenses and direct operating expenses, as discussed above.
65
See “— Comparison of the Year Ended June 30, 2013 versus the Year Ended June 30, 2012 — Consolidated Results of Operations” for a discussion of the NHL work stoppage during the 2012-13 season and the NBA work stoppage during the 2011-12 season.
Liquidity and Capital Resources
Overview
Our primary sources of liquidity are cash and cash equivalents on hand, cash flows from the operations of our businesses and available borrowing capacity under our $500,000 credit agreement with a syndicate of lenders, providing for a senior secured revolving credit facility (see “Financing Agreements — Revolving Credit Facility” below). Our principal uses of cash include working capital-related items, capital spending, and investments that we may fund from time to time. The decisions of the Company as to the use of its available liquidity will be based upon the ongoing review of the funding needs of the business, the optimal allocation of cash resources, and the timing of cash flow generation.
We believe we have sufficient liquidity, including approximately $90,000 in cash and cash equivalents as of June 30, 2014, along with available borrowing capacity under our Revolving Credit Facility combined with cash flows from the operations of our businesses that may fluctuate from time to time, to operate our businesses, pursue new opportunities and our other initiatives.
We constantly assess capital and credit markets activity and conditions against our ability to meet our net funding and investing requirements over the next twelve months and we believe that the combination of cash and cash equivalents on hand, cash generated from operating activities and borrowing availability under our Revolving Credit Facility should provide us with sufficient liquidity to fund such requirements. However, U.S. and global economic conditions may lead to lower demand for our offerings, such as lower levels of attendance or advertising. The consequences of such conditions could adversely impact our business and results of operations and might require that we seek alternative sources of funding through the capital and credit markets that may or may not be available to us.
Financing Agreements
Revolving Credit Facility
On May 6, 2014, MSG L.P. and certain of its subsidiaries entered into a credit agreement with a syndicate of lenders providing for a senior secured revolving credit facility of up to $500,000 with a term of five years (the “Revolving Credit Facility”). Simultaneously with MSG L.P. entering into the Revolving Credit Facility, MSG L.P. terminated its previously existing $375,000 revolving credit facility with a syndicate of lenders, which facility had been effective since January 28, 2010.
Subject to the satisfaction of certain conditions and limitations, the Revolving Credit Facility allows for the addition of incremental term and/or revolving loan commitments and incremental term and/or revolving loans. Borrowings under the Revolving Credit Facility, which proceeds are available for working capital, capital expenditures and for general corporate purposes, bear interest at a floating rate which, at the option of MSG L.P., may be either 2.25% over the applicable period LIBOR rate, or 1.25% plus the higher of: (1) the U.S. Federal Funds Rate plus 0.50%; (ii) the U.S. Prime Rate; or (iii) the one-month LIBOR rate plus 1.00%. Accordingly, we will be subject to interest rate risk with respect to any borrowings we may make under that facility. In appropriate circumstances, we may seek to reduce this exposure through the use of interest rate swaps or similar instruments. Upon a payment default in respect of principal, interest or other amounts due and payable under the Revolving Credit Facility or related loan documents, default interest will accrue on all overdue amounts at an additional rate of 2.00% per annum. MSG L.P. is also required to pay a commitment fee of 0.40% in respect of the average daily unused commitments thereunder and pay customary letter of credit fees, as well as fronting fees, to banks that issue letters of credit pursuant to the Revolving Credit Facility.
The Revolving Credit Facility contains certain customary representations and warranties, affirmative covenants and events of default. It also requires MSG L.P. to comply with the following financial covenants: (i) a maximum total secured leverage ratio of 3.50:1.00 and (ii) a maximum total leverage ratio of 6.00:1.00 subject to upward adjustment during the continuance of certain events. In addition, there is a minimum interest coverage ratio of 2.00:1.00 for the Company. As of June 30, 2014, MSG L.P. was in compliance with the financial covenants in the Revolving Credit Facility. All borrowings under the Revolving Credit Facility are subject to the satisfaction of customary conditions, including covenant compliance, absence of a default and accuracy of representations and warranties. As of June 30, 2014, there was $7,460 in letters of credit issued and outstanding under the Revolving Credit Facility with available borrowing capacity of $492,540.
66
All obligations under the Revolving Credit Facility are guaranteed by MSG L.P.'s existing and future direct and indirect domestic subsidiaries that are not designated as excluded subsidiaries or unrestricted subsidiaries in accordance with the facility (the “Guarantors”). All obligations under the Credit Agreement, including the guarantees of those obligations, are secured by certain of the assets of MSG L.P. and each Guarantor, (collectively, “Collateral”) including, but not limited to, a pledge of the equity interests held directly or indirectly by MSG L.P. in each Guarantor. The Collateral, however, does not include, among other things, our sports franchises or other assets of any of MSG L.P.'s teams, including of the Knicks and Rangers, or any interests in real property of MSG L.P. or the Guarantors, including the Madison Square Garden Complex (which includes both The Garden and The Theater at Madison Square Garden), the leasehold interest in Radio City Music Hall and MSG L.P.'s real property interest in other venues. Subject to customary notice and minimum amount conditions, MSG L.P. may voluntarily prepay outstanding loans under the Revolving Credit Facility at any time, in whole or in part, without premium or penalty (except for customary breakage costs with respect to LIBOR loans). With certain exceptions, MSG L.P. is required to make mandatory prepayments on loans outstanding, in certain circumstances, including without limitation from the net cash proceeds of certain sales of assets (including Collateral) or casualty insurance and/or condemnation recoveries (subject to certain reinvestment, repair or replacement rights), and the incurrence of certain indebtedness.
In addition to the financial covenants previously discussed, the Revolving Credit Facility and the related security agreement contain certain customary representations and warranties, affirmative covenants and events of default. The Revolving Credit Facility contains certain restrictions on the ability of MSG L.P. and its restricted subsidiaries to take certain actions as provided in (and subject to various exceptions and baskets set forth in) the Revolving Credit Facility, including the following: (i) incur additional indebtedness and contingent liabilities; (ii) create liens on certain assets; (iii) make investments, loans or advances in or to other persons; (iv) pay dividends and distributions or repurchase capital stock; (v) repay, redeem or repurchase certain indebtedness; (vi) change its lines of business; (vii) engage in certain transactions with affiliates; (viii) amend specified material agreements; (ix) merge or consolidate; and (x) make certain dispositions. Additionally there is a limitation on the ability of the Company to incur indebtedness if (a) the Company, MSG L.P. and any of its restricted subsidiaries collectively would not comply with a total leverage ratio of 4.00:1.00 and (b) the Company on a consolidated basis would not comply with the minimum interest coverage ratio of 2.00:1.00.
Revolving Credit Agreement with Nonconsolidated Affiliate
In September 2013, the Company acquired a 50% interest in Azoff-MSG. The Company provides a $50,000 revolving credit facility to the entity, which amount was fully borrowed as of June 30, 2014.
Cash Flow Discussion
Operating Activities
Net cash provided by operating activities for the year ended June 30, 2014 increased by $79,500 to $342,555 as compared to the prior year primarily driven by an increase of $80,825 from changes in assets and liabilities, slightly offset by a decrease in net income and other non-cash items. The increase resulting from changes in assets and liabilities was primarily due to (i) an increase during the year ended June 30, 2014 in accrued and other liabilities of $80,991 as compared to an increase of $29,564 during the prior year, (ii) an increase during the year ended June 30, 2014 in deferred revenue of $64,092 as compared to an increase of $24,920 during the prior year and (iii) an increase during the year ended June 30, 2014 in accounts payable of $704 as compared to a decrease of $14,743 during the prior year. These increases were partially offset by a decrease during the year ended June 30, 2014 in deferred income taxes of $15,568 as compared to an increase of $5,523 during the prior year and an increase during the year ended June 30, 2014 in net related party receivables of $7,182 as compared to a decrease of $8,712 during the prior year.
Net cash provided by operating activities for the year ended June 30, 2013 decreased by $70,318 to $263,055 as compared to the prior year. This decrease was driven by a decrease of $104,501 resulting from changes in assets and liabilities, partially offset by a $34,183 increase in net income and other non-cash items. The decrease resulting from changes in assets and liabilities was primarily due to (i) a decrease during the year ended June 30, 2013 in accounts payable of $14,743 as compared to an increase of $17,339 during the prior year, (ii) an increase during the year ended June 30, 2013 in deferred revenue of $24,920 as compared to an increase of $55,592 during the prior year, (iii) an increase during the year ended June 30, 2013 in deferred income taxes of $5,523 as compared to an increase of $21,781 during the prior year and (iv) an increase during the year ended June 30, 2013 in accrued and other liabilities of $29,564 as compared to an increase of $45,073 during the prior year.
67
Investing Activities
Net cash used in investing activities for the year ended June 30, 2014 increased by $331,037 to $516,398 as compared to the prior year. This increase is primarily due to $226,510 of cash used during the current year for the Company's investments in and loans to its nonconsolidated affiliates, Azoff-MSG, BBLV and Tribeca Enterprises. In addition, capital expenditures for the year ended June 30, 2014 increased by $76,892 as compared to the prior year primarily due to the renovation of the Forum during the current year partially offset by lower capital expenditures associated with the Transformation. Investing activities during the prior year included proceeds of $44,136 from the sale of all of the Company's holdings of Live Nation common stock. These contributors to the higher net cash used in investing activities during the current year were partially offset by an $18,000 loan provided to the Company (which we expect to be forgiven based on our satisfaction of certain conditions) during the year ended June 30, 2014 from the City of Inglewood in connection with the Company's renovation of the Forum.
Net cash used in investing activities for the year ended June 30, 2013 decreased by $243,720 to $185,361 as compared to the prior year primarily driven by lower capital expenditures associated with the Transformation and, to a lesser extent, proceeds from the March 2013 sale of all the Company's holdings of Live Nation common stock as well as the Company's June 2012 acquisition of the Forum. These decreases were slightly offset by higher capital expenditures for MSG Entertainment.
Financing Activities
Net cash used in financing activities for the year ended June 30, 2014 increased by $5,538 to $11,819 as compared to the prior year. This increase is primarily due to $6,718 of cash used for deferred financing costs during the year ended June 30, 2014 as a result of entering into the Revolving Credit Facility and lower proceeds from stock option exercises as compared to the prior year. These increases were largely offset by lower taxes paid in lieu of shares issued for equity-based compensation during the year ended June 30, 2014 as compared to the prior year.
Net cash used in financing activities for the year ended June 30, 2013 increased by $3,613 to $6,281 as compared to the prior year. During the year ended June 30, 2013, taxes paid in lieu of shares issued for equity-based compensation amounted to $21,148. During the year ended June 30, 2012, the Company paid $11,768 for the acquisition of restricted shares. The impact of these items was partially offset by higher proceeds from stock option exercises and an increase in the excess tax benefit on share-based awards as compared to the prior year.
Contractual Obligations and Off Balance Sheet Arrangements
Future cash payments required under contracts entered into by the Company in the normal course of business, outstanding letters of credit and capital leases as of June 30, 2014 are summarized in the following table:
Payments Due by Period | |||||||||||||||||||
Total | Year 1 | Years 2-3 | Years 4-5 | More Than 5 Years | |||||||||||||||
Off balance sheet arrangements: | |||||||||||||||||||
Contractual obligations (a) | $ | 1,236,772 | $ | 199,823 | $ | 273,754 | $ | 208,111 | $ | 555,084 | |||||||||
Operating lease obligations (b) | 389,281 | 41,005 | 82,641 | 74,630 | 191,005 | ||||||||||||||
Letters of credit (c) | 7,460 | 7,460 | — | — | — | ||||||||||||||
1,633,513 | 248,288 | 356,395 | 282,741 | 746,089 | |||||||||||||||
Contractual obligations reflected on the balance sheet: | |||||||||||||||||||
Capital lease obligations (d) | 2,564 | 462 | 924 | 924 | 254 | ||||||||||||||
Contractual obligations (e) | 91,293 | 41,220 | 18,736 | 10,933 | 20,404 | ||||||||||||||
93,857 | 41,682 | 19,660 | 11,857 | 20,658 | |||||||||||||||
Total | $ | 1,727,370 | $ | 289,970 | $ | 376,055 | $ | 294,598 | $ | 766,747 | |||||||||
___________________________________
(a) | Contractual obligations not reflected on the balance sheet consist primarily of (i) the MSG Media segment's obligations related to professional team rights, acquired under license agreements, to telecast certain live sporting events, (ii) the MSG Sports segment's obligations under employment agreements that the Company has with its professional sports teams' personnel that are generally guaranteed regardless of employee injury or termination, and (iii) minimum purchase requirements incurred in the normal course of the Company's operations. |
68
(b) | Operating lease obligations represent future minimum rental payments on various long-term, noncancelable leases for office and storage space, and lease commitments for Radio City Music Hall and the Beacon Theatre. |
(c) | Consists of letters of credit obtained by the Company under the Revolving Credit Facility as collateral for certain insurance policies and for a lease agreement. |
(d) | Reflects the face amount of capital lease obligations, including related interest. |
(e) | Consists principally of amounts earned under employment agreements that the Company has with certain of its professional sports teams' personnel in the MSG Sports segment. |
The future cash payments reflected above do not include the impact of potential insurance recoveries or amounts which may be due for NBA luxury tax payments or NBA or NHL revenue sharing.
The future cash payments reflected above include amounts related to Fuse (see Note 23 to the consolidated financial statements included in Item 8 of this Annual Report on Form 10-K).
See “Financing Agreements — Revolving Credit Agreement with Nonconsolidated Affiliate” above for discussion of the revolving credit agreement provided by the Company to Azoff-MSG.
Seasonality of Our Business
The dependence of the MSG Sports segment on revenues from its NBA and NHL sports teams generally means it earns a disproportionate share of its revenues in the second and third quarters of our fiscal year. The dependence of the MSG Entertainment segment on revenues from the Radio City Christmas Spectacular generally means it earns a disproportionate share of its revenues and operating income in the second quarter of our fiscal year.
Recently Issued Accounting Pronouncements and Critical Accounting Policies
Recently Adopted Accounting Pronouncements
In December 2011, the Financial Accounting Standards Board (“FASB”) issued Accounting Standards Update (“ASU”) No. 2011-11, Disclosures about Offsetting Assets and Liabilities, which creates new disclosure requirements regarding the nature of an entity's rights of offset and related arrangements associated with its financial instruments and derivative instruments. In January 2013, the FASB issued ASU No. 2013-01, Clarifying the Scope of Disclosures about Offsetting Assets and Liabilities, which clarifies the scope of transactions that are subject to disclosures required by FASB Accounting Standards Codification (“ASC”) 210-20-50, Balance Sheet - Offsetting - Disclosure, concerning offsetting. In particular ASU No. 2013-01 addresses implementation issues about the scope of ASU No. 2011-11 and clarifies that the scope of the disclosure is limited to derivatives, repurchase agreements, and securities borrowing and securities lending transactions that are either offset in the financial statements or are subject to a master netting arrangement or similar arrangement. These standards were adopted by the Company in the first quarter of fiscal year 2014. The adoption of these standards did not have an impact on the Company's financial position, results of operations, or cash flows.
In February 2013, the FASB issued ASU No. 2013-02, Comprehensive Income (Topic 220) - Reporting of Amounts Reclassified Out of Accumulated Other Comprehensive Income, which requires an entity to provide information about amounts reclassified out of accumulated other comprehensive income by component. In addition, an entity is required to present, either on the face of the statement where net income is presented or in the notes, significant amounts reclassified out of accumulated other comprehensive income by the respective line items of net income but only if the amount reclassified is required under GAAP to be reclassified to net income in its entirety in the same reporting period. For other amounts that are not required under GAAP to be reclassified in their entirety to net income, an entity is required to cross-reference to other disclosures required under GAAP that provide additional detail about those amounts. This standard was adopted by the Company in the first quarter of fiscal year 2014. The adoption of this standard impacted the Company's disclosures only and did not have any impact on the Company's financial position, results of operations, or cash flows.
In April 2014, the FASB issued ASU No. 2014-08, Presentation of Financial Statements (Topic 205) and Property, Plant, and Equipment (Topic 360): Reporting Discontinued Operations and Disclosures of Disposals of Components of an Entity, which revises the definition of a discontinued operation to limit the circumstances under which a disposal or classification as held for sale qualifies for presentation as a discontinued operation. Expanded disclosures are required concerning a discontinued operation and the disposal of a significant component of an entity not qualifying as a discontinued operation. The revised standard is effective for any new disposals and new classifications of assets held for sale in annual and interim periods beginning after December 15, 2014. Early adoption is permitted. The Company elected to early adopt this guidance in the
69
fourth quarter of fiscal year 2014. The adoption of this standard did not have any impact on the Company's financial position, results of operations, or cash flows.
Recently Issued Accounting Pronouncements Not Yet Adopted
In May 2014, the FASB issued ASU No. 2014-09, Revenue from Contracts with Customers (Topic 606), which supersedes the revenue recognition requirements in FASB ASC Topic 605, Revenue Recognition. This ASU is based on the principle that revenue is recognized to depict the transfer of goods or services to customers in an amount that reflects the consideration to which the entity expects to be entitled in exchange for those goods or services. The ASU also requires additional disclosure about the nature, amount, timing and uncertainty of revenue and cash flows arising from customer contracts, including significant judgments and changes in judgments and assets recognized from costs incurred to obtain or fulfill a contract. This standard will be effective for the Company beginning in the first quarter of fiscal year 2018 using one of two retrospective application methods. The Company is currently evaluating the impact this standard will have on its consolidated financial statements.
Critical Accounting Policies
The preparation of the Company's consolidated financial statements in conformity with GAAP requires management to make estimates and assumptions about future events. These estimates and the underlying assumptions affect the amounts of assets and liabilities reported, disclosures about contingent assets and liabilities, and reported amounts of revenues and expenses. Management believes its use of estimates in the consolidated financial statements to be reasonable. The significant accounting policies which we believe are the most critical to aid in fully understanding and evaluating our reported financial results include the following:
Multiple-Deliverable Transactions
The Company has various types of multiple-deliverable arrangements, including multi-year sponsorship agreements. The deliverables included in each sponsorship agreement vary and may include suite licenses, event tickets and various media and advertising benefits, which include items such as, but not limited to, signage at The Garden and the Company's other venues. The timing of revenue recognition for each deliverable is dependent upon meeting the revenue recognition criteria for the respective deliverable.
The Company allocates revenue to each deliverable within the arrangement based on its relative selling price. For many deliverables in an arrangement, such as event tickets and certain advertising benefits, the Company has vendor specific objective evidence (“VSOE”) of selling price as it typically sells the same or similar deliverables regularly on a stand-alone basis. Absent VSOE the Company considers whether third party evidence (“TPE”) is available; however, in most instances TPE is not available. The Company's process for determining its estimated selling prices for deliverables without VSOE or TPE involves management's judgment and considers multiple factors including company specific and market specific factors that may vary depending upon the unique facts and circumstances related to each deliverable. Key factors considered by the Company in developing a best estimate of selling price for deliverables include, but are not limited to, prices charged for similar deliverables, the Company's ongoing pricing strategy and policies, and consideration of pricing of similar deliverables sold in other multiple-deliverable agreements.
Impairment of Long-Lived and Indefinite-Lived Assets
The Company's long-lived and indefinite-lived assets accounted for approximately 75% of the Company's consolidated total assets as of June 30, 2014 and consist of the following:
Goodwill | $ | 701,674 | |
Indefinite-lived intangible assets | 163,850 | ||
Amortizable intangible assets, net | 80,306 | ||
Property and equipment, net | 1,252,467 | ||
$ | 2,198,297 | ||
In assessing the recoverability of the Company's long-lived and indefinite-lived assets, the Company must make estimates and assumptions regarding future cash flows and other factors to determine the fair value of the respective assets. These estimates and assumptions could have a significant impact on whether an impairment charge is recognized and also the magnitude of any such charge. Fair value estimates are made at a specific point in time, based on relevant information. These estimates are subjective in nature and involve uncertainties and matters of significant judgments and therefore cannot be determined with
70
precision. Changes in assumptions could significantly affect the estimates. If these estimates or material related assumptions change in the future, we may be required to record impairment charges related to our long-lived and/or indefinite-lived assets.
Goodwill
Goodwill is tested annually for impairment as of August 31st and at any time upon the occurrence of certain events or substantive changes in circumstances. The Company has the option to perform a qualitative assessment to determine if an impairment is more likely than not to have occurred. If the Company can support the conclusion that it is not more likely than not that the fair value of a reporting unit is less than its carrying amount, we would not need to perform the two-step impairment test for that reporting unit. If the Company cannot support such a conclusion or the Company does not elect to perform the qualitative assessment then the first step of the goodwill impairment test is used to identify potential impairment by comparing the fair value of a reporting unit with its carrying amount, including goodwill. If the carrying amount of a reporting unit exceeds its fair value, the second step of the goodwill impairment test is performed to measure the amount of impairment loss, if any. The second step of the goodwill impairment test compares the implied fair value of the reporting unit's goodwill with the carrying amount of that goodwill. If the carrying amount of the reporting unit's goodwill exceeds the implied fair value of that goodwill, an impairment loss is recognized in an amount equal to that excess. The implied fair value of goodwill is determined in the same manner as the amount of goodwill that would be recognized in a business combination. The Company's three reporting units for evaluating goodwill impairment are the same as its reportable segments, and all of them have goodwill. The estimates of the fair value of the Company's reporting units are primarily determined using discounted cash flows and comparable market transactions. These valuations are based on estimates and assumptions including projected future cash flows, discount rates, determination of appropriate market comparables and the determination of whether a premium or discount should be applied to comparables. For all periods presented the Company elected to perform the qualitative assessment of impairment for the Sports and Media reporting units. These assessments considered factors such as:
• | Macroeconomic conditions; |
• | Industry and market considerations; |
• | Cost factors; |
• | Overall financial performance of the reporting unit; |
• | Other relevant company-specific factors such as changes in management, strategy or customers; and |
• | Relevant reporting unit specific events such as changes in the carrying amount of net assets. |
For all periods presented, the Company performed the quantitative assessment of impairment for the MSG Entertainment reporting unit. For MSG Entertainment, these valuations of the reporting unit include assumptions for the number and expected financial performance of live entertainment events and productions, which includes, but is not limited to, the level of ticket sales, concessions and sponsorships. Significant judgments inherent in a discounted cash flow valuation include the selection of appropriate discount rates, estimating the amount and timing of estimated future cash flows and identification of appropriate continuing growth rate assumptions. The discount rates used in the analysis are intended to reflect the risk inherent in the projected future cash flows generated by the respective intangible assets.
The goodwill balance reported on the Company's balance sheet as of June 30, 2014 by reportable segment is as follows:
MSG Media | $ | 424,508 | |
MSG Entertainment | 58,979 | ||
MSG Sports | 218,187 | ||
$ | 701,674 | ||
During the first quarter of fiscal year 2014, the Company performed its annual impairment test of goodwill, and there was no impairment of goodwill identified for any of its reportable segments. Based on this impairment test, the Company's reporting units had sufficient safety margins, representing the excess of the estimated fair value of each reporting unit less its respective carrying value (including goodwill allocated to each respective reporting unit).
In addition, the Company performed an impairment test of MSG Media as required pursuant to the Fuse sale (see Note 23 to the consolidated financial statements included in Item 8 of this Annual Report on Form 10-K), and there was no impairment of goodwill identified as a result of this test.
Identifiable Indefinite-Lived Intangible Assets
Identifiable indefinite-lived intangible assets are tested annually for impairment as of August 31st and at any time upon the occurrence of certain events or substantive changes in circumstances. The Company has the option to perform a qualitative
71
assessment to determine if an impairment is more likely than not to have occurred. In the qualitative assessment, the Company must evaluate the totality of qualitative factors, including any recent fair value measurements, that impact whether an indefinite-lived intangible asset other than goodwill has a carrying amount that more likely than not exceeds its fair value. The Company must proceed to conducting a quantitative analysis, according to which an impairment charge is recognized for the amount of the asset's carrying amount exceeding the fair value, if the Company (1) determines that such an impairment is more likely than not to exist, or (2) forgoes the qualitative assessment entirely. The impairment test for identifiable indefinite-lived intangible assets consists of a comparison of the estimated fair value of the intangible asset with its carrying value. If the carrying value of the intangible asset exceeds its fair value, an impairment loss is recognized in an amount equal to that excess. The following table sets forth the amount of identifiable indefinite-lived intangible assets reported in the Company's consolidated balance sheet as of June 30, 2014 by reportable segment:
Sports franchises (MSG Sports segment) | $ | 101,429 | |
Trademarks (MSG Entertainment segment) | 62,421 | ||
$ | 163,850 | ||
In March 2014, the Company acquired an NBA Development League franchise, which will begin operations for the 2014-15 season. The purchase was accounted for as the acquisition of an indefinite-lived franchise intangible asset.
When the Company performs the qualitative assessment the Company considers the events and circumstances that could affect the significant inputs used to determine the fair value of the intangible asset. Examples of such events and circumstances include:
• | Cost factors; |
• | Financial performance; |
• | Legal, regulatory, contractual, business or other factors; |
• | Other relevant company-specific factors such as changes in management, strategy or customers; |
• | Industry and market considerations; and |
• | Macroeconomic conditions. |
When the quantitative assessment is performed the Company determines the fair value of the intangible asset. During the first quarter of fiscal year 2014, the Company performed its annual impairment test of identifiable indefinite-lived intangible assets, and there was no impairment identified. Based on this impairment test, the Company's indefinite-lived intangible assets had sufficient safety margins, representing the excess of each identifiable indefinite-lived intangible asset's estimated fair value over its respective carrying value.
Other Long-Lived Assets
For other long-lived assets, including intangible assets that are amortized, the Company evaluates assets for recoverability when there is an indication of potential impairment. If the undiscounted cash flows from a group of assets being evaluated is less than the carrying value of that group of assets, the fair value of the asset group is determined and the carrying value of the asset group is written down to fair value.
The Company has recognized intangible assets for affiliate relationships, season ticket holder relationships, suite holder relationships, and other intangibles as a result of purchase accounting. The Company has determined that certain of such intangible assets have finite lives.
The estimated useful lives and net carrying values of these intangibles at June 30, 2014 are as follows:
Net Carrying Value | Estimated Useful Lives | ||||
Affiliate relationships | $ | 51,043 | 24 years | ||
Season ticket holder relationships | 24,464 | 12 to 15 years | |||
Suite holder relationships | 2,454 | 11 years | |||
Other intangibles | 2,345 | 15 years | |||
$ | 80,306 | ||||
The useful lives for the affiliate relationships, season ticket holder relationships and suite holder relationships were determined based upon an estimate for renewals of existing agreements the Company had in place with its major customers in April 2005
72
(the time that purchase accounting was applied). The Company has renewed its major affiliation agreements and maintained customer relationships in the past and believes it will be able to renew its major affiliation agreements and maintain those customer relationships in the future. Furthermore, the Company has been successful in maintaining its relationships with its season ticket holders and suite holders in the past and believes it will be able to significantly renew its season ticket and suite holder relationships and maintain those relationships in the future. However, it is possible that the Company will not successfully renew such agreements as they expire or that if it does, the net revenue earned may not equal or exceed the net revenue currently being earned, which could have a material negative effect on our business. In light of these facts and circumstances, the Company has determined that its estimated useful lives are appropriate.
There have been periods when an existing affiliation agreement has expired and the parties have not finalized negotiations of either a renewal of that agreement or a new agreement for certain periods of time. In certain of these circumstances, the affiliate may continue to carry the service(s) until execution of definitive renewal or replacement agreements (or until we or the affiliate determine that carriage should cease). See “Part I — Item 1A. Risk Factors — Risks Relating to Our Media Business — The Success of Our Media Business Also Depends on Affiliation Fees We Receive Under our Affiliation Agreements, the Loss of Which or Renewal of Which on Less Favorable Terms May Have a Material Negative Effect on Our Business and Results of Operations.”
If an affiliate ceases to carry the service on an other than temporary basis, the Company records an impairment charge for the then remaining carrying value of the affiliate relationship intangible asset associated with that affiliate. If the Company were to renew an affiliation agreement at rates that produced materially less net revenue compared to the net revenue produced under the previous agreement, the Company would evaluate the impact on its cash flows and, if necessary, would further evaluate such indication of potential impairment by following the policy described above for the asset or asset group containing that intangible asset. The Company also would evaluate whether the remaining useful life of the affiliate relationship remained appropriate. Based on the carrying value of the affiliate relationships recorded as of June 30, 2014, if the estimated life of these affiliate relationships were shortened by 10%, the effect on amortization for the year ended June 30, 2014 would be an increase of approximately $384.
Defined Benefit Pension Plans and Other Postretirement Benefit Plan
The Company utilizes actuarial methods to calculate pension and other postretirement benefit obligations and the related net periodic benefit cost which are based on actuarial assumptions. Two key assumptions, the discount rate and the expected long-term rate of return on plan assets, are important elements of the plans' expense and liability measurement and we evaluate these key assumptions annually. Other assumptions include demographic factors, such as mortality, retirement age and turnover. The actuarial assumptions used by the Company may differ materially from actual results due to various factors, including, but not limited to, changing economic and market conditions. Differences between actual and expected occurrences could significantly impact the actual amount of net periodic benefit cost and the benefit obligation recorded by the Company. Material changes in the costs of the plans may occur in the future due to changes in these assumptions, changes in the number of the plan participants, changes in the level of benefits provided, changes in asset levels and changes in legislation. Our assumptions reflect our historical experience and our best judgment regarding future expectations.
Accumulated and projected benefit obligations reflect the present value of future cash payments for benefits. We use the Towers Watson U.S. Rate Link: 40-90 discount rate model (which is developed by examining the yields on selected highly rated corporate bonds) to discount these benefit payments on a plan by plan basis, to select a rate at which we believe each plan's benefits could be effectively settled. Lower discount rates increase the present value of benefit obligations and will usually increase the subsequent year's net periodic benefit cost. The weighted-average discount rates used to determine benefit obligations as of June 30, 2014 for the Company's pension plans and postretirement plan were 4.32% and 4.00%, respectively. A 25 basis point decrease in these assumed discount rates would increase the projected benefit obligations for the Company's pension plans and postretirement plan at June 30, 2014 by $6,550 and $240, respectively. The weighted-average discount rates used to determine net periodic benefit cost for the year ended June 30, 2014 for the Company's pension plans and postretirement plan were 4.80% and 4.50%, respectively. A 25 basis point decrease in these assumed discount rates would increase the total net periodic benefit cost for the Company's pension plans by $550 and decrease net periodic benefit cost for the postretirement plan by $13 for the year ended June 30, 2014.
The expected long-term return on plan assets is based on a periodic review and modeling of the plans' asset allocation structures over a long-term horizon. Expectations of returns for each asset class are the most important of the assumptions used in the review and modeling, and are based on comprehensive reviews of historical data, forward-looking economic outlook, and economic/financial market theory. The expected long-term rate of return was selected from within the reasonable range of rates determined by (a) historical real returns, net of inflation, for the asset classes covered by the investment policy, and (b) projections of inflation over the long-term period during which benefits are payable to plan participants. The expected long-term rate of return on plan assets for the Company's funded pension plans was 4.57% for the year ended June 30, 2014.
73
Performance of the capital markets affects the value of assets that are held in trust to satisfy future obligations under the Company's funded plans. Adverse market performance in the future could result in lower rates of return for these assets than projected by the Company which could increase the Company's funding requirements related to these plans, as well as negatively affect the Company's operating results by increasing the net periodic benefit cost. A 25 basis point decrease in the long-term return on pension plan assets assumption would increase net periodic pension benefit cost by $254 for the year ended June 30, 2014.
Another important assumption for our postretirement plan is healthcare cost trend rates. We developed our estimate of the healthcare cost trend rates through examination of the Company's claims experience and the results of recent healthcare trend surveys.
Assumptions for healthcare cost trend rates used to determine the benefit obligation and net periodic benefit cost for our postretirement plan as of and for the year ended June 30, 2014 are as follows:
Net Periodic Benefit Cost | Benefit Obligation | ||||
Healthcare cost trend rate assumed for next year | 7.75 | % | 7.25 | % | |
Rate to which the cost trend rate is assumed to decline (the ultimate trend rate) | 5.00 | % | 5.00 | % | |
Year that the rate reaches the ultimate trend rate | 2020 | 2020 | |||
A one percentage point change in assumed healthcare cost trend rates would have the following effects on the benefit obligation for our postretirement plan and net periodic postretirement benefit cost as of and for the year ended June 30, 2014:
Increase (Decrease) on Total of Service and Interest Cost Components | Increase (Decrease) on Benefit Obligation | ||||||
One percentage point increase | $ | 76 | $ | 1,031 | |||
One percentage point decrease | (66 | ) | (906 | ) | |||
GAAP includes mechanisms that serve to limit the volatility in the Company's earnings that otherwise would result from recording changes in the value of plan assets and benefit obligations in our consolidated financial statements in the periods in which those changes occur. For example, while the expected long-term rate of return on the plans' assets should, over time, approximate the actual long-term returns, differences between the expected and actual returns could occur in any given year. These differences contribute to the deferred actuarial gains or losses, which are then amortized over time.
See Note 16 to the consolidated financial statements included in Item 8 of this Annual Report on Form 10-K for more information on our pension plans and other postretirement benefit plan.
Item 7A. Quantitative and Qualitative Disclosures About Market Risk
For sensitivity analyses and other information regarding market risks we face in connection with our pension and postretirement plans, see “Item 7. Management's Discussion and Analysis of Financial Condition and Results of Operations — Recently Issued Accounting Pronouncements and Critical Accounting Policies — Critical Accounting Policies — Defined Benefit Pension Plans and Other Postretirement Benefit Plan,” which information is incorporated by reference herein.
Our market risk exposure to interest rate risk relates to any borrowing we may incur.
Borrowings under our Revolving Credit Facility incur interest, based on our election, at a floating rate based upon LIBOR, the U.S. Federal Funds Rate or the U.S. Prime Rate, plus, in each case, a fixed spread. Accordingly, we are subject to interest rate risk with respect to the tenor of any borrowings we may incur under the Revolving Credit Facility. If appropriate, we may seek to reduce such exposure through the use of interest rate swaps or similar instruments that qualify for hedge accounting treatment. See “Item 7. Management's Discussion and Analysis of Financial Condition and Results of Operations — Liquidity and Capital Resources — Financing Agreements” for more information on our Revolving Credit Facility.
We have de minimis foreign currency risk exposure as our businesses operate almost entirely in U.S. Dollars. We do not have any meaningful commodity risk exposures associated with the operation of our venues.
74
Item 8. Financial Statements and Supplementary Data
The Financial Statements required by this Item 8 appear beginning on page 85 of this Annual Report on Form 10-K, and are incorporated by reference herein.
Item 9. Changes in and Disagreements with Accountants on Accounting and Financial Disclosure
None.
Item 9A. Controls and Procedures
Evaluation of Disclosure Controls and Procedures
An evaluation was carried out under the supervision and with the participation of the Company's management, including our Chief Executive Officer and Chief Financial Officer, of the effectiveness of the design and operation of our disclosure controls and procedures (as defined in Rules 13a-15(e) and 15d-15(e) under the Securities Exchange Act of 1934). Based upon that evaluation as of June 30, 2014, the Company's Chief Executive Officer and Chief Financial Officer concluded that the Company's disclosure controls and procedures are effective at a reasonable level of assurance in alerting them in a timely manner to material information required to be disclosed in our periodic reports filed with the SEC.
Management's Report on Internal Control over Financial Reporting
Management is responsible for establishing and maintaining adequate internal control over financial reporting, as such term is defined under the Securities Exchange Act of 1934 Rule 13a-15(f). The Company's internal control over financial reporting includes those policies and procedures that (i) pertain to the maintenance of records that, in reasonable detail, accurately and fairly reflect the transactions and dispositions of the assets of the Company; (ii) provide reasonable assurance that transactions are recorded as necessary to permit preparation of financial statements in accordance with generally accepted accounting principles, and that receipts and expenditures of the Company are being made only in accordance with authorizations of management and directors of the Company; and (iii) provide reasonable assurance regarding prevention or timely detection of unauthorized acquisition, use, or disposition of the Company's assets that could have a material effect on the financial statements.
Internal control over financial reporting is designed to provide reasonable assurance regarding the reliability of financial reporting and the preparation of financial statements prepared for external purposes in accordance with generally accepted accounting principles. Because of its inherent limitations, internal control over financial reporting may not prevent or detect misstatements. Also, projections of any evaluation of effectiveness to future periods are subject to the risk that controls may become inadequate because of changes in conditions, or that the degree of compliance with the policies or procedures may deteriorate.
Under the supervision and with the participation of management, including the Company's Chief Executive Officer and Chief Financial Officer, we conducted an evaluation of the effectiveness of our internal control over financial reporting based on the framework in Internal Control — Integrated Framework (1992) issued by the Committee of Sponsoring Organizations of the Treadway Commission. Based on our evaluation under the framework in Internal Control — Integrated Framework (1992), our management concluded that our internal control over financial reporting was effective as of June 30, 2014.
The effectiveness of our internal control over financial reporting as of June 30, 2014 has been audited by KPMG LLP, an independent registered public accounting firm, as stated in their report which is included herein.
Changes in Internal Controls
During our most recent fiscal quarter, there has not been any change in our internal control over financial reporting (as such term is defined in Rules 13a-15(f) and 15d-15(f) under the Securities Exchange Act of 1934) that has materially affected, or is reasonably likely to materially affect, our internal control over financial reporting.
Item 9B. Other Information
None.
75
PART III
Item 10. Directors, Executive Officers and Corporate Governance
Information relating to our directors, executive officers and corporate governance will be included in the proxy statement for the 2014 annual meeting of the Company's stockholders, which is expected to be filed within 120 days of our fiscal year end, and is incorporated herein by reference.
Item 11. Executive Compensation
Information relating to executive compensation will be included in the proxy statement for the 2014 annual meeting of the Company's stockholders, which is expected to be filed within 120 days of our fiscal year end, and is incorporated herein by reference.
Item 12. Security Ownership of Certain Beneficial Owners and Management and Related Stockholder Matters
Information relating to the beneficial ownership of our common stock will be included in the proxy statement for the 2014 annual meeting of the Company's stockholders, which is expected to be filed within 120 days of our fiscal year end, and is incorporated herein by reference.
Item 13. Certain Relationships and Related Transactions, and Director Independence
Information relating to certain relationships and related transactions and director independence will be included in the proxy statement for the 2014 annual meeting of the Company's stockholders, which is expected to be filed within 120 days of our fiscal year end, and is incorporated herein by reference.
Item 14. Principal Accountant Fees and Services
Information relating to principal accountant fees and services will be included in the proxy statement for the 2014 annual meeting of the Company's stockholders, which is expected to be filed within 120 days of our fiscal year end, and is incorporated herein by reference.
76
PART IV
Item 15. Exhibits and Financial Statement Schedules
Page No. | ||||
The following documents are filed as part of this report: | ||||
1. | The financial statements as indicated in the index set forth on page | |||
2. | Financial statement schedule: | |||
Schedule supporting consolidated financial statements: | |
Schedules other than that listed above have been omitted, since they are either not applicable, not required or the information is included elsewhere herein.
3. | The Index to Exhibits is on page | |||
77
THE MADISON SQUARE GARDEN COMPANY
SCHEDULE II
VALUATION AND QUALIFYING ACCOUNTS
(in thousands)
Balance at Beginning of Period | (Additions) Deductions Charged to Costs and Expenses | Deductions (a) | Balance at End of Period | ||||||||||||
Year Ended June 30, 2014 Allowance for doubtful accounts | $ | (1,729 | ) | $ | (21 | ) | $ | 1,067 | $ | (683 | ) | ||||
Year Ended June 30, 2013 Allowance for doubtful accounts | $ | (2,434 | ) | $ | 228 | $ | 477 | $ | (1,729 | ) | |||||
Year Ended June 30, 2012 Allowance for doubtful accounts | $ | (2,292 | ) | $ | (568 | ) | $ | 426 | $ | (2,434 | ) | ||||
_____________________________
(a) Primarily reflects write-offs of uncollectible amounts.
78
SIGNATURES
Pursuant to the requirements of Section 13 or 15(d) the Securities Exchange Act of 1934, as amended, the Registrant has duly caused this report to be signed on its behalf by the undersigned, thereunto duly authorized, on the 20th day of August, 2014.
The Madison Square Garden Company | ||
By: | /S/ ROBERT M. POLLICHINO | |
Name: | Robert M. Pollichino | |
Title: | Executive Vice President and Chief | |
Financial Officer | ||
POWER OF ATTORNEY
KNOW ALL MEN BY THESE PRESENTS, that each person whose signature appears below constitutes and appoints Thomas S. Smith, Jr. and Robert M. Pollichino, and each of them, as such person's true and lawful attorneys-in-fact and agents, with full power of substitution and resubstitution, for such person in such person's name, place and stead, in any and all capacities, to sign this report, and file the same, with all exhibits thereto, and other documents in connection therewith, with the Securities and Exchange Commission, granting unto said attorneys-in-fact and agents, full power and authority to do and perform each and every act and thing requisite and necessary to be done as fully to all intents and purposes as he might or could do in person, hereby ratifying and confirming all that said attorneys-in-fact and agents or any of them may lawfully do or cause to be done by virtue hereof.
Pursuant to the requirements of the Securities Exchange Act of 1934, as amended, this report has been signed below by the following persons in the capacities and on the dates indicated.
Name | Title | Date | ||
/S/ THOMAS S. SMITH, JR. | President and Chief Executive Officer (Principal Executive Officer) | August 20, 2014 | ||
Thomas S. Smith, Jr. | ||||
/S/ ROBERT M. POLLICHINO | Executive Vice President and Chief Financial Officer (Principal Financial Officer) | August 20, 2014 | ||
Robert M. Pollichino | ||||
/S/ JOSEPH F. YOSPE | Senior Vice President, Controller and Principal Accounting Officer | August 20, 2014 | ||
Joseph F. Yospe | ||||
/S/ JAMES L. DOLAN | Executive Chairman (Director) | August 20, 2014 | ||
James L. Dolan | ||||
/S/ CHARLES F. DOLAN | Director | August 20, 2014 | ||
Charles F. Dolan | ||||
/S/ CHARLES P. DOLAN | Director | August 20, 2014 | ||
Charles P. Dolan | ||||
/S/ KRISTIN A. DOLAN | Director | August 20, 2014 | ||
Kristin A. Dolan | ||||
/S/ THOMAS C. DOLAN | Director | August 20, 2014 | ||
Thomas C. Dolan | ||||
/S/ BRIAN G. SWEENEY | Director | August 20, 2014 | ||
Brian G. Sweeney | ||||
79
Name | Title | Date | ||
/S/ DEBORAH DOLAN-SWEENEY | Director | August 20, 2014 | ||
Deborah Dolan-Sweeney | ||||
/S/ MARIANNE DOLAN WEBER | Director | August 20, 2014 | ||
Marianne Dolan Weber | ||||
/S/ WILT HILDENBRAND | Director | August 20, 2014 | ||
Wilt Hildenbrand | ||||
/S/ ALAN D. SCHWARTZ | Director | August 20, 2014 | ||
Alan D. Schwartz | ||||
/S/ VINCENT TESE | Director | August 20, 2014 | ||
Vincent Tese | ||||
80
INDEX TO EXHIBITS
EXHIBIT NO. | DESCRIPTION | |
2.1 | Distribution Agreement between Cablevision Systems Corporation and Madison Square Garden, Inc. (incorporated by reference to Exhibit 2.1 to Amendment No. 7 to the Company's Registration Statement on Form 10 filed on January 14, 2010). | |
3.1 | Amended and Restated Certificate of Incorporation of Madison Square Garden, Inc. (incorporated by reference to Exhibit 99.1 to the Company's Current Report on Form 8-K filed on February 10, 2010). | |
3.1.A | Certificate of Ownership and Merger merging The Madison Square Garden Company with and into Madison Square Garden, Inc. (incorporated by reference to Exhibit 3.1 to the Company's Form 10-Q for the quarter ended March 31, 2011 filed on May 6, 2011). | |
3.2 | Amended By-Laws of The Madison Square Garden Company (incorporated by reference to Exhibit 3.2 to the Company's Form 10-Q for the quarter ended March 31, 2011 filed on May 6, 2011). | |
4.1 | Registration Rights Agreement by and among Madison Square Garden, Inc. and the Charles F. Dolan Children Trusts (incorporated by reference to Exhibit 3.5 to Amendment No. 7 to the Company's Registration Statement on Form 10 filed on January 14, 2010). | |
4.2 | Registration Rights Agreement by and among Madison Square Garden, Inc. and the Dolan Family Affiliates (incorporated by reference to Exhibit 3.6 to Amendment No. 7 to the Company's Registration Statement on Form 10 filed on January 14, 2010). | |
4.3 | Transfer Consent Agreement with NBA, dated February 9, 2010 (incorporated by reference to Exhibit 3.7 to Amendment No. 6 to the Company's Registration Statement on Form 10 filed on January 11, 2010). | |
4.4 | Transfer Consent Agreement with NHL, dated February 9, 2010 (incorporated by reference to Exhibit 3.8 to Amendment No. 6 to the Company's Registration Statement on Form 10 filed on January 11, 2010). | |
10.1 | Construction Management Agreement as of July 8, 2010 between MSG Holdings, L.P. and Turner Construction Company (incorporated by reference to Exhibit 10.1 to the Company's Current Report Form 8-K filed on July 9, 2010). | |
10.2 | Tax Disaffiliation Agreement between Cablevision Systems Corporation and Madison Square Garden, Inc., dated January 12, 2010 (incorporated by reference to Exhibit 10.2 to Amendment No. 5 to the Company's Registration Statement on Form 10 filed on December 24, 2009). | |
10.3 | Employee Matters Agreement between Cablevision Systems Corporation and Madison Square Garden, Inc., dated January 12, 2010 (incorporated by reference to Exhibit 10.3 to Amendment No. 6 to the Company's Registration Statement on Form 10 filed on January 11, 2010). | |
10.4 | Madison Square Garden, Inc. 2010 Employee Stock Plan (incorporated by reference to Exhibit 10.4 to Amendment No. 6 to the Company's Registration Statement on Form 10 filed on January 11, 2010).† | |
10.5 | Madison Square Garden, Inc. 2010 Cash Incentive Plan (incorporated by reference to Exhibit 10.5 to Amendment No. 6 to the Company's Registration Statement on Form 10 filed on January 11, 2010).† | |
10.6 | Madison Square Garden, Inc. 2010 Stock Plan for Non-Employee Directors (incorporated by reference to Exhibit 10.1 to the Company's Form 10-Q for the Quarter Ended March 31, 2010 filed on May 7, 2010).† | |
81
EXHIBIT NO. | DESCRIPTION | |
10.7 | Lease Agreement, between RCPI Trust and Radio City Productions LLC, relating to Radio City Music Hall, dated December 4, 1997 (incorporated by reference to Exhibit 10.7 to Amendment No. 4 to the Company's Registration Statement on Form 10 filed on November 4, 2009).+ | |
10.8 | First Amendment to Original Lease Agreement, dated December 4, 1997, between RCPI Trust and Radio City Productions LLC, dated February 19, 1999 (incorporated by reference to Exhibit 10.8 to Amendment No. 4 to the Company's Registration Statement on Form 10 filed on November 4, 2009). | |
10.9 | Second Amendment to Original Lease Agreement, dated December 4, 1997, between RCPI Landmark Properties, LLC and Radio City Productions LLC, dated November 6, 2002 (incorporated by reference to Exhibit 10.9 to Amendment No. 4 to the Company's Registration Statement on Form 10 filed on November 4, 2009).+ | |
10.10 | Third Amendment to Original Lease Agreement, dated December 4, 1997, between RCPI Landmark Properties, LLC and Radio City Productions LLC, dated August 14, 2008 (incorporated by reference to Exhibit 10.10 to Amendment No. 3 to the Company's Registration Statement on Form 10 filed on October 19, 2009).+ | |
10.11 | Fourth Amendment to Lease, dated January 24, 2011 between RCPI Landmark Properties, LLC and Radio City Productions LLC (incorporated by reference to Exhibit 10.11 to the Company's Form 10-K for the fiscal year ended December 31, 2010 filed on March 4, 2011).+ | |
10.12 | Restated Guaranty of Lease between Madison Square Garden, L.P. and RCPI Landmark Properties, LLC, dated August 14, 2008 (incorporated by reference to Exhibit 10.11 to Amendment No. 4 to the Company's Registration Statement on Form 10 filed on November 4, 2009).+ | |
10.13 | First Amendment to Restated Guaranty dated as of March 22, 2010 by and among RCPI Landmark Properties, LLC and Madison Square Garden, L.P. (incorporated by reference to Exhibit 10.1 to the Company's Form 10-Q for the quarter ended June 30, 2010 filed on August 6, 2010).+ | |
10.14 | Second Amendment to Restated Guaranty dated as of January 24, 2011 by and among RCPI Landmark Properties, LLC and Madison Square Garden, L.P. (incorporated by reference to Exhibit 10.14 to the Company's Form 10-K for the fiscal year ended December 31, 2010 filed on March 4, 2011). | |
10.15 | Affiliation Agreement between CSC Holdings, Inc. and Madison Square Garden, L.P. (incorporated by reference to Exhibit 10.12 to Amendment No. 6 to the Company's Registration Statement on Form 10 filed on January 11, 2010).+ | |
10.16 | Form of Madison Square Garden, Inc. Option Agreement in respect of Vested Cablevision Options granted on and prior to November 8, 2005 (incorporated by reference to Exhibit 10.13 to Amendment No. 6 to the Company's Registration Statement on Form 10 filed on January 11, 2010).† | |
10.17 | Form of Madison Square Garden, Inc. Rights Agreement (incorporated by reference to Exhibit 10.14 to Amendment No. 6 to the Company's Registration Statement on Form 10 filed on January 11, 2010).† | |
10.18 | Form of Madison Square Garden, Inc. Option Agreement in respect of Vested Cablevision Options granted on June 5, 2006 and October 19, 2006 (incorporated by reference to Exhibit 10.15 to Amendment No. 6 to the Company's Registration Statement on Form 10 filed on January 11, 2010).† | |
10.19 | Form of Madison Square Garden, Inc. Option Agreement in respect of Cablevision Options granted on January 20, 2009 (incorporated by reference to Exhibit 10.16 to Amendment No. 6 to the Company's Registration Statement on Form 10 filed on January 11, 2010).† | |
82
EXHIBIT NO. | DESCRIPTION | |
10.20 | Form of Madison Square Garden, Inc. Option Agreement in respect of Cablevision Options granted on March 5, 2009 (incorporated by reference to Exhibit 10.17 to Amendment No. 6 to the Company's Registration Statement on Form 10 filed on January 11, 2010).† | |
10.21 | Employment Agreement by and between Madison Square Garden, Inc. and James L. Dolan (incorporated by reference to Exhibit 10.18 to Amendment No. 5 to the Company's Registration Statement on Form 10 filed on December 24, 2009).† | |
10.22 | Employment Agreement by and between Madison Square Garden, Inc. and Hank J. Ratner (incorporated by reference to Exhibit 10.19 to Amendment No. 5 to the Company's Registration Statement on Form 10 filed on December 24, 2009).† | |
10.23 | Letter Agreement dated February 28, 2014 between The Madison Square Garden Company and Hank J. Ratner (incorporated by reference to Exhibit 10.1 to the Company's Current Report on Form 8-K filed on March 6, 2014).† | |
10.24 | Employment Agreement dated August 21, 2012 between The Madison Square Garden Company and Robert M. Pollichino (incorporated by reference to Exhibit 10.23 to the Company's Form 10-K for the fiscal year ended June 30, 2012 filed on August 24, 2012).† | |
10.25 | Retirement Agreement dated as of January 6, 2014 between The Madison Square Garden Company and Robert M. Pollichino (incorporated by reference to Exhibit 10.1 to the Company's Current Report on Form 8-K filed on January 6, 2014).† | |
10.26 | Consulting Agreement dated as of January 6, 2014 between The Madison Square Garden Company and Robert M. Pollichino (incorporated by reference to Exhibit 10.2 to the Company's Current Report on Form 8-K filed on January 6, 2014).† | |
10.27 | Employment Agreement dated August 21, 2012 between The Madison Square Garden Company and Lawrence J. Burian (incorporated by reference to Exhibit 10.24 to the Company's Form 10-K for the fiscal year ended June 30, 2012 filed on August 24, 2012).† | |
10.28 | Time Sharing Agreement between Dolan Family Office LLC and Madison Square Garden, Inc. (incorporated by reference to Exhibit 10.22 to Amendment No. 5 to the Company's Registration Statement on Form 10 filed on December 24, 2009). | |
10.29 | Employment Agreement dated March 4, 2014 between The Madison Square Garden Company and Tad Smith (incorporated by reference to Exhibit 10.2 to the Company's Current Report on Form 8-K filed on March 6, 2014).† | |
10.30 | Employment Agreement dated August 21, 2012 between The Madison Square Garden Company and Joseph F. Yospe (incorporated by reference to Exhibit 10.26 to the Company's Form 10-K for the fiscal year ended June 30, 2012 filed on August 24, 2012).† | |
10.31 | Employment Agreement dated August 5, 2014 between The Madison Square Garden Company and Sean R. Creamer (incorporated by reference to Exhibit 10.1 to the Company's Current Report on Form 8-K filed on August 5, 2014).† | |
10.32 | Credit Agreement dated as of May 6, 2014, by and among MSG Holdings, L.P., certain subsidiaries of MSG Holdings, L.P., JPMorgan Chase Bank, N.A., as administrative agent, collateral agent and a letter of credit issuer, and the lenders parties thereto (incorporated by reference to Exhibit 10.1 to the Company's Current Report on Form 8-K filed on May 6, 2014). | |
10.33 | Security Agreement dated as of May 6, 2014, by and among MSG Holdings, L.P., certain subsidiaries of MSG Holdings, L.P., other guarantors referred to therein and JP Morgan Chase Bank, N.A., as collateral agent (incorporated by reference to Exhibit 10.2 to the Company's Current Report on Form 8-K filed on May 6, 2014). | |
10.34 | Form of Non-Employee Director Award Agreement (incorporated by reference to Exhibit 10.2 to the Company's Form 10-Q for the quarter ended December 31, 2012 filed on February 6, 2013).† | |
83
EXHIBIT NO. | DESCRIPTION | |
10.35 | Form of Restricted Stock Units Agreement (incorporated by reference to Exhibit 10.32 to the Company's Form 10-K for the fiscal year ended June 30, 2013 filed on August 21, 2013).† | |
10.36 | Form of Performance Award Agreement (incorporated by reference to Exhibit 10.33 to the Company's Form 10-K for the fiscal year ended June 30, 2013 filed on August 21, 2013).† | |
10.37 | Form of Restricted Shares Agreement (incorporated by reference to Exhibit 10.30 to the Company's Form 10-K/A (Amendment No. 1) for the fiscal year ended December 31, 2009 filed on April 23, 2010).† | |
10.38 | The Madison Square Garden Company Policy Concerning Certain Matters Relating to AMC Networks Inc. including Responsibilities of Overlapping Directors and Officers (incorporated by reference to Exhibit 10.34 to the Company's Form 10-K for the fiscal year ended June 30, 2012 filed on August 24, 2012). | |
10.39 | Summary of Office Space Arrangement between MSG Holdings, L.P. and the Knickerbocker Group LLC (incorporated by reference to Exhibit 10.1 to the Company's Form 10-Q for the quarter ended March 31, 2013 filed on May 3, 2013). | |
10.40 | Formation, Contribution and Investment Agreement, dated as of August 30, 2013 among MSG Holdings, L.P., Entertainment Ventures, LLC, Azoff Music Management LLC, and, for certain purposes, Irving Azoff and Irving Azoff and Rochelle Azoff, as Co-Trustees of the Azoff Family Trust of 1997, dated May 27, 1997, as amended (incorporated by reference to Exhibit 99.1 to the Company's Current Report on Form 8-K filed on September 5, 2013). | |
10.41 | Purchase Agreement dated, April 3, 2014, between MSG Holdings, L.P. and SiTV Media, Inc. (incorporated by to Exhibit 99.1 to the Company's Current Report on Form 8-K filed on April 4, 2014). | |
21.1 | Subsidiaries of the Registrant. | |
23.1 | Consent of KPMG LLP. | |
24.1 | Powers of Attorney (included on the signature page to this Annual Report on Form 10-K). | |
31.1 | Certification by the Chief Executive Officer Pursuant to Section 302 of the Sarbanes-Oxley Act of 2002. | |
31.2 | Certification by the Chief Financial Officer Pursuant to Section 302 of the Sarbanes-Oxley Act of 2002. | |
32.1 | Certification by the Chief Executive Officer Pursuant to Section 906 of the Sarbanes-Oxley Act of 2002. | |
32.2 | Certification by the Chief Financial Officer Pursuant to Section 906 of the Sarbanes-Oxley Act of 2002. | |
101.INS | XBRL Instance Document. | |
101.SCH | XBRL Taxonomy Extension Schema. | |
101.CAL | XBRL Taxonomy Extension Calculation Linkbase. | |
101.DEF | XBRL Taxonomy Extension Definition Linkbase | |
101.LAB | XBRL Taxonomy Extension Label Linkbase. | |
101.PRE | XBRL Taxonomy Extension Presentation Linkbase | |
+ | Confidential treatment has been granted with respect to certain portions of this exhibit. Omitted portions have been filed separately with the Securities and Exchange Commission. |
† | This exhibit is a management contract or a compensatory plan or arrangement. |
84
INDEX TO CONSOLIDATED FINANCIAL STATEMENTS
Page | |
85
Report of Independent Registered Public Accounting Firm
The Board of Directors and Stockholders
The Madison Square Garden Company:
We have audited the accompanying consolidated balance sheets of The Madison Square Garden Company as of June 30, 2014 and 2013, and the related consolidated statements of operations, comprehensive income (loss), cash flows, and stockholders' equity for each of the years in the three-year period ended June 30, 2014. In connection with our audits of the consolidated financial statements, we also have audited the consolidated financial statement schedule (as listed in the index to Item 15). We also have audited The Madison Square Garden Company's internal control over financial reporting as of June 30, 2014, based on criteria established in Internal Control – Integrated Framework (1992) issued by the Committee of Sponsoring Organizations of the Treadway Commission (“COSO”). The Madison Square Garden Company's management is responsible for these consolidated financial statements, the consolidated financial statement schedule, for maintaining effective internal control over financial reporting, and for its assessment of the effectiveness of internal control over financial reporting, included in the accompanying Management's Report on Internal Control over Financial Reporting. Our responsibility is to express an opinion on these consolidated financial statements and the consolidated financial statement schedule and an opinion on the Company's internal control over financial reporting based on our audits.
We conducted our audits in accordance with the standards of the Public Company Accounting Oversight Board (United States). Those standards require that we plan and perform the audits to obtain reasonable assurance about whether the financial statements are free of material misstatement and whether effective internal control over financial reporting was maintained in all material respects. Our audits of the consolidated financial statements included examining, on a test basis, evidence supporting the amounts and disclosures in the financial statements, assessing the accounting principles used and significant estimates made by management, and evaluating the overall financial statement presentation. Our audit of internal control over financial reporting included obtaining an understanding of internal control over financial reporting, assessing the risk that a material weakness exists, and testing and evaluating the design and operating effectiveness of internal control based on the assessed risk. Our audits also included performing such other procedures as we considered necessary in the circumstances. We believe that our audits provide a reasonable basis for our opinions.
A company's internal control over financial reporting is a process designed to provide reasonable assurance regarding the reliability of financial reporting and the preparation of financial statements for external purposes in accordance with generally accepted accounting principles. A company's internal control over financial reporting includes those policies and procedures that (1) pertain to the maintenance of records that, in reasonable detail, accurately and fairly reflect the transactions and dispositions of the assets of the company; (2) provide reasonable assurance that transactions are recorded as necessary to permit preparation of financial statements in accordance with generally accepted accounting principles, and that receipts and expenditures of the company are being made only in accordance with authorizations of management and directors of the company; and (3) provide reasonable assurance regarding prevention or timely detection of unauthorized acquisition, use, or disposition of the company's assets that could have a material effect on the financial statements.
Because of its inherent limitations, internal control over financial reporting may not prevent or detect misstatements. Also, projections of any evaluation of effectiveness to future periods are subject to the risk that controls may become inadequate because of changes in conditions, or that the degree of compliance with the policies or procedures may deteriorate.
In our opinion, the consolidated financial statements referred to above present fairly, in all material respects, the financial position of The Madison Square Garden Company as of June 30, 2014 and 2013, and the results of its operations and its cash flows for each of the years in the three-year period ended June 30, 2014, in conformity with U.S. generally accepted accounting principles. Also in our opinion, the related consolidated financial statement schedule, when considered in relation to the basic consolidated financial statements taken as a whole, presents fairly, in all material respects, the information set forth therein. Also in our opinion, The Madison Square Garden Company maintained, in all material respects, effective internal control over financial reporting as of June 30, 2014, based on criteria established in Internal Control – Integrated Framework (1992) issued by COSO.
/s/ KPMG LLP
New York, New York
August 20, 2014
F-1
THE MADISON SQUARE GARDEN COMPANY
CONSOLIDATED BALANCE SHEETS
(in thousands, except per share data)
June 30, | |||||||
2014 | 2013 | ||||||
ASSETS | |||||||
Current Assets: | |||||||
Cash and cash equivalents | $ | 92,251 | $ | 277,913 | |||
Restricted cash | 9,823 | 8,413 | |||||
Accounts receivable, net | 135,369 | 145,728 | |||||
Net related party receivables | 25,156 | 18,565 | |||||
Prepaid expenses | 37,108 | 41,215 | |||||
Other current assets | 23,216 | 20,339 | |||||
Assets held for sale | 77,056 | — | |||||
Total current assets | 399,979 | 512,173 | |||||
Investments in and loans to nonconsolidated affiliates | 225,632 | — | |||||
Property and equipment, net | 1,252,467 | 1,135,180 | |||||
Amortizable intangible assets, net | 80,306 | 90,705 | |||||
Indefinite-lived intangible assets | 163,850 | 158,636 | |||||
Goodwill | 701,674 | 742,492 | |||||
Other assets | 102,053 | 93,028 | |||||
Total assets | $ | 2,925,961 | $ | 2,732,214 | |||
LIABILITIES AND STOCKHOLDERS' EQUITY | |||||||
Current Liabilities: | |||||||
Accounts payable | $ | 16,710 | $ | 16,006 | |||
Net related party payables | 283 | 283 | |||||
Accrued liabilities: | |||||||
Employee related costs | 102,097 | 70,663 | |||||
Other accrued liabilities | 173,003 | 221,405 | |||||
Deferred revenue | 300,937 | 237,537 | |||||
Liabilities held for sale | 11,171 | — | |||||
Total current liabilities | 604,201 | 545,894 | |||||
Defined benefit and other postretirement obligations | 75,728 | 59,726 | |||||
Other employee related costs | 61,284 | 45,370 | |||||
Other liabilities | 59,970 | 58,536 | |||||
Deferred tax liability | 520,334 | 543,753 | |||||
Total liabilities | 1,321,517 | 1,253,279 | |||||
Commitments and contingencies (Notes 11, 12 and 13) | |||||||
Stockholders' Equity: | |||||||
Class A Common stock, par value $0.01, 360,000 shares authorized; 63,606 and 63,268 shares outstanding as of June 30, 2014 and 2013, respectively | 639 | 639 | |||||
Class B Common stock, par value $0.01, 90,000 shares authorized; 13,589 shares outstanding as of June 30, 2014 and 2013 | 136 | 136 | |||||
Preferred stock, par value $0.01, 45,000 shares authorized; none outstanding | — | — | |||||
Additional paid-in capital | 1,081,055 | 1,070,764 | |||||
Treasury stock, at cost, 317 and 596 shares as of June 30, 2014 and 2013, respectively | (7,537 | ) | (14,179 | ) | |||
Retained earnings | 552,862 | 437,794 | |||||
Accumulated other comprehensive loss | (22,711 | ) | (16,219 | ) | |||
Total stockholders' equity | 1,604,444 | 1,478,935 | |||||
Total liabilities and stockholders' equity | $ | 2,925,961 | $ | 2,732,214 | |||
See accompanying notes to consolidated financial statements.
F-2
THE MADISON SQUARE GARDEN COMPANY
CONSOLIDATED STATEMENTS OF OPERATIONS
(in thousands, except per share data)
Years Ended June 30, | |||||||||||
2014 | 2013 | 2012 | |||||||||
Revenues (including related party revenues of $183,527, $169,706 and $169,532, respectively) | $ | 1,555,594 | $ | 1,340,818 | $ | 1,284,016 | |||||
Operating expenses: | |||||||||||
Direct operating (including related party expenses of $13,817, $12,870 and $12,704, respectively) | 899,383 | 691,029 | 714,362 | ||||||||
Selling, general and administrative (including related party expenses of $15,587, $13,700 and $11,411, respectively) | 365,148 | 309,568 | 304,624 | ||||||||
Depreciation and amortization (including impairments) | 106,950 | 89,132 | 87,503 | ||||||||
1,371,481 | 1,089,729 | 1,106,489 | |||||||||
Operating income | 184,113 | 251,089 | 177,527 | ||||||||
Other income (expense): | |||||||||||
Equity in loss of nonconsolidated affiliates | (1,323 | ) | — | — | |||||||
Interest income (including interest income from nonconsolidated affiliates of $589 for the year ended June 30, 2014) | 2,508 | 2,195 | 2,318 | ||||||||
Interest expense | (7,406 | ) | (7,917 | ) | (7,070 | ) | |||||
Miscellaneous | (1,346 | ) | 3,497 | 7,072 | |||||||
(7,567 | ) | (2,225 | ) | 2,320 | |||||||
Income from operations before income taxes | 176,546 | 248,864 | 179,847 | ||||||||
Income tax expense | (61,478 | ) | (106,482 | ) | (73,302 | ) | |||||
Net income | $ | 115,068 | $ | 142,382 | $ | 106,545 | |||||
Basic earnings per common share | $ | 1.49 | $ | 1.87 | $ | 1.42 | |||||
Diluted earnings per common share | $ | 1.47 | $ | 1.83 | $ | 1.38 | |||||
Weighted-average number of common shares outstanding: | |||||||||||
Basic | 77,142 | 76,268 | 74,938 | ||||||||
Diluted | 78,167 | 77,940 | 77,459 | ||||||||
See accompanying notes to consolidated financial statements.
F-3
THE MADISON SQUARE GARDEN COMPANY
CONSOLIDATED STATEMENTS OF COMPREHENSIVE INCOME (LOSS)
(in thousands)
Years Ended June 30, | ||||||||||||||||||||||||
2014 | 2013 | 2012 | ||||||||||||||||||||||
Net income | $ | 115,068 | $ | 142,382 | $ | 106,545 | ||||||||||||||||||
Other comprehensive income (loss), before income taxes: | ||||||||||||||||||||||||
Pension plans and postretirement plan: | ||||||||||||||||||||||||
Net unamortized gains (losses) arising during the period | $ | (12,574 | ) | $ | 6,744 | $ | (8,772 | ) | ||||||||||||||||
Prior service credit due to plan amendment | — | — | 331 | |||||||||||||||||||||
Amortization of net actuarial loss included in net periodic benefit cost | 1,426 | 2,100 | 2,021 | |||||||||||||||||||||
Amortization of net prior service credit included in net periodic benefit cost | (126 | ) | $ | (11,274 | ) | (139 | ) | $ | 8,705 | (150 | ) | $ | (6,570 | ) | ||||||||||
Net changes related to available-for-sale securities | — | 5,087 | (8,961 | ) | ||||||||||||||||||||
Other comprehensive income (loss), before income taxes | (11,274 | ) | 13,792 | (15,531 | ) | |||||||||||||||||||
Income tax benefit (expense) related to items of other comprehensive income (loss) | 4,782 | (5,849 | ) | 6,602 | ||||||||||||||||||||
Other comprehensive income (loss) | (6,492 | ) | 7,943 | (8,929 | ) | |||||||||||||||||||
Comprehensive income | $ | 108,576 | $ | 150,325 | $ | 97,616 | ||||||||||||||||||
See accompanying notes to consolidated financial statements.
F-4
THE MADISON SQUARE GARDEN COMPANY
CONSOLIDATED STATEMENTS OF CASH FLOWS
(in thousands)
Years Ended June 30, | |||||||||||
2014 | 2013 | 2012 | |||||||||
Cash flows from operating activities: | |||||||||||
Net income | $ | 115,068 | $ | 142,382 | $ | 106,545 | |||||
Adjustments to reconcile net income to net cash provided by operating activities: | |||||||||||
Depreciation and amortization (including impairments) | 106,950 | 89,132 | 87,503 | ||||||||
Impairment of deferred costs | — | 4,982 | — | ||||||||
Amortization of deferred financing costs | 2,519 | 2,180 | 2,180 | ||||||||
Share-based compensation expense related to equity classified awards | 21,750 | 15,296 | 18,316 | ||||||||
Excess tax benefit on share-based awards | (6,659 | ) | (8,317 | ) | (6,998 | ) | |||||
Gain on sale of investment | — | (3,130 | ) | — | |||||||
Equity in loss of nonconsolidated affiliates | 1,323 | — | — | ||||||||
Provision for doubtful accounts | 21 | (228 | ) | 568 | |||||||
Change in assets and liabilities: | |||||||||||
Accounts receivable, net | (11,469 | ) | (18,935 | ) | (9,120 | ) | |||||
Net related party receivables | (7,182 | ) | 8,712 | (4,690 | ) | ||||||
Prepaid expenses and other assets | (10,169 | ) | (14,204 | ) | (1,078 | ) | |||||
Accounts payable | 704 | (14,743 | ) | 17,339 | |||||||
Net related party payables | 184 | (79 | ) | 362 | |||||||
Accrued and other liabilities | 80,991 | 29,564 | 45,073 | ||||||||
Deferred revenue | 64,092 | 24,920 | 55,592 | ||||||||
Deferred income taxes | (15,568 | ) | 5,523 | 21,781 | |||||||
Net cash provided by operating activities | 342,555 | 263,055 | 333,373 | ||||||||
Cash flows from investing activities: | |||||||||||
Capital expenditures | (306,389 | ) | (229,497 | ) | (401,424 | ) | |||||
Proceeds from sale of investment | — | 44,136 | — | ||||||||
Proceeds from renovation loan (Note 9) | 18,000 | — | — | ||||||||
Payments for acquisition of assets | (1,499 | ) | — | (27,657 | ) | ||||||
Investments in and loans to nonconsolidated affiliates | (226,510 | ) | — | — | |||||||
Net cash used in investing activities | (516,398 | ) | (185,361 | ) | (429,081 | ) | |||||
Cash flows from financing activities: | |||||||||||
Principal payments on capital lease obligations | (257 | ) | (272 | ) | (864 | ) | |||||
Additions to deferred financing costs | (6,718 | ) | — | — | |||||||
Acquisition of restricted shares | — | — | (11,768 | ) | |||||||
Proceeds from stock option exercises | 863 | 6,822 | 2,966 | ||||||||
Taxes paid in lieu of shares issued for equity-based compensation | (12,366 | ) | (21,148 | ) | — | ||||||
Excess tax benefit on share-based awards | 6,659 | 8,317 | 6,998 | ||||||||
Net cash used in financing activities | (11,819 | ) | (6,281 | ) | (2,668 | ) | |||||
Net increase (decrease) in cash and cash equivalents | (185,662 | ) | 71,413 | (98,376 | ) | ||||||
Cash and cash equivalents at beginning of period | 277,913 | 206,500 | 304,876 | ||||||||
Cash and cash equivalents at end of period | $ | 92,251 | $ | 277,913 | $ | 206,500 | |||||
Supplemental Data: | |||||||||||
Income taxes paid, net | $ | 105,997 | $ | 82,444 | $ | 12,995 | |||||
Interest paid for capital lease obligations | 205 | 281 | 358 | ||||||||
Non-cash investing and financing activities: | |||||||||||
Capital expenditures incurred but not yet paid | 14,540 | 54,837 | 59,666 | ||||||||
Asset retirement obligations | (5,027 | ) | 6,700 | 15,998 | |||||||
Leasehold improvements paid by landlord and other non-cash additions to property and equipment | — | 978 | 1,540 | ||||||||
Acquisition of assets not yet paid | 3,715 | — | — | ||||||||
See accompanying notes to consolidated financial statements.
F-5
THE MADISON SQUARE GARDEN COMPANY
CONSOLIDATED STATEMENTS OF STOCKHOLDERS' EQUITY
(in thousands)
Common Stock Issued | Additional Paid-In Capital | Treasury Stock | Retained Earnings | Accumulated Other Comprehensive Income (Loss) | Total | ||||||||||||||||||
Balance as of June 30, 2011 | $ | 761 | $ | 1,041,769 | $ | (10,279 | ) | $ | 188,867 | $ | (15,233 | ) | $ | 1,205,885 | |||||||||
Net income | — | — | — | 106,545 | — | 106,545 | |||||||||||||||||
Other comprehensive loss | — | — | — | — | (8,929 | ) | (8,929 | ) | |||||||||||||||
Comprehensive income | 97,616 | ||||||||||||||||||||||
Exercise of options | 3 | 2,963 | — | — | — | 2,966 | |||||||||||||||||
Share-based compensation expense | — | 18,316 | — | — | — | 18,316 | |||||||||||||||||
Treasury stock acquired from acquisition of restricted shares | — | — | (11,768 | ) | — | — | (11,768 | ) | |||||||||||||||
Excess tax benefit on share-based awards | — | 6,998 | — | — | — | 6,998 | |||||||||||||||||
Balance as of June 30, 2012 | $ | 764 | $ | 1,070,046 | $ | (22,047 | ) | $ | 295,412 | $ | (24,162 | ) | $ | 1,320,013 | |||||||||
Net income | — | — | — | 142,382 | — | 142,382 | |||||||||||||||||
Other comprehensive income | — | — | — | — | 7,943 | 7,943 | |||||||||||||||||
Comprehensive income | 150,325 | ||||||||||||||||||||||
Exercise of options | 11 | 6,799 | 12 | — | — | 6,822 | |||||||||||||||||
Share-based compensation expense | — | 15,296 | — | — | — | 15,296 | |||||||||||||||||
Tax withholding associated with shares issued for equity-based compensation | — | (21,148 | ) | — | — | — | (21,148 | ) | |||||||||||||||
Shares issued upon Restricted Stock Units vesting | — | (7,856 | ) | 7,856 | — | — | — | ||||||||||||||||
Excess tax benefit on share-based awards, net | — | 7,627 | — | — | — | 7,627 | |||||||||||||||||
Balance as of June 30, 2013 | $ | 775 | $ | 1,070,764 | $ | (14,179 | ) | $ | 437,794 | $ | (16,219 | ) | $ | 1,478,935 | |||||||||
Net income | — | — | — | 115,068 | — | 115,068 | |||||||||||||||||
Other comprehensive loss | — | — | — | — | (6,492 | ) | (6,492 | ) | |||||||||||||||
Comprehensive income | 108,576 | ||||||||||||||||||||||
Exercise of options | — | (89 | ) | 979 | — | — | 890 | ||||||||||||||||
Share-based compensation expense | — | 21,750 | — | — | — | 21,750 | |||||||||||||||||
Tax withholding associated with shares issued for equity-based compensation | — | (12,366 | ) | — | — | — | (12,366 | ) | |||||||||||||||
Excess tax benefit on share-based awards | — | 6,659 | — | — | — | 6,659 | |||||||||||||||||
Shares issued upon Restricted Stock Units vesting | — | (5,663 | ) | 5,663 | — | — | — | ||||||||||||||||
Balance as of June 30, 2014 | $ | 775 | $ | 1,081,055 | $ | (7,537 | ) | $ | 552,862 | $ | (22,711 | ) | $ | 1,604,444 | |||||||||
See accompanying notes to consolidated financial statements.
F-6
THE MADISON SQUARE GARDEN COMPANY
NOTES TO CONSOLIDATED FINANCIAL STATEMENTS
All amounts included in the following Notes to Consolidated Financial Statements are presented in thousands, except per share data or as otherwise noted.
Note 1. Description of Business
The Madison Square Garden Company (together with its subsidiaries, the “Company” or “Madison Square Garden”) is a fully integrated sports, entertainment and media business. The Company classifies its business interests into three reportable segments: MSG Media, MSG Entertainment, and MSG Sports. MSG Media produces, develops and acquires content for multiple distribution platforms, including content originating from the Company's venues, and is comprised of the Company's regional sports networks, MSG Network and MSG+, collectively the “MSG Networks.” For all periods presented, MSG Media also included Fuse, a national television network dedicated to music, which was sold on July 1, 2014 (see Note 23). MSG Entertainment presents or hosts live entertainment events, such as concerts, family shows, performing arts and special events, in the Company's diverse collection of venues. MSG Entertainment also creates, produces and/or presents live productions, including the Radio City Christmas Spectacular featuring the Radio City Rockettes (the “Rockettes”), that are performed in the Company's and other venues. MSG Sports owns and operates the following sports franchises: the New York Knicks (the “Knicks”) of the National Basketball Association (the “NBA”), the New York Rangers (the “Rangers”) of the National Hockey League (the “NHL”), the New York Liberty (the “Liberty”) of the Women's National Basketball Association (the “WNBA”), the Hartford Wolf Pack of the American Hockey League (the “AHL”), which is the primary player development team for the Rangers, and the Westchester Knicks, an NBA Development League (the “NBADL”) team. MSG Sports also promotes, produces and/or presents a broad array of other live sporting events outside of Knicks, Rangers and Liberty games.
The Company conducts a significant portion of its operations at venues that it either owns or operates under long-term leases. The Company owns the Madison Square Garden Arena (“The Garden”) and The Theater at Madison Square Garden in New York City, the Forum in Inglewood, CA and The Chicago Theatre in Chicago. In addition, the Company leases Radio City Music Hall and the Beacon Theatre in New York City, and has a booking agreement with respect to the Wang Theatre in Boston.
The Company was incorporated on July 29, 2009 as an indirect, wholly-owned subsidiary of Cablevision Systems Corporation (“Cablevision”). On February 9, 2010, Cablevision distributed all of the outstanding common stock of The Madison Square Garden Company to Cablevision shareholders (the “Distribution”) and the Company thereafter acquired the subsidiaries of Cablevision that owned, directly and indirectly, all of the partnership interests in MSG Holdings, L.P. (“MSG L.P.”). MSG L.P. was the indirect, wholly-owned subsidiary of Cablevision through which Cablevision held the Company's businesses until the Distribution occurred. MSG L.P. is now a wholly-owned subsidiary of The Madison Square Garden Company through which the Company conducts substantially all of its business activities.
Note 2. Summary of Significant Accounting Policies
Principles of Consolidation
The consolidated financial statements of the Company include the accounts of The Madison Square Garden Company and its subsidiaries. All significant intercompany transactions and balances have been eliminated in consolidation.
Use of Estimates
The preparation of the accompanying consolidated financial statements in conformity with generally accepted accounting principles in the United States (“GAAP”) requires management to make estimates and assumptions about future events. These estimates and the underlying assumptions affect the amounts of assets and liabilities reported, disclosures about contingent assets and liabilities, and reported amounts of revenues and expenses. Such estimates include the valuation of accounts receivable, goodwill, intangible assets, other long-lived assets, tax accruals and other liabilities. In addition, estimates are used in revenue recognition, revenue sharing expense (net of escrow), luxury tax expense, income tax expense, performance and share-based compensation, depreciation and amortization, litigation matters and other matters. Management believes its use of estimates in the consolidated financial statements to be reasonable.
Management evaluates its estimates on an ongoing basis using historical experience and other factors, including the general economic environment and actions it may take in the future. The Company adjusts such estimates when facts and circumstances dictate. However, these estimates may involve significant uncertainties and judgments and cannot be determined with precision. In addition, these estimates are based on management's best judgment at a point in time and as such these estimates may ultimately differ from actual results. Changes in estimates resulting from weakness in the economic environment or other
F-7
THE MADISON SQUARE GARDEN COMPANY
NOTES TO CONSOLIDATED FINANCIAL STATEMENTS
(Continued)
factors beyond the Company's control could be material and would be reflected in the Company's financial statements in future periods.
Revenue Recognition
MSG Media
The Company's MSG Media segment earns affiliation fee revenue from cable television systems and satellite, telephone and other multichannel video programming distributors that carry the Company's programming services. The programming service is delivered throughout the term of the agreements and the Company recognizes this revenue in the period that the programming service is provided.
MSG Media also earns advertising revenues, which are typically recognized when the advertisements are aired. In certain advertising sales arrangements, the Company's MSG Media business guarantees specified viewer ratings for their programming. For these types of transactions, a portion of such revenue is deferred if the guaranteed viewer ratings are not met and is subsequently recognized either when the Company provides the required additional advertising time, the guarantee obligation contractually expires or additional performance requirements become remote.
MSG Entertainment
The Company's MSG Entertainment segment earns revenues from the sale of tickets for events that the Company produces or promotes/co-promotes. In addition, for entertainment events held at the Company's venues that MSG Entertainment does not produce or promote/co-promote, revenues are earned for venue license fees from the third-party promoters of the event. Event-related revenues from the sale of tickets, venue license fees from third-party promoters, sponsorships, concessions and merchandise are recognized when the event occurs. Amounts collected in advance of an event are recorded as deferred revenue and are recognized as revenues when earned.
Revenues from the sale of advertising in the form of venue signage and sponsorships, which are not related to any specific event, are recorded and recognized ratably over the period of benefit of the respective agreements.
Revenues from the rental of The Garden's suites are recognized ratably over the period of benefit of the respective agreements for the benefit of the Company's MSG Entertainment and MSG Sports segments.
MSG Sports
The Knicks, Rangers and Liberty derive revenues principally from ticket sales and distributions of league-wide national television contracts and other league-wide revenue sources, which are recognized over the respective team's season. Event-related revenues from other live sporting events, including the sale of tickets, venue license fees earned in connection with other live sporting events that the Company does not produce or promote, sponsorships, concessions and merchandise are recognized when the event occurs. Amounts collected in advance of an event are recorded as deferred revenue and are recognized as revenues when earned. Local media rights revenue recognized by MSG Sports for the licensing of team-related programming to the Company's MSG Media segment are generally recognized on a straight-line basis over the fiscal year and are eliminated in consolidation.
Revenues from the sale of advertising in the form of venue signage and sponsorships, which are not related to any specific event, are recognized ratably over the period of benefit of the respective agreements.
Revenues from the rental of The Garden's suites are recognized ratably over the period of benefit of the respective agreements for the benefit of the Company's MSG Sports and MSG Entertainment segments.
Multiple-Deliverable Transactions
The Company has various types of multiple-deliverable arrangements, including multi-year sponsorship agreements. The deliverables included in each sponsorship agreement vary and may include suite licenses, event tickets and various media and advertising benefits, which include items such as, but not limited to, signage at The Garden and the Company's other venues. The timing of revenue recognition for each deliverable is dependent upon meeting the revenue recognition criteria for the respective deliverable.
The Company allocates revenue to each deliverable within the arrangement based on its relative selling price. For many deliverables in an arrangement, such as event tickets and certain advertising benefits, the Company has vendor specific
F-8
THE MADISON SQUARE GARDEN COMPANY
NOTES TO CONSOLIDATED FINANCIAL STATEMENTS
(Continued)
objective evidence (“VSOE”) of selling price as it typically sells the same or similar deliverables regularly on a stand-alone basis. Absent VSOE the Company considers whether third party evidence (“TPE”) is available; however, in most instances TPE is not available. The Company's process for determining its estimated selling prices for deliverables without VSOE or TPE involves management's judgment and considers multiple factors including company specific and market specific factors that may vary depending upon the unique facts and circumstances related to each deliverable. Key factors considered by the Company in developing a best estimate of selling price for deliverables include, but are not limited to, prices charged for similar deliverables, the Company's ongoing pricing strategy and policies, and consideration of pricing of similar deliverables sold in other multiple-deliverable agreements.
Gross versus Net Revenue Recognition
The Company reports revenue on a gross or net basis based on management's assessment of whether the Company acts as a principal or agent in the transaction. To the extent the Company acts as the principal, revenue is reported on a gross basis. The determination of whether the Company acts as a principal or an agent in a transaction is based on an evaluation of several qualitative factors, including for co-promotions where we have a 50% or lower economic interest. Generally, when the Company is the promoter or co-promoter of an event the Company reports revenue on a gross basis. When the Company acts as an agent, revenue is reported on a net basis.
Nonmonetary Transactions
The Company enters into nonmonetary transactions that involve the exchange of goods or services, such as advertising and promotional benefits as well as tickets, for other goods or services. Such transactions are measured and recorded at the fair value of the goods or services surrendered unless the goods or services received have a more readily determinable fair value. In addition, the Company enters into other monetary transactions in which nonmonetary consideration is also included and the entire transaction is recorded at fair value. If the fair values cannot be determined for either the asset(s) surrendered or received within reasonable limits, then the nonmonetary transaction is measured and recorded at the book value of the item(s) surrendered which typically is zero.
Direct Operating Expenses
Direct operating expenses include, but are not limited to, compensation expense for the Company's professional sports teams' players and certain other team personnel, as well as league assessments for the MSG Sports segment; event costs related to the presentation and production of the Company's live entertainment and sporting events; network programming costs; and venue lease, maintenance and other operating expenses.
Player Costs and Other Team Personnel Transactions, NBA Luxury Tax, Escrow System/Revenue Sharing and League Assessments for the MSG Sports Segment
Player Costs and Other Team Personnel Transactions
Costs incurred to acquire player contracts, including signing bonuses, are deferred and amortized over the applicable NBA or NHL regular season on a straight-line basis over the fixed contract period of the respective player. The NBA and NHL seasons are typically from November through April and October through April, respectively. Player salaries are also expensed over the applicable NBA, NHL or WNBA regular season typically on a straight-line basis. In certain player contracts the annual contractual salary amounts (including any applicable signing bonuses) may fluctuate such that expensing the salary for the entire contract on a straight-line basis over each regular season more appropriately reflects the economic benefit of the services provided.
In instances where a player sustains what is deemed to be a season-ending or career-ending injury, a provision is recorded, when that determination can be reasonably made, for the remainder of the player's seasonal or contractual salary and related costs, together with any associated NBA luxury tax, net of any anticipated insurance recoveries. When players are traded, waived or contracts are terminated, any remaining unamortized signing bonuses are expensed to current operations. Amounts due to these individuals are generally paid over their remaining contract terms. Team personnel contract termination costs are recognized in the period in which those events occur. See Note 6 for further discussion of significant team personnel transactions.
The NBA and NHL each have collective bargaining agreements (“CBA”) with the respective league's players association, to which the Company is subject. The NBA CBA expires after the 2020-21 season (although the NBA and the National Basketball Players Association (“NBPA”) each have the right to terminate the CBA following the 2016-17 season). The NHL CBA expires
F-9
THE MADISON SQUARE GARDEN COMPANY
NOTES TO CONSOLIDATED FINANCIAL STATEMENTS
(Continued)
on September 15, 2022 (although the NHL and National Hockey League Players’ Association (“NHLPA”) each have the right to terminate the CBA effective following the 2019-20 season).
The NBA CBA contains a “soft” salary cap (i.e., a cap on each team's aggregate player salaries but with certain exceptions that enable teams to pay more, sometimes substantially more, than the cap). The NHL CBA provides for a “hard” salary cap (i.e., teams may not exceed a stated maximum that has been negotiated for the 2012-13 and 2013-14 seasons and is adjusted each season thereafter based upon league-wide revenues).
NBA Luxury Tax
Amounts in this paragraph are in thousands, except for luxury tax rates.
The NBA CBA provides for a luxury tax that is applicable to all teams with aggregate player salaries exceeding a threshold that is set prior to each season based upon projected league-wide revenues (as defined under the CBA). A team's luxury tax for the 2011-12 and 2012-13 seasons generally equaled the amount by which the team's aggregate player salaries exceeded such threshold. Beginning with the 2013-14 season, the tax rates for teams with aggregate player salaries above such threshold start at $1.50 for each $1.00 of team salary above the threshold up to $5,000 and scale up to $3.25 for each $1.00 of team salary that is from $15,000 to $20,000 over the threshold, and an additional tax rate increment of $0.50 applies for each additional $5,000 (or part thereof) of team salary in excess of $20,000 over the threshold. In addition, for teams that are taxpayers in at least four of any five seasons beginning in 2011-12, the above tax rates are increased by $1.00 for each increment. Beginning with the 2012-13 season, 50% of the aggregate luxury tax payments are to be used as a funding source for the revenue sharing plan and the remaining 50% of such payments will be distributed in equal shares to non-taxpaying teams. The Company recognizes the estimated amount associated with luxury tax expense or the amount it expects to receive as a non-tax paying team, if applicable, on a straight-line basis over the NBA regular season as a component of direct operating expenses.
NBA and NHL Escrow System/Revenue Sharing
The NBA CBA also provides that players collectively receive a designated percentage of league-wide revenues (net of certain direct expenses) as compensation (approximately 50%), and the teams retain the remainder. The percentage of league-wide revenues paid as compensation and retained by the teams does not apply evenly across all teams and accordingly the Company may pay its players a higher or lower portion of the Knicks' revenues than other NBA teams. Throughout each season, NBA teams withhold 10% of each player's salary and contribute the withheld amounts to an escrow account. If the league's aggregate player compensation exceeds the designated percentage of league-wide revenues, some or all of such escrowed amounts are distributed equally to all NBA teams. In the event that the league's aggregate player compensation is below the designated percentage of league-wide revenues, the teams will remit the shortfall to the NBPA for distribution to the players. The NBA also has instituted a revenue sharing plan that generally requires the distribution of a pool of funds to teams with below-average net revenues (as defined in the plan), subject to reduction or elimination based on individual team market size and profitability. The plan is funded by a combination of disproportionate contributions from teams with above-average net revenues, subject to certain profit-based limits (each as defined in the plan); aggregate league-wide luxury tax proceeds (100% of proceeds for the 2011-12 season, 50% of proceeds for all seasons beginning with the 2012-13 season) (see above); and, beginning with the 2012-13 season, collective league sources, if necessary. Additional amounts may also be distributed on a discretionary basis, funded by assessments on playoff ticket revenues and through collective league sources.
The NHL CBA provides that each season the players receive as player compensation 50% of that season's league-wide revenues, excluding the impact of agreed-upon aggregate transition payments of $300,000 to be paid on a deferred basis over three years beginning in 2014. Because the percentage to be paid to the players is based upon league-wide revenues and not on a team-by-team basis, the Company may pay its players a higher or lower portion of the Rangers' revenues than other NHL teams pay of their own revenues. In order to implement the salary cap system, NHL teams withhold a portion of each player's salary and contribute the withheld amounts to an escrow account. If the league's aggregate player compensation for a season exceeds the designated percentage (50%) of that season's league-wide revenues, the excess is retained by the league. For the shortened 2012-13 season, any such excess funds will be utilized or distributed by the NHL in its sole discretion. Beginning with the 2013-14 season, any such excess funds will be distributed to all teams in equal shares.
The NHL CBA provides for a revenue sharing plan which generally requires the distribution of a pool of funds approximating 6.055% of league-wide revenues to certain qualifying lower-revenue teams. Under the NHL CBA, the pool is funded as follows: (a) 50% from contributions by the top ten revenue earning teams (based on preseason and regular season revenues) in accordance with a formula; (b) then from payments by teams participating in the playoffs, with each team contributing 35% of its gate receipts for each home playoff game; and (c) the remainder from centrally-generated NHL sources. The Rangers are
F-10
THE MADISON SQUARE GARDEN COMPANY
NOTES TO CONSOLIDATED FINANCIAL STATEMENTS
(Continued)
consistently among the top ten revenue teams and, accordingly, have consistently contributed to the top ten revenue teams component of the plan.
The Company recognizes the amount of its estimated revenue sharing expense associated with the preseason and regular season, net of the amount the Company expects to receive from the escrow on a straight-line basis, over the applicable NBA and NHL seasons as a component of direct operating expenses. In years when the Knicks or Rangers participate in the playoffs, the Company recognizes its estimate of the playoff revenue sharing contribution in the periods when the playoffs occur.
League Assessments
As members of the NBA and NHL, the Knicks and Rangers, respectively, are also subject to annual league assessments. The governing bodies of each league determine the amount of each season's league assessments that are required from each member team. The Company recognizes its teams' estimated league assessments on a straight-line basis over the applicable NBA or NHL season.
Production Costs for the MSG Entertainment Segment
The Company defers certain costs of productions such as creative design costs, scenery, wardrobes, rehearsal and other related costs for the Company's proprietary shows. Deferred production costs are amortized on a straight-line basis over the course of a production's performance period using the expected life of a show's assets, which generally is 5 years. Deferred production costs are subject to recoverability assessments whenever there is an indication of potential impairment. The Company has approximately $58,279 and $37,780 of net deferred production costs recorded within other current assets and other assets in the accompanying consolidated balance sheets as of June 30, 2014 and 2013, respectively.
Network Programming Costs for the MSG Media Segment
For the MSG Networks, the professional team rights acquired under license agreements to telecast various sporting events and other programming for exhibition on its networks are typically expensed on a straight-line basis over the term of the applicable contract or license period. Local media rights expense recognized by MSG Media for the licensing of team-related programming from the Company's MSG Sports segment is generally recognized on a straight-line basis over the fiscal year and is eliminated in consolidation.
In addition to professional team rights, the MSG Media segment also acquires the rights to carry and/or produce other events or programming, such as other sporting events, movies, concerts or specials. Acquired programming rights are stated at the lower of amortized cost or net realizable value. Programming rights and the obligations acquired under license agreements are recorded at the gross amount of the liabilities when the license period has begun, the cost of each program is known or determinable, and the program is accepted and available for airing. Costs are amortized over the license period or projected useful life of the programming as the economic benefits are received. On a quarterly basis the Company reviews the programming usefulness of its program rights and if it determines that the programming has no future usefulness and will no longer be aired, an impairment of the portion of the unamortized cost of the license agreement is recorded in direct operating expenses.
Certain owned original programming is produced for the Company's networks by independent production companies. Owned original programming costs are expensed as incurred.
Advertising Expenses
Advertising costs are typically charged to expense when incurred, however, advertising for productions such as the Radio City Christmas Spectacular and other live entertainment events are deferred within interim periods and expensed, over the run of the show, but by no later than the end of the fiscal year. Total advertising costs classified in direct operating and selling, general and administrative expenses were $43,967, $33,635 and $34,492 for the years ended June 30, 2014, 2013 and 2012, respectively.
Income Taxes
The Company's provision for income taxes is based on current period income, changes in deferred tax assets and liabilities and changes in estimates with regard to uncertain tax positions. Deferred tax assets are subject to an ongoing assessment of realizability. In assessing the realizability of deferred tax assets, management considers whether it is more likely than not that some portion or all of the deferred tax asset will not be realized. The Company's ability to realize its deferred tax assets depends upon the generation of sufficient future taxable income to allow for the realization of its deductible temporary differences. If such estimates and related assumptions change in the future, the Company may be required to record valuation allowances
F-11
THE MADISON SQUARE GARDEN COMPANY
NOTES TO CONSOLIDATED FINANCIAL STATEMENTS
(Continued)
against its deferred tax assets, resulting in additional income tax expense in the Company's consolidated statements of operations. The Company measures its deferred tax liability with regard to MSG L.P. based on the difference between the tax basis and the carrying amount for financial reporting purposes; this is commonly referred to as the outside basis difference. Interest and penalties, if any, associated with uncertain tax positions are included in income tax expense. The Company accounts for investment tax credits using the “flow-through” method, under which the tax benefit generated from an investment tax credit is recorded in the period the credit is generated.
Share-based Compensation
The Company measures the cost of employee services received in exchange for an award of equity-based instruments based on the grant date fair value of the award. Share-based compensation cost is recognized in earnings (net of estimated forfeitures) over the period during which an employee is required to provide service in exchange for the award, except for restricted stock units granted to non-employee directors which, unless otherwise provided under the applicable award agreement, are fully vested, and are expensed at the grant date. The Company estimates forfeitures based upon historical experience and its expectations regarding future vesting of awards. To the extent actual forfeitures are different from the Company's estimates, share-based compensation is adjusted accordingly.
Cash and Cash Equivalents
The Company considers the balance of its investment in funds that substantially hold highly liquid securities that mature within three months or less from the date the fund purchases these securities to be cash equivalents. The carrying amount of cash and cash equivalents either approximates fair value due to the short-term maturity of these instruments or are at fair value. Checks outstanding in excess of related book balances are included in accounts payable in the accompanying consolidated balance sheets. The Company presents the change in these book cash overdrafts as cash flows from operating activities.
Restricted Cash
Restricted cash as of June 30, 2014 and 2013 primarily consist of cash required to be withheld from player salaries and deposited in an escrow account which is in the name of the Company pursuant to the NHL CBA. The escrow account will be distributed subsequent to the end of the season to the players and NHL teams based on the provisions of the NHL CBA. The carrying amount of restricted cash approximates fair value due to the short-term maturity of these instruments. Changes in restricted cash are reflected in cash flows from either operating or investing activities, depending on the circumstances to which the changes in the underlying restricted cash relate.
Accounts Receivable
Accounts receivable is recorded at net realizable value. The Company maintains an allowance for doubtful accounts to reserve for potentially uncollectible receivables. The allowance for doubtful accounts is estimated based on the Company's analysis of receivables aging, specific identification of certain receivables that are at risk of not being paid, past collection experience and other factors. The Company's allowance for doubtful accounts was $683 and $1,729 as of June 30, 2014 and 2013, respectively.
Investments in Nonconsolidated Affiliates
The Company's investments in nonconsolidated affiliates are accounted for using the equity method of accounting and are carried at cost, plus or minus the Company’s share of net earnings or losses of the investment, subject to certain other adjustments. The cost of equity method investments includes transaction costs of the acquisition. The Company’s share of net earnings or losses of the investment, inclusive of amortization expense for intangible assets associated with the investment, is reflected in equity in earnings (loss) of nonconsolidated affiliates on the Company’s consolidated statements of operations. Dividends received from the investee reduce the carrying amount of the investment. Due to the timing of receiving financial information from its nonconsolidated affiliates, the Company records its share of net earnings or losses of such affiliates on a three-month lag basis, with the exception of the amortization expense of intangible assets which are recorded currently.
Impairment of Investments
The Company reviews its investments at least quarterly to determine whether a decline in fair value below the cost basis is other-than-temporary. The primary factors the Company considers in its determination are the length of time that the fair value of the investment is below the Company’s carrying value; future prospects of the investee; and the Company’s intent and ability to hold the security for a period of time sufficient to allow for any anticipated recovery in fair value. In addition, the Company
F-12
THE MADISON SQUARE GARDEN COMPANY
NOTES TO CONSOLIDATED FINANCIAL STATEMENTS
(Continued)
considers other factors such as general market conditions, industry conditions, and analysts’ ratings. If the decline in fair value is deemed to be other-than-temporary, the cost basis of the investment is written down to fair value and the loss is realized as a component of net income.
Long-Lived and Indefinite-Lived Assets
The Company's long-lived and indefinite-lived assets consist of property and equipment, goodwill, indefinite-lived intangible assets and amortizable intangible assets.
Property and equipment is stated at cost. Equipment under capital leases is recorded at the present value of the total minimum lease payments. Depreciation is calculated on a straight-line basis over the estimated useful lives of the assets or, with respect to equipment under capital leases and leasehold improvements, amortized over the shorter of the lease term or the asset's estimated useful life. The useful lives of the Company's long-lived assets are based on estimates of the period over which the Company expects the assets to be of economic benefit to the Company. In estimating the useful lives the Company considers factors such as, but not limited to, risk of obsolescence, anticipated use, plans of the Company, and applicable laws and permit requirements. In July 2013, the permit for the Madison Square Garden Arena was renewed for ten years and these financial statements have been prepared assuming further renewal of that permit.
Identifiable intangible assets with finite useful lives are amortized on a straight-line basis over their respective estimated useful lives. Goodwill and identifiable intangible assets that have indefinite useful lives are not amortized.
Impairment of Long-Lived and Indefinite-Lived Assets
In assessing the recoverability of the Company's long-lived and indefinite-lived assets, the Company must make estimates and assumptions regarding future cash flows and other factors to determine the fair value of the respective assets. These estimates and assumptions could have a significant impact on whether an impairment charge is recognized and also the magnitude of any such charge. Fair value estimates are made at a specific point in time, based on relevant information. These estimates are subjective in nature and involve uncertainties and matters of significant judgments and therefore cannot be determined with precision. Changes in assumptions could significantly affect the estimates. If these estimates or material related assumptions change in the future, the Company may be required to record impairment charges related to its long-lived and/or indefinite-lived assets.
Goodwill is tested annually for impairment as of August 31st and at any time upon the occurrence of certain events or substantive changes in circumstances. The Company has the option to perform a qualitative assessment to determine if an impairment is more likely than not to have occurred. If the Company can support the conclusion that it is not more likely than not that the fair value of a reporting unit is less than its carrying amount, the Company would not need to perform the two-step impairment test for that reporting unit. If the Company cannot support such a conclusion or the Company does not elect to perform the qualitative assessment then the first step of the goodwill impairment test is used to identify potential impairment by comparing the fair value of a reporting unit with its carrying amount, including goodwill. If the carrying amount of a reporting unit exceeds its fair value, the second step of the goodwill impairment test is performed to measure the amount of impairment loss, if any. The second step of the goodwill impairment test compares the implied fair value of the reporting unit's goodwill with the carrying amount of that goodwill. If the carrying amount of the reporting unit's goodwill exceeds the implied fair value of that goodwill, an impairment loss is recognized in an amount equal to that excess. The implied fair value of goodwill is determined in the same manner as the amount of goodwill that would be recognized in a business combination. The Company's three reporting units for evaluating goodwill impairment are the same as its reportable segments, and all of them have goodwill.
Identifiable indefinite-lived intangible assets are tested annually for impairment as of August 31st and at any time upon the occurrence of certain events or substantive changes in circumstances. The Company has the option to perform a qualitative assessment to determine if an impairment is more likely than not to have occurred. In the qualitative assessment, the Company must evaluate the totality of qualitative factors, including any recent fair value measurements, that impact whether an indefinite-lived intangible asset other than goodwill has a carrying amount that more likely than not exceeds its fair value. The Company must proceed to conducting a quantitative analysis, according to which an impairment charge is recognized for the amount of the asset's carrying amount exceeding the fair value, if the Company (1) determines that such an impairment is more likely than not to exist, or (2) forgoes the qualitative assessment entirely. The impairment test for identifiable indefinite-lived intangible assets consists of a comparison of the estimated fair value of the intangible asset with its carrying value. If the carrying value of the intangible asset exceeds its fair value, an impairment loss is recognized in an amount equal to that excess.
For other long-lived assets, including intangible assets that are amortized, the Company evaluates assets for recoverability when there is an indication of potential impairment. If the undiscounted cash flows from a group of assets being evaluated is less than
F-13
THE MADISON SQUARE GARDEN COMPANY
NOTES TO CONSOLIDATED FINANCIAL STATEMENTS
(Continued)
the carrying value of that group of assets, the fair value of the asset group is determined and the carrying value of the asset group is written down to fair value.
Contingencies
Liabilities for loss contingencies arising from claims, assessments, litigation, fines and penalties and other sources are recorded when it is probable that a liability has been incurred and the amount of the assessment can be reasonably estimated.
Defined Benefit Pension Plans and Other Postretirement Benefit Plan
As more fully described in Note 16, the Company has both funded and unfunded defined benefit plans, as well as a contributory other postretirement benefit plan, covering certain full-time employees and retirees. The majority of the defined benefit pension benefits are based on formulas that reflect the employees' years of service and compensation during their employment period and participation in the plans. The expense recognized by the Company is determined using certain assumptions, including the expected long-term rate of return, discount rate and rate of compensation increases, among others. The Company recognizes the funded status of its defined benefit pension and other postretirement plans (other than multiemployer plans) as an asset or liability in the consolidated balance sheets and recognizes changes in the funded status in the year in which the changes occur through other comprehensive income (loss).
Earnings Per Common Share
Basic earnings per common share (“EPS”) is based upon net income available to common stockholders divided by the weighted-average number of common shares outstanding during the period. Diluted EPS reflects the effect of the assumed exercise of stock options and vesting of restricted shares, restricted stock units (“RSUs”) and shares restricted on the same basis as underlying Cablevision restricted shares (see Note 17) only in the periods in which such effect would have been dilutive.
Asset Retirement Obligations
The Company recorded asset retirement obligations related to the comprehensive transformation of The Garden into a state-of-the-art-arena (the “Transformation”) and the Forum (see Note 9). A liability is initially recorded at fair value for an asset retirement obligation associated with the retirement of tangible long-lived assets in the period in which it is incurred if a reasonable estimate of fair value can be made. When an asset retirement obligation is recorded, an offsetting increase to the carrying value of the related property and equipment is also recorded. The obligation is initially measured at fair value using expected present value techniques. Over time the liabilities are accreted for the change in their present value and the initial capitalized costs are depreciated over the remaining useful lives of the related assets. Changes resulting from revisions to the timing or amount of the original estimate of undiscounted cash flows are recognized as an increase or decrease in the carrying amount of the liability and the related asset retirement cost capitalized.
Recently Adopted Accounting Pronouncements
In December 2011, the Financial Accounting Standards Board (“FASB”) issued Accounting Standards Update (“ASU”) No. 2011-11, Disclosures about Offsetting Assets and Liabilities, which creates new disclosure requirements regarding the nature of an entity's rights of offset and related arrangements associated with its financial instruments and derivative instruments. In January 2013, the FASB issued ASU No. 2013-01, Clarifying the Scope of Disclosures about Offsetting Assets and Liabilities, which clarifies the scope of transactions that are subject to disclosures required by FASB Accounting Standards Codification (“ASC”) 210-20-50, Balance Sheet - Offsetting - Disclosure, concerning offsetting. In particular ASU No. 2013-01 addresses implementation issues about the scope of ASU No. 2011-11 and clarifies that the scope of the disclosure is limited to derivatives, repurchase agreements, and securities borrowing and securities lending transactions that are either offset in the financial statements or are subject to a master netting arrangement or similar arrangement. These standards were adopted by the Company in the first quarter of fiscal year 2014. The adoption of these standards did not have an impact on the Company's financial position, results of operations, or cash flows.
In February 2013, the FASB issued ASU No. 2013-02, Comprehensive Income (Topic 220) - Reporting of Amounts Reclassified Out of Accumulated Other Comprehensive Income, which requires an entity to provide information about amounts reclassified out of accumulated other comprehensive income by component. In addition, an entity is required to present, either on the face of the statement where net income is presented or in the notes, significant amounts reclassified out of accumulated other comprehensive income by the respective line items of net income but only if the amount reclassified is required under GAAP to be reclassified to net income in its entirety in the same reporting period. For other amounts that are not required under GAAP to be reclassified in their entirety to net income, an entity is required to cross-reference to other disclosures required under GAAP
F-14
THE MADISON SQUARE GARDEN COMPANY
NOTES TO CONSOLIDATED FINANCIAL STATEMENTS
(Continued)
that provide additional detail about those amounts. This standard was adopted by the Company in the first quarter of fiscal year 2014. The adoption of this standard impacted the Company's disclosures only and did not have any impact on the Company's financial position, results of operations, or cash flows.
In April 2014, the FASB issued ASU No. 2014-08, Presentation of Financial Statements (Topic 205) and Property, Plant, and Equipment (Topic 360): Reporting Discontinued Operations and Disclosures of Disposals of Components of an Entity, which revises the definition of a discontinued operation to limit the circumstances under which a disposal or classification as held for sale qualifies for presentation as a discontinued operation. Expanded disclosures are required concerning a discontinued operation and the disposal of a significant component of an entity not qualifying as a discontinued operation. The revised standard is effective for any new disposals and new classifications of assets held for sale in annual and interim periods beginning after December 15, 2014. Early adoption is permitted. The Company elected to early adopt this guidance in the fourth quarter of fiscal year 2014. The adoption of this standard did not have any impact on the Company's financial position, results of operations, or cash flows.
Recently Issued Accounting Pronouncements Not Yet Adopted
In May 2014, the FASB issued ASU No. 2014-09, Revenue from Contracts with Customers (Topic 606), which supersedes the revenue recognition requirements in FASB ASC Topic 605, Revenue Recognition. This ASU is based on the principle that revenue is recognized to depict the transfer of goods or services to customers in an amount that reflects the consideration to which the entity expects to be entitled in exchange for those goods or services. The ASU also requires additional disclosure about the nature, amount, timing and uncertainty of revenue and cash flows arising from customer contracts, including significant judgments and changes in judgments and assets recognized from costs incurred to obtain or fulfill a contract. This standard will be effective for the Company beginning in the first quarter of fiscal year 2018 using one of two retrospective application methods. The Company is currently evaluating the impact this standard will have on its consolidated financial statements.
Note 3. Acquisition
On June 25, 2012, the Company acquired the Forum located in Inglewood, CA for a purchase price of $23,500. The acquisition was accounted for as an asset acquisition and the cost of the acquisition was allocated to the assets acquired based on their relative fair values. Acquisition-related costs of $6,828 were capitalized as costs of the acquisition and were allocated to the assets acquired based upon the nature of the cost.
The allocation of the purchase price, including acquisition-related costs, as of the acquisition date are as follows:
Land | $ | 23,757 | |
Building | 6,031 | ||
Trademarks | 540 | ||
$ | 30,328 | ||
The trademarks were determined to be indefinite-lived intangible assets and were valued using a relief-from-royalty method in which the expected benefits are valued by discounting hypothetical royalty payments based on projected revenues covered by the trademarks.
In addition, the Company initially recorded an asset retirement obligation in the amount of $6,000 and an offsetting increase to the carrying value of the related property and equipment in connection with the acquisition and planned revitalization. During the year ended June 30, 2014, the original estimate was revised and recognized as a decrease in the carrying amount of the liability and the related asset retirement cost capitalized.
F-15
THE MADISON SQUARE GARDEN COMPANY
NOTES TO CONSOLIDATED FINANCIAL STATEMENTS
(Continued)
Note 4. Computation of Earnings per Common Share
The following table presents a reconciliation of weighted-average shares used in the calculations of basic and diluted EPS.
Years Ended June 30, | ||||||||
2014 | 2013 | 2012 | ||||||
Weighted-average shares for basic EPS | 77,142 | 76,268 | 74,938 | |||||
Dilutive effect of shares issuable under share-based compensation plans and shares restricted on the same basis as underlying Cablevision restricted shares | 1,025 | 1,672 | 2,521 | |||||
Weighted-average shares for diluted EPS | 78,167 | 77,940 | 77,459 | |||||
Anti-dilutive shares | — | 18 | — | |||||
Note 5. Impairment Charges
As a result of the financial performance of a theatrical production of the Radio City Christmas Spectacular that played in three markets outside of New York during the year ended June 30, 2013, the Company evaluated whether or not an impairment of the deferred costs related to that production had occurred. Consequently, the Company's MSG Entertainment segment recorded a pre-tax impairment charge of $4,982 for the remaining unamortized deferred costs of assets related to this theatrical production outside of New York, which is reflected in direct operating expenses in the accompanying consolidated statement of operations for the year ended June 30, 2013.
Effective July 1, 2010 DISH Network's (“DISH”) license to carry Fuse expired and effective October 1, 2010, DISH's license to carry MSG Network and MSG+ expired. While MSG Network and MSG+ have not been carried by DISH since those dates, DISH restored carriage of Fuse on November 1, 2012. As discussions through December 2011 had not resulted in new carriage agreements being reached to restore DISH's carriage of any of the networks, during the quarter ended December 31, 2011, the Company's MSG Media segment recorded a pre-tax impairment charge of $3,112 to write-off the remaining carrying value of the affiliation agreements and affiliate relationships intangible assets associated with DISH. This pre-tax impairment charge is reflected in depreciation and amortization (including impairments) in the accompanying consolidated statement of operations for the year ended June 30, 2012.
As part of its periodic review of expected usefulness of programming rights, the Company's MSG Media segment recorded a pre-tax impairment charge of $865 associated with these assets during the year ended June 30, 2012, which is included in direct operating expenses in the accompanying consolidated statement of operations for that year. There were no impairment charges associated with these assets during the years ended June 30, 2014 and 2013.
Note 6. Team Personnel Transactions and Insurance Recoveries
Direct operating and selling, general and administrative expenses in the accompanying consolidated statements of operations include net provisions for transactions relating to players and certain other team personnel on the Company's sports teams for (i) season-ending injuries, (ii) trades and (iii) waivers and contract termination costs (“Team Personnel Transactions”).
The following table sets forth provisions for Team Personnel Transactions and insurance recoveries recorded by the Company's MSG Sports segment:
Years Ended June 30, | |||||||||||
2014 | 2013 | 2012 | |||||||||
Provisions for Team Personnel Transactions | $ | 54,225 | $ | 18,715 | $ | 16,314 | |||||
Insurance recoveries related to non season-ending player injuries | — | — | 323 | ||||||||
Note 7. Investments in Nonconsolidated Affiliates
The Company’s equity method investments include investments in Azoff MSG Entertainment LLC (“Azoff-MSG”), Brooklyn Bowl Las Vegas, LLC (“BBLV”) and Tribeca Enterprises LLC (“Tribeca Enterprises”). The Company determined that Azoff-MSG, BBLV and Tribeca Enterprises are not variable interest entities (“VIE”) and therefore these investments were each analyzed under the voting model. The Company determined that due to a lack of a voting majority and consistent with the
F-16
THE MADISON SQUARE GARDEN COMPANY
NOTES TO CONSOLIDATED FINANCIAL STATEMENTS
(Continued)
accounting for partnership (or similar entities) interests, it does not control these entities. Accordingly, the Company accounts for these investments under the equity method of accounting.
In September 2013, the Company acquired a 50% interest in Azoff-MSG for $125,000. The Azoff-MSG entity owns and operates businesses in the entertainment industry and is currently focused on music management, performance rights, comedy and productions, and strategic marketing. As required by GAAP, to the extent that there is a basis difference between the cost and the underlying equity in the net assets of an equity investment, companies are required to allocate such differences between tangible and intangible assets. As of the acquisition date the carrying amount of the investment was greater than the Company’s equity in the underlying assets of Azoff-MSG due to the difference in the carrying amounts of goodwill and amortizable intangible assets of approximately $108,220 and $17,350, respectively. The difference attributable to amortizable intangible assets is being amortized straight-line over the expected useful lives of the intangible assets, which range from 5 to 7 years. As of June 30, 2014, the Company’s investment in Azoff-MSG was $125,677, inclusive of transaction costs related to the acquisition.
In addition, the Company agreed to provide up to $50,000 of revolving credit loans to Azoff-MSG. As of June 30, 2014, these loans were fully drawn upon and, including accrued interest, Azoff-MSG had outstanding loans of $50,300 under the unsecured credit facility with the Company, which is reflected in investments in and loans to nonconsolidated affiliates in the accompanying consolidated balance sheet. Interest income on the outstanding loan balance and related facility fees are recorded currently and are reflected in interest income in the accompanying consolidated statement of operations for the year ended June 30, 2014.
In August 2013, the Company acquired an interest in BBLV. In March 2014, BBLV opened a new venue in Las Vegas which brings together live music, bowling and a restaurant. As of June 30, 2014 the Company's preferred equity investment in BBLV, together with transaction costs related to the acquisition, was $25,725. The Company has $682 of remaining preferred equity commitment to BBLV that had not yet been funded as of June 30, 2014. The above amounts are inclusive of an increased equity commitment made in June 2014 above the amount originally committed on the acquisition date. The Company will be entitled to receive back its capital, which was 78% of BBLV's total capital as of June 30, 2014, plus a preferred return, after which the Company will own a 20% interest in BBLV. The Company does not manage or otherwise control BBLV but has approval rights over certain decisions. Additionally, in June 2014, the Company agreed to loan up to $2,600 to BBLV, of which $1,334 had been advanced as of June 30, 2014. The loan plus accrued interest is reflected in investments in and loans to nonconsolidated affiliates in the accompanying consolidated balance sheet. Interest income on the outstanding loan balance is recorded currently and is reflected in interest income in the accompanying consolidated statement of operations for the year ended June 30, 2014.
In March 2014, the Company acquired a 50% interest in Tribeca Enterprises for $22,500. Tribeca Enterprises owns and operates the Tribeca Film Festival and certain other businesses. Based upon the preliminary valuation, as of the acquisition date the carrying amount of the investment was greater than the Company’s equity in the underlying assets of Tribeca Enterprises due to the difference in the carrying amounts of indefinite-lived and amortizable intangible assets of approximately $5,750 and $5,350, respectively. The difference attributable to amortizable intangible assets is being amortized straight-line over 10 years, the expected useful live of the intangible asset. The Company expects to complete such valuation during the next twelve months. As of June 30, 2014, the Company’s investment in Tribeca Enterprises was $22,582, inclusive of transaction costs related to the acquisition.
In connection with the investment, the Company and Tribeca Enterprises have a service agreement pursuant to which the Company provides marketing inventory and consulting services to Tribeca Enterprises for a fee.
Note 8. Goodwill and Intangible Assets
The carrying amount of goodwill, by reportable segment, as of June 30, 2014 and 2013 is as follows:
June 30, | |||||||
2014 | 2013 | ||||||
MSG Media (a) | $ | 424,508 | $ | 465,326 | |||
MSG Entertainment | 58,979 | 58,979 | |||||
MSG Sports | 218,187 | 218,187 | |||||
$ | 701,674 | $ | 742,492 | ||||
(a) The decrease in the balance from June 30, 2013 reflects the presentation of Fuse as held for sale (see Note 23).
F-17
THE MADISON SQUARE GARDEN COMPANY
NOTES TO CONSOLIDATED FINANCIAL STATEMENTS
(Continued)
During the first quarter of fiscal year 2014, the Company performed its annual impairment test of goodwill, and there was no impairment of goodwill identified for any of its reportable segments. In addition, the Company performed an impairment test of MSG Media as required pursuant to the Fuse sale (see Note 23), and there was no impairment of goodwill identified as a result of this test.
The Company's indefinite-lived intangible assets as of June 30, 2014 and 2013 are as follows:
June 30, | |||||||
2014 | 2013 | ||||||
Sports franchises (MSG Sports segment) | $ | 101,429 | $ | 96,215 | |||
Trademarks (MSG Entertainment segment) | 62,421 | 62,421 | |||||
$ | 163,850 | $ | 158,636 | ||||
In March 2014, the Company acquired the rights to own and operate an NBADL team, named the Westchester Knicks, which will begin operations for the 2014-15 season. The purchase was accounted for as the acquisition of an indefinite-lived franchise intangible asset.
During the first quarter of fiscal year 2014, the Company performed its annual impairment test of identifiable indefinite-lived intangible assets, and there were no impairments identified.
The Company's intangible assets subject to amortization as of June 30, 2014 and 2013 are as follows:
As of June 30, 2014 | Gross | Accumulated Amortization | Net | ||||||||
Affiliate relationships | $ | 83,044 | $ | (32,001 | ) | $ | 51,043 | ||||
Season ticket holder relationships | 73,124 | (48,660 | ) | 24,464 | |||||||
Suite holder relationships | 15,394 | (12,940 | ) | 2,454 | |||||||
Other intangibles | 4,217 | (1,872 | ) | 2,345 | |||||||
$ | 175,779 | $ | (95,473 | ) | $ | 80,306 | |||||
As of June 30, 2013 | |||||||||||
Affiliate relationships | $ | 83,044 | $ | (28,540 | ) | $ | 54,504 | ||||
Season ticket holder relationships | 73,124 | (43,401 | ) | 29,723 | |||||||
Suite holder relationships | 15,394 | (11,542 | ) | 3,852 | |||||||
Other intangibles | 4,217 | (1,591 | ) | 2,626 | |||||||
$ | 175,779 | $ | (85,074 | ) | $ | 90,705 | |||||
The estimated useful lives of the Company's intangible assets subject to amortization are as follows:
Estimated Useful Lives | |
Affiliate relationships | 24 years |
Season ticket holder relationships | 12 to 15 years |
Suite holder relationships | 11 years |
Other intangibles | 15 years |
Amortization expense for intangible assets amounted to $10,399, $11,109 and $19,980 for the years ended June 30, 2014, 2013 and 2012, respectively. Amortization expense for the year ended June 30, 2012 includes a pre-tax impairment charge of $3,112, which reflects the write-off of the remaining carrying value of certain intangible assets (see Note 5).
F-18
THE MADISON SQUARE GARDEN COMPANY
NOTES TO CONSOLIDATED FINANCIAL STATEMENTS
(Continued)
The Company expects its aggregate annual amortization expense for existing intangible assets subject to amortization for each fiscal year from 2015 through 2019 to be as follows:
Fiscal year ending June 30, 2015 | $ | 10,399 | |
Fiscal year ending June 30, 2016 | 10,051 | ||
Fiscal year ending June 30, 2017 | 8,526 | ||
Fiscal year ending June 30, 2018 | 7,076 | ||
Fiscal year ending June 30, 2019 | 7,076 | ||
Note 9. Property and Equipment
As of June 30, 2014 and 2013, property and equipment (including equipment under capital leases) consisted of the following assets:
June 30, | Estimated | ||||||||
2014 | 2013 | Useful Lives | |||||||
Land | $ | 91,678 | $ | 92,828 | |||||
Buildings | 1,077,823 | 781,747 | Up to 45 years | ||||||
Equipment | 313,057 | 310,946 | 2 to 20 years | ||||||
Aircraft | 43,598 | 43,388 | 8 to 15 years | ||||||
Furniture and fixtures | 52,236 | 36,824 | 3 to 9 years | ||||||
Leasehold improvements | 151,536 | 151,224 | Shorter of term of lease or life of improvement | ||||||
Construction in progress | 6,115 | 147,398 | |||||||
1,736,043 | 1,564,355 | ||||||||
Less accumulated depreciation and amortization | (483,576 | ) | (429,175 | ) | |||||
$ | 1,252,467 | $ | 1,135,180 | ||||||
Depreciation and amortization expense on property and equipment (including equipment under capital leases) amounted to $96,551, $78,023 and $67,523 for the years ended June 30, 2014, 2013 and 2012, respectively. During the second quarter of fiscal year 2014, the Company placed into service assets related to the Transformation and the Forum.
For the year ended June 30, 2014, the City of Inglewood provided the Company with an $18,000 loan in connection with the Company’s renovation of the Forum. The loan will be forgiven once certain operating conditions, that the Company expects to satisfy, are met. Property and equipment balances related to the Forum are recorded net of the expected loan forgiveness.
Asset retirement obligations have been recorded in accordance with ASC 410, which requires companies to recognize an obligation along with an offsetting increase to the carrying value of the related property and equipment when an obligation or commitment exists to perform remediation efforts and its fair value is reasonably estimable. These obligations were necessitated by the Transformation and the acquisition and the renovation of the Forum.
F-19
THE MADISON SQUARE GARDEN COMPANY
NOTES TO CONSOLIDATED FINANCIAL STATEMENTS
(Continued)
The following is a summary of the change in the carrying amount of the asset retirement obligations during the years ended June 30, 2014 and 2013:
Balance as of June 30, 2012 | $ | 12,218 | |
Revisions in estimated liabilities | 6,700 | ||
Accretion expense | 15 | ||
Payments | (6,683 | ) | |
Balance as of June 30, 2013 | $ | 12,250 | |
Revisions in estimated liabilities | (5,027 | ) | |
Accretion expense | 15 | ||
Payments | (6,947 | ) | |
Reclassification to Liabilities held for sale | (231 | ) | |
Balance as of June 30, 2014 | $ | 60 | |
As of June 30, 2014, the total asset retirement obligation of $60 was recorded in other accrued liabilities in the accompanying consolidated balance sheet. As of June 30, 2013, $12,034 of the total asset retirement obligations were recorded in other accrued liabilities, with the remaining balance recorded in other liabilities, in the accompanying consolidated balance sheet.
Note 10. Debt
Revolving Credit Facility
On May 6, 2014, MSG L.P. and certain of its subsidiaries entered into a credit agreement with a syndicate of lenders providing for a senior secured revolving credit facility of up to $500,000 with a term of five years (the “Revolving Credit Facility”). Simultaneously with MSG L.P. entering into the Revolving Credit Facility, MSG L.P. terminated its previously existing revolving credit facility with a syndicate of lenders, which facility had been effective since January 28, 2010.
The Revolving Credit Facility contains certain customary representations and warranties, affirmative covenants and events of default. It also requires MSG L.P. to comply with the following financial covenants: (i) a maximum total secured leverage ratio of 3.50:1.00 and (ii) a maximum total leverage ratio of 6.00:1.00 subject to upward adjustment during the continuance of certain events. In addition, there is a minimum interest coverage ratio of 2.00:1.00 for the Company. As of June 30, 2014, MSG L.P. was in compliance with the financial covenants in the Revolving Credit Facility. All borrowings under the Revolving Credit Facility are subject to the satisfaction of customary conditions, including covenant compliance, absence of a default and accuracy of representations and warranties. As of June 30, 2014, there was $7,460 in letters of credit issued and outstanding under the Revolving Credit Facility with available borrowing capacity of $492,540.
All obligations under the Revolving Credit Facility are guaranteed by MSG L.P.'s existing and future direct and indirect domestic subsidiaries that are not designated as excluded subsidiaries or unrestricted subsidiaries in accordance with the facility (the “Guarantors”). All obligations under the Credit Agreement, including the guarantees of those obligations, are secured by certain of the assets of MSG L.P. and each Guarantor, (collectively, “Collateral”) including, but not limited to, a pledge of the equity interests held directly or indirectly by MSG L.P. in each Guarantor. The Collateral, however, does not include, among other things, our sports franchises or other assets of any of MSG L.P.'s teams, including of the Knicks and Rangers, or any interests in real property of MSG L.P. or the Guarantors, including the Madison Square Garden Complex, the leasehold interest in Radio City Music Hall and MSG L.P.'s real property interest in other venues.
MSG L.P. is also required to pay a commitment fee of 0.40% in respect of the average daily unused commitments thereunder and pay customary letter of credit fees, as well as fronting fees, to banks that issue letters of credit pursuant to the Revolving Credit Facility.
In connection with the establishment of this Revolving Credit Facility, the Company incurred deferred financing costs of $6,779, which are being amortized to interest expense over the five-year term. In addition, unamortized deferred financing costs of $1,199 related to the terminated credit agreement were aggregated with the deferred financing costs related to the Revolving Credit Facility and are being amortized to interest expense over the same five-year term.
F-20
THE MADISON SQUARE GARDEN COMPANY
NOTES TO CONSOLIDATED FINANCIAL STATEMENTS
(Continued)
Capital Leases
Capital lease assets for transponder space have been subleased to the Company from a related party. As of June 30, 2014, the Company had $1,967 of related party capital lease obligations which were recorded in liabilities held for sale in the accompanying consolidated balance sheet (see Note 23). As of June 30, 2013, these related party capital lease obligations amounted to $2,224 and were recorded in other accrued liabilities and other liabilities in the accompanying consolidated balance sheet.
Note 11. Operating Leases
The Company has various long-term noncancelable operating lease agreements, primarily for entertainment venues and office and storage space expiring at various dates through 2026. Certain leases include renewal provisions at the Company's option and provide for additional rent based on sales. The rent expense associated with such operating leases is recognized on a straight-line basis over the initial lease term. The difference between rent expense and rent paid is recorded as deferred rent. Rent expense under these lease agreements totaled $41,902, $42,135 and $39,386 for the years ended June 30, 2014, 2013 and 2012, respectively.
As of June 30, 2014, future minimum rental payments under leases having noncancelable initial lease terms in excess of one year were as follows:
Fiscal year ending June 30, 2015 | $ | 41,005 | |
Fiscal year ending June 30, 2016 | 41,793 | ||
Fiscal year ending June 30, 2017 | 40,848 | ||
Fiscal year ending June 30, 2018 | 37,271 | ||
Fiscal year ending June 30, 2019 | 37,359 | ||
Thereafter | 191,005 | ||
$ | 389,281 | ||
Under the terms of a lease agreement and related guaranty, subsidiaries of the Company have certain operating requirements and are required to meet a certain net worth obligation. In the event that these subsidiaries were to fail to meet the required obligations and were unable to avail themselves of the provided for cure options, the landlord could terminate the lease.
Note 12. Contractual Obligations and Off Balance Sheet Arrangements
Future cash payments required under contracts entered into by the Company in the normal course of business and outstanding letters of credit as of June 30, 2014 are summarized in the following table:
Total | Year 1 | Years 2-3 | Years 4-5 | More Than 5 Years | |||||||||||||||
Off balance sheet arrangements: | |||||||||||||||||||
Contractual obligations (a) | $ | 1,236,772 | $ | 199,823 | $ | 273,754 | $ | 208,111 | $ | 555,084 | |||||||||
Letters of credit (b) | 7,460 | 7,460 | — | — | — | ||||||||||||||
1,244,232 | 207,283 | 273,754 | 208,111 | 555,084 | |||||||||||||||
Contractual obligations reflected on the balance sheet (c) | 91,293 | 41,220 | 18,736 | 10,933 | 20,404 | ||||||||||||||
Total | $ | 1,335,525 | $ | 248,503 | $ | 292,490 | $ | 219,044 | $ | 575,488 | |||||||||
_____________________
(a) | Contractual obligations not reflected on the balance sheet consist primarily of (i) the MSG Media segment's obligations related to professional team rights, acquired under license agreements, to telecast certain live sporting events, (ii) the MSG Sports segment's obligations under employment agreements that the Company has with its professional sports teams' personnel that are generally guaranteed regardless of employee injury or termination, and (iii) minimum purchase requirements incurred in the normal course of the Company's operations. |
(b) | Consists of letters of credit obtained by the Company under the Revolving Credit Facility as collateral for certain insurance policies and for a lease agreement. |
F-21
THE MADISON SQUARE GARDEN COMPANY
NOTES TO CONSOLIDATED FINANCIAL STATEMENTS
(Continued)
(c) | Consists principally of amounts earned under employment agreements that the Company has with certain of its professional sports teams' personnel in the MSG Sports segment. |
The future cash payments reflected above include amounts related to Fuse (see Note 23).
The future cash payments reflected above do not include the impact of potential insurance recoveries or amounts which may be due for NBA luxury tax payments or NBA or NHL revenue sharing.
Additionally, in September 2013, in connection with the Company's acquisition of a 50% interest in Azoff-MSG, the Company agreed to provide up to $50,000 of revolving credit loans to Azoff-MSG (see Note 7), which amount was fully borrowed as of June 30, 2014.
Note 13. Legal Matters
In March 2012, the Company was named as a defendant in two purported class action antitrust lawsuits brought in the United States District Court for the Southern District of New York against the NHL and certain NHL member clubs, regional sports networks and cable and satellite distributors. The complaints, which are substantially identical, primarily assert that certain of the NHL's current rules and agreements entered into by defendants, which are alleged by the plaintiffs to provide certain territorial and other exclusivities with respect to the television and online distribution of live hockey games, violate Sections 1 and 2 of the Sherman Antitrust Act. The complaints seek injunctive relief against the defendants' continued violation of the antitrust laws, treble damages, attorneys' fees and pre- and post-judgment interest. On July 27, 2012, the Company and the other defendants filed a motion to dismiss the complaints (which have been consolidated for procedural purposes). On December 5, 2012, the Court issued an Opinion and Order largely denying the motion to dismiss. On April 8, 2014, following the conclusion of fact discovery, all defendants filed motions for summary judgment seeking dismissal of the complaints in their entirety. On August 8, 2014, the Court denied the motions for summary judgment. The Company intends to vigorously defend the claims against the Company.
The Company is a defendant in various other lawsuits. Although the outcome of these other lawsuits cannot be predicted with certainty, management does not believe that resolution of these other lawsuits will have a material adverse effect on the Company.
F-22
THE MADISON SQUARE GARDEN COMPANY
NOTES TO CONSOLIDATED FINANCIAL STATEMENTS
(Continued)
Note 14. Fair Value Measurements
The fair value hierarchy is based on inputs to valuation techniques that are used to measure fair value that are either observable or unobservable. Observable inputs reflect assumptions market participants would use in pricing an asset or liability based on market data obtained from independent sources while unobservable inputs reflect a reporting entity's pricing based upon their own market assumptions. The fair value hierarchy consists of the following three levels:
Level I - Quoted prices for identical instruments in active markets. |
Level II - Quoted prices for similar instruments in active markets; quoted prices for identical or similar instruments in markets that are not active; and model-derived valuations whose inputs are observable or whose significant value drivers are observable. |
Level III - Instruments whose significant value drivers are unobservable.
The following table presents for each of these hierarchy levels, the Company's assets that are measured at fair value on a recurring basis:
Level I | Level II | Level III | Total | ||||||||||||
June 30, 2014 | |||||||||||||||
Assets: | |||||||||||||||
Money market accounts | $ | 61,941 | $ | — | $ | — | $ | 61,941 | |||||||
Time deposits | 24,120 | — | — | 24,120 | |||||||||||
Total assets measured at fair value | $ | 86,061 | $ | — | $ | — | $ | 86,061 | |||||||
June 30, 2013 | |||||||||||||||
Assets: | |||||||||||||||
Money market accounts | $ | 231,788 | $ | — | $ | — | $ | 231,788 | |||||||
Time deposits | 40,281 | — | — | 40,281 | |||||||||||
Total assets measured at fair value | $ | 272,069 | $ | — | $ | — | $ | 272,069 | |||||||
Money market accounts and time deposits are classified within Level 1 of the fair value hierarchy as they are valued using observable inputs that reflect quoted prices for identical assets in active markets. The carrying amount of the Company's money market accounts and time deposits approximates fair value due to their short-term maturities.
F-23
THE MADISON SQUARE GARDEN COMPANY
NOTES TO CONSOLIDATED FINANCIAL STATEMENTS
(Continued)
Note 15. Accumulated Other Comprehensive Income (Loss)
The following table details the changes in each component of accumulated other comprehensive income (loss):
Pension Plans and Postretirement Plan (a) | Available-for-sale Securities (b) | Accumulated Other Comprehensive Income (Loss) | |||||||||
Balance as of June 30, 2011 | $ | (17,441 | ) | $ | 2,208 | $ | (15,233 | ) | |||
Other comprehensive loss before reclassifications, before income taxes | (8,441 | ) | (8,961 | ) | (17,402 | ) | |||||
Amounts reclassified from accumulated other comprehensive loss, before income taxes | 1,871 | — | 1,871 | ||||||||
Income tax benefit | 2,795 | 3,807 | 6,602 | ||||||||
Other comprehensive loss | (3,775 | ) | (5,154 | ) | (8,929 | ) | |||||
Balance as of June 30, 2012 | (21,216 | ) | (2,946 | ) | (24,162 | ) | |||||
Other comprehensive income before reclassifications, before income taxes | 6,744 | 9,587 | 16,331 | ||||||||
Amounts reclassified from accumulated other comprehensive loss, before income taxes | 1,961 | (4,500 | ) | (2,539 | ) | ||||||
Income tax expense | (3,708 | ) | (2,141 | ) | (5,849 | ) | |||||
Other comprehensive income | 4,997 | 2,946 | 7,943 | ||||||||
Balance as of June 30, 2013 | (16,219 | ) | — | (16,219 | ) | ||||||
Other comprehensive loss before reclassifications, before income taxes | (12,574 | ) | — | (12,574 | ) | ||||||
Amounts reclassified from accumulated other comprehensive loss, before income taxes | 1,300 | — | 1,300 | ||||||||
Income tax benefit | 4,782 | — | 4,782 | ||||||||
Other comprehensive loss | (6,492 | ) | — | (6,492 | ) | ||||||
Balance as of June 30, 2014 | $ | (22,711 | ) | $ | — | $ | (22,711 | ) | |||
_____________________
(a) | Amounts reclassified from accumulated other comprehensive income, before income taxes, represents amortization of net actuarial loss and net unrecognized prior service credit included in net periodic benefit cost, which is reflected in direct operating expenses and selling, general and administrative expenses in the accompanying consolidated statements of operations (see Note 16). |
(b) | The Company held an investment in Live Nation Entertainment, Inc. common stock which it sold in March 2013. Other income in the accompanying consolidated statement of operations for the year ended June 30, 2013 includes a pre-tax gain of $3,130, which reflects an unrealized gain reclassified from accumulated other comprehensive income to net income partially offset by block sale costs. Prior to the sale this investment was classified as available-for-sale with the unrealized gains (losses), net of tax, included in the determination of other comprehensive income (loss) and reported in stockholders' equity. |
Note 16. Pension Plans and Other Postretirement Benefit Plan
Company Sponsored Plans
The Company sponsors a non-contributory qualified cash balance retirement plan covering its non-union employees (the “MSG Cash Balance Pension Plan”) and an unfunded non-contributory non-qualified excess cash balance plan covering certain employees who participate in the underlying qualified plan (collectively, the “MSG Cash Balance Plans”).
In addition, the Company sponsors two non-contributory qualified defined benefit pension plans covering certain of its union employees (“Union Plans”). Benefits payable to retirees under the Union Plans are based upon years of service and, for one plan, participants' compensation.
F-24
THE MADISON SQUARE GARDEN COMPANY
NOTES TO CONSOLIDATED FINANCIAL STATEMENTS
(Continued)
The Company sponsored a non-contributory qualified defined benefit pension plan covering its non-union employees hired prior to January 1, 2001 (the “Retirement Plan”) and sponsors an unfunded non-contributory non-qualified defined benefit pension plan for the benefit of certain employees who participate in the underlying qualified plan (the “Excess Plan”). As of December 31, 2007, both the Retirement Plan and Excess Plan were amended to freeze all benefits earned through December 31, 2007 and to eliminate the ability of participants to earn benefits for future service under these plans. On March 1, 2011, the Company merged the Retirement Plan into the MSG Cash Balance Pension Plan, effectively combining the assets and liabilities of the respective plans. In connection with this merger, the respective benefit formulas of the plans were not amended. Effective March 1, 2011, the Retirement Plan no longer exists as a stand-alone plan and is part of the MSG Cash Balance Pension Plan.
The MSG Cash Balance Plans (which now include the Retirement Plan), Union Plans, and Excess Plan are collectively referred to as the “Pension Plans.”
The Company also sponsors a contributory welfare plan which provides certain postretirement healthcare benefits to certain employees hired prior to January 1, 2001 who are eligible to commence receipt of early or normal Retirement Plan benefits under the MSG Cash Balance Pension Plan and their dependents, as well as certain union employees (“Postretirement Plan”).
The following table summarizes the projected benefit obligations, assets, funded status and the amounts recorded on the Company's consolidated balance sheets associated with the Pension Plans and Postretirement Plan as of June 30, 2014 and 2013 based upon actuarial valuations as of those measurement dates.
Pension Plans | Postretirement Plan | ||||||||||||||
June 30, | June 30, | ||||||||||||||
2014 | 2013 | 2014 | 2013 | ||||||||||||
Change in benefit obligation: | |||||||||||||||
Benefit obligation at beginning of period | $ | 153,470 | $ | 159,763 | $ | 7,749 | $ | 8,436 | |||||||
Service cost | 6,333 | 6,737 | 227 | 239 | |||||||||||
Interest cost | 7,509 | 6,866 | 383 | 305 | |||||||||||
Actuarial loss (gain) | 18,036 | (14,801 | ) | 996 | (955 | ) | |||||||||
Benefits paid | (4,972 | ) | (5,095 | ) | (141 | ) | (276 | ) | |||||||
Benefit obligation at end of period | 180,376 | 153,470 | 9,214 | 7,749 | |||||||||||
Change in plan assets: | |||||||||||||||
Fair value of plan assets at beginning of period | 99,661 | 108,017 | — | — | |||||||||||
Actual return on plan assets | 10,296 | (5,260 | ) | — | — | ||||||||||
Employer contributions | 6,826 | 1,999 | — | — | |||||||||||
Benefits paid | (4,972 | ) | (5,095 | ) | — | — | |||||||||
Fair value of plan assets at end of period | 111,811 | 99,661 | — | — | |||||||||||
Funded status at end of period | $ | (68,565 | ) | $ | (53,809 | ) | $ | (9,214 | ) | $ | (7,749 | ) | |||
Amounts recognized in the consolidated balance sheets as of June 30, 2014 and 2013 consist of:
Pension Plans | Postretirement Plan | ||||||||||||||
June 30, | June 30, | ||||||||||||||
2014 | 2013 | 2014 | 2013 | ||||||||||||
Current liabilities (included in accrued employee related costs) | $ | (1,756 | ) | $ | (1,624 | ) | $ | (295 | ) | $ | (208 | ) | |||
Non-current liabilities (included in defined benefit and other postretirement obligations) | (66,809 | ) | (52,185 | ) | (8,919 | ) | (7,541 | ) | |||||||
$ | (68,565 | ) | $ | (53,809 | ) | $ | (9,214 | ) | $ | (7,749 | ) | ||||
F-25
THE MADISON SQUARE GARDEN COMPANY
NOTES TO CONSOLIDATED FINANCIAL STATEMENTS
(Continued)
Accumulated other comprehensive income (loss), before tax, as of June 30, 2014 and 2013 consists of the following amounts that have not yet been recognized in net periodic benefit cost:
Pension Plans | Postretirement Plan | ||||||||||||||
June 30, | June 30, | ||||||||||||||
2014 | 2013 | 2014 | 2013 | ||||||||||||
Actuarial gain (loss) | $ | (38,978 | ) | $ | (28,847 | ) | $ | (805 | ) | $ | 224 | ||||
Prior service credit (cost) | (40 | ) | (66 | ) | 426 | 578 | |||||||||
$ | (39,018 | ) | $ | (28,913 | ) | $ | (379 | ) | $ | 802 | |||||
Components of net periodic benefit cost for the Company's Pension Plans and Postretirement Plan for the years ended June 30, 2014, 2013 and 2012 are as follows:
Pension Plans | Postretirement Plan | ||||||||||||||||||||||
Years Ended June 30, | Years Ended June 30, | ||||||||||||||||||||||
2014 | 2013 | 2012 | 2014 | 2013 | 2012 | ||||||||||||||||||
Service cost | $ | 6,333 | $ | 6,737 | $ | 6,558 | $ | 227 | $ | 239 | $ | 214 | |||||||||||
Interest cost | 7,509 | 6,866 | 6,895 | 383 | 305 | 359 | |||||||||||||||||
Expected return on plan assets | (3,836 | ) | (3,752 | ) | (2,606 | ) | — | — | — | ||||||||||||||
Recognized actuarial loss (gain) | 1,446 | 2,104 | 2,042 | (20 | ) | (4 | ) | (21 | ) | ||||||||||||||
Amortization of unrecognized prior service cost (credit) | 26 | 26 | 26 | (152 | ) | (165 | ) | (176 | ) | ||||||||||||||
Net periodic benefit cost | $ | 11,478 | $ | 11,981 | $ | 12,915 | $ | 438 | $ | 375 | $ | 376 | |||||||||||
Other pre-tax changes in plan assets and benefit obligations recognized in other comprehensive income (loss) for the years ended June 30, 2014, 2013 and 2012 are as follows:
Pension Plans | Postretirement Plan | ||||||||||||||||||||||
Years Ended June 30, | Years Ended June 30, | ||||||||||||||||||||||
2014 | 2013 | 2012 | 2014 | 2013 | 2012 | ||||||||||||||||||
Actuarial gain (loss) | $ | (11,578 | ) | $ | 5,789 | $ | (8,216 | ) | $ | (996 | ) | $ | 955 | $ | (556 | ) | |||||||
Recognized actuarial (gain) loss | 1,446 | 2,104 | 2,042 | (20 | ) | (4 | ) | (21 | ) | ||||||||||||||
Recognized prior service (credit) cost | 26 | 26 | 26 | (152 | ) | (165 | ) | (176 | ) | ||||||||||||||
Prior service credit due to plan amendment | — | — | — | — | — | 331 | |||||||||||||||||
Total recognized in other comprehensive income (loss) | $ | (10,106 | ) | $ | 7,919 | $ | (6,148 | ) | $ | (1,168 | ) | $ | 786 | $ | (422 | ) | |||||||
The estimated net loss and prior service cost for the Pension Plans expected to be amortized from accumulated other comprehensive income (loss) and recognized as components of net periodic benefit cost over the next fiscal year are $2,258 and $26, respectively. The estimated net loss and prior service credit for the Postretirement Plan expected to be amortized from accumulated other comprehensive income (loss) into net periodic benefit credit over the next fiscal year are $23 and $138, respectively.
Funded Status
The accumulated benefit obligation for the Pension Plans aggregated to $179,505 and $152,719 at June 30, 2014 and 2013, respectively. As of June 30, 2014 and 2013 each of the Pension Plans had accumulated benefit obligations and projected benefit obligations in excess of plan assets.
F-26
THE MADISON SQUARE GARDEN COMPANY
NOTES TO CONSOLIDATED FINANCIAL STATEMENTS
(Continued)
Pension Plans and Postretirement Plan Assumptions
Weighted-average assumptions used to determine benefit obligations (made at the end of the period) as of June 30, 2014 and 2013 are as follows:
Pension Plans | Postretirement Plan | ||||||||||
June 30, | June 30, | ||||||||||
2014 | 2013 | 2014 | 2013 | ||||||||
Discount rate | 4.32 | % | 4.80 | % | 4.00 | % | 4.50 | % | |||
Rate of compensation increase | 2.98 | % | 2.98 | % | n/a | n/a | |||||
Healthcare cost trend rate assumed for next year | n/a | n/a | 7.25 | % | 7.75 | % | |||||
Rate to which the cost trend rate is assumed to decline (the ultimate trend rate) | n/a | n/a | 5.00 | % | 5.00 | % | |||||
Year that the rate reaches the ultimate trend rate | n/a | n/a | 2020 | 2020 | |||||||
Weighted-average assumptions used to determine net periodic benefit cost (made at the beginning of the period) for the years ended June 30, 2014, 2013 and 2012 are as follows:
Pension Plans | Postretirement Plan | ||||||||||||||||
Years Ended June 30, | Years Ended June 30, | ||||||||||||||||
2014 | 2013 | 2012 | 2014 | 2013 | 2012 | ||||||||||||
Discount rate | 4.80 | % | 4.21 | % | 5.68 | % | 4.50 | % | 3.90 | % | 5.35 | % | |||||
Expected long-term return on plan assets | 4.57 | % | 4.00 | % | 4.00 | % | n/a | n/a | n/a | ||||||||
Rate of compensation increase | 2.98 | % | 2.96 | % | 2.97 | % | n/a | n/a | n/a | ||||||||
Healthcare cost trend rate assumed for next year | n/a | n/a | n/a | 7.75 | % | 8.25 | % | 8.75 | % | ||||||||
Rate to which the cost trend rate is assumed to decline (the ultimate trend rate) | n/a | n/a | n/a | 5.00 | % | 5.00 | % | 5.00 | % | ||||||||
Year that the rate reaches the ultimate trend rate | n/a | n/a | n/a | 2020 | 2020 | 2020 | |||||||||||
The discount rate was determined (based on the expected duration of the benefit payments for the plans) from the Towers Watson U.S. Rate Link: 40-90 Discount Rate Model as of June 30, 2014 and 2013 to select a rate at which the Company believed the plans' benefits could be effectively settled. This model was developed by examining the yields on selected highly rated corporate bonds. The Company's expected long-term return on plan assets is based on a periodic review and modeling of the plans' asset allocation structures over a long-term horizon. Expectations of returns for each asset class are the most important of the assumptions used in the review and modeling and are based on comprehensive reviews of historical data, forward-looking economic outlook, and economic/financial market theory. The expected long-term rate of return was selected from within the reasonable range of rates determined by (a) historical real returns, net of inflation, for the asset classes covered by the investment policy and (b) projections of inflation over the long-term period during which benefits are payable to plan participants.
Assumed healthcare cost trend rates are a key assumption used for the amounts reported for the Postretirement Plan. A one percentage point change in assumed healthcare cost trend rates would have the following effects:
Increase (Decrease) on Total of Service and Interest Cost Components for the | Increase (Decrease) on Benefit Obligation at | ||||||||||||||||||
Years Ended June 30, | June 30, | ||||||||||||||||||
2014 | 2013 | 2012 | 2014 | 2013 | |||||||||||||||
One percentage point increase | $ | 76 | $ | 75 | $ | 76 | $ | 1,031 | $ | 898 | |||||||||
One percentage point decrease | (66 | ) | (60 | ) | (64 | ) | (906 | ) | (807 | ) | |||||||||
F-27
THE MADISON SQUARE GARDEN COMPANY
NOTES TO CONSOLIDATED FINANCIAL STATEMENTS
(Continued)
Plan Assets and Investment Policy
The weighted-average asset allocation of the pension plan assets at June 30, 2014 and 2013 was as follows:
June 30, | |||||
Asset Classes (a): | 2014 | 2013 | |||
Fixed income securities | 76 | % | 75 | % | |
Cash equivalents | 24 | % | 25 | % | |
100 | % | 100 | % | ||
_____________________
(a) | The Company's target allocation for pension plan assets is 80% fixed income securities and 20% cash equivalents as of June 30, 2014. |
Investment allocation decisions are formally made by the Company's Investment and Benefits Committee, which takes into account investment advice provided by the Company's external investment consultant. The investment consultant takes into account expected long-term risk, return, correlation, and other prudent investment assumptions when recommending asset classes and investment managers to the Company's Investment and Benefits Committee. The investment consultant also takes into account the plans' liabilities when making investment allocation recommendations. Those decisions are driven by asset/liability studies conducted by the external investment consultant who combines actuarial considerations and strategic investment advice. The major categories of the pension plan assets are cash equivalents and long duration bonds which are marked-to-market on a daily basis. Due to the fact that the pension plan assets are significantly made up of long duration bonds, the pension plan assets are subjected to interest-rate risk; specifically, a rising interest rate environment. However, these assets are structured in an asset/liability framework. Consequently, an increase in interest rates would cause a corresponding decrease to the overall liability of the plans, thus creating a hedge against rising interest rates. Additional risks involving the asset/liability framework include earning insufficient returns to cover future liabilities and imperfect hedging of the liability. In addition, a portion of the long duration bond portfolio is invested in non-government securities which are subject to credit risk of the bond issuer defaulting on interest and/or principal payments.
Investments at Estimated Fair Value
The cumulative fair values of the individual plan assets at June 30, 2014 and 2013 by asset class are as follows:
Fair Value of Investments at June 30, 2014 | Level I | Level II | Level III | Total | |||||||||||
Fixed income securities: | |||||||||||||||
U.S. Treasury Securities | $ | 17,050 | $ | — | $ | — | $ | 17,050 | |||||||
U.S. corporate bonds | — | 52,297 | — | 52,297 | |||||||||||
Foreign issued corporate bonds | — | 15,591 | — | 15,591 | |||||||||||
Municipal bonds | — | 236 | — | 236 | |||||||||||
Money market accounts | 26,637 | — | — | 26,637 | |||||||||||
Total investments measured at fair value | $ | 43,687 | $ | 68,124 | $ | — | $ | 111,811 | |||||||
Fair Value of Investments at June 30, 2013 | |||||||||||||||
Fixed income securities: | |||||||||||||||
U.S. Treasury Securities | $ | 24,410 | $ | — | $ | — | $ | 24,410 | |||||||
U.S. corporate bonds | — | 39,471 | — | 39,471 | |||||||||||
Foreign issued corporate bonds | — | 10,406 | — | 10,406 | |||||||||||
Municipal bonds | — | 202 | — | 202 | |||||||||||
Money market accounts | 25,173 | — | — | 25,173 | |||||||||||
Total investments measured at fair value | $ | 49,583 | $ | 50,079 | $ | — | $ | 99,662 | |||||||
F-28
THE MADISON SQUARE GARDEN COMPANY
NOTES TO CONSOLIDATED FINANCIAL STATEMENTS
(Continued)
Contributions for Qualified Defined Benefit Pension Plans
The Company contributed $4,400 and $1,400 to the MSG Cash Balance Pension Plan and Union Plans, respectively, during the year ended June 30, 2014. The Company expects to contribute $6,300 and $1,200 to the MSG Cash Balance Pension Plan and Union Plans, respectively, in fiscal year 2015.
Estimated Future Benefit Payments
The following table presents estimated future fiscal year benefit payments, as well as the expected Medicare Prescription Drug Subsidy, for the Pension Plans and Postretirement Plan:
Pension Plans | Postretirement Plan | Subsidy | |||||||||
Fiscal year ending June 30, 2015 | $ | 7,920 | $ | 300 | $ | — | |||||
Fiscal year ending June 30, 2016 | 7,990 | 375 | — | ||||||||
Fiscal year ending June 30, 2017 | 8,500 | 430 | — | ||||||||
Fiscal year ending June 30, 2018 | 9,110 | 496 | — | ||||||||
Fiscal year ending June 30, 2019 | 9,980 | 574 | — | ||||||||
Fiscal years ending June 30, 2020 – 2024 | 66,080 | 3,632 | — | ||||||||
Savings Plans
The Company sponsors the MSG Holdings, L.P. 401(k) Savings Plan and the MSG Holdings, L.P. Excess Savings Plan (the “MSG Savings Plans”). Expenses related to the MSG Savings Plans included in the accompanying consolidated statements of operations were $3,685, $3,529, $3,112 for the years ended June 30, 2014, 2013 and 2012, respectively.
Multiemployer Plans
The Company contributes to a number of multiemployer defined benefit pension plans, multiemployer defined contribution pension plans, and multiemployer health and welfare plans that provide benefits to retired union-represented employees under the terms of collective bargaining agreements.
Multiemployer Defined Benefit Pension Plans
The multiemployer defined benefit pension plans to which the Company contributes generally provide for retirement and death benefits for eligible union-represented employees based on specific eligibility/participant requirements, vesting periods and benefit formulas. The risks to the Company of participating in these multiemployer defined benefit pension plans are different from single-employer defined benefit pension plans in the following aspects:
• | Assets contributed to a multiemployer defined benefit pension plan by one employer may be used to provide benefits to employees of other participating employers. |
• | If a participating employer stops contributing to a multiemployer defined benefit pension plan, the unfunded obligations of the plan may be borne by the remaining participating employers. |
• | If the Company chooses to stop participating in some of these multiemployer defined benefit pension plans, the Company may be required to pay those plans an amount based on the Company's proportion of the underfunded status of the plan, referred to as a withdrawal liability. However, cessation of participation in a multiemployer defined benefit pension plan and subsequent payment of any withdrawal liability is subject to the collective bargaining process. |
The following table outlines the Company's participation in multiemployer defined benefit pension plans for the years ended June 30, 2014, 2013 and 2012, and summarizes the contributions that the Company has made during each period. The “EIN” and “Pension Plan Number” columns provide the Employer Identification Number and the three digit plan number for each applicable plan. The most recent Pension Protection Act zone status available as of June 30, 2014 and 2013 relates to the plan's two most recent years ended which are indicated. Among other factors, plans in the red zone are generally less than 65% funded, plans in the orange zone are both less than 80% funded and have an accumulated funding deficiency or are expected to have a deficiency in any of the next six plan years, plans in the yellow zone are less than 80% funded, and plans in the green zone are at least 80% funded. The “FIP/RP Status Pending/Implemented” column indicates whether a funding improvement
F-29
THE MADISON SQUARE GARDEN COMPANY
NOTES TO CONSOLIDATED FINANCIAL STATEMENTS
(Continued)
plan (“FIP”) for yellow/orange zone plans or a rehabilitation plan (“RP”) for red zone plans is either pending or has been implemented by the trustees of such plan. The zone status and any FIP or RP information is based on information that the Company received from the plan, and the zone status is as certified by the plan's actuary. The last column lists the expiration date(s) or a range of expiration dates of the collective bargaining agreement(s) to which the plans are subject. There are no other significant changes that affect such comparability.
PPA Zone Status | FIP/RP Status Pending / Implemented | MSG Contributions | |||||||||||||||||||||||
As of June 30, | Years Ended June 30, | ||||||||||||||||||||||||
Plan Name | EIN | Pension Plan Number | 2014 | 2013 | 2014 | 2013 | 2012 | Surcharge Imposed | Expiration Date of CBA | ||||||||||||||||
National Basketball Association Players' Pension Plan | 13-5582586 | 003 | Yellow as of 2/1/2013 | Yellow as of 2/1/2012 | Implemented | $ | 1,687 | $ | 1,609 | $ | 1,514 | No | 6/2021 (with certain termination rights becoming effective 6/2017) | ||||||||||||
Pension Fund of Local No. 1 of I.A.T.S.E. | 13-6414973 | 001 | Green as of 12/31/2012 | Green as of 12/31/2011 | No | 2,120 | 1,789 | 2,120 | No | 5/1/2015 - 2/28/2018 | |||||||||||||||
The Pension, Hospitalization and Benefit Plan of the Electrical Industry – Pension Trust Fund | 13-6123601 | 001 | Green as of 9/30/2013 | Green as of 9/30/2012 | No | 2,051 | 1,750 | 1,889 | No | 6/30/2015 | |||||||||||||||
NBA Pension Plan for Coaches, Assistant Coaches and Trainers | 13-5582586 | 004 | Yellow as of 5/31/13 | Yellow as of 5/31/12 | Implemented | 397 | 350 | 788 | No | n/a | |||||||||||||||
All Other Multiemployer Defined Benefit Pension Plans | 3,148 | 2,686 | 2,821 | ||||||||||||||||||||||
$ | 9,403 | $ | 8,184 | $ | 9,132 | ||||||||||||||||||||
The Company was listed in the following plans' Form 5500's as providing more than 5 percent of the total contributions for the following plans and plan years:
Fund Name | Year Contributions to Plan Exceeded 5 Percent of Total Contributions (As of Plan's Year-End) |
Pension Fund of Local No. 1 of I.A.T.S.E | December 31, 2012, 2011 and 2010 |
Pension Fund of Wardrobe Attendants Union Local 764 | December 31, 2012, 2011 and 2010 |
32BJ/Broadway League Pension Fund | December 31, 2012, 2011 and 2010 |
NBA Pension Plan for Coaches, Assistant Coaches and Trainers | May 31, 2012, 2011 and 2010 |
Pension Fund of Moving Picture Machine Operators Union of Greater New York, Local 306 | December 31, 2011 |
Multiemployer Defined Contribution Pension Plans and Multiemployer Plans That Provide Health and Welfare Benefits
The Company contributed $5,138, $4,895 and $5,788 for the years ended June 30, 2014, 2013 and 2012, respectively, to multiemployer defined contribution pension plans. In addition, the Company contributed $10,670, $9,464 and $9,973 for the years ended June 30, 2014, 2013 and 2012, respectively, to multiemployer plans that provide health and welfare benefits to retired employees.
F-30
THE MADISON SQUARE GARDEN COMPANY
NOTES TO CONSOLIDATED FINANCIAL STATEMENTS
(Continued)
Note 17. Share-based Compensation
In connection with the Distribution, the Company adopted The Madison Square Garden Company 2010 Employee Stock Plan (the “Employee Stock Plan”) and The Madison Square Garden Company 2010 Stock Plan for Non-Employee Directors (the “Non-Employee Director Plan”).
Under the Employee Stock Plan, the Company is authorized to grant incentive stock options and non-qualified stock options (“options” or "stock options”), restricted shares, RSUs, stock appreciation rights (“rights” or “SARs”) and other equity-based awards. The Company may grant awards for up to 7,000 shares of the Company's Class A Common Stock (subject to certain adjustments). Options and rights under the Employee Stock Plan must be granted with an exercise price of not less than the fair market value of a share of the Company's Class A Common Stock on the date of grant and must expire no later than 10 years from the date of grant (or up to one additional year in the case of the death of a holder). The terms and conditions of awards granted under the Employee Stock Plan, including vesting and exercisability, are determined by the Compensation Committee of the Board of Directors (“Compensation Committee”) and may include performance targets. RSUs that were awarded under the Employee Stock Plan are generally subject to three-year cliff vesting, and certain RSUs are also subject to certain performance conditions. RSUs that were awarded by the Company to its employees will settle in shares of the Company's Class A Common Stock (either from treasury or with newly issued shares), or, at the option of the Compensation Committee, in cash.
Under the Non-Employee Director Plan, the Company is authorized to grant non-qualified stock options, RSUs and other equity-based awards. The Company may grant awards for up to 300 shares of the Company's Class A Common Stock (subject to certain adjustments). Non-qualified stock options under the Non-Employee Director Plan must be granted with an exercise price of not less than the fair market value of a share of the Company's Class A Common Stock on the date of grant and must expire no later than 10 years from the date of grant (or up to one additional year in the case of the death of a holder). The terms and conditions of awards granted under the Non-Employee Director Plan, including vesting and exercisability, are determined by the Compensation Committee. Unless otherwise provided in an applicable award agreement, non-qualified stock options granted under this plan will be fully vested and exercisable, and RSUs granted under this plan will be fully vested, upon the date of grant and will settle in shares of the Company's Class A Common Stock (either from treasury or with newly issued shares), or, at the option of the Compensation Committee, in cash, on the first business day after ninety days from the date the director's service on the Board of Directors ceases or, if earlier, upon the director's death.
Treatment After the Distribution of Share-based Payment Awards Initially Granted Under Cablevision Equity Award Programs
Prior to the Distribution certain Company employees and employees and non-employee directors of Cablevision (some of whom are employees or directors of the Company) participated in Cablevision's equity award programs (“Cablevision Stock Plans”).
In connection with the Distribution, each Cablevision stock option and right outstanding at the Distribution date became two options/rights. Cablevision options were converted into options to acquire Cablevision NY Group Class A Common Stock and options to acquire the Company's Class A Common Stock. Cablevision rights were converted into rights with respect to the cash value of Cablevision NY Group Class A Common Stock and rights with respect to the cash value of the Company's Class A Common Stock. The number of shares of the Company's Class A Common Stock that became subject to each option/right was based on a one:four distribution ratio (i.e., one share of the Company's Class A Common Stock for every four shares of Cablevision NY Group Class A Common Stock). As a result, the Company issued to holders of Cablevision options and rights (including its employees and Cablevision employees and/or non-employee directors) 2,471 non-qualified options for the Company's Class A Common Stock and 155 Company SARs. The existing exercise price was allocated between the existing Cablevision options/rights and the Company options/rights based upon the ten-day weighted-average prices of the Cablevision NY Group Class A Common Stock and the Company's Class A Common Stock, taking into account the one:four distribution ratio. As a result of this adjustment, 82.63% of the pre-Distribution exercise price of options and rights was allocated to the Cablevision options and rights and 17.37% was allocated to the Company's options and rights. The options and the rights with respect to the Company's Class A Common Stock were issued under the Company's Employee Stock Plan or the Non-Employee Director Plan, as applicable. As of June 30, 2013 all SARs were either exercised or forfeited.
Further, in connection with the Distribution, one share of the Company's Class A Common Stock was issued in respect of every four shares of Cablevision restricted stock, and such shares were restricted on the same basis as the underlying Cablevision restricted shares. These shares were not issued under any of the Company's equity plans as they were issued as a dividend in respect of Cablevision NY Group Class A Common Stock in connection with the Distribution. As a result of the Distribution, the Company issued to holders of Cablevision equity awards (including its employees and Cablevision employees and/or non-
F-31
THE MADISON SQUARE GARDEN COMPANY
NOTES TO CONSOLIDATED FINANCIAL STATEMENTS
(Continued)
employee directors) 2,238 shares of the Company's Class A Common Stock (restricted on the same basis as the underlying Cablevision shares) and 45 unrestricted shares of the Company's Class A Common Stock. As of June 30, 2013 all shares of the Company's Class A Common Stock (restricted on the same basis as the underlying Cablevision shares) were either vested or forfeited.
In addition, in connection with the Distribution, non-employee directors of Cablevision (some of whom are directors of the Company) received one share of the Company's Class A Common Stock under the Non-Employee Director Plan for every four RSUs held under the applicable Cablevision equity plan. Such shares were not subject to any restrictions.
On June 30, 2011, Cablevision distributed to its stockholders all of the outstanding common stock of AMC Networks Inc. (the “AMC Networks Distribution”). As a result, certain Company employees and directors who continued to hold Cablevision equity awards at the time of the AMC Networks Distribution received options, rights and/or restricted shares of AMC Networks Inc. (“AMC Networks”).
Share-based Compensation Expense
Share-based compensation expense was recognized in the consolidated statements of operations as part of selling, general and administrative expenses. The following table presents the share-based compensation expense reduced for estimated forfeitures recorded during the years ended June 30, 2014, 2013 and 2012.
Years Ended June 30, | |||||||||||
2014 | 2013 | 2012 | |||||||||
Company restricted stock units | $ | 21,750 | $ | 14,661 | $ | 14,487 | |||||
Company stock appreciation rights | — | 16 | 28 | ||||||||
Company restricted shares | — | 635 | 1,395 | ||||||||
Cablevision stock appreciation rights | — | 16 | (242 | ) | |||||||
Cablevision restricted shares | — | — | 1,791 | ||||||||
AMC Networks stock appreciation rights | — | 12 | 103 | ||||||||
AMC Networks restricted shares | — | — | 643 | ||||||||
Total share-based compensation | $ | 21,750 | $ | 15,340 | $ | 18,205 | |||||
As of June 30, 2014, there was $14,437 of unrecognized compensation cost related to unvested RSUs held by Company employees. The cost is expected to be recognized over a weighted-average period of 1.6 years for unvested RSUs. There were no costs related to share-based compensation that were capitalized. Tax benefits realized from tax deductions associated with share-based compensation expense for the years ended June 30, 2014, 2013 and 2012 totaled $11,033, $14,971 and $11,256, respectively.
Stock Options Award Activity
The following table summarizes activity relating to holders (including Company, Cablevision and AMC Networks employees and directors) of the Company's stock options for the year ended June 30, 2014:
Number of | Weighted Average Exercise Price Per Share | Weighted Average Remaining Contractual Term (In Years) | Aggregate Intrinsic Value | ||||||||||||
Non-Performance Vesting Options | Performance Vesting Options (a) | ||||||||||||||
Balance as of June 30, 2013 | 332 | 35 | $ | 12.63 | 2.70 | $ | 17,117 | ||||||||
Exercised (b) | (154 | ) | (15 | ) | $ | 13.67 | |||||||||
Balance as of June 30, 2014 | 178 | 20 | $ | 11.74 | 1.40 | $ | 10,025 | ||||||||
Exercisable as of June 30, 2014 | 178 | 20 | $ | 11.74 | 1.40 | $ | 10,025 | ||||||||
_____________________
(a) | The Cablevision performance objective with respect to these awards has been achieved. |
(b) | Stock options exercised include 111 Company stock options that were exercised pursuant to a cashless exercise, of which approximately 70 Company stock options were surrendered to the Company in order to meet tax withholding requirements |
F-32
THE MADISON SQUARE GARDEN COMPANY
NOTES TO CONSOLIDATED FINANCIAL STATEMENTS
(Continued)
and for the exercise price of the stock options. The Company remitted to Cablevision $2,401, which represents the aggregate value on the exercise date of the stock options that were surrendered to the Company to meet tax withholding requirements. This amount is reflected as a financing activity in the accompanying consolidated statement of cash flows for the year ended June 30, 2014 and has been classified as additional paid-in capital.
The aggregate intrinsic value is calculated as the difference between (i) the exercise price of the underlying award and (ii) the quoted price of the Company's Class A Common Stock for all options outstanding (and all exercisable) which were all in-the-money at June 30, 2014 and 2013, as applicable. For the years ended June 30, 2014, 2013 and 2012, the aggregate intrinsic value of the Company's stock options exercised was $7,055, $39,730 and $7,196, respectively, determined as of the date of option exercise.
Restricted Shares Award Activity
There were no restricted shares outstanding as of June 30, 2014 and 2013 and 119 restricted shares outstanding as of June 30, 2012 relating to the Company's Class A Common Stock issued under the Employee Stock Plan.
During the year ended June 30, 2013, 119 restricted shares of the Company's Class A Common Stock issued under the Employee Stock Plan vested. During the year ended June 30, 2012, 1,067 shares of the Company's Class A Common Stock restricted on the same basis as the underlying Cablevision restricted shares vested. The fair value of the shares vested during the years ended June 30, 2013 and 2012 was $6,826 and $34,668, respectively. To fulfill the employees' statutory minimum tax withholding obligations for the applicable income and other employment taxes, 363 of the shares that vested during the year ended June 30, 2012, with an aggregate value of $11,768, were surrendered to the Company and reflected as financing activity within the consolidated statement of cash flows. These acquired shares have been classified as treasury stock.
Restricted Share Units Award Activity
The following table summarizes activity relating to the Company's RSUs for the year ended June 30, 2014:
Number of | Weighted-Average Fair Value Per Share At Date of Grant | ||||||||
Non-Performance Vesting RSUs | Performance Vesting RSUs | ||||||||
Unvested award balance as of June 30, 2013 | 953 | 493 | $ | 29.97 | |||||
Granted | 242 | 152 | $ | 56.64 | |||||
Vested | (275 | ) | (169 | ) | $ | 28.93 | |||
Forfeited | (144 | ) | — | $ | 35.21 | ||||
Unvested award balance as of June 30, 2014 | 776 | 476 | $ | 38.10 | |||||
The fair value of RSUs that vested during the year ended June 30, 2014 was $25,556. Upon vesting, RSUs granted under the Employee Stock Plan were net share-settled to cover the required statutory tax withholding obligations and the remaining number of shares were issued from the Company's treasury shares. To fulfill the employees' statutory minimum tax withholding obligations for the applicable income and other employment taxes, 173 of these RSUs, with an aggregate value of $9,965 were retained by the Company and reflected as financing activity in the accompanying consolidated statement of cash flows for the year ended June 30, 2014.
The fair value of RSUs that vested during the years ended June 30, 2013 and 2012, was $35,913 and $1,772, respectively. The weighted-average fair value per share at date of grant of RSUs granted during the years ended June 30, 2013 and 2012 was $42.21 and $24.12, respectively.
Note 18. Related Party Transactions
As of June 30, 2014, members of the Dolan family group, for purposes of Section 13(d) of the Securities Exchange Act of 1934, as amended, including trusts for the benefit of the Dolan family group, collectively beneficially own all of the Company's outstanding Class B Common Stock and own approximately 1.8% of the Company's outstanding Class A Common Stock. Such shares of the Company's Class A Common Stock and Class B Common Stock, collectively, represent approximately 69% of the aggregate voting power of the Company's outstanding common stock. Members of the Dolan family are also the controlling stockholders of both Cablevision and AMC Networks.
F-33
THE MADISON SQUARE GARDEN COMPANY
NOTES TO CONSOLIDATED FINANCIAL STATEMENTS
(Continued)
The Company has entered into various agreements with Cablevision in connection with, and subsequent to, the Distribution. These agreements include arrangements with respect to a number of ongoing commercial relationships including affiliation agreements for carriage of MSG Networks and Fuse. As a result of the AMC Networks Distribution, certain of those arrangements between Cablevision and the Company, as well as arrangements entered into subsequent to the AMC Networks Distribution, are with AMC Networks.
The following table summarizes the composition and amounts of related party transactions that are reflected in revenues and operating expenses in the accompanying consolidated statements of operations for the years ended June 30, 2014, 2013 and 2012:
Years Ended June 30, | |||||||||||
2014 | 2013 | 2012 | |||||||||
Revenues | $ | 183,527 | $ | 169,706 | $ | 169,532 | |||||
Operating expenses: | |||||||||||
Origination, master control and post production services | $ | (9,070 | ) | $ | (9,201 | ) | $ | (9,819 | ) | ||
Advertising expense | (13,283 | ) | (11,677 | ) | (7,452 | ) | |||||
Corporate general and administrative | (2,823 | ) | (2,122 | ) | (2,989 | ) | |||||
Telephone and other fiber optic transmission services | (2,201 | ) | (1,743 | ) | (1,650 | ) | |||||
Other expenses | (2,027 | ) | (1,827 | ) | (2,205 | ) | |||||
Revenues
Revenues from related parties primarily consist of revenues recognized from the distribution of programming services to subsidiaries of Cablevision and include sponsorship revenue as well as advertising and promotional benefits received by the Company which is recognized as the benefits are realized.
Origination, Master Control and Post Production Services
AMC Networks provides certain origination, master control and post production services to the Company.
Advertising Expenses
The Company incurs advertising expenses for services rendered by its related parties, primarily Cablevision, most of which are related to the utilization of advertising and promotional benefits by the Company, with an equal amount being recognized as revenue when the benefits are realized.
Corporate General and Administrative
Amounts are charged to the Company for corporate general and administrative expenses pursuant to administrative and other service agreements with Cablevision.
Telephone and other fiber optic transmission services
Amounts are charged to the Company by Cablevision for telephone and other fiber optic transmission services.
Other Expenses
The Company and its related parties enter into transactions with each other in the ordinary course of business. Amounts charged to the Company for other transactions with its related parties are net of amounts charged by the Company to the Knickerbocker Group, LLC, an entity owned by James L. Dolan, the Executive Chairman and a director of the Company, for office space equal to the allocated cost of such space.
Other
See Note 7 for information on the revolving credit loans that the Company provides to Azoff-MSG.
See Note 10 for information on the Company's capital lease obligations due to a related party.
F-34
THE MADISON SQUARE GARDEN COMPANY
NOTES TO CONSOLIDATED FINANCIAL STATEMENTS
(Continued)
See Note 17 for information on share-based payment awards initially granted under Cablevision equity award programs.
Note 19. Income Taxes
Income tax expense is comprised of the following components:
Years Ended June 30, | |||||||||||
2014 | 2013 | 2012 | |||||||||
Current expense: | |||||||||||
Federal | $ | 48,269 | $ | 71,969 | $ | 22,930 | |||||
State and other | 28,680 | 28,498 | 28,386 | ||||||||
76,949 | 100,467 | 51,316 | |||||||||
Deferred expense (benefit): | |||||||||||
Federal | (7,129 | ) | 531 | 36,977 | |||||||
State and other | (8,439 | ) | 4,992 | (15,183 | ) | ||||||
(15,568 | ) | 5,523 | 21,794 | ||||||||
Tax expense relating to uncertain tax positions | 97 | 492 | 192 | ||||||||
Income tax expense | $ | 61,478 | $ | 106,482 | $ | 73,302 | |||||
The income tax expense differs from the amount derived by applying the statutory federal rate to pre-tax income principally due to the effect of the following items:
Years Ended June 30, | |||||||||||
2014 | 2013 | 2012 | |||||||||
Federal tax expense at statutory federal rate | $ | 61,791 | $ | 87,102 | $ | 62,945 | |||||
State income taxes, net of federal benefit | 16,240 | 20,394 | 15,876 | ||||||||
Change in the estimated applicable corporate tax rate used to determine deferred taxes | (2,225 | ) | 1,304 | (6,073 | ) | ||||||
Nondeductible disability insurance premiums expense and (nontaxable) disability insurance recoveries, net | 2,201 | 1,165 | 2,173 | ||||||||
Domestic production activities tax deduction | (7,016 | ) | (6,773 | ) | (1,695 | ) | |||||
Tax expense relating to uncertain tax positions | 97 | 492 | 192 | ||||||||
Federal tax credit related to the Forum | (8,498 | ) | — | — | |||||||
Nondeductible expenses and other | (1,112 | ) | 2,798 | (116 | ) | ||||||
Income tax expense | $ | 61,478 | $ | 106,482 | $ | 73,302 | |||||
The tax effects of temporary differences which give rise to significant portions of the deferred tax assets and liabilities at June 30, 2014 and 2013 are as follows:
June 30, | |||||||
2014 | 2013 | ||||||
Deferred tax asset (liability) | |||||||
Investment in MSG L.P. | $ | (533,262 | ) | $ | (552,873 | ) | |
Compensation and benefit plans | 12,928 | 9,120 | |||||
Net noncurrent deferred tax liability | $ | (520,334 | ) | $ | (543,753 | ) | |
The current federal tax liability of $12,482 and $32,944 as of June 30, 2014 and 2013, respectively, is reflected in other accrued liabilities in the accompanying consolidated balance sheets.
Deferred tax assets as of June 30, 2014 have resulted from the Company's future deductible temporary differences. At this time, based on current facts and circumstances, management believes that it is more likely than not that the Company will realize the benefit for its gross deferred tax assets.
F-35
THE MADISON SQUARE GARDEN COMPANY
NOTES TO CONSOLIDATED FINANCIAL STATEMENTS
(Continued)
The following is a reconciliation of the beginning and ending amount of unrecognized tax benefits associated with the Company's uncertain tax positions:
Balance as of June 30, 2013 | $ | 706 | |
Additions for tax positions related to prior years | 165 | ||
Decreases for tax positions related to prior years | (21 | ) | |
Decreases due to examination settlement | (47 | ) | |
Balance as of June 30, 2014 | $ | 803 | |
During the year ended June 30, 2014, the Company recorded $97 in tax expense on uncertain tax positions including interest and penalties. The expense related to uncertain tax positions taken in prior years and was primarily comprised of state taxes associated with a filing position that is currently being challenged by the taxing authority on appeal. The Company recognizes accrued interest and penalties on unrecognized tax benefits as a component of income tax expense. If favorably realized, the unrecognized tax benefits at June 30, 2014 would decrease the Company's effective tax rate from 34.8% to 34.2%.
During the fourth quarter of fiscal year 2012, the Internal Revenue Service commenced an examination of the Company's federal income tax return as filed for the period from February 10, 2010 through December 31, 2010. The final agent report was accepted in September 2013 and the examination is now closed. The examination concluded without material changes to the tax return as filed.
During the fourth quarter of fiscal year 2014, the State of New York commenced an examination of the Company's State of New York income tax returns as filed for the tax years ended December 31, 2010, 2011, and 2012. The examination is currently in the early stages of fieldwork. The Company does not expect the examination, when finalized, to result in material changes to the tax returns as filed.
The federal and state statute of limitations are currently open on the Company's 2010, 2011, 2012 and 2013 tax returns.
Note 20. Segment Information
The Company classifies its business interests into three reportable segments which are MSG Media, MSG Entertainment and MSG Sports. The Company allocates certain corporate costs to all of its reportable segments. In addition, the Company allocates its venue operating expenses to its MSG Entertainment and MSG Sports segments. Allocated venue operating expenses include the non-event related costs of operating the Company's venues, and include such costs as rent, real estate taxes, insurance, utilities, repairs and maintenance, and labor related to the overall management of the venues. Depreciation expense related to The Garden, The Theater at Madison Square Garden, and the Forum is not allocated to the reportable segments and is reported in “All other.”
The Company conducts a significant portion of its operations at venues that it either owns or operates under long-term leases. The Company owns The Garden and The Theater at Madison Square Garden in New York City, the Forum in Inglewood, CA, and The Chicago Theatre in Chicago. In addition, the Company leases Radio City Music Hall and the Beacon Theatre in New York City, and has a booking agreement with respect to the Wang Theatre in Boston.
The Company evaluates segment performance based on several factors, of which the key financial measure is their operating income (loss) before (i) depreciation, amortization and impairments of property and equipment and intangible assets, (ii) share-based compensation expense or benefit and (iii) restructuring charges or credits, which is referred to as adjusted operating cash flow (“AOCF”), a non-GAAP measure. The Company believes AOCF is an appropriate measure for evaluating the operating performance of its business segments and the Company on a consolidated basis. AOCF and similar measures with similar titles are common performance measures used by investors and analysts to analyze the Company's performance. The Company uses revenues and AOCF measures as the most important indicators of its business performance, and evaluates management's effectiveness with specific reference to these indicators. AOCF should be viewed as a supplement to and not a substitute for operating income (loss), net income (loss), cash flows from operating activities, and other measures of performance and/or liquidity presented in accordance with GAAP. The Company has presented the components that reconcile AOCF to operating income (loss), an accepted GAAP measure. Information as to the operations of the Company's reportable segments is set forth below.
F-36
THE MADISON SQUARE GARDEN COMPANY
NOTES TO CONSOLIDATED FINANCIAL STATEMENTS
(Continued)
Years Ended June 30, | |||||||||||
2014 | 2013 | 2012 | |||||||||
Revenues | |||||||||||
MSG Media | $ | 714,514 | $ | 677,733 | $ | 614,168 | |||||
MSG Entertainment | 300,998 | 252,195 | 263,976 | ||||||||
MSG Sports | 612,071 | 470,290 | 464,726 | ||||||||
All other | 546 | 458 | 165 | ||||||||
Inter-segment eliminations (a) | (72,535 | ) | (59,858 | ) | (59,019 | ) | |||||
$ | 1,555,594 | $ | 1,340,818 | $ | 1,284,016 | ||||||
The Company's inter-segment revenue eliminations by reportable segment are as follows:
Years Ended June 30, | |||||||||||
2014 | 2013 | 2012 | |||||||||
MSG Entertainment | $ | — | $ | (81 | ) | $ | (93 | ) | |||
MSG Sports | (72,535 | ) | (59,777 | ) | (58,926 | ) | |||||
$ | (72,535 | ) | $ | (59,858 | ) | $ | (59,019 | ) | |||
Reconciliation (by Segment and in Total) of AOCF to Operating Income (Loss)
Years Ended June 30, | |||||||||||
2014 | 2013 | 2012 | |||||||||
AOCF | |||||||||||
MSG Media | $ | 343,497 | $ | 349,506 | $ | 258,599 | |||||
MSG Entertainment | (4,284 | ) | (10,205 | ) | 5,295 | ||||||
MSG Sports | 3,575 | 27,014 | 28,717 | ||||||||
All other (b)(c) | (29,975 | ) | (10,754 | ) | (9,376 | ) | |||||
$ | 312,813 | $ | 355,561 | $ | 283,235 | ||||||
Years Ended June 30, | |||||||||||
2014 | 2013 | 2012 | |||||||||
Depreciation and amortization (including impairments) | |||||||||||
MSG Media | $ | 15,559 | $ | 16,358 | $ | 24,616 | |||||
MSG Entertainment | 9,900 | 9,522 | 9,653 | ||||||||
MSG Sports | 12,225 | 10,451 | 11,003 | ||||||||
All other (d) | 69,266 | 52,801 | 42,231 | ||||||||
$ | 106,950 | $ | 89,132 | $ | 87,503 | ||||||
Years Ended June 30, | |||||||||||
2014 | 2013 | 2012 | |||||||||
Share-based compensation expense | |||||||||||
MSG Media | $ | 4,770 | $ | 4,579 | $ | 5,637 | |||||
MSG Entertainment | 5,566 | 5,005 | 4,944 | ||||||||
MSG Sports | 4,813 | 3,089 | 4,645 | ||||||||
All other (c) | 6,601 | 2,667 | 2,979 | ||||||||
$ | 21,750 | $ | 15,340 | $ | 18,205 | ||||||
F-37
THE MADISON SQUARE GARDEN COMPANY
NOTES TO CONSOLIDATED FINANCIAL STATEMENTS
(Continued)
Years Ended June 30, | |||||||||||
2014 | 2013 | 2012 | |||||||||
Operating income (loss) | |||||||||||
MSG Media | $ | 323,168 | $ | 328,569 | $ | 228,346 | |||||
MSG Entertainment | (19,750 | ) | (24,732 | ) | (9,302 | ) | |||||
MSG Sports | (13,463 | ) | 13,474 | 13,069 | |||||||
All other | (105,842 | ) | (66,222 | ) | (54,586 | ) | |||||
$ | 184,113 | $ | 251,089 | $ | 177,527 | ||||||
A reconciliation of reportable segment operating income to the Company's consolidated income from operations before income taxes is as follows:
Years Ended June 30, | |||||||||||
2014 | 2013 | 2012 | |||||||||
Total operating income for reportable segments | $ | 289,955 | $ | 317,311 | $ | 232,113 | |||||
Other operating loss | (105,842 | ) | (66,222 | ) | (54,586 | ) | |||||
Operating income | 184,113 | 251,089 | 177,527 | ||||||||
Items excluded from operating income: | |||||||||||
Equity in loss of nonconsolidated affiliates | (1,323 | ) | — | — | |||||||
Interest income | 2,508 | 2,195 | 2,318 | ||||||||
Interest expense | (7,406 | ) | (7,917 | ) | (7,070 | ) | |||||
Miscellaneous income (expense) (e) | (1,346 | ) | 3,497 | 7,072 | |||||||
Income from operations before income taxes | $ | 176,546 | $ | 248,864 | $ | 179,847 | |||||
Years Ended June 30, | |||||||||||
2014 | 2013 | 2012 | |||||||||
Capital expenditures | |||||||||||
MSG Media | $ | 2,062 | $ | 11,664 | $ | 9,385 | |||||
MSG Entertainment | 6,130 | 3,191 | 3,821 | ||||||||
MSG Sports | 4,674 | 3,242 | 1,872 | ||||||||
All other (f) | 293,523 | 211,400 | 386,346 | ||||||||
$ | 306,389 | $ | 229,497 | $ | 401,424 | ||||||
_________________
(a) | Primarily represents local media rights recognized by the Company's MSG Sports segment from the licensing of team-related programming to the Company's MSG Media segment which are eliminated in consolidation. Local media rights are generally recognized on a straight-line basis over the fiscal year. |
(b) | Consists of unallocated corporate general and administrative costs. |
(c) | The amount for the year ended June 30, 2014 includes executive management transition costs. |
(d) | Principally includes depreciation and amortization expense on The Garden, The Theater at Madison Square Garden and the Forum and certain corporate property, equipment and leasehold improvement assets not allocated to the Company's reportable segments. |
(e) | Miscellaneous expense for the year ended June 30, 2014 primarily includes transaction costs related to the sale of Fuse, which was completed on July 1, 2014 (see Note 23). Miscellaneous income for the year ended June 30, 2013 consists principally of a gain from the sale of all of the Company's holdings of Live Nation common stock (see Note 15). Miscellaneous income for the year ended June 30, 2012 consists principally of the recovery of certain claims in connection with a third party bankruptcy proceeding. |
F-38
THE MADISON SQUARE GARDEN COMPANY
NOTES TO CONSOLIDATED FINANCIAL STATEMENTS
(Continued)
(f) | Consists principally of capital expenditures associated with the Transformation. In addition, amounts for the years ended June 30, 2014 and 2013 include Forum related capital expenditures. Forum related capital expenditures were previously reported in the MSG Entertainment segment; however prior year amounts were reclassified to conform to the current year presentation. |
Substantially all revenues and assets of the Company's reportable segments are attributed to or located in the United States and are primarily concentrated in the New York metropolitan area.
Note 21. Concentrations of Risk
Financial instruments that may potentially subject the Company to a concentration of credit risk consist primarily of cash and cash equivalents and accounts receivable. Cash and cash equivalents are invested in money market funds and bank time deposits. The Company monitors the financial institutions and money market funds where it invests its cash and cash equivalents with diversification among counterparties to mitigate exposure to any single financial institution. The Company's emphasis is primarily on safety of principal and liquidity and secondarily on maximizing the yield on its investments.
The following individual non-affiliated customers accounted for the following percentages of the Company's consolidated accounts receivable balances:
June 30, | |||||
2014 | 2013 | ||||
Customer A | 17 | % | 15 | % | |
Customer B | 16 | % | 14 | % | |
Customer C | 10 | % | 12 | % | |
The Company did not have a single non-affiliated customer that represented 10% or more of its consolidated revenues for years ended June 30, 2014, 2013 and 2012. Revenues from Cablevision amounted to $182,908, $169,354 and $169,481 for the years ended June 30, 2014, 2013 and 2012, which represent 12%, 13% and 13%, respectively, of the Company's consolidated revenues (see Note 18).
The accompanying consolidated balance sheets as of June 30, 2014 and 2013 include the following approximate amounts that are recorded in connection with the Company's license agreement with the New Jersey Devils:
June 30, | |||||||
2014 | 2013 | ||||||
Reported in | |||||||
Prepaid expenses | $ | 1,000 | $ | 4,000 | |||
Other current assets | 2,000 | 2,000 | |||||
Other assets | 42,000 | 42,000 | |||||
$ | 45,000 | $ | 48,000 | ||||
As of June 30, 2014, approximately 5,900 employees, which represents a substantial portion of the Company's workforce, are subject to collective bargaining agreements. Approximately 15% are subject to collective bargaining agreements that expired as of June 30, 2014 and approximately 17% are subject to collective bargaining agreements that will expire as of June 30, 2015 if they are not extended prior thereto.
F-39
THE MADISON SQUARE GARDEN COMPANY
NOTES TO CONSOLIDATED FINANCIAL STATEMENTS
(Continued)
Note 22. Interim Financial Information (Unaudited)
The following is a summary of the Company's selected quarterly financial data for the years ended June 30, 2014 and 2013:
Three Months Ended | Year Ended June 30, 2014 | ||||||||||||||||||
September 30, 2013 | December 31, 2013 | March 31, 2014 | June 30, 2014 | ||||||||||||||||
Revenues | $ | 215,585 | $ | 509,379 | $ | 458,956 | $ | 371,674 | $ | 1,555,594 | |||||||||
Operating expenses | 175,722 | 412,832 | 431,507 | 351,420 | 1,371,481 | ||||||||||||||
Operating income | $ | 39,863 | $ | 96,547 | $ | 27,449 | $ | 20,254 | $ | 184,113 | |||||||||
Net income | $ | 23,868 | $ | 60,509 | $ | 19,054 | $ | 11,637 | $ | 115,068 | |||||||||
Basic earnings per common share | $ | 0.31 | $ | 0.79 | $ | 0.25 | $ | 0.15 | $ | 1.49 | |||||||||
Diluted earnings per common share | $ | 0.31 | $ | 0.77 | $ | 0.24 | $ | 0.15 | $ | 1.47 | |||||||||
Three Months Ended | Year Ended June 30, 2013 | ||||||||||||||||||
September 30, 2012 | December 31, 2012 | March 31, 2013 | June 30, 2013 | ||||||||||||||||
Revenues | $ | 204,166 | $ | 387,886 | $ | 412,406 | $ | 336,360 | $ | 1,340,818 | |||||||||
Operating expenses | 163,976 | 306,863 | 348,620 | 270,270 | 1,089,729 | ||||||||||||||
Operating income | $ | 40,190 | $ | 81,023 | $ | 63,786 | $ | 66,090 | $ | 251,089 | |||||||||
Net income | $ | 20,605 | $ | 46,911 | $ | 38,449 | $ | 36,417 | $ | 142,382 | |||||||||
Basic earnings per common share | $ | 0.27 | $ | 0.62 | $ | 0.50 | $ | 0.47 | $ | 1.87 | |||||||||
Diluted earnings per common share | $ | 0.26 | $ | 0.60 | $ | 0.49 | $ | 0.47 | $ | 1.83 | |||||||||
Note 23. Subsequent Event
On July 1, 2014, the Company completed the previously announced sale of Fuse to SiTV Media, Inc., the parent company of NUVOtv, for a cash purchase price of $226,000, subject to a working capital adjustment. The Company also received a 15% equity interest in SiTV Media, Inc., which interest is subject to potential reduction based on certain performance goals. The assets and liabilities of Fuse have been segregated and reported as held for sale as of June 30, 2014. The components of Assets held for sale and Liabilities held for sale were as follows:
June 30, 2014 | |||
Assets held for sale: | |||
Accounts receivable, net | $ | 22,425 | |
Property and equipment, net | 8,903 | ||
Goodwill | 40,818 | ||
Other assets | 4,910 | ||
Assets held for sale | $ | 77,056 | |
Liabilities held for sale: | |||
Net related party payables | $ | 184 | |
Other accrued expenses | 6,836 | ||
Deferred revenue | 692 | ||
Other liabilities | 3,459 | ||
Liabilities held for sale | $ | 11,171 | |
F-40