Attached files
| file | filename |
|---|---|
| EX-31.2 - EX-31.2 - INTERNATIONAL RECTIFIER CORP /DE/ | irf-2014629xex312.htm |
| EX-21 - EX-21 - INTERNATIONAL RECTIFIER CORP /DE/ | irf-2014629xex21.htm |
| EX-32.1 - EX-32.1 - INTERNATIONAL RECTIFIER CORP /DE/ | irf-2014629xex321.htm |
| EX-24 - EX-24 - INTERNATIONAL RECTIFIER CORP /DE/ | irf-2014629xex24.htm |
| EX-32.2 - EX-32.2 - INTERNATIONAL RECTIFIER CORP /DE/ | irf-2014629xex322.htm |
| EX-10.4 - EX-10.4 - INTERNATIONAL RECTIFIER CORP /DE/ | irf-2014629xex104.htm |
| EX-10.3 - EX-10.3 - INTERNATIONAL RECTIFIER CORP /DE/ | irf-2014629xex103.htm |
| EX-10.1 - EX-10.1 - INTERNATIONAL RECTIFIER CORP /DE/ | irf-2014629xex101.htm |
| EX-23.1 - EX-23.1 - INTERNATIONAL RECTIFIER CORP /DE/ | irf-2014629xex231.htm |
| EX-31.1 - EX-31.1 - INTERNATIONAL RECTIFIER CORP /DE/ | irf-2014629xex311.htm |
| EXCEL - IDEA: XBRL DOCUMENT - INTERNATIONAL RECTIFIER CORP /DE/ | Financial_Report.xls |
| EX-10.2 - EX-10.2 - INTERNATIONAL RECTIFIER CORP /DE/ | irf-2014629xex102.htm |
UNITED STATES
SECURITIES AND EXCHANGE COMMISSION
Washington, D.C. 20549
FORM 10-K
(Mark One) | |
x | ANNUAL REPORT PURSUANT TO SECTION 13 OR 15(d) OF THE SECURITIES EXCHANGE ACT OF 1934 |
For the fiscal year ended June 29, 2014 | |
OR | |
o | TRANSITION REPORT PURSUANT TO SECTION 13 OR 15(d) OF THE SECURITIES EXCHANGE ACT OF 1934 |
For the transition period from to | |
Commission file number 1-7935
INTERNATIONAL RECTIFIER CORPORATION

(Exact Name of Registrant as Specified in Its Charter)
Delaware (State or Other Jurisdiction of Incorporation or Organization) | 95-1528961 (IRS Employer Identification No.) |
101 N. Sepulveda Blvd
El Segundo, CA 90245
(Address of Principal Executive Offices)(Zip Code)
Registrant’s telephone number, including area code: (310) 726-8000
Securities registered pursuant to Section 12(b) of the Act:
Title of Each Class | Name of Each Exchange on Which Registered | |
Common Stock, par value $1.00 | The New York Stock Exchange | |
Securities registered pursuant to Section 12(g) of the Act: None
Indicate by check mark if the registrant is a well-known seasoned issuer, as defined in Rule 405 of the Securities Act. Yes x No o
Indicate by check mark if the registrant is not required to file reports pursuant to Section 13 or Section 15(d) of the Act. Yes o No x
Indicate by check mark whether the registrant (1) has filed all reports required to be filed by Section 13 or 15(d) of the Securities Exchange Act of 1934 during the preceding 12 months (or for such shorter period that the registrant was required to file such reports), and (2) has been subject to such filing requirements for the past 90 days. Yes x No o
Indicate by checkmark whether the registrants submitted electronically and posted on its corporate Website, if any, every Interactive Data file required to be submitted and posted pursuant to Rule 405 of Regulation S-T (§229.405 of this chapter) during the preceding 12 months (or for such shorter period that the registrant was required to submit and post such files.) Yes x No o
Indicate by check mark if disclosure of delinquent filers pursuant to Item 405 of Regulation S-K (§229.405) is not contained herein, and will not be contained, to the best of registrant’s knowledge, in definitive proxy or information statements incorporated by reference in Part III of this Form 10-K or any amendment to this Form 10-K. o
Indicate by check mark whether the registrant is a large accelerated filer, an accelerated filer, a non-accelerated filer, or a smaller reporting company. See the definitions of “large accelerated filer,” “accelerated filer” and “smaller reporting company” in Rule 12b-2 of the Exchange Act. (Check one)
Large accelerated filer x | Accelerated filer o |
Non-accelerated filer o (Do not check if smaller reporting company) | Smaller reporting company o |
Indicate by check mark whether the registrant is a shell company (as defined in Rule 12b-2 of the Act). Yes o No x
The aggregate market value of the registrant’s voting common stock, par value $1.00 per share, held by non-affiliates as of the last business day of the registrant’s most recently completed second fiscal quarter was $1,803,600,677 (computed using the closing price of a share of Common Stock on December 29, 2013, reported by the New York Stock Exchange).
There were 71,534,479 shares of the registrant’s common stock, par value $1.00 per share, outstanding on August 13, 2014.
DOCUMENTS INCORPORATED BY REFERENCE
Portions of the Registrant’s definitive Proxy Statement for its 2014 Annual Meeting of Stockholders, which will be filed with the Securities and Exchange Commission within 120 days after June 29, 2014, are incorporated by reference into Part III hereof.
TABLE OF CONTENTS
Note Regarding Forward-Looking Statements
We have made statements in this Annual Report on Form 10-K which are “forward-looking statements” within the meaning of the Private Securities Litigation Reform Act of 1995. These statements relate to expectations concerning matters that (a) are not historical facts, (b) predict or forecast future events or results, or (c) embody assumptions that may prove to have been inaccurate. These forward-looking statements involve risks, uncertainties and assumptions. When we use words such as “anticipate,” “believe,” “estimate,” “expect,” “forecast,” “intend,” “may,” “plan,” “should,” or similar expressions, we are making forward-looking statements. Although we believe that the expectations reflected in such forward-looking statements are reasonable, we cannot give readers any assurance that such expectations will prove correct. The actual results may differ materially from those anticipated in the forward-looking statements as a result of numerous factors, many of which are beyond our control. Important factors that could cause actual results to differ materially from our expectations include, but are not limited to, the factors discussed in Part I, Item 1A, “Risk Factors” and in “Critical Accounting Policies and Estimates” within Part II, Item 7, “Management’s Discussion and Analysis of Financial Condition and Results of Operations.” All forward-looking statements attributable to us are expressly qualified in their entirety by the factors that may cause actual results to differ materially from anticipated results. Readers are cautioned not to place undue reliance on these forward-looking statements, which reflect our opinion only as of the date hereof. We undertake no duty or obligation to revise these forward-looking statements. Readers should carefully review the risk factors described in this document as well as in other documents we file from time to time with the Securities and Exchange Commission.
PART I
ITEM 1. BUSINESS
International Rectifier Corporation (“we,” “us,” “IR” or the “Company”) designs, manufactures and markets power management semiconductors. Power management semiconductors address the core challenges of power management, power performance and power conservation, by increasing system efficiency, allowing more compact end-products, improving features on electronic devices and prolonging battery life.
Power semiconductors convert raw power from an electrical outlet, a battery, an alternator running off an internal combustion engine, hybrid electric vehicle (“HEV”) or electric vehicle (“EV”), or a renewable energy source, into more efficient and useful power for a wide range of electrical and electronic systems and equipment. The more sophisticated the end product, the greater the need for specially-formatted, finely-regulated power. The importance of power semiconductor technology rises with the increasing complexity of electronic products and the worldwide proliferation of electronic features in information technology, industrial, consumer, aerospace and defense and automotive products.
With the increasing demand for energy usage worldwide and generally rising energy costs, governments, businesses, and consumers alike are striving to conserve energy and demand more efficient uses of power in all types of electronic products including computers, appliances, military aircraft, and hybrid cars. According to IHS Technology ("IHS"), a semiconductor industry market research company, the market for power management semiconductors for calendar year 2014 is estimated to be about $31.7 billion, primarily in power switching transistors including power MOSFETS and IGBTs and ICs.
Power management semiconductors enable energy savings and improve performance by delivering the power tailored for a particular electrical device, rather than delivering a constant stream of power. The information technology, industrial, computing, consumer, high reliability and automobile industries use power management semiconductors to promote energy efficiency and improve product and device performance metrics.
Our products include power metal oxide semiconductor field effect transistors (“MOSFETs”), high voltage analog and mixed signal integrated circuits (“HVICs”), low voltage analog and mixed signal integrated circuits (“LVICs”), digital integrated circuits (“ICs”), radiation‑resistant (“RAD-Hard”) power MOSFETs, insulated gate bipolar transistors (“IGBTs”), high reliability DC-DC converters, digital controllers, integrated power modules, and automotive product packages.
1
Our semiconductors are used in a wide variety of applications, including:
Automotive | Networking |
Industrial Motors | Displays |
Consumer Electronics | Servers |
Personal Computers | Gaming Consoles |
Household Appliances | Satellites |
Telecommunications | Renewable Energy |
Business Strategy
We focus on energy efficiency by improving the technology and design of our power management products and have significantly expanded our product offerings over the years. To achieve our mission, our business strategy is focused on the following key elements:
• | Providing power management solutions tailored to target market segment applications and customers’ needs. Our business is divided into six reporting segments: Power Management Devices, Energy Saving Products, Automotive Products, Enterprise Power, HiRel, and Intellectual Property. Except for our Intellectual Property segment, our segments are organized around the end markets and customers that they target and serve. We call these segments (excluding our Intellectual Property segment which is described in “Products and Technology” section) our “Customer Segments,” and they consist of the following: |
• | Power Management Devices (“PMD”) – Our PMD segment provides high performance power MOSFETs with the widest range of packages within the power management semiconductor industry for a range of applications including power supply, data processing, telecommunications, industrial, and commercial battery-powered systems. Key products used by our PMD segment include Trench HEXFET®MOSFETs, Discrete HEXFET®MOSFETs, Dual HEXFET®MOSFETs, FETKY®s, and DirectFET®s. |
• | Energy Saving Products (“ESP”) – Our ESP segment provides integrated design platforms that enable our customers to add energy-conserving features to help achieve lower operating energy and manufacturing costs. Our integrated design platforms incorporate our silicon packaging technology to help improve system performance. The ESP segment’s primary market applications include motor control appliances, industrial automation, lighting and display, audio and video. The ESP segment’s key products include our analog HVICs and IGBT platforms, digital control ICs and IRAM integrated power modules. The ESP segment’s iMotion platform targets the growing trend towards variable speed motors in the appliance market. |
• | Automotive Products (“AP”) – Our AP segment provides high performance and energy saving solutions for a broad variety of automotive systems, ranging from typical 12V power net applications up to 1200V hybrid electric vehicle applications. Our automotive expertise includes supplying products for various automotive applications including AC and DC motor drives of all power classes, actuator drivers, automotive lighting (such as high intensity discharge lamps), direct fuel injection for diesel and gasoline engines, hybrid electric vehicle power train and peripheral systems for micro, mild, full and plug-in hybrids for electric vehicles, as well as for body electronic systems like glow plugs, Positive Temperature Coefficient (“PTC”) heaters, electric power steering, fuel pumps, Heating Ventilation and Air Conditioning (“HVAC”) and rear wipers. Our automotive product designs are used in application‑specific solutions, application‑specific integrated circuits (“ASICs”) and application‑specific standard parts (“ASSPs”) and generic high volume products for multiple original equipment manufacturer (“OEM”) platform usage. The AP segment's key products include our HVICs, intelligent power switch ICs, power MOSFETs including DirectFET®, IGBTs, Diodes and advanced power modules. |
2
• | Enterprise Power (“EP”) – Our EP segment provides high performance analog and digital end-to-end power solutions for servers, storage, routers, switches, infrastructure equipment, graphic cards, and gaming consoles. IR offers a broad portfolio of power management system products that deliver benchmark power density, efficiency and performance. The EPBU segment's key products include CHiL digital PWM controllers, PowIRstagesTM, SupIRBuckTM, DirectFET® discretes, iPOWIR® voltage regulators, and low voltage IC's. The large and growing server market has placed an emphasis and premium on digital control, telemetry, power density, efficiency and performance. We see this trend increasing in other EP segment target applications. We offer a broad portfolio of digital and analog power management solutions that deliver benchmark power density, efficiency and performance. The EP segment's key products include our DirectFET® discrete products, CHiL digital PWM controllers, power monitoring products, XPhase®, SupIRBuckTM, iPOWIR® voltage regulators, Low voltage ICs, and PowIRstagesTM. |
• | HiRel – Our HiRel segment provides high-reliability power components and sub-assemblies designed to address power management requirements in mission critical applications including satellites and space exploration vehicles, military hardware, and other high reliability applications such as commercial aircraft, undersea telecommunications, and oil drilling in heavy industry, as well as products used in biomedical applications. Our HiRel segment has a legacy of more than thirty years of experience in many of these applications, has developed strategic relationships with major system integrators worldwide and has the knowledge, technology and processes required to meet the requirements of customers in the high-reliability markets. The HiRel segment's key products include our RAD-Hard discretes, RAD-Hard ICs, power management modules, DC-DC converters, High Temperature converters, and Energy Storage Systems. |
• | Our goal is to establish leadership in core technologies and expertise related to the solutions we offer, as follows: |
• | Proprietary process technology - Our manufacturing efforts are heavily focused on proprietary processes that support our power management products. As products decrease in size and increase in functionality or power density, our wafer fabrication facilities must be able to manufacture power management solutions with deep sub-micron pattern widths or ultra thin wafers. This precision fabrication carries over to assembly and test operations, where advanced packaging technology and comprehensive testing are required to address the ever increasing performance and complexity of our integrated circuits or power devices. |
• | Packaging technology - Innovative packaging technology can help to address growth opportunities within our business segments by helping our products to deliver better efficiency, enhanced functionalities and performances, as well as the various physical sizes required by our customers. We have developed a number of proprietary packaging technologies to support our broad portfolio of power management semiconductors. We also have developed specific packaging technologies to help enhance our offerings in particular applications. Our DirectFET2® package for automotive applications is an example of the use of our packaging technology adapted to a specific industry application. This package provides low die free package resistance, low top-side thermal impedance and low package inductance with no wire bonds or molding. |
• | Application expertise - With the world continuing its focus on energy conservation, we develop technologies that advance the state of the art in energy‑efficiency for power management semiconductors. Our technologies help address the following: thermal management, which is the management of the heat load within an application; high frequency, which is the challenge in our customer’s applications of placing components closer together that use less energy; high voltage, which is the challenge of moving a high amount of energy within an application; and cost reduction, which is the challenge of combining elements in smaller and smaller chips and smaller power management architecture at a lower cost. |
• | Design engineering capabilities - Our power management semiconductors provide valuable solutions to our customers. Our solutions solve specific design problems in energy efficient applications ranging from feature-rich consumer devices to space constrained applications such as in computing or in IT systems. This is demonstrated by our development of the SupIRBuckTM integrated voltage regulator for Point-of-Load (“POL”) applications in conventional technologies and our development of Gallium Nitride (“GaN”) technology for use in emerging technologies. |
3
• | The building of an efficient and flexible manufacturing and supply chain. Our manufacturing strategy is to build our products using a mix of internal factories and external contract manufacturers, whether for wafer fabrication or assembly and test. In particular, we prefer to use our internal factories primarily to manufacture new products and products where we utilize proprietary technologies, and external foundries and contract manufacturers to supplement our internal capacity, as well as respond to changes in demand for wafer fabrication and back-end assembly and test. During fiscal year 2014 we continued efforts to provide us with additional flexibility to adjust our internal manufacturing footprint to changes in demand by qualifying additional technologies and higher value-added products and programs with our contract wafer fabrication and assembly and test suppliers. During fiscal year 2014 we targeted external contractors for up to 30 percent of our wafer fabrication needs and 75 percent of our packaging needs. We will continue to monitor the demand environment and we may seek to further adjust our operational footprint and take other actions to reflect changes in demand in future periods. As our reliance upon external foundries and contract manufacturers’ increases, we are exposed to a higher degree of manufacturing and supply chain risk (See Part I, Item 1A, “Risk Factors”). |
• | Strategic relationships with Tier One Original Equipment Manufacturers (“OEMs”), Original Design Manufacturers (“ODMs”), and Distributors. We seek to expand our relations with industry leaders and develop business relationships with key OEMs, ODMs, and distributors, in each of our target markets in order to be able to deliver advanced solutions to our customers. As part of our strategy, we bring to our customers an experienced technical sales team that is recognized for their ability to assist customers in providing power management solutions for the customers’ immediate and longer-term technology and product requirements. These technical sales teams are comprised of account managers and field application engineers. These teams interface with our customers and work closely with their designers and purchasing organizations to integrate our products and/or solutions into theirs to achieve the desired results. To better understand and respond to our customers’ longer-term needs, our technical sales teams often facilitate communication from customers to the IR respective marketing and design center teams who try to address their evolving technological needs. |
4
Products and Technology
The following table summarizes the types of products and end-market applications for our customer segments:
(In thousands) | Power Management Devices | Energy Saving Products | Automotive Products | Enterprise Power | HiRel |
Revenues by Fiscal year | |||||
2014 | $411,967 | $209,450 | $149,646 | $133,947 | $200,412 |
2013 | $367,762 | $176,386 | $124,695 | $116,302 | $188,831 |
2012 | $367,913 | $243,340 | $113,353 | $132,164 | $192,229 |
Primary product function | Power conversion and management which include the lowest RDS(on) and widest range of packages for a diverse range of applications. | Integrated design platforms that enable customers to add energy‑conserving features that help achieve lower operating energy costs and overall system manufacturing bill of material costs. | Provide high performance and energy saving solutions for a broad variety of automotive systems, ranging from typical 12V power net applications up to 1200V hybrid electric vehicle power management solutions. | Power management system solutions that deliver power density, efficiency and performance in enterprise power. | Discrete components, complex hybrid power module assemblies and rugged DC-DC converters utilize leading-edge power technology together with demanding environmental specifications. |
Type of products | Trench HEXFET® MOSFETs, discrete HEXFET® MOSFETs, dual HEXFET® MOSFETs, FETKY®, DirectFET®s | High voltage ICs, Digital control ICs, iRAM integrated power modules, IGBTs | HVICs, intelligent power switch ICs, power MOSFETs including DirectFET®, IGBTs, Diodes and advanced power modules | CHil Digital PWM Controllers, Low voltage ICs, DirectFET®s, SupIRBuck™, XPhase® , iPOWIR®, and PowIRstagesTM | RAD-Hard MOSFETs RAD-Hard ICs, power modules/hybrid solutions, motor controls, DC-DC converters, high temperature converters, Energy Storage Systems |
End applications | Power supply, data processing, tele-communications and industrial and commercial battery-powered systems | Motor control appliances, industrial automation, lighting and display, audio and video | AC and DC motor drives of all power classes, actuator drivers, automotive lighting (such as high intensity discharge lamps), direct fuel injection in diesel and gasoline engines, hybrid electric vehicle power train and peripheral systems in micro, mild, full and plug-in hybrids or electric vehicles, as well as for body electronic systems like glow plugs, PTC heater, electric power steering, fuel pumps, HVAC and rear wipers | Servers, storage, routers, switches, infrastructure equipment, notebooks, graphic cards, gaming consoles | Satellites, space exploration vehicles, military hardware and other high-reliability hardware such as commercial aircraft, undersea telecommunications, oil drilling, high reliability devices in heavy industry and biomedical |
Not included within our customer segments or the above table is our Intellectual Property (“IP”) segment, which contributes royalty revenues from our licensing or sale of intellectual property. Our IP segment reported $1.1 million of revenues for fiscal year 2014. For additional financial information concerning our segments, see Part II, Item 7, “Management’s Discussion and Analysis – Revenues and Gross Margin.”
5
Manufacturing
Semiconductor manufacturing involves two primary phases of production: wafer fabrication, and assembly and test. Wafer fabrication requires a sequence of process steps that expose silicon wafers to chemicals that change their electrical properties. The chemicals are applied in patterns that define cells or circuits within numerous individual devices, termed “die” or “chips” on each wafer. Assembly and test is the sequence of production steps that divides the wafer into individual chips and encloses the chips in structures, termed “packages” which make them usable in a circuit. Power semiconductors generally use process technology and equipment already proven in the manufacturing of ICs.
The table below provides information about our manufacturing facilities and products:
Facility and Approximate Total Size | Products |
Fabrication Facilities | |
Temecula, California, 414,000 sq. ft. | Wafer fabrication of HEXFET® power MOSFETs, IGBTs, HEXFREDS, IC's, High Reliability products including Radiation Hardened HEXFET® power MOSFETs |
Mesa, Arizona, 35,000 sq. ft. | Epitaxial Silicon film deposition wafer production for HEXFET®, power MOSFETs, IGBTs and IC products |
Newport, South Wales, U.K. 451,000 sq. ft. | ICs, power MOSFETs, IGBTs, and GaN |
Singapore, 60,000 sq. ft. | Ultra-thin wafer processing of power MOSFETs and IGBTs |
St. Paul, Minnesota, 17,000 sq. ft. | Epitaxial wafer production for power semiconductor devices |
Assembly and Test Facilities | |
Leominster, Massachusetts, 72,000 sq. ft. | For the High Reliability market: RAD-Hard MOSFETs, RAD-Hard ICs, power modules/hybrid solutions, and motor controls |
San Jose, California, 34,000 sq. Ft. | High Reliability DC/DC converters |
Tijuana B.C., Mexico, 195,000 sq. Ft. | HEXFET®, power MOSFETs, IGBT, High Reliability Discretes, and DirectFET |
As discussed above under “Business Strategy: The building of an efficient and flexible manufacturing and supply chain”, where we describe our manufacturing strategy, we use third party foundries for wafer fabrication as well as third party contract manufacturers for back-end assembly and test of products in facilities inside and outside of the United States.
Marketing, Sales and Distribution
For the fiscal year ended June 29, 2014, we derived approximately 61 percent, 32 percent and 7 percent of our revenues from sales to distributors, OEMs, and contract manufacturers, respectively. Our sales organization consists of sales employees, field application engineers and inside sales employees, as well as external sales representatives. We divide our sales team into regional sales organizations in the Americas, Europe, Asia Pacific and Japan. Our regional sales organizations are supported by the business unit groups within each of our reportable segments which coordinate the marketing activities for their respective products. The regional sales organizations are also supported by a global logistics organization which manages owned warehouses, as well as relationships with third party delivery hubs. Product orders flow to our manufacturing facilities or third party contract manufacturers, which make the products. The products are then shipped through owned warehouses or third-party delivery hubs for delivery to the customers.
The primary function of our sales organization is demand creation activities to help identify sales opportunities within our key customer applications, assist our customers in designing our products into their applications and provide longer-term solutions based on our customers’ technology and product plans and requirements. In many circumstances, we sell our products to the contract manufacturer of the OEM.
6
The primary goal of our marketing organization is to collect and consolidate inputs from our customers and sales team and integrate this knowledge with information gathered from our research and development (“R&D”) group to develop enhanced solutions that can address our customers’ power management requirements. Our marketing activities involve, among other things, using existing products to improve efficiency, density and/or cost of customers’ power solutions, as well as assessing and developing new solutions to exceed the capabilities of products and solutions currently available in the market.
We utilize our distributors’ sales forces, account networks, inventory programs and logistics services to provide our customers with order fulfillment options, products, and flexibility. A significant portion of our sales to distributors are subject to agreements which may include standard stock rotation and price protection provisions, as well as ship and debit rights.
For financial information about the results of our geographic areas for each of the last three fiscal years, refer to Part II, Item 8, Note 11, “Segment Information” of Notes to Consolidated Financial Statements. For the risks attendant to our foreign operations, see Part I, Item 1A, “Risk Factors – Our international operations expose us to material risks, including risks under U.S. export laws.”
Customers
Our devices are incorporated into subsystems and end products manufactured by other companies. Our customers include distributors, OEMs and contract manufacturers. The majority of our products in our customer segments, which include the PMD, ESP, AP, EP, and HiRel segments, are sold directly to distributors or OEM customers. During the fiscal years ended June 29, 2014, June 30, 2013, and June 24, 2012, sales to two of our largest distribution customers, Weikeng International and Arrow Electronics, were approximately 14.3 percent and 10.7 percent, respectively, 12.8 percent and 10.4 percent, respectively, and 12.2 percent and 10.9 percent, respectively, of consolidated revenues. Also, some of our segments have several large customers who are individually significant to their respective segments.
For financial information about geographic areas, please see Part II, Item 8, Note 11, “Segment Information” of Notes to Consolidated Financial Statements.
Competitors
We believe that our comprehensive line of power management products and our ability to combine our silicon products into compact, cost-effective packages and system‑level solutions differentiates us from our competition. Our products compete with products manufactured by others, in varying degrees, on the basis of enabling capability, performance, reliability, quality, price, and service (including technical advice and support).
Generally, the semiconductor industry is highly competitive, and subject to rapid price fluctuations, cyclical demand and product design changes. We face significant competition in each of our product lines from well-established U.S. and international semiconductor companies. Several of our competitors are larger companies with greater financial resources with which to pursue design, manufacturing, marketing and distribution of their products.
Our major competitors by segment for the fiscal year ended June 29, 2014 were as follows:
Segment: | Competitors (alphabetical) |
Power Management Devices | Fairchild, Infineon, ON Semiconductor, Renesas, STMicroelectronics, Toshiba, and Vishay |
Energy Saving Products | Fairchild, Infineon, IXYS, Mitsubishi, NXP, ON Semiconductor, Renesas, STMicroelectronics, and Toshiba |
Automotive Products | Fairchild, Infineon, NXP, STMicroelectronics, and Vishay |
Enterprise Power | Fairchild, Infineon, Intersil, Maxim, and Texas Instruments |
HiRel | Aeroflex, Microsemi, MS Kennedy, and VPT |
7
Research and Development
Our R&D program focuses on the advancement and diversification of our technology platforms and products, as well as next generation technologies. We continue to commit substantial resources to R&D to generate new patents and other intellectual property related to our technologies and products. For fiscal year 2014 we spent $130.8 million (11.8 percent of revenues) on R&D activities.
Technology platforms supported include our power management IC platforms, our MOSFET and IGBT switch platforms, as well as packaging /multichip module platforms such as PowIRstage®, SupIRbuck® and iRAM PS multi-chip modules. Our R&D effort also focuses on developing longer term, broadly applicable new technologies such as GaNpowIR®, our proprietary GaN on Si based power conversion device platform. Based on all these platforms, we have been developing and introducing power management products and new architectures for the next-generation of applications, including new gaming consoles, high-performance servers, hybrid vehicles and energy‑efficient appliances.
We maintain and operate a global network of product design centers. During fiscal year 2014, we continued to introduce advanced power management solutions that drive high performance computing and save energy across our served market segments. These products included: a) integrated power stage devices, b) ICs and chipsets improving power density and efficiency in DC-DC applications found in high performance computers and servers, c) the continued expansion of our CHiL digital controllers and DirectFET® product families, d) ICs for Class D audio, electronic lighting ballasts and motor control, e) GaNpowIR® devices, f) our SmartRectifier™ ICs helping computer and consumer entertainment devices meet emerging system and standby power regulations, g) radiation hardened DC-DC converter modules for space satellite power applications, and h) expansion of our IGBT and MOSFET switch product families.
Backlog
Our sales are generally made on a purchase order basis, with lead times varying depending on market conditions and internal capacity factors. Customers are generally not subject to long-term contracts. However, we have from time to time entered into long-term supply agreements with certain customers. These long-term supply agreements generally do not contain minimum purchase commitments, and products to be delivered and the related delivery schedules under these long-term contracts could be frequently revised to reflect changes in customer needs. Because of these factors, our backlog at any particular date is not necessarily representative of actual sales for any succeeding period and we believe that our backlog is not a meaningful indicator of future revenues.
Seasonality
Our revenues are affected by the cyclical nature of the business of the end users of our products and the trends in our customers’ end markets. As a result, our results typically vary within a given customer segment across a fiscal year as conditions in end user markets change and also in response to macro-economic and industry long-term trends and business cycles.
8
Intellectual Property
We continue to make significant investments in developing, making use of and protecting our Intellectual Property ("IP"). In the past fiscal year, we added approximately 105 patents worldwide to our patent portfolio. We have approximately 960 issued unexpired U.S. patents and approximately 690 patent applications pending worldwide. We are also licensed to use certain patents owned by others. We have several registered trademarks in the United States and abroad, including the trademarks HEXFET® and DirectFET®. We believe that our IP contributes to our competitive advantage, and we are committed to enforcing and defending our intellectual property rights, including through litigation if and when necessary.
We report revenues from the sale and/or licensing of our technologies and manufacturing process know-how, as well as settlements of claims brought against third parties in our IP segment. In fiscal years 2014, 2013 and 2012, we received $1.1 million, $3.1 million and $1.6 million of royalty revenues, respectively. IP segment revenues are dependent on our licensed MOSFET, HVIC and package technology patents, the continued enforceability and validity of those patents, the ability of our competitors to design around our technology or develop competing technologies, and general market conditions. The continuation of such revenues is subject to a number of risks (see Part I, Item 1A, “Risk Factors—Our ongoing protection and reliance on our IP assets expose us to risks”). We continue to derive royalty revenues from HVIC and package technology patents, and from time to time, we enter into opportunistic licensing arrangements that we believe are consistent with our business strategy.
Aside from our HVIC and package technologies, our IP strategy has been to use our IP primarily for the design and development of a value‑added family of products, and to defend those products in the marketplace. In our IP segment, we continue to evaluate licensing of technologies or fields of use that have application beyond our product groups or which no longer align with our long-term business strategies for our product groups. We also target certain technologies for licensing that we believe help establish our product platforms and structures as industry standards and thereby enhance the growth of our products in various end market applications.
Environmental Matters
Federal, state, local and foreign laws and regulations impose various restrictions and controls on the storage, use and discharge of certain materials, chemicals and gases used in our semiconductor manufacturing processes, and on the operation of our facilities and equipment. We believe we use reasonable efforts to maintain a system of compliance and controls for these laws and regulations. Despite our efforts and controls, from time to time, issues may arise with respect to these matters.
Additionally, under some of these laws and regulations, we could be held financially responsible for remedial measures if properties are contaminated or if waste is sent to a landfill or recycling facility that becomes contaminated. We may also be subject to common law claims if released substances damage or harm third parties. We cannot make assurances that changes in environmental laws and regulations will not require additional investments in capital equipment and the implementation of additional compliance programs in the future, which could have a material adverse effect on our results of operations, financial position or cash flows, as could any failure by or violation of us to comply with any prior, current or future environmental laws and regulations.
Our disclosures regarding the matters set forth in Note 15, “Environmental Matters,” to our Notes to the Consolidated Financial Statements set forth in Part II, Item 8, herein, are incorporated herein by reference. (See also Part II, Item 1A, “Risk Factors.”)
Employees
As of June 29, 2014, we had 4,165 employees, with 1,636 employed in the U.S., 1,470 in Mexico, 634 in Europe, and 425 in Asia. As of June 29, 2014, none of our U.S. employees had collective bargaining agreements and we consider our relations with our employees to be good. In some jurisdictions outside the United States, from time to time, employees may be covered by certain statutory, special or other arrangements, such as collective bargaining agreements. Additionally, employees may participate in collective groups like work councils, that may seek benefits for covered personnel. We believe our relationships with such organizations are also generally good.
9
Executive Officers of the Registrant
The following sets forth certain information with respect to each person who is currently an executive officer of the Company:
Name | Age | Position |
Oleg Khaykin | 49 | President and Chief Executive Officer |
Ilan Daskal | 49 | Executive Vice President and Chief Financial Officer |
Gary Tanner | 62 | Executive Vice President and Chief Operations Officer |
Michael Barrow | 60 | Executive Vice President, GaN Technologies |
Adam White | 40 | Senior Vice President, Global Sales |
Timothy Bixler | 47 | Vice President, Secretary and General Counsel |
Oleg Khaykin has served as a Director, President and CEO of our Company since March 2008. Prior to joining us, Mr. Khaykin served most recently as the Chief Operating Officer of Amkor Technology, Inc. (“Amkor”), a leading provider of semiconductor assembly and test services, which he joined in 2003 as Executive Vice President of Strategy and Business Development. Prior to his work at Amkor, Mr. Khaykin most recently served as Vice President of Strategy and Business Development at Conexant Systems Inc. (“Conexant”) and its spin-off, Mindspeed Technologies Inc., where he held positions of increasing responsibilities from 1999 to 2003. Prior to Conexant, he was with the Boston Consulting Group, a leading international strategy and general management consulting firm, where he worked with many European and U.S. firms on a broad range of business and management issues, including revenue growth strategies, operational improvement, mergers and acquisitions, divestitures, and turnaround and restructuring. Mr. Khaykin holds a BSEE with University Honors from Carnegie-Mellon University and an MBA from the J.L. Kellogg Graduate School of Management. Mr. Khaykin is, and has been since September 2010, a member of the board of directors of Newport Corporation. Mr. Khaykin was a member of the board of directors of Zarlink Semiconductor Inc. from November 2007 to October 2011.
Ilan Daskal joined us in October, 2008 as Executive Vice President and Chief Financial Officer. Prior to joining the Company, Mr. Daskal held senior financial positions with Infineon Technologies since 2001, most recently serving as Vice President of Finance & Business Administration for Infineon’s North American Communications Business Group. Before that, Mr. Daskal held senior financial management and strategy positions at several Israeli technology companies, including Savan Communication, a firm that was acquired by Infineon while Mr. Daskal was Chief Financial Officer.
Gary Tanner has served as Executive Vice President and Chief Operations Officer since January 2013. Mr. Tanner served as Chief Executive Officer at Zarlink Semiconductor Inc. (“Zarlink”), from May 2011 to October 2011, when Zarlink was acquired by Microsemi Corporation in October 2011. Prior to his role as Chief Executive Officer of Zarlink, from November 2009 to May 2011, Mr. Tanner served as Chief Operating Officer at that company. Mr. Tanner joined Zarlink in August 2007 as Senior Vice President of Worldwide Operations via the acquisition of Legerity, Inc., where Mr. Tanner served as the Head of Operations. Before Zarlink, Mr. Tanner worked for nine years at Intel Corporation, where he held various positions managing domestic and international manufacturing operations. Prior to Intel, Mr. Tanner held various management positions in fab operations at National Semiconductor, Texas Instruments and NCR. Mr. Tanner is and has been since July 2012, a director of STATS ChipPAC Ltd. Prior to joining the Company, Mr. Tanner was the principal in GWT Consulting and Investments LLC, a firm that provided consulting services to the Company from January through December 2012.
Michael Barrow is and has been since January 2013, Executive Vice President, GaN Technologies of the Company. Mr. Barrow had previously served the Company as Executive Vice President and Chief Operations Officer from the time he joined the Company in April 2008 through December 2012. Prior to joining IR, Mr. Barrow most recently served as Senior Vice President of the Flip Chip and Wafer Level Business Unit for Amkor Technology, Inc., where Mr. Barrow served in various positions since late 2003. Prior to his work at Amkor Technology, Inc., Mr. Barrow served 12 years in various leadership roles at Intel Corporation (“Intel”), most recently as Technology General Manager of Intel’s Communications Group.
10
Adam White was appointed Senior Vice President, Global Sales of the Company in July 2011. Mr. White joined us in 1996 and held various technical, manufacturing and marketing positions during his initial years with the Company, and various positions in the areas of business development and sales in his more recent years with the Company. For more than the past six years, Mr. White held various positions in increasing leadership in business development and sales, most recently since January 2010 in the position of Senior Vice President, Worldwide Sales, focusing on Company commercial demand creation. Mr. White holds a Bachelor of Engineering, Electronics and Electrical Engineering with Diploma in Industrial Studies, BEng (Hons), DIS from University of Loughborough, United Kingdom.
Timothy Bixler joined us in July 2008 as Vice President, Secretary and General Counsel. Prior to joining us, Mr. Bixler held a number of legal department roles with General Electric since 2001, most recently serving as Senior Business Counsel of the Homeland Protection Business. Prior to his work at General Electric, Mr. Bixler served as General Counsel for eMD.com and also served as counsel for Ashland Inc./APAC, Inc. Mr. Bixler also spent three years at the law firm of Arnall, Golden & Gregory.
Available Information
We file with the SEC, pursuant to Section 13(a) or 15(d) of the Exchange Act of 1934, as amended (“Exchange Act”), annual reports on Form 10-K, quarterly reports on Form 10-Q, current reports on Form 8-K and amendments to those reports filed or furnished. These reports may be accessed at the SEC’s Public Reference Room at 100 F Street, N.E., Washington, D.C. 20549. Information on the operation of the Public Reference Room is available by calling the SEC at 1-800-SEC-0330. The SEC maintains a website that contains reports, proxy and information statements, and other information about us. The SEC’s internet address is http://www.sec.gov.
Our internet address is http://www.irf.com. We make available free of charge through our website our annual report on Form 10-K, quarterly reports on Form 10-Q, current reports on Form 8-K, proxy statements and amendments to those reports, as soon as reasonably practicable after we electronically file such material with, or furnish it to, the SEC.
We also make available, free of charge, through our corporate governance website, our corporate charter (our Certificate of Incorporation, as amended), Bylaws, Corporate Governance Guidelines, the charters of the committees of our Board of Directors, Code of Ethics and other information and material, including information about how to contact our Board of Directors, the committees of our Board of Directors and their members. To find this information and materials, visit our corporate governance section of our website at www.irf.com.
Information made available on our website is not incorporated by this reference into this report.
11
ITEM 1A. RISK FACTORS
Statement of Caution Under the Private Securities Litigation Reform Act of 1995
In this Annual Report on Form 10-K we have included some statements and other information that are not historical facts but are “forward‑looking statements” as that term is defined in the Private Securities Litigation Reform Act of 1995. The materials presented can be identified by the use of forward‑looking terminology such as “anticipate,” “believe,” “estimate,” “expect,” “may,” “should,” “view,” or “will” or the negative or other variations of those words. We caution that these statements are subject to a number of uncertainties, and actual results may differ materially. Factors that could affect our actual results include those set forth below under “Factors that May Affect Future Results” and other uncertainties disclosed in our reports filed from time to time with the SEC. You should read these factors in conjunction with the factors discussed elsewhere in this and our other filings with the SEC and in materials incorporated by reference in these filings. These factors are intended to highlight certain items that may affect our financial condition and results of operations and are not meant to be an exhaustive discussion of risks that apply to companies like ours.
Like other companies, we are susceptible to macroeconomic downturns in the United States or abroad. Similarly, the price of our securities is subject to volatility due to fluctuations in general market conditions, actual financial results that do not meet our and/or the investment community’s expectations, changes in our and/or the investment community’s expectations for our future results and other factors, many of which are beyond our control.
Unless required by law, we undertake no obligation to publicly update or revise any forward looking statements, to reflect new information, future events or otherwise.
Factors That May Affect Future Results
The proposed merger with Infineon may disrupt our business and, if the merger does not occur, our stock price may decline, we will have incurred significant expenses, and we may need to pay a fee to Infineon.
As previously announced, on August 20, 2014 we entered into a merger agreement with Infineon Technologies AG (“Infineon”) pursuant to which Infineon will acquire all of our common stock for $40 per share in cash (the "Merger"). The Merger, whether or not consummated, may result in a loss of key personnel and may disrupt our sales and marketing or other key business activities, including our relationships with third parties, including customers, which may have an adverse impact on our financial performance. The merger agreement in general requires us to operate our business in the ordinary course pending consummation of the Merger, but includes certain contractual restrictions on the conduct of our business that may affect our ability to execute on our business strategies and attain our financial goals. Additionally, we have incurred and will continue to incur substantial financial advisory, legal, and other professional fees and expenses in connection with the Merger, which must be paid even if the Merger is not completed.
The obligation of Infineon to complete the Merger is subject to several conditions, including the adoption of the merger agreement by the affirmative vote of the holders of at least a majority of our outstanding shares of common stock and the receipt of certain regulatory approvals, including the expiration or early termination of the waiting period under the Hart-Scott-Rodino Antitrust Improvements Act of 1974, as amended, certain foreign antitrust approvals and clearance by the Committee on Foreign Investment in the United States. These conditions are described in more detail in the merger agreement, which will be filed as an exhibit to the Company's Current Report on Form 8-K to be filed with the SEC on or about August 22, 2014. There is no assurance that each of the conditions set forth in the merger agreement will be satisfied or that the Merger will occur when or as expected. If the Merger is not completed, the share price of our common stock may change to the extent that the current market price of our common stock reflects an assumption that the Merger will be completed.
Under certain circumstances, if the Merger is not completed, we may be required to pay Infineon a termination fee of $70 million or pay $15 million to reimburse Infineon for its transaction related expenses.
12
The price of our common stock has fluctuated widely in the past and may fluctuate widely in the future.
Our common stock, which is traded on the NYSE, has experienced and may continue to experience significant price and volume fluctuations that could adversely affect the market price of our common stock without regard to our operating performance. In addition, we believe that factors such as quarterly fluctuations in financial results and earnings, financial performance and other activities of other publicly traded companies in the semiconductor industry could cause the price of our common stock to fluctuate substantially. Any similar fluctuations in the future could adversely affect the market price of our common stock.
General Economic Conditions Continue to be Uncertain and Could Materially Adversely Affect our Business.
Like many other businesses, our business is subject to the global macroeconomic environment and a number of general economic and regulatory factors, which have been and remain uncertain and potentially volatile including interest rates, recession, inflation, exchange rates, consumer credit availability, consumer debt levels, health care costs and governmental policy, tax rates and tax policy, unemployment trends and other matters that influence business and consumer confidence and spending.
These factors could negatively affect our business, operating results and financial condition in a number of ways, including increasing our costs or imposing practical limits on pricing, both of which could lower our profit margins and have a material adverse effect on our results of operations and financial condition. If business or consumer spending decreases or fails to develop, or general economic conditions deteriorate, we could experience significantly diminished demand for our products, which would also materially adversely affect our operating results and financial condition. In addition, if the financial condition of our customers, including our distributors, is adversely affected, our revenues could be substantially lower and some parties may not pay us or may delay paying us for products. Also, if the banking system or the financial markets were to deteriorate, our investment portfolio may be impacted, and the values and liquidity of our investments could be adversely affected.
Adverse changes in end-market demand, due to downturns or other changes in the semiconductor industry, cyclicality, seasonality, or economic factors, could adversely affect our operating results and the value of our business.
The semiconductor industry is cyclical and often very volatile. We compete in many end markets and service thousands of customers, whether directly or through distribution. Our target markets have wide fluctuations in product supply and demand, and also experience significant downturns, often in connection with actual or anticipated declines in general economic conditions, industry inventory levels and maturing product cycles. The market value of our business may decline during the down portion of cycles or rapid adverse changes in demand. We can also experience sharp declines in end-market demand, leading to under-utilization of our manufacturing capacity and declining revenues and gross margins. In addition, in those circumstances, we have previously recorded significant charges to recognize impairment in the value of some of our manufacturing equipment, the costs to reduce the size of our workforce and exit facilities, and other restructuring costs, and could do so again in the future.
Some of our business segments also experience annual seasonality with wide fluctuations of supply and demand, which may result in significant quarter to quarter fluctuations in revenues and gross margins in those segments.
Changes in the mix of customer demand can materially adversely affect our operating results and require additional investments in production capacity.
We try to anticipate customer demand and plan our investments in manufacturing capacity and production to match anticipated demand. Also, some of our products can be sold at relatively higher gross margins than others. As a result, if the mix of customer demand changes to a mix other than what we anticipated or changes to a mix of products with relatively lower gross margins, we may experience a reduction in our revenues and gross margins.
Additionally, a mismatch between our inventories and customer demand, could result in our having inventories of products that may not be sellable and not enough product of the proper mix to meet demand. These factors may result in the need to write-off unsellable inventories and/or loss of sales and revenue. If the mix of customer demand requires us to increase our production capacity for particular products, we could incur additional costs and delays associated with the introduction of new products and start-up of new facilities and production lines. As a result of these effects, adverse changes in the mix of customer demand could materially adversely affect our operating results and financial condition.
13
If the demand for our products or a particular mix of our products increases faster than we anticipate or are able to produce, we may not be able to satisfy the demand with our planned available capacity, which could limit our revenue growth potential and expose us to loss of design and sale opportunities, and potential liability.
During rapid demand or product mix changes, product manufacturing lead times may increase and we may have challenges being able to meet the demand, especially for particular product lines. We attempt to procure internal or external capacity to meet our demand forecast and our customer demands for particular products. However, since additional capacity can take up to six months or more to obtain and install, if the demand for our products or a particular mix of our products increases at a rate faster than we anticipate or are able to produce, we may not be able to increase our internal and external manufacturing capacity fast enough to satisfy the higher demand. As a result, our revenue growth may be limited by internal or external manufacturing capacity available to us.
To the extent we are not able to satisfy customer demands timely or otherwise, we may also lose design and sales opportunities which could have a material adverse impact on our results of operations.
To the extent we are not able to satisfy our contractual obligations to fulfill products, we may also be subject to potential claims. While we would defend ourselves vigorously against any such claims, large claims, if found meritorious, could have a material adverse effect on our results of operation and financial condition.
The semiconductor industry is highly competitive and increased competition could result in lower prices for our products and adversely impact our future profitability.
The semiconductor industry is highly competitive. Price pressures often exist as competitors attempt to gain a greater market share by lowering prices or by offering a more desirable technological solution. Product alternatives from competitors can also reduce our ability to win customer designs and reduce sales generally. To the extent our competitors are larger and have greater financial and other resources than we have, they may be able to compete on a stronger basis than us. Pricing and other competitive pressures can adversely affect our revenues and gross margin, and hence, our profitability.
New technologies could result in the development of new more competitive products and a decrease in demand for our existing products, and we may not be able to develop new products to satisfy changes in demand.
Rapidly changing technologies, design cycles, new product introductions and changing industry standards, characterize the semiconductor industry. Therefore, our financial performance depends on our ability to design, develop, manufacture, assemble, test, market, sell and support new products and enhancements on a timely and cost-effective basis. As a result, we must spend substantial resources on research and development and manufacturing capability for new products and technology platforms, including our Gallium Nitride technologies. We cannot guarantee that we will develop the new products and platforms ahead of competitors in the market. If we do not develop new technologies or timely react to changes in existing technologies we could have lower revenues and a loss of market share relative to our competitors.
We do not know if we will successfully identify and capitalize on new product opportunities or develop and bring new products to market in a timely and cost-effective manner (including our Gallium Nitride technologies), or that products or disruptive technologies developed by others will not render our products or technologies obsolete or noncompetitive in the future. In addition, to remain competitive, we must continue to reduce wafer costs, decrease die sizes and improve manufacturing yields across our product lines. We do not know if we can accomplish these goals. In addition, if there is a fundamental shift in technologies or if we do not capitalize on our new Gallium Nitride technology before others, our competitive position within the industry would be materially and adversely affected.
Delays in production at our new manufacturing facilities or at third party manufacturers, implementing new production processes or resolving problems associated with production or malfunctions could adversely affect our manufacturing capacity and efficiencies.
Our manufacturing processes are highly complex, require advanced and costly equipment and are continuously being modified in an effort to improve yields and product performance. Impurities, defects or other difficulties in the manufacturing process can lower product yields and increase costs. Our manufacturing capacity and efficiency are important factors in our profitability. We cannot promise that we will be able to maintain or increase our manufacturing capacity and efficiency to the same extent as our competitors or enough to be able to meet demand.
14
Our strategy for increased, efficient and flexible, capacity has also included the greater use of third party manufacturers for wafer and product assembly and testing. We are also constructing a new wafer thinning facility in Singapore. We have at times experienced difficulty completing construction at new facilities, in beginning production at new facilities or third party manufacturers, or in changing processes for existing products or moving and qualifying product lines to new locations. We have also from time to time experienced delays in our ability to increase capacities, delays in product deliveries and reduced yields. Additionally, from time to time, there are market constraints on our ability to obtain necessary production equipment from third party equipment manufacturers. As a consequence, our plans to adjust our manufacturing and achieve the needed capacity efficiency and flexibility, including our ability to hire staff and make our new wafer thinning facility in Singapore operational at the production levels needed for our business in a timely and cost-effective way, could be delayed or not achieved at all.
We also may experience manufacturing problems in achieving acceptable yields, experience product delivery delays, and/or quality issues in the future, as a result of, among other things, capacity constraints, construction delays, delays in upgrading or expanding existing facilities, changing our process technologies or qualifying third party manufacturers to produce our products. As a result of any of these factors, we could have a material loss of revenues or an inability to meet customer demands. Also, our operating results have in the past been, and in the future would be adversely affected, even materially, by low utilization of our production capacity, if due to these factors our facilities are not operating at an efficient level.
Our ongoing protection and reliance on intellectual property assets expose us to risks.
We have traditionally relied on our patented and other proprietary technologies for protection of the products we sell and for licensing revenues. Enforcement of our rights is costly, risky and time consuming. We cannot provide assurance that we can successfully continue to protect our intellectual property rights, especially in foreign markets.
We have limited recurring revenue from licensing agreements for existing patents and proprietary technologies; however, we may enter into opportunistic licensing arrangements that we believe are consistent with our business strategy. What royalty income we obtain is largely dependent on the following factors: the level of product sales and mix of products sold by licensees, the introduction and sale of products by our licensees that are not covered by our patents and proprietary technologies; the defensibility and enforceability of our patents and proprietary technologies; changes in our licensees' unit sales, prices or die sizes; the terms, if any, upon which expiring license agreements are renegotiated; and our ability to obtain revenues from new licensing opportunities.
We cannot assure that we will obtain new licenses to produce royalties or that we will continue to receive royalties from existing licenses in the future. While we try to predict the effects of these factors, often there are variations or factors that can significantly affect results to be different from that predicted. Accordingly, we cannot assure that our predictions of our IP segment revenues will be consistent with actual results, nor can we guarantee any level of our future royalty income.
Our failure to obtain or maintain the right to use certain technologies expose us to risks and could negatively affect our financial results.
Our future success and competitive position may depend in part upon our ability to obtain or maintain certain proprietary technologies used in our products. Our ability to maintain these technologies is achieved in part by defending and maintaining the validity of our patents, defending claims of infringement brought by our competitors and other third parties, and at times by asserting intellectual property claims against third parties. We have in the past asserted intellectual property claims against others and may do so again in the future. We can also be subject to claims and lawsuits in which it is alleged that we have infringed upon the intellectual property rights of others or that our claims of rights are narrow or invalid. We also license certain patents and other technologies owned by others for use in our products and processes.
15
Our involvement in existing and future intellectual property litigation could result in significant expense, adversely affect sales of the challenged product or technologies and divert the efforts and attention of our technical and management personnel, whether or not the litigation is resolved in our favor. If it is claimed or determined that we have infringed the rights of third parties, we may be exposed to substantial liability for damages or have our rights limited and may need to obtain licenses from the patent or other technology owners, discontinue, change our processes or products, or expend significant resources to develop or acquire non-infringing technologies. For intellectual property licenses we have, our ability to continue to use such technologies depends on our ability to maintain such licenses. We cannot promise that we would be successful in such efforts or that such licenses would be available under reasonable terms or that we would be successful in our claims against third parties. All of these factors and our failure to develop or acquire non-infringing technologies, to obtain licenses on acceptable terms, the occurrence of litigation itself or our failure to be successful in litigation could have a material adverse effect on our operating results and financial condition.
If some OEMs do not design our products into their equipment or if we do not convert design or program wins to actual sales, for whatever reasons, a portion of our revenues may be adversely affected.
A “design-win” or program award from a customer does not guarantee that the design or program win will result in future sales to that customer. We also are unable to assure that we will be able to convert any design or program wins into sales for the life of any particular program, or at all, or that the revenues from such wins would be significant. We also cannot promise that we will achieve any level of design or program wins. Without design or program wins from OEMs, we would only be able to sell our products to these OEMs as a second source, if at all. Once an OEM designs another supplier’s product into one of its product platforms, it is more difficult for us to achieve future design or program wins with that OEM’s product platform because changing suppliers involves significant cost, time, effort and risk. Achieving a design or program win with a customer also does not ensure that we will receive significant revenues from that customer. Accordingly, if OEMs do not design our products into their equipment or if we do not convert design or program wins to actual sales, for whatever reasons, our revenues may be materially adversely affected.
Third party interruptions, delays or material cost increases affecting our materials, parts or equipment may impair our competitive position and our operations.
Our manufacturing operations depend upon obtaining adequate supplies of materials, parts and equipment, including among other things, silicon, mold compounds, lead frames, fabrication and assembly equipment, on a timely basis from third parties. Our results of operations could be adversely affected if we were unable to obtain adequate supplies of materials, parts and equipment in a timely manner from our third party suppliers or if the costs of materials, parts or equipment increase significantly. From time to time, suppliers may discontinue products, extend lead times, limit supplies or increase prices due to capacity constraints, market conditions or other factors. For example, from time to time we experience material cost increases for commodity metals that are included in materials used in our manufacturing processes, and the future costs of these materials are uncertain. Additionally, we have a limited number of suppliers or sole suppliers for some materials, parts and equipment, and any interruption could materially impair our operations, our revenues, and adversely affect our ability to meet customer demand, and otherwise adversely affect our business, financial condition and results of operations.
Interruptions, delays or cost increases at our key facilities may impair our competitive position and our operations.
We manufacture a substantial portion of the semiconductor wafers for our products at our Temecula, California and Newport, Wales facilities and use third party manufacturers to produce the remaining portion of the semiconductor wafers used by us. Also, we assemble and test products at our Tijuana, Mexico facility and use third party contract manufacturers to assemble and test a larger portion of our products. Also, we rely increasingly on the use of our wafer thinning facility in Singapore as its production ramps. Any disruption of operations at these facilities or at other facilities where we manufacture products or where our products are manufactured, whether as a result of equipment malfunction or maintenance needs, natural or man-made disasters, or other effects could have a material adverse effect on our ability to generate revenues, meet customer demand and otherwise adversely affect our business, financial condition and results of operations.
16
Our products may be found to be defective and, as a result, claims may be asserted by others, which may harm our business and our reputation with our customers and materially adversely affect our results and financial condition.
Our products are typically sold at prices that are significantly lower than the cost of the equipment or other goods in which they are incorporated. Although we maintain quality control systems, we ship large quantities of products to a wide range of customers around the world, for use in a variety of high profile and often critical applications. Those applications include, among others, space, aviation, servers, automotive and medical applications. In the ordinary course of our business, we receive claims that some of these products are defective or do not perform to published or agreed specifications. We could also receive claims that our products have caused personal injury or property damage. Since a defect or failure in our products could give rise to failures in the end products that incorporate them (and potential claims for consequential damages, or for injury or property damage, depending on applicable law and contract), we often need to defend against claims for damages that are larger than the revenues and profit we receive from the products involved. In addition, our ability to reduce the amount of these claims may be limited by the laws or the customary business practices of the countries where we do business. Even in cases where we do not believe we have legal liability for claims, we may choose to pay them to retain a customer's business or goodwill or to avoid the costs and attendant risks of protracted litigation. Our results of operations and business would be materially adversely affected as a result of significant alleged quality or performance issues in our products, or if we are required or choose to pay for the damages that result.
Although we currently have product liability and other types of insurance, we have certain deductibles and exclusions to such policies and may not have sufficient insurance coverage. We also may not have sufficient resources to satisfy all possible product liability or other types of product claims. In addition, in our HiRel segment, we are sometimes subject to government procurement regulations and other laws that could result in costly investigations and other legal proceedings as a consequence of allegedly defective products or other actions. Any perception that our products are defective would likely result in reduced sales of our products, loss of customers and harm to our business and reputation.
Our reliance on third party contractors to make semiconductor wafers and to assemble certain of our parts as a lower cost alternative may expose us to business risks.
A significant portion of our semiconductor wafers are fabricated by third party contractors and are assembled and tested by third party contractors. We have used these contractors as a lower cost alternative to in-house manufacturing, and to increase our capacity efficiency and manufacturing flexibility. We review these contractors' references, and historical manufacturing experience prior to the engagement of their services, and require oversight over their quality assurance processes. However, if we fail to adequately review the contractors' historical or current manufacturing processes, or if the contractors do not perform as needed, the quality of our products could be subject to higher failure rates, which could adversely impact our reputation and the growth of future business with our customers. Although we believe that parties to our third party manufacturing arrangements would have an economic motivation to succeed in performing their contractual responsibilities, there can be no assurance that these parties or any future parties will perform their obligations as expected.
From time to time and in the ordinary course of business we have commercial or product quality issues or disputes with such contractors, and there can be no assurance that other future disputes will not arise. In some instances, we do not have long-term agreements with our contractors. As a result, we do not have immediate control over our product delivery schedules or product quality. Due to the amount of time often required to qualify contractors and the high cost of qualifying multiple parties for the same products, we could experience delays in the shipment of our products if we are forced to find alternative third parties to perform contract services. Any delivery delays from contractors in the future could have a material adverse effect on our operating results and financial condition, and affect our ability to satisfy customer obligations. Also, the failure of these contractors to properly perform their obligations could prevent us from achieving greater capacity efficiency and flexibility, or result in returns or claims from customers arising from quality issues.
17
We maintain a backlog of customer orders that is subject to cancellation, reduction or delay in delivery schedules, which may result in lower than expected revenues and gross margin.
With certain exceptions related primarily to products within our HiRel segment, we manufacture primarily pursuant to purchase orders for current delivery or to forecast, rather than under fixed supply obligations. The semiconductor industry is subject to rapid changes in customer outlooks or unexpected increases of inventory in the supply channel as a result of shifts in end-market demand generally or in the mix of that demand. Therefore, many of our purchase orders or forecasts may be revised or canceled without penalty. As a result, we must commit resources to the manufacturing of products, and a specific mix of products, often without significant advance purchase commitments from customers. Our inability to sell products after we devote significant resources to build them could have a material adverse effect on our inventory levels and value, our revenues and our operating results generally. Additionally, cancellation or significant reduction in significant customer programs, could materially affect our ability to achieve our revenues and gross margin targets.
We build and maintain inventory in order to meet our historic and projected needs, but cannot assure that our inventory will be adequate to meet demand, our commitments to customers or be salable at a future date.
We build and maintain inventory in order to meet our historic and projected needs, but cannot assure that we will accurately predict both the demand for our products and the lead times required to obtain the necessary materials, and build the proper mix and amount of inventory. If we fail to adequately predict demand and align inventory to that demand, we may not be able to meet our customer commitments for deliveries of product, and our revenues and gross margin may be adversely affected. To the extent we have made contractual commitments to customers, and do not satisfy those commitments, we may be exposed to claims for damages.
From time to time, we have unusually high inventory levels on hand relative to current sales. In these circumstances when we produce or have produced inventory that does not meet current or future demand, or customers revise forecasts or cancel orders, we may determine that certain of the inventory may only be sold at a discount or may not be sold at all, potentially resulting in the reduction in the carrying value of our inventory and a material adverse effect on our financial condition and results of operations.
Our distributors may return inventory which could negatively impact our financial results.
Many of our distributors have some rights to return inventory under stock rotation programs and also may return inventory with our approval or under certain circumstances. In addition, we have, from time to time, accepted, and may in the future accept, additional returns. If these distributors return a large amount of inventory, our operating results could be impacted by lower revenues and higher costs associated with inventory write-offs.
We receive a significant portion of our revenues from a relatively small number of customers and distributors.
Historically, a significant portion of our revenues has come from a relatively small number of customers and distributors. For example, we derived approximately 61 percent of our revenues from sales to distributors, the two largest of which accounted for approximately 14.3 percent and 10.7 percent of consolidated revenues, respectively. Loss or financial failure of any significant customer or distributor, reduction in orders by any of our significant customers or distributors, or cancellation of a significant order, could materially and adversely affect our business and/or that of one or more of our reportable segments.
We may fail to attract or retain the qualified technical, sales, marketing and managerial personnel, and key executive officers required to operate our business successfully.
Our future success depends, in part, upon our ability to attract and retain highly qualified technical, sales, marketing and managerial personnel, as well as key executive officers. Personnel with the necessary semiconductor expertise are scarce and competition for personnel with these skills is intense. While we try to ensure continuity of management in crucial areas we cannot guaranty that these efforts will be successful in all circumstances. Similarly, there is no assurance that we will be able to retain any of our existing key personnel, or attract, assimilate and retain the additional personnel needed to support our business. If we are unable to retain existing key employees or are unsuccessful in attracting new highly qualified employees, our business, financial condition and results of operations could be materially and adversely affected.
18
We are subject to a revolving credit facility that may restrict our current and future operations, and the Company may not be able to use the facility when it is in adverse financial circumstances.
In October 2012, we entered into a four year senior unsecured revolving credit facility which expires in October 2016 and under which we may borrow up to $100 million. Whether or not we have borrowings under the facility, the revolving credit facility imposes restrictions on our business, including restrictions on additional indebtedness, liens and encumbrances, investments, acquisitions, loans and advances, mergers, consolidations and asset dispositions, dividends and other restricted payments, transactions with affiliates, capital expenditures and other matters customarily restricted in such agreements. The terms of the credit facility also require us to comply with certain financial tests.
We cannot assure that we will be able to satisfy the financial tests set forth under the revolving credit facility to be able to make or maintain borrowings under the facility. In particular, the facility requires that the Company maintain a certain liquidity level for borrowings, and that liquidity level is not likely to be maintained during times when the Company is in an adverse financial condition. Also, whether or not we make borrowings under the facility, restrictions under the facility may limit our ability to engage in activities or transactions that could otherwise benefit us. If we cannot satisfy the restrictions and financial tests under the revolving credit facility, then we may either have to terminate the facility and repay any indebtedness thereunder or be subject to an event of default that could materially and adversely affect our operating results and our financial condition.
If we fail to maintain adequate internal controls over financial reporting our ability to report our results of operations and financial condition accurately and in a timely manner may be adversely impacted resulting in a material weakness or a material misstatement and considerable additional expense, negatively impact investor confidence and adversely impact the price of our common stock.
As required by Section 404 of the Sarbanes‑Oxley Act, we are required to conduct an assessment of our internal control over financial reporting and include in our annual report our assessment of the effectiveness of our internal control over financial reporting. In certain prior years, we had previously determined that we had material weaknesses in internal control over financial reporting. While these material weaknesses have been remediated, there is no assurance that we would not have additional material weaknesses in the future. Each material weakness results from a reasonable possibility that a material misstatement in our financial statements will not be prevented or detected on a timely basis. In addition, it is possible that in the future, as a result of our assessment of our internal control that we may identify material weaknesses and be subject to regulatory sanctions and a loss of investor confidence in our internal controls. The failure to remediate any such potential material weaknesses in a timely manner could possibly cause us to fail to complete our periodic filing requirements and obtain reasonable assurance regarding the reliability of our financial statements.
We have previously been named as a defendant in lawsuits and may in the future be named as defendant in other lawsuits that may adversely affect our financial condition, results of operations and cash flows.
We have previously been named as a defendant in several securities class action, derivative and other lawsuits, and had been subject to investigations by governmental agencies. There can be no assurance that we will not be subject to additional lawsuits and other legal proceedings in the future. For any lawsuits and proceedings, our attention may be diverted from our ordinary business operations and we may incur significant expenses associated with defense and potential obligations to indemnify current and former officers and directors who may be parties to or involved in such action or proceeding. Depending on the outcome of such future lawsuits and proceedings, we may also be required to pay material damages and fines, consent to injunctions on future conduct, or suffer other penalties, remedies or sanctions. The ultimate resolution of these matters could have a material adverse effect on our results of operations and financial condition, and, consequently, negatively impact the trading price of our common stock.
19
Changes in our effective tax rate may have an adverse effect on our financial position, results of operations and cash flows.
Our future effective tax rates may be adversely affected by a number of factors, including the jurisdictions in which profits are determined to be earned and taxed and the inter-company pricing related to those profits; the resolution of issues arising from tax audits with various tax authorities; changes in the valuation of our deferred tax assets and liabilities; adjustments to estimated taxes upon finalization of various tax returns; increases in expenses not deductible for tax purposes; changes in available tax credits; changes in share‑based compensation expense; changes in tax laws or the interpretation of such tax laws (including transfer pricing guidelines, and foreign tax holdings and our ability to satisfy the conditions of foreign tax holidays); changes in United States generally accepted accounting principles (“GAAP”); or the repatriation of non-U.S. earnings against which we have not previously provided U.S. taxes.
In addition, we have made certain judgments regarding the realizability of our deferred tax assets. In accordance with GAAP the carrying value of the net deferred tax assets is based on our assessment whether it is more likely than not that we will generate sufficient future taxable income in the relevant jurisdictions to realize these deferred tax assets, after considering all available positive and negative evidence. If our assumptions and estimates change in the future given unforeseen changes in market conditions, tax laws or other factors, valuation allowances may be recorded or increased, resulting in increased income tax expense. Conversely, if we are ultimately able to use all or a portion of the deferred tax assets for which a valuation allowance has been established, the related portion of the valuation allowance will be released to reduce income tax expense, or credit additional paid-in capital or other comprehensive income, as applicable.
Certain of our businesses are subject to governmental regulation and procurement processes that expose us to additional risks, including U.S. export control laws.
Certain of our businesses, in particular our HiRel segment, manufacture and sell many products that are subject to U.S. export control laws and related regulations. We also manufacture and sell products that are sold indirectly to the U.S. government and may subject us to government procurement regulations, investigations or review. While we maintain a system of controls over such products designed to maintain compliance with such laws and regulations, we cannot promise that these controls will be effective in all cases. There are also limitations on the effectiveness of controls, including the failure of human judgment. If we fail to maintain an effective system of controls or are otherwise found non-compliant with applicable laws and regulations, violations could lead to governmental investigations, fines, penalties and limitations on our ability to export product from the U.S., all of which could have a material effect on our financial result. Also, if these laws or regulations affecting exports change, they could adversely affect our ability to design, manufacture and sell many of our products of our HiRel segment outside the U.S., and could thereby materially adversely affect our business as a whole.
For example, currently the U.S. government is not approving new export licenses to Russia for our military use products, is increasing its level of sanctions on Russia due to world events, and is tightening controls on the types of products that may be sold to China without licensing. To the extent these changes continue, the Company may be restricted or limited with respect to certain sales in these areas.
U.S. governmental procurement regulations require that our HiRel segment from time to time provide to its customers certain information that is more readily provided by companies that maintain a cost accounting system meeting certain U.S. governmental standards. We do not have such a system, nor is one required for the business we conduct; however, our inability to efficiently provide cost information in the form that may be required by certain customers to satisfy U.S. government regulations may limit our ability to secure certain U.S. government related business and have a material adverse effect on our revenues and gross margin.
Quality control and similar standards are applicable to our facilities and the facilities of our contractors in which certain products are manufactured, and these standards are subject to compliance review by certain U.S. Government agencies. Our use of third‑party facilities meeting such standards is subject to negotiation of satisfactory agreements with those parties and if we cannot reach such agreements, certain of our businesses, may experience production constraints and its revenues may be materially reduced. To the extent governmental regulation, or changes, or procurement decision making are not favorable to us, the results of certain of our businesses may be materially adversely affected.
20
Compliance with new regulations regarding the use of “conflict minerals” could limit the supply and increase the cost of certain metals used in manufacturing our products, and our failure to demonstrate that our products are free of conflict minerals could adversely affect our revenues.
Section 1502 of the Dodd-Frank Wall Street Reform and Consumer Protection Act of 2010 (the “Dodd-Frank Act”), requires the SEC to promulgate new disclosure requirements for manufacturers of products containing certain minerals which are mined from the Democratic Republic of Congo and adjoining countries. These “conflict minerals” are commonly found in metals used in the manufacture of semiconductors. Manufacturers are also required to disclose their efforts to prevent the sourcing of such minerals and metals produced from them. The implementation of these new regulations may limit the sourcing and availability of some of the metals used in the manufacture of our products. The regulations may also reduce the number of suppliers who provide conflict-free metals, and may affect our ability to obtain products in sufficient quantities or at competitive prices. Finally, some of our customers may elect to disqualify us as a supplier, and materially adversely affect our revenues if we are unable to verify that the metals used in our products are free of conflict minerals.
We cannot promise that we will have sufficient capital resources to make necessary investments in manufacturing technology and equipment.
The semiconductor industry is capital intensive. Semiconductor manufacturing requires a regular upgrading of process technology to remain competitive, as new and enhanced semiconductor processes are developed which permit smaller, more efficient and more powerful semiconductor devices. We maintain certain of our own manufacturing, assembly and test facilities, which have required and will continue to require significant investments in manufacturing technology and equipment, especially for new technologies we develop, including our Gallium Nitride technologies. We are also attempting to add the appropriate level and mix of capacity to meet our customers’ future demand, as well as the establishment and production ramp of our new wafer thinning facility in Singapore. There can be no assurance that we will have sufficient capital resources to make necessary investments in manufacturing technology and equipment, or that we will be able to complete and operate our new wafer thinning facility in Singapore in time and at the levels required to satisfy customer demand. Although we believe that anticipated cash flows from operations, existing cash reserves and other equity or debt financings that we may obtain will be sufficient to satisfy our future capital expenditure requirements, we cannot promise that this will be the case or that alternative sources of capital or credit will be available to us on favorable terms or at all.
We have made and may continue to make substantial investments in plant and equipment that may become impaired.
In order to conduct our business, we make substantial investments in plant and equipment, including substantial investments in support of the construction and production ramp of our wafer thinning facility in Singapore and in equipment loaned to our third party contract manufacturers. Some of our investments in plant and equipment support particular technologies, processes or products, and may not be applicable to other or newer technologies, processes or products. Also, the ability to relocate and qualify equipment for our operations, whether within our Company or to and from third party contractors is typically time consuming and costly. To the extent we invest in more equipment or a mix of equipment than we can use efficiently, experience low plant or equipment utilization due to reduced demand or adverse market conditions, our plant or equipment becomes older or outmoded, or we are not able to efficiently recover and/or utilize equipment on loan at third party contractors, we may incur significant costs or impairment charges that could materially adversely affect our results of operation and financial condition.
21
Our restructuring programs may not achieve their goals, could be costly, delayed and disruptive to our business, and could materially adversely affect our results and financial condition.
In August 2012, we announced a restructuring program to modify our manufacturing strategy due to a reduction in customer demand. The plan included closing or resizing various manufacturing facilities and otherwise reducing our selling and administrative and research and development costs. While many of the actions associated with this program have already taken place, others have yet to be concluded. We cannot assure that these restructuring initiatives will achieve their goals or accomplish the cost reductions planned. Additionally, because our restructuring activities involve changes to many aspects of our business, the cost reductions could adversely affect productivity and revenues to an extent we have not anticipated. Even if we fully execute and implement these restructuring activities, and they generate the anticipated cost savings, there may be other unforeseen factors that could adversely impact our profitability and business. Costs associated with the program and the timing of the program are subject to a number of conditions, among them the ability to qualify existing product lines at other internal or external manufacturing facilities (including the timely ramping to full production of the wafer thinning facility we are constructing in Singapore), customer requirements or demand, changes in business conditions and/or operational needs, retention of key employees, and governmental regulations. Accordingly, there could be both adverse changes in the amount of costs or the timing of the anticipated actions. Changes in the timing or amount of costs associated with, or disruptions caused by, our restructuring initiatives could materially adversely affect our results and financial condition.
While we attempt to monitor the credit worthiness of our customers, we may be at risk due to the adverse financial condition of one or more customers.
We have established procedures for the review and monitoring of the credit worthiness of our customers and/or significant amounts owing from customers. Despite our monitoring and procedures, especially in the current macroeconomic situation, we may find that, despite our efforts, one or more of our customers become insolvent or face bankruptcy proceedings. Such events could have an adverse effect on our operating results if our receivables applicable to that customer become uncollectable in whole or in part, or if our customers’ financial situation result in reductions in whole or in part of our ability to continue to sell our products or services to such customers at the same levels or at all.
Large potential environmental liabilities or costs of related regulatory compliance may adversely impact our financial position, results of operations and cash flows.
Federal, state, foreign and local laws and regulations impose restrictions and controls on the discharge of materials, chemicals and gases used in our semiconductor manufacturing processes, and on the operation of our facilities and equipment. We believe we use reasonable efforts to maintain a system of compliance and controls for these laws and regulations. However, we cannot promise that these controls will be effective or that issues with respect to these matters will not occur. There are also inherent limitations on the effectiveness of controls, including the failure of human judgment.
Under some laws and regulations, we could be held financially responsible for remedial measures if our properties are contaminated or if we send waste to a landfill or recycling facility that becomes contaminated, even if we did not cause the contamination. Under other laws, we may be subject to fines and penalties if facilities or equipment are not operated in technical compliance with permit conditions or if required reports are not timely filed with applicable agencies. Also, we may be subject to common law claims if we release substances that damage or harm third parties. We have been subject to claims of governmental authorities and other third parties, and may continue to be in the future (See Note 15, “Environmental Matters”, to our Consolidated Financial Statements set forth in Part II, Item 8).
Further, changes in environmental laws or regulations may require additional investments in capital equipment or the implementation of additional compliance programs in the future. Additionally, if we were to divest additional facilities, our facilities may undergo further environmental review and investigation which may lead to previously unknown environmental liabilities.
While we intend to defend against any claim of liability in this area vigorously, any claim against us in this regard if resolved unfavorably, or any present or future failure to comply with environmental laws or regulations, could subject us to serious liabilities and could have a material adverse effect on our results of operation and financial condition.
22
Our international operations expose us to material risks that could materially adversely affect our operating results and financial condition.
We expect revenues from foreign markets to continue to represent a significant portion of total revenues. We maintain or contract with others to promote significant operations and equipment in foreign countries, including wafer fabrication, product assembly and testing. Among others, these risks include: changes in, or impositions of, legislative or regulatory requirements, including tax laws in the United States and in the countries in which we manufacture or sell our products; trade restrictions and sanctions (including, without limitation, increasing sanctions with respect to Russia and China); transportation delays; work stoppages; economic and political instability; crime; kidnapping; war; terrorism; and foreign currency fluctuations.
Any or all of such risks could materially adversely affect the revenues and operating results of our segments or Company as a whole. Additionally, in certain jurisdictions where we use third party contractors, the legal systems do not provide effective remedies to us when the contractor has breached its obligation or otherwise fails to perform.
In addition, it is more difficult in some foreign countries to protect our products or intellectual property rights to the same extent as is possible in the United States. Therefore, the risk of piracy or misuse of our technology and product may be greater in these foreign countries.
As a result of our foreign operations, we have sales, expenses, assets and liabilities denominated in foreign currencies. For example:
• | some of our manufacturing costs are denominated in British Pound, Mexican Peso and other foreign currencies; and |
• | some sales of our products are denominated in Euro, Japanese Yen and other foreign currencies; and |
• | some property, plant and equipment purchases are denominated in Japanese Yen, Euro, British Pound and other foreign currencies. |
As a result, movements in exchange rates could cause our net sales and expenses to fluctuate, affecting our profitability and cash flows. We use foreign currency forward contracts to reduce our exposure to foreign currency exchange rate fluctuations. The objective of these contracts is to reduce the impact of foreign currency exchange rate movements on our operating results. We do not use these contracts for speculative or trading purposes. These activities may not be successful in reducing our foreign currency exchange rate exposure, and could result in a material adverse effect on our results of operation and financial condition.
Our reported results can be affected adversely and unexpectedly by the implementation of new, or changes in the interpretation of existing, United States generally accepted accounting principles (GAAP).
Our financial reporting is subject to GAAP, and GAAP is subject to change over time. If new rules or interpretations of existing rules require us to change our financial reporting, our reported results of operations and financial condition could be affected substantially, including requirements to restate historical financial reporting.
Security breaches and other disruptions could compromise the integrity of our information and expose us to liability, which would cause our business and reputation to suffer.
We routinely collect and store sensitive data, including intellectual property and other proprietary information about our business and that of our customers, suppliers and business partners. The secure processing, maintenance and transmission of this information is critical to our operations and business strategy. Despite our security measures, our information technology and infrastructure may be vulnerable to attacks by hackers or breached due to employee error, malfeasance or other disruptions. Any such breach could compromise our networks and the information stored there could be accessed, publicly disclosed, lost or stolen. Any such access, disclosure or other loss of information could result in legal claims or proceedings and liability under laws that protect the privacy of personal information. It could also result in regulatory penalties, disrupt our operations and the services we provide to customers, damage our reputation and cause a loss of confidence in our products and services, which could adversely affect our business/operating margins, revenues and competitive position.
23
Terrorist attacks, or threats or occurrences of other terrorist activities whether in the United States or internationally may affect the markets in which our common stock trades, the markets in which we operate and our profitability.
Terrorist attacks, such as those that took place on September 11, 2001, or threats or occurrences of other terrorist or related activities, whether in the United States or internationally, may affect the market in which our common stock trades, the markets in which we operate and our profitability. Future terrorist or related activities could affect our domestic and international sales, disrupt our supply chains and impair our ability to produce and deliver our products. These activities could affect our physical facilities or those of our suppliers or customers, and make transportation of our supplies and products more difficult or cost prohibitive. Due to the broad and uncertain effects that terrorist attacks have had on financial and economic markets generally, we cannot provide any estimate of how these activities might affect our future results.
Natural disasters, whether in the United States or internationally, may materially adversely affect the markets in which our common stock trades, the markets in which we operate, our ability to produce and sell product, and our operating results and financial condition.
Our corporate headquarters, one of our manufacturing facilities, one of our key research facilities, one of our key third party foundries and certain other critical business operations are located near major earthquake fault lines. In addition, one of our major manufacturing facilities is located in a high brush fire danger area. Another major manufacturing facility and the facilities of some of our third party contractors are potentially susceptible to flood risk. Additionally, many of our other third party contractors perform work for us in areas susceptible to natural disasters.
Natural disasters, whether in the United States or internationally, generally may affect the markets in which our common stock trades, the markets in which we operate, our ability to achieve revenues and our profitability. In the past, our operations and those of our third party contractors have been affected by a number of natural disasters, including, among other things, earthquakes, fires, floods, volcanoes, hurricanes, and inclement weather, and may be affected by additional natural disasters in the future. Additionally, such events could result in power or other utility outages, delay or result in cancellation of domestic and international sales, disrupt our supply chains, close factories and delay production, reduce sales and cancel orders, and impair our ability to produce, sell and deliver our products. Such events could affect physical facilities, including without limitation, the facilities where we or our contractors or vendors produce materials and products (whether finished goods or raw materials and process chemicals and gases). Such events could also make transportation of our supplies and products more difficult, delay delivery, or cost prohibitive. Additionally, to the extent we may not be able to satisfy contractual obligations, we may be subject to potential claims.
Due to the broad and uncertain effects that natural events could have on our Company, we cannot provide an estimate of how these activities might adversely affect our future results however, we could be materially and adversely affected by any of these events. Also, although we maintain insurance policies, we may not have or maintain sufficient insurance coverage at levels and with such deductibles and limitations that would prevent a material adverse effect on our financial condition or results of operations.
ITEM 1B. UNRESOLVED STAFF COMMENTS
As of the date of this Annual Report on Form 10-K, there are no unresolved Staff comments regarding our previously filed periodic or current reports under the Exchange Act.
24
ITEM 2. PROPERTIES
We maintain manufacturing facilities, design centers, and business offices around the world. Our manufacturing facilities, design centers, and business offices as of June 29, 2014, are in the following locations:
Location | Owned | Leased | Semiconductor Silicon/Wafer Manufacturing | Wafer Thinning, Assembly and Test/ Module Manufacturing | Design Center | Business/ Office |
El Segundo, California (U.S.A.) | X | X | X | X | ||
Temecula, California (U.S.A.) | X | X | X | |||
San Jose, California (U.S.A.) | X | X | X | X | ||
Irvine, California (U.S.A.) | X | X | ||||
Chandler, Arizona (U.S.A.) | X | X | X | |||
Mesa, Arizona (U.S.A.) | X | X | ||||
Durham, North Carolina (U.S.A.) | X | X | ||||
Leominster, Massachusetts (U.S.A.) | X | X | X | X | ||
Tewksbury, Massachusetts (U.S.A.) | X | X | X | |||
St. Paul, Minnesota (U.S.A.) | X | X | ||||
Warwick, Rhode Island (U.S.A.) | X | X | ||||
Tijuana, Mexico | X | X | X | |||
Reigate, England (U.K.) | X | X | X | |||
Newport, Wales (U.K.) | X | X | X | X | X | |
Skovlunde, Denmark | X | X | ||||
Provence, France | X | X | ||||
Neu Isenburg, Germany | X | X | ||||
Pavia, Italy | X | X | ||||
Singapore | X | X | X | |||
Beijing, China | X | X | ||||
Shanghai, China | X | X | ||||
Shenzhen, China | X | X | ||||
Hong Kong, China | X | X | ||||
Seoul, Korea | X | X | ||||
Osaka, Japan | X | X | ||||
Nagoya, Japan | X | X | ||||
Tokyo, Japan | X | X | ||||
Our manufacturing facilities in San Jose, California and Leominster, Massachusetts are dedicated for use by the HiRel segment. With the exception of the facilities at these two locations, the rest of our fabrication and assembly and test facilities are generally shared by the PMD, ESP, AP, EP, and HiRel segments. The IP segment generally operates out of our El Segundo, California business office.
We believe our current facilities, supplemented by third party contract wafer fabrication and assembly and test capacity, are adequate for our near-term operating needs; however, we continue to take a number of actions to respond to changes in customer demand. Specifically, during fiscal year 2014 we added capacity to our existing external contract wafer fabrication capacity and assembly and test capacity related to certain proprietary and higher value-added products and programs. Recently, we have made capacity adjustments to our internal factories. Pursuant to our fiscal year 2013 Restructuring Initiatives, we have closed one older and less efficient factory, and will partially close another. We are consolidating a certain amount of our proprietary processes such as ultra-thin wafer processing into a small wafer thinning facility in Singapore. Certain wafers from both third party contract wafer fabrication facilities and an internal manufacturing facility will go to our Singapore facility for final processing.
In addition to the facilities listed above, we have sales or technical support offices located in China, Finland, France, Germany, India, Italy, Japan, Mexico, the Philippines, Russia, Singapore, South Korea, Sweden, Taiwan, the United Kingdom and the United States.
25
ITEM 3. LEGAL PROCEEDINGS
Our disclosures regarding the matters set forth in Note 15, "Environmental Matters," and Note 16 "Litigation," to our consolidated financial statements set forth in Part II, Item 8, herein, are incorporated herein by reference.
ITEM 4. MINE SAFETY DISCLOSURES
Not applicable.
26
PART II
ITEM 5. MARKET FOR THE REGISTRANT’S COMMON EQUITY, RELATED STOCKHOLDER MATTERS AND ISSUER PURCHASES OF EQUITY SECURITIES
Market Information
Our common stock is traded on the New York Stock Exchange (“NYSE”) under the symbol “IRF.” There were 947 registered holders of record of our common stock as of June 29, 2014. Stockholders are urged to obtain current market quotations for the common stock. For equity compensation plan information, please refer to Part III, Item 12, “Security Ownership of Certain Beneficial Owners and Management and Related Stockholder Matters” herein, and matters incorporated herein by reference from the Company’s proxy statement relating to the Company’s 2014 annual meeting of stockholders to be filed within 120 days after June 29, 2014.
As of our fiscal year ended June 29, 2014, 8.4 million common stock shares are reserved for issuance under our equity incentive plans, of which 0.3 million stock options and 3.8 million restricted stock units are outstanding and approximately 4.3 million are available for future grants. As of June 29, 2014, 0.2 million stock options were outstanding and exercisable at an average exercise price of $21.77.
Dividends
No cash dividends have been declared to stockholders during the past three years, and we do not expect to declare cash dividends in the foreseeable future. However; payment of dividends is within the discretion of our Board of Directors, and will depend upon, among other things, our earnings, financial condition, capital requirements, and general business conditions.
Stock Prices
The following table contains daily closing stock prices for each quarter of fiscal years 2014, and 2013:
2014 | 2013 | |||||||||||
Fiscal Quarter | High | Low | High | Low | ||||||||
1st | $ | 25.52 | $ | 21.19 | $ | 19.99 | $ | 16.25 | ||||
2nd | 26.04 | 22.91 | 17.91 | 14.69 | ||||||||
3rd | 28.12 | 24.13 | 21.80 | 17.50 | ||||||||
4th | 28.72 | 25.25 | 22.53 | 18.04 | ||||||||
27
Stock Performance
The following graph compares the cumulative total stockholder return of our common stock during the last five fiscal years with (i) the cumulative total return of the Standard and Poor’s 500 Stock Index and (ii) the cumulative total return of the Standard and Poor’s High Technology Composite Index. The comparison assumes $100 was invested on June 28, 2009 in our common stock and in each of the foregoing indices and the reinvestment of dividends through fiscal year ended June 29, 2014. The stock price performance on the following graph is not necessarily indicative of future stock price performance.
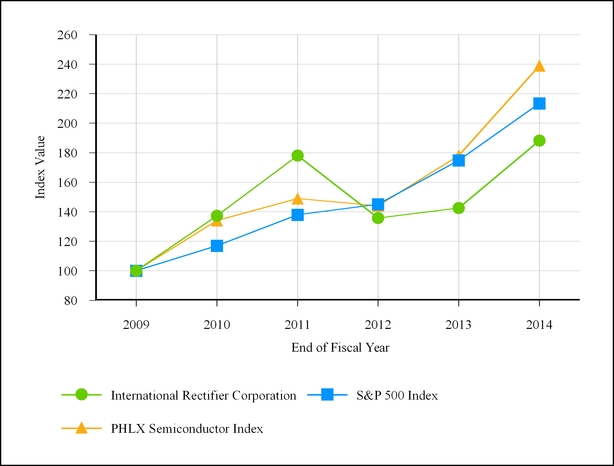
Cumulative Total Return | End of Fiscal Year (In US Dollars) | |||||||||||
2009 | 2010 | 2011 | 2012 | 2013 | 2014 | |||||||
International Rectifier Corporation | 100 | 137 | 178 | 136 | 143 | 188 | ||||||
S&P 500 Index | 100 | 117 | 138 | 145 | 175 | 213 | ||||||
PHLX Semiconductor Index | 100 | 134 | 149 | 144 | 178 | 239 | ||||||
28
Recent Sales of Unregistered Securities
None.
Purchase of Equity Securities
The following provides information on a fiscal monthly basis for the quarter ended June 29, 2014, with respect to the Company’s purchases of equity securities under the authorized stock repurchase program:
Period | Total Number of Shares Purchased | Average Price Paid per Share | Total Number of Shares Purchased as Part of Publicly Announced Plans or Programs (1) | Maximum Number (or Approximate Dollar Value) of Shares that May Yet be Purchased Under the Plans or Programs | |||||||
March 31, 2014 to April 27, 2014 | — | — | — | $ | 34,226,768 | ||||||
April 28, 2014 to May 25, 2014 | 242,661 | $ | 25.72 | 242,661 | $ | 27,978,963 | |||||
May 26, 2014 to June 29, 2014 | 138,473 | $ | 27.15 | 138,473 | $ | 24,215,340 | |||||
(1) | On October 27, 2008, the Company announced that its Board of Directors had authorized a stock repurchase program of up to $100 million. The Company announced on July 20, 2010, that its Board of Directors had authorized an additional $50 million for the stock repurchase program bringing the total authorized for the plan to $150 million. This plan may be suspended at any time without prior notice. |
29
ITEM 6. SELECTED FINANCIAL DATA
The following tables include consolidated selected summary financial data for each of our last five fiscal years. The selected financial data for our fiscal years ended June 29, 2014, June 30, 2013 and June 24, 2012, and as of June 29, 2014 and June 30, 2013, are derived from our audited Consolidated Financial Statements, contained in Part II, Item 8, “Financial Statements and Supplementary Data,” of this report. The selected financial data for our fiscal years ended June 26, 2011 and June 27, 2010, and as of June 24, 2012, June 26, 2011 and June 27, 2010, are derived from our audited Consolidated Financial Statements for these periods, which are not included in this report. This information should be read in conjunction with our audited Consolidated Financial Statements and Management’s Discussion and Analysis of Financial Condition and Results of Operations.
Statements of Operations Data | Fiscal Year Ended (1) | ||||||||||||||||||
June 29, 2014 | June 30, 2013 | June 24, 2012 | June 26, 2011 | June 27, 2010 | |||||||||||||||
(In thousands, except per share data) | |||||||||||||||||||
Revenues | $ | 1,106,571 | $ | 977,035 | $ | 1,050,588 | $ | 1,176,577 | $ | 895,297 | |||||||||
Cost of sales | 707,363 | 719,930 | 710,565 | 711,685 | 602,700 | ||||||||||||||
Gross profit | 399,208 | 257,105 | 340,023 | 464,892 | 292,597 | ||||||||||||||
Selling, general and administrative expense | 182,318 | 181,746 | 200,411 | 193,748 | 169,190 | ||||||||||||||
Research and development expense | 130,848 | 127,093 | 135,105 | 119,339 | 99,310 | ||||||||||||||
Impairment of goodwill | — | — | 69,421 | — | — | ||||||||||||||
Amortization of acquisition‑related intangible assets | 6,420 | 6,653 | 8,369 | 6,768 | 4,375 | ||||||||||||||
Asset impairment, restructuring and related charges (recoveries) | 5,638 | 16,996 | — | (3,359 | ) | 289 | |||||||||||||
Gain on disposition of property | — | — | (5,410 | ) | — | — | |||||||||||||
Operating income (loss) | 73,984 | (75,383 | ) | (67,873 | ) | 148,396 | 19,433 | ||||||||||||
Other expense, net | 2,974 | 1,390 | 4,267 | 718 | 2,019 | ||||||||||||||
Interest expense (income), net | 24 | 57 | (333 | ) | (10,114 | ) | (11,221 | ) | |||||||||||
Income (loss) from continuing operations before income taxes | 70,986 | (76,830 | ) | (71,807 | ) | 157,792 | 28,635 | ||||||||||||
Provision for (benefit from) income taxes | 12,253 | 11,990 | (16,757 | ) | (8,754 | ) | (52,192 | ) | |||||||||||
Income (loss) from continuing operations | $ | 58,733 | $ | (88,820 | ) | $ | (55,050 | ) | $ | 166,546 | $ | 80,827 | |||||||
Net income (loss) per common share-basic | $ | 0.83 | $ | (1.28 | ) | $ | (0.79 | ) | $ | 2.35 | $ | 1.13 | |||||||
Net income (loss) per common share-dilutive | $ | 0.81 | $ | (1.28 | ) | $ | (0.79 | ) | $ | 2.33 | $ | 1.13 | |||||||
Balance Sheet Data | |||||||||||||||||||
Total cash, cash equivalents, restricted cash and investments | $ | 610,410 | $ | 455,895 | $ | 385,884 | $ | 499,668 | $ | 586,590 | |||||||||
Total assets | 1,565,540 | 1,453,212 | 1,531,823 | 1,670,984 | 1,440,917 | ||||||||||||||
Long-term debt, less current maturities | — | — | — | — | — | ||||||||||||||
Notes:
1. | No dividends were paid by the Company during the five years presented. |
30
ITEM 7. MANAGEMENT’S DISCUSSION AND ANALYSIS OF FINANCIAL CONDITION AND RESULTS OF OPERATIONS
This Management’s Discussion and Analysis of Financial Condition and Results of Operations (“MD&A”) should be read in conjunction with the other sections of this Annual Report on Form 10-K, including Part I, Item 1, “Business;” Part II, Item 6, “Selected Financial Data;” and Part II, Item 8, “Financial Statements and Supplementary Data.” Except for historic information contained herein, the matters addressed in this MD&A constitute “forward‑looking statements” within the meaning of Section 27A of the Securities Act of 1933, as amended (“Securities Act”), and Section 21E of the Exchange Act, as amended. Forward‑looking statements may be identified by the use of terms such as “anticipate,” “believe,” “expect,” “intend,” “project,” “will,” and similar expressions. Such forward‑looking statements are subject to a variety of risks and uncertainties, including those discussed under the heading “Statement of Caution Under the Private Securities Litigation Reform Act of 1995,” in Part I, Item 1A, “Risk Factors” and elsewhere in this Annual Report on Form 10-K, that could cause actual results to differ materially from those anticipated by us. We undertake no obligation to update these forward‑looking statements to reflect events or circumstances after the date of this Annual Report or to reflect actual outcomes.
The following discussion and analysis provides information we believe is relevant to an assessment and understanding of our consolidated results of operations and financial condition. This discussion should be read in conjunction with our consolidated financial statements and accompanying notes for the year ended June 29, 2014. The discussion includes:
• | Overview |
• | Results of Operations |
• | Liquidity and Capital Resources |
• | Recent Accounting Standards |
• | Critical Accounting Polices and Estimates |
While we have made certain forward looking statements regarding revenues, gross margin, cash flows, selling, general and administrative expense and research and development expense in the following MD&A based on our current visibility into the market and current trends, actual results could vary significantly based on changed conditions, among other reasons (See Part I, Item 1A, “Risk Factors”).
Overview
Fiscal Year 2014 Developments
On August 20, 2014, we entered into a merger agreement with Infineon Technologies AG ("Infineon") pursuant to which a wholly-owned subsidiary of Infineon will merge with and into us, resulting in us becoming a wholly-owned subsidiary of Infineon. See Note 18 to our Consolidated Financial Statements included in Item 8 of Part II of this Form 10-K for more information.
Our financial results for fiscal year 2014 include the following measures:
• | Our revenues were $1,106.6 million, a 13.3 percent increase from the prior fiscal year. |
• | Our gross margin was 36.1 percent, an increase of 9.8 percentage points from 26.3 percent in the prior fiscal year. |
• | Our net income was $58.7 million, compared to a net loss of $88.8 million in the prior fiscal year. |
• | Our diluted net income per share was $0.81, compared to net loss per share of $1.28 in the prior fiscal year. |
• | We generated cash from operating activities of $180.1 million during fiscal year 2014 compared to $139.4 million in the prior fiscal year. |
We conduct our business on a 52/53 week fiscal year. When operating under a 52/53 week fiscal year, it becomes necessary to have a longer fiscal year approximately every 5-6 years, resulting in a 53 week fiscal year. Fiscal year 2013 was such a 53 week year with a fourth quarter that was 14 weeks long, instead of a typical 13 weeks. As a result, on a normalized basis, our revenues and most operating expenses (but not all) were increased in our fourth quarter ended June 30, 2013 to approximately 108 percent of what they otherwise would have been for the typical 13-week quarter, and increased for the year to approximately 102 percent of what they otherwise would have been for a typical 52-week year. However, certain costs, primarily depreciation but also leases and a few other expenses, were incurred at a normal “quarterly” rate, rather than increasing due to the extra week.
31
Our revenues were $1,106.6 million for the fiscal year ended June 29, 2014, an increase of $129.5 million or 13.3 percent compared to revenues of $977.0 million for the fiscal year ended June 30, 2013. This revenue increase was primarily due to a general improvement in demand across all of our customer segments.
Our gross margin percentage increased by 9.8 percentage points to 36.1 percent for the fiscal year ended June 29, 2014 compared to the fiscal year ended June 30, 2013. The increase in gross margin percentage was mainly a result of a reduction in manufacturing costs and an improvement in factory utilization, partially offset by lower selling prices.
During the fiscal year ended June 29, 2014, we continued to focus on consolidating our internal manufacturing footprint and otherwise reducing manufacturing costs. We also continued efforts to increase our manufacturing flexibility by qualifying additional technologies and higher value-added products and programs with our contract wafer fabrication and assembly and test suppliers. In the short-term, we have targeted using external contractors for around 30 percent of our wafer fabrication needs, and around 75 percent of our packaging needs. We will continue to monitor the demand environment and we may seek to further adjust our internal manufacturing footprint and take other actions to reflect changes in demand in future periods.
In August 2012, we adopted a restructuring plan to modify our manufacturing strategy and lower our operating expenses in order to align our cost structure with current business conditions. As part of the plan, we closed our El Segundo wafer fabrication facility in March 2013 and we have achieved the previously estimated annual cost savings of approximately $10 million. As an additional part of the plan, the resizing of our Newport, Wales fabrication facility is expected to continue in several phases. We currently expect the resizing to be completed by the middle of calendar year 2015, with estimated annual cost savings of approximately $16 million following completion.
In conjunction with our ongoing restructuring plan, we incurred approximately $5.1 million of equipment relocation and re-qualification costs, $0.4 million of decommissioning costs, and $0.1 million of severance and workforce reduction costs during the fiscal year ended June 29, 2014. We anticipate that we will incur restructuring charges during fiscal year 2015 of approximately $6.6 million (See Part I, Item 1, Notes to Consolidated Financial Statements - Note 10, “Asset Impairment, Restructuring and Related Charges”).
Our SG&A expenses increased by $0.6 million for the fiscal year ended June 29, 2014, compared to the fiscal year ended June 30, 2013. The year-over-year increase in SG&A expenses was primarily due to increased bonus expense and stock compensation expense, mostly offset by decreased litigation and other legal expenses.
R&D expenses increased by $3.8 million for the fiscal year ended June 29, 2014, compared to the fiscal year ended June 30, 2013. The year-over-year increase in R&D expenses was primarily due to increased bonus expense and stock compensation expense, partially offset by a decrease resulting from the absence of a one-time asset impairment charge that was recorded in the prior year comparable period, and decreased material related costs.
Our cash, cash equivalents and investments as of June 29, 2014 totaled $609.0 million (excluding restricted cash of $1.4 million), compared to $454.5 million (excluding restricted cash of $1.3 million) as of June 30, 2013. The increase in our cash and investments was primarily due to cash flows from operating activities of $180.1 million, which consisted of $58.7 million of net income for fiscal year 2014 as adjusted for significant non-cash expenses, including depreciation expense and stock based compensation expense. Cash flows from operating activities provided $139.4 million of cash in the prior year comparable period.
Segment Reporting
For the description of our reportable segments, see Note 11, “Segment Information”, to our Consolidated Financial Statements set forth in Part II, Item 8.
Four of our five Customer Segments (as identified below), namely, PMD, ESP, AP and EP, generally share the same manufacturing base and sales, marketing, and distribution channels. While each segment focuses on different target end markets and applications, there are common performance elements arising from that shared manufacturing base and sales, marketing, and distribution channels. As a result, while we manage performance of these segments individually, we also analyze performance of these segments together, separately from our other Customer Segment, HiRel. For ease of reference, we refer to these four segments collectively as our “Commercial Segments.” What we refer to as our “Customer Segments” include our PMD, ESP, AP, EP and HiRel reporting segments, and excludes the IP segment.
32
Results of Operations
Selected Operating Results
The following table sets forth certain items included in selected financial data as a percentage of revenues (in millions, except percentages):
Fiscal Year Ended | ||||||||||||||||||||
June 29, 2014 | June 30, 2013 | June 24, 2012 | ||||||||||||||||||
Revenues | $ | 1,106.6 | 100.0 | % | $ | 977.0 | 100.0 | % | $ | 1,050.6 | 100.0 | % | ||||||||
Cost of sales | 707.4 | 63.9 | 719.9 | 73.7 | 710.6 | 67.6 | ||||||||||||||
Gross profit | 399.2 | 36.1 | 257.1 | 26.3 | 340.0 | 32.4 | ||||||||||||||
Selling, general and administrative expense | 182.3 | 16.5 | 181.7 | 18.6 | 200.4 | 19.1 | ||||||||||||||
Research and development expense | 130.8 | 11.8 | 127.1 | 13.0 | 135.1 | 12.9 | ||||||||||||||
Impairment of goodwill | — | — | — | — | 69.4 | 6.6 | ||||||||||||||
Amortization of acquisition‑related intangible assets | 6.4 | 0.6 | 6.7 | 0.7 | 8.4 | 0.8 | ||||||||||||||
Asset impairment, restructuring and related charges | 5.6 | 0.5 | 17.0 | 1.7 | — | — | ||||||||||||||
Gain on disposition of property | — | — | — | — | (5.4 | ) | (0.5 | ) | ||||||||||||
Operating income (loss) | 74.0 | 6.7 | (75.4 | ) | (7.7 | ) | (67.9 | ) | (6.5 | ) | ||||||||||
Other expense, net | 3.0 | 0.3 | 1.4 | 0.1 | 4.3 | 0.4 | ||||||||||||||
Interest expense (income), net | — | — | 0.1 | — | (0.3 | ) | — | |||||||||||||
Income (loss) before income taxes | 71.0 | 6.4 | (76.8 | ) | (7.9 | ) | (71.8 | ) | (6.8 | ) | ||||||||||
(Benefit from) provision for income taxes | 12.3 | 1.1 | 12.0 | 1.2 | (16.8 | ) | (1.6 | ) | ||||||||||||
Net income (loss) | $ | 58.7 | 5.3 | % | $ | (88.8 | ) | (9.1 | )% | $ | (55.1 | ) | (5.2 | )% | ||||||
Amounts and percentages in the above table may not total due to rounding.
33
Revenues and Gross Margin
Revenues and Gross Margin for Fiscal year 2014 Compared to Fiscal Year 2013
The following table summarizes revenues and gross margin by reportable segment for the fiscal year ended June 29, 2014 compared to the fiscal year ended June 30, 2013 (in thousands, except percentages):
Fiscal Years Ended | |||||||||||||||||||||||||||
June 29, 2014 | June 30, 2013 | Change | |||||||||||||||||||||||||
Revenues | Gross Margin | Gross Margin % | Revenues | Gross Margin | Gross Margin % | Revenues % | Gross Margin ppt | ||||||||||||||||||||
Power Management Devices (PMD) | $ | 411,967 | $ | 129,502 | 31.4 | % | $ | 367,762 | $ | 79,682 | 21.7 | % | 12.0 | % | 9.7 | ||||||||||||
Energy Saving Products (ESP) | 209,450 | 65,123 | 31.1 | 176,386 | 26,958 | 15.3 | 18.7 | 15.8 | |||||||||||||||||||
Automotive Products (AP) | 149,646 | 44,176 | 29.5 | 124,695 | 22,127 | 17.7 | 20.0 | 11.8 | |||||||||||||||||||
Enterprise Power (EP) | 133,947 | 55,062 | 41.1 | 116,302 | 37,754 | 32.5 | 15.2 | 8.6 | |||||||||||||||||||
Commercial Segments total | 905,010 | 293,863 | 32.5 | 785,145 | 166,521 | 21.2 | 15.3 | 11.3 | |||||||||||||||||||
HiRel | 200,412 | 104,196 | 52.0 | 188,831 | 88,185 | 46.7 | 6.1 | 5.3 | |||||||||||||||||||
Customer Segments total | 1,105,422 | 398,059 | 36.0 | 973,976 | 254,706 | 26.2 | 13.5 | 9.8 | |||||||||||||||||||
Intellectual Property (IP) | 1,149 | 1,149 | 100.0 | 3,059 | 2,399 | 78.4 | (62.4 | ) | 21.6 | ||||||||||||||||||
Consolidated total | $ | 1,106,571 | $ | 399,208 | 36.1 | % | $ | 977,035 | $ | 257,105 | 26.3 | % | 13.3 | % | 9.8 | ||||||||||||
Revenues
Revenues from all our segments, taken as a whole, increased by $129.5 million, or 13.3 percent for the fiscal year ended June 29, 2014 compared to the prior year comparable period. Revenues from our Customer Segments taken as a whole (which excludes the IP segment) increased by $131.4 million, or 13.5 percent. Revenues from our Commercial Segments taken as a whole increased by $119.9 million, or 15.3 percent.
Within our Commercial Segments, revenues for our PMD segment increased by 12.0 percent for the fiscal year ended June 29, 2014 compared to the prior year comparable period due to an increase in demand for our computing related products, industrial and consumer related products, and power supply components, partially offset by price erosion. Revenues for our ESP segment increased by 18.7 percent compared to the prior year comparable period due to increased demand in our consumer, industrial, and appliance related products resulting from a general market recovery, partially offset by price erosion. Revenues for our AP segment increased by 20.0 percent compared to the prior year comparable period primarily due to increased demand for new MOSFET, intelligent power switch IC, and IGBT products, partially offset by price erosion. Revenues for our EP segment increased by 15.2 percent compared to the prior year comparable period primarily due to an increase in demand for digital controller and PowIRstage products, partially offset by price erosion.
For the fiscal year ended June 29, 2014, our HiRel segment revenues increased by 6.1 percent compared to the prior year comparable period, primarily due to an increase in demand for RAD-Hard discrete products.
For the fiscal year ended June 29, 2014, our IP segment revenues decreased by $1.9 million or 62.4 percent, to $1.1 million compared to the prior year comparable period, primarily as a result of a one-time sale of patents in the prior year for $1.7 million.
34
Gross Margin
Our gross margin percentage increased by 9.8 percentage points to 36.1 percent for the fiscal year ended June 29, 2014 compared to 26.3 percent for the prior year comparable period. The increase in our gross margin percentage was the result of an increase of 11.3 percentage points in gross margin for our Commercial Segments taken as a whole, and an increase of 5.3 percentage points in gross margin for our HiRel segment. The increase in gross margin for our Commercial Segments was primarily due to lower manufacturing costs and improved factory utilization, partially offset by price erosion.
Our PMD segment's gross margin increased from 21.7 percent for the fiscal year ended June 30, 2013, to 31.4 percent for the fiscal year ended June 29, 2014, primarily due to lower manufacturing costs and improved factory utilization. Our ESP segment's gross margin increased from 15.3 percent for the fiscal year ended June 30, 2013, to 31.1 percent for the fiscal year ended June 29, 2014, primarily due to improved factory utilization and lower manufacturing costs, partially offset by price erosion. Our ESP segment has also been favorably impacted by cost savings associated with the fiscal year 2013 closure of our fabrication facility in El Segundo, California. Our AP segment's gross margin increased from 17.7 percent for the fiscal year ended June 30, 2013, to 29.5 percent for the fiscal year ended June 29, 2014, primarily due to lower manufacturing costs, lower inventory excess and obsolescence expense, and improved factory utilization. Our EP segment's gross margin increased from 32.5 percent for the fiscal year ended June 30, 2013, to 41.1 percent for the fiscal year ended June 29, 2014, primarily due to lower manufacturing costs, including a one-time benefit from the release of a legacy product related claim reserve, and lower inventory excess and obsolescence expense, partially offset by price erosion.
Our HiRel segment’s gross margin percentage increased from 46.7 percent for the fiscal year ended June 30, 2013, to 52.0 percent for the fiscal year ended June 29, 2014, primarily due to lower manufacturing costs, including the absence of unusual production costs associated with a fabrication transfer in the prior year.
Our IP segment’s gross margin percentage increased by 21.6 percentage points for the fiscal year ended June 29, 2014 compared to the prior year comparable period due to the absence of costs associated with the sale of patents in the prior year.
Revenues and Gross Margin for Fiscal Year 2013 Compared to Fiscal Year 2012
The following table summarizes revenues and gross margin by reportable segment for the fiscal year ended June 30, 2013 compared to the fiscal year ended June 24, 2012 (in thousands, except percentages):
Fiscal Years Ended | |||||||||||||||||||||||||||
June 30, 2013 | June 24, 2012 | Change | |||||||||||||||||||||||||
Revenues | Gross Margin | Gross Margin % | Revenues | Gross Margin | Gross Margin % | Revenues % | Gross Margin ppt | ||||||||||||||||||||
Power Management Devices (PMD) | $ | 367,762 | $ | 79,682 | 21.7 | % | $ | 367,913 | $ | 83,805 | 22.8 | % | 0.0 | % | (1.1 | ) | |||||||||||
Energy Saving Products (ESP) | 176,386 | 26,958 | 15.3 | 243,340 | 84,972 | 34.9 | (27.5 | ) | (19.6 | ) | |||||||||||||||||
Automotive Products (AP) | 124,695 | 22,127 | 17.7 | 113,353 | 25,326 | 22.3 | 10.0 | (4.6 | ) | ||||||||||||||||||
Enterprise Power (EP) | 116,302 | 37,754 | 32.5 | 132,164 | 45,913 | 34.7 | (12.0 | ) | (2.2 | ) | |||||||||||||||||
Commercial Segments total | 785,145 | 166,521 | 21.2 | 856,770 | 240,016 | 28.0 | (8.4 | ) | (6.8 | ) | |||||||||||||||||
HiRel | 188,831 | 88,185 | 46.7 | 192,229 | 98,418 | 51.2 | (1.8 | ) | (4.5 | ) | |||||||||||||||||
Customer Segments total | 973,976 | 254,706 | 26.2 | 1,048,999 | 338,434 | 32.3 | (7.2 | ) | (6.1 | ) | |||||||||||||||||
Intellectual Property (IP) | 3,059 | 2,399 | 78.4 | 1,589 | 1,589 | 100.0 | 92.5 | (21.6 | ) | ||||||||||||||||||
Consolidated total | $ | 977,035 | $ | 257,105 | 26.3 | % | $ | 1,050,588 | $ | 340,023 | 32.4 | % | (7.0 | )% | (6.1 | ) | |||||||||||
35
Revenues
Revenues from all our segments, taken as a whole, decreased by $73.6 million, or 7.0 percent. Revenues from our Customer Segments (which excludes the IP segment) decreased by $75.0 million, or 7.2 percent, for the fiscal year ended June 30, 2013 as compared to the prior year comparable period. Revenues for our Commercial Segments taken as a whole decreased by 8.4 percent compared to the prior year comparable period.
Within our Commercial Segments, revenues for our PMD segment were flat compared to the prior year comparable period due to a decrease in demand for our computing components offset by an increased demand for our industrial and consumer products components in the second half of the fiscal year. Revenues for our ESP segment decreased by 27.5 percent compared to the prior year comparable period due to decreased demand in our consumer and appliance related products resulting from market slowdowns mainly in Asia, inventory reductions at our customers, and price erosion. Revenues for our AP segment increased by 10.0 percent for the fiscal year ended June 30, 2013 compared to the prior year comparable period primarily due to increased demand for new IGBT and MOSFET products. Revenues for our EP segment decreased by 12.0 percent compared to the prior year comparable period due to a decrease in demand for prior generation server components and loss of market share in current generation server components, partially offset by increased demand for high-end computing and communication products.
For the fiscal year ended June 30, 2013, our HiRel segment revenues decreased by 1.8 percent compared to the prior year comparable period, primarily due to a decrease in shipments for RAD-Hard discrete products due to production issues associated with a fabrication transfer.
For the fiscal year ended June 30, 2013, our IP segment revenues increased by $1.5 million or 92.5 percent, to $3.1 million compared to the prior year comparable period. The increase in revenue arose from a one-time $1.7 million sale of patents.
Gross Margin
Our gross margin percentage decreased by 6.1 percentage points to 26.3 percent for the fiscal year ended June 30, 2013 compared to 32.4 percent for the prior year comparable period. This decrease in our gross margin percentage was the result of a decrease of 6.8 percentage points in gross margin for our Commercial Segments taken as a whole, and a decrease of 4.5 percentage points in gross margin for our HiRel segment. The decrease in gross margin for our Commercial Segments was primarily due to increased costs associated with lower factory utilization and price erosion.
Our PMD segment's gross margin decreased from 22.8 percent for the fiscal year ended June 24, 2012, to 21.7 percent for the fiscal year ended June 30, 2013, due to price erosion offset by a favorable industrial product component mix and lower inventory excess and obsolescence expense. Our ESP segment's gross margin decreased from 34.9 percent for the fiscal year ended June 24, 2012, to 15.3 percent for the fiscal year ended June 30, 2013, due to price erosion and higher inventory excess and obsolescence expense. Our AP segment's gross margin decreased from 22.3 percent for the fiscal year ended June 24, 2012, to 17.7 percent for the fiscal year ended June 30, 2013, due to price erosion and higher inventory excess and obsolescence expense. Our EP segment's gross margin decreased from 34.7 percent for the fiscal year ended June 24, 2012, to 32.5 percent for the fiscal year ended June 30, 2013, primarily due to an unfavorable product mix as a result of a decrease in our server related business, which has higher gross margins than our computing components business, and price erosion.
Our HiRel segment’s gross margin percentage decreased by 4.5 percentage points for the fiscal year ended June 30, 2013 compared to the prior year comparable period primarily due to unusual production costs associated with a fabrication transfer.
Our IP segment’s gross margin percentage decreased by 21.6 percentage points for the fiscal year ended June 30, 2013 compared to the prior year comparable period due to costs associated with the sale of patents.
36
Selling, General and Administrative Expense
(Dollar amounts in thousands) | Fiscal Year Ended June 29, 2014 | % of Revenues | Fiscal Year Ended June 30, 2013 | % of Revenues | Fiscal Year Ended June 24, 2012 | % of Revenues | % Revenues Change 2014 vs. 2013 | % Revenues Change 2013 vs. 2012 | |||||||||||
Selling, General and Administrative Expense | $ | 182,318 | 16.5 | % | $ | 181,746 | 18.6 | % | $ | 200,411 | 19.1 | % | (2.1) ppt | (0.5) ppt | |||||
Our SG&A expenses increased by $0.6 million for the fiscal year ended June 29, 2014, compared to the fiscal year ended June 30, 2013. The year-over-year increase in SG&A expenses was primarily due to increased bonus expense and stock compensation expense, mostly offset by decreased litigation and other legal expenses.
SG&A expenses decreased by $18.7 million for the fiscal year ended June 30, 2013, compared to the fiscal year ended June 24, 2012. The year-over-year decrease in SG&A expenses was primarily due to a decrease in headcount related expenses and decreased professional services, partly offset by increased litigation expenses and increased stock compensation expense. The decreases were partially offset by an increase in SG&A depreciation expense of $3.3 million for the fiscal year ended June 30, 2013 compared to the previous year due to the implementation of our Enterprise Resource Planning (“ERP”) system at the beginning of the second quarter of fiscal year 2012 as well as additional ERP enhancements which went into service throughout fiscal year 2013.
Research and Development Expense
(Dollar amounts in thousands) | Fiscal Year Ended June 29, 2014 | % of Revenues | Fiscal Year Ended June 30, 2013 | % of Revenues | Fiscal Year Ended June 24, 2012 | % of Revenues | % Revenues Change 2014 vs. 2013 | % Revenues Change 2013 vs. 2012 | ||||||||||
Research and Development Expense | $ | 130,848 | 11.8 | % | $ | 127,093 | 13.0 | % | $ | 135,105 | 12.9 | % | (1.2) ppt | 0.1 ppt | ||||
R&D expenses increased by $3.8 million for the fiscal year ended June 29, 2014, compared to the fiscal year ended June 30, 2013. The year-over-year increase in R&D expenses was primarily due to increased bonus expense and stock compensation expense, partially offset by a decrease resulting from the absence of a one-time asset impairment charge that was recorded in the prior year comparable period, and decreased material related costs.
R&D expenses decreased by $8.0 million for the fiscal year ended June 30, 2013, compared to the fiscal year ended June 24, 2012. The year-over-year decrease in R&D expenses was primarily due to a decrease in headcount related expenses as a result of our restructuring initiatives and decreased material related costs, which were partly offset by the exhaustion of certain reimbursable grant funding at the end of fiscal year 2012, increased asset impairment expense, and increased stock compensation expense.
Impairment of Goodwill
During the fourth quarter of fiscal years 2014 and 2013, we completed our annual goodwill impairment tests. Based on the results of these tests, no impairment was recorded in either period.
In the fourth quarter of fiscal year 2012, we completed our annual goodwill impairment tests, taking into account current and anticipated future economic conditions and technology trends, and estimated future operating results. After completing the first step in the goodwill impairment analysis, we concluded that the goodwill in the EP segment was impaired. Several factors led to a reduction in forecasted EP segment cash flows, key among them, deteriorating market conditions, business trends, and projected product mix, causing lower than expected performance. As a result, the net book value of our EP segment exceeded its estimated fair value determined using a discounted cash flow analysis. As the estimated fair value was less than the net book value, we performed the second step of the impairment test, and as a result of the step two analysis, we recorded a goodwill impairment charge of $69.4 million relating to our EP segment in fiscal year 2012.
37
Asset Impairment, Restructuring and Related Charges (Recoveries)
Asset impairment, restructuring and related charges reflect the impact of certain cost reduction programs and initiatives implemented by us. These programs and initiatives include the closing of facilities, the termination of employees and other related activities. Asset impairment, restructuring and related charges include program-specific exit costs, severance benefits pursuant to an ongoing benefit arrangement, and special termination benefits. Severance costs unrelated to our restructuring initiatives are recorded as an element of cost of sales, R&D expense, or SG&A expense, depending upon the classification and function of the employment position terminated. Restructuring costs are expensed during the period in which all requirements of recognition were met.
Fiscal Year 2013 Initiatives
During the first quarter of fiscal year 2013, we announced a restructuring plan to modify our manufacturing strategy and lower operating expenses in order to align our cost structure with business conditions. As part of the plan, we are incurring costs recorded in asset impairment, restructuring and related charges related primarily to the following:
• | El Segundo Fabrication Facility Closure Initiative |
• | Newport Fabrication Facility Resizing Initiative |
• | Other Cost Reduction Activities Initiative (completed in fiscal year 2013) |
The following tables summarize the total asset impairment, restructuring and related charges by initiative for fiscal years 2014 and 2013 (in thousands):
Fiscal Year Ended | |||||||||||||||
June 29, 2014 | |||||||||||||||
El Segundo Fabrication Facility Closure Initiative | Newport Fabrication Facility Resizing Initiative | Other Cost Reduction Activities Initiative | Total | ||||||||||||
Reported in asset impairment, restructuring and related charges: | |||||||||||||||
Asset impairment | $ | — | $ | — | $ | — | $ | — | |||||||
Severance and workforce reduction costs (recoveries) | (20 | ) | 141 | — | 121 | ||||||||||
Decommissioning costs | — | 383 | — | 383 | |||||||||||
Relocation and re-qualification costs | 4 | 5,130 | — | 5,134 | |||||||||||
Total asset impairment, restructuring and related charges | $ | (16 | ) | $ | 5,654 | $ | — | $ | 5,638 | ||||||
Fiscal Year Ended | |||||||||||||||
June 30, 2013 | |||||||||||||||
El Segundo Fabrication Facility Closure Initiative | Newport Fabrication Facility Resizing Initiative | Other Cost Reduction Activities Initiative | Total | ||||||||||||
Reported in asset impairment, restructuring and related charges: | |||||||||||||||
Asset impairment | $ | 178 | $ | 675 | $ | 1,062 | $ | 1,915 | |||||||
Severance and workforce reduction costs | 5,875 | 597 | 5,417 | 11,889 | |||||||||||
Decommissioning costs | — | 79 | — | 79 | |||||||||||
Relocation and re-qualification costs | 398 | 2,715 | — | 3,113 | |||||||||||
Total asset impairment, restructuring and related charges | $ | 6,451 | $ | 4,066 | $ | 6,479 | $ | 16,996 | |||||||
38
In addition to the amounts in the tables above, $2.1 million and $2.0 million of other charges related to the restructuring initiatives were recorded in cost of sales during the fiscal years ended June 29, 2014 and June 30, 2013, respectively. These charges, which were for accelerated depreciation and inventory write-downs, are not classifiable as restructuring costs, and were therefore recorded in cost of sales.
The following table summarizes changes in our restructuring related accruals related to our fiscal year 2013 initiatives for the fiscal years ended June 29, 2014 and June 30, 2013, which are included in accrued salaries, wages, and benefits on the balance sheet (in thousands):
El Segundo Fabrication Facility Closure Initiative | Newport Fabrication Facility Resizing Initiative | Other Cost Reduction Activities Initiative | Total | ||||||||||||
Accrued severance and workforce reduction costs at June 24, 2012 | $ | — | $ | — | $ | — | $ | — | |||||||
Accrued during the period and charged to asset impairment, restructuring and related charges | 5,875 | 597 | 5,417 | 11,889 | |||||||||||
Costs paid during the period | $ | (5,678 | ) | $ | (597 | ) | $ | (5,417 | ) | $ | (11,692 | ) | |||
Accrued severance and workforce reduction costs June 30, 2013 | 197 | — | — | 197 | |||||||||||
Accrued during the period and charged to asset impairment, restructuring and related charges | $ | (20 | ) | $ | 141 | $ | — | $ | 121 | ||||||
Costs paid during the period | (120 | ) | (141 | ) | — | (261 | ) | ||||||||
Accrued severance and workforce reduction costs June 29, 2014 | $ | 57 | $ | — | $ | — | $ | 57 | |||||||
El Segundo Fabrication Facility Closure Initiative
During fiscal year 2013, we adopted a restructuring plan and closed our El Segundo wafer fabrication facility in the third quarter of fiscal year 2013. During the fiscal year ended June 29, 2014, we incurred de minimis asset impairment, restructuring and related charges. During the fiscal year ended June 30, 2013, we incurred $6.5 million of asset impairment, restructuring and related charges.
In addition to the restructuring charges above, during the fiscal year ended June 30, 2013, we recorded $1.5 million of other charges related to the restructuring initiative in cost of sales. These other charges, which were for accelerated depreciation and inventory write-downs, are not classifiable as restructuring costs, and affected the ESP reporting segment. We recorded no such charges during the fiscal year ended June 29, 2014.
During the fiscal years ended June 29, 2014 and June 30, 2013, cash payments for this initiative were $0.1 million and $6.1 million, respectively, and are estimated to be approximately $0.1 million in fiscal year 2015.
In addition, we estimate we will make total cash expenditures of $2.5 million for the decontamination and restoration of this fabrication facility. These costs were previously considered as part of the asset impairment of the El Segundo Fabrication Facility recorded in the fourth quarter of fiscal year 2012, and are not anticipated to result in additional restructuring charges.
As a result of the El Segundo facility now being closed and in a decommissioning phase, no further expenses are expected to be incurred related to this initiative and we have achieved the previously estimated annual cost savings of approximately $10 million for fiscal year 2014 compared to our pre-initiative run rate. These cost savings were the result of reduced manufacturing overhead costs, which would have impacted cost of sales. These overhead cost savings were not offset by additional costs incurred in other locations.
39
Newport, Wales Fabrication Facility Resizing Initiative
During fiscal year 2013, we adopted a restructuring plan to resize our wafer fabrication facility in Newport, Wales in several phases. We currently expect the resizing to be completed by the middle of calendar year 2015. During the fiscal year ended June 29, 2014 and June 30, 2013, we incurred $5.7 million and $4.1 million, respectively, of asset impairment, restructuring and related charges. In connection with the plan, the Company estimates total pre-tax costs of approximately $16.3 million. These consist of approximately $0.7 million of asset impairment costs, $2.6 million of severance and workforce reduction costs, $4.4 million of decommissioning costs, and $8.6 million of relocation and re-qualification costs. In addition to the restructuring charges above, during the fiscal years ended June 29, 2014 and June 30, 2013, we recorded $2.1 million and $0.5 million, respectively, of other charges related to the restructuring initiative in cost of sales. These other charges, which were for accelerated depreciation, are not classifiable as restructuring costs.
During the fiscal years ended June 29, 2014 and June 30, 2013, cash payments for this initiative were $5.7 million and $3.4 million, respectively, and are estimated to be approximately $6.6 million in fiscal year 2015.
After the completion of this initiative, we estimate annual cost savings of approximately $16 million compared to our pre-initiative run rate. These cost savings are the result of reduced manufacturing overhead costs, which will impact cost of sales. We do not anticipate these cost savings to be offset by additional costs incurred in other locations.
Other Cost Reduction Activities Initiative (completed in fiscal year 2013)
During fiscal year 2013, we completed all actions for this initiative to reduce (i) capacity at manufacturing facilities in Mexico, California, and Arizona, and (ii) administrative and research and development costs around the world. As part of the plan, we incurred $5.4 million of severance and workforce reduction costs in fiscal year 2013. During the fiscal year ended June 30, 2013, severance and workforce reduction costs included $3.0 million related to manufacturing functions, $1.1 million for general and administrative functions, and $1.3 million for research and development functions.
As part of these efforts, during the fiscal year ended June 30, 2013, we also incurred $1.1 million of asset impairment costs for the planned disposition of certain manufacturing equipment related to our manufacturing facility in Mexico. During the fiscal year ended June 30, 2013, cash payments for this initiative were $5.4 million.
As a result of the efforts associated with this initiative, we have achieved the previously estimated annual cost savings of approximately $18 million for fiscal year 2014 compared to our pre-initiative run rate and the initiative is now closed. These cost savings resulted in reduced SG&A and R&D expenses, as well as lower cost of sales. Furthermore, these cost savings were not offset by significant additional costs incurred in other locations.
Other Expense, Net
Other expense, net includes, primarily, gains and losses related to foreign currency fluctuations and investment impairments, offset by tax indemnification releases. Other expense, net, was $3.0 million and $1.4 million for the fiscal years ended June 29, 2014 and June 30, 2013, respectively. Other expense, net for the fiscal year ended June 29, 2014 includes a foreign currency exchange loss of $1.5 million, and an unrealized loss of $1.4 million due to fluctuation in the fair value of a derivative financial instrument. The prior year comparable period included a foreign currency exchange loss of $2.2 million, and a cost-based investment impairment charge of $0.4 million, partially offset by a release of tax indemnification reserves of $1.1 million.
Other expense, net, was $4.3 million for the fiscal year ended June 24, 2012. The fiscal year ended June 24, 2012 included a foreign currency exchange loss of $3.5 million, and investment impairment charges of $2.9 million, which were partially offset by a $1.3 million release of tax indemnification reserves. Foreign currency exchange losses consist primarily of the re-measurement into the functional currency of non-functional currency receivable and payable balances, including intercompany balances, partially offset by foreign currency forward contracts.
40
Interest Expense (Income), Net
Interest income includes, primarily, realized gains related to the disposal of investments, and interest income from investments. Interest income was $0.4 million, $0.4 million, and $0.8 million for the fiscal years ended June 29, 2014, June 30, 2013, and June 24, 2012, respectively. Interest income remained relatively flat for the fiscal year ended June 29, 2014 compared to the fiscal year ended June 30, 2013. The decline in interest income for the fiscal year ended June 30, 2013 compared to the fiscal year ended June 24, 2012, was due primarily to lower average balances of interest bearing investments and lower interest rates that reduced interest income by $0.4 million.
Interest expense has remained relatively flat at around $0.5 million in each of the previous three fiscal years.
Income Taxes
Our provision for (benefit from) income taxes and effective tax rate for the fiscal years ended June 29, 2014, June 30, 2013, and June 24, 2012 was as follows (in thousands, except percentages):
Fiscal Year Ended | |||||||||||
June 29, 2014 | June 30, 2013 | June 24, 2012 | |||||||||
Income (loss) before income taxes | $ | 70,986 | $ | (76,830 | ) | $ | (71,807 | ) | |||
Provision for (benefit from) income taxes | 12,253 | 11,990 | (16,757 | ) | |||||||
Effective tax rate | 17.3 | % | (15.6 | )% | 23.3 | % | |||||
In fiscal year 2014 we recorded a tax expense of $12.3 million, or 17.3 percent of pre-tax income of $71.0 million. The main components of the expense were: (i) $7.0 million expense related to foreign and domestic taxes, (ii) $6.7 million expense resulting from multijurisdictional taxation, which included an expense of $2.9 million for the correction of an immaterial prior period error related to a deferred tax charge, (iii) $4.4 million related to a reduction of the United Kingdom (“UK”) statutory tax rate, reducing the value of the Company’s net deferred tax assets in the U.K. by this amount, (iv) $2.7 million in foreign withholding taxes, and (v) $0.5 million expense related to other foreign taxes. These expenses were partially offset by a net reduction in various foreign uncertain tax positions and related interest and penalties, which arose from lapses in applicable statutes of limitation and settlements with tax authorities, totaling approximately $9.0 million.
In fiscal year 2013 we recorded a tax expense of $12.0 million, or (15.6) percent, against a pre-tax loss of $76.8 million. The main components of the expense were: (i) $9.9 million expense related to foreign and domestic taxes, (ii) $3.5 million related to a reduction of the United Kingdom (“UK”) statutory tax rate, reducing the value of the Company’s net deferred tax assets in the U.K. by this amount, (iii) $3.3 million in foreign withholding taxes, and (iv) $0.4 million expense related to other foreign taxes. These expenses were partially offset by a net reduction in various foreign uncertain tax positions and related interest and penalties, which arose from lapses in applicable statutes of limitation and settlements with tax authorities, totaling approximately $5.1 million.
In fiscal year 2012 we recorded a tax benefit of $16.8 million, or 23.3 percent of pre-tax loss of $71.8 million. The main components of the benefit were: (i) $28.6 million benefit from release of the valuation allowance established with respect to our UK deferred tax assets and (ii) $7.7 million benefit resulting from multijurisdictional taxation. The benefit was partially offset by (i) $10.3 million increase in the valuation allowance established with respect to state deferred tax assets, (ii) $5.0 million of foreign withholding taxes, (iii) $3.0 million increase in foreign uncertain tax positions and related interest and penalties, (iv) $0.7 million expense related to foreign and domestic taxes, and (v) $0.5 million expense related to other foreign taxes.
We operate in multiple foreign jurisdictions with lower statutory tax rates than the United States, and our operation in Singapore has the most significant impact on the effective tax rate for the fiscal year 2014. We expect to be subject to an effective tax rate of 17 percent in Singapore for fiscal year 2015.
41
Liquidity and Capital Resources
Contractual Obligations and Commercial Commitments
As of the fiscal year ended June 29, 2014, our contractual obligations and commercial commitments described below are as follows (in thousands):
Payments Due by Period | |||||||||||||||||||||||||||
Total | Less than 1 Year | 1 - 2 Years | 2 - 3 Years | 3 - 4 Years | 4 - 5 Years | 5 Years & Thereafter | |||||||||||||||||||||
Operating leases (1) | $ | 49,320 | $ | 12,393 | $ | 10,170 | $ | 7,021 | $ | 6,240 | $ | 5,988 | $ | 7,508 | |||||||||||||
Purchase commitments: | |||||||||||||||||||||||||||
Capital purchase obligations | 15,690 | 11,157 | 2,765 | 1,768 | — | — | — | ||||||||||||||||||||
Other purchase obligations | 105,326 | 101,606 | 3,164 | 496 | 46 | 14 | — | ||||||||||||||||||||
Total contractual obligations | $ | 170,336 | $ | 125,156 | $ | 16,099 | $ | 9,285 | $ | 6,286 | $ | 6,002 | $ | 7,508 | |||||||||||||
Amount of Commercial Commitments by Expiration Period | ||||||||||||||||||||||||
Total | 2015 | 2016 | 2017 | 2018 | Thereafter | |||||||||||||||||||
Bank guarantees and letters of credit (1) | $ | 712 | $ | 712 | — | — | — | — | ||||||||||||||||
Total bank guarantees and letters of credit | $ | 712 | $ | 712 | $ | — | $ | — | $ | — | $ | — | ||||||||||||
(1) | These represent our off-balance sheet arrangements. |
The contractual obligations table above does not include reserves of $3.2 million for non-current liabilities related to unrecognized tax benefits as of June 29, 2014.
Other purchase obligations in the table above represent non-capital related agreements with vendors to supply inventory, inputs and/or services to our fabrication and assembly and test facilities.
On October 27, 2008, our Board of Directors authorized a stock repurchase program of up to $100.0 million of common stock of the Company. On July 20, 2010, our Board of Directors authorized an increase in the stock repurchase program limit by an additional $50.0 million bringing the total program authorization to $150.0 million. Repurchases of our shares of common stock under this program may be made in the open market or through privately negotiated transactions. The timing and actual number of shares repurchased depends on market conditions and other factors. The stock repurchase program may be suspended at any time without prior notice. For the fiscal year ended June 29, 2014, we repurchased approximately 0.5 million shares for approximately $12.6 million. As of June 29, 2014, we have purchased an aggregate of approximately 6.7 million shares for approximately $125.8 million under the program.
Revolving Credit Facility
On October 25, 2012 (the “Closing Date”), we entered into a Credit Agreement (the “Credit Agreement”), as borrower, with Wells Fargo Bank, National Association, as Administrative Agent (“Agent”), and certain lenders (the “Lenders”), pursuant to which we established a senior unsecured revolving credit facility (the “Credit Facility”) in an aggregate principal amount of $100 million with sublimits for swingline loans (of $25 million) and the issuance of letters of credit (of $10 million). The Credit Facility matures on October 25, 2016.
The proceeds of the Credit Facility may be used to finance certain capital expenditures and acquisitions permitted thereunder, to provide for the working capital and general corporate needs as well as to pay fees, commissions and expenses associated with the Credit Facility.
42
Outstanding amounts under the Credit Facility will initially bear interest at a rate per annum equal to, at our option, either (a) LIBOR plus 1.25 percent or (b) a “Base Rate” (equal to the greatest of (i) the Agent’s prime rate; (ii) the federal funds rate plus 0.50 percent; and (iii) LIBOR plus 1.00 percent) plus 0.25 percent. From and after our fiscal quarter ending on March 24, 2013, the margin over LIBOR and the Base Rate may be adjusted periodically based on our ratio of total funded debt to consolidated EBITDA as defined under the Credit Facility, with 1.75 percent per annum being the maximum LIBOR margin and 0.75 percent per annum being the maximum Base Rate margin established by such adjustment mechanism. We are required to pay a commitment fee on the unused commitments under the Credit Facility at an initial rate equal to 0.25 percent per annum (subject to a similar leverage-based adjustment up to a maximum of 0.35 percent per annum).
The terms of the Credit Agreement require us (subject to certain limited exceptions and conditions) to comply with the following financial tests: (i) maintenance of maximum total funded debt to consolidated EBITDA of not more than 2.50 to 1.0; (ii) maintenance of minimum consolidated EBITDA to consolidated interest charges of 4.00 to 1.0; and (iii) maintenance of minimum available liquidity of at least $200 million. Liquidity is generally defined as cash and cash equivalents, short-term investments and long-term investments (not to exceed $50 million), and the undrawn amount of the Credit Facility. As a result of the requirement to comply with the financial tests, we will not be able to access the Credit Facility during periods where the financial tests, including the minimum liquidity threshold, are not met, thereby limiting our ability to draw on the line during a period of illiquidity or at any other time where the minimum liquidity threshold is not met.
In addition, the Credit Agreement contains certain covenants that, among other things, restrict additional indebtedness, liens and encumbrances, investments, acquisitions, loans and advances, mergers, consolidations and asset dispositions, dividends and other restricted payments, transactions with affiliates, capital expenditures (limited to between $175 million and $200 million per annum during the term of the Credit Facility) and other matters customarily restricted in such agreements, in each case, subject to certain customary exceptions.
The Credit Agreement also contains customary provisions related to: (i) events of default, including payment defaults, (ii) breaches of representations and warranties, (iii) covenant defaults, (iv) cross-defaults to certain material indebtedness in excess of specified amounts, (v) certain events of bankruptcy and insolvency, (vi) judgments in excess of specified amounts, (vii) certain impairments to the guarantees or collateral documents, and (viii) change in control defaults.
As of June 29, 2014, we were in compliance with the financial covenants, and there were no amounts outstanding under the Credit Facility.
Off-Balance Sheet Arrangements
In the normal course of business, we enter into various off-balance sheet arrangements, including operating leases for buildings and equipment, standby letters of credit or other guarantees, and purchase commitments. See tables under “Contractual Obligations and Commercial Commitments” as disclosed previously in this “Liquidity and Capital Resources” section.
Sources and Uses of Cash
We require cash to fund our operating expense and working capital requirements, capital expenditures, strategic growth initiatives, and to repurchase our common stock under our stock repurchase program. Our primary sources for funding these requirements are cash and investments on hand and cash from operating activities. On October 25, 2012, we entered into a $100 million unsecured revolving credit facility, as discussed above. To maintain the availability of the Facility, we have to comply with a number of covenants and satisfy a number of conditions, including a minimum available liquidity requirement. We are currently in compliance with the financial covenants contained in the Credit Agreement.
43
Total cash (excluding restricted cash), cash equivalents, and investments at the end of each year were as follows (in thousands):
Fiscal Year Ended | |||||||
June 29, 2014 | June 30, 2013 | ||||||
Cash and cash equivalents | $ | 588,922 | $ | 443,490 | |||
Investments | 20,114 | 11,056 | |||||
Total cash, cash equivalents, and investments | $ | 609,036 | $ | 454,546 | |||
Our cash, cash equivalents and investments as of June 29, 2014 totaled $609.0 million (excluding restricted cash of $1.4 million), compared to $454.5 million (excluding restricted cash of $1.3 million) as of June 30, 2013. Our cash equivalents and investments consisted of money market funds and publicly traded equity investments, respectively. The increase in our cash and investments was primarily due to cash flows from operating activities of $180.1 million, which consisted of $58.7 million of net income for fiscal year 2014 as adjusted for significant non-cash expenses, including depreciation expense and stock based compensation expense.
As of June 29, 2014, we had increases of $145.4 million in cash and cash equivalents and $9.1 million in investments, compared to the balances as of June 30, 2013.
We believe that our existing cash and cash equivalents will be sufficient to meet operating requirements and satisfy our existing balance sheet liabilities and other cash obligations for at least the next twelve months. Our cash and cash equivalents are available to fund working capital needs, strategic growth initiatives, if any, repurchase of stock for our common stock repurchase program and capital expenditures. During fiscal year 2014, we took actions to meet our longer term revenue growth goals, including ongoing capital investments in our existing manufacturing operations and in the construction and production ramp of a new wafer thinning facility in Singapore.
Cash Flow
Our cash flows were as follows (in thousands):
Fiscal Year Ended | |||||||||||
June 29, 2014 | June 30, 2013 | June 24, 2012 | |||||||||
Cash flows provided by operating activities | $ | 180,086 | $ | 139,396 | $ | 41,051 | |||||
Cash flows used in investing activities | (32,045 | ) | (4,659 | ) | (3,319 | ) | |||||
Cash flows (used in) provided by financing activities | (7,897 | ) | 4,800 | (26,847 | ) | ||||||
Effect of exchange rates on cash and cash equivalents | 5,288 | (1,470 | ) | (4,193 | ) | ||||||
Net increase in cash and cash equivalents | $ | 145,432 | $ | 138,067 | $ | 6,692 | |||||
Non-cash adjustments to cash flow provided by operating activities during the fiscal year ended June 29, 2014 included $87.2 million of depreciation and amortization, $26.5 million of stock compensation expense, and $6.4 million of amortization of intangible assets. Changes in operating assets and liabilities decreased cash provided by operating activities by $11.2 million, primarily attributed to an increase in accounts receivable, partially offset by an increase in accrued salaries expense and a decrease in other assets.
Cash used in investing activities of $32.0 million during the fiscal year ended June 29, 2014 was primarily the result of capital expenditures of $44.1 million, partially offset by the sales and maturities of investments of $11.0 million. Cash used in financing activities of $7.9 million during the fiscal year ended June 29, 2014 was primarily the result of stock repurchases under the stock repurchase program and cash used for net settlement of restricted stock units, partially offset by proceeds from exercises of stock options.
44
Working Capital
Our working capital is dependent on demand for our products and our ability to manage accounts receivable and inventories. Other factors which may result in changes to our working capital levels are our restructuring initiatives, investment impairments and share repurchases.
The changes in working capital for the fiscal year ended June 29, 2014 were as follows (in thousands):
June 29, 2014 | June 30, 2013 | Change | |||||||||
Current Assets | |||||||||||
Cash and cash equivalents | $ | 588,922 | $ | 443,490 | $ | 145,432 | |||||
Restricted cash | 635 | 611 | 24 | ||||||||
Short-term investments | 20,114 | 11,056 | 9,058 | ||||||||
Trade accounts receivable, net | 161,723 | 137,762 | 23,961 | ||||||||
Inventories | 230,011 | 232,315 | (2,304 | ) | |||||||
Current deferred tax assets | 2,145 | 4,948 | (2,803 | ) | |||||||
Prepaid expenses and other current assets | 26,675 | 33,002 | (6,327 | ) | |||||||
Total current assets | 1,030,225 | 863,184 | 167,041 | ||||||||
Current Liabilities | |||||||||||
Accounts payable | 86,256 | 89,312 | (3,056 | ) | |||||||
Accrued income taxes | 2,946 | 949 | 1,997 | ||||||||
Accrued salaries, wages and commissions | 47,750 | 39,719 | 8,031 | ||||||||
Other accrued expenses | 72,968 | 78,414 | (5,446 | ) | |||||||
Total current liabilities | 209,920 | 208,394 | 1,526 | ||||||||
Net working capital | $ | 820,305 | $ | 654,790 | $ | 165,515 | |||||
For a discussion of changes in cash and investments, please see "Sources and Uses of Cash" and "Cash Flows," above.
The increase in net trade accounts receivable of $24.0 million from June 30, 2013 to June 29, 2014 reflects the increase in average weekly revenue of approximately 15.9 percent for the quarter ended June 29, 2014 compared to the quarter ended June 30, 2013, while our days-sales-outstanding remained relatively flat.
Inventories decreased $2.3 million during the fiscal year ended June 29, 2014 due to a $10.5 million decrease in raw materials, partially offset by a $5.9 million increase in work-in-process and a $2.3 million increase in finished goods. Due to this decrease in inventory, inventory weeks decreased to approximately 16 weeks as of June 29, 2014 from approximately 17 weeks as of June 30, 2013.
Other
As of June 29, 2014, if our offshore cash, cash equivalents, and investment amounts were repatriated to the U.S., approximately $43.0 million would incur U.S. federal and state income taxes. We expect the amount that would incur U.S. federal and state income taxes to vary depending on a number of factors, including, but not limited to, general market conditions, the level of economic activity, and applicable regulatory or statutory changes. We believe that the amount of offshore cash, cash equivalents and investments will increase over time, consistent with increases in our planned offshore business activity, offset by offshore working capital needs and strategic investments to support the growth and expansion of the Company overall. In light of our overall amount of $609.0 million in cash (excluding restricted cash of $1.4 million), cash equivalents and short-term investments as of June 29, 2014, we do not believe that indefinite reinvestment of approximately $43.0 million of earnings off-shore would have a material adverse effect on us as a whole.
45
Recent Accounting Standards
Information set forth under Part II, Item 8, Note 1, “Business, Basis of Presentation and Summary of Significant Accounting Policies—Recent Accounting Standards” is incorporated herein by reference.
Critical Accounting Policies and Estimates
The discussion and analysis of our financial condition and results of operations are based upon our consolidated financial statements, which have been prepared in accordance with U.S. generally accepted accounting principles (“GAAP”). The preparation of consolidated financial statements in accordance with GAAP requires us to make estimates and judgments that affect the reported amounts of assets, liabilities, revenues and expenses, as well as the disclosure of contingent assets and liabilities. The U.S. Securities and Exchange Commission has defined critical accounting policies as those that “are both most important to the portrayal of the company’s financial condition and results, and they require management’s most difficult, subjective or complex judgments, often as a result of the need to make estimates about the effect of matters that are inherently uncertain.” As such, we have identified the following policies as our critical accounting policies: Revenue recognition, impairment of long-lived assets, intangibles and goodwill, inventories, income taxes and loss contingencies.
The judgments and estimates we make in applying the accounting principles generally accepted in the U.S. affect the amounts of assets and liabilities reported, disclosures, and reported amounts of revenues and expenses. As such, we evaluate the judgments and estimates underlying all of our accounting policies, including those noted above, on an ongoing basis. We have based our estimates on the latest available historical information as well as known or foreseen trends; however, we cannot guarantee that we will continue to experience the same patterns in the future. If the historical data and assumptions we used to develop our estimates do not properly reflect future activity, our net sales, gross profit, net income and earnings per share could be materially and adversely impacted.
Revenue Recognition and Allowances
Revenue is recognized when there is persuasive evidence of an arrangement, the price to the buyer is fixed or determinable, collection is reasonably assured, and delivery or performance of service has occurred. We recognize revenue upon shipment or upon delivery, depending on specific contractual terms and/or shipping terms with the customer. If title transfer and risk of loss are addressed explicitly in a customer contract or purchase order, or by reference to the standard terms and conditions, those stated terms determine whether the recognition of revenue on product sales to that customer shall be upon either shipment or delivery. If both the contract and purchase order are silent with respect to shipping terms and lack reference to our standard terms and conditions, barring other contrary information, transfer of title and risk of loss will follow the historical shipping terms for that customer. If revenue is to be recognized upon delivery, such delivery date is tracked through information provided by the third party shipping company used by us to deliver the product to the customer.
Generally, we recognize revenue on sales to distributors using the "sell in" method (i.e. when product is sold to the distributor) rather than the "sell through" method (i.e. when the product is sold by the distributor to the end user). Certain distributors and other customers have limited rights of return (including stock rotation rights) and/or are entitled to price protection, where a rebate credit may be provided to the customer if we lower our price on products held in the distributor's inventory. Additionally, in certain limited cases, we may pre-approve a credit to a distributor to facilitate a particular sale by the distributor to an end customer. We record a reduction in revenue for estimated future product returns and future credits to be issued to the customer in the period in which revenues are recognized. The estimate of future returns and credits is based on historical sales returns, analysis of credit memo data, and other factors known at the time of revenue recognition. We monitor product returns, credits, and potential price adjustments on an ongoing basis.
We also maintain consignment inventory arrangements with certain of our customers. Pursuant to these arrangements, we deliver products to a customer or a designated third party warehouse based upon the customer's projected needs, but do not recognize revenue unless and until the customer or third party reports that it has removed the product from the warehouse, and all the other revenue recognition criteria are met.
46
We recognize royalty revenue in accordance with agreed upon terms when performance obligations are satisfied, the amount is fixed or determinable, and collectability is reasonably assured. The amount of royalties recognized is often calculated based on the licensees' periodic reporting to us. Any upfront payments are recognized as revenue only if there is no continuing performance obligation when the license commences and collectability is reasonably assured. Otherwise, revenue is amortized over the life of the license or according to performance obligations outlined in the license agreement.
If our customers’ contracts contain substantive acceptance provisions, we recognize revenue in accordance with the specific contract acceptance provisions. Sales taxes and other taxes directly imposed on revenue‑producing transactions are excluded from revenue.
Goodwill, Acquisition-Related and Other Intangible Assets
We classify the difference between the consideration transferred and the fair value of the net tangible and intangible assets acquired at the date of acquisition as goodwill. We classify intangible assets apart from goodwill if the assets have contractual or other legal rights, or if the assets can be separated and sold, transferred, licensed, rented or exchanged. Depending on the nature of the assets acquired, the amortization period may range from 2 to 15 years for those acquisition‑related intangible assets subject to amortization.
We evaluate the carrying value of long-lived assets, including goodwill and other intangible assets, annually during the fourth quarter of each fiscal year and more frequently if we believe indicators of impairment exist and whenever events or changes in circumstances indicate that the carrying value may not be recoverable. In evaluating goodwill, a two-step goodwill impairment test is applied to each reporting unit. We identify reporting units and determine the carrying value of each reporting unit by assigning the assets and liabilities, including the existing goodwill and intangible assets, to those reporting units. Each of our operating segments represent an individual reporting unit for purposes of assessing impairment of goodwill. In the first step of the impairment test, we estimate the fair value of the reporting unit. If the fair value of the reporting unit is less than the carrying value of the reporting unit, we perform the second step which compares the implied fair value of goodwill with the carrying amount of goodwill and writes down the carrying amount of the goodwill to the implied fair value.
The fair value of our reporting units is determined using the income approach, which estimates fair value of our reporting units based on a discounted cash flow approach. During fiscal years 2014, 2013, and 2012, the discount rates that we utilized for determining discounted cash flows were 14.1 percent, 14.5 percent, and 14.0 percent, respectively, based upon our assessment of the risks associated with the projected cash flows and market based estimates of capital costs. In completing the goodwill impairment analysis, we test the appropriateness of the reporting units’ estimated fair value by reconciling the aggregate reporting units’ fair values with our market capitalization.
The determination of the fair value of the reporting units requires us to make significant estimates and assumptions. These estimates and assumptions include estimates of future revenues and expense growth rates, capital expenditures and the depreciation and amortization, changes in working capital, discount rates, and the selection of appropriate control premiums. Due to the inherent uncertainty involved in making these estimates, actual future results related to assumed variables could differ from these estimates. Changes in assumptions regarding future results or other underlying assumptions could have a significant impact on either the fair value of the reporting unit or the amount of any resulting goodwill impairment charge.
Property, Plant and Equipment
Property, plant and equipment are stated at cost. Any gain or loss on retirement or disposition is included in operating expenses or cost of goods sold, depending on how the equipment was used. Depreciation is provided using the straight-line method based on the estimated useful lives of the assets, ranging from three to forty years. Repairs and maintenance costs are charged to expense as incurred.
We test long-lived assets for impairment whenever events or changes in circumstances indicate that their carrying amount may not be recoverable. Such events and circumstances include, but are not limited to:
• | A significant change in business strategy or in the extent or manner for which the asset is being used or in its physical condition; |
• | A significant negative change in the business climate, industry conditions, economic conditions or market value of an asset; and |
• | Current period operating losses or negative cash flow combined with a history of similar losses or a forecast that indicates continuing losses associated with the use of an asset. |
47
We evaluate the recoverability of long-lived assets based on the expected undiscounted cash flows for their asset group.
Inventories
Inventories are stated at the lower of cost or market using the first-in first-out method. Inventories are reviewed for excess or obsolescence based upon demand forecasts for a specific time horizon and reserves are established accordingly. Manufacturing costs deemed to be abnormal, such as idle facility expense, excessive spoilage, double freight and re-handling costs are charged as cost of sales in the period incurred.
Income Taxes
Deferred income taxes are determined based on the difference between the financial reporting and tax bases of assets and liabilities using enacted rates in effect during the year in which the differences are expected to reverse. This process requires estimating both our geographic mix of taxable income, and our current tax exposures in each jurisdiction where we operate. These estimates involve complex issues, require extended periods of time to resolve, and require us to make judgments, such as anticipating the positions that we will take on tax returns prior to actually preparing the returns and the outcomes of disputes with tax authorities. We are also required to measure and record deferred tax assets and liabilities and estimate the period of time over which the deferred tax assets will be realized. Realization of deferred tax assets is dependent upon generating sufficient taxable income, carryback of losses to prior taxable periods offsetting deferred tax liabilities, and the availability of tax planning strategies.
Valuation allowances are established for the deferred tax assets that we believe do not meet the “more likely than not” criteria. Judgments regarding future taxable income may be revised due to changes in market conditions, tax laws, or other factors. If our assumptions and estimates change in the future, the valuation allowances established may be increased, resulting in increased income tax expense. Conversely, if we are ultimately able to use all or a portion of the deferred tax assets for which a valuation allowance has been established, the related portion of the valuation allowance will be released to reduce income tax expense or goodwill, credit other comprehensive income, or credit additional paid-in capital, as applicable. Income tax expense is the tax payable for the period and the change during the period in deferred tax assets and liabilities recorded in our tax provision. We recognize any interest and penalties associated with income taxes in income tax expense.
We recognize certain tax liabilities for anticipated tax audit findings in the United States and other tax jurisdictions based on our estimate of whether, and the extent to which additional taxes would be due. If the audit findings result in actual taxes owed more or less than what we had anticipated, our income tax expense would be increased or decreased, accordingly, in the period of the determination.
Loss Contingencies
We are subject to various claims and litigation arising in the ordinary course of business. Because of the nature and inherent uncertainties of litigation and claims, the outcomes of these matters are subject to significant uncertainty. We accrue for these matters if it is probable that an asset has been impaired or a liability has been incurred and if the amount of the loss can be reasonably estimated. We disclose loss contingencies if it is at least reasonably possible that a material loss has been incurred.
48
ITEM 7A. QUANTITATIVE AND QUALITATIVE DISCLOSURES ABOUT MARKET RISK
Interest Rates
Our exposure to interest rate risk is primarily through our investment portfolio as we currently do not have outstanding long-term debt. The objectives of our investments in debt securities are to preserve principal and maintain liquidity while achieving market returns on the investment portfolio. To achieve these objectives, the returns on our investments in short-term fixed-rate debt securities will be generally compared to yields on money market instruments such as industrial commercial paper, LIBOR, or Treasury Bills. Investments in longer term fixed-rate debt securities will be generally compared to yields on comparable maturity Government or high grade corporate instruments with an equivalent credit rating. Based on our investment portfolio and interest rates at June 29, 2014, a 100 basis point increase or decrease in interest rates would result in a de minimis annualized change in the fair value of the investment portfolio. Changes in interest rates may affect the fair value of the investment portfolio; however, unrealized gains or losses are not recognized in net income unless the investments are sold or the unrealized losses are considered to be other-than-temporary.
Foreign Currency Exchange Rates
A significant amount of our revenues, expense, and capital purchasing transactions are conducted on a global basis in several foreign currencies. To protect against exposure to currency exchange rate fluctuations, we have established a balance sheet transaction risk hedging program. Through this hedging program, we seek to reduce, but not always entirely eliminate, the impact of currency exchange rate movements.
We generally hedge the risks of foreign currency-denominated repetitive working capital positions with offsetting foreign currency denominated exchange transactions, using currency forward contracts or spot transactions. Transaction gains and losses on these foreign currency-denominated working capital positions are generally offset by corresponding gains and losses on the related hedging instruments, usually resulting in reduced net exposure. At various times, we have currency exposure related to the British Pound Sterling, the Euro, and the Japanese Yen. For example, in the United Kingdom, we have a sales office and a semiconductor wafer fabrication facility with revenues in U.S. Dollars and Euros, and expenses in British Pounds Sterling and U.S. Dollars.
The Company does not hedge its revenues and expenses against changes in foreign currency exchange rates, as it does not perceive the net risk of changes to translated revenues and expenses from changes in exchange rates as significant enough at this time to justify hedging to mitigate this risk. For example, during the twelve months ended June 29, 2014, a 10 percent adverse change in the exchange rates of all currencies where we have an economic exposure (defined as a move by all such currencies in the same direction relative to the U.S. Dollar) would have resulted in an negative impact on income (loss) before income taxes of approximately $2.5 million. However, upward movements against the U.S. Dollar of certain select currencies, combined with downward movements in select others, could have a much larger negative impact.
For our balance sheet transaction hedging program, we had approximately $11.6 million and $14.4 million in notional amounts of forward contracts not designated as accounting hedges as of June 29, 2014 and June 30, 2013, respectively. Net realized and unrealized foreign‑currency gains (losses) related to foreign currency forward contracts recognized in earnings, as a component of other expense, were $1.1 million, $0.1 million, and $1.0 million for the fiscal years ended June 29, 2014, June 30, 2013, and June 24, 2012, respectively.
In the normal course of business, we also face risks that are either non-financial or non-quantifiable. Such risks principally include country risk, credit risk and legal risk and are not discussed or quantified in the preceding analysis.
49
Market Value Risk
We carry certain assets at fair value. Generally, for assets that are reported at fair value, we use quoted market prices or valuation models that utilize market data inputs to estimate fair value. In certain cases quoted market prices or market data inputs may not be readily available or availability could be diminished due to market conditions. In these cases, our estimate of fair value is based on best available information or other estimates determined by management.
At June 29, 2014, we had $609.0 million of total cash (excluding 1.4 million of restricted cash), cash equivalents and short-term and long-term investments, consisting of available-for-sale fixed income securities. We manage our total portfolio to encompass a diversified pool of investment‑grade securities. The average credit rating of our investment portfolio is AAA/Aaa. Our investment policy is to manage our total cash and investment balances to preserve principal and maintain liquidity while achieving market returns on the investment portfolio. To the extent that certain investments in our portfolio of investments continue to have strategic value, we generally do not attempt to reduce or eliminate our market exposure. For securities that we no longer consider strategic, we evaluate legal, market, and economic factors in our decision on the timing of disposal. We may or may not enter into transactions to reduce or eliminate the market risks of our investments.
50
ITEM 8. CONSOLIDATED FINANCIAL STATEMENTS AND SUPPLEMENTARY DATA
Index to Consolidated Financial Statements and Financial Statement Schedule
Page | |
Supporting Financial Statement Schedule: | |
Schedules other than those listed above have been omitted since they are either not required, not applicable, or the required information is shown in the Consolidated Financial Statements or related Notes.
51
REPORT OF INDEPENDENT REGISTERED PUBLIC ACCOUNTING FIRM
The Board of Directors and Stockholders of International Rectifier Corporation and Subsidiaries
We have audited the accompanying consolidated balance sheets of International Rectifier Corporation and Subsidiaries as of June 29, 2014 and June 30, 2013, and the related consolidated statements of operations, comprehensive income (loss), stockholders' equity and cash flows for each of the three years in the period ended June 29, 2014. Our audits also included the financial statement schedule listed at Item 15(a). These financial statements and schedule are the responsibility of the Company's management. Our responsibility is to express an opinion on these financial statements and schedule based on our audits.
We conducted our audits in accordance with the standards of the Public Company Accounting Oversight Board (United States). Those standards require that we plan and perform the audit to obtain reasonable assurance about whether the financial statements are free of material misstatement. An audit includes examining, on a test basis, evidence supporting the amounts and disclosures in the financial statements. An audit also includes assessing the accounting principles used and significant estimates made by management, as well as evaluating the overall financial statement presentation. We believe that our audits provide a reasonable basis for our opinion.
In our opinion, the financial statements referred to above present fairly, in all material respects, the consolidated financial position of International Rectifier Corporation and Subsidiaries at June 29, 2014 and June 30, 2013, and the consolidated results of their operations and their cash flows for each of the three years in the period ended June 29, 2014, in conformity with U.S. generally accepted accounting principles. Also, in our opinion, the related financial statement schedule, when considered in relation to the basic consolidated financial statements taken as a whole, presents fairly in all material respects the information set forth therein.
We also have audited, in accordance with the standards of the Public Company Accounting Oversight Board (United States), International Rectifier Corporation and Subsidiaries' internal control over financial reporting as of June 29, 2014, based on criteria established in Internal Control-Integrated Framework issued by the Committee of Sponsoring Organizations of the Treadway Commission (1992 framework) and our report dated August 20, 2014 expressed an unqualified opinion thereon.
/s/ Ernst & Young LLP
Los Angeles, California
August 20, 2014
52
INTERNATIONAL RECTIFIER CORPORATION AND SUBSIDIARIES
CONSOLIDATED STATEMENTS OF OPERATIONS
(In thousands, except per share data)
Fiscal Year Ended | |||||||||||
June 29, 2014 | June 30, 2013 | June 24, 2012 | |||||||||
Revenues | $ | 1,106,571 | $ | 977,035 | $ | 1,050,588 | |||||
Cost of sales | 707,363 | 719,930 | 710,565 | ||||||||
Gross profit | 399,208 | 257,105 | 340,023 | ||||||||
Selling, general and administrative expense | 182,318 | 181,746 | 200,411 | ||||||||
Research and development expense | 130,848 | 127,093 | 135,105 | ||||||||
Impairment of goodwill | — | — | 69,421 | ||||||||
Amortization of acquisition‑related intangible assets | 6,420 | 6,653 | 8,369 | ||||||||
Asset impairment, restructuring and related charges | 5,638 | 16,996 | — | ||||||||
Gain on disposition of property | — | — | (5,410 | ) | |||||||
Operating income (loss) | 73,984 | (75,383 | ) | (67,873 | ) | ||||||
Other expense, net | 2,974 | 1,390 | 4,267 | ||||||||
Interest expense (income), net | 24 | 57 | (333 | ) | |||||||
Income (loss) before income taxes | 70,986 | (76,830 | ) | (71,807 | ) | ||||||
Provision for (benefit from) income taxes | 12,253 | 11,990 | (16,757 | ) | |||||||
Net income (loss) | $ | 58,733 | $ | (88,820 | ) | $ | (55,050 | ) | |||
Net income (loss) per common share: | |||||||||||
Basic | $ | 0.83 | $ | (1.28 | ) | $ | (0.79 | ) | |||
Diluted | $ | 0.81 | $ | (1.28 | ) | $ | (0.79 | ) | |||
Weighted average common shares outstanding: | |||||||||||
Basic | 71,108 | 69,385 | 69,270 | ||||||||
Diluted | 72,549 | 69,385 | 69,270 | ||||||||
The accompanying notes are an integral part of these financial statements.
53
INTERNATIONAL RECTIFIER CORPORATION AND SUBSIDIARIES
CONDENSED CONSOLIDATED STATEMENTS OF COMPREHENSIVE INCOME (LOSS)
(In thousands)
Fiscal Year Ended | |||||||||||
June 29, 2014 | June 30, 2013 | June 24, 2012 | |||||||||
Net income (loss) | $ | 58,733 | $ | (88,820 | ) | $ | (55,050 | ) | |||
Other comprehensive income (loss): | |||||||||||
Foreign currency translation adjustments | 27,603 | (3,768 | ) | (10,595 | ) | ||||||
Unrealized gains (losses) on securities: | |||||||||||
Unrealized gains (losses) on available-for-sale securities, net of tax effect of $0, $684, and $2,434, respectively | 11,176 | 1,219 | (6,045 | ) | |||||||
Other comprehensive income (loss) | 38,779 | (2,549 | ) | (16,640 | ) | ||||||
Comprehensive income (loss) | $ | 97,512 | $ | (91,369 | ) | $ | (71,690 | ) | |||
The accompanying notes are an integral part of these financial statements.
54
INTERNATIONAL RECTIFIER CORPORATION AND SUBSIDIARIES
CONSOLIDATED BALANCE SHEETS
(In thousands, except share and per share data)
June 29, 2014 | June 30, 2013 | ||||||
ASSETS | |||||||
Current assets: | |||||||
Cash and cash equivalents | $ | 588,922 | $ | 443,490 | |||
Restricted cash | 635 | 611 | |||||
Short-term investments | 20,114 | 11,056 | |||||
Trade accounts receivable, net of allowances of $352 for 2014 and $915 for 2013 | 161,723 | 137,762 | |||||
Inventories | 230,011 | 232,315 | |||||
Current deferred tax assets | 2,145 | 4,948 | |||||
Prepaid expenses and other current assets | 26,675 | 33,002 | |||||
Total current assets | 1,030,225 | 863,184 | |||||
Restricted cash | 739 | 738 | |||||
Property, plant and equipment, net | 391,765 | 423,338 | |||||
Goodwill | 52,149 | 52,149 | |||||
Acquisition‑related intangible assets, net | 15,503 | 21,923 | |||||
Long-term deferred tax assets | 31,183 | 32,792 | |||||
Other assets | 43,976 | 59,088 | |||||
Total assets | $ | 1,565,540 | $ | 1,453,212 | |||
LIABILITIES AND STOCKHOLDERS’ EQUITY | |||||||
Current liabilities: | |||||||
Accounts payable | $ | 86,256 | $ | 89,312 | |||
Accrued income taxes | 2,946 | 949 | |||||
Accrued salaries, wages and commissions | 47,750 | 39,719 | |||||
Current deferred tax liabilities | 348 | — | |||||
Other accrued expenses | 72,968 | 78,414 | |||||
Total current liabilities | 210,268 | 208,394 | |||||
Long-term deferred tax liabilities | 7,817 | 8,970 | |||||
Other long-term liabilities | 19,809 | 24,530 | |||||
Total liabilities | 237,894 | 241,894 | |||||
Commitments and contingencies | |||||||
Stockholders’ equity: | |||||||
Preferred shares, $1 par value, authorized: 1,000,000; issued and outstanding: none in 2014 or 2013 | — | — | |||||
Common shares, $1 par value, authorized: 330,000,000; outstanding: 71,520,121 shares in 2014 and 70,399,081 shares in 2013 | 78,192 | 76,590 | |||||
Capital contributed in excess of par value | 1,097,665 | 1,067,841 | |||||
Treasury stock, at cost: 6,672,216 shares in 2014 and 6,191,082 shares in 2013 | (125,785 | ) | (113,175 | ) | |||
Retained earnings | 260,598 | 201,865 | |||||
Accumulated other comprehensive income (loss) | 16,976 | (21,803 | ) | ||||
Total stockholders’ equity | 1,327,646 | 1,211,318 | |||||
Total liabilities and stockholders’ equity | $ | 1,565,540 | $ | 1,453,212 | |||
The accompanying notes are an integral part of these financial statements.
55
INTERNATIONAL RECTIFIER CORPORATION AND SUBSIDIARIES
CONSOLIDATED STATEMENTS OF STOCKHOLDERS’ EQUITY
(In thousands, except share data)
Common Shares, at Par Value | Capital Contributed in Excess of Par Value | Treasury Stock, at Cost | Retained Earnings | Accumulated Other Comprehensive Income (Loss) | Total | ||||||||||||||||||
Balance, June 26, 2011 | $ | 74,527 | $ | 1,021,509 | $ | (81,245 | ) | $ | 345,735 | $ | (2,614 | ) | $ | 1,357,912 | |||||||||
Net loss for the year ended June 24, 2012 | — | — | — | (55,050 | ) | — | (55,050 | ) | |||||||||||||||
Other comprehensive loss | — | — | — | — | (16,640 | ) | (16,640 | ) | |||||||||||||||
Exercise of stock options—224,884 shares | 224 | 3,045 | — | — | — | 3,269 | |||||||||||||||||
Vesting of RSU’s, net of settlement for tax withholdings—373,938 shares | 374 | (4,634 | ) | — | — | — | (4,260 | ) | |||||||||||||||
Repurchase of common stock-1,267,634 shares | — | — | (26,720 | ) | — | — | (26,720 | ) | |||||||||||||||
Tax benefit from stock based awards | — | 1,675 | — | — | — | 1,675 | |||||||||||||||||
Stock‑based compensation expense | — | 16,141 | — | — | — | 16,141 | |||||||||||||||||
Balance, June 24, 2012 | 75,125 | 1,037,736 | (107,965 | ) | 290,685 | (19,254 | ) | 1,276,327 | |||||||||||||||
Net loss for the year ended June 30, 2013 | — | — | — | (88,820 | ) | — | (88,820 | ) | |||||||||||||||
Other comprehensive loss | — | — | — | — | (2,549 | ) | (2,549 | ) | |||||||||||||||
Exercise of stock options —929,036 shares | 929 | 14,545 | — | — | — | 15,474 | |||||||||||||||||
Vesting of RSU’s, net of settlement for tax withholdings —535,473 shares | 536 | (6,000 | ) | — | — | — | (5,464 | ) | |||||||||||||||
Repurchase of common stock-296,200 shares | — | — | (5,210 | ) | — | — | (5,210 | ) | |||||||||||||||
Stock‑based compensation expense | — | 21,560 | — | — | — | 21,560 | |||||||||||||||||
Balance, June 30, 2013 | 76,590 | 1,067,841 | (113,175 | ) | 201,865 | (21,803 | ) | 1,211,318 | |||||||||||||||
Net income for the year ended June 29, 2014 | — | — | — | 58,733 | — | 58,733 | |||||||||||||||||
Other comprehensive income | — | — | — | — | 38,779 | 38,779 | |||||||||||||||||
Exercise of stock options —885,854 shares | 886 | 13,260 | — | — | — | 14,146 | |||||||||||||||||
Vesting of RSU’s, net of settlement for tax withholdings —716,207 shares | 716 | (10,149 | ) | — | — | — | (9,433 | ) | |||||||||||||||
Repurchase of common stock-481,134 shares | — | — | (12,610 | ) | — | — | (12,610 | ) | |||||||||||||||
Tax benefit from stock based awards | — | 219 | — | — | — | 219 | |||||||||||||||||
Stock‑based compensation expense | — | 26,494 | — | — | — | 26,494 | |||||||||||||||||
Balance, June 29, 2014 | $ | 78,192 | $ | 1,097,665 | $ | (125,785 | ) | $ | 260,598 | $ | 16,976 | $ | 1,327,646 | ||||||||||
The accompanying notes are an integral part of these financial statements.
56
INTERNATIONAL RECTIFIER CORPORATION AND SUBSIDIARIES
CONSOLIDATED STATEMENTS OF CASH FLOWS
(In thousands)
Fiscal Year Ended | |||||||||||
June 29, 2014 | June 30, 2013 | June 24, 2012 | |||||||||
Cash flows from operating activities: | |||||||||||
Net income (loss) | $ | 58,733 | $ | (88,820 | ) | $ | (55,050 | ) | |||
Adjustments to reconcile net income (loss) to net cash provided by operating activities: | |||||||||||
Depreciation and amortization | 87,210 | 91,187 | 84,951 | ||||||||
Amortization of acquisition‑related intangible assets | 6,420 | 6,653 | 8,369 | ||||||||
(Gain) loss on disposal of fixed assets | (264 | ) | 5,036 | 1,695 | |||||||
Gain on disposition of property | — | — | (5,410 | ) | |||||||
Impairment of long-lived assets | 80 | 2,792 | 2,530 | ||||||||
Stock compensation expense | 26,494 | 21,560 | 16,141 | ||||||||
Impairment of goodwill | — | — | 69,421 | ||||||||
Gain on sale of investments | (36 | ) | (8 | ) | (55 | ) | |||||
Other-than-temporary impairment of investments | — | 350 | 2,865 | ||||||||
(Recovery of) provision for bad debts | — | (58 | ) | 1,015 | |||||||
Provision for inventory write‑downs | 4,900 | 20,421 | 18,734 | ||||||||
Loss (gain) on derivatives | 1,437 | 634 | (1,079 | ) | |||||||
Deferred income taxes | 7,338 | 11,384 | (25,183 | ) | |||||||
Tax benefit from stock-based awards | 219 | — | 1,674 | ||||||||
Excess tax benefit from stock-based awards | — | — | (864 | ) | |||||||
Changes in operating assets and liabilities, net | (11,190 | ) | 65,046 | (83,461 | ) | ||||||
Other | (1,255 | ) | 3,219 | 4,758 | |||||||
Net cash provided by operating activities | 180,086 | 139,396 | 41,051 | ||||||||
Cash flows from investing activities: | |||||||||||
Additions to property, plant and equipment | (44,111 | ) | (72,605 | ) | (128,083 | ) | |||||
Proceeds from sale of property, plant and equipment | 1,003 | 118 | 5,524 | ||||||||
Sale of investments | 36 | 52,131 | 75,792 | ||||||||
Maturities of investments | 11,000 | 25,500 | 216,307 | ||||||||
Purchase of investments | — | (9,979 | ) | (173,383 | ) | ||||||
Release from restricted cash | 27 | 176 | 524 | ||||||||
Net cash used in investing activities | (32,045 | ) | (4,659 | ) | (3,319 | ) | |||||
Cash flows from financing activities: | |||||||||||
Proceeds from exercise of stock options | 14,146 | 15,474 | 3,269 | ||||||||
Excess tax benefit from stock-based awards | — | — | 864 | ||||||||
Purchase of treasury stock | (12,610 | ) | (5,210 | ) | (26,720 | ) | |||||
Net settlement of restricted stock units for tax withholdings | (9,433 | ) | (5,464 | ) | (4,260 | ) | |||||
Net cash (used in) provided by financing activities | (7,897 | ) | 4,800 | (26,847 | ) | ||||||
Effect of exchange rate changes on cash and cash equivalents | 5,288 | (1,470 | ) | (4,193 | ) | ||||||
Net increase in cash and cash equivalents | 145,432 | 138,067 | 6,692 | ||||||||
Cash and cash equivalents, beginning of year | 443,490 | 305,423 | 298,731 | ||||||||
Cash and cash equivalents, end of year | $ | 588,922 | $ | 443,490 | $ | 305,423 | |||||
The accompanying notes are an integral part of these financial statements.
57
INTERNATIONAL RECTIFIER CORPORATION AND SUBSIDIARIES
NOTES TO CONSOLIDATED FINANCIAL STATEMENTS
1. Business, Basis of Presentation and Summary of Significant Accounting Policies
Business
International Rectifier Corporation (“IR” or the “Company”) designs, manufactures and markets power management semiconductors. Power management semiconductors address the core challenges of power management, power performance and power conservation, by increasing system efficiency, allowing more compact end-products, improving features on electronic devices, and prolonging battery life.
The Company’s products include power metal oxide semiconductor field effect transistors (“MOSFETs”), high voltage analog and mixed signal integrated circuits (“HVICs”), low voltage analog and mixed signal integrated circuits (“LVICs”), digital integrated circuits (“ICs”), radiation‑resistant (“RAD-Hard”) power MOSFETs, insulated gate bipolar transistors (“IGBTs”), high reliability DC-DC converters, digital controllers, integrated power modules, and automotive products packages.
Basis of Presentation and Consolidation
The consolidated financial statements have been prepared in accordance with U.S. generally accepted accounting principles (“GAAP”). The consolidated financial statements include the accounts of the Company and its subsidiaries, which are located in North America, Europe, and Asia. Intercompany balances and transactions have been eliminated in consolidation.
Fiscal Year
The Company operates on a 52-53 week fiscal year with the fiscal year ending on the last Sunday in June. Fiscal year 2014 consisted of 52 weeks ending June 29, 2014, fiscal year 2013 consisted of 53 weeks ending June 30, 2013 and fiscal year 2012 consisted of 52 weeks ending June 24, 2012. Fiscal quarters consist of 13 weeks ending on the last Sunday of the calendar quarter, except for the last fiscal quarter of 14 weeks in fiscal years that have 53 weeks.
Estimates
The preparation of financial statements in conformity with GAAP requires management to make estimates and assumptions that affect the reported assets and liabilities and the disclosure of contingent assets and liabilities at the date of the financial statements, and the reported revenues and expenses during the reporting period. Actual results may differ from those estimates.
Subsequent Events
The Company evaluates events subsequent to the end of the fiscal year through the date the financial statements are filed with the Securities and Exchange Commission for recognition or disclosure in the consolidated financial statements. Events that provide additional evidence about material conditions that existed at the date of the balance sheet are evaluated for recognition in the consolidated financial statements. Events that provide evidence about conditions that did not exist at the date of the balance sheet but occurred after the balance sheet date are evaluated for disclosure in the notes to the consolidated financial statements.
58
INTERNATIONAL RECTIFIER CORPORATION AND SUBSIDIARIES
NOTES TO CONSOLIDATED FINANCIAL STATEMENTS (CONTINUED)
1. Business, Basis of Presentation and Summary of Significant Accounting Policies (Continued)
Revenue Recognition and Allowances
Revenue is recognized when there is persuasive evidence of an arrangement, the price to the buyer is fixed or determinable, collection is reasonably assured, and delivery or performance of service has occurred. The Company recognizes revenue upon shipment or upon delivery, depending on specific contractual terms and/or shipping terms with the customer. If title transfer and risk of loss are addressed explicitly in a customer contract or purchase order, or by reference to the standard terms and conditions, those stated terms determine whether the recognition of revenue on product sales to that customer shall be upon either shipment or delivery. If both the contract and purchase order are silent with respect to shipping terms and lack reference to the Company's standard terms and conditions, barring other contrary information, transfer of title and risk of loss will follow the historical shipping terms for that customer. If revenue is to be recognized upon delivery, such delivery date is tracked through information provided by the third party shipping company used by the Company to deliver the product to the customer.
Generally, the Company recognizes revenue on sales to distributors using the "sell in" method (i.e. when product is sold to the distributor) rather than the "sell through" method (i.e. when the product is sold by the distributor to the end user). Certain distributors and other customers have limited rights of return (including stock rotation rights) and/or are entitled to price protection, where a rebate credit may be provided to the customer if the Company lowers its price on products held in the distributor's inventory. Additionally, in certain limited cases, the Company may pre-approve a credit to a distributor to facilitate a particular sale by the distributor to an end customer. The Company records a reduction in revenue for estimated future product returns and future credits to be issued to the customer in the period in which revenues are recognized. The estimate of future returns and credits is based on historical sales returns, analysis of credit memo data, and other factors known at the time of revenue recognition. The Company monitors product returns, credits, and potential price adjustments on an ongoing basis.
The Company also maintains consignment inventory arrangements with certain of its customers. Pursuant to these arrangements, the Company delivers products to a customer or a designated third party warehouse based upon the customer's projected needs, but does not recognize revenue unless and until the customer or third party reports that it has removed the product from the warehouse, and all the other revenue recognition criteria are met.
The Company recognizes royalty revenue in accordance with agreed upon terms when performance obligations are satisfied, the amount is fixed or determinable, and collectability is reasonably assured. The amount of royalties recognized is often calculated based on the licensees' periodic reporting to the Company. Any upfront payments are recognized as revenue only if there is no continuing performance obligation when the license commences and collectability is reasonably assured. Otherwise, revenue is amortized over the life of the license or according to performance obligations outlined in the license agreement.
If the Company’s customers’ contracts contain substantive acceptance provisions the Company recognizes revenue in accordance with the specific contract acceptance provisions. Sales taxes and other taxes directly imposed on revenue‑producing transactions are excluded from revenue.
Shipping Costs
Outbound customer shipping costs are expensed as incurred and are included in selling, general and administrative ("SG&A") expense. The expense for outbound customer shipments for the fiscal years ended June 29, 2014, June 30, 2013, and June 24, 2012 was $8.3 million, $8.2 million, and $8.9 million, respectively.
Advertising Costs
Advertising costs are expensed as incurred and are included in SG&A expense. Advertising expense for the fiscal years ended June 29, 2014, June 30, 2013, and June 24, 2012 was $3.9 million, $4.2 million and $4.0 million, respectively.
Research and Development Costs
Research and development (“R&D”) costs, including salaries, departmental general overhead, and allocated expenses, are expensed as incurred.
59
INTERNATIONAL RECTIFIER CORPORATION AND SUBSIDIARIES
NOTES TO CONSOLIDATED FINANCIAL STATEMENTS (CONTINUED)
1. Business, Basis of Presentation and Summary of Significant Accounting Policies (Continued)
Environmental Costs
The Company accrues for costs associated with environmental remediation obligations when such losses are probable and reasonably estimable and adjusts its estimates as new facts and circumstances come to its attention. Costs incurred to investigate and remediate contaminated sites are expensed when these costs are identified and estimable and are not discounted to their present value.
Interest Expense (Income), Net
Interest (income) expense, net, was comprised of the following (in thousands):
Fiscal Year Ended | |||||||||||
June 29, 2014 | June 30, 2013 | June 24, 2012 | |||||||||
Interest income | $ | (427 | ) | $ | (405 | ) | $ | (842 | ) | ||
Interest expense | 451 | 462 | 509 | ||||||||
Interest expense (income), net | $ | 24 | $ | 57 | $ | (333 | ) | ||||
No interest was capitalized for the fiscal years ended June 29, 2014, June 30, 2013 and June 24, 2012.
Income Taxes
Deferred income taxes are determined based on the difference between the financial reporting and tax bases of assets and liabilities using enacted rates in effect during the year in which the differences are expected to reverse. This process requires estimating both the Company's geographic mix of taxable income, and its current tax exposures in each jurisdiction where it operates. These estimates involve complex issues, require extended periods of time to resolve, and require the Company to make judgments, such as anticipating the positions that it will take on tax returns prior to actually preparing the returns and the outcomes of disputes with tax authorities. The Company is also required to measure and record deferred tax assets and liabilities and estimate the period of time over which the deferred tax assets will be realized. Realization of deferred tax assets is dependent upon generating sufficient taxable income, carryback of losses to prior taxable periods offsetting deferred tax liabilities, and the availability of tax planning strategies.
Valuation allowances are established for the deferred tax assets that the Company believes do not meet the “more likely than not” criteria. Judgments regarding future taxable income may be revised due to changes in market conditions, tax laws, or other factors. If the Company's assumptions and estimates change in the future, the valuation allowances established may be increased, resulting in increased income tax expense. Conversely, if the Company is ultimately able to use all or a portion of the deferred tax assets for which a valuation allowance has been established, the related portion of the valuation allowance will be released to reduce income tax expense or goodwill, credit other comprehensive income, or credit additional paid-in capital, as applicable. Income tax expense is the tax payable for the period and the change during the period in deferred tax assets and liabilities recorded in the Company's tax provision. The Company recognizes any interest and penalties associated with income taxes in income tax expense.
The Company recognizes certain tax liabilities for anticipated tax audit findings in the United States and other tax jurisdictions based on its estimate of whether, and the extent to which additional taxes would be due. If the audit findings result in actual taxes owed more or less than what the Company had anticipated, its income tax expense would be increased or decreased, accordingly, in the period of the determination.
60
INTERNATIONAL RECTIFIER CORPORATION AND SUBSIDIARIES
NOTES TO CONSOLIDATED FINANCIAL STATEMENTS (CONTINUED)
1. Business, Basis of Presentation and Summary of Significant Accounting Policies (Continued)
Net Income (Loss) per Common Share
Net income (loss) per common share-basic is computed using net income (loss) available to common stockholders (the numerator) divided by the weighted average number of common shares outstanding (the denominator) during the period. In general, the computation of net income (loss) per common share-diluted is similar to the computation of net income per common share-basic except that the denominator is increased to include the number of additional common shares that would have been outstanding upon the exercise of stock options and vesting of restricted stock units using the treasury stock method. Under the treasury stock method, the Company reduces the gross number of dilutive shares by the number of shares purchasable from the proceeds of the options assumed to be exercised and restricted stock units vested, and related unrecognized compensation.
Fair Value Measurements
Fair value is the price that would be received to sell an asset or paid to transfer a liability in an orderly transaction between market participants at the measurement date. Assets and liabilities measured at fair value are categorized based on whether or not the inputs are observable in the market and the degree that the inputs are observable. The categorization of financial assets and liabilities within the valuation hierarchy is based upon the lowest level of input that is significant to the fair value measurement. The hierarchy is broken down into three levels (with Level 3 being the lowest) defined as follows:
• | Level 1—Inputs are based on quoted market prices for identical assets or liabilities in active markets at the measurement date. |
• | Level 2—Inputs include quoted prices for similar assets or liabilities in active markets, quoted prices for identical or similar assets or liabilities in markets that are not active, and inputs (other than quoted prices) that are observable for the asset or liability, either directly or indirectly. |
• | Level 3—Inputs include management's best estimate of what market participants would use in pricing the asset or liability at the measurement date. The inputs are unobservable in the market and significant to the instrument's valuation. |
The financial assets and liabilities which are measured and recorded at fair value on a recurring basis are included within the following items on the Company’s consolidated balance sheet as of June 29, 2014 and June 30, 2013 (in thousands):
As of June 29, 2014 | |||||||||||||||
Assets and Liabilities: | Total | Level 1 | Level 2 | Level 3 | |||||||||||
Short-term investments | $ | 20,114 | $ | 20,114 | $ | — | $ | — | |||||||
Prepaid expenses and other current assets | 19 | — | 19 | — | |||||||||||
Other assets | 20,461 | 19,010 | — | 1,451 | |||||||||||
Other long-term liabilities | (9,844 | ) | (9,844 | ) | — | — | |||||||||
Total | $ | 30,750 | $ | 29,280 | $ | 19 | $ | 1,451 | |||||||
As of June 30, 2013 | |||||||||||||||
Assets and Liabilities: | Total | Level 1 | Level 2 | Level 3 | |||||||||||
Short-term investments | 11,056 | 6,004 | 5,052 | — | |||||||||||
Prepaid expenses and other current assets | 19 | — | 19 | — | |||||||||||
Other assets | 29,725 | 26,837 | — | 2,888 | |||||||||||
Other long-term liabilities | (8,326 | ) | (8,326 | ) | — | — | |||||||||
Total | $ | 32,474 | $ | 24,515 | $ | 5,071 | $ | 2,888 | |||||||
The fair value of investments, derivative financial instruments, and other assets and liabilities are disclosed in Notes 2, 3 and 9, respectively. There were no cash and cash equivalents measured at fair value on a recurring basis as of either June 29, 2014 or June 30, 2013.
61
INTERNATIONAL RECTIFIER CORPORATION AND SUBSIDIARIES
NOTES TO CONSOLIDATED FINANCIAL STATEMENTS (CONTINUED)
1. Business, Basis of Presentation and Summary of Significant Accounting Policies (Continued)
The Company determines at the end of a reporting period whether a given financial asset or liability is valued using Level 1, 2 or 3 inputs. During the fiscal years ended June 29, 2014, June 30, 2013, and June 24, 2012, for each class of assets and liabilities, there were no transfers between those valued using quoted prices in active markets for identical assets (Level 1), those valued using significant other observable inputs (Level 2), and those valued using significant unobservable inputs (Level 3).
As of June 29, 2014, the Company held foreign currency forward contracts recorded at fair value using Level 2 inputs, for which fair value was measured based on readily observable market parameters for all substantial terms of the derivatives. There were no other assets or liabilities measured using Level 2 inputs.
Level 3 Valuations
The following tables provide a reconciliation of the beginning and ending balance of items measured at fair value on a recurring basis using significant unobservable inputs (Level 3) for the fiscal year ended June 29, 2014, and June 30, 2013 (in thousands):
Level 3 | |||
Assets | |||
Derivatives | |||
Beginning balance at June 30, 2013 | $ | 2,888 | |
Total losses (realized or unrealized) included in other expense, net | (1,437 | ) | |
Ending balance at June 29, 2014 | $ | 1,451 | |
Level 3 | |||
Assets | |||
Derivatives | |||
Beginning balance at June 24, 2012 | $ | 2,834 | |
Total gains (realized or unrealized) included in other expense, net | 54 | ||
Ending balance at June 30, 2013 | $ | 2,888 | |
When at least one significant valuation model assumption or input used to measure the fair value of financial assets or liabilities is unobservable in the market, the financial assets or liabilities are deemed to be measured using Level 3 inputs. These Level 3 inputs may include pricing models, discounted cash flow methodologies or similar techniques where at least one significant model assumption or input is unobservable. The Company uses Level 3 inputs to value a non-transferable put option on a strategic investment (the “Put Option”).
The Company accounts for the Put Option as a derivative instrument not designated as an accounting hedge. The fair value was determined by an independent valuation firm using a binomial option pricing model based on the income approach. The model uses inputs such as exercise price, fair market value of the underlying common stock, expected life (years), expected volatility, risk-free rate equivalent, and dividend yield. The expected life is the remaining life of the Put Option. Expected volatility is based on historical volatility of the underlying common stock as well as consideration of the volatilities of public companies deemed comparable. As of June 29, 2014, the Company determined that significant changes in the above assumptions would not materially affect the fair value of the Put Option. Additionally, the model materially relies on the assumption that the issuer of the Put Option will uphold its financial obligation up to its common equity value should the Company exercise the Company’s right to put the associated number of common shares back to the issuer at a fixed price in local currency.
62
INTERNATIONAL RECTIFIER CORPORATION AND SUBSIDIARIES
NOTES TO CONSOLIDATED FINANCIAL STATEMENTS (CONTINUED)
1. Business, Basis of Presentation and Summary of Significant Accounting Policies (Continued)
Non-Recurring Fair Value Measurements
During the fiscal year ended June 29, 2014, the Company recorded de minimis other-than-temporary impairments on financial assets required to be measured at fair value on a non-recurring basis.
For the fiscal year ended June 30, 2013, the Company measured at fair value, on a non-recurring basis, the carrying values of certain equipment in its research and development group, its Newport, Wales, Mexico and other manufacturing facilities, and a subcontractor facility located in Southeast Asia, due to the non-use of that equipment. The Company determined that the carrying values of those assets of $11.8 million exceeded their estimated fair values of $5.9 million. The fair values were determined using the market approach, which considered the estimated fair value of the equipment using significant unobservable inputs (Level 3) obtained from third party equipment brokerage firms. Consequently, during the fiscal year ended June 30, 2013, the Company recorded an impairment charge of $5.9 million, which represented the excess of the carrying values of the assets over the fair values, less the estimated cost to sell.
In fiscal year 2012, as a result of decreased customer demand resulting in changes in manufacturing strategy, the Company measured at fair value on a non-recurring basis, the carrying values of its plant assets and machinery and equipment relating to its El Segundo, California fabrication facility and determined those assets exceeded their expected undiscounted cash flows. As a result, the Company wrote the related assets down to their estimated fair value. The fair value was determined using the market approach, which considered the estimated fair value of the plant assets and machinery and equipment using significant unobservable inputs (level 3) obtained from the perspective of a market participant. Consequently, the Company recorded an impairment charge of $2.5 million, which represented the excess of the carrying values of the assets over the fair values, less the estimated cost to sell.
Other-Than-Temporary Impairments of Investments
The Company evaluates securities for other-than-temporary impairment on a quarterly basis. Impairment is evaluated considering numerous factors, and their relative significance varies depending on the situation. Factors considered include the length of time and extent to which the market value has been less than cost, the financial condition and near-term prospects of the issuer of the securities, the Company’s intent to sell, or whether it is more likely than not that it will be required to sell, the investment before anticipated recovery in fair value. If, based upon the analysis, it is determined that the impairment is other-than-temporary, the security is written down to fair value, and a loss is recognized through earnings as a component of other (income)/expense, net. The amount of other-than-temporary impairment recognized through earnings is disclosed in Note 2.
Cash, Restricted Cash, Cash Equivalents, and Investments
The Company classifies all highly liquid investments purchased with original or remaining maturities of ninety days or less at the date of purchase to be cash equivalents. The cost of these investments approximates their fair value. The Company invests excess cash in marketable securities consisting of available-for-sale fixed income securities, as well as strategic investments in the common stock and preferred stock of publicly traded foreign companies. Unrealized gains and losses on these investments are included in other comprehensive income, a separate component of stockholders’ equity, net of any related tax effect. Realized gains and losses are included in other expense, net. Declines in value of these investments judged by management to be other-than-temporary, if any, are included in other expense, net.
Investments in non-marketable securities are carried at cost as the Company does not exert significant influence over any of its investments. The Company evaluates the carrying value of its investments for impairment on a periodic basis.
The Company manages its total portfolio to encompass a diversified pool of investment‑grade securities. The Company’s investment policy is to manage its total cash and investments balances to preserve principal and maintain liquidity while achieving market returns on the investment portfolio.
63
INTERNATIONAL RECTIFIER CORPORATION AND SUBSIDIARIES
NOTES TO CONSOLIDATED FINANCIAL STATEMENTS (CONTINUED)
1. Business, Basis of Presentation and Summary of Significant Accounting Policies (Continued)
Cash, restricted cash, cash equivalents and investments as of June 29, 2014 and June 30, 2013 are summarized as follows (in thousands):
June 29, 2014 | June 30, 2013 | ||||||
Cash and cash equivalents | $ | 588,922 | $ | 443,490 | |||
Short-term investments | 20,114 | 11,056 | |||||
Restricted cash | 1,374 | 1,349 | |||||
Total cash, restricted cash, cash equivalents and investments | $ | 610,410 | $ | 455,895 | |||
Restricted cash consisted of $0.6 million in a short-term deposit account with a bank as collateral for travel card transactions at both June 29, 2014 and June 30, 2013, and $0.7 million held with another bank as collateral for an outstanding letter of credit at both June 29, 2014 and June 30, 2013.
Inventories
Inventories are stated at the lower of cost or market using the first-in first-out method. Inventories are reviewed for excess or obsolescence based upon demand forecasts for a specific time horizon and reserves are established accordingly. Manufacturing costs deemed to be abnormal, such as idle facility expense, excessive spoilage, double freight and re-handling costs are charged as cost of sales in the period incurred.
Inventories as of June 29, 2014 and June 30, 2013 were comprised of the following (in thousands):
June 29, 2014 | June 30, 2013 | ||||||
Raw materials | $ | 47,997 | $ | 58,471 | |||
Work-in-process | 103,034 | 97,158 | |||||
Finished goods | 78,980 | 76,686 | |||||
Total inventories | $ | 230,011 | $ | 232,315 | |||
Property, Plant and Equipment
Property, plant and equipment are stated at cost. Any gain or loss on retirement or disposition is included in operating expenses or cost of goods sold, depending on how the equipment was used. Depreciation is provided using the straight-line method based on the estimated useful lives of the assets, ranging from three to forty years. Depreciation and amortization expense for the fiscal years ended June 29, 2014, June 30, 2013 and June 24, 2012 was $87.2 million, $90.9 million and $83.7 million, respectively.
Property, plant and equipment as of June 29, 2014 and June 30, 2013 were comprised of the following (in thousands):
June 29, 2014 | June 30, 2013 | Range of Useful Life | |||||||
Building and improvements | $ | 178,683 | $ | 167,746 | 3 ‑ 40 | ||||
Equipment | 1,181,738 | 1,123,457 | 3 ‑ 15 | ||||||
Less: accumulated depreciation and amortization | (1,021,912 | ) | (946,023 | ) | |||||
338,509 | 345,180 | ||||||||
Land | 14,840 | 14,435 | |||||||
Construction-in-progress | 38,416 | 63,723 | |||||||
Total property, plant and equipment | $ | 391,765 | $ | 423,338 | |||||
Amortization of improvements to leased premises is recorded using the straight-line method over the shorter of the remaining term of the lease or estimated useful lives of the improvements. As of June 29, 2014 and June 30, 2013, the Company did not have any material capital leases included in property, plant and equipment.
64
INTERNATIONAL RECTIFIER CORPORATION AND SUBSIDIARIES
NOTES TO CONSOLIDATED FINANCIAL STATEMENTS (CONTINUED)
1. Business, Basis of Presentation and Summary of Significant Accounting Policies (Continued)
Repairs and maintenance costs are charged to expense as incurred. In the fiscal years ended June 29, 2014, June 30, 2013 and June 24, 2012, repairs and maintenance expenses were $50.3 million, $47.9 million and $54.4 million, respectively.
The Company tests long-lived assets for impairment whenever events or changes in circumstances indicate that their carrying amount may not be recoverable. Such events and circumstances include, but are not limited to:
• | A significant change in business strategy or in the extent or manner for which the asset is being used or in its physical condition; |
• | A significant negative change in the business climate, industry conditions, economic conditions or market value of an asset; and |
• | Current period operating losses or negative cash flow combined with a history of similar losses or a forecast that indicates continuing losses associated with the use of an asset. |
The Company evaluates the recoverability of long-lived assets based on the expected undiscounted cash flows for their asset group.
Disposition of Property
During fiscal year 2012, the Company completed the sale of the site of a previous manufacturing research and development facility located in Oxted, England. The Company received cash of approximately $5.6 million as consideration. Since the site had a carrying value of $0.1 million previously recorded in property, plant, and equipment, net, almost the entire proceeds, net of $0.1 million of transaction costs, were recorded as a gain of $5.4 million on disposition of property in the condensed consolidated statement of operations for the fiscal year ended 2012.
Goodwill, Acquisition‑Related and Other Intangible Assets
The Company classifies the difference between the consideration transferred and the fair value of the net tangible and intangible assets acquired at the date of acquisition as goodwill. The Company classifies intangible assets apart from goodwill if the assets have contractual or other legal rights, or if the assets can be separated and sold, transferred, licensed, rented or exchanged. Depending on the nature of the assets acquired, the amortization period may range from 2 to 15 years for those acquisition‑related intangible assets subject to amortization.
The Company evaluates the carrying value of long-lived assets, including goodwill and other intangible assets, annually during the fourth quarter of each fiscal year and more frequently if it believes indicators of impairment exist and whenever events or changes in circumstances indicate that the carrying value may not be recoverable. In evaluating goodwill, a two-step goodwill impairment test is applied to each reporting unit. The Company identifies reporting units and determines the carrying value of each reporting unit by assigning the assets and liabilities, including the existing goodwill and intangible assets, to those reporting units. Each of the Company’s operating segments represents an individual reporting unit for purposes of assessing impairment of goodwill. In the first step of the impairment test, the Company estimates the fair value of the reporting unit. If the fair value of the reporting unit is less than the carrying value of the reporting unit, the Company performs the second step which compares the implied fair value of goodwill with the carrying amount of goodwill and writes down the carrying amount of the goodwill to the implied fair value.
The fair value of the Company’s reporting units is determined using the income approach, which estimates fair value of its reporting units based on a discounted cash flow approach. During fiscal years 2014, 2013, and 2012, the discount rates the Company utilized for determining discounted cash flows were 14.1 percent, 14.5 percent, and 14.0 percent, respectively, based upon its assessment of the risks associated with the projected cash flows and market based estimates of capital costs. In completing the goodwill impairment analysis, the Company tests the appropriateness of the reporting units’ estimated fair value by reconciling the aggregate reporting units’ fair values with the Company's market capitalization.
65
INTERNATIONAL RECTIFIER CORPORATION AND SUBSIDIARIES
NOTES TO CONSOLIDATED FINANCIAL STATEMENTS (CONTINUED)
1. Business, Basis of Presentation and Summary of Significant Accounting Policies (Continued)
The determination of the fair value of the reporting units requires the Company to make significant estimates and assumptions. These estimates and assumptions include estimates of future revenues and expense growth rates, capital expenditures and the depreciation and amortization, changes in working capital, discount rates, and the selection of appropriate control premiums. Due to the inherent uncertainty involved in making these estimates, actual future results related to assumed variables could differ from these estimates. Changes in assumptions regarding future results or other underlying assumptions could have a significant impact on either the fair value of the reporting unit or the amount of any resulting goodwill impairment charge.
The Company’s annual evaluation during fiscal years 2014 and 2013 indicated that the fair value of the reporting units was more than their carrying value indicating no impairment.
In the fourth quarter of fiscal year 2012, after completing the first step in the goodwill impairment analysis, the Company concluded that goodwill in the Enterprise Power ("EP") segment was impaired. Several factors led to a reduction in forecasted EP segment cash flows, including, among others, deteriorating market conditions, business trends and projected product mix, causing lower than expected performance. As the estimated fair value was less than the net book value, the Company performed the second step of the impairment test, and as a result of the step two analysis, recorded a goodwill impairment charge of $69.4 million relating to the EP segment in fiscal year 2012.
As of June 29, 2014 and June 30, 2013, acquisition‑related intangible assets included the following (in thousands):
June 29, 2014 | |||||||||||||
Amortization Periods (Years) | Gross Carrying Amount | Accumulated Amortization | Net | ||||||||||
Completed technology | 4 - 12 | $ | 52,045 | $ | (43,771 | ) | $ | 8,274 | |||||
Customer lists | 5 - 12 | 10,430 | (8,163 | ) | 2,267 | ||||||||
Intellectual property and other | 2 - 15 | 16,763 | (11,801 | ) | 4,962 | ||||||||
Total acquisition‑related intangible assets | $ | 79,238 | $ | (63,735 | ) | $ | 15,503 | ||||||
June 30, 2013 | |||||||||||||
Amortization Periods (Years) | Gross Carrying Amount | Accumulated Amortization | Net | ||||||||||
Completed technology | 4 - 12 | $ | 52,045 | $ | (39,163 | ) | $ | 12,882 | |||||
Customer lists | 5 - 12 | 10,430 | (7,313 | ) | 3,117 | ||||||||
Intellectual property and other | 2 - 15 | 16,763 | (10,839 | ) | 5,924 | ||||||||
Total acquisition‑related intangible assets | $ | 79,238 | $ | (57,315 | ) | $ | 21,923 | ||||||
Based on identified intangible assets that are subject to amortization as of June 29, 2014, the Company expects future amortization expense for each period to be as follows (in thousands):
Fiscal Year | |||||||||||||||||||||||||||
Total | 2015 | 2016 | 2017 | 2018 | 2019 | 2020 and thereafter | |||||||||||||||||||||
Estimated Amortization Expense | $ | 15,503 | $ | 6,220 | $ | 4,681 | $ | 1,463 | $ | 897 | $ | 897 | $ | 1,345 | |||||||||||||
66
INTERNATIONAL RECTIFIER CORPORATION AND SUBSIDIARIES
NOTES TO CONSOLIDATED FINANCIAL STATEMENTS (CONTINUED)
1. Business, Basis of Presentation and Summary of Significant Accounting Policies (Continued)
The carrying amount of goodwill by reportable segment as of June 29, 2014 and June 30, 2013 was as follows (in thousands):
Business Segments: | June 29, 2014 | June 30, 2013 | |||||
Energy Saving Products | $ | 33,190 | $ | 33,190 | |||
HiRel | 18,959 | 18,959 | |||||
Total goodwill | $ | 52,149 | $ | 52,149 | |||
Income tax deductions related to goodwill were $3.0 million for each of the fiscal years ended June 29, 2014, June 30, 2013, and June 24, 2012. As of June 29, 2014, $8.3 million of goodwill remains deductible for income tax purposes.
Warranty
The Company records warranty liabilities at the time of sale for the estimated costs that may be incurred under the terms of its warranty agreements. The specific warranty terms and conditions vary depending upon product sold and the country in which the Company does business. In general, for standard products, the Company will replace defective parts not meeting the Company’s published specifications at no cost to the customers. Factors that affect the liability include historical and anticipated failure rates of products sold, and cost per claim to satisfy the warranty obligation. If actual results differ from the estimates, the Company revises its estimated warranty liability to reflect such changes.
The following table details the changes in the Company’s warranty reserve for the fiscal years ended June 29, 2014, June 30, 2013, and June 24, 2012, which is included in other accrued expenses as detailed in Note 6 (in thousands):
Accrued warranty, June 26, 2011 | $ | 3,457 | |
Accruals for warranties issued during the year | 3,722 | ||
Changes in estimates related to pre-existing warranties | (1,135 | ) | |
Warranty claim settlements | (3,854 | ) | |
Accrued warranty, June 24, 2012 | 2,190 | ||
Accruals for warranties issued during the year | 2,019 | ||
Changes in estimates related to pre-existing warranties | 144 | ||
Warranty claim settlements | (2,361 | ) | |
Accrued warranty, June 30, 2013 | 1,992 | ||
Accruals for warranties issued during the year | 2,495 | ||
Changes in estimates related to pre-existing warranties | (184 | ) | |
Warranty claim settlements | (2,685 | ) | |
Accrued warranty, June 29, 2014 | $ | 1,618 | |
67
INTERNATIONAL RECTIFIER CORPORATION AND SUBSIDIARIES
NOTES TO CONSOLIDATED FINANCIAL STATEMENTS (CONTINUED)
1. Business, Basis of Presentation and Summary of Significant Accounting Policies (Continued)
Derivative Financial Instruments
The Company’s primary objectives for holding derivative financial instruments ("derivatives") are to hedge non-functional currency risks. The Company’s accounting policies for derivatives are based on the criteria for designation of a hedging transaction as an accounting hedge, either as cash flow or fair value hedges. A cash flow hedge refers to the hedge of the exposure to variability in the cash flows of an asset or a liability, or of a forecasted transaction. A fair value hedge refers to the hedge of the exposure to changes in fair value of an asset or a liability, or of an unrecognized firm commitment. The criteria for designating a derivative as a hedge include the instrument’s effectiveness in risk reduction and, in most cases, a one-to-one matching of the derivative to its underlying transaction. Gains and losses from derivatives designated as fair value accounting hedges generally offset changes in the values of the hedged assets or liabilities over the life of the hedge. The Company recognizes gains and losses on derivatives that are not currently designated as hedges for accounting purposes in earnings as a component of other expense, net. As of June 29, 2014 and June 30, 2013, the Company had no derivatives designated as accounting hedges. As such, all gains and losses on derivatives for the years ended June 29, 2014 and June 30, 2013 were recognized in earnings as a component of other expense, net.
Foreign Currency Translation
In most cases, the functional currency of a foreign operation is deemed to be the local country’s currency. Assets and liabilities of operations outside the United States are translated into U.S. reporting currency using current exchange rates. Revenues and expenses denominated in foreign functional currencies are translated at the average exchange rates during the period. The effects of foreign currency translation adjustments are included as a component of accumulated other comprehensive income within stockholders’ equity.
Stock‑Based Compensation
The Company grants Restricted Stock Units ("RSU’s") with three types of vesting schedules: (i) service-based, (ii) performance-based or (iii) market-based (see Note 9). The fair value for service-based and performance-based RSU’s is determined using the fair value of the Company’s common stock on the date of grant. Compensation expense for awards with service-based conditions is amortized over the requisite service period of the award on a straight-line basis. Compensation expense for awards with performance conditions is recognized over the period from the date the performance condition is determined to be probable of occurring through the date the applicable condition is expected to be met. If the performance condition is not considered probable of being achieved, no expense is recognized until such time as the performance condition is considered probable of being met, if ever.
The fair value of market-based RSU’s is estimated by an independent valuation firm using the Monte Carlo Simulation method which takes into account multiple input variables that determine the probability of satisfying the market conditions stipulated in the award. This method requires the input of assumptions, including the expected volatility of the Company’s common stock, and a risk-free interest rate. Compensation expense related to awards that are expected to vest upon achieving a market-based condition is recognized on a straight-line basis regardless of whether the market condition is satisfied, provided that the requisite service has been achieved. The amount of periodic expense attributed to market-based RSUs is based on the estimated forfeiture rate, which is updated according to the Company’s actual forfeiture rates.
The Company estimates the fair value of stock options granted using the Black‑Scholes option pricing model. The fair value for awards that are expected to vest are then amortized on a straight-line basis over the requisite service period of the award, which is generally the option vesting term. The amount of periodic expense attributed to awards is based on the estimated forfeiture rate, which is updated based on the Company’s actual forfeiture rates. This option pricing model requires the input of subjective assumptions, including the expected volatility of the Company’s common stock, pre-vesting forfeiture rate and an option’s expected life.
The Company estimates the expected term of options using historical exercise and forfeiture data. The Company believes that this historical data is the best estimate of the expected life of a new option, and that generally all groups of the Company’s employees exhibit similar exercise behavior.
68
INTERNATIONAL RECTIFIER CORPORATION AND SUBSIDIARIES
NOTES TO CONSOLIDATED FINANCIAL STATEMENTS (CONTINUED)
1. Business, Basis of Presentation and Summary of Significant Accounting Policies (Continued)
The Company uses the historical volatility of its common stock to estimate expected volatility. The Company believes that historical volatility is a better indicator of expected volatility than implied volatility because a sequential period of historical data at least equal to the expected term of options and stock awards is available, and there is currently no indication that future volatility is likely to differ from historical volatility.
Stock Repurchase Program
The Company’s stock repurchase program authorizes it to repurchase up to $150.0 million of shares of the Company's outstanding common stock. Stock repurchases under this program may be made in the open market or through privately negotiated transactions. The timing and actual number of shares repurchased depend on market conditions and other factors. The stock repurchase program may be suspended at any time without prior notice. The Company has used and plans to continue to use existing cash to fund the repurchases. All of the shares repurchased by the Company through the program were purchased in open market transactions. During the fiscal year ended June 29, 2014, the Company repurchased approximately 0.5 million shares for approximately $12.6 million. As of June 29, 2014, the Company had purchased approximately 6.7 million shares for approximately $125.8 million under the program. As of June 29, 2014, the Company had not cancelled the repurchased shares of common stock, and as such, they are reflected as treasury stock in the June 29, 2014 and June 30, 2013 consolidated balance sheets.
Concentration of Risk
The Company is subject to concentrations of credit risk in its investments, derivatives and trade accounts receivable. The Company maintains cash, cash equivalents, and other securities with high credit quality financial institutions based upon the Company’s analysis of that financial institution’s relative credit standing. The Company’s investment policy is designed to limit exposure to any one institution. The Company also is exposed to credit-related losses in the event of non-performance by counterparties to derivative instruments. The counterparties to derivative transactions are typically major financial institutions with investment grade credit ratings and a publicly traded foreign company. This credit risk is generally limited to the gains in such contracts should any of these counterparties fail to perform as contracted. The Company considers the risk of counterparty default for the financial institutions to be minimal, and the publicly traded foreign company to be more significant.
The Company sells its products to distributors and original equipment manufacturers involved in a variety of industries including computing, consumer, communications, automotive and industrial. The Company has adopted credit policies and standards to accommodate industry growth and inherent risk. The Company performs continuing credit evaluations of its customers’ financial condition and requires collateral as deemed necessary. Reserves are provided for estimated amounts of trade accounts receivable that may not be collected. The Company maintains allowances for doubtful accounts and pricing disputes. These allowances as of fiscal years ended June 29, 2014 and June 30, 2013 were $0.4 million and $0.9 million, respectively.
Loss Contingencies
The Company is subject to various claims and litigation arising in the ordinary course of business. Because of the nature and inherent uncertainties of litigation and claims, the outcomes of these matters are subject to significant uncertainty. The Company accrues for these matters if it is probable that an asset has been impaired or a liability has been incurred and if the amount of the loss can be reasonably estimated. The Company discloses loss contingencies if it is at least reasonably possible that a material loss has been incurred.
69
INTERNATIONAL RECTIFIER CORPORATION AND SUBSIDIARIES
NOTES TO CONSOLIDATED FINANCIAL STATEMENTS (CONTINUED)
1. Business, Basis of Presentation and Summary of Significant Accounting Policies (Continued)
Adoption of Recent Accounting Standards
In July 2012, the FASB issued ASC update No. 2012-02, “Intangibles-Goodwill and Other (Topic 350), Testing Indefinite-Lived Intangible Assets for Impairment” (“ASC 2012-02”). Under the amendments in this update, a company has the option first to assess qualitative factors to determine whether the existence of events and circumstances indicates that it is more likely than not that the indefinite-lived intangible asset is impaired as a basis for determining whether it is necessary to perform the quantitative impairment test in accordance with Topic 350. The more-likely-than-not threshold is defined as having a likelihood of more than 50 percent. If after assessing the qualitative factors, a company determines it does not meet the more-likely-than-not threshold, a company is not required to perform the quantitative impairment test by calculating the fair value of an indefinite-lived intangible asset and comparing the fair value with the carrying amount of the asset. The amendments in this update are effective for annual and interim impairment tests performed for fiscal years beginning after September 15, 2012 (early adoption permitted). The adoption of this update did not have a material impact on the Company's financial statements.
In February 2013, the FASB issued ASC update No. 2013-02, “Comprehensive Income (Topic 220), Reporting of Amounts Reclassified Out of Accumulated Other Comprehensive Income” (ASC 2013-02). The objectives of this update require companies to provide information about the amounts reclassified out of accumulated other comprehensive income by component. In addition, a company is required to present, either on the face of the statement where net income is presented or in the notes, significant amounts reclassified out of accumulated other comprehensive income by the respective line items of net income, but only if the amount reclassified is required under GAAP to be reclassified to net income in its entirety in the same reporting period. The amendments in this update are effective for fiscal years and interim periods within those years beginning after December 15, 2012. The adoption of this update did not have a material impact on the Company's financial statements, and additional disclosure pursuant to this update is presented in Note 8.
Recent Accounting Standards
In July 2013, the FASB issued ASC update No. 2013-11, "Income Taxes (Topic 740), Presentation of an Unrecognized
Tax Benefit When a Net Operating Loss Carryforward, a Similar Tax Loss, or a Tax Credit Carryforward Exists" (ASU 2013-11). Under the amendments in this update, an unrecognized tax benefit, or a portion of an unrecognized tax benefit,
should be presented in the financial statements as a reduction to a deferred tax asset for a net operating loss carryforward, a
similar tax loss, or a tax credit carryforward, except as follows. To the extent a net operating loss carryforward, a similar tax
loss, or a tax credit carryforward is not available at the reporting date under the tax law of the applicable jurisdiction to settle
any additional income taxes that would result from the disallowance of a tax position or the tax law of the applicable jurisdiction does not require the entity to use, and the entity does not intend to use, the deferred tax asset for such purpose, the
unrecognized tax benefit should be presented in the financial statements as a liability and should not be combined with deferred
tax assets. The assessment of whether a deferred tax asset is available is based on the unrecognized tax benefit and deferred tax
asset that exist at the reporting date and should be made presuming disallowance of the tax position at the reporting date. The
amendments in this update are effective for fiscal years and interim periods within those years beginning after December 15,
2013. The Company does not believe that adoption of this update will have a material impact on its financial statements.
In May 2014, the FASB issued ASC updated No. 2014-09, "Revenue from Contracts with Customers (Topic 606)" (ASU 2014-09). Under the amendments in this update, recognition of revenue occurs when a customer obtains control of promised goods or services in an amount that reflects the consideration to which the entity expects to be entitled in exchange for those goods or services. In addition, the new standard requires that reporting companies disclose the nature, amount, timing, and uncertainty of revenue and cash flows arising from contracts with customers. The amendments in this update are effective for fiscal years and interim periods within those years beginning after December 15, 2016. Early adoption is not permitted. The new standard is required to be applied either retrospectively to each prior reporting period presented, or retrospectively with the cumulative effect of applying the update recognized at the date of initial application. The Company has not yet selected a transition method, and has not determined the impact that the new standard will have on its consolidated financial statements.
70
INTERNATIONAL RECTIFIER CORPORATION AND SUBSIDIARIES
NOTES TO CONSOLIDATED FINANCIAL STATEMENTS (CONTINUED)
2. Investments
Available-for-sale investments are carried at fair value, inclusive of unrealized gains and losses, and net of discount accretion and premium amortization computed using the level yield method. Net unrealized gains and losses are included in other comprehensive income (loss) net of applicable income taxes. Gains or losses on sales of available-for-sale investments are recognized using the first-in, first-out method and are included in other expense, net or interest expense (income), net, depending upon the type of security.
Available-for-sale securities as of June 29, 2014 are summarized as follows (in thousands):
Amortized Costs | Gross Unrealized Gain | Gross Unrealized Loss | Net Unrealized Gain | Market Value | |||||||||||||||
Short-Term Investments: | |||||||||||||||||||
Equity securities | $ | 7,000 | $ | 13,114 | $ | — | $ | 13,114 | $ | 20,114 | |||||||||
Other Assets: | |||||||||||||||||||
Equity securities | $ | 4,631 | $ | 3,845 | $ | — | $ | 3,845 | $ | 8,476 | |||||||||
Available-for-sale securities as of June 30, 2013 are summarized as follows (in thousands):
Amortized Costs | Gross Unrealized Gain | Gross Unrealized Loss | Net Unrealized Gain | Market Value | |||||||||||||||
Short-Term Investments: | |||||||||||||||||||
Corporate debt | $ | — | $ | 40 | $ | — | $ | 40 | $ | 40 | |||||||||
U.S. government and agency obligations | 11,007 | 9 | — | 9 | 11,016 | ||||||||||||||
Total short-term investments | $ | 11,007 | $ | 49 | $ | — | $ | 49 | $ | 11,056 | |||||||||
Other Assets: | |||||||||||||||||||
Equity securities | $ | 11,631 | $ | 5,739 | $ | (5 | ) | $ | 5,734 | $ | 17,365 | ||||||||
The Company manages its total portfolio to encompass a diversified pool of investment‑grade securities. The investment policy is to manage its total cash and investments balances to preserve principal and maintain liquidity while achieving market returns on the investment portfolio.
The Company also holds as strategic investments the common stock of three publicly traded foreign companies. The common stock of the three companies are shown as “Equity securities” in the table above and are included in short-term investments and other assets on the consolidated balance sheets, depending on the expected holding period for the security. The common shares of the publicly traded companies are traded on either the Tokyo Stock Exchange or the Taiwan Stock Exchange.
The Company holds an option on one of the strategic investments to put the associated number of common shares back to the issuer at a fixed price in local currency (which is described as the “Put Option” in Note 1). The Put Option became effective September 1, 2009 and is reported at fair value. As of June 29, 2014, the fair value of the Put Option was $1.5 million, with changes in fair value recorded in other expense, net (See Note 3, “Derivative Financial Instruments”). Dividend income from these investments was $0.2 million, $0.2 million, and $0.1 million for the fiscal years ended June 29, 2014, June 30, 2013, and June 24, 2012, respectively.
71
INTERNATIONAL RECTIFIER CORPORATION AND SUBSIDIARIES
NOTES TO CONSOLIDATED FINANCIAL STATEMENTS (CONTINUED)
2. Investments (Continued)
The Company also holds as strategic investments the common stock and preferred stock of a privately held domestic company. The common stock and preferred stock of the privately held domestic company was carried at cost of $1.5 million in other assets. During the second quarter of fiscal year 2012, the privately held domestic company in which the Company has an equity investment experienced a negative change in financial condition. The Company then evaluated that the investment was permanently impaired and recorded an impairment charge of $1.5 million during the second quarter of fiscal year 2012.
In addition, the Company holds a note receivable from another privately held company which was carried at cost of $0.4 million. This investment was carried at cost as the Company determined that it was nonmarketable since the issuer is a start-up company whose securities are not publicly traded, and as a result, it was not practicable to estimate the fair value of the investment. During the fiscal year ended June 30, 2013, the privately held company in which the Company has an equity investment experienced a negative change in financial condition. The Company then evaluated that the investment was permanently impaired and recorded an impairment charge of $0.4 million during the fiscal year ended June 30, 2013.
The following table provides the Company’s other-than-temporary impairments for equity, asset-backed, and mortgage-backed securities (in thousands):
Fiscal Year Ended | |||||||||||
June 29, 2014 | June 30, 2013 | June 24, 2012 | |||||||||
Privately held domestic company - common and preferred stock | $ | — | $ | 350 | $ | 1,504 | |||||
Publicly traded foreign companies - common stock | — | — | 1,332 | ||||||||
Mortgage-backed securities | — | — | 29 | ||||||||
Total other-than-temporary impairments | $ | — | $ | 350 | $ | 2,865 | |||||
Unrealized loss positions are measured and determined at the end of each fiscal year. There were no available-for-sale investments in a gross unrealized loss position as of June 29, 2014. Available-for-sale investments in a gross unrealized loss position as of June 30, 2013 included an equity investment held in a de minimis gross unrealized loss position for less than 12 months, and there were no investments in a gross unrealized loss position for 12 months or more.
During the fiscal year ended June 29, 2014, the Company sold a de minimis amount of available-for-sale securities, and the related proceeds and gross realized gains and (losses) were also de minimis. During the fiscal year ended June 30, 2013, available-for-sale securities were sold for total proceeds of $52.1 million, and gross realized gains and (losses) were de minimis. During the fiscal year ended June 24, 2012, available-for-sale securities were sold for total proceeds of $75.8 million, and gross realized gains and (losses) were $0.1 million and $(0.1) million, respectively. The cost of marketable securities sold was determined by the first-in, first-out method.
For information regarding the unrealized holding gains (losses) on available-for-sale investments reclassified out of accumulated other comprehensive income into the consolidated statement of operations, see "Note 8: Accumulated Other Comprehensive Income (Loss)."
72
INTERNATIONAL RECTIFIER CORPORATION AND SUBSIDIARIES
NOTES TO CONSOLIDATED FINANCIAL STATEMENTS (CONTINUED)
2. Investments (Continued)
Fair Value of Investments
The following tables present the balances of investments measured at fair value on a recurring basis as of June 29, 2014 and June 30, 2013 (in thousands):
As of June 29, 2014 | |||||||||||||||
Total | Level 1 | Level 2 | Level 3 | ||||||||||||
Equity securities | 28,590 | 28,590 | — | — | |||||||||||
Total investments at fair value | $ | 28,590 | $ | 28,590 | $ | — | $ | — | |||||||
As of June 30, 2013 | |||||||||||||||
Total | Level 1 | Level 2 | Level 3 | ||||||||||||
Corporate debt | $ | 40 | $ | — | $ | 40 | $ | — | |||||||
U.S. government and agency obligations | 11,016 | 6,004 | 5,012 | — | |||||||||||
Equity securities | 17,365 | 17,365 | — | — | |||||||||||
Total investments at fair value | $ | 28,421 | $ | 23,369 | $ | 5,052 | $ | — | |||||||
3. Derivative Financial Instruments
The Company is exposed to financial market risks, including fluctuations in interest rates, foreign currency exchange rates and market value risk related to its investments. The Company uses derivative financial instruments primarily to mitigate foreign exchange rate risks. In the normal course of business, the Company also faces risks that are either non-financial or non-quantifiable. Such risks principally include country risk, credit risk and legal risk, and are not discussed or quantified in the following analyses. As of June 29, 2014, the Company’s only derivatives were currency forward contracts which were not designated as accounting hedges, the Put Option (See Note 2, “Investments”), and a call option on the equity of a private domestic company. The private domestic company is a development stage entity, and as such, the Company is unable to determine the fair value of the call option at this time.
Interest Rates
The Company is subject to interest rate risk through its investments. The objectives of the Company’s investments in debt securities are to preserve principal and maintain liquidity while achieving market returns on the investment portfolio. To achieve these objectives, the returns on the Company’s investments in short-term debt generally will be compared to yields on money market instruments such as U.S. Commercial Paper programs, LIBOR, or U.S. Treasury Bills. Investments in long-term debt securities will be generally compared to yields on comparable maturity of U.S. Treasury obligations, investment grade corporate instruments with an equivalent credit rating or an aggregate benchmark index.
The Company had no outstanding interest rate derivatives as of June 29, 2014.
Foreign Currency Exchange Rates
A significant amount of the Company's revenues, expense, and capital purchasing transactions are conducted on a global basis in several foreign currencies. To protect against exposure to currency exchange rate fluctuations, the Company has established a balance sheet risk hedging program. Through this hedging program, the Company seeks to reduce, but does not always entirely eliminate, the impact of currency exchange rate movements on certain balance sheet line items.
73
INTERNATIONAL RECTIFIER CORPORATION AND SUBSIDIARIES
NOTES TO CONSOLIDATED FINANCIAL STATEMENTS (CONTINUED)
3. Derivative Financial Instruments (Continued)
The Company generally hedges the risks of foreign currency-denominated repetitive working capital positions with offsetting foreign currency denominated exchange transactions, using currency forward contracts or spot transactions. Transaction gains and losses on these foreign currency-denominated working capital positions are generally offset by corresponding gains and losses on the related hedging instruments, usually resulting in reduced net exposure. At various times, the Company has currency exposure related primarily to the British Pound Sterling, the Euro, and the Japanese Yen, as well as other foreign currencies. For example, in the United Kingdom, the Company has a sales office and a semiconductor wafer fabrication facility with revenues in U.S. Dollars and Euros, and expenses in British Pounds Sterling and U.S. Dollars. The Company does not hedge its revenues and expenses against changes in foreign currency exchange rates, as it does not perceive the net risk of changes to translated revenues and expenses from changes in exchange rates as significant enough at this time to justify hedging. The aggregate foreign currency losses included in net income for the fiscal years ended June 29, 2014, June 30, 2013, and June 24, 2012 were $1.5 million, $2.2 million, and $3.5 million, respectively.
For its balance sheet risk hedging program, the Company had approximately $11.6 million and $14.4 million in notional amounts of forward contracts not designated as accounting hedges outstanding at June 29, 2014 and June 30, 2013, respectively. Net realized and unrealized foreign currency gains related to foreign currency forward contracts not designated as accounting hedges recognized in earnings, as a component of other expense, net, were $1.1 million, $0.1 million, and $1.0 million for the fiscal years ended June 29, 2014, June 30, 2013, and June 24, 2012, respectively.
At June 29, 2014 and June 30, 2013, the fair value carrying amounts of the Company’s derivative financial instruments were as follows (in thousands):
June 29, 2014 | June 30, 2013 | ||||||||||
Balance Sheet Location | Fair Value | Balance Sheet Location | Fair Value | ||||||||
Put Option | Other assets | $ | 1,451 | Other assets | $ | 2,888 | |||||
Currency forward contracts | Prepaid expenses and other current assets | 19 | Prepaid expenses and other current assets | 19 | |||||||
Total | $ | 1,470 | $ | 2,907 | |||||||
The gain or (loss) recognized in other expense, net, for the Company’s derivative financial instruments not designated as hedging instruments during the fiscal years ended June 29, 2014, June 30, 2013, and June 24, 2012 was comprised of the following (in thousands):
Fiscal Year Ended | |||||||||||
June 29, 2014 | June 30, 2013 | June 24, 2012 | |||||||||
Put Option | $ | (1,437 | ) | $ | 54 | $ | 61 | ||||
Currency forward contracts | 1,137 | 129 | 961 | ||||||||
Total | $ | (300 | ) | $ | 183 | $ | 1,022 | ||||
74
INTERNATIONAL RECTIFIER CORPORATION AND SUBSIDIARIES
NOTES TO CONSOLIDATED FINANCIAL STATEMENTS (CONTINUED)
3. Derivative Financial Instruments (Continued)
Fair Value
The following tables present derivative financial instruments measured at fair value on a recurring basis as of June 29, 2014 and June 30, 2013 (in thousands):
June 29, 2014 | |||||||||||||||
Total | Level 1 | Level 2 | Level 3 | ||||||||||||
Put Option | $ | 1,451 | $ | — | $ | — | $ | 1,451 | |||||||
Foreign currency derivatives: | |||||||||||||||
Assets | 19 | — | 19 | — | |||||||||||
Total derivative financial instruments at fair value | $ | 1,470 | $ | — | $ | 19 | $ | 1,451 | |||||||
June 30, 2013 | |||||||||||||||
Total | Level 1 | Level 2 | Level 3 | ||||||||||||
Put Option | $ | 2,888 | $ | — | $ | — | $ | 2,888 | |||||||
Foreign currency derivatives: | |||||||||||||||
Assets | 19 | — | 19 | — | |||||||||||
Total derivative financial instruments at fair value | $ | 2,907 | $ | — | $ | 19 | $ | 2,888 | |||||||
4. Supplemental Cash Flow Disclosures
Components of the changes of operating assets and liabilities were comprised of the following (in thousands):
Fiscal Year Ended | |||||||||||
June 29, 2014 | June 30, 2013 | June 24, 2012 | |||||||||
Trade accounts receivable | $ | (22,343 | ) | $ | 28,419 | $ | 28,504 | ||||
Inventories | 1,525 | 40,880 | (64,929 | ) | |||||||
Prepaid expenses and other current assets | 12,625 | 5,773 | (5,757 | ) | |||||||
Accounts payable | (2,364 | ) | 9,745 | (30,088 | ) | ||||||
Accrued salaries, wages and commissions | 7,779 | (907 | ) | (9,952 | ) | ||||||
Deferred compensation | 611 | (498 | ) | 1,388 | |||||||
Accrued income taxes | 2,896 | (3,868 | ) | 998 | |||||||
Other accrued expenses | (11,919 | ) | (14,498 | ) | (3,625 | ) | |||||
Changes in operating assets and liabilities | $ | (11,190 | ) | $ | 65,046 | $ | (83,461 | ) | |||
Supplemental disclosures of cash flow information (in thousands):
Fiscal Year Ended | |||||||||||
June 29, 2014 | June 30, 2013 | June 24, 2012 | |||||||||
Cash paid during the year for: | |||||||||||
Interest | $ | 451 | $ | 462 | $ | 511 | |||||
Income taxes | 2,522 | 6,998 | 13,810 | ||||||||
Non-cash investing activities: | |||||||||||
Liabilities accrued for property, plant and equipment purchases | $ | 2,154 | $ | 4,815 | $ | 11,137 | |||||
75
INTERNATIONAL RECTIFIER CORPORATION AND SUBSIDIARIES
NOTES TO CONSOLIDATED FINANCIAL STATEMENTS (CONTINUED)
5. Revolving Credit Facility and Bank Letters of Credit
Revolving Credit Facility
On October 25, 2012 (the “Closing Date”), the Company entered into a Credit Agreement (the “Credit Agreement”), as borrower, with Wells Fargo Bank, National Association, as Administrative Agent (“Agent”), and certain lenders (the “Lenders”), pursuant to which it established a new senior unsecured revolving credit facility (the “Credit Facility”) in an aggregate principal amount of $100 million with sublimits for swingline loans (of $25 million) and the issuance of letters of credit (of $10 million). The Credit Facility matures on October 25, 2016. The proceeds of the Credit Facility may be used by the Company to finance certain capital expenditures and acquisitions permitted thereunder, to provide for the working capital and general corporate needs as well as to pay fees, commissions and expenses associated with the Credit Facility.
The terms of the Credit Agreement require the Company to comply with certain financial tests, and include various affirmative and negative covenants, and customary representations and warranties, conditions and events of default. Additionally, the Credit Facility is subject to a commitment fee on the unused portion at an initial rate equal to 0.25 percent per annum. As of June 29, 2014, the Company was in compliance with the financial covenants, and there were no amounts outstanding under the Credit Facility.
Bank Letters of Credit
At June 29, 2014 and June 30, 2013, the Company had $0.7 million and $0.7 million, respectively, of outstanding letters of credit. These letters of credit are secured by cash collateral provided by the Company equal to their face amount.
6. Other Accrued Expenses
Other accrued expenses as of June 29, 2014 and June 30, 2013 were comprised of the following as of (in thousands):
June 29, 2014 | June 30, 2013 | ||||||
Sales returns | $ | 40,655 | $ | 33,902 | |||
Accrued accounting and legal costs | 4,474 | 8,108 | |||||
Deferred revenue | 9,255 | 9,678 | |||||
Accrued warranty | 1,618 | 1,992 | |||||
Accrued utilities | 2,592 | 2,516 | |||||
Accrued repurchase obligation | 2,559 | 4,759 | |||||
Accrued sales and other taxes | 3,661 | 3,053 | |||||
Accrued subcontractor costs | 1,435 | 1,307 | |||||
Accrued rent | 1,393 | 4,858 | |||||
Other | 5,326 | 8,241 | |||||
Total other accrued expenses | $ | 72,968 | $ | 78,414 | |||
76
INTERNATIONAL RECTIFIER CORPORATION AND SUBSIDIARIES
NOTES TO CONSOLIDATED FINANCIAL STATEMENTS (CONTINUED)
7. Other Long-Term Liabilities
Other long-term liabilities as of June 29, 2014 and June 30, 2013 were comprised of the following (in thousands):
June 29, 2014 | June 30, 2013 | ||||||
Income taxes payable | $ | 3,218 | $ | 12,344 | |||
Deferred compensation | 11,594 | 9,903 | |||||
Other | 4,997 | 2,283 | |||||
Total other long-term liabilities | $ | 19,809 | $ | 24,530 | |||
At June 29, 2014, the Company had $1.1 million of accrued asset retirement obligations, of which $0.7 million is included in “Other” in the table above, with the remainder in other accrued expenses related to future obligations for the closure of certain owned manufacturing facilities.
8. Accumulated Other Comprehensive Income (Loss)
The components of accumulated other comprehensive income (loss) as of June 29, 2014, June 30, 2013, and June 24, 2012 and were as follows (in thousands):
June 29, 2014 | June 30, 2013 | June 24, 2012 | |||||||||
Foreign currency translation adjustments | $ | 5,336 | $ | (22,267 | ) | $ | (18,499 | ) | |||
Net unrealized gains (losses) on available-for-sale securities | 11,640 | 464 | (755 | ) | |||||||
Accumulated other comprehensive income (loss) | $ | 16,976 | $ | (21,803 | ) | $ | (19,254 | ) | |||
The following table details the changes in the Company’s accumulated other comprehensive income (loss) balance for the fiscal years ended June 29, 2014 and June 30, 2013 (in thousands):
Foreign Currency Translation Adjustments | Unrealized Gain (Loss) on Available-For-Sale Securities | Total | ||||||||||
Balance at June 24, 2012 | $ | (18,499 | ) | $ | (755 | ) | $ | (19,254 | ) | |||
Other comprehensive income (loss) before reclassifications | (3,768 | ) | 1,909 | (1,859 | ) | |||||||
Amounts reclassified from accumulated other comprehensive income (loss) | — | (6 | ) | (6 | ) | |||||||
Tax effects | — | (684 | ) | (684 | ) | |||||||
Net other comprehensive income (loss) | (3,768 | ) | 1,219 | (2,549 | ) | |||||||
Balance at June 30, 2013 | (22,267 | ) | 464 | (21,803 | ) | |||||||
Other comprehensive income before reclassifications | 27,603 | 11,212 | 38,815 | |||||||||
Amounts reclassified from accumulated other comprehensive income (loss) | — | (36 | ) | (36 | ) | |||||||
Tax effects | — | — | — | |||||||||
Net other comprehensive income | 27,603 | 11,176 | 38,779 | |||||||||
Balance at June 29, 2014 | $ | 5,336 | $ | 11,640 | $ | 16,976 | ||||||
77
INTERNATIONAL RECTIFIER CORPORATION AND SUBSIDIARIES
NOTES TO CONSOLIDATED FINANCIAL STATEMENTS (CONTINUED)
8. Accumulated Other Comprehensive Income (Loss) (Continued)
The amounts reclassified out of accumulated other comprehensive income (loss) into the consolidated statements of operations, with presentation location, were as follows:
Fiscal Year Ended | |||||||||||
Location | June 29, 2014 | June 30, 2013 | June 24, 2012 | ||||||||
Unrealized gain (loss) on available-for-sale securities | Interest income, net | 36 | 6 | 203 | |||||||
9. Stock‑Based Compensation and Employee Benefit Plans
Stock Incentive Plans
The Company makes stock based incentive awards (“Equity Awards”) and issues shares in connection with those awards under the Company’s stock incentive plans.
For the fiscal years ended June 29, 2014, June 30, 2013, and June 24, 2012, Equity Awards were granted under the Company’s 2011 Performance Incentive Plan (the “2011 Plan”), and Equity Awards remained outstanding under the 2011 Plan at the end of each of those fiscal years. At the end of those fiscal years, Equity Awards also remained outstanding under the Company’s prior Amended and Restated 2000 Incentive Plan (the "2000 Plan"), and the Company's prior 1997 Employee Stock Incentive Plan (“1997 Plan”).
The 2011 Plan was adopted by the Board of Directors (the “Board”) on August 15, 2011 and approved by the shareholders of the Company on November 11, 2011. Following shareholder approval of the 2011 Plan, no further Equity Awards could be made under the 2000 Plan; however the 2000 Plan remains in effect with respect to pre-existing Equity Awards. The grant of Equity Awards under the 1997 Plan ceased in November 2004 following an amendment increasing the share limit of the 2000 Plan.
Directors, officers and employees of the Company, and certain consultants to the Company, are eligible to receive Equity Awards under the 2011 Plan. As of June 29, 2014, approximately 4,275,927 shares were available for Equity Award purposes under the 2011 Plan. The 2011 Plan has rules which determine the number of shares that apply for share limits depending whether the awards are “full value awards.” Each share issued for a “full-value award” is counted against the share limit under the 2011 Plan as 1.50 shares for every one share actually issued in connection with the award. For this purpose, a “full-value award” means any award other than a stock option or stock appreciation right.
Stock Options
During the fiscal year ended June 29, 2014, the Company granted stock options to Company employees under the 2011 Plan. Subject to the terms and conditions of the 2011 Plan and applicable award documentation, those awards generally vest and become exercisable in equal installments over each of the first three anniversaries of the date of grant, and expire after five years.
78
INTERNATIONAL RECTIFIER CORPORATION AND SUBSIDIARIES
NOTES TO CONSOLIDATED FINANCIAL STATEMENTS (CONTINUED)
9. Stock‑Based Compensation and Employee Benefit Plans (Continued)
The following table summarizes the stock option activity for the fiscal years ended June 29, 2014, June 30, 2013, and June 24, 2012 (in thousands, except per share price data):
Stock Option Shares | Weighted Average Option Exercise Price per Share | Weighted Average Grant Date Fair Value per Share | Aggregate Intrinsic Value | |||||||||||
Outstanding, June 26, 2011 | 2,992 | $ | 21.30 | $ | 22,154 | |||||||||
Granted | 51 | $ | 21.76 | $ | 6.82 | |||||||||
Exercised | (225 | ) | $ | 14.54 | $ | 1,481 | ||||||||
Expired or forfeited | (774 | ) | $ | 35.29 | ||||||||||
Outstanding, June 24, 2012 | 2,044 | $ | 16.76 | $ | 7,031 | |||||||||
Granted | 115 | $ | 19.96 | $ | 5.58 | |||||||||
Exercised | (929 | ) | $ | 16.66 | $ | 3,678 | ||||||||
Expired or forfeited | (43 | ) | $ | 18.71 | ||||||||||
Outstanding, June 30, 2013 | 1,187 | $ | 17.08 | $ | 4,978 | |||||||||
Granted | 16 | $ | 24.90 | $ | 6.72 | |||||||||
Exercised | (886 | ) | $ | 15.97 | $ | 7,702 | ||||||||
Expired or forfeited | (43 | ) | $ | 14.90 | ||||||||||
Outstanding, June 29, 2014 | 274 | $ | 21.47 | $ | 1,852 | |||||||||
For the fiscal years ended June 29, 2014, June 30, 2013, and June 24, 2012, the Company received proceeds of $14.1 million, $15.5 million and $3.3 million, respectively, as a result of the exercise of stock options issued under its stock based compensation plans. The tax benefit realized for the tax deductions from stock-based awards was $0.2 million, $0.0 million and $1.7 million for fiscal years ended June 29, 2014, June 30, 2013, and June 24, 2012, respectively.
The following table summarizes the stock options outstanding at June 29, 2014, and the related weighted average price and life information (in thousands, except year and price data):
June 29, 2014 | ||||||||||||||||||||||||||
Outstanding | Exercisable | |||||||||||||||||||||||||
Range of Exercise Price per Share | Number Outstanding | Weighted Average Remaining Life (Years) | Weighted Average Exercise Price | Aggregate Intrinsic Value | Number Exercisable | Weighted Average Remaining Life (Years) | Weighted Average Exercise Price | Aggregate Intrinsic Value | ||||||||||||||||||
$15.82 to $19.19 | 92 | 0.62 | $ | 18.66 | 88 | 0.47 | $ | 18.72 | ||||||||||||||||||
$20.15 to $22.72 | 141 | 3.23 | $ | 20.70 | 60 | 2.99 | $ | 21.00 | ||||||||||||||||||
$24.39 to $32.07 | 17 | 3.99 | $ | 25.80 | 3 | 1.50 | $ | 28.93 | ||||||||||||||||||
$32.20 to $34.27 | 24 | 0.42 | $ | 33.88 | 24 | 0.42 | $ | 33.88 | ||||||||||||||||||
274 | 2.15 | $ | 21.47 | $ | 1,852 | 175 | 1.35 | $ | 21.77 | $ | 1,186 | |||||||||||||||
RSU Awards
During the fiscal year ended June 29, 2014, the Company granted 1,105,259 RSUs to employees and 43,704 RSUs to members of the Board, in each case under the 2011 Plan. The RSUs provided for vesting over a period of service, subject to the terms and conditions of their respective plans and applicable award documentation. For the RSU awards made to employees, the vesting of awards generally takes place in equal installments over each of the first three anniversaries of the date of grant. The RSU awards made to members of the Board were made as part of the Board’s annual director compensation program, under which the vesting of RSU awards takes place generally on the first anniversary of the date of grant.
79
INTERNATIONAL RECTIFIER CORPORATION AND SUBSIDIARIES
NOTES TO CONSOLIDATED FINANCIAL STATEMENTS (CONTINUED)
9. Stock‑Based Compensation and Employee Benefit Plans (Continued)
In the fourth quarter of fiscal year 2014, the Company granted RSUs with market-based vesting criteria representing up to 495,081 shares to executives and certain key employees pursuant to the 2011 Plan. These market-based RSU awards could potentially vest in any or each of the three consecutive quarters beginning with the final quarter of fiscal year 2017. The actual number of awards that will ultimately vest in each of the three quarters is based on the average closing price of the Company's common stock for that quarter, and in no event can the total number of shares vested in all three quarters exceed the total number of shares designated in the market-based RSU awards granted. Any of these awards that remain unvested as of the end of the second quarter of fiscal year 2018 will be forfeited. The fair value of these awards was estimated using the Monte Carlo Simulation method which takes into account the probability that the market conditions of these awards will be achieved. Compensation costs related to awards with a market-based condition are recognized regardless of whether the market conditions are satisfied, provided that the requisite service has been provided.
The following table summarizes the RSU activity for the fiscal years ended June 29, 2014, June 30, 2013, and June 24, 2012 (in thousands, except per share price data):
Restricted Stock Units | Weighted Average Grant Date Fair Value Per Share | Aggregate Intrinsic Value | ||||||||
Outstanding, June 26, 2011 | 2,051 | $ | 21.22 | $ | 53,501 | |||||
Granted | 1,518 | $ | 19.80 | |||||||
Vested | (560 | ) | $ | 22.49 | $ | 12,821 | ||||
Expired or forfeited | (104 | ) | $ | 23.84 | ||||||
Outstanding, June 24, 2012 | 2,905 | $ | 21.72 | $ | 57,932 | |||||
Granted | 1,928 | $ | 20.77 | |||||||
Vested | (804 | ) | $ | 21.80 | $ | 16,180 | ||||
Expired or forfeited | (333 | ) | $ | 22.04 | ||||||
Outstanding, June 30, 2013 | 3,696 | $ | 21.31 | $ | 77,394 | |||||
Granted | 1,644 | $ | 24.36 | |||||||
Vested | (1,065 | ) | $ | 21.44 | $ | 28,644 | ||||
Expired or forfeited | (450 | ) | $ | 15.22 | ||||||
Outstanding, June 29, 2014 | 3,825 | $ | 19.26 | $ | 105,791 | |||||
The Company's stock-based compensation plan permits the reduction of a participant’s RSUs for purposes of settling a participant’s income tax withholding obligation. During the fiscal years ended June 29, 2014, June 30, 2013 and June 24, 2012, the Company withheld RSUs representing 348,502 shares, 268,677 shares, and 185,701 shares, respectively, to fund participant income tax withholding obligations.
During fiscal year 2011, the Company granted RSU awards with performance (non-market-based) vesting criteria to executives and certain key employees pursuant to the 2000 Plan. Under the terms of the awards, vesting took place upon the achievement of certain specified performance goals, and otherwise subject to the terms and conditions of the 2000 Plan and applicable award documentation. During the fiscal year ended June 24, 2012, the Company recorded a net credit of $1.3 million to stock compensation expense relating to these awards, based on the determination that the achievement of certain of the performance goals that the Company in the prior year had determined were probable within the time established for the awards, were no longer considered probable as of the end of fiscal year 2012. After the effect of such credit, the Company recognized $1.1 million of credit for these awards during fiscal year 2012 based on actual achievement or the determination that the achievement of certain of the performance goals was probable within the time established for the awards. Those RSU awards terminated following the close of the 2012 fiscal year.
80
INTERNATIONAL RECTIFIER CORPORATION AND SUBSIDIARIES
NOTES TO CONSOLIDATED FINANCIAL STATEMENTS (CONTINUED)
9. Stock‑Based Compensation and Employee Benefit Plans (Continued)
Additional information
Additional information relating to the Company’s stock based compensation plans, including employee stock options and RSUs (including RSUs with performance-based and market-based vesting criteria) at June 29, 2014, June 30, 2013, and June 24, 2012, is as follows (in thousands):
June 29, 2014 | June 30, 2013 | June 24, 2012 | ||||||
Outstanding options exercisable | 175 | 1,039 | 1,749 | |||||
Options and RSUs available for grant | 4,276 | 6,040 | 8,505 | |||||
Total reserved common stock shares for equity awards | 8,375 | 10,923 | 13,454 | |||||
Forfeitures are estimated at the time of grant. Based on the Company’s historical exercise and termination data, a four percent forfeiture rate is assumed for the majority of the options and RSUs.
For the fiscal years ended June 29, 2014, June 30, 2013, and June 24, 2012, stock‑based compensation expense associated with the Company’s stock options and RSUs (including RSUs with performance and/or market-based vesting criteria) was as follows (in thousands):
Fiscal Year Ended | |||||||||||
June 29, 2014 | June 30, 2013 | June 24, 2012 | |||||||||
Cost of sales | $ | 5,242 | $ | 4,393 | $ | 2,766 | |||||
Selling, general and administrative expense | 13,144 | 11,166 | 9,199 | ||||||||
Research and development expense | 8,108 | 6,001 | 4,176 | ||||||||
Total stock‑based compensation expense | $ | 26,494 | $ | 21,560 | $ | 16,141 | |||||
The total unrecognized compensation expense for outstanding stock options and RSUs was $62.8 million as of June 29, 2014. The weighted average number of years to recognize the total compensation expense for stock options and RSUs are 1.52 and 2.33, respectively. As of June 29, 2014, the Company had no RSUs with performance (non-market) based vesting conditions outstanding.
The fair value of the stock options associated with the above compensation expense for the fiscal years ended June 29, 2014, June 30, 2013, and June 24, 2012, respectively, was determined at the grant date using the Black‑Scholes option pricing model with the following weighted average assumptions:
2014 | 2013 | 2012 | ||||||
Expected life | 3.5 years | 3.5 years | 3.5 years | |||||
Risk free interest rate | 0.79 | % | 0.39 | % | 0.44 | % | ||
Volatility | 35.41 | % | 37.56 | % | 42.25 | % | ||
Dividend yield | 0.00 | % | 0.00 | % | 0.00 | % | ||
The fair value of the market-based RSUs associated with the above compensation expense for the fiscal years ended June 29, 2014, June 30, 2013, and June 24, 2012, respectively, was determined at the grant date using the Monte Carlo Simulation method with the following weighted average assumptions:
2014 | 2013 | 2012 | ||||||
Expected award life | 3.5 years | 2.7 years | 3.0 years | |||||
Risk free interest rate | 1.08 | % | 0.66 | % | 0.41 | % | ||
Volatility | 34.70 | % | 36.62 | % | 36.61 | % | ||
Dividend yield | 0.00 | % | 0.00 | % | 0.00 | % | ||
81
INTERNATIONAL RECTIFIER CORPORATION AND SUBSIDIARIES
NOTES TO CONSOLIDATED FINANCIAL STATEMENTS (CONTINUED)
9. Stock‑Based Compensation and Employee Benefit Plans (Continued)
During fiscal year 2014, the Company estimated the expected term of options using historical exercise and forfeiture data. The risk-free interest rate is based on U.S. Treasury securities with maturities equal to the expected life of the option and market-based RSU. The Company uses the historical volatility of common stock for valuing its stock options and market-based RSUs. The Company believes that historical volatility is a better indicator of expected volatility than implied volatility because a sequential period of historical data at least equal to the expected term of options and stock awards is available, and there is currently no indication that future volatility is likely to differ from historical volatility.
Employee Stock Participation Plan
The Company’s amended 1984 Employee Stock Participation Plan (“Amended ESPP”), has been suspended since April 2007. Participation in the Amended ESPP has remained suspended through fiscal year 2014. No shares have been issued during the suspension of the Amended ESPP and 755,542 shares remained un-issued at June 29, 2014.
Deferred Compensation Plan
The Company has a deferred compensation plan which provides directors, executive management and other key employees with the ability to defer the receipt of compensation in order to accumulate retirement funds on a tax deferred basis. The Company does not make contributions to the deferred compensation plan or guarantee returns on the investments. Participant deferrals and investment gains and losses remain the Company’s assets and are subject to claims of general creditors. The assets and liabilities of the deferred compensation plan are recorded at fair value each reporting period with the changes in fair value recorded in other expense, net.
The following tables present the long-term liabilities and the related assets measured at fair value on a recurring basis as of June 29, 2014 and June 30, 2013 (in thousands):
June 29, 2014 | |||||||||||||||
Total | Level 1 | Level 2 | Level 3 | ||||||||||||
Employee deferred compensation plan liability | $ | 9,844 | $ | 9,844 | $ | — | $ | — | |||||||
Assets of employee deferred compensation plan (reported in other assets) | 10,534 | 10,534 | — | — | |||||||||||
June 30, 2013 | |||||||||||||||
Total | Level 1 | Level 2 | Level 3 | ||||||||||||
Employee deferred compensation plan liability | $ | 8,326 | $ | 8,326 | $ | — | $ | — | |||||||
Assets of employee deferred compensation plan (reported in other assets) | 9,472 | 9,472 | — | — | |||||||||||
The Company recorded gross unrealized gains for the deferred compensation plan in other expense, net, of $0.2 million, $0.1 million and $0.3 million for fiscal years 2014, 2013 and 2012, respectively.
Employee Retirement Savings Plans
The Company sponsors a 401(k) plan which provides participating employees in the U.S. with an opportunity to accumulate funds for retirement. The Company’s contributions to the 401(k) plan were $2.5 million, $2.2 million, and $2.4 million for fiscal years 2014, 2013, and 2012, respectively.
The Company also contributes to defined contribution employee retirement savings plans for certain employees located in Europe and Asia. The Company's contributions to defined contribution retirement savings plans in Europe were $2.3 million, $1.8 million, and $1.9 million for fiscal years 2014, 2013, and 2012, respectively. The Company's contributions to defined contribution retirement savings plans in Asia were $0.1 million for each of the three fiscal years 2014, 2013, and 2012.
82
INTERNATIONAL RECTIFIER CORPORATION AND SUBSIDIARIES
NOTES TO CONSOLIDATED FINANCIAL STATEMENTS (CONTINUED)
10. Asset Impairment, Restructuring and Related Charges (Recoveries)
Asset impairment, restructuring and related charges reflect the impact of certain cost reduction programs and initiatives implemented by the Company. These programs and initiatives include the closing of facilities, the termination of employees and other related activities. Asset impairment, restructuring and related charges include program-specific exit costs, severance benefits pursuant to an ongoing benefit arrangement, and special termination benefits. Severance costs unrelated to the Company's restructuring initiatives are recorded as an element of cost of sales, research and development (“R&D”) or selling, general and administrative expense (“SG&A”), depending upon the classification and function of the employment position terminated. Restructuring costs are expensed during the period in which all requirements of recognition are met.
Asset write-downs are principally related to facilities and equipment that will not be used subsequent to the completion of exit or downsizing activities being implemented, and cannot be sold for amounts in excess of carrying value. In determining the asset groups for the purpose of calculating write-downs, the Company groups assets at the lowest level for which identifiable cash flows are largely independent of the cash flows of other assets and liabilities. In determining whether an asset is impaired, the Company evaluates estimated undiscounted future cash flows and other factors such as changes in strategy and technology. An impairment loss exists if the estimated undiscounted future cash flows are less than the carrying amount of the asset group. The Company then determines the fair value of the asset group by discounting the estimated future cash flows, consistent with the cash flows of a market participant, at a discount rate that is used when analyzing potential acquisitions. The Company then compares the fair value of the asset group with the carrying amount of the asset group and writes down the carrying amount of the asset group to its fair value.
During the first quarter of fiscal year 2013, the Company announced a restructuring plan to modify its manufacturing strategy and lower operating expenses in order to align its cost structure with business conditions. As part of the plan, the Company has incurred and expects to further incur costs recorded in asset impairment, restructuring and related charges related primarily to the following:
• | Fiscal Year 2013 El Segundo Fabrication Facility Closure Initiative |
• | Fiscal Year 2013 Newport Fabrication Facility Resizing Initiative |
• | Fiscal Year 2013 Other Cost Reduction Activities Initiative (completed in fiscal year 2013) |
The following tables summarize the total asset impairment, restructuring and related charges by initiative for fiscal years 2014 and 2013 (in thousands):
Fiscal Year Ended | |||||||||||||||
June 29, 2014 | |||||||||||||||
El Segundo Fabrication Facility Closure Initiative | Newport Fabrication Facility Resizing Initiative | Other Cost Reduction Activities Initiative | Total | ||||||||||||
Reported in asset impairment, restructuring and related charges: | |||||||||||||||
Asset impairment | $ | — | $ | — | $ | — | $ | — | |||||||
Severance and workforce reduction costs (recoveries) | (20 | ) | 141 | — | 121 | ||||||||||
Decommissioning costs | — | 383 | — | 383 | |||||||||||
Relocation and re-qualification costs | 4 | 5,130 | — | 5,134 | |||||||||||
Total asset impairment, restructuring and related charges | $ | (16 | ) | $ | 5,654 | $ | — | $ | 5,638 | ||||||
83
INTERNATIONAL RECTIFIER CORPORATION AND SUBSIDIARIES
NOTES TO CONSOLIDATED FINANCIAL STATEMENTS (CONTINUED)
10. Asset Impairment, Restructuring and Related Charges (Recoveries) (Continued)
Fiscal Year Ended | |||||||||||||||
June 30, 2013 | |||||||||||||||
El Segundo Fabrication Facility Closure Initiative | Newport Fabrication Facility Resizing Initiative | Other Cost Reduction Activities Initiative | Total | ||||||||||||
Reported in asset impairment, restructuring and related charges: | |||||||||||||||
Asset impairment | $ | 178 | $ | 675 | $ | 1,062 | $ | 1,915 | |||||||
Severance and workforce reduction costs | 5,875 | 597 | 5,417 | 11,889 | |||||||||||
Decommissioning costs | — | 79 | — | 79 | |||||||||||
Relocation and re-qualification costs | 398 | 2,715 | — | 3,113 | |||||||||||
Total asset impairment, restructuring and related charges | $ | 6,451 | $ | 4,066 | $ | 6,479 | $ | 16,996 | |||||||
In addition to the amounts in the tables above, $2.1 million and $2.0 million of other charges related to the restructuring initiatives were recorded in cost of sales during the fiscal years ended June 29, 2014 and June 30, 2013, respectively. These charges, which were for accelerated depreciation and inventory write-downs, are not classifiable as restructuring costs, and were therefore recorded in cost of sales.
The following table summarizes changes in the Company's restructuring related accruals related to its fiscal year 2013 initiatives for the fiscal years ended June 29, 2014 and June 30, 2013, which are included in accrued salaries, wages, and benefits on the balance sheet (in thousands):
El Segundo Fabrication Facility Closure Initiative | Newport Fabrication Facility Resizing Initiative | Other Cost Reduction Activities Initiative | Total | ||||||||||||
Accrued severance and workforce reduction costs at June 24, 2012 | $ | — | $ | — | $ | — | $ | — | |||||||
Accrued during the period and charged to asset impairment, restructuring and related charges | 5,875 | 597 | 5,417 | 11,889 | |||||||||||
Costs paid during the period | $ | (5,678 | ) | $ | (597 | ) | $ | (5,417 | ) | $ | (11,692 | ) | |||
Accrued severance and workforce reduction costs June 30, 2013 | 197 | — | — | 197 | |||||||||||
Accrued (recovered) during the period and charged to asset impairment, restructuring and related charges | $ | (20 | ) | $ | 141 | $ | — | $ | 121 | ||||||
Costs paid during the period | (120 | ) | (141 | ) | — | (261 | ) | ||||||||
Accrued severance and workforce reduction costs June 29, 2014 | $ | 57 | $ | — | $ | — | $ | 57 | |||||||
El Segundo Fabrication Facility Closure Initiative
During fiscal year 2013, the Company adopted a restructuring plan and closed its El Segundo wafer fabrication facility in the third quarter of fiscal year 2013. During the fiscal year ended June 29, 2014, the Company incurred de minimis asset impairment, restructuring and related charges. During the fiscal year ended June 30, 2013, the company incurred $6.5 million of asset impairment, restructuring and related charges. No further expenses are expected to be incurred related to this initiative.
In addition to the restructuring charges above, during the fiscal year ended June 30, 2013, the Company recorded $1.5 million of other charges related to the restructuring initiative in cost of sales. These other charges, which were for accelerated depreciation and inventory write-downs, are not classifiable as restructuring costs, and affected the ESP reporting segment. The Company recorded no such charges during the fiscal year ended June 29, 2014.
84
INTERNATIONAL RECTIFIER CORPORATION AND SUBSIDIARIES
NOTES TO CONSOLIDATED FINANCIAL STATEMENTS (CONTINUED)
10. Asset Impairment, Restructuring and Related Charges (Recoveries) (Continued)
During the fiscal years ended June 29, 2014 and June 30, 2013, cash payments for this initiative were $0.1 million and $6.1 million, respectively, and are estimated to be approximately $0.1 million in fiscal year 2015.
In addition, the Company estimates it will make total cash expenditures of $2.5 million for the decontamination and restoration of this fabrication facility. These costs were previously considered as part of the asset impairment of the El Segundo Fabrication Facility recorded in the fourth quarter of fiscal year 2012, and are not anticipated to result in additional restructuring charges.
Newport, Wales Fabrication Facility Resizing Initiative
During fiscal year 2013, the Company adopted a restructuring plan to resize its wafer fabrication facility in Newport, Wales in several phases. The Company currently expects the resizing to be completed by the middle of calendar year 2015. During the fiscal years ended June 29, 2014 and June 30, 2013, the Company incurred $5.7 million and $4.1 million, respectively, of asset impairment, restructuring and related charges. In connection with the plan, the Company estimates total pre-tax costs of approximately $16.3 million. These consist of approximately $0.7 million of asset impairment costs, $2.6 million of severance and workforce reduction costs, $4.4 million of decommissioning costs, and $8.6 million of relocation and re-qualification costs. In addition to the restructuring charges above, during the fiscal years ended June 29, 2014 and June 30, 2013, the Company recorded $2.1 million and $0.5 million, respectively, of other charges related to the restructuring initiative in cost of sales. These other charges, which were for accelerated depreciation, are not classifiable as restructuring costs.
During the fiscal years ended June 29, 2014 and June 30, 2013, cash payments for this initiative were $5.7 million and $3.4 million, respectively, and are estimated to be approximately $6.6 million in fiscal year 2015.
Other Cost Reduction Activities Initiative (completed in fiscal year 2013)
During fiscal year 2013, the Company completed all actions for this initiative to reduce (i) capacity at manufacturing facilities in Mexico, California, and Arizona, and (ii) administrative and research and development costs around the world. As part of the plan, the Company incurred $5.4 million of severance and workforce reduction costs in fiscal year 2013. During the fiscal year ended June 30, 2013, severance and workforce reduction costs included $3.0 million related to manufacturing functions, $1.1 million for general and administrative functions, and $1.3 million for research and development functions.
As part of these efforts, during the fiscal year ended June 30, 2013, the Company also incurred $1.1 million of asset impairment costs for the planned disposition of certain manufacturing equipment related to its manufacturing facility in Mexico. During the fiscal year ended June 30, 2013, cash payments for this initiative were $5.4 million.
11. Segment Information
The Company reports in six segments which correspond to the way the Company manages its business and interacts with customers. These reportable segments, which correspond to operating segments include:
Power Management Devices (“PMD”) - The PMD segment provides high performance power MOSFETs
with the widest range of packages up to 250V within the power management semiconductor industry for a range of applications including power supply, data processing, telecommunications, industrial, and commercial battery-powered systems. Key products used by the PMD segment include Trench HEXFET®MOSFETs, Discrete HEXFET®MOSFETs, Dual HEXFET®MOSFETs, FETKY®s, and DirectFET®s.
Energy Saving Products (“ESP”) - The ESP segment provides integrated design platforms that enable our customers to add energy-conserving features to help achieve lower operating energy and manufacturing costs. The integrated design platforms incorporate silicon packaging technology to help improve system performance. The ESP segment’s primary market applications include motor control appliances, industrial automation, lighting and display, audio and video. The ESP segment’s key products include analog HVICs and IGBT platforms, digital control ICs and IRAM integrated power modules. The ESP segment’s iMotion platform targets the growing trend towards variable speed motors in the appliance market.
85
INTERNATIONAL RECTIFIER CORPORATION AND SUBSIDIARIES
NOTES TO CONSOLIDATED FINANCIAL STATEMENTS (CONTINUED)
11. Segment Information (Continued)
Automotive Products (“AP”) - The AP segment provides high performance and energy saving solutions for a broad variety of automotive systems, ranging from typical 12V power net applications up to 1200V hybrid electric vehicle applications. The Company's automotive expertise includes supplying products for various automotive applications including AC and DC motor drives of all power classes, actuator drivers, automotive lighting (such as high intensity discharge lamps), direct fuel injection for diesel and gasoline engines, hybrid electric vehicle power train and peripheral systems for micro, mild, full and plug-in hybrids for electric vehicles, as well as for body electronic systems like glow plugs, Positive Temperature Coefficient (“PTC”) heaters, electric power steering, fuel pumps, Heating Ventilation and Air Conditioning (“HVAC”) and rear wipers. The Company's automotive product designs are used in solutions, integrated circuits (“ASICs”) and standard parts (“ASSPs”) and generic high volume products for multiple original equipment manufacturer (“OEM”) platform usage. The AP segment's key products include HVICs, intelligent power switch ICs, power MOSFETs including DirectFET®, IGBTs, Diodes and advanced power modules.
Enterprise Power (“EP”) – The EP segment provides high performance analog and digital end-to-end power solutions for servers, storage, routers, switches, infrastructure equipment, graphic cards, and gaming consoles. IR offers a broad portfolio of power management system products that deliver benchmark power density, efficiency and performance. The EPBU segment's key products include CHiL digital PWM controllers, PowIRstagesTM, SupIRBuckTM, DirectFET® discretes, iPOWIR® voltage regulators, and Low voltage IC's. The large and growing server market has placed an emphasis and premium on digital control, telemetry, power density, efficiency and performance. The Company sees this trend increasing in other EP segment target applications. The Company offers a broad portfolio of digital and analog power management solutions that deliver benchmark power density, efficiency and performance. The EP segment's key products include our DirectFET® discrete products, CHiL digital PWM controllers, power monitoring products, XPhase®, SupIRBuckTM, iPOWIR® voltage regulators, Low voltage ICs, and PowIRstagesTM.
HiRel - The HiRel segment provides high-reliability power components and sub-assemblies designed to address power management requirements in mission critical applications including satellites and space exploration vehicles, military hardware, and other high reliability applications such as commercial aircraft, undersea telecommunications, and oil drilling in heavy industry, as well as products used in biomedical applications. Our HiRel segment has a legacy of more than thirty years of experience in many of these applications, has developed strategic relationships with major system integrators worldwide and has the knowledge, technology and processes required to meet the requirements of customers in the high-reliability markets. The HiRel segment's key products include our RAD-Hard discretes, RAD-Hard ICs, power management modules, DC-DC converters, High Temperature converters, and Energy Storage Systems.
Intellectual Property (“IP”) - The IP segment includes revenues from the sale of the Company’s technologies and manufacturing process know-how, in addition to the operating results of the Company’s patent licensing and settlements of claims brought against third parties. The Company continues, from time to time, to seek opportunistic licensing arrangements that it believes are consistent with its business strategy.
The Company does not allocate assets, sales and marketing, information systems, finance and administrative costs and asset impairment, restructuring and related charges to the operating segments, as these are not meaningful statistics to the Chief Executive Officer ("CEO") in making resource allocation decisions or in evaluating performance of the operating segments. Because operating segments are generally defined by the products they design and sell, they do not make sales to each other.
The Company does not directly allocate assets to its operating segments, nor does the CEO evaluate operating segments using discrete asset information. However, depreciation and amortization related to the manufacturing of goods is included in gross profit for the segments as part of manufacturing overhead. Due to the Company’s methodology for cost build up at the product level, it is impractical to determine the amount of depreciation and amortization included in each segment’s gross profit.
The Company’s “Customer Segments” as referred to herein includes its PMD, ESP, AP, EP and HiRel reporting segments.
86
INTERNATIONAL RECTIFIER CORPORATION AND SUBSIDIARIES
NOTES TO CONSOLIDATED FINANCIAL STATEMENTS (CONTINUED)
11. Segment Information (Continued)
For the fiscal years ended June 29, 2014, June 30, 2013 and June 24, 2012, revenues and gross margin by reportable segments were as follows (in thousands, except percentages):
June 29, 2014 | June 30, 2013 | June 24, 2012 | |||||||||||||||||||||||||||
Business Segment | Revenues | Percentage of Total | Gross Margin | Revenues | Percentage of Total | Gross Margin | Revenues | Percentage of Total | Gross Margin | ||||||||||||||||||||
PMD | $ | 411,967 | 37.2 | % | 31.4 | % | $ | 367,762 | 37.6 | % | 21.7 | % | $ | 367,913 | 35.0 | % | 22.8 | % | |||||||||||
ESP | 209,450 | 18.9 | 31.1 | 176,386 | 18.1 | 15.3 | 243,340 | 23.2 | 34.9 | ||||||||||||||||||||
AP | 149,646 | 13.5 | 29.5 | 124,695 | 12.8 | 17.7 | 113,353 | 10.8 | 22.3 | ||||||||||||||||||||
EP | 133,947 | 12.1 | 41.1 | 116,302 | 11.9 | 32.5 | 132,164 | 12.6 | 34.7 | ||||||||||||||||||||
HiRel | 200,412 | 18.1 | 52.0 | 188,831 | 19.3 | 46.7 | 192,229 | 18.3 | 51.2 | ||||||||||||||||||||
Customer segments total | 1,105,422 | 99.9 | 36.0 | 973,976 | 99.7 | 26.2 | 1,048,999 | 99.8 | 32.3 | ||||||||||||||||||||
IP | 1,149 | 0.1 | 100.0 | 3,059 | 0.3 | 78.4 | 1,589 | 0.2 | 100.0 | ||||||||||||||||||||
Consolidated total | $ | 1,106,571 | 100.0 | % | 36.1 | % | $ | 977,035 | 100.0 | % | 26.3 | % | $ | 1,050,588 | 100.0 | % | 32.4 | % | |||||||||||
Geographic information for the fiscal years ended June 29, 2014, June 30, 2013 and June 24, 2012 is presented below (in thousands):
Fiscal Year Ended | |||||||||||
June 29, 2014 | June 30, 2013 | June 24, 2012 | |||||||||
Revenues from Unaffiliated Customers | |||||||||||
United States | $ | 251,810 | $ | 229,092 | $ | 231,497 | |||||
Asia | 646,102 | 562,886 | 613,706 | ||||||||
Europe | 207,510 | 181,998 | 203,796 | ||||||||
Subtotal | 1,105,422 | 973,976 | 1,048,999 | ||||||||
Royalties (unallocated) | 1,149 | 3,059 | 1,589 | ||||||||
Total | $ | 1,106,571 | $ | 977,035 | $ | 1,050,588 | |||||
Long-lived Assets | |||||||||||
United States | $ | 200,653 | $ | 239,240 | $ | 268,664 | |||||
Asia | 101,794 | 95,564 | 79,249 | ||||||||
Europe | 133,294 | 147,622 | 178,294 | ||||||||
Total | $ | 435,741 | $ | 482,426 | $ | 526,207 | |||||
Revenues from unaffiliated customers are based on the location in which the sale originated. Long-lived assets include all long-term assets excluding long-term investments, restricted cash, long-term deferred income taxes, goodwill and acquisition‑related intangibles.
During the fiscal year ended June 29, 2014, June 30, 2013, and June 24, 2012, sales to two of the Company’s distribution customers, Weikeng International and Arrow Electronics, were approximately 14.3 percent and 10.7 percent, respectively, 12.8 percent and 10.4 percent, respectively, and 12.2 percent and 10.9 percent, respectively, of consolidated revenues.
87
INTERNATIONAL RECTIFIER CORPORATION AND SUBSIDIARIES
NOTES TO CONSOLIDATED FINANCIAL STATEMENTS (CONTINUED)
12. Income Taxes
Income (loss) before income taxes is as follows (in thousands):
Fiscal Year Ended | |||||||||||
June 29, 2014 | June 30, 2013 | June 24, 2012 | |||||||||
Domestic | $ | 32,255 | $ | (105,575 | ) | $ | (88,430 | ) | |||
Foreign | 38,731 | 28,745 | 16,623 | ||||||||
Total income (loss) before income taxes | $ | 70,986 | $ | (76,830 | ) | $ | (71,807 | ) | |||
The provision for (benefit from) income taxes is as follows (in thousands):
Fiscal Year Ended | |||||||||||
June 29, 2014 | June 30, 2013 | June 24, 2012 | |||||||||
Current income taxes: | |||||||||||
Domestic | $ | 5,118 | $ | 1,735 | $ | 5,971 | |||||
Foreign | (203 | ) | (1,129 | ) | 2,455 | ||||||
$ | 4,915 | $ | 606 | $ | 8,426 | ||||||
Deferred income taxes: | |||||||||||
Domestic | $ | 1,150 | $ | 352 | $ | 5,728 | |||||
Foreign | 6,188 | 11,032 | (30,911 | ) | |||||||
7,338 | 11,384 | (25,183 | ) | ||||||||
Total provision (benefit) | $ | 12,253 | $ | 11,990 | $ | (16,757 | ) | ||||
The tax benefit from stock-based compensation reduced current or future income taxes payable for the fiscal years ended June 29, 2014, June 30, 2013, and June 24, 2012 by $0.2 million, $0.0 million, and $1.7 million, respectively.
The Company’s effective tax rate on pretax income (loss) differs from the U.S. federal statutory tax rate as follows:
Fiscal Year Ended | ||||||||
June 29, 2014 | June 30, 2013 | June 24, 2012 | ||||||
Statutory tax rate | 35.0 | % | (35.0 | )% | (35.0 | )% | ||
State taxes, net of federal benefit | 0.4 | (0.1 | ) | 14.6 | ||||
Change in valuation allowance | (25.5 | ) | 58.2 | (38.9 | ) | |||
Multijurisdictional taxation * | 4.6 | (8.4 | ) | (1.5 | ) | |||
Actual and deemed foreign dividends | 7.2 | 2.7 | 3.7 | |||||
Foreign tax credit | (5.2 | ) | (4.8 | ) | (7.0 | ) | ||
Research and development credit | 1.4 | (8.0 | ) | (2.6 | ) | |||
Uncertain tax positions | (12.6 | ) | (6.6 | ) | 3.7 | |||
Tax rate changes | 6.1 | 9.7 | 0.7 | |||||
Withholding tax | 3.7 | 4.3 | 6.7 | |||||
Stock based compensation | 0.9 | 2.4 | 2.5 | |||||
Goodwill impairment | — | — | 30.1 | |||||
Other, net | 1.3 | 1.2 | (0.3 | ) | ||||
Effective tax rate (benefit) | 17.3 | % | 15.6 | % | (23.3 | )% | ||
* Provision for income taxes related to multijurisdictional taxation for the fiscal year ended June 29, 2014 included an expense of $2.9 million for the correction of an immaterial prior period error related to a deferred tax charge.
88
INTERNATIONAL RECTIFIER CORPORATION AND SUBSIDIARIES
NOTES TO CONSOLIDATED FINANCIAL STATEMENTS (CONTINUED)
12. Income Taxes (Continued)
Net Deferred Tax Assets (Liabilities)
The major components of the net deferred tax assets (liabilities) as of June 29, 2014 and June 30, 2013 were as follows (in thousands):
June 29, 2014 | June 30, 2013 | ||||||
Deferred tax assets: | |||||||
Accrued expenses | $ | 13,857 | $ | 13,514 | |||
Accrued compensation | 17,187 | 18,011 | |||||
Property, plant and equipment | 5,104 | 8,499 | |||||
Losses carryforward | 76,045 | 108,921 | |||||
Research and experimental credits | 50,385 | 51,015 | |||||
Other tax credits | 40,719 | 36,745 | |||||
Other | 740 | 636 | |||||
Total deferred tax assets | 204,037 | 237,341 | |||||
Valuation allowance | (167,428 | ) | (204,233 | ) | |||
Deferred tax liabilities: | |||||||
Unrealized gain on securities | (7,122 | ) | (2,992 | ) | |||
Prepaid expenses | (899 | ) | (1,347 | ) | |||
Undistributed foreign earnings | (3,425 | ) | — | ||||
Total deferred tax liabilities | (11,446 | ) | (4,339 | ) | |||
Net deferred tax assets | $ | 25,163 | $ | 28,769 | |||
Realization of deferred tax assets is dependent upon generating sufficient future taxable income, carryback of losses, offsetting deferred tax liabilities, and the availability of tax planning strategies. Based on the consideration of all available evidence using a “more-likely-than-not” standard, the Company has determined that the valuation allowance established against its United States ("U.S.") federal and California deferred tax assets should remain in place as of the end of fiscal year 2014. The valuation allowance for U.S. federal tax assets relates to beginning of the year balances of reserves that were established during fiscal year 2009. In addition, the Company determined during fiscal year 2012 that its California deferred tax assets should be fully reserved with a valuation allowance.
With respect to the U.S. valuation allowance, cumulative pre-tax losses for the current and prior two years in the Company's U.S. federal consolidated group constitute significant negative evidence, and therefore, positive evidence of equal or greater significance is needed at a minimum to overcome that negative evidence before a tax benefit is recognized for deductible temporary differences and loss carryforwards. The Company examined the four sources of income that allow the realization of deferred tax assets. These sources are carrybacks, reversals of existing temporary differences, tax planning strategies, and future taxable income exclusive of reversals of existing temporary differences. As of fiscal year 2014, the Company determined that none of the sources of income were meaningful enough to warrant the release of the U.S. federal and state valuation allowance.
The Company's fiscal years' 2009, 2012, and 2013 California pretax losses constitute negative evidence, which resulted in recording a $10.3 million valuation allowance in 2012 against all of the Company's California deferred tax assets. The pattern of losses for California makes the reliance on forecasted earnings a source of income which should not be used, and the carryback of losses is not permitted in California. Based upon this analysis, the Company concluded that a full valuation allowance was required in fiscal year 2014.
89
INTERNATIONAL RECTIFIER CORPORATION AND SUBSIDIARIES
NOTES TO CONSOLIDATED FINANCIAL STATEMENTS (CONTINUED)
12. Income Taxes (Continued)
During fiscal year 2011, the Company recorded a deferred charge of $14.6 million in connection with the reduction of its deferred tax assets in the U.K. which is offset by the associated valuation allowance, and both balances were reduced by $0.8 million. As of June 29, 2014, as a result of the amortization of the deferred charge reported during the fiscal year, the charge and the related valuation allowance were reduced to $5.0 million and $2.2 million, respectively.
During the third quarter of fiscal year 2012, the Company recorded a deferred charge of $16.5 million and valuation allowance of $13.4 million related to certain intercompany transactions which reduced its deferred tax assets and associated valuation allowance in the U.S. by $3.1 million. As of June 29, 2014, as a result of the amortization of the deferred charge reported during the fiscal year, the charge and the related valuation allowance were reduced to $10.2 million and $8.3 million, respectively.
Statutory Rate Reduction in U.K.
During the three months ended September 23, 2012, the statutory tax rate in the U.K. was reduced from 24 percent to 23 percent, effective April 1, 2013. The Company reported a $3.2 million one-time expense due to the rate reduction on the deferred tax assets in the U.K. as a discrete item in the provision for income taxes. On July 17, 2013, the U.K. enacted the Finance Act of 2013 that further reduced tax rates from 23 percent to 21 percent in April 2014, and eventually to 20 percent in April 2015. The Company reported a $4.2 million one-time expense due to the rate reduction on the deferred tax assets in the U.K. as a discrete item in the provision for income taxes during Q1 of 2014.
Singapore Tax Holiday
During fiscal year 2011, the Company was granted certain incentives by the Singapore Economic Development Board. As a result, the Company started to operate under a tax holiday in Singapore, effective from December 27, 2010 through December 26, 2020. The tax holiday was amended in the fourth fiscal quarter of 2013, resulting in an extension of the incentive through December 26, 2022. The tax holiday is conditional upon the Company meeting certain employment and investment thresholds. The impact of the Singapore tax holiday provided no benefit in the 2012, 2013 and 2014 fiscal years.
The Company operated in multiple foreign jurisdictions with lower statutory tax rates than the U.S., and its operation in Singapore has the most significant impact on the Company's effective tax rate.
Reconciliation of Unrecognized Tax Benefits
A reconciliation of unrecognized tax benefits from June 24, 2012 to June 29, 2014 is as follows (in thousands):
Beginning balances at June 24, 2012 | $ | 48,876 | |
Increases for positions taken in current year | 2,262 | ||
Increases for positions taken in a prior year | 2,395 | ||
Decreases for positions taken in a current year | — | ||
Decreases for positions taken in a prior year | (3,953 | ) | |
Decreases for settlements with taxing authorities | — | ||
Decreases for lapses in the applicable statute of limitation | (4,895 | ) | |
Unrecognized tax benefits at June 30, 2013 | 44,685 | ||
Increases for positions taken in current year | 1,760 | ||
Increases for positions taken in a prior year | 4,069 | ||
Decreases for positions taken in a current year | (212 | ) | |
Decreases for positions taken in a prior year | (1,532 | ) | |
Decreases for settlements with taxing authorities | (552 | ) | |
Decreases for lapses in the applicable statute of limitation | (6,479 | ) | |
Unrecognized tax benefits at June 29, 2014 | $ | 41,739 | |
90
INTERNATIONAL RECTIFIER CORPORATION AND SUBSIDIARIES
NOTES TO CONSOLIDATED FINANCIAL STATEMENTS (CONTINUED)
12. Income Taxes (Continued)
The Company recognizes certain tax liabilities for anticipated tax audit findings in the United States and other tax jurisdictions based on our estimate of whether, and the extent to which additional taxes would be due. If the audit findings result in actual taxes owed more or less than what was anticipated, income tax expense would be increased or decreased, accordingly, in the period of the determination.
As of June 29, 2014, the liability for income tax associated with uncertain tax positions was $3.2 million. If recognized, the liability associated with uncertain tax positions would result in a benefit to income taxes on the consolidated statement of operations which would reduce the Company's future effective tax rate. For fiscal year 2014, $9.1 million of the decrease to uncertain tax positions impacted the effective tax rate. The remaining change in the uncertain tax positions was recorded against long-term deferred tax assets that receive a full valuation allowance and foreign currency translation adjustments.
The Company's policy is to recognize interest and penalties related to uncertain tax positions as a component of income tax expense. The Company had accrued interest and penalties related to uncertain tax positions as of June 29, 2014 and June 30, 2013 of $1.2 million and $3.9 million, respectively. The change in interest and penalties during fiscal year 2014 of $2.7 million was primarily the result of lapses in the statutes of limitation offset by the accrual of additional interest. The decrease in interest and penalties of $0.5 million during fiscal year 2013 was primarily the result of lapses in the statutes of limitation and accrual of interest related to outstanding uncertain tax positions.
The Company’s uncertain tax positions are expected to decrease by an estimated $0.8 million during the next twelve months primarily due to a significant decrease from lapses of statutes of limitation in certain foreign tax jurisdictions partially offset by increases in uncertain tax positions in certain domestic and foreign tax jurisdictions.
The Company anticipates that there will be other changes to the unrecognized tax benefit associated with uncertain tax positions due to the expiration of statutes of limitation, audit settlements and other changes in reserves. However, due to the uncertainty regarding the timing of these events, a current estimate of the range of other changes that may occur within the next twelve months cannot be made.
Tax Jurisdiction
The Company's major tax jurisdictions are U.S. Federal, California, Japan, United Kingdom, Singapore, Germany, Hong Kong and Mexico. In the ordinary course of business, the Company is subject to examination by taxing authorities. As of June 30, 2013, the Company is no longer subject to: (i) U.S. federal income tax examinations for years before the fiscal year ended June 28, 2009; (ii) California income tax examinations before the fiscal year ended June 29, 2008, subject to fiscal years 2000 through 2005 being currently under appeal and being subject to reopening for examination by the Franchise Tax Board; (iii) Japan income tax examinations before the fiscal year ended July 1, 2009; (iv) United Kingdom before the fiscal year ended June 24, 2013; (v) Germany tax examinations before the fiscal year ended June 27, 2010; (vi) Singapore tax examination before fiscal year 2011; (vii) Mexico tax examination for the assessment year ended December 31, 2009; and (viii) Hong Kong profits tax examinations before the assessment year ended March 31, 2010.
As a matter of course, the Company is regularly audited by various taxing authorities. Unfavorable settlement of any particular issue may require the use of cash. Favorable resolution may be recognized as a reduction to the effective tax rate in the year of resolution. The Company's interest and penalties associated with income taxes are included in both accrued income taxes and long-term income taxes payable, as appropriate.
Operating Loss Carryforwards and Tax Credits
The Company has federal, state and foreign net operating loss carryforwards. The federal net operating loss of $127.7 million will expire in 2029 through 2033, and the California net operating loss of $118.2 million will expire in 2015 through 2033. The foreign net operating losses of $33.3 million have no expiration. The Company has foreign tax credits of $62.7 million that will expire from 2019 through 2024. The Company also has federal research credits of $23.3 million that will expire in 2026 through 2033, California research credits of $41.5 million that have no expiration, Massachusetts research credits of $1.2 million that will expire in 2023 through 2029, and Massachusetts investment tax credits of $0.4 million that will expire in 2023 through 2029.
91
INTERNATIONAL RECTIFIER CORPORATION AND SUBSIDIARIES
NOTES TO CONSOLIDATED FINANCIAL STATEMENTS (CONTINUED)
12. Income Taxes (Continued)
Pursuant to Sections 382 and 383 of the U.S. Internal Revenue Code, the utilization of operating loss carryforward and other tax attributes may be subject to limitations if certain ownership changes occur during a three-year testing period. The Company does not believe an ownership change has occurred as of June 29, 2014 that would limit the Company's utilization of any operating loss carryforward or other tax attributes.
Undistributed Earnings
As of June 29, 2014, U.S. income taxes have been provided on approximately $9.3 million of undistributed earnings of foreign subsidiaries. The amount represents excess cash held by foreign subsidiaries not required for working capital, capital expenditures and other needs of the foreign subsidiaries. The remaining unrepatriated foreign earnings of $118.1 million are considered to be invested indefinitely.
13. Net Income (Loss) per Common Share
The table below provides a computation of basic and diluted earnings per share for the fiscal years ended June 29, 2014, June 30, 2013 and June 24, 2012 (in thousands, except per share amounts):
Fiscal Year Ended | |||||||||||
June 29, 2014 | June 30, 2013 | June 24, 2012 | |||||||||
Net income (loss) | $ | 58,733 | $ | (88,820 | ) | $ | (55,050 | ) | |||
Net income (loss) per common share - basic | |||||||||||
Basic weighted average common shares outstanding | 71,108 | 69,385 | 69,270 | ||||||||
Basic net income (loss) per common share | $ | 0.83 | $ | (1.28 | ) | $ | (0.79 | ) | |||
Net income (loss) per common share - diluted | |||||||||||
Basic weighted average common shares outstanding | 71,108 | 69,385 | 69,270 | ||||||||
Effect of dilutive securities – stock options and RSU’s | 1,441 | — | — | ||||||||
Diluted weighted average common shares outstanding | 72,549 | 69,385 | 69,270 | ||||||||
Diluted net income (loss) per common share | $ | 0.81 | $ | (1.28 | ) | $ | (0.79 | ) | |||
For the fiscal years ended June 29, 2014, June 30, 2013, and June 24, 2012, 0.0 million, 0.9 million, and 0.6 million of common stock equivalents were anti-dilutive and were not included in the computation of diluted earnings per share for these periods, respectively. In addition, for the fiscal years ended June 29, 2014, June 30, 2013, and June 24, 2012, 0.7 million, 1.2 million, and 0.8 million, respectively, of contingently issuable RSUs for which all necessary conditions had not been met were not included in the computation of diluted earnings per share.
14. Commitments and Contingencies
The Company has operating leases for the use of certain real estate and equipment. Substantially all operating leases are non-cancelable or cancelable only by the payment of penalties. All lease payments are based on the lapse of time but include, in some cases, payments for insurance, maintenance and property taxes. There are no purchase options on operating leases at favorable terms, but most real estate leases have one or more renewal options. Certain leases on real estate are subject to annual escalations for increases in utilities and property taxes.
The Company has entered into several operating lease agreements, some of which contain provisions for future rent increases, rent free periods, or periods in which rent payments are reduced (abated). For each lease, the total amount of rental payments due over the lease term is being charged to rent expense on a straight-line method over the term of the lease. The difference between rent expense recorded and the amount paid is credited or charged to “accrued rent expense,” which is included in “Other current liabilities” in the accompanying consolidated balance sheet.
92
INTERNATIONAL RECTIFIER CORPORATION AND SUBSIDIARIES
NOTES TO CONSOLIDATED FINANCIAL STATEMENTS (CONTINUED)
14. Commitments and Contingencies (Continued)
Total rental expense on all operating leases totaled $11.8 million, $11.6 million, and $11.2 million for the fiscal years ended June 29, 2014, June 30, 2013, and June 24, 2012, respectively. The Company had outstanding purchase commitments for capital expenditures of approximately $15.7 million at June 29, 2014. The Company had no material capital lease obligations as of June 29, 2014.
As of June 29, 2014, minimum rental commitments by period under operating leases are as follows (in thousands):
Fiscal Year | |||||||||||||||||||||||||||
Total | 2015 | 2016 | 2017 | 2018 | 2019 | 2020 and thereafter | |||||||||||||||||||||
Minimum fixed rentals | $ | 49,320 | $ | 12,393 | $ | 10,170 | $ | 7,021 | $ | 6,240 | $ | 5,988 | $ | 7,508 | |||||||||||||
During fiscal year 2012, the Company entered into an amended foundry services agreement with one of its contract manufacturers for wafer fabrication, under which the Company is entitled to purchase silicon wafers through December 31, 2017. Under the terms of the agreement, the Company advanced funds of $1.5 million against future processing charges. The advance payment is recoverable in the form of a fixed amount per wafer purchased. Any portion of the advance not recovered as of December 31, 2017 will be forfeited. As of June 29, 2014, the Company believes that the $1.2 million outstanding balance of the advance will be recovered.
15. Environmental Matters
General. Federal, state, local and foreign laws and regulations impose various restrictions and controls on the storage, use and discharge of certain materials, chemicals and gases used in semiconductor manufacturing processes, and on the operation of the Company's facilities and equipment. The Company believes it uses reasonable efforts to maintain a system of compliance and controls for these laws and regulations. Despite its efforts and controls, from time to time, issues may arise with respect to these matters. Additionally, under some of these laws and regulations, the Company could be held financially responsible for remedial measures if properties are contaminated or if waste is sent to a landfill or recycling facility that becomes contaminated. Also, the Company may be subject to common law claims if released substances damage or harm third parties. The Company cannot make assurances that changes in environmental laws and regulations will not require additional investments in capital equipment and the implementation of additional compliance programs in the future, which could have a material adverse effect on the Company's results of operations, financial position or cash flows, as could any failure by or violation of the Company to comply with any prior, current or future environmental laws and regulations.
Angeles Chemical Company, Inc. et al. v. Omega Chemical PRP Group, LLC et al. In November 2007, the Company was named as one of approximately 100 defendants in Angeles Chemical Company, Inc. et al. v. Omega Chemical PRP Group, LLC et al., No. EDCV07-1471 (TJH) (JWJx) (C.D. Cal.) (the "Angeles Case"). Angeles Chemical Company, Inc. and related entities ("Plaintiffs") own or operate a facility (the "Angeles Facility") down gradient of the Omega Chemical Superfund Site (the "Omega Site") in Whittier, California. Numerous parties, including the Company, allegedly disposed of wastes at the Omega Site. Plaintiffs claim that contaminants from the Omega Site migrated in groundwater from the Omega Site to the Angeles Facility, thereby causing damage to the Angeles Facility. In addition, they claim that the United States Environmental Protection Agency ("EPA") considers them to be responsible for the groundwater plume near the Angeles Facility, which Plaintiffs contend was caused by disposal activities at the Omega Site. Plaintiffs filed claims based on the Comprehensive Environmental Response, Compensation and Liability Act ("CERCLA"), nuisance and trespass, and also seek declaratory relief. Plaintiffs seek to require the defendants to investigate and clean-up the contamination and to recover damages. The case has been stayed by the court pending the Environmental Protection Agency's completion of its remedial investigation. The Company previously entered into a settlement with other parties associated with the Omega Site pursuant to which the Company paid money in exchange for an agreement to defend and indemnify the Company with regard to certain environmental claims (the "Omega Indemnification"). The Company believes that much, if not all, of the risks associated with the Angeles Case should be covered by the Omega Indemnification, and otherwise intends to vigorously defend against all of the claims asserted by the various parties in respect of the property.
93
INTERNATIONAL RECTIFIER CORPORATION AND SUBSIDIARIES
NOTES TO CONSOLIDATED FINANCIAL STATEMENTS (CONTINUED)
15. Environmental Matters (Continued)
Rachelle Laboratories, Inc. Rachelle Laboratories, Inc. ("Rachelle"), a subsidiary of the Company that discontinued operations in 1986, was named a potentially responsible party ("PRP") in connection with the investigation by the EPA of the disposal of allegedly hazardous substances at a major superfund site in Monterey Park, California ("OII Site"). The Company has taken the position that none of the wastes generated by Rachelle were hazardous. Counsel for Rachelle received a letter dated August 2001 from the U.S. Department of Justice, directed to all or substantially all PRPs for the OII Site, offering to settle claims against such parties for all work performed through and including the final remedy for the OII Site. The offer required a payment from Rachelle in the amount of approximately $9.3 million in order to take advantage of the settlement. Rachelle did not accept the offer. The Company intends to vigorously defend against all of the claims asserted in respect of the property and the Company cannot determine at this time what, if any, further regulatory actions may be taken in the future in respect of Rachelle.
Other Environmental Matters. In addition to the foregoing, the Company has been either named as a potentially responsible party or made voluntary disclosures, as described below:
(i)In February 2012, the Company notified the California Department of Toxic Substances Control (“DTSC”) and local districts that the Company’s Temecula, California manufacturing facility previously shipped wastes for disposal offsite as non-hazardous wastes which may have contained fluoride levels considered to constitute hazardous waste under California regulations. The Company has received a notice of minor administrative violation from one of the local districts without the assessment of any penalty, but the Company has not as yet been contacted by all applicable regulatory authorities, including the DTSC;
(ii)In December 2010, the Company received notice from a property owner asserting that the Company was a potentially responsible party for the remediation of hazardous materials allegedly discovered by that owner at a property in El Segundo, California, formerly owned and leased by the Company. The Company had also been contacted by the DTSC in connection with that 2010 notice. In July 2012, the Company received notice from a subsequent owner of that property seeking reimbursement of investigation costs and increased construction costs allegedly resulting from the presence of hazardous materials at the property;
(iii)At around the time of the Company’s 2007 divestiture of the Company’s Power Control Systems business to Vishay Intertechnology, Inc., the Company advised appropriate governmental authorities of the discovery of certain chemical compounds in the groundwater underneath one of the Company's manufacturing plants in Italy that was subject to the sale. In 2010, in response to inquiries from the authority requiring a confirmation of intention to proceed with a plan of characterization in relation to the site, the Company restated its position that it had not committed to take further action. In October 2012, local authorities contacted the current site owner suggesting that additional groundwater testing should take place and that testing took place at the end of 2012. The Company has not been contacted by applicable authorities since that testing; and
(iv)In June 2001, the Company received a letter from a law firm representing UDT Sensors, Inc. ("UDT") relating to environmental contamination (chlorinated solvents such as trichlorethene) purportedly found in UDT's properties in Hawthorne, California. The letter alleges that the Company operated a manufacturing business at that location in the 1970's and/or 1980's and that it may have liability in connection with the claimed contamination.
The Company intends to defend vigorously each of the foregoing matters, and to the extent the matter involves regulatory agencies it is too early to assess what, if any, penalties may be asserted or actions taken in the future.
16. Litigation
Angeles. v. Omega. See Note 15, "Environmental Matters."
In addition to the above, the Company is involved in certain legal matters that arise in the ordinary course of business. The Company intends to pursue its rights and defend against any claims brought by third parties vigorously. However, because of the nature and inherent uncertainties of litigation, should the outcome of these actions be unfavorable, the Company's business, financial condition, results of operations or cash flows could be materially and adversely affected.
94
INTERNATIONAL RECTIFIER CORPORATION AND SUBSIDIARIES
NOTES TO CONSOLIDATED FINANCIAL STATEMENTS (CONTINUED)
17. Quarterly Financial Data (Unaudited)
The following table sets forth a summary of the Company’s unaudited quarterly financial information for each of the four quarters in the fiscal year ended June 29, 2014 (in thousands, except per share data):
Three Months Ended | |||||||||||||||
September 29, 2013 | December 29, 2013 | March 30, 2014 | June 29, 2014 | ||||||||||||
Revenues | $ | 269,750 | $ | 269,965 | $ | 269,269 | $ | 297,587 | |||||||
Cost of sales | 174,439 | 172,000 | 169,135 | 191,789 | |||||||||||
Gross profit | 95,311 | 97,965 | 100,134 | 105,798 | |||||||||||
Selling, general and administrative expense | 43,750 | 44,727 | 45,025 | 48,816 | |||||||||||
Research and development expense | 32,173 | 32,786 | 32,710 | 33,179 | |||||||||||
Amortization of acquisition‑related intangible assets | 1,630 | 1,630 | 1,605 | 1,555 | |||||||||||
Asset impairment, restructuring and related charges | 1,402 | 1,015 | 1,624 | 1,597 | |||||||||||
Operating income | 16,356 | 17,807 | 19,170 | 20,651 | |||||||||||
Other expense, net | 762 | 1,510 | 451 | 251 | |||||||||||
Interest expense (income), net | (1 | ) | 7 | 28 | (10 | ) | |||||||||
Income before income taxes | 15,595 | 16,290 | 18,691 | 20,410 | |||||||||||
Provision for (benefit from) income taxes * | 6,872 | (1,631 | ) | (449 | ) | 7,461 | |||||||||
Net income | $ | 8,723 | $ | 17,921 | $ | 19,140 | $ | 12,949 | |||||||
Net income per common share: | |||||||||||||||
Basic | $ | 0.12 | $ | 0.25 | $ | 0.27 | $ | 0.18 | |||||||
Diluted | $ | 0.12 | $ | 0.25 | $ | 0.26 | $ | 0.18 | |||||||
Weighted average common shares outstanding: | |||||||||||||||
Basic | 70,830 | 71,147 | 71,248 | 71,208 | |||||||||||
Diluted | 71,664 | 72,163 | 72,728 | 72,874 | |||||||||||
* For further information, see "Note 12: Income Taxes".
95
INTERNATIONAL RECTIFIER CORPORATION AND SUBSIDIARIES
NOTES TO CONSOLIDATED FINANCIAL STATEMENTS (CONTINUED)
17. Quarterly Financial Data (Unaudited) (Continued)
The following table sets forth a summary of the Company’s unaudited quarterly financial information for each of the four quarters in the fiscal year ended June 30, 2013 (in thousands, except per share data):
Three Months Ended | |||||||||||||||
September 23, 2012 | December 23, 2012 | March 24, 2013 | June 30, 2013 | ||||||||||||
Revenues | $ | 252,492 | $ | 223,822 | $ | 224,268 | $ | 276,453 | |||||||
Cost of sales | 181,951 | 174,733 | 169,860 | 193,386 | |||||||||||
Gross profit | 70,541 | 49,089 | 54,408 | 83,067 | |||||||||||
Selling, general and administrative expense | 47,295 | 45,083 | 43,020 | 46,348 | |||||||||||
Research and development expense | 33,449 | 32,125 | 28,876 | 32,643 | |||||||||||
Amortization of acquisition‑related intangible assets | 1,680 | 1,680 | 1,663 | 1,630 | |||||||||||
Asset impairment, restructuring and related charges | 8,966 | 4,941 | 880 | 2,209 | |||||||||||
Operating income (loss) | (20,849 | ) | (34,740 | ) | (20,031 | ) | 237 | ||||||||
Other expense (income), net | 1,008 | 411 | (450 | ) | 421 | ||||||||||
Interest expense (income), net | (32 | ) | (8 | ) | 64 | 33 | |||||||||
Income (loss) before income taxes | (21,825 | ) | (35,143 | ) | (19,645 | ) | (217 | ) | |||||||
Provision for (benefit from) income taxes | 6,950 | (2,421 | ) | 1,600 | 5,861 | ||||||||||
Net income (loss) | $ | (28,775 | ) | $ | (32,722 | ) | $ | (21,245 | ) | $ | (6,078 | ) | |||
Net income (loss) per common share: | |||||||||||||||
Basic | $ | (0.42 | ) | $ | (0.47 | ) | $ | (0.31 | ) | $ | (0.09 | ) | |||
Diluted | $ | (0.42 | ) | $ | (0.47 | ) | $ | (0.31 | ) | $ | (0.09 | ) | |||
Weighted average common shares outstanding: | |||||||||||||||
Basic | 69,283 | 69,144 | 69,273 | 69,785 | |||||||||||
Diluted | 69,283 | 69,144 | 69,273 | 69,785 | |||||||||||
96
INTERNATIONAL RECTIFIER CORPORATION AND SUBSIDIARIES
NOTES TO CONSOLIDATED FINANCIAL STATEMENTS (CONTINUED)
18. Subsequent Events
On August 20, 2014, the Company entered into an agreement and plan of merger pursuant to which Infineon Technologies AG (“Infineon”) will acquire the Company (the "Merger"). If the Merger is consummated, each share of the Company's common stock issued and outstanding immediately prior to the Merger will be converted into the right to receive $40 in cash, without interest, on the terms and subject to the conditions set forth in the merger agreement.
The Company is subject to certain restrictions on our business activities under the merger agreement, such as limits on capital expenditures, loans and investments, that apply during the period from August 20, 2014 through the consummation of the Merger.
The completion of the Merger is subject to customary closing conditions, including approval of the merger agreement by a majority of the outstanding shares of the Company’s common stock, the absence of certain laws or orders that restrain, enjoin, or otherwise prohibit the merger, and receipt of certain regulatory approvals, including the expiration or early termination of the waiting period under the Hart-Scott-Rodino Antitrust Improvements Act of 1974, as amended, receipt of certain foreign antitrust approvals, and clearance by the Committee on Foreign Investment in the United States.
The Company may terminate the merger agreement to enter into an agreement relating to an alternative acquisition proposal from a third party if the Board determines that such proposal is superior to the Merger, provided that the Company complies with the procedures in the merger agreement, including the obligation to pay Infineon a $70 million break-up fee. The merger agreement may also be terminated by Infineon if we take other specified actions which are inconsistent with supporting the Merger. In the event of a termination of the merger agreement in these instances, the Company may be required to pay Infineon a $70 million break-up fee.
In addition, if the merger agreement is terminated by either party due to a failure to close the Merger by January 20, 2015 (provided under certain circumstances such date may be extended to June 22, 2015) or because there is an order or law relating to antitrust matters which prohibits consummation of the Merger, and in each case all conditions to closing have been (or are capable of being) satisfied other than those relating to regulatory approvals under applicable antitrust laws, Infineon will be obligated to pay a $70 million reverse break-up fee to the Company.
The merger agreement also provides that upon termination of the merger agreement as a result of the failure of our stockholders to approve the merger agreement, the Company will reimburse Infineon $15 million in respect of its transaction related expenses.
Although there can be no assurance, the Company expects the acquisition to close late in the calendar year 2014 or early in the calendar year 2015 subject to regulatory approval.
97
ITEM 9. CHANGES IN AND DISAGREEMENTS WITH ACCOUNTANTS ON ACCOUNTING AND FINANCIAL DISCLOSURE
None.
ITEM 9A. CONTROLS AND PROCEDURES
Evaluation of Disclosure Controls and Procedures
Disclosure controls and procedures (as defined in Rules 13a-15(e) and 15d-15(e) under the Securities Exchange Act of 1934 (the “Exchange Act”)) are designed to ensure that information required to be disclosed in reports we file or submit under the Exchange Act is recorded, processed, summarized and reported within the time periods specified in the rules and forms of the SEC and that such information is accumulated and communicated to our management, including the Chief Executive Officer (“CEO”) and Chief Financial Officer (“CFO”), to allow timely decisions regarding required disclosures.
Our management, under the supervision and with the participation of our CEO and CFO, evaluated the effectiveness of the design and operation of our disclosure controls and procedures as of June 29, 2014. Based upon this evaluation, our CEO and CFO concluded that, as of June 29, 2014, our disclosure controls and procedures were effective.
Changes in Internal Control Over Financial Reporting
“Internal control over financial reporting” is a process designed by, or under the supervision of, our CEO and CFO, and effected by our board of directors, management, and other personnel, to provide reasonable assurance regarding the reliability of financial reporting and the preparation of consolidated financial statements for external purposes in accordance with generally accepted accounting principles.
During the fiscal quarter ended June 29, 2014 there were no changes in internal control over financial reporting that have materially affected, or are reasonably likely to materially affect, our internal control over financial reporting.
Management's Report on Internal Control Over Financial Reporting
Management is responsible for establishing and maintaining adequate internal control over financial reporting as such term is defined in Rules 13a-15(f) and 15d-15(f) under the Exchange Act. Internal control over financial reporting is a process designed to provide reasonable assurance regarding the reliability of financial reporting and the preparation of consolidated financial statements for external purposes in accordance with generally accepted accounting principles.
Under the supervision and with the participation of our management, including our CEO and CFO, management conducted an assessment of our internal control over financial reporting as of June 29, 2014. In making this assessment, management used the criteria set forth in Internal Control-Integrated Framework (1992) issued by the Committee of Sponsoring Organizations of the Treadway Commission. Based on this assessment, management has determined that the Company’s internal control over financial reporting, as of June 29, 2014, was effective.
Management’s assessment of the effectiveness of the Company’s internal control over financial reporting as of June 29, 2014, has been audited by the Company’s independent register public accounting firm, as stated in their report appearing on page 100.
98
Inherent Limitations Over Internal Controls
We do not expect that our disclosure controls and procedures or our internal control over financial reporting will prevent or detect all errors. A control system, no matter how well designed and operated, can provide only reasonable, not absolute, assurance that the control system's objectives will be met. Further, the design of a control system must acknowledge the fact that there are resource constraints and the benefits of controls must be considered relative to their costs. These inherent limitations include the realities that judgments in decision making can be faulty and that breakdowns can occur because of simple error or mistake. Controls can also be circumvented by the deliberate acts of one or more persons. The design of any system of controls is based, in part, upon certain assumptions about the likelihood of future events and there can be no assurance that any design will succeed in achieving its stated goals under all potential future conditions. Over time, controls may become inadequate because of changes in conditions or deterioration in the degree of compliance with associated policies or procedures. Because of the inherent limitations in a cost-effective control system, misstatements due to error may occur and not be detected.
99
REPORT OF INDEPENDENT REGISTERED PUBLIC ACCOUNTING FIRM
The Board of Directors and Stockholders of International Rectifier Corporation and Subsidiaries
We have audited International Rectifier Corporation and Subsidiaries’ internal control over financial reporting as of June 29, 2014, based on criteria established in Internal Control-Integrated Framework issued by the Committee of Sponsoring Organizations of the Treadway Commission (1992 framework) (the COSO criteria). International Rectifier Corporation and Subsidiaries’ management is responsible for maintaining effective internal control over financial reporting, and for its assessment of the effectiveness of internal control over financial reporting included in the accompanying Management’s Report on Internal Control Over Financial Reporting. Our responsibility is to express an opinion on the company’s internal control over financial reporting based on our audit.
We conducted our audit in accordance with the standards of the Public Company Accounting Oversight Board (United States). Those standards require that we plan and perform the audit to obtain reasonable assurance about whether effective internal control over financial reporting was maintained in all material respects. Our audit included obtaining an understanding of internal control over financial reporting, assessing the risk that a material weakness exists, testing and evaluating the design and operating effectiveness of internal control based on the assessed risk, and performing such other procedures as we considered necessary in the circumstances. We believe that our audit provides a reasonable basis for our opinion.
A company’s internal control over financial reporting is a process designed to provide reasonable assurance regarding the reliability of financial reporting and the preparation of financial statements for external purposes in accordance with generally accepted accounting principles. A company’s internal control over financial reporting includes those policies and procedures that (1) pertain to the maintenance of records that, in reasonable detail, accurately and fairly reflect the transactions and dispositions of the assets of the company; (2) provide reasonable assurance that transactions are recorded as necessary to permit preparation of financial statements in accordance with generally accepted accounting principles, and that receipts and expenditures of the company are being made only in accordance with authorizations of management and directors of the company; and (3) provide reasonable assurance regarding prevention or timely detection of unauthorized acquisition, use, or disposition of the company’s assets that could have a material effect on the financial statements.
Because of its inherent limitations, internal control over financial reporting may not prevent or detect misstatements. Also, projections of any evaluation of effectiveness to future periods are subject to the risk that controls may become inadequate because of changes in conditions, or that the degree of compliance with the policies or procedures may deteriorate.
In our opinion, International Rectifier Corporation and Subsidiaries maintained, in all material respects, effective internal control over financial reporting as of June 29, 2014, based on the COSO criteria.
We also have audited, in accordance with the standards of the Public Company Accounting Oversight Board (United States), the 2014 consolidated financial statements of International Rectifier Corporation and Subsidiaries and our report dated August 20, 2014 expressed an unqualified opinion thereon.
/s/ Ernst & Young LLP
Los Angeles, California
August 20, 2014
100
ITEM 9B. OTHER INFORMATION
None.
101
PART III
Certain information required by Part III is omitted from this Annual Report on Form 10-K and is incorporated herein by reference to the definitive proxy statement with respect to our 2014 Annual Meeting of Stockholders (the “Proxy Statement”), which we intend to file with the Securities and Exchange Commission no later than 120 days after the end of the fiscal year covered by this Report.
ITEM 10. DIRECTORS, EXECUTIVE OFFICERS AND CORPORATE GOVERNANCE
Information regarding executive officers of the Company is included in Part I under the caption “Executive Officers of the Registrant.” Other information required by this Item will appear in the Proxy Statement under the headings “Proposal No.1 Election of Directors,” “Information Concerning Nominees and Members of the Board,” "Director Compensation," "Summary Structure of the Board-Committees of the Board," “Committees of the Board,” “Compensation Committee Report,” “Report of the Audit Committee,” “Compensation Committee Interlocks and Insider Participation,” “Section 16(a) Beneficial Ownership Reporting Compliance,” “Corporate Governance,” "Code of Ethics for Directors, Officers and Employees," "Stockholder Proposals and Nominations for 2014 Annual Meeting," and “Executive Officers of the Company,” which sections are incorporated herein by reference.
The Board has adopted a Code of Ethics that applies to all directors, officers and employees, including the Company’s principal executive officer, principal financial officer and principal accounting officer, as required by the SEC. The Company’s Code of Ethics can be found on the Corporate Governance portion of the Investor Relations section of our website, http://www.irf.com and are also available at no charge upon written request to the Corporate Secretary, International Rectifier Corporation, 101 North Sepulveda Boulevard, El Segundo, CA 90245. We intend to satisfy the disclosure requirement under Item 5.05 of Form 8-K regarding an amendment to, or a waiver from, a provision of our Code of Ethics that applies to our principal executive officer, principal financial officer or principal accounting officer by posting such information within four business days of any such amendment or waiver on our website, http://www.irf.com — select the "Investor Relations" link and then the "Corporate Governance" link.
ITEM 11. EXECUTIVE COMPENSATION
Information required by this Item will appear in the Proxy Statement under the headings “Executive Compensation,” “Compensation Discussion and Analysis,” “Compensation Committee Report,” “Compensation Committee Interlocks and Insider Participation,” “Compensation Policies and Practices as They Relate to the Company’s Risk Management,” and “Corporate Governance,” which sections are incorporated herein by reference.
102
ITEM 12. SECURITY OWNERSHIP OF CERTAIN BENEFICIAL OWNERS AND MANAGEMENT AND RELATED STOCKHOLDER MATTERS
Securities Authorized for Issuance Under Equity Compensation Plans
The following table provides information as of June 29, 2014 about the Company’s Common Stock that may be issued to employees or members of the Company’s Board of Directors under the Company’s existing Equity Compensation Plans.
EQUITY COMPENSATION PLAN INFORMATION
Plan Category | Number of securities to be issued upon exercise of outstanding options, warrants and rights (a) | Weighted‑average exercise price of outstanding options, warrants and rights (b) | Number of securities remaining available for future issuance under equity compensation plans (excluding securities reflected in column (a)) (c) | |||||||||
Equity compensation plans approved by security holders | 4,098,080 | (1) | $ | 21.42 | (2) | 5,031,469 | (3) | |||||
Equity compensation plans not approved by security holders | 1,000 | (4) | 34.27 | — | ||||||||
Total | 4,099,080 | $ | 21.47 | 5,031,469 | ||||||||
(1) | Of these shares, 145,498 and 127,877 were subject to options then outstanding under the International Rectifier Corporation 2011 Performance Incentive Plan (the “2011 Plan”), and the amended and restated 2000 Incentive Plan (“2000 Plan”), respectively, and 3,817,659 and 7,046 were subject to restricted stock unit awards then outstanding under the 2011 Plan and the 2000 Plan, respectively. |
(2) | This weighted-average exercise price does not reflect the 3,824,705 shares that will be issued upon the payment of outstanding restricted stock units. |
(3) | This figure consists of 4,275,927 shares available for future issuance under the 2011 Plan, and 755,542 shares available for issuance under the amended and restated 1984 Employee Stock Participation Plan (“ESPP”); however, participation in the ESPP has been suspended since April 2007. |
(4) | This figure represents 1,000 options then outstanding under the 1997 Employee Stock Incentive Plan (the “1997 Plan”). The 1997 Plan was originally approved by our Board of Directors on November 24, 1997 and expired on November 22, 2004. No new awards are permitted under the 1997 Plan and, therefore, no shares remain available for grant under the plan. However, options issued and outstanding under the plan remain exercisable in accordance with the plan terms. None of the stock options that we granted under the plan are incentive stock options under Section 422 of the Internal Revenue Code and the term of each outstanding option granted under the plan does not exceed ten years from the date of its grant. There are no unvested restricted stock or restricted stock unit awards outstanding under the plan. |
The Compensation Committee of our Board of Directors administers the 1997 Plan. The Compensation Committee has broad discretionary authority to construe and interpret the plan. The Compensation Committee may, through the terms of the award or otherwise, accelerate the vesting, extend the exercisability, term or vesting schedule, or change the price or previously imposed terms and conditions on an option or restricted stock award on the occurrence of specified events as set forth in the plan including, without limitation, upon a change of control of the Company (as defined in the plan) or in other circumstances or events as deemed appropriate by the Compensation Committee. The Compensation Committee right to amend awards granted under the plan is subject to the holder's consent as to any amendment that deprives the holder in any material respects of his or her rights under the award, except in specified circumstances as set forth in the plan. No award, or any interest in an award, may be transferred in any manner other than by will or the laws of descent and distribution, or incapacity, without the approval of the Compensation Committee.
Other information required by this Item will appear in the Proxy Statement under the heading “Security Ownership of Principal Stockholders and Management,” which section is incorporated herein by reference.
103
ITEM 13. CERTAIN RELATIONSHIPS AND RELATED TRANSACTIONS, AND DIRECTOR INDEPENDENCE
Information required by this Item will appear in the Proxy Statement under the headings “Corporate Governance,” “Related Party Transaction Policy - Certain Relationships and Related Transactions,” and "Independent Directors," which sections are incorporated herein by reference.
ITEM 14. PRINCIPAL ACCOUNTING FEES AND SERVICES
Information required by this Item will appear in the Proxy Statement under the heading "Report of the Audit Committee," and the proposal for “Ratification of Appointment of Independent Registered Public Accounting Firm,” and the heading “Independent Registered Public Accounting Firm Fees,” which sections are incorporated herein by reference.
104
PART IV
ITEM 15. EXHIBITS AND FINANCIAL STATEMENT SCHEDULES
a. | Financial Statements and Financial Statement Schedule being filed as part of this report are listed in the index on page 51. |
b. | Exhibits filed as part of this report are listed on the Exhibit Index on page 109. |
EXHIBIT INDEX
Incorporated By Reference:
Exhibit No. | Item | Document |
2(a) | Agreement of Plan of Merger, dated February 24, 2011, by and among International Rectifier Corporation, Cancun Merger Corp., CHiL Semiconductor Corporation, solely for purposes of specified Sections, the Equityholders party thereto and, solely for the purposes of specified Sections, Shareholder Representative Services LLC, solely in its capacity as the Equityholders’ representative | Form 8-K filed February 25, 2011, with the Securities and Exchange Commission. (Exhibit 2.1) |
3(a) | Certificate of Incorporation of the Company, as amended through July 19, 2004 | Registration Statement on Form S-8 filed with the Securities and Exchange Commission on July 19, 2004, Registration No. 333-117489. (Exhibit 3.1) |
3(b) | Amendment to Certificate of Incorporation, dated November 13, 2009 | Form 10-Q for the quarterly period ended December 27, 2009, filed with the Securities and Exchange Commission on February 3, 2010. (Exhibit 3.2) |
3(c) | Bylaws as Amended and Restated | Form 8-K filed August 19, 2013, with the Securities and Exchange Commission. (Exhibit 3.1) |
4(a) | Description of the Company's Common Stock | Form 8-A filed with the Securities and Exchange Commission on June 17, 1985 |
4(b) | Preferred Share Purchase Rights | Form 8-A filed with the Securities and Exchange Commission on August 21, 1996 |
10(a)* | International Rectifier Corporation 1997 Employee Stock Incentive Plan | Registration Statement on Form S-8 filed with the Securities and Exchange Commission on February 26, 1998, Registration No. 33-46901. (Exhibit 4.1) |
10(b)* | Amendment to International Rectifier Corporation 1997 Employee Stock Incentive Plan, dated October 1, 2001 | Registration Statement on Form S-8 filed with the Securities and Exchange Commission on October 1, 2001, Registration No. 333-70560. (Exhibit 4.2) |
10(c)* | International Rectifier Corporation Amended and Restated Stock Incentive Plan of 1992 | Registration Statement on Form S-8 filed with the Securities and Exchange Commission on December 2, 1997, Registration No. 33-41363. (Exhibit 4.1) |
10(d)* | International Rectifier Corporation Retirement Savings Plan | Registration Statement on Form S-8 filed with the Securities and Exchange Commission on June 24, 1998, Registration No. 33-57575. (Exhibits 4.1, 4.2 and 4.3) |
10(e)* | Amendment to International Rectifier Corporation Amended and Restated Stock Incentive Plan of 1992 effective as of February 20, 2002 | Form 10-Q—for the quarterly period ended March 31, 2001, filed with the Securities and Exchange Commission on May 16, 2001. (Exhibit 2) |
10(f)* | International Rectifier Corporation 2000 Stock Incentive Plan | Registration Statement on Form S-8 filed with the Securities and Exchange Commission on May 18, 2000, Registration Number 333-37308. (Exhibit 4) |
10(g)* | International Rectifier Corporation 1997 Stock Incentive Plan | Registration Statement on Form S-8 filed with the Securities and Exchange Commission on October 1, 2001, Registration Number 333-41904. (Exhibit 4.1) |
10(h)* | International Rectifier Corporation 2000 Incentive Plan (Amended and Restated as of September 28, 2000) | Proxy Statement on Schedule 14A filed with the Securities and Exchange Commission on October 12, 2000. (Annex to Proxy Statement) |
10(i)* | International Rectifier Corporation Restated 1984 Stock Participation Plan | Proxy Statement on Schedule 14A filed with the Securities and Exchange Commission on October 10, 2003. (Annex A) |
10(j)* | Amended and Restated International Rectifier Corporation 2000 Stock Incentive Plan, effective as of November 24, 2004. | Form 8-K dated November 24, 2004, filed with the Securities and Exchange Commission. (Exhibit 99.1) |
10(k)* | International Rectifier Corporation Deferred Compensation Plan | Form 10-Q—for the quarterly period ended September 30, 2004, filed with the Securities and Exchange Commission on November 12, 2004. (Exhibit 10.1) |
105
10(l)* | Master Trust Agreement, effective as of November 11, 2004, between International Rectifier Corporation, a Delaware corporation, and Wilmington Trust Company, a Delaware corporation, as trustee, to evidence the master trust to be established pursuant to the International Rectifier Corporation Deferred Compensation Plan | Form 10-Q—for the quarterly period ended September 30, 2004, filed with the Securities and Exchange Commission on November 12, 2004. (Exhibit 10.2) |
10(m)* | Amended and Restated 1984 Stock Participation Plan, Effective as of November 21, 2005 | Form 8-K dated November 21, 2005, filed with the Securities and Exchange Commission on November 21, 2005. (Exhibit 99.1) |
10(n) | Master Purchase Agreement, dated November 8, 2006, by and between International Rectifier Corporation and Vishay Intertechnology, Inc. with respect to all outstanding capital stock of the Target Companies and certain of the assets of International Rectifier Corporation | Form 8-K, dated November 14, 2006, filed with the Securities Exchange Commission. (Exhibit 2.1) |
10(o) | First Amendment to Master Purchase Agreement and Stock Purchase Agreement, dated January 23, 2007, by and between International Rectifier Corporation and Vishay International, Inc. | Form 10-Q—for the quarterly period ended December 31, 2006, dated February 9, 2007, filed with the Securities and Exchange Commission. (Exhibit 10.1) |
10(p) | Amendment and Waiver Agreement, dated March 30, 2007, by and among Vishay Intertechnology, Inc., Siliconix Inc., V.I.E.C., Ltd., Vishay Europe GmbH, Siliconix Semiconductor, Inc., acting in its function ( hoedanigheid ) as managing partner ( beherend vennoot ) of the limited partnership ( commanditaire vennootschap ), Siliconix Technology C.V., Vishay Americas, Inc., Vishay Asia Logistics Pte. Ltd., International Rectifier Corporation, International Rectifier Southeast Asia Pte, Ltd. and IR International Holdings China, Inc. | Form 8-K, dated April 9, 2007, filed with the Securities Exchange Commission. (Exhibit 2.1) |
10(q) | Technology License Agreement, dated April 1, 2007, by and between International Rectifier Corporation and Vishay Intertechnology, Inc. | Form 8-K, dated April 9, 2007, filed with the Securities Exchange Commission. (Exhibit 99.1) |
10(r) | Technology License Back Agreement, dated April 1, 2007, by and between Vishay Intertechnology, Inc. and International Rectifier Corporation | Form 8-K, dated April 9, 2007, filed with the Securities Exchange Commission. (Exhibit 99.2) |
10(s) | Trademark License Agreement, dated April 1, 2007, by and between International Rectifier Corporation and Vishay Intertechnology, Inc. | Form 8-K, dated April 9, 2007, filed with the Securities Exchange Commission. (Exhibit 99.3) |
10(t) | IR Trademark License Agreement, dated April 1, 2007, by and between International Rectifier Corporation and Vishay Intertechnology, Inc. | Form 8-K, dated April 9, 2007, filed with the Securities Exchange Commission. (Exhibit 99.4) |
10(u) | Separation Agreement, dated October 2, 2007, by and between International Rectifier Corporation and Alex Lidow | Form 8-K, dated October 2, 2007, filed with the Securities Exchange Commission. (Exhibit 99.1) |
10(v)* | Form of Key Employee Severance Agreement | Form 8-K, dated November 2, 2007, filed with the Securities Exchange Commission. (Exhibit 10.4) |
10(w)* | Employment Agreement, dated February 6, 2008, by and between International Rectifier Corporation and Oleg Khaykin | Form 8-K, dated February 11, 2008, filed with the Securities Exchange Commission. (Exhibit 10.1) |
10(x)* | Offer Letter, dated March 31, 2008, by and between International Rectifier Corporation and Michael Barrow | Form 8-K, dated April 3, 2008, filed with the Securities Exchange Commission. (Exhibit 10.1) |
10(y)* | Agreement, dated April 17, 2008, by and between International Rectifier Corporation and Eric Lidow | Form 8-K, dated April 21, 2008, filed with the Securities Exchange Commission. (Exhibit 10.1) |
10(z) | Form of Indemnification Agreement approved for directors and executive officers of International Rectifier Corporation | Current Report on Form 8-K, dated September 15, 2008, filed with the Securities and Exchange Commission. (Exhibit 10.1) |
10(aa)* | Offer Letter executed September 21, 2008 between International Rectifier Corporation and Ilan Daskal | Current Report on Form 8-K, dated September 21, 2008, filed with the Securities and Exchange Commission. (Exhibit 10.1) |
10(bb)* | Severance Agreement executed September 21, 2008 between International Rectifier Corporation and Ilan Daskal | Current Report on Form 8-K, dated September 21, 2008, filed with the Securities and Exchange Commission. (Exhibit 10.2) |
10(cc)* | Form of Non-Employee Director Option Agreement | Form 10-Q—for the quarterly period ended September 30, 2008, filed with the Securities and Exchange Commission on November 6, 2008. (Exhibit 10.6) |
10(dd)* | Amendment to Employment Agreement, dated December 29, 2008, entered into between International Rectifier Corporation and Oleg Khaykin | Form 10-Q—for the quarterly period ended December 31, 2008, filed with the Securities and Exchange Commission on February 6, 2009. (Exhibit 10.6) |
10(ee)* | RSU Award Agreement, dated August 6, 2008, entered into between International Rectifier Corporation and Oleg Khaykin | Form 10-Q—for the quarterly period ended December 31, 2008, filed with the Securities and Exchange Commission on February 6, 2009. (Exhibit 10.7) |
10(ff)* | Option Award Agreement, dated August 6, 2008, entered into between International Rectifier Corporation and Oleg Khaykin | Form 10-Q—for the quarterly period ended December 31, 2008, filed with the Securities and Exchange Commission on February 6, 2009. (Exhibit 10.8) |
10(gg)* | Amendment to Offer Letter, dated December 26, 2008, entered into between International Rectifier Corporation and Ilan Daskal | Form 10-Q—for the quarterly period ended December 31, 2008, filed with the Securities and Exchange Commission on February 6, 2009. (Exhibit 10.9) |
10(hh)* | Amendment to Severance Agreement, dated December 26, 2008, entered into between International Rectifier Corporation and Ilan Daskal | Form 10-Q—for the quarterly period ended December 31, 2008, filed with the Securities and Exchange Commission on February 6, 2009. (Exhibit 10.10) |
10(ii)* | Amendment to Offer Letter, dated December 26, 2008, entered into between International Rectifier Corporation and Michael Barrow | Form 10-Q—for the quarterly period ended December 31, 2008, filed with the Securities and Exchange Commission on February 6, 2009. (Exhibit 10.13) |
106
10(jj)* | Amendment to Severance Agreement, dated December 26, 2008, entered into between International Rectifier Corporation and Michael Barrow | Form 10-Q—for the quarterly period ended December 31, 2008, filed with the Securities and Exchange Commission on February 6, 2009. (Exhibit 10.14) |
10(kk)* | Revised form of RSU Award Agreement under International Rectifier Corporation's 2000 Incentive Plan (Amended and Restated as of November 22, 2004) | Form 10-Q—for the quarterly period ended December 31, 2008, filed with the Securities and Exchange Commission on February 6, 2009. (Exhibit 10.15) |
10(ll)* | 2000 Incentive Plan Revised Non Employee Director Option Form | Form 10-Q—for the quarterly period ended March 29, 2009, filed with the Securities and Exchange Commission on May 8, 2009. (Exhibit 10.9) |
10(mm)* | International Rectifier Corporation Deferred Compensation Plan, Amended and Restated as of January 1, 2009 | Form 10-Q—for the quarterly period ended March 29, 2009, filed with the Securities and Exchange Commission on May 8, 2009. (Exhibit 10.10) |
10(nn)* | Offer Letter Agreement, dated May 16, 2008, between International Rectifier Corporation and Timothy Bixler | Form 10-K, dated August 27, 2009, filed with the Securities Exchange Commission. (Exhibit 10.1) |
10(oo)* | Severance Agreement, dated June 8, 2008, between International Rectifier Corporation and Timothy Bixler | Form 10-K, dated August 27, 2009, filed with the Securities Exchange Commission. (Exhibit 10.2) |
10(pp)* | Amendment to Offer Letter, dated December 26, 2008, between International Rectifier Corporation and Timothy Bixler | Form 10-K, dated August 27, 2009, filed with the Securities Exchange Commission. (Exhibit 10.3) |
10(qq)* | Amendment to Severance Agreement, dated December 26, 2008, between International Rectifier Corporation and Timothy Bixler | Form 10-K, dated August 27, 2009, filed with the Securities Exchange Commission. (Exhibit 10.4) |
10(rr)* | Offer Letter Amendment, dated November 5, 2009, between the Company and Ilan Daskal | Form 10-Q, dated November 6, 2009, filed with the Securities Exchange Commission. (Exhibit 10.1) |
10(ss) | Confidential Settlement Agreement and Release, Amendment No. 1 to Transition Buy Back Die Supply Agreement, Amendment No. 2 to Technology License Agreement, Amendment No. 7 to Master Purchase Agreement, and Amendment No. 3 to Asset Purchase Agreement, dated June 25, 2009, by and between Vishay Intertechnology, Inc. and International Rectifier Corporation | Form 8-K/A, filed July 29, 2009, with the Securities Exchange Commission. (Exhibit 10.1) |
10(tt)* | Form of Performance Based Restricted Stock Unit Award Agreement for Messrs. Khaykin and Barrow | Form 8-K, filed November 13, 2009, with the Securities Exchange Commission. (Exhibit 10.1) |
10(uu)* | Form of Performance Based Restricted Stock Unit Award Agreement for Messrs. Daskal and Bixler | Form 8-K, filed November 13, 2009, with the Securities Exchange Commission. (Exhibit 10.2) |
10(vv)* | Form of Performance Based Restricted Stock Unit Award Agreement for Alternative Performance Condition | Form 10-Q, dated February 3, 2010, filed with the Securities Exchange Commission. (Exhibit 10.3) |
10(ww)* | Form of Performance Based Restricted Stock Unit Award Agreement for Double Performance Condition | Form 10-Q, dated February 3, 2010, filed with the Securities Exchange Commission. (Exhibit 10.4) |
10(xx)* | Description of Compensation Arrangements for Independent Members of Board of Directors | Form 8-K, filed May 4, 2010, with the Securities Exchange Commission. (Item 1.1) |
10(yy)* | Form of Consulting Agreement, effective August 18, 2010, between International Rectifier Corporation and Dr. Jack O. Vance | Form 8-K, filed August 24, 2010, with the Securities Exchange Commission. (Exhibit 10.1) |
10(zz)* | Form of Non-Employee Director Restricted Stock Unit Agreement | Form 8-K, filed August 24, 2010, with the Securities Exchange Commission. (Exhibit 10.2) |
10(aaa)* | Form of Employee Performance-Based Restricted Stock Unit Award Agreement | Form 8-K, filed July 13, 2010, with the Securities Exchange Commission. (Exhibit 10.1) |
10(bbb)* | Form of Employee Restricted Stock Unit Award Agreement | Form 10-Q dated November 5, 2010 filed with the Securities and Exchange Commission (Exhibit 10.1) |
10(ccc)* | Updated Form of Named Officer Retention Restricted Stock Unit Award Agreement | Form 8-K filed June 24, 2011, with the Securities Exchange Commission (Exhibit 10.1) |
10(ddd)* | Updated Form of Performance Restricted Stock Unit Award Agreement | Form 8-K filed June 24, 2011, with the Securities Exchange Commission (Exhibit 10.2) |
10(eee)* | Description of Named Officer Equity Award Program | Form 8-K, filed June 24, 2011, with the Securities Exchange Commission (Item 5.2(e)) |
10(fff)* | Description of Executive Officer Cash Incentive Program for Fiscal Year 2012 | Form 8-K, filed July 26, 2011, with the Securities Exchange Commission (Item 5.2(e)) |
10(ggg)* | Description of Updated Compensation Arrangements for Independent Members of Board of Directors | Form 8-K, filed August 19, 2011, with the Securities Exchange Commission (Item 1.1) |
10(hhh)* | Description of Executive Officer Cash Incentive Program for Fiscal Year 2012 | Current Report on Form 8-K, filed July 26, 2011 with the Securities and Exchange Commission. (Item 5.2(e)) |
10(iii)* | Description of Updated Compensation Arrangements for Independent Members of Board of Directors | Current Report on Form 8-K, filed August 19, 2011 with the Securities and Exchange Commission. (Item 1.1) |
10(jjj)* | Form of Updated June 2011 Named Officer and Extended Management Team Retention Restricted Stock Unit Award Agreement | Form 10-K, dated August 22, 2011, filed with the Securities Exchange Commission. (Exhibit 10.1) |
10(kkk)* | Form of Updated June 2011 Non-Extended Management Team Retention Restricted Stock Unit Award Agreement | Form 10-K, dated August 22, 2011, filed with the Securities Exchange Commission. (Exhibit 10.2) |
10(lll)* | Form of June 2011 Performance Restricted Stock Unit Award Agreement | Form 10-K, dated August 22, 2011, filed with the Securities Exchange Commission. (Exhibit 10.3) |
107
10(mmm)* | Form of Updated August 2011 Non-Employee Director Restricted Stock Unit Award Agreement | Form 10-K, dated August 22, 2011, filed with the Securities Exchange Commission. (Exhibit 10.4) |
10(nnn)* | Amendment to Relocation Benefits between International Rectifier Corporation and Ilan Daskal dated August 18, 2011 | Form 10-K, dated August 22, 2011, filed with the Securities Exchange Commission. (Exhibit 10.5) |
10(ooo)* | International Rectifier Corporation 2011 Performance Incentive Plan | Form 8-K, filed November 14, 2011, with the Securities Exchange Commission. (Exhibit 10.1) |
10(ppp)* | Form of Stock Option Agreement (2011 Performance Incentive Plan) Effective November 11, 2011 | Form 10-Q, dated February 3, 2012, filed with the Securities Exchange Commission. (Exhibit 10.2) |
10(qqq)* | Form of Restricted Stock Unit Agreement – Extended Management Team Version (2011 Performance Incentive Plan) Effective November 11, 2011 | Form 10-Q, dated February 3, 2012, filed with the Securities Exchange Commission. (Exhibit 10.3) |
10(rrr)* | Form of Restricted Stock Unit Agreement – Non-Extended Management Team Version (2011 Performance Incentive Plan) Effective November 11, 2011 | Form 10-Q, dated February 3, 2012, filed with the Securities Exchange Commission. (Exhibit 10.4) |
10(sss)* | Form of Non-Employee Director Stock Option Agreement-2011 Performance Incentive Plan | Form 10-Q, dated May 3, 2012, filed with the Securities Exchange Commission May 4, 2012. (Exhibit 10.1) |
10(ttt)* | Form of Non-Employee Director RSU Agreement-2011 Performance Incentive Plan | Form 10-Q, dated May 3, 2012, filed with the Securities Exchange Commission May 4, 2012. (Exhibit 10.2) |
10(uuu)* | Description of Executive Officer Cash Incentive Program Performance Goals for Third and Fourth Quarter of Fiscal Year 2012 | Current Report on Form 8-K, filed February 15, 2012 with the Securities and Exchange Commission. (Item 5.2(e)) |
10(vvv)* | Description of Executive Officer Cash Incentive Program for Fiscal Year 2013 | Current Report on Form 8-K, filed June 27, 2012 with the Securities and Exchange Commission. (Item 5.2(e)) |
10(www)* | Form of Performance Restricted Stock Unit Agreement (2011 Performance Incentive Plan) Effective June 21, 2012 | Current Report on Form 8-K, filed June 27, 2012 with the Securities and Exchange Commission. (Exhibit 10.1) |
10(xxx)* | Letter Agreement, dated July 22, 2011, between International Rectifier Corporation and Adam White | Form 10-Q, dated November 1, 2012, filed with the Securities Exchange Commission November 2, 2012. (Exhibit 10.2) |
10(yyy)* | Severance Agreement, dated September 11, 2008, between International Rectifier Corporation and Adam White | Form 10-Q, dated November 1, 2012, filed with the Securities Exchange Commission November 2, 2012. (Exhibit 10.3) |
10(zzz)* | Amendment to Severance Agreement, dated December 26, 2008, between International Rectifier Corporation and Adam White | Form 10-Q, dated November 1, 2012, filed with the Securities Exchange Commission November 2, 2012. (Exhibit 10.4) |
10(aaaa)* | Credit Agreement, dated as of October 25, 2012, among International Rectifier Corporation, the Lenders named therein, and Wells Fargo Bank, National Association, as Administrative Agent, Swing Line Lender and L/C Issuer, and Wells Fargo Securities, LLC, as Lead Arranger and Sale Bookrunner | Current Report on Form 8-K, filed August 23, 2012 with the Securities Exchange Commission. (Exhibit 10.1) |
10(bbbb)* | Letter Agreement dated December 7, 2012, between International Rectifier Corporation and Gary Tanner | Current Report on Form 8-K, filed December 11, 2012 with the Securities and Exchange Commission. (Exhibit 10.1) |
10(cccc)* | Change-in-Control Severance Agreement dated December 7, 2012 between International Rectifier Corporation and Gary Tanner | Current Report on Form 8-K, filed December 11, 2012 with the Securities and Exchange Commission. (Exhibit 10.2) |
10(dddd)* | Amendment to Credit Agreement, dated as of March 25, 2013, among International Rectifier Corporation, the Lenders named therein, and Wells Fargo Bank, National Association, as Administrative Agent, Swing Line Lender and L/C Issuer, and Wells Fargo Securities, LLC, as Lead Arranger and Sale Bookrunner | Form 10-Q, dated April 29, 2013, filed with the Securities Exchange Commission April 30, 2013. (Exhibit 10.1) |
10(eeee)* | Description of Executive Officer Cash Incentive Program Performance Goals for Third and Fourth Quarter of Fiscal Year 2013 | Current Report on Form 8-K, filed February 7, 2013 with the Securities and Exchange Commission. (Item 5.2(e)) |
10(ffff)* | Description of Executive Officer Compensation | Current Report on Form 8-K, filed June 28, 2013 with the Securities and Exchange Commission. (Item 5.2(e)) |
10(iiii)* | Form of Restricted Stock Unit Agreement - Extended Management Team/Executive Officer Version (2011 Performance Incentive Plan) Effective June 27, 2013. | Annual Report on Form 10-K, filed August 20, 2013 with the Securities and Exchange Commission. (Exhibit 10.1) |
10(jjjj)* | Form of Restricted Stock Unit Agreement - Non-Extended Management Team Version (2011 Performance Incentive Plan) Effective June 27, 2013. | Annual Report on Form 10-K, filed August 20, 2013 with the Securities and Exchange Commission. (Exhibit 10.2) |
10(kkkk)* | Updated Form of Performance Restricted Stock Unit Agreement (2011 Performance Incentive Plan) Effective June 27, 2013. | Annual Report on Form 10-K, filed August 20, 2013 with the Securities and Exchange Commission. (Exhibit 10.3) |
10(llll)* | Updated Form of Supplemental Performance Restricted Stock Unit Agreement (2011 Performance Incentive Plan) Effective June 27, 2013. | Annual Report on Form 10-K, filed August 20, 2013 with the Securities and Exchange Commission. (Exhibit 10.4) |
10(mmmm)* | Description of Executive Officer Cash Incentive Program Performance Goals for Third and Fourth Quarter of Fiscal Year 2014 | Current Report on Form 8-K, filed February 6, 2014 (Item 5.2(e)) |
108
10(nnnn)* | Form of Performance Stock Unit Award Agreement for Fiscal Year 2014 | Current Report on Form 8-K, filed June 27, 2014 (Exhibit 10.1) |
10(oooo)* | Description of Executive Officer Compensation | Current Report on Form 8-K, filed June 27, 2014 (Item 5.2(e)) |
14 | Code of Ethics | Form 8-K, filed with the Securities and Exchange Commission on August 19, 2011. (Exhibit 14.1) |
* | Denotes management contract or compensatory plan or arrangement. |
Submitted Herewith:
See page 51 for an index of Financial Statements and Financial Statement Schedule being filed as part of this report.
10.1 | Offer Letter Amendment, dated August 14, 2014 between International Rectifier Corporation and Ilan Daskal. * |
10.2 | Offer Letter Amendment, dated August 14, 2014 between International Rectifier Corporation and Michael Barrow. * |
10.3 | Offer Letter Amendment, dated August 14, 2014 between International Rectifier Corporation and Adam White. * |
10.4 | Severance Agreement, dated as of August 21, 2008, by and between International Rectifier Corporation and Michael Barrow. * |
21 | List of Subsidiaries |
23.1 | Consent of Independent Registered Public Accounting Firm |
24 | Power of Attorney |
31.1 | Certification Pursuant to Rule 13a-14(a) of the Securities Exchange Act of 1934, Adopted Pursuant to Section 302 of the Sarbanes‑Oxley Act of 2002 |
31.2 | Certification Pursuant to Rule 13a-14(a) of the Securities Exchange Act of 1934, Adopted Pursuant to Section 302 of the Sarbanes‑Oxley Act of 2002 |
32.1 | Certification Pursuant to 18 U.S.C. 1350, Adopted Pursuant to Section 906 of the Sarbanes‑Oxley Act of 2002 |
32.2 | Certification Pursuant to 18 U.S.C. 1350, Adopted Pursuant to Section 906 of the Sarbanes‑Oxley Act of 2002 |
101.INS | XBRL Instance |
101.SCH | XBRL Taxonomy Extension Schema |
101.CAL | XBRL Extension Calculation |
101.LAB | XBRL Extension Labels |
101.PRE | XBRL Taxonomy Extension Presentation |
101.DEF | XBRL Taxonomy Extension Definition |
* | Denotes management contract or compensatory plan or arrangement |
109
SIGNATURES
Pursuant to the requirements of Section 13 or 15(d) of the Securities Exchange Act of 1934, the Registrant has duly caused this report to be signed on its behalf by the undersigned, thereunto duly authorized.
INTERNATIONAL RECTIFIER CORPORATION (Registrant) | |||
By: | /s/ ILAN DASKAL | ||
Date: | August 20, 2014 | Ilan Daskal | |
Chief Financial Officer (Duly Authorized Officer and Principal Financial and Accounting Officer) | |||
Pursuant to the requirements of the Securities Exchange Act of 1934, this report has been signed below by the following persons on behalf of the Registrant and in the capacities and on the dates indicated.
Signatures | Title | Date | ||||||||||||
/s/ RICHARD J. DAHL* | Chairman of the Board | August 20, 2014 | ||||||||||||
Richard J. Dahl | ||||||||||||||
/s/ OLEG KHAYKIN* | Director and Chief Executive Officer (Principal Executive Officer) | August 20, 2014 | ||||||||||||
Oleg Khaykin | ||||||||||||||
/s/ ROBERT ATTIYEH* | Director | August 20, 2014 | ||||||||||||
Robert Attiyeh | ||||||||||||||
/s/ MARY B. CRANSTON* | Director | August 20, 2014 | ||||||||||||
Mary B. Cranston | ||||||||||||||
/s/ DWIGHT W. DECKER* | Director | August 20, 2014 | ||||||||||||
Dr. Dwight W. Decker | ||||||||||||||
/s/ DIDIER HIRSCH* | Director | August 20, 2014 | ||||||||||||
Didier Hirsch | ||||||||||||||
/s/ THOMAS A. LACEY* | Director | August 20, 2014 | ||||||||||||
Thomas A. Lacey | ||||||||||||||
/s/ JAMES D. PLUMMER* | Director | August 20, 2014 | ||||||||||||
James D. Plummer | ||||||||||||||
/s/ BARBARA L. RAMBO* | Director | August 20, 2014 | ||||||||||||
Barbara L. Rambo | ||||||||||||||
/s/ ROCHUS E. VOGT* | Director | August 20, 2014 | ||||||||||||
Rochus E. Vogt | ||||||||||||||
*By: /s/ ILAN DASKAL | August 20, 2014 | |||||||||||||
Ilan Daskal Attorney-in-fact | ||||||||||||||
110
SCHEDULE II
INTERNATIONAL RECTIFIER CORPORATION AND SUBSIDIARIES
VALUATION AND QUALIFYING ACCOUNTS
For the Fiscal Years Ended June 29, 2014, June 30, 2013, and June 24, 2012
(In thousands)
Balance at beginning of year | Additions (reductions) charged to costs and expenses(1) | Deductions (2) | Balance at end of year | ||||||||||||
2014 | |||||||||||||||
Accounts receivable allowance | $ | 915 | $ | 690 | $ | (1,253 | ) | $ | 352 | ||||||
Deferred income tax valuation allowance | 204,233 | — | (36,805 | ) | 167,428 | ||||||||||
2013 | |||||||||||||||
Accounts receivable allowance | $ | 2,066 | $ | 179 | $ | (1,330 | ) | $ | 915 | ||||||
Deferred income tax valuation allowance | 161,517 | 42,716 | — | 204,233 | |||||||||||
2012 | |||||||||||||||
Accounts receivable allowance | $ | 2,424 | $ | 1,606 | $ | (1,964 | ) | $ | 2,066 | ||||||
Deferred income tax valuation allowance | 182,563 | 83 | (21,129 | ) | 161,517 | ||||||||||
(1) | Additions charged to costs and expenses relating to accounts receivable are net of reductions to estimated reserves; additions of deferred income tax valuation allowance relate to increased deferred tax assets. |
(2) | Deductions relating to accounts receivable allowance include uncollectable accounts written-off, net of recoveries; deductions of deferred income tax valuation allowance relate to decreased deferred tax assets and release of valuation allowance. |
111