Attached files
| file | filename |
|---|---|
| EX-23.7 - EX-23.7 - BrightSphere Investment Group plc | a2221067zex-23_7.htm |
| EX-23.6 - EX-23.6 - BrightSphere Investment Group plc | a2221067zex-23_6.htm |
| EX-23.1 - EX-23.1 - BrightSphere Investment Group plc | a2221067zex-23_1.htm |
Use these links to rapidly review the document
TABLE OF CONTENTS
INDEX TO FINANCIAL STATEMENTS
As filed with the Securities and Exchange Commission on August 18, 2014
Registration No. 333-197106
UNITED STATES
SECURITIES AND EXCHANGE COMMISSION
WASHINGTON, DC 20549
AMENDMENT NO. 1
TO
FORM S-1
REGISTRATION STATEMENT
UNDER
THE SECURITIES ACT OF 1933
OM Asset Management Limited
(Exact name of each registrant as specified in its charter)
| England and Wales (State or other jurisdiction of incorporation or organization) |
6282 (Primary Standard Industrial Classification Code Number) |
98-1179929 (IRS Employer Identification Number) |
5th Floor, Millennium Bridge House
2 Lambeth Hill
London EC4V 4GG, United Kingdom
+44-20-7002-7000
(Address, including zip code, and telephone number, including area code, of registrant's principal executive offices)
Stephen H. Belgrad
Chief Financial Officer
c/o Old Mutual (US) Holdings Inc.
200 Clarendon Street, 53rd Floor
Boston, Massachusetts 02116
(617) 369-7300
(Name, address, including zip code, and telephone number, including area code, of agent for service)
| Copies to: | ||
Floyd I. Wittlin Christina E. Melendi Bingham McCutchen LLP 399 Park Avenue New York, New York 10022 (212) 705-7000 |
Paul D. Tropp Fried, Frank, Harris, Shriver & Jacobson LLP One New York Plaza New York, New York 10004 (212) 859-8000 |
|
Approximate date of commencement of proposed sale to the public:
As soon as practicable after the effective date of this Registration Statement.
If any of the securities being registered on this Form are to be offered on a delayed or continuous basis pursuant to Rule 415 under the Securities Act of 1933, check the following box. o
If this Form is filed to register additional securities for an offering pursuant to Rule 462(b) under the Securities Act, please check the following box and list the Securities Act registration statement number of the earlier effective registration statement for the same offering. o
If this Form is a post-effective amendment filed pursuant to Rule 462(c) under the Securities Act, check the following box and list the Securities Act registration statement number of the earlier effective registration statement for the same offering. o
If this Form is a post-effective amendment filed pursuant to Rule 462(d) under the Securities Act, check the following box and list the Securities Act registration statement number of the earlier effective registration statement for the same offering. o
Indicate by check mark whether the registrant is a large accelerated filer, an accelerated filer, a non-accelerated filer, or a smaller reporting company. See the definitions of "large accelerated filer," "accelerated filer" and "smaller reporting company" in Rule 12b-2 of the Exchange Act.
| Large accelerated filer o | Accelerated filer o | Non-accelerated filer ý (Do not check if a smaller reporting company) |
Smaller reporting company o |
The registrant hereby amends this registration statement on such date or dates as may be necessary to delay its effective date until the registrant shall file a further amendment which specifically states that this registration statement shall thereafter become effective in accordance with Section 8(a) of the Securities Act of 1933, or until the registration statement shall become effective on such date as the Securities and Exchange Commission, acting pursuant to said Section 8(a), may determine.
The information in this prospectus is not complete and may be changed. We may not sell these securities until the registration statement filed with the Securities and Exchange Commission is effective. This prospectus is not an offer to sell these securities and it is not soliciting offers to buy these securities in any state where the offer or sale is not permitted.
Subject to Completion. Dated August 18, 2014
Ordinary Shares

Ordinary Shares
This is an initial public offering of ordinary shares of OM Asset Management Limited.
All of the ordinary shares offered by this prospectus are being sold by OM Group (UK) Limited, which we refer to as OMGUK or the Selling Shareholder. We are not selling any ordinary shares under this prospectus, and we will not receive any of the proceeds from the sale of the ordinary shares being sold by the Selling Shareholder. Upon completion of this offering, Old Mutual plc, which is our parent company and which we refer to as our Parent, indirectly through the Selling Shareholder, will beneficially own approximately % of our outstanding ordinary shares, or % if the underwriters exercise their over-allotment option in full. As a result of this ownership and certain approval rights we are granting our Parent under a shareholder agreement, our Parent will have significant power to control our affairs and policies. See "Certain Relationships and Related Party Transactions—Relationship with Our Parent and OMGUK Following This Offering—Shareholder Agreement."
No public market for our ordinary shares existed prior to this offering. It is currently estimated that the initial public offering price per share will be between $ and $ . We will apply to have our ordinary shares listed on the New York Stock Exchange under the symbol "OMAM."
Investing in our ordinary shares involves risks that are described in the "Risk Factors" section beginning on page 13 of this prospectus.
Neither the Securities and Exchange Commission nor any state securities commission has approved or disapproved of these securities or passed upon the accuracy or adequacy of this prospectus. Any representation to the contrary is a criminal offense.
|
||||
| |
Per share |
Total |
||
|---|---|---|---|---|
Initial public offering price |
$ | $ | ||
Underwriting discount |
$ | $ | ||
Proceeds, before expenses, to the Selling Shareholder |
$ | $ | ||
|
||||
The Selling Shareholder has granted the underwriters an option to purchase up to an additional ordinary shares.
The underwriters expect to deliver the ordinary shares against payment on , 2014.
| BofA Merrill Lynch | Morgan Stanley | Citigroup | Credit Suisse |
Prospectus dated , 2014
You should rely only on the information contained in this prospectus or in any free writing prospectus we may authorize to be delivered to you. None of OM Asset Management Limited, Old Mutual plc, the Selling Shareholder or the underwriters has authorized anyone to provide you with additional or different information. This document may only be used where it is legal to sell these securities. The information contained in this prospectus may only be accurate as of the date of this prospectus.
OM Asset Management Limited is a newly-formed private limited company under the laws of England and Wales that has not, to date, conducted any activities other than those incidental to its formation, the preparation of this registration statement and the reorganization transactions described under the section "Reorganization," which we refer to as the Reorganization. Upon the consummation of the Reorganization, we will change our name to OM Asset Management plc. Unless we state otherwise or the context otherwise requires, references in this prospectus to "OMAM" refer to OM Asset Management Limited, or OM Asset Management plc, as applicable, and for all periods after the Reorganization (which we expect to be completed prior to the effectiveness of the registration statement of which this prospectus forms a part), references to the "Company" refer to OMAM, and references to "we," "our" and "us" refer to OMAM and its consolidated subsidiaries and equity accounted Affiliates, excluding discontinued operations, after giving effect to the Reorganization. For
i
all periods prior to the Reorganization, references to the "Company" refer to Old Mutual (US) Holdings Inc., or OMUSH, a Delaware corporation, and references to "we," "our" and "us" refer to OMUSH and its predecessors and their respective consolidated subsidiaries and equity accounted Affiliates, excluding discontinued operations. Unless we state otherwise or the context otherwise requires, references in this prospectus to "Affiliates" or an "Affiliate" refer to the asset management firms in which we have an ownership interest. References in this prospectus to our "Parent" refer to Old Mutual plc.
In this prospectus, we rely on and refer to certain market and industry data and forecasts related thereto. We obtained this information and these statistics from sources other than us, which we have supplemented where necessary with information from publicly available sources and our own internal estimates. We use these sources and estimates and believe them to be reliable, but we cannot give you any assurance that any of the projected results will be achieved.
None of the information in this prospectus or the registration statement of which this prospectus forms a part constitutes either an offer or a solicitation to buy or sell any of our Affiliates' products or services, nor is any such information a recommendation for any of our Affiliates' products or services.
ii
The following is a summary of selected information contained elsewhere in this prospectus. It does not contain all of the information that you should consider before deciding to purchase our ordinary shares. Before deciding to invest in our ordinary shares, you should read this entire prospectus carefully, including the Consolidated Financial Statements and the related notes thereto and the information set forth under the sections "Risk Factors" and "Management's Discussion and Analysis of Financial Condition and Results of Operations", in each case included in this prospectus.
We present economic net income, or ENI, to help us describe our operating and financial performance. ENI is the key measure our management uses to evaluate the financial performance of, and make operational decisions for, our business. ENI is not audited, and is not a substitute for net income or other performance measures that are derived in accordance with U.S. generally accepted accounting principles, or U.S. GAAP. Furthermore, our calculation of ENI may differ from similarly titled measures provided by other companies. Please refer to "Management's Discussion and Analysis of Financial Condition and Results of Operations—Non-GAAP Supplemental Performance Measure—Economic Net Income" for a more thorough discussion of ENI and a reconciliation of ENI to U.S. GAAP net income.
Our Business
We are a global, diversified, multi-boutique asset management company with approximately $214.9 billion of assets under management, or AUM, as of June 30, 2014. We currently operate our business through seven boutique asset management firms, which we refer to as our Affiliates. We are currently a wholly-owned indirect subsidiary of Old Mutual plc, which we refer to as our Parent, an international investment, savings, insurance and banking group established in 1845.
Our business model combines the investment talent, entrepreneurialism, focus and creativity of leading asset management boutiques with the resources and capabilities of a larger firm. We have a permanent partnership structure with our Affiliates that preserves the unique culture that has made each of them successful and provides investment and day-to-day operational autonomy. We ensure that key management professionals at each Affiliate retain meaningful levels of equity in their own businesses to maintain strong alignment of interests between us, our Affiliates, their clients and our shareholders. Our approach to investing in Affiliates includes a profit-sharing arrangement to provide incentives for growth and prudent business management across multiple generations of Affiliate partners.
We have broad and deep experience in working with boutique asset managers, and we leverage the expertise and resources within our organization to engage actively with our Affiliates and provide them with capabilities generally unavailable to specialist asset management firms. We work with Affiliates to identify and execute upon growth opportunities for their businesses in areas such as business line expansion and product development, as well as activities critical to the operational success of investment boutiques, including talent management, risk management and compliance support. Our Company-led Global Distribution team complements and enhances the distribution capabilities of our Affiliates. Furthermore, our collaboration with our Affiliates extends to the commitment of seed and co-investment capital to launch new products and investment capital to financially support new growth initiatives. Our business development professionals, all of whom have prior experience executing M&A transactions for asset managers, facilitate growth opportunities for both us and individual Affiliates by sourcing and structuring investments in new Affiliates as well as add-on acquisitions on behalf of existing Affiliates.
1
Currently, our business comprises interests in the following Affiliates:
Our diversification, by Affiliate, asset class, geography and investment strategy, enhances relative earnings stability and provides multiple sources of growth for us. Collectively, our Affiliates offer approximately 100 distinct, active investment strategies in U.S., global, international and emerging markets equities, U.S. and emerging markets fixed income, and alternative investments, including timber and real estate. In addition, there is significant diversification within each of our Affiliate firms through the breadth of their respective investment capabilities. We believe our Affiliates have generated strong absolute and relative performance records. As of June 30, 2014, the percentage of our revenue represented by assets under management outperforming their investment benchmarks on a one-, three-, and five-year basis was 70%, 73% and 75%, respectively. As a result, our Affiliates have attracted significant net client cash flows in recent periods, aggregating $6.9 billion in positive flows for the twelve months ended June 30, 2014, representing approximately 4% of beginning-of-period AUM.
Through our Affiliates, we serve a highly diverse investor base in the institutional and sub-advisory channels in the U.S. and around the world. Our Affiliates currently manage assets for non-U.S. clients in 28 countries, including Australia, Canada, Ireland, Japan, the Netherlands, South Africa, South Korea, Switzerland, and the United Kingdom. Our Company-led Global Distribution platform, launched in 2012, has contributed to the increase of our non-U.S. assets under management. As a result of this effort, we have raised approximately $6.7 billion of new client assets for our current seven Affiliates from the start of 2013 through June 30, 2014.
Net inflows and positive investment performance, in conjunction with the successful execution of our business strategy, have led to growth in revenues and net income. We measure financial performance primarily through ENI, a non-GAAP measure that we believe better reflects our underlying economic performance and returns to shareholders. Our ENI revenues from 2011 through 2013 grew from $435.7 million to $528.0 million, for a compounded annual growth rate, or CAGR, of 10.1%. Over this period, our pre-tax ENI grew from $124.3 million to $153.0 million, representing a
2
CAGR of 10.9%. Our U.S. GAAP revenues from continuing operations attributable to controlling interests from 2011 through 2013 grew from $424.6 million to $519.8 million, representing a CAGR of 10.6%. Our U.S. GAAP pre-tax income from continuing operations attributable to controlling interests increased from $22.0 million to $32.7 million, a CAGR of 21.9%.
Total AUM: $214.9bn
Data as of June 30, 2014
Competitive Strengths
We believe our success as a multi-boutique asset management company is driven by the following competitive strengths:
Well-Established, Diverse Affiliates. Through our seven Affiliates, we are well diversified by brand, strategy and asset class, providing multiple sources of revenue and growth opportunities for our business across global market cycles, while limiting downside risk. Our assets under management across Affiliates are invested in both U.S. and non-U.S. equities as well as fixed income and alternative assets, and span approximately 100 distinct investment strategy composites. We have a well-diversified client base with low levels of client concentration, serving over 600 institutional and sub-advisory clients.
Differentiated Multi-Boutique Model Drives Growth. Our business is differentiated among multi-boutique asset management firms by our focus on active engagement with our Affiliates to enhance their organic growth potential. We have a two-pronged approach for successfully collaborating with our Affiliate firms. First, we align our interests with those of our Affiliates by providing Affiliate partners with equity in their own firms and through a profit-sharing structure, collectively providing Affiliate partners with meaningful wealth creation opportunities and encouraging investments in long-term growth. Second, we offer our Affiliates strategic and financial support to grow and enhance their businesses, including expansion into new products, strategies, geographies and channels. In addition, our Company-led Global Distribution team complements and enhances the distribution capabilities of our Affiliates.
Track Record of Consistent Investment Performance Across Market Cycles. Our Affiliates have produced strong long-term investment performance across their product offerings, generating consistent outperformance relative to benchmarks. Through June 30, 2014, 79 of our Affiliates' 88 strategies which have performance benchmarks have outperformed their relevant benchmarks since inception. These strategies represent 97% of the total assets in the 88 strategies which have performance benchmarks. Our Affiliates' five largest benchmarked investment strategies have each outperformed their relevant benchmarks since inception. Investment performance is calculated on a gross basis, excluding the impact of management, administration, and performance fees. Based on our current average management fee rate, investment returns net of fees would be on average at least 34 bps lower than gross returns.
3
Attractive Financial Model. Our multi-boutique model generates strong, recurring free cash flow to our business. Our ENI revenue has grown by 8.1% annually since 2009. Moreover, our ENI revenue growth since 2011 has accelerated to 10.1% annually as net client cash flows generated positive annualized increases in revenue in seven of the eight quarters in 2012 and 2013. We earn an attractive margin on revenue, enhanced by our profit-sharing model that enables us to participate directly in margin expansion as our Affiliates grow. Accordingly, from 2011 to 2013, our pre-tax ENI operating margin before Affiliate key employee distributions grew from 32% to 34%. Our comparable pre-tax U.S. GAAP operating margin based on pre-tax income from continuing operations attributable to controlling interests and GAAP revenue from continuing operations attributable to controlling interests was 5% for 2011 and 6% for 2013. For additional information regarding economic net income, and reconciliations to U.S. GAAP, see "Managements Discussion and Analysis of Financial Condition and Results of Operations—Non-GAAP Supplemental Performance Measure—Economic Net Income."
Experienced Multi-Boutique Management Team. The members of our senior management team have significant experience in the asset management industry, with a particular focus on managing multi-boutique businesses. With an average industry tenure of approximately 24 years, each of our senior executives brings a deep understanding of how to structure and maintain relationships that provide Affiliate firms with the proper incentives and resources to continue to generate strong growth.
Strong Growth Prospects from New Affiliate Partnerships. We have established a reputation as a collaborative and supportive partner to our Affiliates and seek to partner with additional high quality managers who provide scalable institutional quality investment capabilities in asset classes in which we seek an enhanced presence. We believe our business model is attractive to the owners of boutique asset management firms, as it provides them an opportunity to realize a portion of the value they have created, while maximizing the value of their retained equity by accelerating the growth of their businesses alongside an experienced and supportive partner.
Business Strategy
Our future growth and success will be driven by the following four core strategies:
Continue to Execute on Our Differentiated Multi-Boutique Model. The cornerstone of our multi-boutique model is to combine the investment talent, entrepreneurialism, focus and creativity of leading asset management boutiques with the expertise and capital of a larger firm in areas where our resources can provide distinct advantages. We provide strategic capabilities to our Affiliates, enabling them to focus on delivering superior investment performance, innovative offerings, and excellent service to their clients. We strive to maintain and enhance the characteristics which have made our Affiliates market leaders in their areas of expertise.
Drive Growth at our Existing Affiliates. We enhance the growth of our existing Affiliates by:
- •
- Aligning Incentives to Support Organic Growth: As a
permanent partner dedicated to providing our Affiliates with operational autonomy, our structure is designed to align our economic interests with those of our Affiliates to promote long-term
client-driven growth. Through retained Affiliate equity ownership and a profit-sharing partnership model, we ensure appropriate focus on key issues critical to the long-term success of each Affiliate,
particularly investment performance, client service, talent management and risk management.
- •
- Engaging in Collaborative Growth Initiatives: Our collaboration with our Affiliates generally consists of strategic support across three primary activities. First, we leverage the broad industry experience of our senior management to evaluate, structure, and support Affiliate growth opportunities. Second, we provide seed and co-investment capital to help launch new products. Finally, we provide selective shared services which leverage our scale across our Affiliate base or provide distinctive strategic operational expertise to our Affiliates.
4
- •
- Delivering Complementary Global Distribution Capabilities to Broaden Reach: While our Affiliates have strong client and consultant relationships in their core institutional marketplaces, there are certain areas of distribution outside of their core markets that are more scale-oriented or specialized in nature. To assist our Affiliates in penetrating these markets, we offer a range of distribution capabilities in a transparent, opt-in partnership-based model that is supported by an experienced sales team focused on cultivating broad and deep relationships within the U.S. sub-advised, defined contribution and variable annuity channels and non-U.S. institutional markets.
Invest in New Affiliates. We will selectively pursue partnerships with additional boutique asset managers that can enhance our growth and diversify our earnings drivers. Our partnership strategy targets asset classes that complement our existing Affiliates' capabilities or provide additional expertise in capacity-constrained investment strategies. Within each asset class, we seek to partner with market leaders that have track records of operating as successful, stand-alone enterprises, as well as demonstrating a strong cultural fit and shared strategic vision with us. We target profitable and growing businesses that have the potential to build a meaningful global presence in a given asset class.
Strategically Manage Capital. Our business generates significant, recurring free cash flow that can be re-invested in growth oriented strategies to create value for our shareholders. In particular, we believe we can generate strong risk-adjusted returns on allocated capital by (i) providing seed capital to fund new products and strategies, (ii) committing co-investment capital to launch new fund partnerships; (iii) providing investment capital to support organic growth; and (iv) investing in new Affiliates.
For additional information regarding our business, see "Business."
Summary Risk Factors
Our business is subject to numerous risks that are described more fully in the section entitled "Risk Factors", including:
- •
- OMAM is a holding company. As such, OMAM does not manage investments for clients and does not directly receive management
fees. Substantially all of OMAM's cash flow generation is dependent on our Affiliates, who are registered investment advisers and receive the majority of their fees based on the market values of
assets under management.
- •
- Our financial performance is dependent upon the ability of our Affiliates to attract and retain AUM through sound relative
investment performance over measured periods of time compared to relevant benchmarks and peer performance results. The performance of our Affiliates' investment strategies can be impacted by factors
within and/or outside the control of our Affiliates, including market and economic conditions.
- •
- Assets under management could be withdrawn for any number of reasons, including macroeconomic factors unrelated to
investment performance, a reduction in market demand for the asset classes, products or strategies offered by our Affiliates, price declines in the securities markets generally, turnover of investment
personnel, price declines in those assets in which client assets are concentrated or changes in investment patterns of clients.
- •
- Maintaining strong relationships with our Affiliates is critical to our business model. Any strains in the relationships
that we have with our Affiliates could be detrimental to our overall business.
- •
- As of June 30, 2014, two of our seven Affiliates represented approximately 78% of our assets under management, from which we derive a substantial portion of our revenue. An adverse change in the operating results of either of these Affiliates could have a substantial impact on our results of operations.
5
- •
- The loss of key investment or management personnel at any of our Affiliates or our Company for any reason could have an
adverse impact upon our business, results of operations and financial condition.
- •
- Our profit margins and net income are dependent on the ability of our Affiliates to maintain current fee levels for the
products and services they offer. Trends in the asset management industry have led to lower fees in certain segments of the asset management market. There can be no assurance that our Affiliates will
be able to maintain their current pricing structures. A reduction in the fees charged by our Affiliates, or limited opportunities to increase fees, will reduce or limit our revenues and could reduce
or limit our net income.
- •
- The investment management industry is highly competitive with competition based on a variety of factors, including
investment performance, fee rates, continuity of investment professionals, client relationships, the quality of services provided to clients, reputation and the strategies offered. We and our
Affiliates compete against a broad range of domestic and international asset management firms, broker-dealers, hedge funds, investment banking firms and other financial institutions. The capital
resources, scale, name recognition and geographic footprints of many of these organizations are greater than ours. The recent trend toward consolidation in the investment management industry, and the
financial services industry generally, has served to increase the size and strength of a number of our competitors.
- •
- Upon the completion of this offering, our Parent, through the Selling Shareholder, will beneficially own approximately
% of our outstanding ordinary shares, or % if the underwriters exercise their over-allotment option in full. As a result of this ownership and a
shareholder agreement that
we will enter into with our Parent prior to or concurrently with the consummation of this offering, which we refer to as the Shareholder Agreement, our Parent will, for so long as it continues to own
more than 25% of our outstanding ordinary shares, have significant power to control our affairs and policies.
- •
- Future changes in tax laws or the failure by the United States taxing authorities to treat OMAM as a foreign corporation for U.S. federal tax purposes could limit our ability to utilize tax attributes to offset taxable income and adversely affect our results of operations.
Our Structure and Reorganization
Old Mutual (US) Holdings Inc., or OMUSH, has historically been an indirect wholly-owned subsidiary of Old Mutual plc. Prior to the consummation of this offering, we will effect a reorganization pursuant to which OMAM, incorporated under the laws of England and Wales, will become the indirect parent company of OMUSH. See "Reorganization" for a detailed summary of the steps that will be taken in the reorganization of our Company.
Our Principal Shareholder
Upon and after the consummation of this offering, our Parent will indirectly hold a majority of the voting power of our share capital through OMGUK's ownership of % of our outstanding ordinary shares, or % if the underwriters exercise their over-allotment option in full. Pursuant to the Shareholder Agreement, our Parent will, for so long as it remains the majority owner of our ordinary shares, have the right to nominate a majority of the directors to our Board of Directors and, for so long as it owns certain specified percentages of our outstanding ordinary shares that are less than a majority but greater than 7%, the right to nominate a certain number of directors to our Board of Directors. These rights give our Parent significant power to control our policies and affairs. The Shareholder Agreement also grants our Parent approval rights over certain matters, beginning on the date that our Parent ceases to beneficially own more than 50% of our outstanding ordinary shares, and ending on the date that our Parent ceases to beneficially own at least 25% of our outstanding ordinary shares, including, among others, certain mergers and acquisitions, the incurrence of debt above a
6
specified threshold, certain issuances of share capital, and the declaration or payment of a dividend other than in accordance with our dividend policy in effect as of the date that our Parent ceases to beneficially own more than 50% of our outstanding ordinary shares. Prior to the closing of this offering, our Board of Directors intends to adopt policies and procedures which give our Parent significant control over our business, including budgets, business strategy, acquisitions, expenditures in excess of our budget, financings, insurance, declaration and payment of dividends, risk management, entering into a new line of business, public statements relating to financial performance of our Parent, human resources policies and compensation. See "Certain Relationships and Related Party Transactions—Relationship with Our Parent and OMGUK Following This Offering—Shareholder Agreement."
In addition, we will enter into the following arrangements with our Parent or OMGUK in connection with the Reorganization:
- •
- We will enter into a deferred tax asset arrangement with OMGUK with respect to $279.3 million of existing deferred
tax assets as of June 30, 2014 such that following the Reorganization, any future amounts realized in respect of these assets, until the later of December 31, 2019 or December 31
of the year in which OMGUK ceases to own, directly or indirectly, at least 50% of our outstanding ordinary shares, are entirely attributable and payable on a quarterly basis to OMGUK. Thereafter, the
arrangement will terminate and we will make a payment to OMGUK in an amount equal to the net present value of the deferred tax assets which have yet to be utilized at the termination date, subject to
repayment if and to the extent that the deferred tax assets are determined not to be available.
- •
- We will enter into a seed capital management agreement with our Parent whereby our Parent and certain of its affiliates
will continue to provide approximately $150 million of seed capital to be invested in products managed by our Affiliates. After January 15, 2018, our Parent and certain of its affiliates
may withdraw all of such seed capital investments unless we purchase the seed capital investments.
- •
- We will enter into a co-investment arrangement with OMGUK whereby we will be obligated to pay OMGUK an amount equal to the
after-tax proceeds realized by us in respect of specified pre-offering co-investments with a carrying value of $42.3 million and an aggregate fair value of $51.4 million as of
June 30, 2014.
- •
- OMAM will make a dividend payment of $175.0 million to OMGUK. OMAM also intends to accrue a payable to OMGUK of $10 million which will be paid as funds become available from Affiliate distributions, subject to the maintenance of a minimum level of OMUSH cash holdings. Other than this dividend and payable, OMAM does not intend to make any further pre-IPO dividend or debt repayment to OMGUK following June 30, 2014.
See "Certain Relationships and Related Party Transactions—Relationship with Our Parent and OMGUK Following This Offering" for additional information regarding these arrangements with our Parent and OMGUK.
Recent Financial Performance
For the period from July 1, 2014 through August 31, 2014, our net client cash flows were $ billion. Our assets under management as of August 31, 2014 were $ billion, an increase of $ billion, or %, as compared to our AUM as of June 30, 2014 and an increase of $ billion, or %, as compared to our AUM as of December 31, 2013. For the period from January 1, 2014 through August 31, 2014, net client cash flows were $ billion.
Corporate Information
Our principal executive offices and registered office are located at 5th Floor, Millennium Bridge House, 2 Lambeth Hill, London EC4V 4GG, United Kingdom, and our telephone number is +44-20-7002-7000. Our Internet address is https://www.omam.com. Information on or accessible through our website is not part of this prospectus.
7
Issuer |
OM Asset Management Limited. We will change our name to OM Asset Management plc upon the consummation of the Reorganization. | |
Ordinary shares offered by OM Group (UK) Limited |
ordinary shares. |
|
Underwriters' over-allotment option to purchase additional shares |
ordinary shares from OMGUK. |
|
Ordinary shares to be outstanding immediately after this offering |
ordinary shares. |
|
Use of proceeds |
All of the ordinary shares offered by this prospectus are being sold by OMGUK. We will not receive any proceeds from the sale of ordinary shares in this offering, including from any exercise by the underwriters of their over-allotment option. |
|
Voting rights |
One vote per share. |
|
Dividend policy |
We will initially target a dividend payout in the range of 25% of ENI, subject to maintaining a sustainable quarterly dividend per share. Any declaration of dividends will be at the discretion of our Board of Directors and subject to the approval of our Parent, and will depend on our financial condition, earnings, cash needs, regulatory constraints, capital requirements and any other factors that our Board of Directors or Parent deems relevant in making such a determination. See "Dividend Policy." |
|
Listing |
We will apply to list our ordinary shares on the New York Stock Exchange (which we refer to as the NYSE) under the trading symbol "OMAM." |
|
Risk factors |
Please read the section entitled "Risk Factors" for a discussion of some of the factors you should consider before investing in our ordinary shares. |
|
Directed Share Program |
At our request, the underwriters have reserved up to of the ordinary shares being offered by this prospectus for sale at the initial public offering price to our directors, officers, employees and other individuals associated with us and members of their families. See "Underwriting." |
8
Summary Historical Consolidated and Combined Financial Data
The summary statement of operations data for the years ended December 31, 2013, 2012 and 2011 have been derived from our audited Consolidated Financial Statements included elsewhere in this prospectus. The summary consolidated financial data as of and for the six months ended June 30, 2014 and 2013 have been derived from our unaudited Consolidated Financial Statements included elsewhere in this prospectus, and have been prepared on substantially the same basis as our Consolidated Financial Statements that were audited in accordance with U.S. GAAP and include all adjustments that we consider necessary for a fair statement of our consolidated statements of operations for the periods and as of the dates presented therein. Our results for the six months ended June 30, 2014 are not necessarily indicative of our results for a full year.
The following summary consolidated financial data should be read in conjunction with, and is qualified by reference to, "Selected Historical Consolidated Financial Data," "Management's Discussion and Analysis of Financial Condition and Results of Operations," "Unaudited Pro Forma Consolidated Financial Statements" and the Consolidated Financial Statements and notes thereto included elsewhere in this prospectus.
| |
Six Months Ended June 30, |
Years Ended December 31, | ||||||||||||||
|---|---|---|---|---|---|---|---|---|---|---|---|---|---|---|---|---|
| ($ in millions, except as noted) |
2014(1) | 2013(1) | 2013 | 2012 | 2011 | |||||||||||
U.S. GAAP Statement of Operations(2): |
||||||||||||||||
Management fees(3) |
$ | 275.4 | $ | 233.1 | $ | 478.2 | $ | 399.3 | $ | 398.2 | ||||||
Performance fees |
2.4 | 8.3 | 18.1 | 14.1 | 4.3 | |||||||||||
Other revenue |
0.3 | 1.1 | 1.8 | 0.5 | 0.3 | |||||||||||
Consolidated Funds revenue(3) |
251.6 | 227.8 | 430.5 | 289.6 | 321.4 | |||||||||||
| | | | | | | | | | | | | | | | | |
Total revenue |
529.7 | 470.3 | 928.6 | 703.5 | 724.2 | |||||||||||
| | | | | | | | | | | | | | | | | |
Compensation and benefits |
181.3 | 165.9 | 352.3 | 267.2 | 251.8 | |||||||||||
General and administrative |
37.1 | 32.0 | 68.7 | 68.6 | 76.8 | |||||||||||
Amortization and impairment of acquired intangibles |
0.1 | 0.1 | 0.1 | 1.8 | 8.6 | |||||||||||
Depreciation and amortization |
2.9 | 2.4 | 4.9 | 5.8 | 6.9 | |||||||||||
Consolidated Funds expense(3) |
348.3 | 335.2 | 602.1 | 422.6 | 459.0 | |||||||||||
| | | | | | | | | | | | | | | | | |
Total expenses |
569.7 | 535.6 | 1,028.1 | 766.0 | 803.1 | |||||||||||
| | | | | | | | | | | | | | | | | |
Operating income |
(40.0 | ) | (65.3 | ) | (99.5 | ) | (62.5 | ) | (78.9 | ) | ||||||
| | | | | | | | | | | | | | | | | |
Non-operating items |
4.3 | (2.7 | ) | 15.7 | 15.8 | 6.0 | ||||||||||
| | | | | | | | | | | | | | | | | |
Loss from continuing operations before taxes |
(35.7 | ) | (68.0 | ) | (83.8 | ) | (46.7 | ) | (72.9 | ) | ||||||
| | | | | | | | | | | | | | | | | |
Income tax expense |
16.2 | 6.0 | 13.3 | 3.3 | (4.2 | ) | ||||||||||
| | | | | | | | | | | | | | | | | |
Loss from continuing operations |
(51.9 | ) | (74.0 | ) | (97.1 | ) | (50.0 | ) | (68.7 | ) | ||||||
| | | | | | | | | | | | | | | | | |
Loss from continuing operations attributable to non-controlling interests |
(75.3 | ) | (81.2 | ) | (116.5 | ) | (74.0 | ) | (94.9 | ) | ||||||
| | | | | | | | | | | | | | | | | |
Net income from continuing operations attributable to controlling interests(3)(5) |
$ | 23.4 | $ | 7.2 | $ | 19.4 | $ | 24.0 | $ | 26.2 | ||||||
| | | | | | | | | | | | | | | | | |
| | | | | | | | | | | | | | | | | |
Pre-tax U.S. GAAP controlling interests operating margin(4) |
14 | % | 5 | % | 6 | % | 6 | % | 5 | % | ||||||
9
| |
For the Six Months ended June 30, | |
|
|
||||||||||||
|---|---|---|---|---|---|---|---|---|---|---|---|---|---|---|---|---|
| |
Years Ended December 31, | |||||||||||||||
| ($ in millions, except as noted) | ||||||||||||||||
| 2014 | 2013 | 2013 | 2012 | 2011 | ||||||||||||
Non-GAAP Statement of Operations(1):
|
||||||||||||||||
Economic Net Income(6) |
||||||||||||||||
Management fees |
$ | 285.6 | $ | 238.2 | $ | 499.8 | $ | 420.9 | $ | 420.1 | ||||||
Performance fees |
2.4 | 8.3 | 18.1 | 14.1 | 2.9 | |||||||||||
Other income, including equity-accounted subsidiaries |
4.0 | 5.7 | 9.6 | 15.8 | 12.2 | |||||||||||
Interest income |
0.1 | 0.2 | 0.5 | 1.4 | 0.5 | |||||||||||
| | | | | | | | | | | | | | | | | |
Total ENI Revenue(6) |
$ | 292.1 | $ | 252.4 | 528.0 | 452.2 | 435.7 | |||||||||
| | | | | | | | | | | | | | | | | |
Fixed compensation and benefits |
59.5 | 53.8 | 111.4 | 104.0 | 100.2 | |||||||||||
General and administrative expenses |
40.7 | 35.5 | 76.5 | 71.1 | 72.4 | |||||||||||
Depreciation and amortization |
2.9 | 2.4 | 4.9 | 5.7 | 6.9 | |||||||||||
| | | | | | | | | | | | | | | | | |
Total ENI Operating Expenses |
103.1 | 91.7 | 192.8 | 180.8 | 179.5 | |||||||||||
| | | | | | | | | | | | | | | | | |
Earnings before variable compensation |
189.0 | 160.7 | 335.2 | 271.4 | 256.2 | |||||||||||
Variable compensation |
80.2 | 75.2 | 153.8 | 121.0 | 118.4 | |||||||||||
| | | | | | | | | | | | | | | | | |
Earnings after variable compensation |
108.8 | 85.5 | 181.4 | 150.4 | 137.8 | |||||||||||
Affiliate key employee distributions |
17.6 | 11.8 | 28.4 | 19.1 | 13.5 | |||||||||||
| | | | | | | | | | | | | | | | | |
Pre-Tax Economic Net Income |
$ | 91.2 | $ | 73.7 | 153.0 | 131.3 | 124.3 | |||||||||
Tax on Economic Net Income |
24.6 | 15.4 | 30.1 | 19.0 | 22.4 | |||||||||||
| | | | | | | | | | | | | | | | | |
Economic Net Income(6) |
$ | 66.6 | $ | 58.3 | $ | 122.9 | $ | 112.3 | $ | 101.9 | ||||||
| | | | | | | | | | | | | | | | | |
| | | | | | | | | | | | | | | | | |
Pre-tax ENI operating margin before affiliate key employee distributions(7) |
37 | % | 34 | % | 34 | % | 33 | % | 32 | % | ||||||
Pre-tax ENI operating margin after affiliate key employee distributions(7) |
31 | % | 29 | % | 29 | % | 29 | % | 29 | % | ||||||
Other Operational Information(1): |
||||||||||||||||
Assets under management at period end (in billions) |
$ | 214.9 | $ | 173.9 | $ | 198.8 | $ | 156.7 | $ | 136.8 | ||||||
Net client cash flows (in billions) |
2.6 | 6.1 | 10.5 | 0.4 | (4.6 | ) | ||||||||||
Annualized revenue impact of net flows (in millions)(8) |
15.4 | 20.3 | 42.5 | 11.2 | (12.1 | ) | ||||||||||
- (1)
- Unaudited.
- (2)
- The
U.S. GAAP Statement of Operations Data above has been presented on a continuing operations basis. Please refer to "Management's Discussion and Analysis
of Financial Condition and Results of Operations" for further discussion of our results of operations, including discontinued operations, and a reconciliation to the results from continuing
operations.
- (3)
- Statement
of operations data presented in accordance with U.S. GAAP include the results of consolidated pooled investment vehicles, or "Funds,"
managed by our Affiliates where it has been determined that these entities are controlled by our Company. The effects of consolidating these entities include a reduction in management fee revenue by
approximately $22 million per annum for fiscal years 2011 through 2013, with offsetting increases in the results of consolidated Funds. The net income from continuing operations presented as
attributable to controlling interests exclude the income or loss directly attributable to third-party Fund investors and represent the net amounts attributable to our shareholders.
- (4)
- The pre-tax U.S. GAAP controlling interests operating margin is calculated using pre-tax income from continuing operations attributable to controlling interests and GAAP revenue from continuing
10
operations attributable to controlling interests. The following tables reconcile each component of the calculation:
| |
Six Months Ended June 30, |
|
|
|
||||||||||||
|---|---|---|---|---|---|---|---|---|---|---|---|---|---|---|---|---|
| |
Years Ended December 31, | |||||||||||||||
| ($ in millions) | ||||||||||||||||
| 2014 | 2013 | 2013 | 2012 | 2011 | ||||||||||||
U.S. GAAP Revenue |
$ | 529.7 | $ | 470.3 | $ | 928.6 | $ | 703.5 | $ | 724.2 | ||||||
Exclude revenue from consolidated Funds attributable to non-controlling interests |
(241.5 | ) | (227.8 | ) | (408.8 | ) | (268.0 | ) | (299.6 | ) | ||||||
| | | | | | | | | | | | | | | | | |
U.S. GAAP Revenue from continuing operations attributable to controlling interests |
$ | 288.2 | $ | 242.5 | $ | 519.8 | $ | 435.5 | $ | 424.6 | ||||||
| | | | | | | | | | | | | | | | | |
| | | | | | | | | | | | | | | | | |
| |
Six Months Ended June 30, |
|
|
|
||||||||||||
|---|---|---|---|---|---|---|---|---|---|---|---|---|---|---|---|---|
| |
Years Ended December 31, | |||||||||||||||
| ($ in millions) | ||||||||||||||||
| 2014 | 2013 | 2013 | 2012 | 2011 | ||||||||||||
Loss from continuing operations before taxes |
$ | (35.7 | ) | $ | (68.0 | ) | $ | (83.8 | ) | $ | (46.7 | ) | $ | (72.9 | ) | |
Exclude loss from continuing operations attributable to non-controlling interests |
75.3 | 81.2 | 116.5 | 74.0 | 94.9 | |||||||||||
| | | | | | | | | | | | | | | | | |
Pre-tax income from continuing operations attributable to controlling interests |
$ | 39.6 | $ | 13.2 | $ | 32.7 | $ | 27.3 | $ | 22.0 | ||||||
| | | | | | | | | | | | | | | | | |
| | | | | | | | | | | | | | | | | |
- (5)
- The following table reconciles net income from continuing operations attributable to controlling interests to net income attributable to controlling interests:
| |
Six Months Ended June 30, |
|
|
|
||||||||||||
|---|---|---|---|---|---|---|---|---|---|---|---|---|---|---|---|---|
| |
Years Ended December 31, | |||||||||||||||
| ($ in millions) | ||||||||||||||||
| 2014 | 2013 | 2013 | 2012 | 2011 | ||||||||||||
Net income from continuing operations attributable to controlling interests |
$ | 23.4 | $ | 7.2 | $ | 19.4 | $ | 24.0 | $ | 26.2 | ||||||
Include discontinued operations attributable to controlling interests |
(4.3 | ) | 4.3 | 6.3 | (21.0 | ) | (15.9 | ) | ||||||||
| | | | | | | | | | | | | | | | | |
Net income attributable to controlling interests |
$ | 19.1 | $ | 11.5 | $ | 25.7 | $ | 3.0 | $ | 10.3 | ||||||
| | | | | | | | | | | | | | | | | |
| | | | | | | | | | | | | | | | | |
- (6)
- ENI is discussed in "Management's Discussion and Analysis of Financial Condition and Results of Operations—Non-GAAP Supplemental Performance Measure—Economic Net Income." Pre-tax and post-tax ENI are presented after Affiliate key employee distributions. The following tables reconcile U.S. GAAP net income from continuing operations attributable to controlling interests to economic net
11
income after taxes and U.S. GAAP revenue to revenue included within economic net income for the six months ended June 30, 2014 and 2013 and the years ended December 31, 2013, 2012 and 2011:
| |
For the six months ended June 30, | |
|
|
|||||||||||||
|---|---|---|---|---|---|---|---|---|---|---|---|---|---|---|---|---|---|
| |
Years Ended December 31, | ||||||||||||||||
| ($ in millions) | |||||||||||||||||
| 2014 | 2013 | 2013 | 2012 | 2011 | |||||||||||||
U.S. GAAP net income from continuing operations attributable to controlling interests |
$ | 23.4 | $ | 7.2 | $ | 19.4 | $ | 24.0 | $ | 26.2 | |||||||
Adjustments related to restructuring and reorganization actions undertaken in connection with this offering: |
|||||||||||||||||
Non-cash notional parent corporate cost allocation |
1.6 | 1.2 | 3.3 | 2.8 | 3.2 | ||||||||||||
Intercompany interest expense |
33.2 | 37.8 | 72.2 | 84.0 | 74.1 | ||||||||||||
Co-investment (gain) loss |
(2.1 | ) | 1.0 | (3.0 | ) | (1.2 | ) | (3.1 | ) | ||||||||
Initial public offering costs |
— | — | — | 0.4 | 8.0 | ||||||||||||
Adjustments to reflect the economic earnings of our Company: |
|||||||||||||||||
Non-cash key employee-owned equity and profit-interest revaluations |
16.9 | 20.5 | 47.7 | 16.2 | 11.5 | ||||||||||||
Amortization and impairment of goodwill and acquired intangible assets |
0.1 | 0.1 | 0.1 | 1.8 | 8.6 | ||||||||||||
Tax effect of above adjustments |
(6.5 | ) | (9.5 | ) | (16.8 | ) | (15.7 | ) | (26.6 | ) | |||||||
| | | | | | | | | | | | | | | | | | |
Economic net income after taxes |
$ | 66.6 | $ | 58.3 | $ | 122.9 | $ | 112.3 | $ | 101.9 | |||||||
| | | | | | | | | | | | | | | | | | |
| | | | | | | | | | | | | | | | | | |
| |
Six Months Ended June 30, | |
|
|
||||||||||||
|---|---|---|---|---|---|---|---|---|---|---|---|---|---|---|---|---|
| |
Years Ended December 31, | |||||||||||||||
| ($ in millions) | ||||||||||||||||
| 2014 | 2013 | 2013 | 2012 | 2011 | ||||||||||||
U.S. GAAP Revenue |
529.7 | 470.3 | $ | 928.6 | $ | 703.5 | $ | 724.2 | ||||||||
Include interest income |
0.1 | 0.3 | 0.5 | 1.4 | 0.5 | |||||||||||
Include investment return on equity-accounted affiliates |
3.8 | 4.6 | 7.7 | 15.3 | 10.6 | |||||||||||
Exclude revenue from consolidated Funds attributable to non-controlling interests |
(241.5 | ) | (227.8 | ) | (408.8 | ) | (268.0 | ) | (299.6 | ) | ||||||
| | | | | | | | | | | | | | | | | |
Revenue included within Economic Net Income |
$ | 292.1 | $ | 252.4 | $ | 528.0 | $ | 452.2 | $ | 435.7 | ||||||
| | | | | | | | | | | | | | | | | |
| | | | | | | | | | | | | | | | | |
- (7)
- Pre-tax
ENI margin is a non-GAAP efficiency measure, calculated based on pre-tax ENI, divided by ENI revenue. Operating margin is monitored both before and
after Affiliate key employee distributions. Affiliate key employee distributions are conceptually equivalent to non-controlling interests, representing the share of Affiliate earnings that accrue to
key employees under equity or profit interests plans. For accounting purposes under U.S. GAAP, however, these plans are classified as cash-settled liabilities and the share of earnings
attributed to key employees under these plans is therefore presented as compensation expense rather than non-controlling interests.
- (8)
- Annualized revenue impact of net flows represents the difference between annualized management fees expected to be earned on new accounts and net assets contributed to existing accounts, less the annualized management fees lost on terminated accounts or net assets withdrawn from existing accounts, including equity-accounted Affiliates. Annualized revenue is calculated by multiplying the annual gross fee rate for the relevant account by the net assets gained in the account in the event of a positive flow or the net assets lost in the account in the event of an outflow.
12
You should carefully consider the following risk factors in addition to the other information presented in this prospectus before investing in our ordinary shares. Any of the following risks could have a material adverse effect on our business, financial condition, results of operations or cash flow. If any of the following risks and uncertainties actually occurs, you may lose all or part of your original investment.
Business Risks
Our overall financial results are dependent on the ability of our Affiliates to generate earnings.
OMAM is a holding company and is not a registered investment adviser under U.S. federal or state law. As such, OMAM does not manage investments for clients and does not directly receive management fees. All of OMAM's revenue generation is dependent on our Affiliates who are registered investment advisers under the Investment Advisers Act of 1940, as amended, or the Advisers Act, and receive the majority of their fees based on the market values of assets under management. Substantially all of OMAM's cash flows consist of distributions received from our Affiliates. As a result, OMAM's cash flows and ability to fund operations are largely dependent upon the profitability of our Affiliates.
Each Affiliate is required to make certain cash distributions to us under the operating agreement we enter into with such Affiliate. Distributions to us from an Affiliate may be subject to the Affiliate maintaining sufficient working capital, regulatory requirements, claims of creditors of the Affiliate and applicable bankruptcy and insolvency laws. Any material decrease in profits at, or material reduction in distributions from, our Affiliates could negatively impact our business and results of operations.
The ability of our Affiliates to attract and retain assets under management and generate earnings is dependent on our Affiliates maintaining competitive investment performance, as well as market and other factors.
Our financial performance is dependent upon the abilities of our Affiliates to minimize the risk of outflows through sound relative investment performance over measured periods of time compared to relevant benchmarks and peer performance results. The performance of our Affiliates' investment strategies, which can be impacted by factors within and/or outside the control of our Affiliates, including market and economic conditions, is critical to retaining existing client assets and investors in mutual funds our Affiliates sub-advise and attracting new client and investor assets. Poor performance can be caused by our Affiliates' choices in investing in sectors, industries, companies or assets that do not perform as well as others. Additionally, companies in which our Affiliates invest may incur negative changes in their financial conditions or suffer other adverse events that could reduce the values of the Affiliates' investments in those companies.
Net flows related to our investment strategies can be affected by investment performance relative to other competing investment strategies or to established benchmarks. Investment management strategies are rated, ranked or assessed by independent third parties, distribution partners, and industry periodicals and services. These assessments often influence the investment decisions of our Affiliates' clients and investors in mutual funds our Affiliates sub-advise. If the performance or assessment of our investment strategies is seen as underperforming relative to peers, it could result in an increase in the withdrawal of assets by existing clients and investors in mutual funds our Affiliates sub-advise and the inability to attract additional investments from existing and new clients or investors. If a significant portion of clients or investors decide to withdraw their investments or terminate their investment management agreements, our Affiliates' abilities to generate earnings would decline and our results of operations and financial condition would be affected.
In addition, assets could be withdrawn for any number of reasons other than poor absolute or relative investment performance, including macro-economic factors unrelated to investment
13
performance, a reduction in market demand for the asset classes, products or strategies offered by our Affiliates, the loss of key personnel, price declines in the securities markets generally, price declines in those assets in which client assets are concentrated or changes in investment patterns of clients. Any of these factors could have a negative impact on the revenues and profits of an Affiliate and an adverse impact on our results of operations and financial condition.
Our relationships with our Affiliates are critical to our success.
Maintaining strong relationships with our Affiliates is critical to our business model. Any potential disagreements over matters such as economics or management policies, growth strategies and compensation philosophy would impact our relationships with our Affiliates if not effectively managed. Furthermore, dissatisfaction by the management teams of our Affiliates with the services that we provide to them and the conditions upon which such services are provided also could result in a strained relationship with the management of that Affiliate. Any strains in the relationships that we have with our Affiliates could be detrimental to our overall business.
Each of our Affiliates operates under ownership, governance and economic arrangements that we and such Affiliate negotiated either at inception or during the course of our relationship. Periodically, these arrangements are reviewed and, in some instances, may be renegotiated and revised. Any renegotiation that results in a reduction in our ownership interest in an Affiliate and/or a revision to the economic arrangements could reduce the economic benefits derived by us from that Affiliate.
We derive a substantial portion of our revenue from a limited number of Affiliates and investment strategies.
As of June 30, 2014, Acadian Asset Management LLC, or Acadian, and Barrow, Hanley, Mewhinney & Strauss, LLC, or Barrow Hanley, represented approximately 78% of our assets under management, from which we derive a substantial portion of our revenue. An adverse change in the operating results of either of these Affiliates, whether as a result of poor investment performance, withdrawals of assets under management or otherwise, could have a substantial impact on our results of operations.
While our Affiliates invest in a number of asset classes, a significant portion of our assets are invested in a limited number of investment strategies. As of June 30, 2014, approximately $116 billion, or 54%, of our assets under management were concentrated across five investment strategies: Barrow Hanley's large cap value equity (approximately $56 billion, or 26%) and mid cap value equity (approximately $8 billion, or 4%); Heitman LLC's real estate domestic private equity (approximately $17 billion, or 8%); and Acadian's emerging markets equity (approximately $21 billion, or 10%) and global equity (approximately $14 billion, or 7%). Consequently, our results of operations are dependent upon the abilities of our Affiliates that manage these investment strategies to minimize the risk of outflows through relatively strong performance over measured periods of time compared to relevant benchmarks and peer performance results. Also, certain investors may evaluate us on the basis of the asset-weighted performance of our assets under management. A relatively small change in the relative performance of one of our largest strategies, such as Barrow Hanley's large-cap value equity, could have a significant impact on the asset-weighted performance of our assets under management. Such volatility could adversely affect investors' perception of us.
Our business model limits our ability to manage our Affiliates' investment management practices and certain other aspects of their day-to-day operations.
Our multi-boutique affiliate structure offers a diversity of investment styles and client bases. While our agreements with the majority of our Affiliates typically give us ultimate control over the business activities of those Affiliates, we generally do not become directly involved in managing their day-to-day operations, including investment management practices, policies and procedures, fee levels, marketing
14
and product development, client relationships and employment and compensation programs. If we fail to intervene in potentially serious matters arising out of the day-to-day operations of our Affiliates, our reputation could be damaged and our results of operations adversely affected.
For each of Heitman, LLC, or Heitman, and Investment Counselors of Maryland, LLC, or ICM, we exercise significant influence rather than control. Our ability to (i) direct the activities of these Affiliates, (ii) influence their decision-making processes and (iii) require our risk management and governance practices to be applied may be limited and not consistent with those of our controlled Affiliates.
Our growth strategy is dependent upon continued growth of our existing Affiliates and our ability to successfully acquire or invest in new Affiliates.
Since we depend on distributions from our Affiliates to conduct our operations, the inability of our Affiliates to meet projected distribution levels could impact their ability to grow their businesses and contribute to our future growth at current or historical levels. In addition, capacity constraints, particularly on our Affiliates' smaller strategies, or the unavailability of appropriate investment opportunities could limit their ability to accept new client assets and, therefore, limit the growth of their and our revenue.
Our growth strategy is also enhanced by our ability to successfully make new acquisitions or investments, which will depend on our ability to find suitable firms to acquire or invest in, our ability to negotiate agreements with such firms on acceptable terms, and our ability to raise the capital necessary to finance such transactions. Our most recent acquisition occurred in 2010. There is no certainty that we will identify suitable candidates at prices and terms we consider attractive, consummate any such acquisition or investment on acceptable terms, have sufficient resources to complete an identified acquisition or investment or that our strategy for pursuing acquisitions or investments will be effective. In addition, any acquisition or investment can involve a number of risks, including the existence of known liabilities or contingent liabilities or those not disclosed or known by us prior to closing an acquisition or investment. An acquisition or investment may impose additional demands on our staff that could strain our operational resources and increase the possibility of operational error, and require expenditure of substantial legal, investment banking and accounting fees. We may be required to issue ordinary shares or spend significant cash to consummate an acquisition or investment, resulting in dilution of ownership or additional debt leverage, or spend additional time and money on facilitating the acquisition or investment that otherwise would be spent on the development and expansion of our existing businesses. Following a completed acquisition or investment, failure by us and the target firm to achieve a strong, long-term relationship, or failure of the firm to realize incremental organic growth and growth through leveraging its relationship with us may result in our inability to achieve the anticipated benefits of the acquisition or investment, and could have an adverse impact on our business, financial condition and results of operations. In addition, the capital available for our use and the nature by which we deploy it is subject to the approval of our Parent in certain circumstances. Any future capital constraints imposed by our Parent may inhibit our ability to partner with new firms. See "Certain Relationships and Related Party Transactions—Relationship with Our Parent and OMGUK Following This Offering—Shareholder Agreement."
We and our Affiliates rely on certain key personnel, and our results are dependent upon our ability to retain and attract key personnel.
We and our Affiliates depend on the skills and expertise of our key investment and management personnel, and our success and growth depends on our ability to attract and retain key personnel. Our Affiliates rely heavily upon the services of certain key investment and management personnel, many of whom have managed their firms for a number of years and who primarily guide the investment decision-making processes and strategies at the firms. The loss of key investment and management
15
personnel at any of our Affiliates for any reason could have an adverse impact upon our business, results of operations and financial condition. Any of our key investment or management personnel could resign at any time, join a competitor or form a competing company. We have entered into non-competition agreements with some, but not all, of our investment and management personnel, but these agreements may not be enforceable or may not be enforceable to their full extent. In addition, we may agree to waive a non-competition agreement applicable to investment or management personnel in light of the circumstances of our relationship with that person.
All of our Affiliates have established equity plans which are intended to attract, retain and motivate key personnel and pursuant to which key Affiliate personnel may be awarded or be able to purchase equity in their firm. The equity plans provide key employees with the opportunity to participate in the appreciation in the value of their businesses. Award documents under these plans typically limit a recipient's right to provide competitive services to clients of the Affiliates or solicit employees of the Affiliates for prescribed periods. Additionally, certain of our Affiliates' key executive management personnel may have entered into, or been offered the opportunity to enter into, agreements with us that are structured to motivate and retain such personnel. However, retention strategies we and our Affiliates have put into place may not be successful and, to the extent the plans do not produce the desired results, our Affiliates may suffer a loss of valued personnel.
For certain of our Affiliates, a number of key management personnel are arriving at the point in their careers where they may be looking to limit their day-to-day involvement in their businesses or withdraw entirely. We have instituted succession planning at our Affiliates in an attempt to mitigate any disruption caused by these changes but cannot predict whether such efforts will be successful and whether the firms will be able to retain clients, assets and personnel or attract new assets and talent.
We rely upon the contributions of our senior management team to establish and implement our strategy and to manage the future growth of our business. The amount and structure of compensation and opportunities for equity ownership we offer are key components of our ability to attract and retain qualified management personnel. In connection with our transition to a public company, we intend to make certain changes to our compensation structure, as described in "Compensation Discussion and Analysis—Compensation Plans Expected Post-Offering." There is no assurance that we will be successful in designing and implementing an attractive compensation model.
We and certain of our Affiliates face risks associated with investments in the real estate and timber markets.
One of our Affiliates, Heitman, focuses on investments in private real estate equity, public real estate securities and real estate debt. Another of our Affiliates, Campbell Global, LLC, or Campbell Global, acquires and manages timberland for investors. As a result, we are exposed to the risks associated with investment in real estate and in timberland. Investment in real estate is subject to the risk of illiquidity of the investment, the possibility that cash generated from operations will not be sufficient to meet fixed obligations, changes in economic conditions affecting real estate ownership directly or the demand for real estate, the need for unanticipated expenditures in connection with environmental matters, changes in tax rates and other operating expenses, adverse changes in law, governmental rules, and fiscal policies, acts of God, environmental and waste hazards and other factors that are beyond the control of our real estate investment Affiliate. Timberland investments are subject to physical risks and economic risks. Physical risks include natural disasters, fire, pest infestation, disease, animal damage, and theft. Economic risks include price risk, supply risk, regulatory risk, demand risk, and liquidity risk. If our Affiliates do not adequately manage the unique risks associated with investments in real estate and timberland, or if any event occurs that is out of the control of our Affiliates, then our results of operations and financial condition may be adversely impacted.
16
Our Affiliates' business operations are complex, and a failure to properly perform operational tasks or maintain infrastructure could have an adverse effect on our revenues and income.
In addition to providing investment management services, our Affiliates must have the necessary operational capabilities to manage their businesses effectively in accordance with client expectations and applicable law. The required non-investment management functions include sales, marketing, portfolio recordkeeping and accounting, security pricing, trading activity, investor reporting, corporate governance, compliance, net asset value computations, account reconciliations and calculations of required distributions to accounts. Some of these functions are performed either independently or with the support of or in conjunction with us or third-party service providers that are overseen by our Affiliates. Also, certain of our Affiliates are highly dependent on specially developed proprietary systems. Any material failure to properly perform and monitor these non-investment management functions and operations, or adequately oversee the entities that provide the services, could result in potential liability to clients, regulatory sanctions, investment losses, loss of clients and reputational damage.
Reputational harm could result in a loss of assets under management and revenues for our Affiliates and us.
The integrity of our brand and reputation, as well as the integrity of the brand and reputation of each of our Affiliates, is critical to the ability of us and our Affiliates to attract and retain clients, business partners and employees and maintain relationships with consultants. We operate within the highly regulated financial services industry and various potential scenarios could result in harm to our reputation. They include internal operational failures, failure to follow investment or legal guidelines in the management of accounts, intentional or unintentional misrepresentation of our Affiliates' products and services in offering or advertising materials, public relations information, social media or other external communications, employee misconduct or investments in businesses or industries that are controversial to certain special interest groups. The negative publicity associated with any of these factors could harm our reputation and those of our Affiliates and adversely impact relationships with existing and potential clients, third-party distributors, consultants and other business partners and subject us to regulatory sanctions. Damage to our brands or reputations would negatively impact our standing in the industry and result in loss of business in both the short term and the long term.
Our brand and reputation are also tied to the brand and reputation of our Parent and those of our Parent's other subsidiaries. Immediately following this offering and, after giving effect to the transactions described herein, our Parent will indirectly own approximately % of our outstanding ordinary shares, or % if the underwriters exercise their over-allotment option in full. We exercise no control over the activities of our Parent or its affiliates. We may be subject to reputational harm, or our relationships with existing and potential clients, third-party distributors, consultants and other business partners could be harmed, if our Parent or any of its affiliates, previously, or in the future, among other things, engages in poor business practices, experiences adverse results, becomes subject to litigation or otherwise damages its reputation or business prospects. Any of these events might in turn adversely affect our own reputation, our revenues and our business prospects.
We or our Affiliates may not always successfully manage actual or potential conflicts of interests that may arise in our businesses.
As we continue to expand the scope of our business, we increasingly confront actual, potential and perceived conflicts of interest relating to our activities and the investment activities of our Affiliates. Conflicts may arise with respect to decisions by our Affiliates regarding the allocation of specific investment opportunities among accounts in which Affiliates may receive an allocation of profits and accounts in which they do not or among client accounts that have overlapping investment objectives yet different fee structures.
17
Certain client accounts of our Affiliates have similar investment objectives and may engage in transactions in the same types of securities and instruments. These transactions could impact the prices and availability of the securities and instruments in which a client account invests and could have an adverse impact on an account's performance. An Affiliate may also buy or sell positions in a client account while that or another Affiliate, on behalf of other client accounts, is undertaking a similar, differing or opposite strategy, which could disadvantage the other accounts.
The SEC and other regulators have increased their scrutiny of conflicts of interest. Our Affiliates have implemented procedures and controls to be followed when actual, potential or perceived conflicts of interest are identified, but it is possible that the procedures adopted by our Affiliates may not be effective in identifying or mitigating all conflicts which could give rise to the dissatisfaction of, or litigation by, investors or regulatory enforcement actions. Appropriately dealing with conflicts of interest is complex and difficult, and the reputations of us and our Affiliates could be damaged if we or they fail, or appear to fail, to deal appropriately with one or more potential or actual conflicts of interest. Regulatory scrutiny, litigation or reputational risk incurred in connection with conflicts of interest would adversely impact our business in a number of ways, including by making counterparties reluctant to do business with us, impeding our ability to retain or increase our assets under management, subjecting us to potential litigation and adversely impacting our results of operations.
Conflicts of interest also may arise between our Affiliates where, for example, for competitive business reasons, more than one Affiliate may seek the same business opportunity, clients or talent or make other competitive business decisions.
We may make business decisions which we believe are in the best interests of our Company but that may have indirect negative effects on one or more of our Affiliates. We also may be required to make strategic and financial or other resource allocation decisions that may directly benefit one or more Affiliates and not others. Any decision that does not directly or indirectly benefit an Affiliate could negatively impact our relationship with that Affiliate.
Equity ownership by key employees of each Affiliate is at the level of the applicable Affiliate and not at the holding company level, although employees of our Affiliates may acquire our ordinary shares. Therefore, there may be instances where the interests of an Affiliate and its key employee equity-holders may not align with ours in effecting a desired outcome.
While we endeavor to assess and resolve any conflicts in a manner that is not disruptive or detrimental to us, our Affiliates, or our Parent, there is no assurance that a resolution may be possible or the interests of all parties can be taken into account.
Impairment of our Affiliates' relationships with clients and/or consultants may negatively impact their businesses and our operating results.
Our Affiliates have strong client and consultant relationships in their core institutional marketplaces, and they depend upon these relationships to successfully market their existing products and strategies and to introduce new products and strategies. Some Affiliates may have client exposures that are meaningful to their individual businesses. As of June 30, 2014, our Affiliates' top five client relationships represented 17% of total run rate ENI management fee revenue, including equity-accounted Affiliates, and our Affiliates' top 25 clients represented 35% of run rate ENI management fee revenue, including equity-accounted Affiliates. Total run rate ENI management fee revenue reflects the sum for each account at each of our seven Affiliates, of the product of (a) assets under management in each account at June 30, 2014, multiplied by (b) the relevant management fee rate on that account. This calculation includes the management fees paid by consolidated Funds, as well as all accounts at each of our equity-accounted Affiliates. Any negative changes in these relationships that reduce the number of client or consultant contacts, restrict access to existing or potential clients, or
18
result in negative statements by a consultant, could have an adverse impact on our Affiliates' businesses and negatively impact our operating results.
The business of our Affiliates is dependent upon investment advisory agreements that are subject to negotiation, non-renewal, or termination, including termination upon assignment.
Our Affiliates derive substantially all of their revenues from the fees charged to their clients under their investment advisory agreements with those clients. The agreements generally provide for fees to be paid on the basis of the market values of assets under management, although a portion also provide for fees to be paid on the basis of investment performance against stated benchmarks.
An investment advisory agreement may be terminated by a client without penalty upon relatively short notice (typically no more than 30 days). In addition, the investment advisory agreements with registered investment companies generally may be terminated by the mutual fund or, in those instances where an Affiliate serves as a sub-adviser, the mutual fund's adviser, without penalty, upon 60 days' notice and are subject to annual approval by the mutual fund's board of directors or trustees. Clients may decide to terminate or not renew an agreement for poor investment performance or any variety of reasons beyond the control of our Affiliates. A decrease in revenues resulting from termination of an advisory agreement for any reason could have a material adverse effect on the revenue and profits of our Affiliates and a negative effect on our results of operations.
Pursuant to the Advisers Act, investment advisory agreements between our Affiliates, all of which are U.S. registered investment advisers, and their clients are not assignable without the consent of the client. As required by the Investment Company Act of 1940, or the Investment Company Act, investment advisory agreements between our Affiliates and investment company clients terminate upon their assignment. Assignment, as generally defined, includes direct assignments as well as assignments that may be deemed to occur, under certain circumstances, upon the direct or indirect transfer of a "controlling block" of the voting securities of the respective Affiliate. A transaction is not an assignment under the Advisers Act or the Investment Company Act, however, if it does not result in a change of actual control or management of the relevant Affiliate.
It is not expected that this offering will constitute an assignment of any investment advisory agreements for purposes of the Advisers Act or the Investment Company Act, as applicable. However, our Parent could decide to sell a controlling block of our voting securities in the future, in which event the contractual anti-assignment and termination provisions of the investment advisory agreements between our Affiliates and their clients may be implicated. If an assignment of an investment advisory agreement is deemed to occur, and clients do not consent to the assignment or enter into a new agreement, our results of operations could be materially and adversely affected.
The historical returns of our existing investment strategies may not be indicative of their future results or of the investment strategies we may develop in the future.
We have presented information with respect to the historical returns of our existing investment strategies throughout this prospectus, including under "Business—Products and Investment Performance". The historical returns of our Affiliates' strategies and the ratings and rankings our Affiliates or their strategies have received in the past should not be considered indicative of the future results of these strategies or of any other strategies that our Affiliates may develop in the future. The investment performance our Affiliates achieve for their clients varies over time and the variance can be wide. The ratings and rankings our Affiliates or their strategies have received are typically revised monthly. The historical performance and ratings and rankings presented herein are as of June 30, 2014 and for periods then ended unless otherwise indicated. The returns on the strategies of our Affiliates' have benefited during some periods from investment opportunities and positive economic and market conditions. In other periods, general economic and market conditions have negatively affected
19
investment opportunities and the returns on our Affiliates' strategies. These negative conditions may occur again, and in the future our Affiliates may not be able to identify and invest in profitable investment opportunities within their current or future strategies.
Pressure on fee levels of our Affiliates and changes to their mix of assets could impact our results of operations.
Our profit margins and net income are dependent on the ability of our Affiliates to maintain current fee levels for the products and services they offer. The competitive nature of the asset management industry has led to a trend toward lower fees in certain segments of the asset management market, and there can be no assurance that our Affiliates will be able to maintain their current pricing structures. Our Affiliates also may be required to restructure their fees due to regulatory changes. These factors also could inhibit the ability of our Affiliates to increase fees for certain products. A reduction in the fees charged by our Affiliates, or limited opportunities to increase fees, will reduce or limit our revenues and could reduce or limit our net income.
The fees charged by our Affiliates on their assets under management vary by asset class and produce different revenues per dollar of assets under management based on factors such as the type of assets being managed, the applicable investment strategy, the type of client and the client fee schedule. Institutional clients may have significant negotiating leverage in establishing the terms of an advisory relationship, particularly with respect to the level of fees paid, and the competitive pressure to attract and retain institutional clients may impact the level of fee income earned by an Affiliate. In order for an Affiliate to maintain its fee structure in a competitive environment, it may elect to decline to manage additional assets from potential clients who demand lower fees even though our revenues may be adversely affected in the short term.
Furthermore a shift in the mix of assets under management from assets that generate higher fees to those that generate lower fees may result in a decrease in revenues while aggregate assets under management remain unchanged or increase. Such shifts can occur as various investment strategies go in and out of favor due to competition in the industry or as a result of movements between asset classes or certain products no longer being available to investors. A decrease in revenues without a reduction in expenses will result in reduced net income.
Changes in how clients choose to access asset management services may also exert downward pressure on fees. Some investment consultants, for example, are implementing programs in which the consultant provides a range of services, including selection, in a fiduciary capacity, of asset managers to serve as sub-adviser at lower fee rates than the manager's otherwise applicable rates, with the expectation of a larger amount of assets under management through that consultant. The expansion of those and similar programs could, over time, make it more difficult for us to maintain our fee rates.
Failure by our Affiliates to comply with investment guidelines set by their clients, including the boards of mutual funds that they sub-advise, or limitations imposed by applicable law could result in a loss of assets, potential damage awards or regulatory sanctions, which could adversely impact our results of operations or financial condition.
As investment advisers, our Affiliates have fiduciary duties to their clients. Our Affiliates are required to follow specified investment guidelines established by their clients in the management of client accounts. Our Affiliates that sub-advise registered investment companies are also required to invest fund assets in accordance with guidelines contained in the Investment Company Act and applicable provisions of the Internal Revenue Code of 1986, as amended, or the Code, as well as any guidelines established by the boards of the investment companies. Affiliates that manage accounts subject to the fiduciary responsibility provisions of the Employee Retirement Income Security Act of 1974, as amended, or ERISA, must comply with the requirements of ERISA and regulations of the
20
Department of Labor in their management of those plan accounts. An Affiliate's failure to comply with applicable client and regulatory guidelines could result in losses to a client which, depending on the circumstances, could result in an Affiliate obligation to make the client whole for such losses. If an Affiliate believed that the circumstances did not justify a reimbursement, or a client believed the reimbursement offered was insufficient, the client could seek to recover damages from the Affiliate, withdraw assets from management by the Affiliate or terminate its investment advisory agreement with the Affiliate. An Affiliate that fails to follow investment guidelines or other limitations in the management of a client account may be subject to actual and threatened lawsuits, or be subject to investigations and proceedings by governmental and self-regulatory organizations and potential damages, fines or sanctions. Any of these events could harm the reputations of us and our Affiliates and adversely impact our and their results of operations and financial condition.
If our techniques for managing risk are ineffective, we may be exposed to material unanticipated losses.
In order to manage the significant risks inherent in our business, we must maintain effective policies, procedures and systems that enable us to identify, monitor and control our exposure to operational, legal and reputational risks. Our risk management methods may prove to be ineffective due to their design or implementation, or as a result of the lack of adequate, accurate or timely information or otherwise. If our risk management efforts are ineffective, we could suffer losses that could have a material adverse effect on our financial condition or results of operations. The potential for some types of operational risks, including, for example, trading errors, may be increased in periods of increased volatility, which can magnify the cost of an error. Although we have not suffered operational errors, including trading errors, of significant magnitude in the past, we may experience such errors in the future, which could be significant and the losses related to which we could be required to absorb. Additionally, we could be subject to litigation, particularly from our clients, and sanctions or fines from regulators. Our Affiliates' techniques for managing operational, legal and reputational risks in client portfolios may not fully mitigate the risk exposure in all economic or market environments, including exposure to risks that we might fail to identify or anticipate.
We or our Affiliates may be exposed to potential liability as a general partner or a controlling person.
Our Affiliates are limited liability companies of which we are, or an entity controlled by us is, the managing member. Certain of our Affiliates may serve as general partners, managing members or their equivalents for investment products that are organized as partnerships or other commingled vehicles. As such, we or an Affiliate may be exposed to liability to the limited liability company, partnership or investment vehicle or required to undertake certain obligations under applicable law that we or they otherwise would not be required to undertake as a holding company or investment adviser. In addition we may be deemed to be a control person of our Affiliates, as that term is defined in various United States federal and state statutes, and, as such, potentially liable for the acts of our Affiliates or their employees. Consequently, if under such circumstances any of our Affiliates incurs liabilities or expenses that exceed its ability to pay, we may be directly or indirectly liable for its payment to the extent provided in the governing documents of the limited liability company, partnership or investment vehicle or under applicable law. While we and our Affiliates maintain errors and omissions and general liability insurance in amounts believed to be adequate to cover certain potential liabilities, we cannot be certain that claims will not be made against us that exceed the limits of available insurance coverage, that the insurers will remain solvent and will meet their obligations to provide coverage or that an adequate amount of insurance coverage will continue to be available to us and our Affiliates at a reasonable cost. A judgment against any of our Affiliates and/or us in excess of available insurance coverage could have a material adverse impact on our business and financial condition.
21
Our expenses are subject to fluctuations that could materially impact our results of operations.
Our results of operations are dependent upon the level of our expenses and those of our Affiliates, which can vary from period to period. We and our Affiliates have certain fixed expenses that we incur as going concerns, and some of those expenses are not subject to adjustment. If our revenues decrease, without a corresponding decrease in expenses, our results of operations would be negatively impacted. While we and our Affiliates attempt to project expense levels in advance, there is no guarantee that an unforeseen expense will not arise or that we will be able to adjust our variable expenses quickly enough to match a declining asset base. Consequently, either event could have either a temporary or permanent negative impact on our results of operations.
The cost of insuring our business is meaningful and may increase.
Our insurance costs are meaningful and can fluctuate significantly from year to year. In addition, certain insurance coverage may not be available or may only be available at prohibitive costs. As we renew our insurance coverage, we may be subject to additional costs caused by premium increases, higher deductibles, co-insurance liability, changes in the size of our business or nature of our operations, litigation or acquisitions or dispositions. We may also obtain additional forms of coverage resulting from our being a public company.
We currently maintain certain insurance arrangements with our Parent and we benefit from the financial leverage our Parent brings to bear in negotiating certain insurance premiums with insurers specific to directors and officers insurance and excess errors and omission insurance. If we no longer were to be a member of our Parent's group of companies, we likely would lose the benefit of this arrangement and potentially be subject to less financially favorable insurance arrangements. Higher insurance costs and incurred deductibles, as with any expense, would reduce our net income. In addition, we may obtain additional liability insurance for our directors and officers. There have been historical periods in which directors' and officers' liability insurance and errors and omissions insurance have been available only with limited coverage amounts, less favorable terms or at prohibitive cost, and these conditions could recur.
Investments in non-U.S. markets and in securities of non-U.S. companies may involve foreign currency exchange risk, and tax, political, social and economic uncertainties, and a reduction in assets under management associated with investments in non-U.S. equities could have a disproportionate adverse impact on our results of operations.
A significant amount of our Affiliates' assets under management is represented by strategies that primarily invest in securities of non-U.S. companies. Fluctuations in foreign currency exchange rates could negatively impact the account values and the investment returns of clients who are invested in these strategies, with a corresponding reduction in management fee income. In addition, an increase in the value of the U.S. dollar relative to non-U.S. currencies could result in a decrease in the U.S. dollar value of assets under management that are denominated in non-U.S. currencies, which in turn would result in lower revenues.
Many non-U.S. financial markets are not as developed or as efficient as the U.S. financial markets and, as a result, have limited liquidity and greater price volatility and may lack established regulations. Liquidity in such markets also may be adversely impacted by political or economic events, government policies, expropriation, volume trading limits by foreign investors, and social or civil unrest. The ability to dispose of an investment and its market value may be adversely impacted by any of these factors. In addition, non-U.S. legal and regulatory financial accounting standards and practices may be different from those of the U.S., and there may be less publicly available information about non-U.S. companies and non-U.S. markets. Governments of foreign jurisdictions may assert their abilities to tax local gains and/or income of foreign investors, including clients of our Affiliates, which could adversely impact the
22
economics associated with investing in foreign jurisdictions or non-U.S. based companies. These risks also could impact the performance of strategies that invest in such markets and, in particular, strategies that concentrate investments in emerging market companies and countries.
In general, management fees for accounts that invest in non-U.S. equity markets, particularly emerging markets, are higher than those for accounts that invest in the domestic markets. Since approximately 38.5% of our Affiliates' total assets under management as of June 30, 2014 were invested in global, international and emerging markets equities, a significant reduction in assets under management associated with such investments could have a disproportionately adverse impact on our results of operations.
Our non-U.S. distribution initiatives may be unsuccessful, may expose us to other tax and regulatory risks and may not facilitate the growth of our business.
One of the primary opportunities for growth lies in expanding the geographic regions in which our Affiliates' investment products and services are distributed. To assist our Affiliates in their non-U.S. distribution, we offer the assistance of our Company-led distribution team. The success of these non-U.S. initiatives is therefore dependent upon the ability of our and our Affiliates' teams to successfully partner in non-U.S. distribution efforts and to structure products that appeal to the global markets. The inability of the Company-led distribution team and our Affiliates to successfully execute on their non-U.S. distribution plans may adversely impact the growth prospects of our Affiliates.
Our non-U.S. distribution initiative has required and will continue to require us to incur a number of up-front expenses, including those associated with obtaining regulatory approvals, as well as additional ongoing expenses, including those associated with the employment of additional support staff and regulatory compliance. Our employees routinely travel outside the United States in connection with our distribution efforts and may spend extended periods of time in one or more non-U.S. jurisdictions. Their activities outside the United States on our behalf may raise both tax and regulatory issues. If we are incorrect in our analysis of the applicability or the extent of the impact of non-U.S. tax or regulatory requirements, we could incur costs, penalties or be the subject of an enforcement or other action. We also expect that operating our business in non-U.S. markets generally will be more expensive than in the United States. To the extent that our revenues do not increase as much as our expenses in connection with our distribution initiatives outside the United States, our profitability could be adversely affected. Expanding our distribution initiatives into non-U.S. markets may also place significant demands on our existing infrastructure and employees.
Our outstanding indebtedness may impact our business and may restrict our growth and results of operations.
At the time we consummate this offering, OMAM expects to have $175.0 million of debt outstanding under a revolving credit facility with a third-party lender as described in "Unaudited Pro Forma Consolidated Financial Data."
We may incur additional indebtedness in the future for a variety of business reasons, including in relation to our acquisition strategy and in connection with our obligations under the deferred tax asset arrangement that we will enter into with OMGUK in connection with this offering (see "Certain Relationships and Related Party Transactions—Relationship with Our Parent and OMGUK Following This Offering—Deferred Tax Asset Arrangement"), and for seed or co-investment capital. We will be dependent on the cash flow generated from our Affiliates to service any indebtedness that is taken on by us.
The level of our indebtedness has important consequences to investors in our ordinary shares. For example, our level of indebtedness may require us to use a substantial portion of our cash flow from operations to pay interest and principal on our debt, which would reduce the funds available to us for working capital, capital expenditures and other general corporate purposes and may limit our ability to
23
pay future dividends. Too much debt may limit our ability to implement our business strategy; heighten our vulnerability to downturns in our business, the financial services industry or in the general economy and limit our flexibility in planning for, or reacting to, changes in our business and the financial services industry; or prevent us from taking advantage of business opportunities as they arise or successfully carrying out our plans to expand our business and our Affiliates' product offerings. Any of these consequences could have a material adverse effect on our financial condition or results of operations.
We may be unable to obtain sufficient capital and liquidity to meet the financing requirements of our business.
Historically, we have relied principally upon our Parent to provide financing to facilitate the growth of our business and, in particular, to finance our acquisition strategy and investments in new products. In connection with the Reorganization, we intend to establish independent financing facilities with third-party lenders as described in "Unaudited Pro Forma Consolidated Financial Data." Our future ability to incur debt may be restricted or limited by the regulations that govern our Parent's operations and our Parent's approval rights over our incurrence of indebtedness. We also may be subject to more onerous borrowing terms to the extent we do not have established relationships with third-party lenders. Borrowing from third-party lenders on less favorable terms could result in our having to allocate greater amounts of cash available in the future toward debt repayment and reduce cash available for other business opportunities. Our ability to finance our operations through borrowing from, and to repay maturing obligations to, our lenders will be dependent in large part on the profitability of our Affiliates and our future operating performance. Any future inability to obtain financing on reasonable terms and with reasonable restrictions on the operation of our business could impair our liquidity, have a negative impact on our growth and that of our Affiliates and negatively impact our financial condition.
Our business involves risks of potential litigation that could harm our business.
We and our Affiliates may be named as defendants or co-defendants in lawsuits, or may be involved in disputes that include the threat of lawsuits seeking substantial damages. Any such legal action, whether threatened or actual, could result in reputational damage, loss of clients and assets, increased costs and expenses in resolving a claim, diversion of employee resources and resulting financial losses.
Our Affiliates make investment decisions on behalf of their clients that could result in substantial losses to those clients. If their clients suffer significant losses or otherwise are dissatisfied with the service of one of our Affiliates, that Affiliate could be subject to the risk of legal liability or actions alleging negligent misconduct, breach of fiduciary duty, breach of contract, unjust enrichment and/or fraud. These risks often are difficult to assess or quantify and their existence and magnitude often remain unknown for substantial periods of time, even after an action has been commenced. Our Affiliates may incur substantial legal expenses in defending against litigation commenced by a client or regulatory authority. Substantial legal liability levied on any one of our Affiliates could have a material adverse effect on our business, financial condition, or results of operations and could cause significant reputational harm.
Any significant limitation on the use of our facilities or the failure or security breach of our software applications or operating systems and networks, including the potential risk of cyber-attacks, could result in the disclosure of confidential client information, damage to our reputation, additional costs, regulatory penalties and financial losses.
We and our Affiliates depend upon our principal business offices and our various centers of operation for the continued operations of our businesses. A disruption in the infrastructure that supports our businesses or prevents our employees from performing their job functions, including
24
communication failures, natural disasters, terrorist attacks and international hostilities, may have a material impact on our ability to continue business operations without interruption. Insurance and other safeguards might not be available or might only partially reimburse us for our losses.
Although we have back-up systems and disaster recovery programs in place and test their uses periodically, there can be no assurance that the recovery programs will be sufficient to mitigate any harm that may result from a disruption or disaster. Additionally, it is possible that any such disruption or disaster could have a significant impact on the general economy, domestic and local financial and capital markets or specific industries, including the financial services industry.
A significant portion of our operations relies heavily on the secure processing, storage and transmission of confidential and other information as well as the monitoring of a large number of complex transactions. With the evolving proliferation of new technologies and the increasing use of the Internet and mobile devices to conduct financial transactions, financial institutions such as us have been, and will continue to be, subject to an increasing risk of cyber incidents from these activities. We and our Affiliates take protective measures to secure information, including through system security technology. However, our technology systems may still be vulnerable to unauthorized access, computer malware or other events that have a security impact, such as an authorized employee or vendor inadvertently causing the release of confidential information or third-party unauthorized access or account takeovers, which could materially damage our operations or cause the disclosure or modification of sensitive or confidential information. Breach of our technology systems through cyber-attacks, or failure to manage and secure our technology environment, could result in interruptions or malfunctions in the operations of our business, loss of valuable information, liability for stolen assets or information, remediation costs to repair damage caused by a breach, additional costs to mitigate against future incidents and litigation costs resulting from an incident. Moreover, loss of confidential client information could harm our reputation and subject us to liability under the laws that protect personal data, resulting in increased costs or loss of revenues.
Our Affiliates and third parties with which we do business may also be sources of cybersecurity or other technological risks as we outsource certain functions. While we engage in certain actions to reduce the exposure resulting from outsourcing, such as performing onsite security control assessments, limiting third-party access to the least privileged level necessary to perform job functions, and restricting third-party processing to systems stored within our data centers, ongoing threats may result in unauthorized access, loss or destruction of data or other cyber incidents with increased costs and consequences to us such as those discussed above.
The carrying value of goodwill and other intangible assets on our balance sheet could become impaired, which would adversely affect our financial condition and results of operations.
We have recorded goodwill and intangible asset impairments in the past and could incur such charges in the future as acquisitions occur and we take on more goodwill. We review the carrying value of goodwill and intangible assets not subject to amortization on an annual basis, or more frequently if indications exist suggesting that the fair value of our intangible assets may be below their carrying values. We test the values of intangible assets subject to amortization whenever events or changes in circumstances indicate that the carrying amount of an asset may not be recoverable. Should such review indicate impairment, a write-down of the carrying value of the intangible asset could occur, resulting in a non-cash charge that may, in turn, affect our reported results of operations, financial condition and shareholders' equity.
Claims for indemnification may be substantial and have a negative impact on our financial condition.
We have engaged in a number of transactions involving the sale of businesses to third parties and to members of management of former Affiliates. As is customary in business transactions of these
25
types, we were required to and did provide indemnifications with respect to third-party claims arising out of these transactions for limited periods of time with respect to certain claims, and for unlimited periods of time with respect to other claims. While we currently are not aware of exposure or potential exposure to any claim against us for indemnification, there can be no guarantee that a claim will not arise during the relevant indemnification period and that we will not have to provide the requisite indemnification. In addition, legal challenges to any potential claim for indemnification could result in increased legal expenses.
The failure of a counterparty to meet its obligations could affect our business adversely.
Our Affiliates routinely execute transactions with counterparties in the financial industry and for the provision of services that are important to the business, and we may engage in transactions with counterparties as part of our corporate finance management function and for the provision of services. As a result, we and our Affiliates and clients have exposure to the credit, operational and other risks posed by such counterparties, including the risk of default by or bankruptcy of a counterparty. The failure of a counterparty to meet its obligations or provide the services we depend on for these or other reasons could adversely affect our ability to conduct our businesses and result in loss of client assets and potential liability.
We may be subject to financial criminal activity which could result in financial loss or damage to our reputation.
Instances of financial criminal activity, personal trading violations and other abuses, including misappropriation of assets by internal or external perpetrators, may arise despite our internal control policies and procedures. Instances of such criminal activity by financial firms and their personnel, including those in the investment management industry, have led the U.S. government and regulators to increase enforcement of existing rules relating to such activities, adopt new rules and regulations and enhance oversight of the U.S. financial industry. As we expand our international operations, we will be subject to the rules of other jurisdictions that govern and control financial criminal activities and exposed to financial criminal activities on a more global scale. Compliance with existing and new rules and regulations may have the effect of increasing our expenses. Further, should any of our or our Affiliates' personnel be linked to financial criminal activity, either domestically or internationally, we would suffer material damage to our reputation which could result in a corresponding loss of clients and/or client assets and revenue.
We and our Affiliates are vulnerable to reputational harm because we operate in an industry in which personal relationships, integrity and client confidences are of critical importance. For example, if an employee were to engage in illegal or suspicious activities, we or an Affiliate could be subject to legal or regulatory sanctions and suffer serious harm to our reputations (as a consequence of the negative perception resulting from such activities), and impairment to client relationships and the ability to attract new clients. Our Affiliates' businesses often require that they deal with confidential information. If their employees were to improperly use or disclose this information, even if inadvertently, our Affiliates and we could be subject to legal or regulatory action and suffer serious harm to our reputations and current and future business relationships.
It is not always possible to deter employee misconduct, and the precautions we take to detect and prevent this activity may not always be effective. In addition, the SEC has increased its scrutiny of the use of non-public information obtained from corporate insiders by professional investors. Employee misconduct, or even unsubstantiated allegations of misconduct, could adversely impact our reputation, current and future business relationships and our financial condition.
26
We are subject to the U.K. Bribery Act, the U.S. Foreign Corrupt Practices Act and other anti-corruption laws, as well as export control laws, customs laws, sanctions laws and other laws governing our operations. If we fail to comply with these laws, we could be subject to civil or criminal penalties, other remedial measures, and legal expenses, which could adversely affect our business, results of operations and financial condition.
Our operations are subject to anti-corruption laws, including the U.K. Bribery Act 2010, or the Bribery Act, the U.S. Foreign Corrupt Practices Act, or the FCPA, and other anti-corruption laws that apply in countries where we do business. The Bribery Act, FCPA and these other laws generally prohibit us and our employees and intermediaries from bribing, being bribed or making other prohibited payments to government officials or other persons to obtain or retain business or gain some other business advantage. We and our commercial partners operate in a number of jurisdictions that may pose a risk of potential Bribery Act or FCPA violations, and we participate in collaborations and relationships with third parties whose actions could potentially subject us to liability under the Bribery Act, FCPA or local anti-corruption laws. In addition, we cannot predict the nature, scope or effect of future regulatory requirements to which our internal operations might be subject or the manner in which existing laws might be administered or interpreted.
We are also subject to other laws and regulations governing our international operations, including regulations administered by the governments of the United Kingdom and the United States, and authorities in the European Union, including applicable export control regulations, economic sanctions on countries or persons, customs requirements and currency exchange regulations, or Trade Control Laws.
There is no assurance that we will be completely effective in ensuring our compliance with all applicable anti-corruption laws, including the Bribery Act, the FCPA or other legal requirements, including Trade Control Laws. If we are not in compliance with the Bribery Act, the FCPA and other anti-corruption laws or Trade Control Laws, we may be subject to criminal and civil penalties, disgorgement and other sanctions and remedial measures, and legal expenses, which could have an adverse impact on our business, financial condition, results of operations and liquidity. Likewise, any investigation of any potential violations of the Bribery Act, the FCPA, other anti-corruption laws or Trade Control Laws by U.K., U.S. or other authorities could also have an adverse impact on our reputation, our business, results of operations and financial condition.
Industry Risks
We operate in a competitive environment.
The investment management industry is highly competitive, with competition based on a variety of factors, including investment performance, investment management fee rates, continuity of investment professionals, and client relationships, the quality of services provided to clients, reputation and the strategies offered. We and our Affiliates compete against a broad range of domestic and international asset management firms, broker-dealers, hedge funds, investment banking firms and other financial institutions. We directly compete against these organizations with respect to investment products, distribution channels, opportunities to acquire other investment management firms and retention and recruitment of talent. The capital resources, scale, name recognition and geographic footprints of many of these organizations are greater than ours. The recent trend toward consolidation in the investment management industry, and the financial services industry in general, has served to increase the size and strength of a number of our competitors. Some investors may prefer to invest with an investment manager that is not publicly traded based on the perception that a publicly traded asset manager may focus on the manager's own growth to the detriment of investment performance for clients. Some competitors may operate in a different regulatory environment than we do, which may give them certain competitive advantages in the investment products and portfolio structures that they offer.
27
In addition, each of our Affiliates competes against other investment managers offering the same or different investment strategies. The competition in our industry results in pressure on fees which may hinder the ability of our Affiliates to compete. All of our Affiliates rely upon their investment performance as a competitive advantage, which may not always position them to compare favorably to their competitors. In certain instances, our Affiliates also may compete against one another for clients. It is likely that new competitors will enter the market as there are low costs and limited barriers to entry.
Our ability to attract assets also is dependent upon the ability of our Affiliates to offer a mix of products and services that meet client demand and their abilities to maintain investment management fees at competitive levels. There are a number of asset classes and product types that currently are not well covered by our Affiliates, such as index funds, passive ETFs and hedge funds. When these asset classes or products are in favor with either existing or potential clients, our Affiliates will miss the opportunity to attract and manage these assets and face the risk of assets being withdrawn in favor of competitors who manage the asset classes and/or provide these products. If our Affiliates are unable to compete effectively in their markets, our results of operations and potential business growth could be adversely affected.
Our sole business is asset management. As a result, we may be more impacted by trends and issues, and more susceptible to negative events impacting the asset management industry than other more diversified financial services companies that provide asset management and other financial services.
We operate in a highly regulated industry, and continually changing federal, state, local and foreign laws and regulations could materially adversely affect our business, financial condition and results of operations.
The investment management business is highly regulated and, as a result, our Affiliates are required to comply with a wide array of domestic and international laws and regulations. The requirements imposed by our regulators are designed to ensure the integrity of the financial markets and to protect customers and other third parties who deal with us, and are not designed to protect our shareholders. Accordingly, these regulators often serve to limit our activities, including through client protection and market conduct requirements.
Our Affiliates are subject to extensive regulation in the U.S. through their primary regulator, the SEC, under the Advisers Act. Those of our Affiliates that act as investment advisers or sub-advisers to registered investment companies must comply with the terms of the Investment Company Act and the rules thereunder. The Advisers Act imposes numerous obligations on registered investment advisers, including fiduciary, record keeping, advertising and operational requirements, disclosure obligations, and prohibitions on fraudulent activities. The Investment Company Act regulates the structure and operations of registered investment companies and imposes additional obligations on advisers to registered investment companies, including detailed disclosure and regulatory requirements applicable to the registered investment companies and additional compliance responsibilities which must strictly be adhered to by the funds and their advisers. Certain of our advisory Affiliates also are subject to the rules and regulations adopted by the Commodity Futures Trading Commission, or the CFTC, under the Commodity Exchange Act, by the Department of Labor, under ERISA, the Financial Industry Regulatory Authority, Inc., or FINRA, and state regulators.
The domestic regulatory environment in which we operate has seen significantly increased regulation in recent years. In particular, the Dodd-Frank Act represents a comprehensive overhaul of the financial services industry in the U.S. and includes, among other things: (i) the creation of a Financial Stability Oversight Council to identify emerging systemic risks posed by financial firms, activities and practices, and to improve cooperation among federal agencies, (ii) the creation of the Consumer Financial Protection Bureau authorized to promulgate and enforce consumer protection
28
regulations relating to financial products and services, and (iii) enhanced regulation of financial markets, including the derivatives and securitization markets. Certain provisions of the Dodd-Frank Act may require our Affiliates to change, or adopt new limitations on, the manner in which they conduct their business. The Dodd-Frank Act and the rules promulgated thereunder have also increased regulatory burdens and related reporting and compliance costs. Certain provisions may have unintended adverse consequences on the liquidity or structure of the financial markets. In addition, the scope and impact of many provisions of the Dodd-Frank Act remain to be determined by implementing regulations, some of which have involved lengthy proposal and promulgation periods and could lead to additional legislation or regulation. The Dodd-Frank Act impacts a broad range of market participants with whom our Affiliates interact or may interact. These changes may also impact the way in which our Affiliates conduct business with their counterparties and many aspects of the regulatory landscape continue to evolve. As a result of these uncertainties, the full impact of the Dodd-Frank Act on the investment management industry and on our and our Affiliates' businesses, in particular, cannot be predicted at this time.
Developments in the current regulatory environment in the U.S. may include heightened and additional examinations and inspections by regulators. Regulators also may take a more aggressive posture on bringing enforcement proceedings resulting in fines, penalties and additional remedial activities.
We and our Affiliates also are subject to the regulatory environments of the non-U.S. jurisdictions in which we and they operate, some of which also recently implemented or are in the process of implementing changes in regulations. In the United Kingdom we and our Affiliates are subject to regulation by two regulators, the Prudential Regulation Authority and the Financial Conduct Authority, which impose a comprehensive system of regulation on investment advisers and the manner in which we and they conduct our businesses. Some Affiliates are subject to and required to comply with the rules and regulations of the Irish Central Bank and the Luxembourg CSSF. We and our Affiliates are additionally subject to regulation relating to the offer and sale of financial products in each of the European Union countries in which we and they operate. The system of financial regulation in the European Union (including the U.K., Germany, Ireland, Luxembourg and Sweden) continues to develop and evolve and, as a result, the rules to which we and our Affiliates are subject (including rules relating to the remuneration of staff) are and will continue to be subject to change. Others that are registered in Australia, Canada, China, Hong Kong, Japan, South Korea, Russia, Singapore and the United Arab Emirates are subject to applicable regulations in those jurisdictions. As we execute on our growth strategy and continue to expand our distribution efforts into non-U.S. jurisdictions, including other member countries of the European Union, Latin America, the Middle East and certain other Asian countries, our Affiliates may be required to register with additional foreign regulatory authorities or otherwise comply with non-U.S. rules and regulations that currently are not applicable to our businesses and with respect to which we may have limited or no compliance experience. Our lack of experience in complying with any such non-U.S. or non-U.K. laws and regulations may increase our risk of becoming a party to litigation or subject to regulatory actions.
Our business, results of operations and financial condition may be adversely affected as a result of new or revised legislation or regulations or by changes in the interpretation or enforcement of existing laws and regulations in any of the jurisdictions in which we and our Affiliates conduct business. The ability of us and our Affiliates to function in this legislative and regulatory environment will depend on our and our Affiliates' abilities to monitor and promptly react to legislative and regulatory changes. It is impossible to determine the extent of the impact of any new laws, regulations or initiatives that may be proposed, or whether any of the proposals will become law. Any new laws or regulations could make compliance more difficult and expensive and affect the manner in which we and our Affiliates conduct business.
29
Failure to comply with applicable laws or regulations could result in fines, suspension or revocation of an Affiliate's registration as an investment adviser, suspensions of individual employees, revocation of licenses to operate in certain jurisdictions or other sanctions, which could materially adversely affect our business, financial condition and results of operations. Even if an investigation or proceeding did not result in a fine or sanction, or the fine or sanction imposed against an Affiliate or us or our respective employees by a regulator were small in monetary amount, the adverse publicity relating to an investigation, proceeding or imposition of a fine or sanction could cause us to suffer financial loss, harm our reputation and cause us to lose business or fail to attract new business which would have a direct adverse impact on our business, financial condition and results of operations.
If we were deemed an investment company under the Investment Company Act, we would become subject to burdensome regulatory requirements and our business activities could be restricted.
We do not believe that we are an "investment company" under the Investment Company Act. Generally, a company is an "investment company" if, absent an applicable exemption, it (i) is, or holds itself out as being, engaged primarily, or proposes to engage primarily, in the business of investing, reinvesting or trading in securities or (ii) engages, or proposes to engage, in the business of investing, reinvesting, owning, holding or trading in securities and owns or proposes to acquire "investment securities" having a value exceeding 40% of the value of its total assets (exclusive of U.S. government securities and cash items). We are primarily engaged in a non-investment company business. Because we control and operate our Affiliates, we believe, among other reasons, that our interests in our Affiliates are not "investment securities" as defined in the Investment Company Act. If we were to stop participating in the management of our Affiliates, our interests in our Affiliates could be deemed an "investment security" for purposes of the Investment Company Act.
We and our Affiliates intend to conduct our operations so that we will not be deemed an investment company under the Investment Company Act. However, if we were to be deemed an investment company, restrictions imposed by the Investment Company Act, including limitations on our capital structure and our ability to transact with our Affiliates, could make it impractical for us to continue our business as currently conducted and could have a material adverse effect on our financial performance and operations.
Risks Related to Our Ownership Structure
Our Parent will continue to control us after this offering and will have significant power to control our business, affairs and policies.
Upon completion of this offering, our Parent will beneficially own approximately % of our outstanding ordinary shares, or % if the underwriters exercise their over-allotment option in full. As a result of this ownership, and pursuant to the rights granted to our Parent under the Shareholder Agreement that we will enter into with our Parent prior to or concurrently with the consummation of this offering, our Parent will have significant power to control our business, affairs and policies, including the election of directors and, through the election of directors, the appointment of management, the adoption of amendments to our articles of association and the number of ordinary shares available for issuance under our equity incentive plans for our prospective and existing employees. This concentration of ownership may have the effect of delaying or preventing a change in control of us or discouraging others from making tender offers for our ordinary shares, which could prevent shareholders from receiving a premium for their ordinary shares. It also may make it difficult for other shareholders to replace management and may adversely impact the trading price of our ordinary shares because investors often perceive disadvantages in owning ordinary shares in companies with controlling shareholders.
30
Pursuant to the Shareholder Agreement that we will enter into with our Parent, our Parent will, for so long as it remains the majority owner of our outstanding ordinary shares, have the right to nominate a majority of the directors to our Board of Directors and, for so long as it owns certain specified percentages of our outstanding ordinary shares that are less than a majority but greater than 7%, the right to nominate a certain number of directors to our Board of Directors. Our Board of Directors intends to adopt policies and procedures prior to the consummation of this offering, which will give our Parent significant control over certain matters, including budgets, business strategy, acquisitions, expenditures, financings, dividends, insurance and compensation, and will require us to comply with certain policies and procedures similar to those at our Parent.
Pursuant to the Shareholder Agreement, beginning on the date that our Parent ceases to beneficially own more than 50% of our outstanding ordinary shares and ending on the date our Parent ceases to beneficially own more than 25% of our outstanding ordinary shares, our Parent will have approval rights over various matters, including:
- •
- any merger or acquisition with consideration paid or payable (including a pro rata share of the debt assumed) of more than
$100 million, or any disposition of assets with a fair market value of more than $100 million, involving us or one of our subsidiaries or controlled affiliates, on the one hand, and any
other person, on the other hand;
- •
- any incurrence or guarantee of (or grant of a lien with respect to) external recourse debt in an amount greater than
$300 million, plus the principal amount of the outstanding external debt on the date that our Parent ceases to beneficially own more than 50% of our outstanding ordinary shares;
- •
- any issuance of share capital other than (i) issuances of equity awards to directors or employees pursuant to a
compensation plan or (ii) issuances of share capital in connection with an acquisition involving a consideration payable not exceeding $100 million;
- •
- entry into or termination of any strategic joint venture or strategic alliance involving assets in excess of
$100 million;
- •
- any declaration or payment of a dividend other than in accordance with our dividend policy in effect as of the date that
our Parent ceases to beneficially own more than 50% of our outstanding ordinary shares;
- •
- listing or delisting of any securities on a securities exchange;
- •
- any agreement or arrangement that would conflict with the terms of the Shareholder Agreement;
- •
- any amendment to our constitutional documents; and
- •
- any filing or petition under bankruptcy laws, admission of insolvency or similar actions by us or any of our subsidiaries or controlled affiliates, or our dissolution or winding-up.
This concentration of ownership and the approval rights of our Parent will limit your ability to influence corporate matters. For information regarding the beneficial ownership of our outstanding ordinary shares by our Parent, see "Security Ownership of Certain Beneficial Owners and Management." For more information regarding our Shareholder Agreement with our Parent, see "Certain Relationships and Related Party Transactions—Relationship with Our Parent and OMGUK Following This Offering—Shareholder Agreement."
We will be a "controlled company" within the meaning of NYSE Listed Company Manual and, as a result, will qualify for, and intend to rely on, exemptions from certain corporate governance requirements.
Upon the closing of this offering, our Parent will continue to beneficially own a majority of our ordinary shares. As a result, we will be a "controlled company" within the meaning of the NYSE Listed Company Manual. Under the NYSE Listed Company Manual, a company of which more than 50% of
31
the voting power is held by an individual, group or another company is a "controlled company" and may elect not to comply with certain corporate governance requirements in the NYSE Listed Company Manual, including:
- •
- the requirement that a majority of our Board of Directors consist of independent directors;
- •
- the requirement that we have a nominating/corporate governance committee that is composed entirely of independent
directors; and
- •
- the requirement that we have a compensation committee that is composed entirely of independent directors.
Following this offering, we intend to utilize the exemptions to each of the requirements listed above. Accordingly, you will not have the same protections afforded to shareholders of companies that are subject to all of the NYSE corporate governance requirements of the NYSE Listed Company Manual. See "Management—Composition of our Board of Directors and Director Independence."
If our Parent sells a controlling interest in us to a third party in a private transaction, you may not realize any change-of-control premium on our ordinary shares and we may become subject to the control of a presently unknown third party.
Following the completion of this offering, our Parent will beneficially own a substantial majority of our ordinary shares. Our Parent will have the ability, should it choose to do so, to sell some or all of our ordinary shares in a privately negotiated transaction, which, if sufficient in size, could result in a change of control of us. The ability of our Parent to privately sell such shares may not be subject to any requirement for a concurrent offer to be made to acquire all of our ordinary shares that will be publicly traded hereafter, which could prevent you from realizing any change-of-control premium on your ordinary shares that may otherwise accrue to our Parent upon its private sale of our ordinary shares. Additionally, if our Parent privately sells a significant equity interest in us, we may become subject to the control of a presently unknown third party. Such third party may have interests that conflict with the interests of our other shareholders.
Our Parent's continuing significant interest in us following this offering may result in conflicts of interest.
For as long as our Parent continues to beneficially own a significant amount of our outstanding ordinary shares, it will continue to be able to strongly influence or effectively control our decisions. See "Security Ownership of Certain Beneficial Owners and Management" and "—Our Parent will continue to control us after this offering and will have significant power to control our business, affairs and policies." Moreover, as long as our Parent continues to beneficially own more than 50% of our issued share capital, it will be able to determine the outcome of any corporate actions requiring approval of our shareholders by way of ordinary resolution (as such matters require approval by at least 50% of shareholders present and voting at the meeting at which the resolution is proposed). In addition, for so long as our Parent continues to beneficially own more than 75% of our issued share capital, it will be able to determine the outcome of any corporate actions requiring approval of our shareholders by way of special resolution, including any amendments to our constitutional documents (as such matters require approval by at least 75% of shareholders present and voting at the meeting at which the resolution is proposed).
Our Parent will also have the director nominations and approval rights described in "Certain Relationships and Related Party Transactions—Relationship with Our Parent and OMGUK Following This Offering—Shareholder Agreement." Because our Parent's interests may differ from those of other shareholders, actions our Parent takes or omits to take with respect to us, for as long as it is our controlling shareholder, including those corporate or business actions requiring its prior affirmative written consent or vote, may not be as favorable to other shareholders as they are to our Parent.
32
The interests of our Parent could conflict in material respects with those of our other shareholders. For example, our Parent (through its control of our Board of Directors or pursuant to consent rights in the Shareholder Agreement) may prevent us from incurring indebtedness or making acquisitions with our own capital if such actions would adversely affect its capital ratios on a consolidated basis, negatively affect its credit rating or otherwise influence its financial metrics. Our Parent also could, for similar reasons, exert control over the amount and timing of our investments and dispositions, cause us to sell revenue-generating assets or control the issuance of additional ordinary shares. Any such actions by our Parent could affect the amount of cash available for distribution to shareholders. In addition, our Parent may from time to time acquire and hold interests in businesses that compete directly or indirectly with us. It also may pursue acquisition opportunities that may be complementary to our business and, as a result, those acquisition opportunities may not be available to us. Our Parent may have tax positions that are different from ours which could influence its decisions regarding whether and when to dispose of assets and whether and when to incur new or refinance existing indebtedness. In addition, the structuring of future transactions may take into consideration our Parent's tax considerations even where no similar benefit would accrue to us.
Our Parent is also allowed to take into account the interests of parties other than us in resolving conflicts of interest, which has the effect of limiting its duties (including fiduciary duties) to our shareholders. Other affiliates of our Parent and existing and former personnel employed by our Parent may not be subject to non-competition, non-solicitation and confidentiality agreements to which members of our management and those of our Affiliates are subject and thus may not be prohibited from engaging in other businesses or activities, including those that might be in direct competition with us. Our Parent also may control the enforcement of obligations owed to us by it and its affiliates and decide whether to retain separate counsel or others to perform services for us.
The Shareholder Agreement and our Board's approach to corporate governance and risk management, including policies which our Board of Directors intends to adopt prior to the consummation of this offering, which will give our Parent significant control over our business, may impose additional controls and information sharing by us and our Affiliates from that deemed to be standard in the investment management industry. While overlaying these additional governance and risk management structures onto the highly regulated investment management business may be viewed as a desirable added layer of regulatory oversight, it may be viewed by Affiliates and potential acquisition targets as being overly cumbersome, controlling and costly and thus a competitive deterrent to a third party becoming affiliated with us.
Through participation in our Parent's incentive compensation plans, our executive officers, one of whom also serves as a director of our Company, have acquired shares or been granted restricted shares of our Parent, and they may continue to participate in such plans following this offering. As a result, their ownership of shares of our Parent may exceed their ownership or rights to acquire ordinary shares of our Company at the time of this offering and into the future, which may present a conflict of interest for the executive.
Our ability to pay regular dividends to our shareholders is subject to the discretion of our Board of Directors and our Parent and may be limited by our holding company structure and applicable provisions of the laws of England and Wales.
Following completion of this offering, we will target a dividend payout as described in "Dividend Policy." Beginning on the date that our Parent ceases to beneficially own more than 50% of our outstanding ordinary shares and ending on the date that our Parent ceases to beneficially own at least 25% of our outstanding ordinary shares, the approval of our Parent will be required to declare any dividend other than in accordance with the dividend policy in effect on the date our Parent ceases to beneficially own more than 50% of our outstanding ordinary shares. In addition, with the approval of our Parent (for so long as required), our Board of Directors may change the amount or frequency of dividends or discontinue the payment of dividends entirely. In addition, as a holding company, we will
33
be dependent upon the ability of our Affiliates to generate earnings and cash flows and distribute them to us so that we may pay dividends to our shareholders. The ability of our Affiliates to distribute cash to OMAM will be subject to their operating results, cash requirements and financial condition, the applicable provisions of governing law which may limit the amount of funds available for distribution, their compliance with covenants and financial ratios related to existing or future indebtedness, and their other agreements with third parties. As a consequence of these various limitations and restrictions, we may not be able to make, or may have to reduce or eliminate, the payment of dividends on our ordinary shares.
Some of our directors are executive officers of our Parent.
All of our directors immediately following this offering will have been designated to our Board of Directors by our Parent. Three of these directors will be officers or employees of our Parent. Because of their positions as an officer or employee of our Parent, these three directors own substantial amounts of shares of our Parent. Ownership interests of these three directors in shares of our Parent, or service of certain of our directors as officers of our Parent, may create, or may create the appearance of, conflicts of interest when a director is faced with a decision that could have different implications for the two companies. These potential conflicts could arise, for example, over matters such as the desirability of an acquisition opportunity, employee retention or recruiting, capital management or our dividend policy and could result in our Company taking actions that are in the best interests of our Parent but not our other shareholders.
Our separation from our Parent could have a negative impact on our business and results of operations due to our Parent's strong brand and reputation.
As a wholly-owned subsidiary of our Parent, we have benefited from the use of the "Old Mutual" brand name and logo. We believe the association with our Parent has provided us with preferred status among a variety of service providers, vendors and others due to our Parent's globally recognized brand, perceived high quality products and services and strong capital base and financial strength. Immediately prior to the completion of this offering, we intend to enter into a transitional servicemark license agreement with OMUSH, our Parent and, solely for the intellectual property owned by it applicable to the agreement, Old Mutual Life Assurance Company (South Africa) Ltd., or OMLACSA, which we refer to as the Servicemark Agreement. Pursuant to the Servicemark Agreement, our Parent and OMLACSA will grant us a limited, non-exclusive, fully paid-up, royalty-free, non-transferable, non-sublicensable license to use certain trademarks, servicemarks, names and logos, including the name "Old Mutual," with respect to our business and in connection with this offering, worldwide, subject to certain exceptions set forth in the Servicemark Agreement. The license term shall be for the period commencing on the date of the closing of this offering and ending six months after the date on which our Parent ceases to directly or indirectly own a majority of our outstanding ordinary shares. After this license expires, we must cease using the licensed intellectual property and any benefits that we derived from the use of the "Old Mutual" brand name and logo will likely be diminished or eliminated.
In addition, certain of our Parent's other affiliates have established investment advisory and other investment-advisory related relationships with our Affiliates pursuant to which our Affiliates derive revenue. For the quarter ended June 30, 2014, our Parent and its subsidiaries (other than the Company and our Affiliates) contributed less than 2% of total ENI revenue including equity-accounted Affiliates. We cannot predict whether these relationships would continue when we are no longer a wholly-owned subsidiary of our Parent.
This offering could adversely impact our relationships with certain of our current or potential business partners as we may no longer be viewed as a part of our Parent's group of companies. If we no longer are entitled to benefit from the relationship with our Parent as a result of this offering, we may not be able to obtain certain services at the same level or obtain the same benefit through new, independent relationships with third-party vendors. Likewise, we may not be able to replace the service
34
and arrangement in a timely manner or on terms and conditions, including cost, as favorable as those we previously have received as a subsidiary of our Parent. Some third parties may re-price, modify or terminate their vendor relationships with us after we are no longer a wholly-owned subsidiary of our Parent.
The risks relating to our separation from our Parent could materialize or evolve at any time, including immediately upon the completion of this offering, when our Parent's beneficial ownership in our ordinary shares will decrease to approximately % (or approximately % if the underwriters' over-allotment option to purchase additional shares is exercised in full), and at a later date if our Parent were to decide to decrease its ownership of our ordinary shares.
We cannot accurately predict the impact that our separation from our Parent will have on our business and the businesses of our Affiliates, distribution partners, service providers, vendors and other business partners.
Risks Related to Our Tax Matters
The Internal Revenue Service, or the IRS, may not agree to treat OMAM as a foreign corporation for U.S. federal tax purposes.
Although OMAM is incorporated in England and Wales, which are part of the United Kingdom, the IRS may assert that it should be treated as a U.S. corporation (and, therefore, a U.S. tax resident) for U.S. federal tax purposes pursuant to section 7874 of the Code. For U.S. federal tax purposes, a corporation generally is considered a tax resident in the jurisdiction of its organization or incorporation. Because OMAM is a United Kingdom incorporated entity, it would generally be classified as a foreign corporation (and, therefore, a non-U.S. tax resident) under these rules. Section 7874 of the Code provides an exception under which a foreign incorporated entity may, in certain circumstances, be treated as a U.S. corporation for U.S. federal tax purposes.
For OMAM to be treated as a foreign corporation for U.S. federal tax purposes under section 7874 of the Code, immediately after the Reorganization, either (i) the former stockholders of OMUSH, i.e., OMGUK, must own (within the meaning of section 7874 of the Code) less than 80% (by both vote and value) of our ordinary shares by reason of holding shares in OMUSH immediately prior to the Reorganization, excluding for this purpose shares owned by the expanded affiliated group including OMAM, or (ii) OMAM must have substantial business activities in the United Kingdom (taking into account the activities of our expanded affiliated group).
Based on the rules for determining share ownership under section 7874 of the Code, in particular the rule excluding shares owned by OMGUK, which should be treated as a member of the expanded affiliated group including OMAM, we believe that OMGUK should be treated as owning less than 80% of our ordinary shares after the Reorganization and that, therefore, OMAM should be treated as a foreign corporation for U.S. federal income tax purposes, although no assurances can be given in this regard. If OMAM were to be treated as a U.S. corporation, income it earned would become subject to U.S. taxation, and the gross amount of any dividend payments to its non-U.S. shareholders could be subject to 30% U.S. withholding tax, depending on the application of any income tax treaty that might apply to reduce the withholding tax.
For further discussion of the application of section 7874 of the Code to the Reorganization, see "Material U.S. Federal Tax Considerations for Holders of Ordinary Shares—Tax Consequences of the Reorganization."
Future changes to the tax laws under which we should be treated as a foreign corporation for U.S. federal tax purposes and changes in other tax laws relating to multinational corporations could adversely affect us.
Under current law, as noted above, OMAM should be treated as a foreign corporation for U.S. federal tax purposes. Changes to section 7874 of the Code or the U.S. Treasury regulations
35
promulgated thereunder or future IRS guidance could affect OMAM's status as a foreign corporation for U.S. federal tax purposes, and any such changes or future IRS guidance could have prospective or retroactive application. In addition, recent legislative proposals have aimed to expand the scope of U.S. corporate tax residence. Such legislation, if passed, could also affect OMAM's status as a foreign corporation for U.S. federal tax purposes. Any of these changes to such laws or regulations, or future IRS guidance, could adversely affect us.
Moreover, the U.S. Congress, government agencies in non-U.S. jurisdictions where we and our Affiliates do business, and the Organization for Economic Co-operation and Development have each recently focused on issues related to the taxation of multinational corporations. As a result, the tax laws in the U.S. and other countries in which we and our Affiliates do business could change on a prospective or retroactive basis, and any such changes could adversely affect us.
Section 7874 of the Code could limit OMUSH's ability to utilize its U.S. tax attributes to offset certain U.S. taxable income, if any, generated by certain specified transactions for a period of time following the Reorganization.
Following the acquisition of a U.S. corporation by a foreign corporation, section 7874 of the Code can limit the ability of the acquired U.S. corporation and its U.S. affiliates to utilize U.S. tax attributes such as net operating losses to offset U.S. taxable income resulting from certain transactions.
These limitations will apply if, immediately after the Reorganization, either (i) the former stockholder of OMUSH, i.e., OMGUK, owns (within the meaning of section 7874 of the Code) at least 60% (by both vote and value) of our ordinary shares by reason of holding shares in OMUSH immediately prior to the Reorganization, excluding for this purpose shares owned by the expanded affiliated group including OMAM, or (ii) we do not have substantial business activities in the United Kingdom (taking into account the activities of our expanded affiliated group).
Based on the rules for determining share ownership under section 7874 of the Code, in particular the rule excluding shares owned by OMGUK, which should be treated as a member of the expanded affiliated group including OMAM, we believe that OMGUK should be treated as owning less than 60% of our ordinary shares after the Reorganization, and that therefore, OMUSH should not be subject to the limitations described above, although no assurances can be offered in this regard. If such limitations were to apply, the U.S. consolidated group that includes OMUSH would owe potentially more U.S. tax due to the inability to utilize these tax attributes, but there would likely be a corresponding reduction in the obligation of OMAM to make payments under the deferred tax asset arrangement, in the same or subsequent periods. For further discussion of the deferred tax asset arrangement, see "Certain Relationships and Related Party Transactions—Relationship with Our Parent and OMGUK Following This Offering—Deferred Tax Asset Arrangement."
For further discussion of the application of section 7874 of the Code to the Reorganization, see "Material U.S. Federal Tax Considerations for Holders of Ordinary Shares—Tax Consequences of the Reorganization."
Dividends and interest from OMUSH to OMAM, and dividends, interest or other income from foreign entities owned by Affiliates or investment in other foreign countries may be subject to withholding taxes.
Under U.S. federal income tax law, dividends and other distributions from Affiliates of OMUSH to OMUSH and from OMUSH to OMAM UK Limited, or UK Sub, should not be subject to U.S. withholding tax. Additionally, dividends from OMAM US, Inc., or US Sub, to OMAM should not be subject to U.S. withholding tax under the income tax treaty between the United Kingdom and the United States, or the Treaty, provided that OMAM satisfies the minimum holding period requirements set forth in the Treaty. Under U.S. federal income tax law, interest paid by OMUSH to UK Sub should not be subject to U.S. withholding tax and, under the Treaty, interest paid by US Sub to OMAM should also not be subject to U.S. withholding tax. The IRS, however, may challenge any determination
36
that OMAM is eligible for benefits under the Treaty, or may assert that OMAM does not qualify for a complete exemption from withholding tax on dividends under the Treaty. If OMAM is not eligible for benefits under the Treaty, the gross amounts of such dividends or interest would be subject to a 30% U.S. withholding tax. If OMAM qualifies for benefits under the Treaty, but not for a complete exemption from withholding tax on dividends, the gross amount of such dividends should nevertheless qualify for a reduced withholding tax rate of 5%.
Under U.K. law, dividends and other distributions from a U.K. corporation are not subject to U.K. withholding tax. However, dividends, interest or other income earned by OMUSH or Affiliates of OMUSH from foreign entities that OMUSH or such Affiliates control or have invested in may be subject to foreign withholding taxes. Unless our share of these withholding taxes is fully credited against our U.S. or U.K. income tax liability or fully refunded, it could increase our aggregate tax burden. Although we intend to arrange the ownership of our foreign subsidiaries, our intercompany dividends, interest and other payments and our investments in foreign countries on our own behalf and on behalf of our clients with a view to minimizing the incurrence of such withholding taxes, there can be no assurance that such arrangements will have the intended result.
If we were treated as a "controlled foreign corporation" for U.S. federal income tax purposes, U.S. holders of 10% or more of the voting power of our ordinary shares may be subject to U.S. federal income taxation at ordinary income tax rates on undistributed earnings and profits.
While we do not believe that we should be treated as a controlled foreign corporation, or CFC, for U.S. federal income tax purposes, no assurances can be offered in this regard. We will generally be classified as a CFC if more than 50% of our outstanding ordinary shares, measured by reference to voting power or value, are owned (directly, indirectly or by attribution) by "10% U.S. Shareholders." For this purpose, a "10% U.S. Shareholder" is any U.S. person that owns directly, indirectly or by attribution, 10% or more of the voting power of our outstanding ordinary shares. If we are classified as a CFC, a 10% U.S. Shareholder may be subject to U.S. federal income taxation at ordinary income tax rates on all or a portion of our undistributed earnings and profits attributable to certain categories of passive income and certain other income described in Subpart F of the Code, and may also be subject to U.S. federal income taxation at ordinary income tax rates on any gain realized on a sale of ordinary shares, to the extent of our current and accumulated earnings and profits attributable to such shares. The CFC rules are complex, and U.S. persons that are, or may be, 10% U.S. Shareholders are urged to consult their own tax advisors regarding the possible application of the CFC rules to them in their particular circumstances.
If we were treated as a passive foreign investment company for U.S. federal income tax purposes, U.S. investors in our ordinary shares could be subject to adverse U.S. federal income tax consequences.
For U.S. federal income tax purposes, a foreign corporation is classified as a passive foreign investment company, or PFIC, for any taxable year if either (i) 75% or more of its gross income for such taxable year is "passive income" (as defined for such purposes) or (ii) 50% or more of the value of the assets held by such corporation (based on an average of the quarterly values of the assets) during such taxable year is attributable to assets that produce passive income or that are held for the production of passive income.
As discussed in "Material U.S. Federal Tax Considerations for Holders of Ordinary Shares," we do not believe that we are currently a PFIC, and we do not anticipate becoming a PFIC in the foreseeable future; however, no assurances can be offered in this regard. The tests for determining PFIC status are applied annually after the close of the taxable year. It is difficult to accurately predict future income and assets relevant to this determination and no ruling from the IRS or opinion of counsel has been or will be sought with respect to PFIC status. Whether we are a PFIC will depend on our particular facts and circumstances (such as the valuation of our assets, including goodwill and other intangible assets, the treatment of intercompany interest income, etc.) and may also be impacted by the application of
37
the PFIC rules, which are subject to differing interpretations. The fair market value of our assets is expected to depend, in part, upon (a) the market price of our ordinary shares and (b) the composition of our income and assets, which will be impacted by how, and how quickly, we spend any cash that is raised in any financing transaction. Accordingly, we cannot assure U.S. holders that we are not, or will not become, a PFIC. If we should determine that we are a PFIC, we will attempt to notify U.S. holders, although there can be no assurance that we will be able to do so in a timely and complete manner. If we are a PFIC for any taxable year during which a U.S. holder holds our ordinary shares, we generally will continue to be treated as a PFIC with respect to such U.S. holder for all succeeding taxable years during which such holder holds our ordinary shares, although a U.S. holder may avoid some of the adverse effects of the PFIC regime by making a deemed sale election with respect to our ordinary shares after we have ceased being treated as a PFIC.
If we are properly characterized as a PFIC, U.S. holders of our ordinary shares would be subject to adverse U.S. federal income tax consequences, such as ineligibility for any preferred tax rates on capital gains, or on actual or deemed dividends, interest charges on certain taxes treated as deferred, and additional annual reporting requirements under U.S. federal income tax laws and regulations. Whether or not U.S. holders of our ordinary shares make a timely mark-to-market election may impact the U.S. federal income tax consequences to U.S. holders with respect to the acquisition, ownership and disposition of our ordinary shares and any distributions such U.S. holders may receive. Investors should consult their own tax advisors regarding all aspects of the application of the PFIC rules to our ordinary shares.
Failure to comply with the tax laws of the United States, the United Kingdom or other jurisdictions, which laws are subject to potential legislative, judicial or administrative change and differing interpretations, possibly on a retroactive basis, may result in erroneous filings, negative impact to income and reputational damage.
We and our Affiliates are subject to a range of taxes and tax audits. Tax and other regulatory authorities may disagree with tax positions taken by us and our Affiliates based on our, or their, interpretations of the relevant tax laws, which could result in erroneous filings, retroactive adverse impact on income, the loss of tax benefits and reputational damage. We will regularly assess the likelihood of favorable or unfavorable outcomes resulting from these examinations to determine the adequacy of our provision for income taxes, which will require estimates and judgments. Although we will make these tax estimates on a reasonable basis, there can be no assurance that the tax authorities will agree with such estimates and judgments. From time to time, we may have to engage in litigation to attempt to achieve the results reflected in our estimates, which may be time-consuming and expensive and may have other adverse impacts. There can be no assurance that we will be successful in any such litigation or that any final determination of our tax liability will not be materially different from the historical treatment reflected in our historical income tax provisions and accruals. Any future changes to tax laws or interpretations could have a material impact on our effective tax rate and subsequently our results of operations.
While we believe that being incorporated in the United Kingdom should help us maintain a competitive worldwide effective corporate tax rate, we cannot give any assurance as to what our effective tax rate will be. This is because, among other things, of uncertainties regarding the tax policies of all the jurisdictions where we operate our business and uncertainties regarding the application to our structure, which is complex, of the tax laws of various jurisdictions, including, without limitation, the United States and the United Kingdom. Because of this uncertainty, our actual effective tax rate may vary from our expectation and that variance could be material. Additionally, the tax laws of the United States, the United Kingdom or other jurisdictions, or the administrative or judicial interpretations thereof, could change in the future, possibly with retroactive effect, and such changes could cause a material change in our effective tax rate.
38
If various U.S. federal legislative proposals and modifications to existing tax treaties between the U.S. and foreign countries are enacted, they could result in a material increase in our U.S. and state taxes.
Proposals have been introduced in the U.S. Congress that, if ultimately enacted, could either limit treaty benefits on certain payments made by our Affiliates or their subsidiaries or subject the earnings from non-U.S. subsidiaries of our Affiliates to taxation, or both. We cannot predict the outcome of any specific legislative proposals. However, since we operate or have operations in a number of foreign jurisdictions, our plans for expansion or our results of operations in such jurisdictions could be adversely affected if any adopted proposals resulted in an increase in our tax burden, costs of our tax compliance or otherwise adversely affected our results of operations and cash flows.
Risks Related to This Offering
Our ordinary shares have no prior market, and our share price may decline after this offering.
Although we intend to list our ordinary shares on the NYSE, an active public trading market for our ordinary shares may not develop or, if it develops, may not be maintained after this offering, and we cannot predict how liquid the market for our ordinary shares might become. Although certain of the underwriters have advised us that they intend to make a market in our ordinary shares, they are not obligated to do so. The underwriters may also discontinue any market making activities at any time, in their sole discretion, which could further negatively impact your ability to sell our ordinary shares or the prevailing market price at the time you choose to sell. If an active trading market does not develop, you may have difficulty selling your ordinary shares at an attractive price or at all. For example, the NYSE imposes certain securities trading requirements, including minimum trading price, minimum number of shareholders and minimum market capitalization. We and the representatives of the underwriters will negotiate to determine the initial public offering price. The initial public offering price may not reflect the price at which investors in the market will be willing to buy and sell our ordinary shares following this offering and may be higher than the trading price of our ordinary shares following this offering. As a result, there can be no assurance that following this offering our ordinary shares will trade at a price equal to or greater than the offering price.
The trading price of our ordinary shares may be volatile, and you may not be able to sell your ordinary shares at or above the initial public offering price.
The trading price and volume of our ordinary shares may be highly volatile and could be subject to wide fluctuations in response to various factors. Some of the factors that may cause the trading price and volume of our ordinary shares to fluctuate include:
- •
- fluctuations in our annual or quarterly financial results, level of net client cash inflows or outflows or our AUM or the
annual or quarterly financial results of companies perceived to be similar to us;
- •
- changes in, or a failure to meet, estimates of our financial results or changes in recommendations by securities analysts;
- •
- low number of ordinary shares available for public trading;
- •
- the entrance into the market and success of new competitors;
- •
- our acquisition or disposition of Affiliates;
- •
- our ability to hire and retain qualified personnel, including key personnel;
- •
- changes in the regulatory environment related to our business and industry;
- •
- litigation or regulatory actions involving us;
- •
- investors' general perception of us or the investment management industry generally;
39
- •
- performance of our Affiliates' investment products on an absolute basis or relative to benchmarks or peers;
- •
- publication of research reports about us or the investment management industry, or the failure of securities analysts to
cover our ordinary shares after this offering;
- •
- adverse market reactions to any indebtedness we may incur or securities we may issue in the future;
- •
- actions by shareholders;
- •
- changes in market valuations of similar companies;
- •
- changes in general economic, industry and market conditions; and
- •
- regulatory compliance costs.
In addition, if the stock market in general experiences a loss of investor confidence, the trading price of our ordinary shares could decline for reasons unrelated to our business, financial condition or results of operations. The price of our ordinary shares may be impacted by changes in securities prices to a greater extent than businesses outside of our industry. This is because as securities prices in general decline, the price of our ordinary shares may be impacted not only by this general decline but also by the impact of the general decline on our assets under management and revenue.
Some companies that have had volatile market prices for their securities have had securities class actions filed against them. If a lawsuit were filed against us, regardless of its merits or outcome, it likely would result in substantial costs and divert management's attention and resources. This could have a material adverse effect on our business, results of operations and financial condition.
Future sales of our ordinary shares by us, OMGUK or other shareholders could cause our share price to decline.
If we, OMGUK or other shareholders sell, or indicate an intention to sell, or there is a perception that they might sell, substantial amounts of our ordinary shares in the public market after the contractual lock-up agreements described below and other restrictions on resale lapse, the trading price of our ordinary shares could decline below the initial public offering price or the then-current trading level. Upon completion of this offering we expect to have ordinary shares outstanding. Of these shares, ordinary shares will be subject to a 180-day contractual lock-up (subject to extension) with the underwriters. Certain of the representatives of the underwriters may permit our officers, directors, employees and current shareholders who are subject to the contractual lock-up to sell ordinary shares or to demand piggy-back registration rights prior to the expiration of the lock-up agreements.
Sales by OMGUK or other shareholders or the possibility that these sales may occur also may make it more difficult for us to raise additional capital by selling equity securities in the future, at a time and price that we deem appropriate.
Pursuant to a registration rights agreement that we will enter into with our Parent, we will agree to use our reasonable best efforts to file registration statements from time to time for the sale of ordinary shares held by OMGUK now or in the future. See "Certain Relationships and Related Party Transactions—Relationship with Our Parent and OMGUK Following This Offering—Registration Rights Agreement." See also "Ordinary Shares Eligible for Future Sale" for further details regarding the number of ordinary shares eligible for sale in the public market after this offering.
We cannot predict the size of future issuances of our ordinary shares or the effect, if any, that future issuances and sales of our ordinary shares may have on the market price of our ordinary shares. Sales or distributions of substantial amounts of our ordinary shares, including shares issued in connection with an acquisition, or the perception that such sales or distributions could occur, may cause the market price of our ordinary shares to decline.
40
The pro forma net tangible book value per share of our ordinary shares is lower than the offering price of our ordinary shares. You will experience substantial dilution as a result of investing in this offering.
The initial public offering price per share is substantially higher than the pro forma net tangible book value per share of our ordinary shares outstanding. As a result, investors purchasing ordinary shares in this offering will experience immediate substantial dilution of $ comparing the tangible book value per ordinary share to the offering price (based on the mid-point of the range on the front cover of the prospectus).
We will incur additional costs due to operating as a public company whose ordinary shares are publicly traded in the United States, and our management expects to devote substantial time to compliance with our public company legal and reporting obligations.
As a public company whose ordinary shares are traded in the United States, we will incur additional legal, accounting and other expenses that we did not incur as a private company. In addition, we will be subject to the reporting requirements of the Securities Exchange Act of 1934, as amended, or the Exchange Act, and will be required to implement specific corporate governance practices and adhere to a variety of reporting requirements under the Sarbanes-Oxley Act of 2002, or Sarbanes-Oxley, and the related rules and regulations of the SEC, as well as the rules of the NYSE. The Exchange Act will require us to file annual, quarterly and current reports with respect to our business and financial condition. Our management and other personnel will need to devote substantial time to compliance with our public company obligations. Moreover, these rules and regulations will increase our legal and financial compliance costs and will make some activities more time-consuming and costly. For example, we expect these new rules and regulations to make it more difficult and more expensive for us to obtain director and officer liability insurance, and we may be required to incur additional costs to maintain the same or similar coverage.
In addition, Sarbanes-Oxley requires, among other things, that we maintain effective internal control over financial reporting and disclosure controls and procedures. In particular, commencing with our Annual Report on Form 10-K for fiscal year 2015, we must perform system and process evaluation and testing of our internal control over financial reporting to allow management to report on the effectiveness of our internal control over financial reporting, as required by Section 404 of Sarbanes-Oxley, and obtain an auditor attestation as to the effectiveness of our internal controls. Our testing may reveal deficiencies in our internal control over financial reporting that are deemed to be material weaknesses. Our compliance with Section 404 will require that we incur additional accounting expense and expend additional management time on compliance-related issues. Moreover, if we are not able to comply with the requirements of Section 404 in a timely manner, or if we identify deficiencies in our internal control over financial reporting that are deemed to be material weaknesses, the market price of our ordinary shares could decline, and we could be subject to sanctions or investigations by the NYSE, the SEC or other regulatory authorities, which would require additional financial and management resources.
As a public company we will also need to enhance our investor relations, legal, financial reporting, treasury and corporate communications functions. We have historically presented our Consolidated Financial Statements in accordance with International Financial Reporting Standards, or IFRS, but have presented our Consolidated Financial Statements in this prospectus, and will present our Consolidated Financial Statements after the consummation of this offering, in accordance with U.S. GAAP. These additional efforts may strain our resources and divert management's attention from other business concerns, which could have a material adverse effect on our business, financial condition and results of operations.
41
Risks Related to Being an English Company Listing Ordinary Shares
The rights of our shareholders may differ from the rights typically offered to shareholders of a U.S. corporation organized in Delaware.
We are incorporated under the laws of England and Wales. The rights of holders of our ordinary shares are governed by English law, including the provisions of the Companies Act 2006, and by our articles of association. These rights differ in certain respects from the rights of shareholders in typical U.S. corporations organized in Delaware. The principal differences are set forth in "Description of Share Capital—Differences in Corporate Law."
U.S. investors may have difficulty enforcing civil liabilities against the Company, our directors or members of senior management and the experts named in this prospectus.
We are incorporated under the laws of England and Wales. Several of our directors reside outside the United States and all or a substantial portion of the assets of such persons are located outside the United States. As a result, it may be difficult for you to serve legal process on us or our directors or have any of them appear in a U.S. court. The United States and the United Kingdom do not currently have a treaty providing for the recognition and enforcement of judgments, other than arbitration awards, in civil and commercial matters. The enforceability of any judgment of a U.S. federal or state court in the United Kingdom will depend on the laws and any treaties in effect at the time, including conflicts of laws principles (such as those bearing on the question of whether a U.K. court would recognize the basis on which a U.S. court had purported to exercise jurisdiction over a defendant). In this context, there is doubt as to the enforceability in the United Kingdom of civil liabilities based solely on the federal securities laws of the United States. In addition, awards for punitive damages in actions brought in the United States or elsewhere may be unenforceable in the United Kingdom. An award for monetary damages under the U.S. securities laws would likely be considered punitive if it did not seek to compensate the claimant for loss or damage suffered and was intended to punish the defendant.
English law and provisions in our articles of association may have anti-takeover effects that could discourage an acquisition of us by others, even if an acquisition would be beneficial to our shareholders, and may prevent attempts by our shareholders to replace or remove our current management.
Certain provisions of English law and our articles of association (as in effect following the completion of this offering) may have the effect of delaying or preventing a change in control of us or changes in our management. For example, English law and our articles of association include, or will include, provisions that:
- •
- establish an advance notice procedure for shareholder approvals to be brought before an annual meeting of our
shareholders, including proposed nominations of persons for election to our Board of Directors; and
- •
- provide that vacancies on our Board of Directors may, in certain specified circumstances, be filled only by a majority of directors then in office, even though less than a quorum.
These provisions, alone or together, could delay or prevent hostile takeovers and changes in control or changes in our management. In addition, these provisions may adversely affect the market price of our ordinary shares or inhibit fluctuations in the market price of our ordinary shares that could otherwise result from actual or rumored takeover attempts.
The U.K. City Code on Takeovers and Mergers, or the Takeover Code, applies, among other things, to an offer for a public company whose registered office is in the United Kingdom (or the Channel Islands or the Isle of Man) and whose securities are not admitted to trading on a regulated market in the United Kingdom (or the Channel Islands or the Isle of Man) if the company is considered by the Panel on Takeovers and Mergers, or the Takeover Panel, to have its place of central
42
management and control in the United Kingdom (or the Channel Islands or the Isle of Man). This is known as the "residency test." Under the Takeover Code, the Takeover Panel will determine whether we have our place of central management and control in the United Kingdom by looking at various factors, including the structure of our Board of Directors, the functions of the directors and where they are resident.
If at the time of a takeover offer the Takeover Panel determines that we have our place of central management and control in the United Kingdom, we would be subject to a number of rules and restrictions, including but not limited to the following: (i) our ability to enter into deal protection arrangements with a bidder would be extremely limited; (ii) we might not, without the approval of our shareholders, be able to perform certain actions that could have the effect of frustrating an offer, such as issuing shares or carrying out acquisitions or disposals; and (iii) we would be obliged to provide equality of information to all bona fide competing bidders.
Following the completion of this offering, our Parent will be interested in over 50% of our voting share capital, and therefore, if the Takeover Panel were to determine that we were subject to the Takeover Code, our Parent would be able to increase its aggregate holding in us without triggering the requirement under Rule 9 of the Takeover Code to make a cash offer for the outstanding shares in the Company.
The Takeover Panel has confirmed to our representatives that, on the basis of our planned board of directors, it does not consider the Takeover Code to apply to the Company, although that position is subject to change if our center of management and control is subsequently found to move to the U.K.
We will be subject to data protection laws under U.K. legislation, and any breaches of such legislation could adversely affect our business, reputation, results of operations and financial condition.
Our ability to obtain, retain and otherwise manage personal data is governed by data protection and privacy requirements and regulatory rules and guidance. In the U.K., we must comply with the Data Protection Act 1998 in relation to processing certain personal data. The application of data privacy laws is often uncertain, and as business practices are challenged by regulators, private litigants and consumer protection agencies, it is possible that these laws may be interpreted and applied in a manner that is inconsistent with our data protection practices. Additionally, under European data protection laws, distributing personal data into the United States may constitute an offense.
Pre-emption rights for U.S. and other non-U.K. holders of shares may be unavailable.
In the case of certain increases in our issued share capital, under English law, existing holders of shares are entitled to pre-emption rights to subscribe for such shares, unless shareholders dis-apply such rights by a special resolution at a shareholders' meeting. These pre-emption rights will have been dis-applied by our shareholder prior to completion of the offering and we shall propose equivalent resolutions in the future once the initial period of dis-application has expired. However, OMGUK will have pre-emption rights, subject to certain exceptions, until it ceases to own more than 7% of our outstanding ordinary shares. In any event, U.S. holders of ordinary shares in U.K. companies are customarily excluded from exercising any such pre-emption rights they may have, unless a registration statement under the Securities Act is effective with respect to those rights, or an exemption from the registration requirements thereunder is available. We do not intend to file any such registration statement, and we cannot assure prospective U.S. investors that any exemption from the registration requirements of the Securities Act or applicable non-U.S. securities laws would be available to enable U.S. or other non-U.K. holders to exercise such pre-emption rights or, if available, that we will utilize any such exemption.
43
SPECIAL NOTE REGARDING FORWARD-LOOKING STATEMENTS
This prospectus includes forward-looking statements, including information relating to anticipated growth in revenues, margins or earnings, anticipated changes in our business, anticipated future performance of our business, anticipated future investment performance of our Affiliates, our expected future net cash flows, our anticipated expense levels, changes in expense, the expected effects of acquisitions and expectations regarding market conditions. The words or phrases "will likely result," "are expected to," "will continue," "is anticipated," "can be," "may be," "aim to," "may affect," "may depend," "intends," "expects," "believes," "estimate," "project," and other similar expressions are intended to identify such forward-looking statements. Such statements are subject to various known and unknown risks and uncertainties and we caution readers that any forward-looking information provided by or on behalf of us is not a guarantee of future performance.
Actual results may differ materially from those in forward-looking information as a result of various factors, some of which are beyond our control, including but not limited to those discussed below and those discussed under the heading "Risk Factors" and elsewhere in this prospectus. Due to such risks and uncertainties and other factors, we caution each person receiving such forward-looking information not to place undue reliance on such statements. Further, such forward-looking statements speak only as of the date of this prospectus and we undertake no obligations to update any forward-looking statement to reflect events or circumstances after the date of this prospectus or to reflect the occurrence of unanticipated events.
Our future revenue, earnings and financial performance may fluctuate due to numerous factors, such as:
- •
- the earnings of our Affiliates;
- •
- the total value and composition of our Affiliates' AUM;
- •
- the concentration of revenues in limited numbers of Affiliates and asset classes;
- •
- the quality and autonomous nature of our relations with our Affiliates;
- •
- our Affiliates' exposure to liability;
- •
- our ability to grow our Affiliates or acquire new firms;
- •
- the nature of our Affiliates' advisory agreements;
- •
- market fluctuations, client investment decisions and investment returns;
- •
- our or our Affiliates' levels of debt and expenses;
- •
- the purchasing power of institutional investors;
- •
- our Affiliates' ability to maintain fee levels;
- •
- the integrity of our and our Affiliates' brands and reputations;
- •
- our and our Affiliates' ability to limit employee misconduct;
- •
- our and our Affiliates' ability to manage actual or potential conflicts of interest that may arise in our businesses;
- •
- our competitors' performance;
- •
- the performance and retention of existing personnel;
- •
- our or our Affiliates' ability to recruit new personnel;
- •
- our or our Affiliates' ability to launch new products;
44
- •
- our reliance on third-party service providers;
- •
- our and our Affiliates' ability to execute strategies;
- •
- our and our Affiliates' ability to conform to compliance guidelines;
- •
- potential litigation (including administrative or tax proceedings) or regulatory actions;
- •
- software and insurance costs;
- •
- our access to capital;
- •
- fluctuations in and risks associated with real estate and timber markets;
- •
- modifications of relevant tax laws or interpretations thereof and potential increases in our tax liability;
- •
- the level of control over us retained by our Parent; and
- •
- the other factors discussed in "Risk Factors."
Our business is also subject to substantial governmental regulation and changes in legal, regulatory, accounting, tax and compliance requirements that may have a substantial effect on our business and results of operations.
45
All of the ordinary shares offered by this prospectus are being sold by the Selling Shareholder. The Selling Shareholder in this offering is OM Group (UK) Limited, a subsidiary of Old Mutual plc, our Parent. We will not receive any proceeds from the sale of ordinary shares in this offering, including from any exercise by the underwriters of their over-allotment option. For information about the Selling Shareholder, see "Security Ownership of Certain Beneficial Owners and Management."
46
Prior to Reorganization
We have historically been a direct wholly-owned subsidiary of OMGUK, which in turn is wholly-owned by our Parent. Set forth below, in relevant part, is our holding company structure and ownership immediately prior to the Reorganization:
Reorganization
Our Parent has undertaken, and will undertake, certain steps to reorganize the ownership of our business in preparation for this offering, including the following:
- 1.
- OMGUK
has incorporated OMAM under the laws of England and Wales as a direct, wholly-owned subsidiary of OMGUK.
- 2.
- OMAM
has incorporated OMAM US, Inc., which we refer to as US Sub, in the State of Delaware as a direct, wholly-owned subsidiary of OMAM.
- 3.
- US
Sub has incorporated OMAM UK Limited, which we refer to as UK Sub, under the laws of England and Wales as a direct, wholly-owned subsidiary of US Sub.
- 4.
- Our
existing intercompany debt, which is currently owed by OMUSH to OMGUK, will be refinanced with new intercompany debt.
- 5.
- OMGUK
will contribute its shares in OMUSH and the new intercompany debt to OMAM in return for an issuance of shares by OMAM resulting in the elimination of
this debt in our pro forma consolidated balance sheet, as it will constitute an arrangement between two of our subsidiaries.
- 6.
- The OMUSH shares will be transferred to UK Sub via a series of share exchanges, and the new intercompany debt will be contributed among OMAM, US Sub and UK Sub.
47
- 7.
- OMAM
will undergo a reduction of share capital to maximize distributable reserves, be re-registered in the United Kingdom as a public limited company, amend
its articles of association to reflect the same and organize its share capital for purposes of this offering.
- 8.
- OMAM will issue third-party debt amounting to $175.0 million and pay a $175.0 million pre-offering dividend to OMGUK. OMAM also intends to accrue a payable to OMGUK of $10 million which will be paid as funds become available from Affiliate distributions, subject to the maintenance of a minimum level of OMUSH cash holdings. Other than this dividend and payable, OMAM does not intend to make any further pre-IPO dividend or debt repayment to OMGUK following June 30, 2014.
For a more detailed description of the Reorganization steps and pro forma financial statements giving effect to the Reorganization, see "Unaudited Pro Forma Consolidated Financial Data".
After the Reorganization
Following these transactional steps, and immediately following the consummation of this offering, our share ownership structure, in relevant part, will appear as follows:
We plan to enter into certain agreements with related parties, including our Parent and OMGUK, as part of the Reorganization. See "Certain Relationships and Related Party Transactions—Relationship with Our Parent and OMGUK Following This Offering" for additional information regarding these agreements.
48
In connection with the Reorganization, we plan to pay a one-time dividend to OMGUK in an amount equal to $175.0 million.
We will initially target a dividend payout in the range of 25% of ENI, subject to maintaining a sustainable quarterly dividend per share. Any declaration of dividends will be at the discretion of our Board of Directors and subject to the approval of our Parent, and will depend on our financial condition, earnings, cash needs, regulatory constraints, capital requirements and any other factors that our Board of Directors or Parent deems relevant in making such a determination. Under English law, we may only pay dividends out of our accumulated, realized profits, so far as not previously utilized by distribution or capitalization, or Distributable Reserves, and provided that at the time of payment of the dividend, the amount of our net assets is not less than the total of our called-up share capital and undistributable reserves. At the time of the closing of this offering, we expect the amount of OMAM's Distributable Reserves to be approximately $ . Because we are a holding company and have no direct operations, we will only be able to pay dividends from our available cash on-hand and any funds we receive from our subsidiaries, including OMUSH. Therefore, there can be no assurance that we will pay any dividends in the future to holders of our ordinary shares, or as to the amount of any such dividends.
49
The following table presents our capitalization as of June 30, 2014, on an actual basis and on an as-adjusted basis giving effect to the Reorganization. This offering will have no impact on the capitalization of OMAM.
You should read this table together with the sections of this prospectus entitled "Unaudited Pro Forma Consolidated Financial Data" and "Management's Discussion and Analysis of Financial Condition and Results of Operations" and our Consolidated Financial Statements and related notes included elsewhere in this prospectus.
| ($ in millions) |
Actual | As Adjusted for the Reorganization |
|||||
|---|---|---|---|---|---|---|---|
| |
(unaudited) |
||||||
Excluding consolidated Funds(1) |
|||||||
Cash and cash equivalents |
$ | 113.7 | $ | 53.7 | |||
| | | | | | | | |
| | | | | | | | |
Long-term debt payable to related parties |
1,003.5 | — | |||||
Third-party borrowings |
2.5 | 177.5 | |||||
Shareholders Equity |
|||||||
Shareholders equity (deficit) |
(436.1 | ) | (4.2 | ) | |||
Non-controlling interests |
(3.6 | ) | (3.6 | ) | |||
| | | | | | | | |
Total Shareholders Equity (deficit) |
(439.7 | ) | (7.8 | ) | |||
| | | | | | | | |
Total Capitalization |
$ | 566.3 | $ | 169.7 | |||
| | | | | | | | |
| | | | | | | | |
- (1)
- Excludes certain sponsored investment entities of our Affiliates that we are required to consolidate on our Consolidated Financial Statements in accordance with U.S. GAAP. See "Management's Discussion and Analysis of Financial Condition and Results of Operations" for further information regarding our consolidated sponsored investment entities.
50
If you invest in our ordinary shares in this offering, your ownership interest will be immediately diluted to the extent of the difference between the initial public offering price per ordinary share and the net tangible book value per ordinary share. Dilution results from the fact that the initial public offering price per ordinary share is substantially in excess of the net tangible book value per ordinary share attributable to existing shareholders for our presently outstanding ordinary shares. As of June 30, 2014, net tangible book value attributable to our shareholders was $ , or $ per ordinary share, based on ordinary shares issued and outstanding after giving effect to the Reorganization. Net tangible book value per ordinary share equals total consolidated tangible assets minus total consolidated liabilities divided by the number of outstanding ordinary shares.
This offering will result in an immediate dilution of $ per ordinary share to the investors who purchase our ordinary shares in this offering.
The following table illustrates the per share dilution after giving pro forma effect to this offering based on the mid-point of the range on the front cover of this prospectus:
| |
As of June 30, 2014 |
|||
|---|---|---|---|---|
Net tangible book value per pro forma share |
||||
Pro forma adjustments per pro forma share |
||||
| | | | | |
Pro forma net tangible book value per pro forma share |
||||
Initial public offering price per share |
||||
| | | | | |
Dilution per share to new investors |
||||
| | | | | |
| | | | | |
51
SELECTED HISTORICAL CONSOLIDATED FINANCIAL DATA
We present economic net income, or ENI, to help us describe our operating and financial performance. ENI is the key measure our management uses to evaluate the financial performance of, and make operational decisions for, our business. ENI is not audited, and is not a substitute for net income or other performance measures that are derived in accordance with U.S. GAAP. Furthermore, our calculation of ENI may differ from similarly titled measures provided by other companies. Please refer to "Management's Discussion and Analysis of Financial Condition and Results of Operations—Non-GAAP Supplemental Performance Measure—Economic Net Income" for a more thorough discussion of ENI and a reconciliation of ENI to U.S. GAAP net income.
The following table sets forth selected historical consolidated financial data for our Company as of the dates and for the periods indicated. The selected statement of operations data for the years ended December 31, 2013, 2012 and 2011, and the balance sheet data as of December 31, 2013 and 2012 have been derived from our audited Consolidated Financial Statements included elsewhere in this prospectus.
The selected statement of operations data for the years ended December 31, 2010 and 2009, and the balance sheet data as of December 31, 2011, 2010 and 2009 have been derived from our Consolidated Financial Statements not included in this prospectus, which were audited in accordance with International Financial Reporting Standards, and have been adjusted to be in accordance with U.S. GAAP for the purposes of the following selected historical and consolidated financial data presentation. The selected consolidated financial data for the six months ended June 30, 2014 and 2013 and as of June 30, 2014 have been derived from our unaudited Consolidated Financial Statements included elsewhere in this prospectus. Unaudited consolidated balance sheets dated as of December 31, 2011, 2010 and 2009 and as of June 30, 2014 and 2013 and unaudited statements of operations for the years ended December 31, 2010 and 2009 and for the six months ended June 30, 2014 and 2013 have been prepared on substantially the same basis as our Consolidated Financial Statements that were audited in accordance with U.S. GAAP and include all adjustments that we consider necessary for a fair statement of our consolidated statements of operations and balance sheets for the periods and as of the dates presented therein. Our results for the six months ended June 30, 2014 are not necessarily indicative of our results for a full fiscal year.
You should read our following selected historical consolidated financial data together with "Management's Discussion and Analysis of Financial Condition and Results of Operations" and the historical Consolidated Financial Statements and the related notes thereto, included elsewhere in this prospectus.
| |
For the six months ended June 30, |
For the years ended December 31, | ||||||||||||||||||||
|---|---|---|---|---|---|---|---|---|---|---|---|---|---|---|---|---|---|---|---|---|---|---|
| ($ in millions, except as noted) |
2014(1) | 2013(1) | 2013 | 2012 | 2011 | 2010(1) | 2009(1) | |||||||||||||||
U.S. GAAP Statement of Operations Data: |
||||||||||||||||||||||
Management fees(2) |
$ | 275.4 | $ | 233.1 | $ | 478.2 | $ | 399.3 | $ | 398.2 | $ | 387.5 | $ | 347.5 | ||||||||
Performance fees |
2.4 | 8.3 | 18.1 | 14.1 | 4.3 | 2.2 | 0.4 | |||||||||||||||
Other revenues |
0.3 | 1.1 | 1.8 | 0.5 | 0.3 | 0.8 | 2.3 | |||||||||||||||
Consolidated Funds revenue(2) |
251.6 | 227.8 | 430.5 | 289.6 | 321.4 | 350.7 | 310.0 | |||||||||||||||
| | | | | | | | | | | | | | | | | | | | | | | |
Total revenue |
$ | 529.7 | $ | 470.3 | $ | 928.6 | $ | 703.5 | $ | 724.2 | $ | 741.2 | $ | 660.2 | ||||||||
| | | | | | | | | | | | | | | | | | | | | | | |
Net income before tax from continuing operations attributable to controlling interests(2) |
$ | 39.6 | $ | 13.2 | $ | 32.7 | $ | 27.3 | $ | 22.0 | $ | 4.8 | $ | 9.0 | ||||||||
Net income/(loss) from continuing operations attributable to controlling interests(2) |
23.4 | 7.2 | 19.4 | 24.0 | 26.2 | (13.9 | ) | (87.4 | ) | |||||||||||||
Net income/(loss) from continuing operations |
(51.9 | ) | (74.0 | ) | $ | (97.1 | ) | $ | (50.0 | ) | $ | (68.7 | ) | $ | (97.4 | ) | $ | (198.6 | ) | |||
Pre-tax U.S. GAAP controlling interests operating margin(3) |
14 | % | 5 | % | 6 | % | 6 | % | 5 | % | 1 | % | 3 | % | ||||||||
U.S. GAAP Earnings Per Share from continuing operations |
||||||||||||||||||||||
52
| ($ in millions, except as noted) |
For the six months ended June 30, |
For the years ended December 31, | ||||||||||||||||||||
|---|---|---|---|---|---|---|---|---|---|---|---|---|---|---|---|---|---|---|---|---|---|---|
Non-GAAP Statement of Operations Data(1):
|
2014 | 2013 | 2013 | 2012 | 2011 | 2010 | 2009 | |||||||||||||||
Economic Net Income(4): |
||||||||||||||||||||||
Management fees |
$ | 285.6 | $ | 238.2 | $ | 499.8 | $ | 420.9 | $ | 420.1 | $ | 408.8 | $ | 375.7 | ||||||||
Performance fees |
2.4 | 8.3 | 18.1 | 14.1 | 2.9 | 2.2 | 0.4 | |||||||||||||||
Other revenues |
4.1 | 5.9 | 10.1 | 17.2 | 12.7 | 11.9 | 10.1 | |||||||||||||||
| | | | | | | | | | | | | | | | | | | | | | | |
Total ENI Revenue |
$ | 292.1 | $ | 252.4 | $ | 528.0 | $ | 452.2 | $ | 435.7 | $ | 422.9 | $ | 386.2 | ||||||||
| | | | | | | | | | | | | | | | | | | | | | | |
Pre-tax Economic Net Income |
$ | 91.2 | $ | 73.7 | $ | 153.0 | $ | 131.3 | $ | 124.3 | $ | 123.9 | $ | 132.3 | ||||||||
Post-tax Economic Net Income |
66.6 | 58.3 | 122.9 | 112.3 | 101.9 | 103.4 | 106.2 | |||||||||||||||
Pre-tax ENI operating margin before Affiliate key employee distributions(5) |
37 | % | 34 | % | 34 | % | 33 | % | 32 | % | 32 | % | 35 | % | ||||||||
Pre-tax ENI operating margin after Affiliate key employee distributions(5) |
31 | % | 29 | % | 29 | % | 29 | % | 29 | % | 29 | % | 34 | % | ||||||||
Economic Net Income Per Share |
||||||||||||||||||||||
Other Operational Information(1): |
||||||||||||||||||||||
Assets under management at period end (in billions) |
$ | 214.9 | $ | 173.9 | $ | 198.8 | $ | 156.7 | $ | 136.8 | $ | 144.0 | $ | 140.2 | ||||||||
Net client cash flows (in billions) |
2.6 | 6.1 | 10.5 | 0.4 | (4.6 | ) | (11.8 | ) | (1.8 | ) | ||||||||||||
| |
As of June 30, |
As of December 31, | |||||||||||||||||
|---|---|---|---|---|---|---|---|---|---|---|---|---|---|---|---|---|---|---|---|
U.S. GAAP Consolidated Balance Sheet Data:
|
2014(1) | 2013 | 2012 | 2011(1) | 2010(1) | 2009(1) | |||||||||||||
Total assets(6) |
$ | 8,049.2 | $ | 8,551.8 | $ | 8,529.8 | $ | 8,372.9 | $ | 8,295.4 | $ | 9,742.3 | |||||||
Total assets attributable to controlling interests |
906.3 | 1,014.4 | 999.2 | 1,027.2 | 996.9 | 1,029.4 | |||||||||||||
Total debt(6) |
5,429.2 | 5,469.0 | 5,641.8 | 5,248.5 | 5,349.8 | 5,937.0 | |||||||||||||
Total debt attributable to controlling interests |
1,006.0 | 1,043.2 | 1,147.5 | 1,198.3 | 1,295.3 | 1,963.6 | |||||||||||||
Total liabilities(6) |
5,962.3 | 6,015.9 | 6,097.8 | 5,696.9 | 5,766.4 | 6,405.6 | |||||||||||||
Total liabilities attributable to controlling interests |
1,346.0 | 1,461.1 | 1,480.5 | 1,515.1 | 1,607.9 | 2,300.3 | |||||||||||||
Net assets(6) |
$ | 2,086.9 | $ | 2,535.9 | $ | 2,432.0 | $ | 2,676.0 | $ | 2,529.0 | $ | 3,336.7 | |||||||
Redeemable non-controlling interests in consolidated Funds(6) |
(49.7 | ) | (403.3 | ) | (88.9 | ) | (108.8 | ) | (98.3 | ) | (1,500.4 | ) | |||||||
Non-controlling interests in consolidated Funds(6) |
(2,476.9 | ) | (2,579.3 | ) | (2,824.4 | ) | (3,055.1 | ) | (3,041.7 | ) | (3,107.2 | ) | |||||||
Non-controlling interests |
3.6 | (0.1 | ) | (0.9 | ) | (4.5 | ) | (43.1 | ) | (43.1 | ) | ||||||||
| | | | | | | | | | | | | | | | | | | | |
Parent Equity Deficit |
$ | (436.1 | ) | $ | (446.8 | ) | $ | (482.2 | ) | $ | (492.4 | ) | $ | (654.1 | ) | $ | (1,314.0 | ) | |
- (1)
- Unaudited.
- (2)
- Statement of operations data presented in accordance with U.S. GAAP include the results of consolidated pooled investment vehicles, or "Funds," managed by our Affiliates where it has been determined these entities are controlled by our Company. The effects of consolidating these entities include a reduction in management fee revenue ranging from $21 million to $28 million per annum for fiscal years 2009 through 2013 with offsetting increases in the results of consolidated Funds. The net income from continuing operations presented as attributable to controlling interests exclude the income or loss directly attributable to third-party Fund investors, and represent the net amounts attributable to our shareholders.
53
The following table reconciles our net income attributable to controlling interests to our net income from continuing operations attributable to controlling interests and our net income before tax from continuing operations attributable to controlling interests:
| |
Six Months Ended June 30, |
Years Ended December 31, |
||||||||||||||
|---|---|---|---|---|---|---|---|---|---|---|---|---|---|---|---|---|
($ in millions)
|
2014 | 2013 | 2013 | 2012 | 2011 | |||||||||||
Net income attributable to controlling interests |
$ | 19.1 | $ | 11.5 | $ | 25.7 | $ | 3.0 | $ | 10.3 | ||||||
Exclude: Loss (profit) on discontinued operations attributable to controlling interests |
4.3 | (4.3 | ) | (6.4 | ) | 21.1 | 15.9 | |||||||||
| | | | | | | | | | | | | | | | | |
Net income from continuing operations attributable to controlling interests |
23.4 | 7.2 | 19.4 | 24.0 | 26.2 | |||||||||||
Add: Income tax expense (benefit) |
16.2 | 6.0 | 13.3 | 3.3 | (4.2 | ) | ||||||||||
| | | | | | | | | | | | | | | | | |
Net income before tax from continuing operations attributable to controlling interests |
$ | 39.6 | $ | 13.2 | $ | 32.7 | $ | 27.3 | $ | 22.0 | ||||||
| | | | | | | | | | | | | | | | | |
| | | | | | | | | | | | | | | | | |
- (3)
- The
pre-tax U.S. GAAP controlling interests operating margin is calculated using pre-tax income from continuing operations attributable to controlling
interests and GAAP revenue from continuing operations attributable to controlling interests.
- (4)
- ENI,
including a reconciliation to U.S. GAAP net income (loss) attributable to controlling interests, is discussed in "Management's Discussion and
Analysis of Financial Condition and Results of Operations—Non-GAAP Supplemental Performance Measure—Economic Net Income." Pre-tax and post-tax ENI are presented after Affiliate
key employee distributions. These measures are conceptually equivalent to net income before tax from continuing operations attributable to controlling interests and net income from continuing
operations attributable to controlling interests, respectively.
- (5)
- Pre-tax
ENI margin is a non-GAAP efficiency measure, calculated based on pre-tax ENI, divided by ENI revenue. Operating margin is monitored both before and
after Affiliate key employee distributions. Affiliate key employee distributions are conceptually equivalent to non-controlling interests, representing the share of Affiliate earnings that accrue to
key employees under equity or profit interests plans. For accounting purposes under U.S. GAAP, however, these plans are classified as cash-settled liabilities and the share of earnings
attributed to key employees under these plans is therefore presented as compensation expense rather than non-controlling interests.
- (6)
- Balance sheet data presented in accordance with U.S. GAAP include the results of consolidated pooled investment vehicles, or "Funds," managed by our Affiliates where it has been determined these entities are controlled by our Company. Consolidated assets and liabilities of these entities that are attributable to third-party investors, or non-controlling interests, have the effect of increasing our consolidated assets and liabilities. The net assets and liabilities presented as attributable to controlling interests exclude the portions directly attributable to these third-party investors, and represent the net amounts attributable to our shareholders. Similarly, Parent Equity Deficit represents the net assets of our Company after excluding net assets directly attributable to these third-party investors.
54
UNAUDITED PRO FORMA CONSOLIDATED FINANCIAL DATA
The following unaudited pro forma consolidated financial data present our statements of operations and balance sheet, assuming that all of the transactions described below had been completed as of: (i) January 1, 2013 with respect to the unaudited pro forma statements of operations and (ii) June 30, 2014 with respect to the unaudited pro forma balance sheet. The pro forma adjustments are based on available information and upon assumptions that our management believes are reasonable in order to reflect, on a pro forma basis, the impact of the Reorganization.
The pro forma adjustments principally give effect to the Reorganization, specifically:
- •
- issuance of third-party debt amounting to $175.0 million and a corresponding dividend to OMGUK of
$175.0 million. OMAM also intends to accrue a payable to OMGUK of $10 million which will be paid as funds become available from Affiliate distributions, subject to the maintenance of a minimum
level of OMUSH cash holdings. Other than this dividend and payable, we do not intend to make any further pre-IPO dividend or debt repayment to OMGUK following June 30, 2014.
- •
- refinancing and contribution of our existing intercompany debt, which is currently owed by OMUSH to OMGUK, into a new
subsidiary of ours, resulting in the elimination of this debt in our pro forma consolidated balance sheet, as it will constitute an arrangement between two of our subsidiaries. The elimination of the
intercompany debt will be reflected as a capital contribution in our Consolidated Financial Statements;
- •
- redemption of a $32.0 million note receivable from OMGUK, which will be reflected as a return of capital in our
Consolidated Financial Statements;
- •
- entering into a deferred tax asset arrangement with OMGUK with respect to $279.3 million of existing deferred tax
assets as of June 30, 2014, such that following the Reorganization, any future amounts realized in respect of these assets, until the later of December 31, 2019 or December 31 of
the year in which OMGUK ceases to own, directly or indirectly, at least 50% of our outstanding ordinary shares, are entirely attributable and payable on a quarterly basis to OMGUK. This will result in
the recording of an intercompany payable to OMGUK in our Consolidated Financial Statements, which will track the value of the allocated deferred tax assets until the later of December 31, 2019
or December 31, of the year in which OMGUK ceases to own, directly or indirectly, at least 50% of our outstanding ordinary shares, at which point in time the arrangement would be terminated and
the payable would be settled on November 30 of the following year at its net present value subject to repayment, if and to the extent that the deferred tax assets are determined not to be
available. See "Certain Relationships and Related Party Transactions—Relationship with Our Parent and OMGUK Following This Offering—Deferred Tax Asset Arrangement;"
- •
- entering into a contractual arrangement with OMGUK to allocate certain existing real estate and timber co-investments
entirely to OMGUK, such that any future amounts realized in respect of these assets are entirely attributable and payable to OMGUK. This will result in the recording of an intercompany payable to
OMGUK in our Consolidated Financial Statements, which will henceforth track the value of the allocated co-investments. See "Certain Relationships and Related Party
Transactions—Relationship with Our Parent and OMGUK Following This Offering—Co-Investment Arrangement;" and
- •
- in connection with a pre-existing contractual provision, entering into an agreement with an Affiliate's Key Employee Limited Partnership, enabling us to purchase additional ownership interests. Incremental income is shown in the pro forma statement of operations as a result of this purchase. We expect to incur a compensation charge of $32.8 million in the third quarter of 2014 based on the difference in value between the purchase price paid and our current liability
55
with respect to this interest. This compensation charge will be excluded from our economic net income based on policies described in "Management's Discussion and Analysis of Financial Condition and Results of Operation—Non-GAAP Supplemental Performance Measure—Economic Net Income."
We have not made any pro forma adjustments to our general and administrative expense, or any of our other expense items, relating to reporting, compliance or investor relations costs, or other incremental costs that we may incur as a public company, including costs relating to compliance with Section 404 of the Sarbanes-Oxley Act of 2002.
The unaudited pro forma consolidated financial data is included for informational purposes only and should not be relied upon as being indicative of our statements of operations or balance sheets had the Reorganization been completed on the dates assumed. The unaudited pro forma consolidated financial information also does not project the statement of operations or balance sheet for any future period or date. The following discussion should be read in conjunction with "Management's Discussion and Analysis of Results of Operations and Financial Condition" and our Consolidated Financial Statements and related notes included elsewhere in this prospectus.
56
Unaudited Pro Forma Consolidated Statement of Operations
For the Year Ended December 31, 2013
| ($ in millions, except where otherwise noted) |
OMAM 2013 |
Debt elimination/ consolidation and new financing(1) |
Allocation of co-investments to OMGUK(2) |
Affiliate equity transaction(3) |
OMAM Pro Forma |
|||||||||||
|---|---|---|---|---|---|---|---|---|---|---|---|---|---|---|---|---|
Management fees |
$ | 478.2 | — | — | — | $ | 478.2 | |||||||||
Performance fees |
18.1 | — | — | — | 18.1 | |||||||||||
Other revenue |
1.8 | — | — | — | 1.8 | |||||||||||
Consolidated Funds' revenue: |
||||||||||||||||
Revenue from timber |
401.1 | — | — | — | 401.1 | |||||||||||
Other revenue |
29.4 | — | — | — | 29.4 | |||||||||||
| | | | | | | | | | | | | | | | | |
Total revenue |
928.6 | — | — | — | 928.6 | |||||||||||
| | | | | | | | | | | | | | | | | |
Compensation and benefits |
352.3 | — | — | (17.8 | ) | 334.5 | ||||||||||
General and administrative expense |
68.7 | — | — | — | 68.7 | |||||||||||
Amortization and impairment of acquired intangibles |
0.1 | — | — | — | 0.1 | |||||||||||
Depreciation and amortization |
4.9 | — | — | — | 4.9 | |||||||||||
Consolidated Funds' expense: |
||||||||||||||||
Interest and dividend expense |
150.1 | — | — | — | 150.1 | |||||||||||
Timber expense |
238.4 | — | — | — | 238.4 | |||||||||||
Other expense |
213.6 | — | — | — | 213.6 | |||||||||||
| | | | | | | | | | | | | | | | | |
Total operating expenses |
1,028.1 | — | — | (17.8 | ) | 1,010.3 | ||||||||||
| | | | | | | | | | | | | | | | | |
Operating income |
(99.5 | ) | — | — | 17.8 | (81.7 | ) | |||||||||
Non-operating income and (expense): |
||||||||||||||||
Investment income/(loss) |
10.7 | — | (3.0 | ) | — | 7.7 | ||||||||||
Interest income |
0.5 | — | — | — | 0.5 | |||||||||||
Interest expense (A) |
(72.2 | ) | 68.7 | — | — | (3.5 | ) | |||||||||
Net gains from consolidated Funds |
76.7 | — | — | — | 76.7 | |||||||||||
| | | | | | | | | | | | | | | | | |
Income/(loss) from continuing operations before taxes (B) |
(83.8 | ) | 68.7 | (3.0 | ) | 17.8 | (0.3 | ) | ||||||||
Provision for income taxes(4) |
13.3 | 2.9 | (1.2 | ) | 7.2 | 22.2 | ||||||||||
| | | | | | | | | | | | | | | | | |
Income/(loss) from continuing operations |
(97.1 | ) | 65.8 | (1.8 | ) | 10.6 | (22.5 | ) | ||||||||
Net income/(loss) from continuing operations attributable to non-controlling interests (C) |
(116.5 | ) | — | — | — | (116.5 | ) | |||||||||
| | | | | | | | | | | | | | | | | |
Net income/(loss) from continuing operations attributable to controlling interests |
$ | 19.4 | (5) | $ | 65.8 | $ | (1.8 | ) | $ | 10.6 | $ | 94.0 | ||||
| | | | | | | | | | | | | | | | | |
| | | | | | | | | | | | | | | | | |
Earnings per share |
||||||||||||||||
Net income before tax and interest expense from continuing operations attributable to controlling interests (B-A-C) |
$ | 104.9 | $ | — | $ | (3.0 | ) | $ | 17.8 | $ | 119.7 | |||||
57
Unaudited Pro Forma Consolidated Statement of Operations
For the Six Months Ended June 30, 2014
| ($ in millions, except where otherwise noted) |
OMAM June 30, 2014 |
Debt elimination/ consolidation and new financing(1) |
Allocation of co-investments to OMGUK(2) |
Affiliate equity transaction(3) |
OMAM Pro Forma |
|||||||||||
|---|---|---|---|---|---|---|---|---|---|---|---|---|---|---|---|---|
Management fees |
$ | 275.4 | — | — | — | $ | 275.4 | |||||||||
Performance fees |
2.4 | — | — | — | 2.4 | |||||||||||
Other revenue |
0.3 | — | — | — | 0.3 | |||||||||||
Consolidated Funds' revenue: |
||||||||||||||||
Revenue from timber |
239.4 | — | — | — | 239.4 | |||||||||||
Other revenue |
12.2 | — | — | — | 12.2 | |||||||||||
| | | | | | | | | | | | | | | | | |
Total revenue |
529.7 | — | — | — | 529.7 | |||||||||||
| | | | | | | | | | | | | | | | | |
Compensation and benefits |
181.3 | — | — | (2.4 | ) | 178.9 | ||||||||||
General and administrative expense |
37.1 | — | — | — | 37.1 | |||||||||||
Amortization and impairment of acquired intangibles |
0.1 | — | — | — | 0.1 | |||||||||||
Depreciation and amortization |
2.9 | — | — | — | 2.9 | |||||||||||
Consolidated Funds' expense: |
||||||||||||||||
Interest and dividend expense |
67.2 | — | — | — | 67.2 | |||||||||||
Timber expense |
144.9 | — | — | — | 144.9 | |||||||||||
Other expense |
136.2 | — | — | — | 136.2 | |||||||||||
| | | | | | | | | | | | | | | | | |
Total operating expenses |
569.7 | — | — | (2.4 | ) | 567.3 | ||||||||||
| | | | | | | | | | | | | | | | | |
Operating income |
(40.0 | ) | — | — | 2.4 | (37.6 | ) | |||||||||
Non-operating income and (expense): |
||||||||||||||||
Investment income/(loss) |
5.9 | — | (1.4 | ) | — | 4.5 | ||||||||||
Interest income |
0.1 | — | — | — | 0.1 | |||||||||||
Interest expense (A) |
(33.2 | ) | 31.5 | — | — | (1.7 | ) | |||||||||
Net gains from consolidated Funds |
31.5 | — | — | — | 31.5 | |||||||||||
| | | | | | | | | | | | | | | | | |
Income/(loss) from continuing operations before taxes (B) |
(35.7 | ) | 31.5 | (1.4 | ) | 2.4 | (3.2 | ) | ||||||||
Provision for income taxes |
16.2 | 1.5 | (0.6 | ) | 0.8 | 17.9 | ||||||||||
| | | | | | | | | | | | | | | | | |
Income/(loss) from continuing operations |
(51.9 | ) | 30.0 | (0.8 | ) | 1.6 | (21.1 | ) | ||||||||
Net income/(loss) from continuing operations attributable to non-controlling interests (C) |
(75.3 | ) | — | — | — | (75.3 | ) | |||||||||
| | | | | | | | | | | | | | | | | |
Net income/(loss) from continuing operations attributable to controlling interests |
$ | 23.4 | (5) | $ | 30.0 | $ | (0.8 | ) | $ | 1.6 | $ | 54.2 | ||||
| | | | | | | | | | | | | | | | | |
| | | | | | | | | | | | | | | | | |
Earnings per share |
||||||||||||||||
Net income before tax and interest expense from continuing operations attributable to controlling interests (B-A-C) |
$ | 72.8 | $ | — | $ | (1.4 | ) | $ | 2.4 | $ | 73.8 | |||||
58
Unaudited Pro Forma Consolidated Statement of Operations
For the Year Ended December 31, 2013 and the Six Months Ended June 30, 2014
Pro Forma U.S. GAAP Adjustments to the Consolidated Statement of Operations:
Reorganization and other adjustments to our consolidated statement of operations include:
- 1)
- Our
existing intercompany debt, which is currently owed by OMUSH to OMGUK, is to be refinanced and contributed to a new subsidiary of ours in connection with
this offering, and while it will remain outstanding, it will be an arrangement between two of our subsidiaries and will consequently be eliminated in our Consolidated Financial Statements. New third
party debt of $175.0 million will be raised through the establishment of a revolving credit facility, and assuming we achieve a minimum investment-grade credit rating equivalent to BBB, our
ongoing consolidated cost of debt has been estimated at 2%, or $3.5 million per annum ($0.9 million per quarter). The net effect of the tax owed on interest income earned on the reissued
and contributed intercompany debt to be held by our new subsidiary, and the tax deduction on interest paid by us on the new third party debt is incremental annual tax expense of $2.9 million,
or $0.7 million per quarter.
- 2)
- We
are entering into a co-investment arrangement with OMGUK to allocate certain existing real estate and timber co-investments entirely to OMGUK, such that
any gains and losses on these assets as well as the return of principal and any carried interest are entirely attributable and payable to OMGUK. This contractual arrangement will result in the
recognition of an offsetting expense equivalent to the value of these gains, which amounted to $3.0 million in 2013, and $1.4 million for the first six months of 2014. The tax effect of
this allocation has been estimated at our average U.S. statutory rate of 40.2%, amounting to $1.2 million for 2013, and $0.6 million for the first six months of 2014.
- 3)
- In connection with the Reorganization, as a result of a pre-existing contractual provision, an Affiliate equity transaction has increased our ownership percentage in the applicable Affiliate. As a result of this transaction we have shown additional earnings of $17.8 million for the year ended December 31, 2013 and $2.4 million for the first six months of June 30, 2014. The tax effect of this transaction has been estimated at our average U.S. statutory rate of 40.2%, amounting to $7.2 million for 2013, and $0.8 million for the first six months of 2014. The increase in earnings is due to a reduction in our share of the liability revaluation as a result of increased ownership by the Company and lower Affiliate key employee distributions.
59
Notes to the Pro Forma Consolidated Statement of Operations
- 4)
- The following table illustrates the tax effect of the above pro forma U.S. GAAP adjustments:
| |
GAAP 2013 |
Offshore taxable income(A) |
Offshore third party debt costs(A) |
Allocation of co-investments OMGUK(B) |
Affiliate equity transaction(B) |
Eliminations(A) | OMAM Pro Forma |
|||||||||||||||
|---|---|---|---|---|---|---|---|---|---|---|---|---|---|---|---|---|---|---|---|---|---|---|
Net income before tax and interest expense from continuing operations attributable to controlling interests |
104.9 | 72.2 | — | (3.0 | ) | 17.8 | (72.2 | ) | 119.7 | |||||||||||||
Interest expense on external debt |
— | — | (3.5 | ) | — | — | — | (3.5 | ) | |||||||||||||
Deductible intercompany interest expense(A) |
(72.2 | ) | — | — | — | — | 72.2 | — | ||||||||||||||
| | | | | | | | | | | | | | | | | | | | | | | |
Taxable income from continuing operations |
32.7 | 72.2 | (3.5 | ) | (3.0 | ) | 17.8 | — | 116.2 | |||||||||||||
Taxes payable at the statutory rate |
(13.1 | ) | (3.6 | ) | 0.7 | 1.2 | (7.2 | ) | — | (21.9 | ) | |||||||||||
Non-recurring deferred tax and timing adjustments |
(0.2 | ) | — | — | — | — | — | (0.2 | ) | |||||||||||||
| | | | | | | | | | | | | | | | | | | | | | | |
Tax expense on continuing operations |
(13.3 | ) | (3.6 | ) | 0.7 | 1.2 | (7.2 | ) | — | (22.2 | ) | |||||||||||
Effective tax rate |
41 | % | 5 | % | 20 | % | 40 | % | 40 | % | 19 | % | ||||||||||
- (A)
- As
noted above, our ongoing annual cost of debt is estimated at $3.5 million. The existing intercompany debt will be eliminated in our consolidated
results. As noted in our unaudited pro forma consolidated statement of operations under "Debt elimination/consolidation and new financing", the net tax effect of the changes in financing arrangements
is estimated at $2.9 million in additional tax expense. This is comprised of $3.6 million in incremental tax expense on intragroup interest income to be earned by us, at an effective
U.K. tax rate of 5.0%, net of $0.7 million in tax benefits on external interest to be paid by us at the U.K. statutory rate of tax of 20%.
- (B)
- The allocation of co-investments to OMGUK and Affiliate equity transaction have been tax-effected at our average U.S. statutory rate of tax of 40.2%.
- 5)
- The following table reconciles our Net income from continuing operations attributable to controlling interests to Net income attributable to controlling interests:
| |
Six Months Ended | Year Ended | |||||
|---|---|---|---|---|---|---|---|
| ($ in millions) |
June 30, 2014 |
December 31, 2013 |
|||||
Net income from continuing operations attributable to controlling interests |
23.4 | $ | 19.4 | ||||
Discontinued operations attributable to controlling interests |
(4.3 | ) | 6.4 | ||||
| | | | | | | | |
Net income attributable to controlling interests |
19.1 | 25.7 | |||||
60
Unaudited Pro Forma Consolidated Balance Sheet
As of June 30, 2014
| |
|
Reorganization and other adjustments | |
||||||||||||||||
|---|---|---|---|---|---|---|---|---|---|---|---|---|---|---|---|---|---|---|---|
| |
|
OMAM pro-forma after reorganization |
|||||||||||||||||
| ($ in millions) |
OMAM June 30, 2014 |
IPO dividend and new financing(1) |
Debt elimination/ consolidation(2) |
Assignment of benefits(3) |
Affiliate equity transaction(4) |
||||||||||||||
Current assets |
|||||||||||||||||||
Cash and cash equivalents |
$ | 113.7 | — | — | — | $ | (60.0 | ) | $ | 53.7 | |||||||||
Investment advisory fees receivable |
134.7 | — | — | — | — | 134.7 | |||||||||||||
Amounts due from related parties |
— | — | — | — | — | — | |||||||||||||
Property and equipment, net |
23.1 | — | — | — | — | 23.1 | |||||||||||||
Investments (excluding co-investments) |
116.4 | — | — | — | — | 116.4 | |||||||||||||
Co-investments into Real Estate and Timber products |
42.3 | — | — | (42.3 | ) | — | — | ||||||||||||
Co-investments assigned to Parent |
— | — | — | 42.3 | — | 42.3 | |||||||||||||
Acquired intangibles, net |
1.1 | — | — | — | — | 1.1 | |||||||||||||
Goodwill |
126.5 | — | — | — | — | 126.5 | |||||||||||||
Other assets |
41.9 | — | — | — | — | 41.9 | |||||||||||||
Note receivable due from related party |
32.2 | — | (32.2 | ) | — | — | — | ||||||||||||
Deferred tax assets |
274.4 | — | — | (180.1 | ) | — | 94.3 | ||||||||||||
Deferred tax assets subject to tax sharing arrangement |
— | — | — | 180.1 | — | 180.1 | |||||||||||||
Assets of consolidated Funds: |
— | ||||||||||||||||||
Cash and cash equivalents |
107.1 | — | — | — | — | 107.1 | |||||||||||||
Investments, at fair value |
62.4 | — | — | — | — | 62.4 | |||||||||||||
Investments in related parties, at fair value |
— | — | — | — | — | — | |||||||||||||
Restricted cash |
2,487.6 | — | — | — | — | 2,487.6 | |||||||||||||
Timber assets |
4,394.0 | — | — | — | — | 4,394.0 | |||||||||||||
Other assets |
91.8 | — | — | — | — | 91.8 | |||||||||||||
| | | | | | | | | | | | | | | | | | | | |
Total assets |
$ | 8,049.2 | $ | — | $ | (32.2 | ) | $ | — | $ | (60.0 | ) | $ | 7,957.0 | |||||
| | | | | | | | | | | | | | | | | | | | |
| | | | | | | | | | | | | | | | | | | | |
Current liabilities |
|||||||||||||||||||
Accounts payable and accrued expenses |
30.0 | 10.0 | — | — | — | $ | 40.0 | ||||||||||||
Accrued incentive compensation |
79.1 | — | — | — | — | 79.1 | |||||||||||||
Interest payable to related parties |
— | — | — | — | — | — | |||||||||||||
Accrued income taxes |
5.0 | — | — | — | — | 5.0 | |||||||||||||
Notes payable to related parties |
1,003.5 | — | (1,003.5 | ) | — | — | — | ||||||||||||
Third party borrowings |
2.5 | 175.0 | — | — | — | 177.5 | |||||||||||||
Other amounts due to related parties |
5.0 | — | — | 321.6 | — | 326.6 | |||||||||||||
Other liabilities |
220.9 | — | — | — | (27.2 | ) | 193.7 | ||||||||||||
Liabilities of consolidated Funds: |
— | ||||||||||||||||||
Accounts payable and accrued expenses |
41.6 | — | — | — | — | 41.6 | |||||||||||||
Long term debt |
3,797.3 | — | — | — | — | 3,797.3 | |||||||||||||
Related party debt |
625.9 | — | — | — | — | 625.9 | |||||||||||||
Securities sold, not yet purchased, at fair value |
22.2 | — | — | — | — | 22.2 | |||||||||||||
Other liabilities |
129.3 | — | — | — | — | 129.3 | |||||||||||||
| | | | | | | | | | | | | | | | | | | | |
Total liabilities |
$ | 5,962.3 | $ | 185.0 | $ | (1,003.5 | ) | $ | 321.6 | $ | (27.2 | ) | $ | 5,438.2 | |||||
Redeemable non-controlling interests in consolidated Funds |
49.7 | — | — | — | — | 49.7 | |||||||||||||
Equity: |
|||||||||||||||||||
Parent equity (deficit) |
(443.5 | ) | (185.0 | ) | 971.3 | (321.6 | ) | (32.8 | ) | (11.6 | ) | ||||||||
Other comprehensive income |
7.4 | — | — | — | — | 7.4 | |||||||||||||
Non-controlling interests |
(3.6 | ) | — | — | — | — | (3.6 | ) | |||||||||||
Non-controlling interests in consolidated Funds |
2,476.9 | — | — | — | — | 2,476.9 | |||||||||||||
| | | | | | | | | | | | | | | | | | | | |
Total liabilities, equity and redeemable equity |
$ | 8,049.2 | $ | — | $ | (32.2 | ) | $ | — | $ | (60.0 | ) | $ | 7,957.0 | |||||
| | | | | | | | | | | | | | | | | | | | |
| | | | | | | | | | | | | | | | | | | | |
61
Unaudited Pro Forma Consolidated Balance Sheet
As of June 30, 2014
Pro Forma U.S. GAAP Adjustments to the Consolidated Balance Sheet
Reorganization and other adjustments to our Consolidated Balance Sheet consist of:
- 1)
- A
new third party credit facility is to be entered into and drawn down upon in the amount of $175.0 million, which will be used to fund a dividend to
be paid to OMGUK prior to this offering. OMAM also intends to accrue a payable to OMGUK of $10 million which will be paid as funds become available from Affiliate distributions, subject to the
maintenance of a minimum level of OMUSH cash holdings. Other than this dividend and payable, the Company does not intend to make any further pre-IPO dividend or debt repayment to OMGUK following June
30, 2014.
- 2)
- A
$32.0 million intercompany note receivable from OMGUK is to be redeemed in connection with this offering via a capital distribution back to our
Parent. Existing intercompany debt owed by OMUSH to OMGUK of $1.0 billion is to be refinanced and contributed to a new subsidiary of ours in connection with this offering, and while it will
remain outstanding, it will be eliminated in our Consolidated Financial Statements.
- 3)
- In connection with this offering, we will enter into arrangements with OMGUK for the payment of future realizable benefits associated with $279.3 million in deferred tax assets, as well as co-investments made by us in real-estate and timber strategies of our Affiliates with a fair value of $51.4 million currently carried on the Company's Balance Sheet at June 30, 2014 at $42.3 million. Accordingly, intercompany payables to OMGUK representing the carrying values of these assets as of June 30, 2014 will be recognized. The values of these payables will be adjusted each period going forward to match the values of the underlying deferred tax assets and investments to which they are contractually linked, resulting in no net impact to our ongoing earnings. Cash remittances to OMGUK to settle these obligations will be made as the allocated tax attributes are utilized by us and as the co-investments are redeemed, including any carried interest associated with these investments, less taxes payable. For further discussion, see "Reorganization" and "Certain Relationships and Related Party Transactions—Relationship with Our Parent and OMGUK Following This Offering."
The following table summarizes the breakdown of deferred tax assets following the allocation to OMGUK:
| |
As of June 30, 2014 |
Parent Tax-sharing Arrangement |
Pro Forma— Ordinary Shareholders |
|||||||
|---|---|---|---|---|---|---|---|---|---|---|
Federal net operating losses and interest carry-forwards |
$ | 279.3 | $ | (279.3 | ) | $ | — | |||
Liability for uncertain tax positions |
(88.6 | ) | 88.6 | — | ||||||
Valuation allowance |
(45.9 | ) | 10.6 | (35.3 | ) | |||||
Other deferred tax adjustments |
129.6 | — | 129.6 | |||||||
| | | | | | | | | | | |
Deferred tax asset |
$ | 274.4 | $ | (180.1 | ) | $ | 94.3 | |||
| | | | | | | | | | | |
| | | | | | | | | | | |
- 4)
- In connection with the Reorganization, as a result of a pre-existing contractual provision, we have increased our ownership percentage in an Affiliate. Reflecting this Affiliate equity transaction, we have shown a reduction in cash of $60 million, a reduction of liabilities of $27 million and a reduction of equity of $33 million. The reduction in equity reflects the additional consideration to be paid above the existing liability for the equity purchased.
62
MANAGEMENT'S DISCUSSION AND ANALYSIS OF
FINANCIAL CONDITION AND RESULTS OF OPERATIONS
The following discussion of our financial condition and results of operations should be read in conjunction with our Consolidated Financial Statements and related notes which appear elsewhere in this prospectus.
This discussion contains forward-looking statements that involve risks and uncertainties. See "Special Note Regarding Forward-Looking Statements" for more information. Our actual results could differ materially from those anticipated in these forward-looking statements as a result of various factors, including those discussed below and elsewhere in this prospectus, particularly under "Risk Factors."
This Management's Discussion and Analysis of Financial Condition and Results of Operations, or MD&A, is designed to provide a reader of our financial statements with a narrative from the perspective of our management on our financial condition, results of operations, liquidity and certain other factors that may affect our future results.
Our MD&A is presented in eight sections:
- •
- Overview provides a brief description of our Affiliates, a summary of The Economics of Our Business and an explanation of
How We Measure Performance using a non-GAAP measure
which we refer to as economic net income or ENI. This section also provides a Summary Results of Operations and information regarding our Assets Under Management by Affiliate and asset class.
- •
- U.S. GAAP Results of Operations for the years ended December 31, 2013, 2012 and
2011 includes an explanation of changes in our U.S. GAAP revenue, expense, and other items over the last three years.
- •
- U.S. GAAP Results of Operations for the six months ended June 30, 2014 and
2013 includes an explanation of changes in our U.S. GAAP revenue, expense, and other items between the most recent interim period and the prior year interim period.
- •
- Non-GAAP Supplemental Performance Measure—Economic Net Income
includes an explanation of the key differences between U.S. GAAP net income and ENI, the key measure management uses to evaluate our performance. This section also provides a reconciliation
between U.S. GAAP net income and ENI for the years ended December 31, 2013, 2012, and 2011 and for the six months ended June 30, 2014 and 2013.
- •
- Non-GAAP ENI Results of Operations for the years ended December 31, 2013, 2012 and
2011 includes an explanation of changes in our ENI revenue, ENI expense, and ENI other items over the last three years, presented in a similar format as provided for
U.S. GAAP.
- •
- Non-GAAP ENI Results of Operations for the six months ended June 30, 2014 and
2013 includes an explanation of changes in our ENI revenue, ENI expense, and ENI other items between the most recent interim period and the prior year interim period, presented
in a similar format as provided for U.S. GAAP.
- •
- Capital Resources and Liquidity discusses our key balance sheet data
including Working Capital and Long-Term Debt. This section also discusses Cash Flow from the business, Adjusted EBITDA, Future
Capital Needs, Commitments, Contingencies and Off-Balance Sheet Obligations, and Market Risk. The discussion of Adjusted EBITDA
includes an explanation of how we calculate Adjusted EBITDA and a reconciliation of Adjusted EBITDA to both net income attributable to controlling interests and cash flows from continuing operations
excluding consolidated Funds.
- •
- Critical Accounting Policies and Estimates provides a discussion of the key accounting policies used in the preparation of our U.S. GAAP financial statements.
63
Overview
We are a diversified, multi-boutique asset management firm headquartered in Boston, Massachusetts. We operate our business through seven affiliate firms to whom we refer in this prospectus as our Affiliates. Through our Affiliates, we offer a diverse range of actively-managed investment strategies and products to institutional investors around the globe. While our Affiliates maintain autonomy in the investment process and the day-to-day management of their businesses, our strategy is to work with them to accelerate the growth and profitability of their firms.
Under U.S. GAAP, our Affiliates may be consolidated into our operations or may be accounted for as equity investments. We may also be required to consolidate certain of our Affiliates' sponsored investment entities or "Funds," due to the nature of our decision-making rights, our economic interests in these Funds or the rights of third-party clients in those Funds.
Our Affiliates and their principal strategies include:
- •
- Acadian Asset Management LLC ("Acadian")—a leading
quantitatively-oriented manager of active global and international equity, fixed income and alternative strategies.
- •
- Barrow, Hanley, Mewhinney & Strauss, LLC ("Barrow
Hanley")—a widely recognized value-oriented investment manager of U.S., international and global equities, fixed income and a range of balanced investment
management strategies.
- •
- Campbell Global, LLC ("Campbell Global")—a leading
sustainable timber and natural resource investment manager that seeks to deliver superior investment performance by focusing on unique acquisition opportunities, client objectives and disciplined
management.
- •
- Copper Rock Capital Partners LLC ("Copper Rock")—a
specialized growth equity investment manager of small-cap international, global and emerging markets equity strategies.
- •
- Heitman LLC ("Heitman")*—a leading real estate
investment manager of high-quality global strategies focused on private real estate equity, public real estate securities and real estate debt.
- •
- Investment Counselors of Maryland, LLC ("ICM")*—a
value-driven domestic equity manager with product offerings across the entire capitalization range and a primary focus on small-cap companies.
- •
- Thompson, Siegel & Walmsley LLC ("TS&W")—a value-oriented investment manager focused on small- and mid-cap U.S. equity, international equity and fixed income strategies.
- *
- Accounted for under the equity method of accounting.
The Economics of Our Business
Our profitability is affected by a variety of factors including the level and composition of our average assets under management, or AUM, fee rates charged on AUM and our expense structure. Our Affiliates earn management fees based on assets under management. Approximately 75% of our management fees are calculated based on average AUM (calculated on either a daily or monthly basis) with the remainder of our management fees calculated based on period end AUM or other measuring methods. Changes in the levels of our assets under management are driven by our investment performance and net client cash flows. Our Affiliates may also earn performance fees when certain accounts add value in relation to relevant benchmarks or exceed required returns. Approximately $70.0 billion, or 33% of our AUM in consolidated Affiliates, are in accounts with incentive fee or carried interest features. The majority of these incentive fees are calculated based on value added over the relevant benchmarks on a rolling three year basis. Carried interests are features of private equity funds, which are calculated based on long term cumulative returns. In addition, approximately
64
$10.0 billion of performance fee eligible AUM is managed by our equity-accounted Affiliates. Fees earned on these assets are not reflected as part of ENI or GAAP performance fee revenue.
Our largest expense item is compensation and benefits paid to our and our Affiliates' employees, which consists of both fixed and variable components. Fixed compensation and benefits represents base salaries and wages, payroll taxes and the costs of our employee benefit programs. Variable compensation, calculated as described below, may be awarded in cash, equity or profit interests.
The arrangements in place with our Affiliates result in the sharing of economics between OMUSH and each Affiliate's key management personnel using a profit-sharing model, except for ICM, which uses a revenue share model as a result of a legacy economic arrangement that has not been restructured. Profit sharing affects two elements within our earnings: (i) the calculation of variable compensation and (ii) the level of each Affiliate's equity or profit interests distribution to its employees. Variable compensation is the portion of earnings that is contractually allocated to Affiliate employees as a bonus pool, typically representing a fixed percentage of earnings before variable compensation, which is measured as revenues less fixed compensation and benefits and other operating and administrative expenses. Profits after variable compensation are shared between us and Affiliate key employee equity holders according to our respective equity or profit interests ownership. The sharing of profits in this manner ensures that the economic interests of Affiliate key employees and those of OMUSH are aligned, both in terms of generating strong annual earnings as well as investing those earnings back into the business in order to generate growth over the long term. We view profit sharing as an attractive operating model, as it allows us to share in the benefits of operating leverage as the business grows, and ensures all equity and profit interests holders are incented to achieve that growth.
Equity or profit interests owned by Affiliate key employees are either awarded as part of their variable compensation arrangements, or alternatively, may have originally resulted from OMUSH acquiring less than 100% of the Affiliate. Over time, Affiliate key employee-owned equity or profit interests are recycled from one generation of employee-owners to the next either by the next generation purchasing equity or profit interests directly from retiring principals, or by Affiliate key employees forgoing cash bonuses in exchange for the equivalent value in Affiliate equity or profit interests. The recycling of equity or profit interests is often facilitated by OMUSH; see "—Non-GAAP ENI Results of Operations—ENI Variable Compensation and Affiliate Key Employee Distributions" for a further discussion.
The diagram below provides an illustrative example of how the profit-sharing model would work initially and over time if the Affiliate grew its revenue and profits. In this example, the employees' variable compensation has been contractually set at 30% of earnings before variable compensation, and the earnings after variable compensation are split 60% to OMUSH and 40% to the Affiliate key employees. Revenue initially equals $200 and operating expenses equal $100. Therefore, earnings before variable compensation equal $100 and the contractual bonus pool (variable compensation) equals $30. The owners split the $70 profit after variable compensation, with OMUSH taking $42, or 60%, and the Affiliate key employees taking $28, or 40%. Including both the contractual employee bonus pool and the key employees' share of profit, the employees receive $58, or 58% of profit before variable compensation. Employee equity is valued at a fixed multiple of this $28 share of profits, so employees have transparency into both their earning potential in any year from the bonus pool and share of profits, as well as the current value of their equity and the long-term potential to realize value from its growth. In this structure, key employees who are managing their business have incentives to manage for profit, but also to manage the business prudently, in the interest of their clients, and invest for growth, since they will benefit over the long term as both employees and equity holders. In this
65
way, each Affiliate is aligned with OMUSH and the public shareholders to generate profits and growth over time.
Illustrative Structure: Profit-Sharing Economics
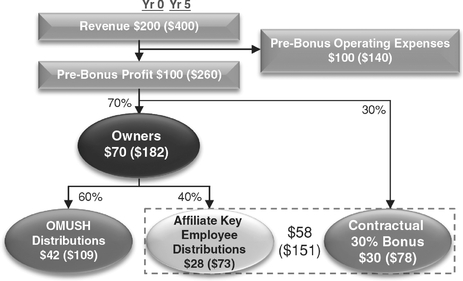
Figures in parenthesis indicate impact of model after five years if revenue and pre-bonus operating expenses grew 15% and 7% annually, respectively.
The alignment of interests is even clearer if we consider the impact of growth on the profit-sharing model. The numbers in parenthesis in the diagram represent the financial results of the illustrative business in five years, assuming revenue has grown at 15% annually and operating expenses have grown at 7% annually. With revenue of $400 and operating expenses of $140, profit before variable compensation has now increased to $260, representing an annual growth rate of 21%. The 30% contractual bonus pool of $78 has also grown 21% annually, as has OMUSH's 60% share of profits, which equals $109, and the Affiliate's 40% share of profits, which equals $73. From this example, it is clear that as profit in the Affiliate's business grows and the operating margin increases, both of the stakeholders—OMUSH and the key employees—are benefiting in a proportionate way. This means that both parties are aligned to invest in the business by hiring new investment professionals, developing new products, or establishing new distribution channels. We believe this investment in turn benefits clients and should generate growth over time.
The alternative structure common in the industry is the revenue share model. In the revenue share model, the affiliate's revenue is typically divided into two fixed percentages—the operating allocation and the owners' allocation. All operating expenses of the business, including employee bonuses, must be covered by the operating allocation. The owners' allocation can be owned entirely by the multi-boutique owner or ownership can be divided between the multi-boutique owner and the affiliate's key employees. In either case, the multi-boutique owner effectively owns a fixed percentage of the affiliates' revenue, which typically does not change as the business grows. While the initial economics of the profit share model and the revenue share model can be similar, over time the economic split and incentive structure can be quite different, leading to less alignment between the affiliate and the multi-boutique owner. The multi-boutique owner's share of profits grows in line with revenue, while any operating leverage in the business is retained entirely by the affiliate's employees. Likewise, new costs and investments to drive growth are borne entirely by the affiliate employees, while the revenue generated by these investments is shared with the multi-boutique owner. While the revenue share structure has been successfully implemented by a number of our peers who have a more autonomous
66
strategy, for OMUSH, which emphasizes collaborative engagement and joint investment with our Affiliates, the alignment of the profit-sharing model is mutually reinforcing with our overall growth strategy and operating philosophy.
How We Measure Performance
We manage our business in aggregate based on a single reportable segment, reflecting how our management assesses the performance of our business. Within our organizational framework, the same operational resources support multiple products and Affiliates and performance is evaluated at a consolidated level.
In measuring and monitoring the key components of our earnings, our management uses a non-GAAP financial measure, ENI, to evaluate the financial performance of, and to make operational decisions for, our business. We also use ENI to make resource allocation decisions, determine appropriate levels of investment or dividend payout, manage balance sheet leverage, determine Affiliate variable compensation and equity distributions, and incentivize management. It is an important measure in evaluating our financial performance because we believe it most accurately represents our operating performance and cash generation capability.
ENI differs from net income determined in accordance with U.S. GAAP as a result of both the reclassification of certain income statement items and the exclusion of certain non-cash or non-recurring income statement items. In particular, ENI excludes the results of discontinued operations which are no longer part of our business, and that portion of consolidated Funds which are not attributable to our shareholders. ENI is also adjusted to reflect the effect of restructuring and reorganization activity undertaken in connection with this offering.
ENI revenue is primarily comprised of the fee revenues paid to us by our clients for our advisory services and earnings from our equity-accounted Affiliates. Revenue included within ENI differs from U.S. GAAP revenue in that it excludes amounts from consolidated Funds which are not attributable to our shareholders, and includes interest income and our share of earnings from equity-accounted Affiliates.
ENI expenses are calculated to reflect all usual expenses from ongoing continuing operations attributable to our shareholders. Expenses included within ENI differ from U.S. GAAP expenses in that they exclude amounts from consolidated Funds not attributable to our shareholders, revaluations of Affiliate key employee owned equity and profit interests, amortization and impairment of acquired intangibles and certain other non-cash expenses.
"Non-controlling interests" is a concept under U.S. GAAP that identifies net components of revenues and expenses that are not attributable to our shareholders. For example, the portion of the net income (loss) of our consolidated Funds that is attributable to the outside investors or clients of the consolidated Funds is included in "Non-controlling interests" in our Consolidated Financial Statements. Conversely, "Controlling interests" is the portion of revenue or expense that is attributable to our shareholders.
For a more detailed discussion of the differences between U.S. GAAP net income and economic net income, see "—Non-GAAP Supplemental Performance Measure—Economic Net Income."
67
Summary Results of Operations
The following table summarizes our results of operations for the years ended December 31, 2013, 2012 and 2011:
| |
Years Ended December 31, | Increase (Decrease) |
||||||||||||||
|---|---|---|---|---|---|---|---|---|---|---|---|---|---|---|---|---|
| ($ in millions, unless otherwise noted) |
2013 | 2012 | 2011 | 2013 vs. 2012 |
2012 vs. 2011 |
|||||||||||
U.S. GAAP Metrics |
||||||||||||||||
Revenue |
$ | 928.6 | $ | 703.5 | $ | 724.2 | $ | 225.1 | $ | (20.7 | ) | |||||
Net income before tax from continuing operations attributable to controlling interests(1) |
32.7 | 27.3 | 22.0 | 5.4 | 5.3 | |||||||||||
Net income from continuing operations attributable to controlling interests(1) |
19.4 | 24.0 | 26.2 | (4.6 | ) | (2.2 | ) | |||||||||
Pre-tax U.S. GAAP controlling interests operating margin(7) |
6 | % | 6 | % | 5 | % | 0 | % | (1 | )% | ||||||
Non-GAAP Metrics used by management (unaudited) |
||||||||||||||||
ENI revenue(2)(4) |
$ | 528.0 | $ | 452.2 | $ | 435.7 | $75.8 | $16.5 | ||||||||
Pre-tax economic net income(2)(5) |
153.0 | 131.3 | 124.3 | 21.7 | 7.0 | |||||||||||
Economic net income(2)(6) |
122.9 | 112.3 | 101.9 | 10.6 | 10.4 | |||||||||||
Pre-tax ENI operating margin before Affiliate key employee distributions(3) |
34 |
% |
33 |
% |
32 |
% |
1 |
% |
1 |
% |
||||||
Pre-tax ENI operating margin after Affiliate key employee distributions(3) |
29 | % | 29 | % | 29 | % | 0 | % | 0 | % | ||||||
Other Operational Information (unaudited) |
||||||||||||||||
Assets under management at year end (in billions) |
$ | 198.8 | $ | 156.7 | $ | 136.8 | $42.1 | $19.9 | ||||||||
Net client cash flows (in billions) |
10.5 | 0.4 | (4.6 | ) | 10.1 | 5.0 | ||||||||||
- (1)
- Net
income from continuing operations attributable to controlling interests excludes the results of consolidated Funds.
- (2)
- Economic
net income, which is presented after Affiliate key employee distributions, is a non-GAAP measure we use to evaluate the performance of our
continuing operations. For a reconciliation to U.S. GAAP financial information and a further discussion of economic net income refer to "—Non-GAAP Supplemental Performance
Measures—Economic Net Income".
- (3)
- Pre-tax
ENI operating margin is calculated based on pre-tax economic net income both before and after Affiliate key employee distributions, divided by ENI
revenue.
- (4)
- ENI
revenue is the ENI measure which corresponds to U.S. GAAP revenue.
- (5)
- Pre-tax
economic net income is the ENI measure which corresponds to U.S. GAAP net income/(loss) before tax from continuing operations attributable to
controlling interests.
- (6)
- Economic
net income is the ENI measure which corresponds to U.S. GAAP net income/(loss) from continuing operations attributable to controlling
interests.
- (7)
- The pre-tax U.S. GAAP controlling interests operating margin is calculated using net income before tax from continuing operations attributable to controlling interests and GAAP revenue from continuing operations attributable to controlling interests.
68
The following table summarizes our unaudited results of operations for the six months ended June 30, 2014 and 2013:
| |
For the six months ended June 30, (unaudited) |
Increase (Decrease) |
||||||||
|---|---|---|---|---|---|---|---|---|---|---|
| ($ in millions, unless otherwise noted) |
2014 | 2013 | 2014 vs. 2013 |
|||||||
US GAAP Metrics |
||||||||||
Revenue |
$ | 529.7 | $ | 470.3 | $ | 59.4 | ||||
Net income before tax from continuing operations attributable to controlling interests(1) |
39.6 | 13.2 | 26.4 | |||||||
Net income from continuing operations attributable to controlling interests(1) |
23.4 | 7.2 | 16.2 | |||||||
Pre-tax U.S. GAAP controlling interests operating margin(7) |
14 | % | 5 | % | 9 | % | ||||
Non-GAAP Metrics used by management |
||||||||||
ENI revenue(2),(4) |
292.1 | 252.4 | 39.7 | |||||||
Pre-tax economic net income(2),(5) |
91.2 | 73.7 | 17.5 | |||||||
Economic net income(2),(6) |
66.6 | 58.3 | 8.3 | |||||||
Pre-tax ENI operating margin before Affiliate key employee distributions(3) |
37 |
% |
34 |
% |
3 |
% |
||||
Pre-tax ENI operating margin after Affiliate key employee distributions(3) |
31 | % | 29 | % | 2 | % | ||||
Other Operational Information |
||||||||||
Assets under management (AUM) at year end (in billions) |
$ | 214.9 | $ | 173.9 | $ | 41.0 | ||||
Net client cash flows (in billions) |
2.6 | 6.1 | (3.5 | ) | ||||||
- (1)
- Net
income from continuing operations attributable to controlling interests excludes the results of consolidated Funds.
- (2)
- Economic
net income, which is presented after Affiliate key employee distributions, is a non-GAAP measure we use to evaluate the performance of our
continuing operations. For a reconciliation to U.S. GAAP financial information and a further discussion of economic net income refer to "—Non-GAAP Supplemental Performance
Measure—Economic Net Income".
- (3)
- Pre-tax
ENI operating margin is calculated based on pre-tax economic net income both before and after Affiliate key employee distributions, divided by ENI
revenue.
- (4)
- ENI
revenue is the ENI measure which corresponds to U.S. GAAP revenue.
- (5)
- Pre-tax
economic net income is the ENI measure which corresponds to U.S. GAAP net income/(loss) before tax from continuing operations attributable to
controlling interests.
- (6)
- Economic
Net Income is the ENI measure which corresponds to U.S. GAAP net income/(loss) from continuing operations attributable to controlling
interests.
- (7)
- The pre-tax U.S. GAAP controlling interests operating margin is calculated using net income before tax from continuing operations attributable to controlling interests and GAAP revenue from continuing operations attributable to controlling interests.
69
Assets Under Management
Our total assets under management as of June 30, 2014 were $214.9 billion. The following table presents our assets under management by Affiliate for each of the periods indicated:
| |
|
As of December 31, | |||||||||||
|---|---|---|---|---|---|---|---|---|---|---|---|---|---|
| |
As of June 30, 2014 |
||||||||||||
| ($ in billions) |
2013 | 2012 | 2011 | ||||||||||
Acadian Asset Management |
$ | 71.0 | $ | 65.2 | $ | 51.9 | $ | 42.2 | |||||
Barrow, Hanley, Mewhinney & Strauss |
97.5 | 91.0 | 67.7 | 59.7 | |||||||||
The Campbell Group |
6.7 | 6.6 | 6.6 | 5.8 | |||||||||
Copper Rock Capital |
2.5 | 2.7 | 1.8 | 1.2 | |||||||||
Heitman |
24.6 | 23.4 | 20.4 | 19.2 | |||||||||
Investment Counselors of Maryland |
2.4 | 2.5 | 2.1 | 1.9 | |||||||||
Thompson, Siegel & Walmsley |
10.2 | 7.4 | 6.2 | 6.8 | |||||||||
| | | | | | | | | | | | | | |
Total assets under management |
$ | 214.9 | $ | 198.8 | $ | 156.7 | $ | 136.8 | |||||
| | | | | | | | | | | | | | |
| | | | | | | | | | | | | | |
Average assets under management |
$ | 203.8 | $ | 177.5 | $ | 148.2 | $ | 143.0 | |||||
| | | | | | | | | | | | | | |
| | | | | | | | | | | | | | |
Our primary asset classes include:
- i.
- U.S.
equity, which includes small cap through large cap securities and substantially value or blended investment styles;
- ii.
- Global/non-U.S.
equity, which includes global and international equities including emerging markets;
- iii.
- Fixed
income, which includes government bonds, corporate bonds and other fixed income investments in the United States and non-U.S. markets;
and
- iv.
- Alternative, real estate and timber, which consist of real estate, timberland investments and other alternative investments.
The following table presents our assets under management by strategy for each of the periods indicated:
| |
|
As of December 31, | |||||||||||
|---|---|---|---|---|---|---|---|---|---|---|---|---|---|
| |
As of June 30, 2014 |
||||||||||||
| ($ in billions) |
2013 | 2012 | 2011 | ||||||||||
U.S. equity, small/smid cap |
$ | 8.1 | $ | 8.3 | $ | 7.2 | $ | 7.4 | |||||
U.S. equity, mid cap value |
9.2 | 7.3 | 4.3 | 4.0 | |||||||||
U.S. equity, large cap value |
64.3 | 61.2 | 46.1 | 43.1 | |||||||||
U.S. equity, core/blend |
4.4 | 3.8 | 2.8 | 2.5 | |||||||||
| | | | | | | | | | | | | | |
Total U.S. equity |
86.0 | 80.6 | 60.4 | 57.0 | |||||||||
| | | | | | | | | | | | | | |
Global equity |
28.6 | 24.8 | 18.2 | 14.5 | |||||||||
International equity |
32.1 | 29.6 | 21.1 | 17.7 | |||||||||
Emerging markets equity |
22.0 | 19.9 | 17.0 | 12.3 | |||||||||
| | | | | | | | | | | | | | |
Total Global/non-U.S. equity |
82.7 | 74.3 | 56.3 | 44.5 | |||||||||
| | | | | | | | | | | | | | |
Fixed income |
14.5 | 13.5 | 12.7 | 10.1 | |||||||||
Alternative, real estate & timber |
31.7 | 30.4 | 27.3 | 25.2 | |||||||||
| | | | | | | | | | | | | | |
Total assets under management |
$ | 214.9 | $ | 198.8 | $ | 156.7 | $ | 136.8 | |||||
| | | | | | | | | | | | | | |
| | | | | | | | | | | | | | |
70
The following table summarizes our asset flows and market appreciation/depreciation by asset class for each of the periods indicated:
| |
|
Years Ended December 31, |
|||||||||||
|---|---|---|---|---|---|---|---|---|---|---|---|---|---|
| |
Six Months Ended June 30, 2014 |
||||||||||||
| ($ in billions) |
2013 | 2012 | 2011 | ||||||||||
U.S. equity |
|||||||||||||
Beginning balance |
$ | 80.6 | $ | 60.4 | $ | 57.0 | $ | 61.2 | |||||
Gross inflows |
4.3 | 8.1 | 2.0 | 3.3 | |||||||||
Gross outflows |
(4.2 | ) | (8.3 | ) | (7.5 | ) | (8.8 | ) | |||||
| | | | | | | | | | | | | | |
Net flows |
0.1 | (0.2 | ) | (5.5 | ) | (5.5 | ) | ||||||
Market appreciation |
5.7 | 20.4 | 8.9 | 1.2 | |||||||||
Other |
(0.4 | ) | — | — | 0.1 | ||||||||
| | | | | | | | | | | | | | |
Ending balance |
$ | 86.0 | $ | 80.6 | $ | 60.4 | $ | 57.0 | |||||
| | | | | | | | | | | | | | |
| | | | | | | | | | | | | | |
Global / non-U.S. equity |
|||||||||||||
Beginning balance |
$ | 74.3 | $ | 56.3 | $ | 44.5 | $ | 51.2 | |||||
Gross inflows |
6.7 | 14.3 | 9.8 | 6.0 | |||||||||
Gross outflows |
(4.5 | ) | (6.7 | ) | (6.8 | ) | (7.3 | ) | |||||
| | | | | | | | | | | | | | |
Net flows |
2.2 | 7.6 | 3.0 | (1.3 | ) | ||||||||
Market appreciation (depreciation) |
6.2 | 10.4 | 8.8 | (5.4 | ) | ||||||||
Other |
— | — | — | ||||||||||
| | | | | | | | | | | | | | |
Ending balance |
$ | 82.7 | $ | 74.3 | $ | 56.3 | $ | 44.5 | |||||
| | | | | | | | | | | | | | |
| | | | | | | | | | | | | | |
Fixed income |
|||||||||||||
Beginning balance |
$ | 13.5 | $ | 12.7 | $ | 10.1 | $ | 8.9 | |||||
Gross inflows |
1.3 | 2.9 | 3.7 | 2.6 | |||||||||
Gross outflows |
(1.3 | ) | (1.8 | ) | (2.0 | ) | (1.4 | ) | |||||
| | | | | | | | | | | | | | |
Net flows |
0.0 | 1.1 | 1.7 | 1.2 | |||||||||
Market appreciation (depreciation) |
1.0 | (0.3 | ) | 0.9 | 0.7 | ||||||||
Other |
— | — | — | (0.7 | ) | ||||||||
| | | | | | | | | | | | | | |
Ending balance |
$ | 14.5 | $ | 13.5 | $ | 12.7 | $ | 10.1 | |||||
| | | | | | | | | | | | | | |
| | | | | | | | | | | | | | |
Alternative, real estate and timber |
|||||||||||||
Beginning balance |
$ | 30.4 | $ | 27.3 | $ | 25.2 | $ | 22.7 | |||||
Gross inflows |
1.6 | 4.0 | 4.1 | 3.3 | |||||||||
Gross outflows |
(0.4 | ) | (1.0 | ) | (0.9 | ) | (1.3 | ) | |||||
Hard asset disposals |
(0.9 | ) | (1.0 | ) | (2.0 | ) | (1.0 | ) | |||||
| | | | | | | | | | | | | | |
Net flows |
0.3 | 2.0 | 1.2 | 1.0 | |||||||||
Market appreciation |
1.0 | 1.1 | 0.9 | 1.5 | |||||||||
Other |
— | — | — | — | |||||||||
| | | | | | | | | | | | | | |
Ending balance |
$ | 31.7 | $ | 30.4 | $ | 27.3 | $ | 25.2 | |||||
| | | | | | | | | | | | | | |
| | | | | | | | | | | | | | |
Total |
|||||||||||||
Beginning balance |
$ | 198.8 | $ | 156.7 | $ | 136.8 | $ | 144.0 | |||||
Gross inflows |
13.9 | 29.3 | 19.6 | 15.2 | |||||||||
Gross outflows |
(10.4 | ) | (17.8 | ) | (17.2 | ) | (18.8 | ) | |||||
Hard asset disposals |
(0.9 | ) | (1.0 | ) | (2.0 | ) | (1.0 | ) | |||||
| | | | | | | | | | | | | | |
Net flows |
2.6 | 10.5 | 0.4 | (4.6 | ) | ||||||||
Market appreciation |
13.9 | 31.6 | 19.5 | (2.0 | ) | ||||||||
Other |
(0.4 | ) | — | — | (0.6 | ) | |||||||
| | | | | | | | | | | | | | |
Ending balance |
$ | 214.9 | $ | 198.8 | $ | 156.7 | $ | 136.8 | |||||
| | | | | | | | | | | | | | |
| | | | | | | | | | | | | | |
Basis points: inflows |
41.4 | 40.0 | 41.7 | 39.4 | |||||||||
Basis points: outflows |
37.2 | 39.8 | 36.8 | 35.1 | |||||||||
Annualized revenue impact of net flows (in millions)* |
$ | 15.4 | $ | 42.5 | $ | 11.2 | $ | (12.1 | ) | ||||
| | | | | | | | | | | | | | |
| | | | | | | | | | | | | | |
- *
- Annualized revenue impact of net flows excludes market appreciation or depreciation. Annualized revenue impact of net flows represents the difference between annualized management fees expected to be earned on new accounts and net assets contributed to existing accounts, less the annualized management fees lost on terminated accounts or net assets withdrawn from existing accounts, including equity-accounted Affiliates. Annualized revenue is calculated by multiplying the annual gross fee rate for the relevant account by the net assets gained in the account in the event of a positive flow or the net assets lost in the account in the event of an outflow.
71
We also analyze our asset flows by client type and client location. Our client types include:
- i.
- Sub-advisory,
which includes assets managed for underlying mutual fund, variable insurance and defined contribution products which are sponsored by insurance
companies and mutual fund platforms, where the end client is typically retail;
- ii.
- Institutional,
which includes assets managed for public / government pension funds, including U.S. state and local government funds and non-U.S. sovereign
wealth, local government and national pension funds; also includes corporate and union-sponsored pension plans; and
- iii.
- Retail / other, which includes assets managed for mutual funds sponsored by our Affiliates, defined contribution plans and accounts managed for high net worth clients.
The following table summarizes our asset flows by client type for each of the periods indicated:
| |
Six Months Ended June 30, 2014 |
Years Ended December 31, | |||||||||||
|---|---|---|---|---|---|---|---|---|---|---|---|---|---|
| ($ in billions) |
2013 | 2012 | 2011 | ||||||||||
Sub-advisory |
|||||||||||||
Beginning balance |
$ | 65.1 | $ | 46.2 | $ | 41.0 | $ | 44.1 | |||||
Gross inflows |
5.4 | 10.2 | 3.4 | 3.4 | |||||||||
Gross outflows |
(3.2 | ) | (5.4 | ) | (5.1 | ) | (7.4 | ) | |||||
| | | | | | | | | | | | | | |
Net flows |
2.2 | 4.8 | (1.7 | ) | (4.0 | ) | |||||||
Market appreciation |
4.9 | 14.1 | 6.9 | 0.9 | |||||||||
Other |
(0.1 | ) | — | — | — | ||||||||
| | | | | | | | | | | | | | |
Ending balance |
$ | 72.1 | $ | 65.1 | $ | 46.2 | $ | 41.0 | |||||
| | | | | | | | | | | | | | |
| | | | | | | | | | | | | | |
Institutional |
|||||||||||||
Beginning balance |
$ | 124.4 | $ | 102.7 | $ | 88.3 | $ | 91.3 | |||||
Gross inflows |
7.8 | 17.6 | 15.0 | 10.6 | |||||||||
Gross outflows |
(6.1 | ) | (10.7 | ) | (10.4 | ) | (9.5 | ) | |||||
Hard asset disposals |
(0.9 | ) | (1.0 | ) | (2.0 | ) | (1.0 | ) | |||||
| | | | | | | | | | | | | | |
Net flows |
0.8 | 5.9 | 2.6 | 0.1 | |||||||||
Market appreciation (depreciation) |
8.3 | 15.8 | 11.8 | (2.5 | ) | ||||||||
Other |
(0.3 | ) | — | — | (0.6 | ) | |||||||
| | | | | | | | | | | | | | |
Ending balance |
$ | 133.2 | $ | 124.4 | $ | 102.7 | $ | 88.3 | |||||
| | | | | | | | | | | | | | |
| | | | | | | | | | | | | | |
Retail/Other |
|||||||||||||
Beginning balance |
$ | 9.3 | $ | 7.8 | $ | 7.5 | $ | 8.6 | |||||
Gross inflows |
0.7 | 1.5 | 1.2 | 1.2 | |||||||||
Gross outflows |
(1.1 | ) | (1.7 | ) | (1.7 | ) | (1.9 | ) | |||||
| | | | | | | | | | | | | | |
Net flows |
(0.4 | ) | (0.2 | ) | (0.5 | ) | (0.7 | ) | |||||
Market appreciation (depreciation) |
0.7 | 1.7 | 0.8 | (0.4 | ) | ||||||||
| | | | | | | | | | | | | | |
Ending balance |
$ | 9.6 | $ | 9.3 | $ | 7.8 | $ | 7.5 | |||||
| | | | | | | | | | | | | | |
| | | | | | | | | | | | | | |
Total |
|||||||||||||
Beginning balance |
$ | 198.8 | $ | 156.7 | $ | 136.8 | $ | 144.0 | |||||
Gross inflows |
13.9 | 29.3 | 19.6 | 15.2 | |||||||||
Gross outflows |
(10.4 | ) | (17.8 | ) | (17.2 | ) | (18.8 | ) | |||||
Hard asset disposals |
(0.9 | ) | (1.0 | ) | (2.0 | ) | (1.0 | ) | |||||
| | | | | | | | | | | | | | |
Net flows |
2.6 | 10.5 | 0.4 | (4.6 | ) | ||||||||
Market appreciation |
13.9 | 31.6 | 19.5 | (2.0 | ) | ||||||||
Other |
(0.4 | ) | — | — | (0.6 | ) | |||||||
| | | | | | | | | | | | | | |
Ending balance |
$ | 214.9 | $ | 198.8 | $ | 156.7 | $ | 136.8 | |||||
| | | | | | | | | | | | | | |
| | | | | | | | | | | | | | |
72
It is a strategic objective to increase our percentage of assets under management sourced from non-U.S. clients. Our categorization by client location includes:
- i.
- U.S.-based
clients, where the contracting client is based in the United States, and
- ii.
- Non-U.S.-based clients, where the contracting client is based outside the United States.
The following table summarizes asset flows by client location for each of the periods indicated:
| |
Six Months Ended June 30, 2014 |
Years Ended December 31, | |||||||||||
|---|---|---|---|---|---|---|---|---|---|---|---|---|---|
| ($ in billions) |
2013 | 2012 | 2011 | ||||||||||
U.S. |
|||||||||||||
Beginning balance |
$ | 160.2 | $ | 126.7 | $ | 113.8 | $ | 120.6 | |||||
Gross inflows |
10.0 | 22.5 | 13.2 | 10.1 | |||||||||
Gross outflows |
(7.8 | ) | (13.4 | ) | (14.4 | ) | (14.5 | ) | |||||
Hard asset disposals |
(0.7 | ) | (0.9 | ) | (1.8 | ) | (0.9 | ) | |||||
| | | | | | | | | | | | | | |
Net flows |
1.5 | 8.2 | (3.0 | ) | (5.3 | ) | |||||||
Market appreciation |
10.8 | 25.3 | 15.9 | (0.9 | ) | ||||||||
Other |
(0.3 | ) | — | — | (0.6 | ) | |||||||
| | | | | | | | | | | | | | |
Ending balance |
$ | 172.2 | $ | 160.2 | $ | 126.7 | $ | 113.8 | |||||
| | | | | | | | | | | | | | |
| | | | | | | | | | | | | | |
Non-U.S. |
|||||||||||||
Beginning balance |
$ | 38.6 | $ | 30.1 | $ | 23.1 | $ | 23.5 | |||||
Gross inflows |
3.9 | 6.8 | 6.4 | 5.1 | |||||||||
Gross outflows |
(2.6 | ) | (4.4 | ) | (2.8 | ) | (4.3 | ) | |||||
Hard asset disposals |
(0.2 | ) | (0.1 | ) | (0.2 | ) | (0.1 | ) | |||||
| | | | | | | | | | | | | | |
Net flows |
1.1 | 2.3 | 3.4 | 0.7 | |||||||||
Market appreciation (depreciation) |
3.1 | 6.2 | 3.5 | (1.1 | ) | ||||||||
Other |
(0.1 | ) | — | — | — | ||||||||
| | | | | | | | | | | | | | |
Ending balance |
$ | 42.7 | $ | 38.6 | $ | 30.0 | $ | 23.1 | |||||
| | | | | | | | | | | | | | |
| | | | | | | | | | | | | | |
Total |
|||||||||||||
Beginning balance |
$ | 198.8 | $ | 156.7 | $ | 136.8 | $ | 144.0 | |||||
Gross inflows |
13.9 | 29.3 | 19.6 | 15.2 | |||||||||
Gross outflows |
(10.4 | ) | (17.8 | ) | (17.2 | ) | (18.8 | ) | |||||
Hard asset disposals |
(0.9 | ) | (1.0 | ) | (2.0 | ) | (1.0 | ) | |||||
| | | | | | | | | | | | | | |
Net flows |
2.6 | 10.5 | 0.4 | (4.6 | ) | ||||||||
Market appreciation |
13.9 | 31.6 | 19.5 | (2.0 | ) | ||||||||
Other |
(0.4 | ) | — | — | (0.6 | ) | |||||||
| | | | | | | | | | | | | | |
Ending balance |
$ | 214.9 | $ | 198.8 | $ | 156.7 | $ | 136.8 | |||||
| | | | | | | | | | | | | | |
| | | | | | | | | | | | | | |
73
U.S. GAAP Results of Operations
For the Years Ended December 31, 2013, 2012 and 2011
Our U.S. GAAP results of operations were as follows for the years ended December 31, 2013, 2012 and 2011:
| |
|
|
|
Increase (Decrease) |
||||||||||||
|---|---|---|---|---|---|---|---|---|---|---|---|---|---|---|---|---|
| |
Years Ended December 31, | |||||||||||||||
| |
2013 vs. 2012 |
2012 vs. 2011 |
||||||||||||||
($ in millions) U.S. GAAP Statement of Operations |
2013 | 2012 | 2011 | |||||||||||||
Management fees |
$ | 478.2 | $ | 399.3 | $ | 398.2 | $ | 78.9 | $ | 1.1 | ||||||
Performance fees |
18.1 | 14.1 | 4.3 | 4.0 | 9.8 | |||||||||||
Other revenue |
1.8 | 0.5 | 0.3 | 1.3 | 0.2 | |||||||||||
Consolidated Funds revenue |
430.5 | 289.6 | 321.4 | 140.9 | (31.8 | ) | ||||||||||
| | | | | | | | | | | | | | | | | |
Total revenue |
928.6 | 703.5 | 724.2 | 225.1 | (20.7 | ) | ||||||||||
| | | | | | | | | | | | | | | | | |
Compensation and benefits |
352.3 | 267.2 | 251.8 | 85.1 | 15.4 | |||||||||||
General and administrative |
68.7 | 68.6 | 76.8 | 0.1 | (8.2 | ) | ||||||||||
Amortization and impairment of acquired intangibles |
0.1 | 1.8 | 8.6 | (1.7 | ) | (6.8 | ) | |||||||||
Depreciation and amortization |
4.9 | 5.8 | 6.9 | (0.9 | ) | (1.1 | ) | |||||||||
Consolidated Funds expense |
602.1 | 422.6 | 459.0 | 179.5 | (36.4 | ) | ||||||||||
| | | | | | | | | | | | | | | | | |
Total expenses |
1,028.1 | 766.0 | 803.1 | 262.1 | (37.1 | ) | ||||||||||
| | | | | | | | | | | | | | | | | |
Operating loss |
(99.5 | ) | (62.5 | ) | (78.9 | ) | (37.0 | ) | 16.4 | |||||||
| | | | | | | | | | | | | | | | | |
Investment income |
10.7 | 16.5 | 13.8 | (5.8 | ) | 2.7 | ||||||||||
Interest income |
0.5 | 1.4 | 0.5 | (0.9 | ) | 0.9 | ||||||||||
Interest expense |
(72.2 | ) | (84.1 | ) | (74.2 | ) | 11.9 | (9.9 | ) | |||||||
Consolidated Funds' investment gain |
76.7 | 82.0 | 65.9 | (5.3 | ) | 16.1 | ||||||||||
| | | | | | | | | | | | | | | | | |
Loss from continuing operations before taxes |
(83.8 | ) | (46.7 | ) | (72.9 | ) | (37.1 | ) | 26.2 | |||||||
| | | | | | | | | | | | | | | | | |
Income tax expense (benefit) |
13.3 | 3.3 | (4.2 | ) | 10.0 | 7.5 | ||||||||||
| | | | | | | | | | | | | | | | | |
Loss from continuing operations |
(97.1 | ) | (50.0 | ) | (68.7 | ) | (47.1 | ) | 18.7 | |||||||
| | | | | | | | | | | | | | | | | |
Gain (loss) from discontinued operations, net of tax |
2.7 | (27.0 | ) | (45.4 | ) | 29.7 | 18.4 | |||||||||
Gain (loss) on disposal of discontinued operations, net of tax |
(2.1 | ) | 10.8 | 22.9 | (12.9 | ) | (12.1 | ) | ||||||||
| | | | | | | | | | | | | | | | | |
Net loss |
(96.5 | ) | (66.2 | ) | (91.2 | ) | (30.3 | ) | 25.0 | |||||||
Net loss attributable to non-controlling interest |
(122.2 | ) | (69.2 | ) | (101.5 | ) | (53.0 | ) | 32.3 | |||||||
| | | | | | | | | | | | | | | | | |
Net income attributable to controlling interests |
$ | 25.7 | $ | 3.0 | $ | 10.3 | $ | 22.7 | $ | (7.3 | ) | |||||
| | | | | | | | | | | | | | | | | |
| | | | | | | | | | | | | | | | | |
Pre-tax U.S. GAAP controlling interests operating margin* |
6 | % | 6 | % | 5 | % | ||||||||||
- *
- The pre-tax U.S. GAAP controlling interests operating margin is calculated using pre-tax income from continuing operations attributable to controlling interests and GAAP revenue from continuing operations attributable to controlling interests.
74
The following table reconciles our net income attributable to controlling interests to our pre-tax net income before tax from continuing operations attributable to controlling interests:
| |
Years ended December 31, |
|||||||||
|---|---|---|---|---|---|---|---|---|---|---|
($ in millions) U.S. GAAP Statement of Operations |
2013 | 2012 | 2011 | |||||||
Net income attributable to controlling interests |
$ | 25.7 | $ | 3.0 | $ | 10.3 | ||||
Exclude: Loss (profit) on discontinued operations attributable to controlling interests |
(6.3 | ) | 21.0 | 15.9 | ||||||
| | | | | | | | | | | |
Net income from continuing operations attributable to controlling interests |
19.4 | 24.0 | 26.2 | |||||||
Add: Income tax expense (benefit) |
13.3 | 3.3 | (4.2 | ) | ||||||
| | | | | | | | | | | |
Net income before tax from continuing operations attributable to controlling interests |
$ | 32.7 | $ | 27.3 | $ | 22.0 | ||||
| | | | | | | | | | | |
| | | | | | | | | | | |
U.S. GAAP Revenues
Our U.S. GAAP revenues principally consist of:
- i.
- management
fees earned based on our overall weighted average fee rate charged to our clients and the level of assets under management;
- ii.
- performance
fees earned when our Affiliates' investment performance over agreed time periods for certain clients has met or exceeded pre-determined hurdles;
- iii.
- other
revenue, consisting primarily of marketing, distribution and joint venture income; and
- iv.
- revenue from consolidated Funds, the net benefit of which is attributable to the holders of non-controlling interests.
Management Fees
Year ended December 31, 2013 compared to year ended December 31, 2012: Management fees increased $78.9 million, or 19.8%, from $399.3 million for the year ended December 31, 2012 to $478.2 million for the year ended December 31, 2013. The increase was primarily attributable to increases in average assets under management, which were $177.5 billion in 2013 and $148.2 billion in 2012. The weighted average fee rate earned on our average assets under management was 34 basis points in both 2013 and 2012. Of the increase in average assets from 2012 to 2013, $23.6 billion was due to net appreciation of assets under management, while $5.7 billion was due to fluctuations in client flows.
Year ended December 31, 2012 compared to year ended December 31, 2011: Management fees increased $1.1 million, or 0.3%, from $398.2 million for the year ended December 31, 2011 to $399.3 million for the year ended December 31, 2012. The increase was primarily attributable to an increase in average assets under management, which were $148.2 billion as of December 31, 2012 and $143.0 billion as of December 31, 2011, partly offset by a decrease in average basis points earned, from 35 basis points in 2011 to 34 basis points in 2012. Of the increase in average assets from 2011 to 2012, $6.5 billion was due to net appreciation of assets under management, while $(1.4) billion was due to fluctuations in client flows.
Performance Fees
Year ended December 31, 2013 compared to year ended December 31, 2012: Performance fees increased $4.0 million, or 28.4% from $14.1 million for the year ended December 31, 2012 to $18.1 million for the year ended December 31, 2013. Performance fees can be variable and are
75
contractually triggered based on investment performance results over agreed upon time periods. The increase was primarily due to higher performance fees from equity and alternative products.
Year ended December 31, 2012 compared to year ended December 31, 2011: Performance fees increased $9.8 million, or 228%, from $4.3 million for the year ended December 31, 2011 to $14.1 million for the year ended December 31, 2012. The increase was primarily attributable to strong emerging market equity investment performance relative to the wider markets.
Other Revenue
Year ended December 31, 2013 compared to year ended December 31, 2012: Other revenue increased $1.3 million, or 260%, from $0.5 million for the year ended December 31, 2012 to $1.8 million for the year ended December 31, 2013. The increase was due to additional marketing and distribution fees earned through our Company-led Global Distribution fund platform as the platform's assets under management grew.
Year ended December 31, 2012 compared to year ended December 31, 2011: Other revenue was broadly consistent, amounting to $0.5 million in 2012 and $0.3 million in 2011.
U.S. GAAP Expenses
Our U.S. GAAP expenses principally consist of:
- i.
- compensation
paid to our investment professionals and other employees, including base salary, benefits, variable compensation, Affiliate distributions and
re-valuation of key employee owned Affiliate equity and profit interests;
- ii.
- general
and administrative expenses;
- iii.
- amortization
of acquired intangible assets;
- iv.
- depreciation
and amortization charges; and
- v.
- expenses of consolidated Funds, the net cost of which is attributable to the holders of non-controlling interests.
Compensation and Benefits Expense
Year ended December 31, 2013 compared to year ended December 31, 2012: Compensation and benefits expense increased $85.1 million, or 31.8%, from $267.2 million for the year ended December 31, 2012 to $352.3 million for the year ended December 31, 2013. Fixed compensation and benefits increased $7.4 million, or 7.1%, from $104.0 million for the year ended December 31, 2012 to $111.4 million for the year ended December 31, 2013. This reflects increases in head count at certain Affiliates, as well as annual increases in base salaries, wages and benefits. Variable compensation increased $32.8 million, or 27.1%, from $121.0 million for the year ended December 31, 2012 to $153.8 million for the year ended December 31, 2013, which was driven by higher pre-variable compensation earnings. Sales-based compensation increased $4.1 million, or 59.4%, from $6.9 million for the year ended December 31, 2012 to $11.0 million for the year ended December 31, 2013, as a result of the timing and structure of the commissions due on inflows of assets under management in current and prior periods. Affiliate key employee distributions increased $9.3 million, or 48.7%, from $19.1 million for the year ended December 31, 2012 to $28.4 million for the year ended December 31, 2013, and revaluations of Affiliate equity increased $31.5 million, both of which were due to higher Affiliate earnings after variable compensation, in addition to higher key employee ownership through the ongoing purchase of Affiliate equity and profit interests.
76
Year ended December 31, 2012 compared to year ended December 31, 2011: Compensation and benefits expense increased $15.4 million, or 6.1%, from $251.8 million for the year ended December 31, 2011 to $267.2 million for the year ended December 31, 2012. Fixed compensation and benefits increased $3.8 million, or 3.8%, from $100.2 million for the year ended December 31, 2011 to $104.0 million for the year ended December 31, 2012. This reflects increases in head count at certain Affiliates, annual increases in base salaries and wages as well as higher average costs of medical benefit programs provided to our and our Affiliates' employees. Variable compensation increased $2.6 million, or 2.2%, from $118.4 million for the year ended December 31, 2011 to $121.0 million for the year ended December 31, 2012, driven by higher pre-variable compensation earnings. Sales-based compensation decreased $1.3 million from $8.2 million for the year ended December 31, 2011 to $6.9 million for the year ended December 31, 2012, as a result of the timing and structure of the commissions due on inflows of assets under management in current and prior periods. Affiliate key employee distributions increased $5.6 million and revaluations of Affiliate equity increased $4.7 million, both due to higher Affiliate earnings after variable compensation, in addition to higher key employee ownership through ongoing purchases of Affiliate equity and profit interests.
General and Administrative Expense
Year ended December 31, 2013 compared to year ended December 31, 2012: General and administrative expense increased $0.1 million, or 0.1%, from $68.6 million for the year ended December 31, 2012 to $68.7 million for the year ended December 31, 2013.
Year ended December 31, 2012 compared to year ended December 31, 2011: General and administrative expense decreased $8.2 million, or 10.7%, from $76.8 million for the year ended December 31, 2011 to $68.6 million for the year ended December 31, 2012. In 2011, we incurred an $8.0 million charge for costs associated with our initial preparations for an initial public offering, which were temporarily halted.
Amortization and Impairment of Acquired Intangibles Expense
Year ended December 31, 2013 compared to year ended December 31, 2012: Amortization of acquired intangibles expense decreased $1.7 million, or 94.4%, from $1.8 million for the year ended December 31, 2012 to $0.1 million for the year ended December 31, 2013. The decrease was primarily due to a $1.6 million goodwill impairment charge recorded in 2012 that was not repeated in 2013.
Year ended December 31, 2012 compared to year ended December 31, 2011: Amortization of acquired intangibles expense decreased $6.8 million, or 79.1%, from $8.6 million for the year ended December 31, 2011 to $1.8 million for the year ended December 31, 2012. The decrease was primarily attributable to a $7.7 million impairment charge in 2011 for an internal restructuring upon the discontinuation of certain Affiliates.
Depreciation and Amortization Expense
Year ended December 31, 2013 compared to year ended December 31, 2012: Depreciation and amortization expense decreased $0.9 million, or 15.5%, from $5.8 million for the year ended December 31, 2012 to $4.9 million for the year ended December 31, 2013. The decrease was primarily attributable to the effect of certain assets becoming fully depreciated.
Year ended December 31, 2012 compared to year ended December 31, 2011: Depreciation and amortization expense decreased $1.1 million, or 15.9%, from $6.9 million for the year ended December 31, 2011 to $5.8 million for the year ended December 31, 2012. The decrease was primarily attributable to the effect of certain assets becoming fully depreciated.
77
U.S. GAAP Other Non-Operating Items of Income and Expense
Other non-operating items of income and expense consist of:
- i.
- investment
income;
- ii.
- interest
income; and
- iii.
- interest expense.
Investment Income
Year ended December 31, 2013 compared to year ended December 31, 2012: Investment income decreased $5.8 million, or 35.2%, from $16.5 million for the year ended December 31, 2012 to $10.7 million for the year ended December 31, 2013, primarily due to lower earnings on equity-accounted Affiliates which decreased $7.6 million, or 49.7%, from $15.3 million for the year ended December 31, 2012 to $7.7 million for the year ended December 31, 2013 due in part to a restructuring of the split of performance fees, as well as lower performance fees at equity-accounted Affiliates. This decrease was partly offset by higher returns on real estate co-investments during 2013.
Year ended December 31, 2012 compared to year ended December 31, 2011: Investment income increased $2.7 million, or 19.6%, from $13.8 million for the year ended December 31, 2011 to $16.5 million for the year ended December 31, 2012. Approximately $4.6 million was attributable to higher earnings from equity-accounted Affiliates, which earned additional performance fees in 2012, partly offset by lower returns on real estate co-investments during 2012.
Interest Income
Year ended December 31, 2013 compared to year ended December 31, 2012: Interest income decreased $0.9 million, or 64.3%, from $1.4 million for the year ended December 31, 2012 to $0.5 million for the year ended December 31, 2013. The decrease was primarily due to a one-time interest receipt received in 2012 related to a tax refund.
Year ended December 31, 2012 compared to year ended December 31, 2011: Interest income increased $0.9 million, or 180%, from $0.5 million for the year ended December 31, 2011 to $1.4 million for the year ended December 31, 2012. The increase was primarily due to a one-time interest receipt in 2012 related to a tax refund.
Interest Expense
Year ended December 31, 2013 compared to year ended December 31, 2012: Intercompany interest expense, primarily related to long-term debt owed to our Parent, decreased $11.9 million, or 14.1%, from $84.1 million for the year ended December 31, 2012 to $72.2 million for the year ended December 31, 2013. The decrease was principally due to reductions in the principal balance of our revolving credit facility with our Parent combined with a reduction in the rate payable on the undrawn balance.
Year ended December 31, 2012 compared to year ended December 31, 2011: Intercompany interest expense increased $9.9 million, or 13.3%, from $74.2 million for the year ended December 31, 2011 to $84.1 million for the year ended December 31, 2012. The increase was primarily attributable to an increase in the rate of interest payable on our revolving credit facility with our Parent as a result of renegotiation of its terms during the fourth quarter of 2011.
78
U.S. GAAP Income Tax Expense (Benefit)
Year ended December 31, 2013 compared to year ended December 31, 2012: Income tax expense increased $10.0 million, or 303%, from $3.3 million for the year ended December 31, 2012 to $13.3 million for the year ended December 31, 2013. The increase was primarily due to the write-off of expired state deferred tax assets in 2013, the reduction of the liability for uncertain tax positions in 2012 and increases in our taxable income.
Year ended December 31, 2012 compared to year ended December 31, 2011: Income tax expense increased $7.5 million from a $4.2 million benefit for the year ended December 31, 2011 to a $3.3 million expense for the year ended December 31, 2012. The increase was primarily due to the write-down of the valuation allowance resulting from changes in state law in 2011, the reduction of the liability for uncertain tax positions in 2012, state tax refunds and increases in our taxable income.
For analysis of the Company's normalized effective tax rate, please refer to "—Non-GAAP ENI Results of Operations—Tax on Economic Net Income."
U.S. GAAP Consolidated Funds
Revenue from consolidated Funds relates primarily to sales of timber in consolidated Funds, while expenses from consolidated Funds represent the cost of those sales and third-party financing costs associated with the timber assets acquired by those Funds. Timber assets are carried at cost and prior to the liquidation of the timber Fund assets, the costs of growing the timber will often outweigh the periodic revenues, resulting in a net operating loss under U.S. GAAP. The entire net income or loss of all consolidated Funds, excluding any income or loss attributable to co-investments we make in the Funds, is included in non-controlling interest in our Consolidated Financial Statements and is not included in the net income (loss) attributable to controlling interests or in management fees.
Year ended December 31, 2013 compared to year ended December 31, 2012: Consolidated Funds' revenue increased $140.9 million, or 48.7%, from $289.6 million for the year ended December 31, 2012 to $430.5 million for the year ended December 31, 2013. Consolidated Funds' expenses increased $179.5 million, or 42.4%, from $422.6 million for the year ended December 31, 2012 to $602.1 million for the year ended December 31, 2013. These increases in both revenues and expenses were mainly due to the consolidation of a new timber Fund. Timber assets are carried at cost and prior to the liquidation of the timber Fund assets, the cost of growing the timber will often outweigh the periodic revenues, resulting in a net operating loss under U.S. GAAP. Consolidated Funds' investment gain decreased $5.3 million, or 6.5%, from $82.0 million for the year ended December 31, 2012 to $76.7 million for the year ended December 31, 2013. The net loss on consolidated Funds increased $43.9 million, or 86.1%, from $51.0 million for the year ended December 31, 2012, to $94.9 million for the year ended December 31, 2013, primarily due to the financial results of a newly consolidated timber Fund. Of these losses, $116.5 million in 2013 and $74.0 million in 2012 were attributable to non-controlling interests in consolidated Funds. Amounts attributable to controlling interests were gains of $21.6 million in 2013 and $23.0 million in 2012, primarily representing management fees earned by our Affiliates.
Year ended December 31, 2012 compared to year ended December 31, 2011: Consolidated Funds' revenue decreased $31.8 million, or 9.9%, from $321.4 million for the year ended December 31, 2011 to $289.6 million for the year ended December 31, 2012. Consolidated Funds' expenses decreased $36.4 million, or 7.9%, from $459.0 million for the year ended December 31, 2011 to $422.6 million for the year ended December 31, 2012. These decreases in both revenues and expenses were mainly due to the liquidation of a previously consolidated timber Fund. Timber assets are carried at cost and prior to the liquidation of the timber Fund assets, the cost of growing the timber will often outweigh the periodic revenues, resulting in a net operating loss under U.S. GAAP. Consolidated Funds' investment
79
gain increased $16.1 million, or 24.4%, from $65.9 million for the year ended December 31, 2011 to $82.0 million for the year ended December 31, 2012. The net loss of consolidated Funds decreased $20.7 million, or 28.9%, to $51.0 million for the year ended December 31, 2012, from $71.7 million for the year ended December 31, 2011, primarily as a result of the exclusion of a previously consolidated timber Fund. Of these losses, $74.0 million for the year ended December 31, 2012 and $94.9 million for the year ended December 31, 2011 were attributable to non-controlling interests in consolidated Funds. Amounts attributable to controlling interests were gains of $23.0 million for the year ended December 31, 2012 and $23.2 million for the year ended December 31, 2011, primarily representing management fees earned by our Affiliates.
Discontinued Operations
In 2011 and 2012, following a strategic review by our Board of Directors, we restructured the composition of our executive management team, including the appointment of our Chief Executive Officer, a new Chief Financial Officer, a new Head of Global Distribution and a new Head of Affiliate Management. Our management team implemented a repositioning of our business to focus on actively managed, alpha-generating institutional investment products. Pursuant to this assessment, during 2011 and 2012 we divested our interests in several former Affiliate firms, including the sale of stable-value manager, Dwight Asset Management, to Goldman Sachs Asset Management, and the exit from our former retail business, Old Mutual Capital, through the sale of selected mutual fund assets to Touchstone Investments. Each of Analytic Investors, Ashfield Capital Partners, Larch Lane Advisors, Lincluden Management Ltd, 300 North Capital and 2100 Xenon were sold to the management of the respective Affiliate. In the fourth quarter of 2013, we began to wind down the operations of Echo Point Investment Management, which was substantially completed in the first quarter of 2014. All of these businesses are included in our discontinued operations.
In the second quarter of 2014, we transferred a former Affiliate, Rogge Global Partners plc, or Rogge, to our Parent, and have accordingly presented its results within discontinued operations.
Year ended December 31, 2013 compared to year ended December 31, 2012: The result from discontinued operations increased $29.7 million, from a loss of $(27.0) million for the year ended December 31, 2012 to a gain of $2.7 million for the year ended December 31, 2013, in each case net of tax. The net amount attributable to controlling interests increased $40.4 million, from a loss of $(31.9) million to a gain of $8.5 million for the year ended December 31, 2013, with the balance attributable to non-controlling interests in consolidated Funds of discontinued operations. Gain/(loss) on disposal decreased $12.9 million, from a gain on disposal of $10.8 million for the year ended December 31, 2012 to a loss on disposal of ($2.1) million for the year ended December 31, 2013, in each case net of tax, representing the excess of disposal proceeds received over the carrying amount of net assets disposed of, and incremental costs of disposal in each period.
Year ended December 31, 2012 to year ended December 31, 2011: The result from discontinued operations increased $18.4 million, or 40.5%, from a loss of $(45.4) million for the year ended December 31, 2011 to a loss of $(27.0) million for the year ended December 31, 2012, in each case net of tax. The net amount attributable to controlling interests increased $6.9 million, or 17.8%, from a loss of $(38.8) million for the year ended December 31, 2011 to a loss of $(31.9) million for the year ended December 31, 2012, with the balance attributable to non-controlling interests in consolidated Funds of discontinued operations. Gain on disposal decreased $12.1 million, or 52.8%, from $22.9 million for the year ended December 31, 2011 to $10.8 million for the year ended December 31, 2012, in each case net of tax, representing the excess of disposal proceeds received over the carrying amount of net assets disposed of.
80
Effects of Inflation
For the years ended December 31, 2013, 2012 and 2011, inflation did not have a material effect on our consolidated results of operations.
U.S. GAAP Results of Operations
For the Six Months Ended June 30, 2014 and 2013
Our U.S. GAAP results of operations were as follows for the six months ended June 30, 2014 and 2013:
| |
(unaudited) Six Months Ended June 30, |
|
||||||||
|---|---|---|---|---|---|---|---|---|---|---|
| |
Increase (Decrease) |
|||||||||
($ in millions) Results of Operations |
2014 | 2013 | ||||||||
Management fees |
$ | 275.4 | $ | 233.1 | $ | 42.3 | ||||
Performance fees |
2.4 | 8.3 | (5.9 | ) | ||||||
Other revenue |
0.3 | 1.1 | (0.8 | ) | ||||||
Consolidated Funds revenue |
251.6 | 227.8 | 23.8 | |||||||
| | | | | | | | | | | |
Total revenue |
529.7 | 470.3 | 59.4 | |||||||
| | | | | | | | | | | |
Compensation and benefits |
181.3 | 165.9 | 15.4 | |||||||
General and administrative |
37.1 | 32.0 | 5.1 | |||||||
Amortization and impairment of acquired intangibles |
0.1 | 0.1 | — | |||||||
Depreciation and amortization |
2.9 | 2.4 | 0.5 | |||||||
Consolidated Funds expense |
348.3 | 335.2 | 13.1 | |||||||
| | | | | | | | | | | |
Total expenses |
569.7 | 535.6 | 34.1 | |||||||
| | | | | | | | | | | |
Operating income |
(40.0 | ) | (65.3 | ) | 25.3 | |||||
| | | | | | | | | | | |
Investment income |
5.9 | 3.6 | 2.3 | |||||||
Interest income |
0.1 | 0.2 | (0.1 | ) | ||||||
Interest expense |
(33.2 | ) | (37.8 | ) | 4.6 | |||||
Consolidated Funds' investment gain |
31.5 | 31.3 | 0.2 | |||||||
| | | | | | | | | | | |
Loss from continuing operations before taxes |
(35.7 | ) | (68.0 | ) | 32.3 | |||||
| | | | | | | | | | | |
Income tax expense |
16.2 | 6.0 | 10.2 | |||||||
| | | | | | | | | | | |
Loss from continuing operations |
(51.9 | ) | (74.0 | ) | 22.1 | |||||
| | | | | | | | | | | |
Loss from discontinued operations, net of tax |
(2.0 | ) | (6.5 | ) | 4.5 | |||||
Gain (loss) on disposal of discontinued operations, net of tax |
2.4 | (1.0 | ) | 3.4 | ||||||
| | | | | | | | | | | |
Net loss |
(51.5 | ) | (81.5 | ) | 30.0 | |||||
Net loss attributable to non-controlling interest |
(70.6 | ) | (93.0 | ) | 22.4 | |||||
| | | | | | | | | | | |
Net income attributable to controlling interests |
$ | 19.1 | $ | 11.5 | $ | 7.6 | ||||
| | | | | | | | | | | |
| | | | | | | | | | | |
Pre-tax U.S. GAAP controlling interests operating margin* |
14 | % | 5 | % | 9 | % | ||||
- *
- The pre-tax U.S. GAAP controlling interest margin is calculated using pre-tax income from continuing operations attributable to controlling interests and GAAP revenue from continuing operations attributable to controlling interests.
U.S. GAAP Revenues
Management Fees
Management fees increased $42.3 million, or 18.1%, from $233.1 million for the six months ended June 30, 2013 to $275.4 million for the six months ended June 30, 2014. The increase was primarily attributable to increases in average assets under management, which were $203.8 billion in the second quarter of 2014 and $169.0 billion in the second quarter of 2013. The weighted average fee rate earned on our average assets under management was 34 basis points for the six months ended June 30, 2014 and 34 basis points for the six months ended June 30, 2013. Of the increase in average assets from the first six months of 2013 to the first six months of 2014, $27.4 billion was due to net appreciation of assets under management, while $7.5 billion was due to fluctuations in client flows.
81
Performance Fees
Performance fees decreased $5.9 million, or 71.1%, from $8.3 million for the six months ended June 30, 2013 to $2.4 million for the six months ended June 30, 2014. Performance fees can be variable and are contractually triggered based on investment performance results over agreed upon time periods. In the six months ended June 30, 2013, we earned $6.4 million in performance fees related to an emerging markets product.
Other Revenue
Other revenue decreased $0.8 million, or 72.7%, from $1.1 million for the six months ended June 30, 2013 to $0.3 million for the six months ended June 30, 2014. The decrease was attributable to a one-time receipt in the prior year of wind-down fees for services relating to the closure of a Fund.
U.S. GAAP Expenses
Compensation and Benefits Expense
Compensation and benefits expense increased $15.4 million, or 9.3%, from $165.9 million for the six months ended June 30, 2013 to $181.3 million for the six months ended June 30, 2014, driven primarily by annual salary increases and higher variable compensation in line with the growth of earnings before variable compensation.
General and Administrative Expense
General and administrative expense increased $5.1 million, or 15.9%, from $32.0 million for the six months ended June 30, 2013 to $37.1 million for the six months ended June 30, 2014. The increase was primarily attributable to increased consulting expenses in connection with succession planning and restructuring activities.
Amortization and Impairment of Acquired Intangibles Expense
Amortization and impairment of acquired intangibles expense was unchanged period-over-period, amounting to $0.1 million for both the six months ended June 30, 2013 and 2014.
Depreciation and Amortization Expense
Depreciation and amortization expense increased $0.5 million, or 20.8%, from $2.4 million for the six months ended June 30, 2013 to $2.9 million for the six months ended June 30, 2014. The increase was primarily due to additional leasehold improvements capitalized during 2013 in relation to enhancements at certain Affiliates' premises.
U.S. GAAP Other Non-Operating Items of Income and Expense
Investment Income
Investment income increased $2.3 million, or 63.9%, from $3.6 million for the six months ended June 30, 2013 to $5.9 million for the six months ended June 30, 2014, reflecting improved performance at our equity-accounted Affiliates.
Interest Income
Interest income was $0.2 million for the six months ended June 30, 2013, broadly in line with $0.1 million earned for the six months ended June 30, 2014.
82
Interest Expense
Interest expense decreased $4.6 million, or 12.2%, from $37.8 million for the six months ended June 30, 2013 to $33.2 million for the six months ended June 30, 2014. The decrease was principally due to reductions in the principal balance of our revolving credit facility with our Parent combined with a reduction in the rate payable on the undrawn balance.
U.S. GAAP Income Tax Expense (Benefit)
Income tax expense was $6.0 million for the six months ended June 30, 2013 and $16.2 million for the six months ended June 30, 2014. The increase of $10.2 million, or 170%, reflected increases in income from continuing operations before tax attributable to controlling interests and a reduced level of interest expense.
Consolidated Funds
Consolidated Funds' revenue increased $23.8 million, or 10.4%, from $227.8 million for the six months ended June 30, 2013 to $251.6 million for the six months ended June 30, 2014. Consolidated Funds' expenses increased $13.1 million, or 3.9%, from $335.2 million for the six months ended June 30, 2013 to $348.3 million for the six months ended June 30, 2014. These increases in both revenues and expenses were mainly due to increased sales in consolidated timber Funds. Timber assets are carried at cost and prior to the liquidation of the timber Fund assets, the costs of growing the timber will often outweigh the periodic revenues, resulting in a net operating loss under U.S. GAAP. Consolidated Funds' investment gain increased $0.2 million, or 0.6%, from $31.3 million for the six months ended June 30, 2013 to $31.5 million for the six months ended June 30, 2014, predominately due to lower returns realized in the second quarter of 2013. The net loss from consolidated Funds decreased $10.9 million, or 14.3%, from $76.1 million for the six months ended June 30, 2013, to $65.2 million for the six months ended June 30, 2014, primarily due to the increase in timber sales. Of these losses, $22.3 million in the first six months of 2013 and $38.3 million in the first six months of 2014 were attributable to non-controlling interests in consolidated Funds. Amounts attributable to controlling interests were gains of $10.3 million for the six months ended June 30, 2013 and $10.2 million for the six months ended June 30, 2014, primarily representing management fees earned.
Discontinued Operations
Discontinued operations principally consist of the results of two of our former Affiliates, Echo Point Investment Management, which wound down in December 2013, and Rogge, which was transferred to a subsidiary of our Parent in June 2014. The net consolidated loss from discontinued operations decreased $4.5 million, or 69.2%, from a loss of $6.5 million for the six months ended June 30, 2013 to a loss of $2.0 million for the six months ended June 30, 2014, in each case net of tax. The net amount attributable to controlling interests decreased $8.6 million, from $4.3 million for the six months ended June 30, 2013 to $(4.3) million for the six months ended June 30, 2014, with the balance attributable to non-controlling interests in consolidated Funds of discontinued operations. Gains on disposal increased $3.4 million from $(1.0) million during the first six months of 2013 to $2.4 million during the first six months of 2014, representing adjustments to disposal proceeds on previously disposed Affiliates.
Effects of Inflation
For the six months ended June 30, 2014 and 2013, inflation did not have a material effect on our consolidated results of operations.
83
Non-GAAP Supplemental Performance Measure
Economic Net Income
As supplemental information, we provide a non-GAAP performance measure that we refer to as economic net income, or ENI, which represents our management's view of the underlying economic earnings generated by us. We use ENI to make resource allocation decisions, determine appropriate levels of investment or dividend payout, manage balance sheet leverage, determine Affiliate variable compensation and equity distributions, and incentivize management. These ENI adjustments include both reclassifications of U.S. GAAP revenue and expense items, as well as adjustments to U.S. GAAP results, primarily to exclude non-cash, non-economic expenses, or to reflect cash benefits not recognized under U.S. GAAP. Adjustments to U.S. GAAP results in the calculation of ENI include, the following:
We re-categorize certain line items on the income statement to reflect the following:
- •
- we exclude the effect of Fund consolidation by removing the portion of Fund revenues, expenses and investment return which
is not attributable to our shareholders;
- •
- we include within management fee revenue any fees paid to Affiliates by consolidated Funds, which are viewed as investment
income under U.S. GAAP;
- •
- we include interest income within total revenues;
- •
- we include our share of earnings from equity-accounted Affiliates within other income, rather than investment income;
- •
- we treat sales-based compensation as an operating expense, rather than part of compensation and benefits;
- •
- we identify separately, the fixed and variable components of compensation and benefits expense; and
- •
- we identify separately as Affiliate distributions the component of U.S. GAAP compensation that represents earnings shared with Affiliate key employee equity and profit-interest holders.
To reflect the Reorganization, we have excluded:
- i.
- notional
corporate cost allocations which are non-cash expenses that will not recur following this offering;
- ii.
- interest
expense historically paid to our Parent, as the related debt was restructured in connection with this transaction and the intercompany interest
will be eliminated from our consolidated results going forward;
- iii.
- historic
mark-to-market co-investment gains and losses, because these investments and ongoing returns thereon have been allocated wholly to OMGUK in
connection with this offering; and
- iv.
- costs related to our initial preparations for an initial public offering which were expensed in prior periods.
We also make the following adjustments to U.S. GAAP results to more closely reflect our economic results:
- v.
- we exclude non-cash expenses representing changes in the value of Affiliate equity and profit interests held by Affiliate key employees. These ownerships interests may in certain circumstances be repurchased by OMUSH at a value based on a pre-determined fixed multiple of trailing earnings and as such this value is carried on our balance sheet as a
84
- vi.
- we
exclude non-cash amortization or impairment expenses related to acquired goodwill and other intangibles as these are non-cash charges that do not result
in an outflow of tangible economic benefits from the business.
- vii.
- we exclude the results of discontinued operations attributable to controlling interests since they are not part of our ongoing business, and restructuring costs incurred in continuing operations which represent an exit from a distinct product or line of business.
liability. Non-cash movements in the value of this liability are treated as compensation expense under U.S. GAAP. However, any equity or profit interests repurchased by OMUSH can be used to fund a portion of future variable compensation awards, resulting in savings in cash variable compensation that offset the negative cash effect of repurchasing the equity. Our Affiliate equity and profit-interest plans have been designed to ensure OMUSH is never required to repurchase more equity than we can reasonably recycle through variable compensation awards in any given twelve month period. OMUSH may also choose to retain repurchased Affiliate equity or profit interests, entitling us to an additional share of future Affiliate earnings that represents an unrecognized economic asset to us.
We also restate our income tax expense to reflect any tax impact of our ENI adjustments. In addition, we exclude deferred tax resulting from changes in tax law and expiration of statutes, adjustments for uncertain tax positions, deferred tax attributable to intangible assets and other unusual items.
Additional categories of economic net income adjustments that we may make in the future include, but are not limited to:
- •
- the exclusion of capital transaction costs, including the costs of raising debt or equity, gains or losses realized as a
result of redeeming debt or equity and direct incremental costs associated with acquisitions of businesses or assets.
- •
- the exclusion of seed capital and co-investment gains, losses and related financing costs. The net returns on these
investments are considered and presented separately from ENI because ENI is primarily a measure of our earnings from managing client assets, which therefore differs from earnings generated by our
investments in Affiliate products, which can be variable from period to period.
- •
- the exclusion of non-contractual, non-cash interest expense recognized under U.S. GAAP in connection with the
unwinding of discount rates implicit in long-term financial liabilities.
- •
- the inclusion of cash tax benefits associated with deductions allowed for acquired intangibles and goodwill that are not recognized within earnings under U.S. GAAP.
85
Reconciliation of economic net income to U.S. GAAP Net Income for the Years Ended December 31, 2013, 2012 and 2011
The following table reconciles net income attributable to controlling interests to economic net income for the years ended December 31, 2013, 2012 and 2011:
| |
|
Years Ended December 31, | ||||||||||
|---|---|---|---|---|---|---|---|---|---|---|---|---|
($ in millions)
|
2013 | 2012 | 2011 | |||||||||
U.S. GAAP net income attributable to controlling interests |
$ | 25.7 | $ | 3.0 | $ | 10.3 | ||||||
Adjustments related to restructuring and reorganization actions undertaken in connection with this offering: |
||||||||||||
i |
Non-cash notional parent corporate cost allocation |
3.3 | 2.8 | 3.2 | ||||||||
ii |
Intercompany interest expense |
72.2 | 84.0 | 74.1 | ||||||||
iii |
Co-investment (gain) |
(3.0 | ) | (1.2 | ) | (3.1 | ) | |||||
iv |
Initial public offering costs |
— | 0.4 | 8.0 | ||||||||
Adjustments to reflect the economic earnings of our Company: |
||||||||||||
v |
Non-cash key employee-owned equity and profit-interest revaluations |
47.7 | 16.2 | 11.5 | ||||||||
vi |
Amortization and impairment of goodwill and acquired intangible assets |
0.1 | 1.8 | 8.6 | ||||||||
vii |
Discontinued operations attributable to controlling interests and restructuring |
(6.3 | ) | 21.0 | 15.9 | |||||||
Tax effect of above adjustments |
(16.8 | ) | (15.7 | ) | (26.6 | ) | ||||||
| | | | | | | | | | | | | |
Economic net income after taxes |
$ | 122.9 | $ | 112.3 | $ | 101.9 | ||||||
| | | | | | | | | | | | | |
| | | | | | | | | | | | | |
Reconciliation of economic net income to U.S. GAAP Net Income for the Six Months Ended June 30, 2014 and 2013
The following table reconciles net income attributable to controlling interests to economic net income for the six months ended June 30, 2014 and 2013:
| |
|
For the Six Months ended June 30, |
|||||||
|---|---|---|---|---|---|---|---|---|---|
($ in millions)
|
2014 | 2013 | |||||||
U.S. GAAP net income attributable to controlling interests |
$ | 19.1 | $ | 11.5 | |||||
Adjustments related to restructuring and reorganization actions undertaken in connection with this offering: |
|||||||||
i |
Non-cash notional parent corporate cost allocation | 1.6 | 1.2 | ||||||
ii |
Intercompany interest expense | 33.2 | 37.8 | ||||||
iii |
Co-investment (gain) loss | (2.1 | ) | 1.0 | |||||
iv |
Initial public offering costs | — | — | ||||||
Adjustments to reflect the economic earnings of our Company: |
|||||||||
v |
Non-cash key employee-owned equity and profit-interest revaluations | 16.9 | 20.5 | ||||||
vi |
Amortization and impairment of goodwill and acquired intangible assets | 0.1 | 0.1 | ||||||
vii |
Discontinued operations attributable to controlling interests and restructuring | 6.2 | (4.3 | ) | |||||
Tax effect of above adjustments |
(8.4 | ) | (9.5 | ) | |||||
| | | | | | | | | | |
Economic net income after taxes |
$ | 66.6 | $ | 58.3 | |||||
| | | | | | | | | | |
| | | | | | | | | | |
Limitations of Economic Net Income
Economic net income is the key measure our management uses to evaluate the financial performance of, and make operational decisions for, our business. Economic net income is not audited, and is not a substitute for net income or other performance measures that are derived in accordance
86
with U.S. GAAP. Furthermore, our calculation of economic net income may differ from similarly titled measures provided by other companies.
Because the calculation of economic net income excludes certain ongoing expenses, including amortization expense and certain compensation costs, it has certain material limitations and should not be viewed in isolation or as a substitute for U.S. GAAP measures of earnings.
Non-GAAP ENI Results of Operations
For the years ended December 31, 2013, 2012 and 2011
| |
|
|
|
Increase (Decrease) | ||||||||||||
|---|---|---|---|---|---|---|---|---|---|---|---|---|---|---|---|---|
| |
Years Ended December 31, | |||||||||||||||
| |
2013 vs. 2012 | 2012 vs. 2011 | ||||||||||||||
($ in millions) Economic Net Income |
2013 | 2012 | 2011 | |||||||||||||
Management fees |
$ | 499.8 | $ | 420.9 | $ | 420.1 | $ | 78.9 | $ | 0.8 | ||||||
Performance fees |
18.1 | 14.1 | 2.9 | 4.0 | 11.2 | |||||||||||
Other income, including equity-accounted subsidiaries |
9.6 | 15.8 | 12.2 | (6.2 | ) | 3.6 | ||||||||||
Interest income |
0.5 | 1.4 | 0.5 | (0.9 | ) | 0.9 | ||||||||||
| | | | | | | | | | | | | | | | | |
Total ENI Revenue |
528.0 | 452.2 | 435.7 | 75.8 | 16.5 | |||||||||||
| | | | | | | | | | | | | | | | | |
Fixed compensation and benefits |
111.4 | 104.0 | 100.2 | 7.4 | 3.8 | |||||||||||
General and administrative expenses |
76.5 | 71.1 | 72.4 | 5.4 | (1.3 | ) | ||||||||||
Depreciation and amortization |
4.9 | 5.7 | 6.9 | (0.8 | ) | (1.2 | ) | |||||||||
| | | | | | | | | | | | | | | | | |
Total ENI Operating Expenses |
192.8 | 180.8 | 179.5 | 12.0 | 1.3 | |||||||||||
| | | | | | | | | | | | | | | | | |
Earnings before variable compensation |
335.2 | 271.4 | 256.2 | 63.8 | 15.2 | |||||||||||
Variable compensation |
153.8 | 121.0 | 118.4 | 32.8 | 2.6 | |||||||||||
| | | | | | | | | | | | | | | | | |
Earnings after variable compensation |
181.4 | 150.4 | 137.8 | 31.0 | 12.6 | |||||||||||
Affiliate key employee distributions |
28.4 | 19.1 | 13.5 | 9.3 | 5.6 | |||||||||||
| | | | | | | | | | | | | | | | | |
Pre-Tax Economic Net Income |
153.0 | 131.3 | 124.3 | 21.7 | 7.0 | |||||||||||
Tax on Economic Net Income |
30.1 | 19.0 | 22.4 | 11.1 | (3.4 | ) | ||||||||||
| | | | | | | | | | | | | | | | | |
Economic Net Income |
$ | 122.9 | $ | 112.3 | $ | 101.9 | $ | 10.6 | $ | 10.4 | ||||||
| | | | | | | | | | | | | | | | | |
| | | | | | | | | | | | | | | | | |
Pre-tax ENI operating margin before Affiliate key employee distributions* |
34 | % | 33 | % | 32 | % | ||||||||||
Pre-tax ENI operating margin after Affiliate key employee distributions* |
29 | % | 29 | % | 29 | % | ||||||||||
- *
- Pre-tax ENI operating margin is calculated based on pre-tax economic net income divided by ENI revenue.
ENI Revenues
The following table reconciles U.S. GAAP Revenue to ENI Revenue for the years ended December 31, 2013, 2012 and 2011:
| |
Years Ended December 31, | |||||||||
|---|---|---|---|---|---|---|---|---|---|---|
| ($ in millions) |
2013 | 2012 | 2011 | |||||||
U.S. GAAP Revenue |
$ | 928.6 | $ | 703.5 | $ | 724.2 | ||||
Include interest income |
0.5 | 1.4 | 0.5 | |||||||
Include investment return on equity-accounted affiliates |
7.7 | 15.3 | 10.6 | |||||||
Exclude revenue from consolidated Funds attributable to non-controlling interest |
(408.8 | ) | (268.0 | ) | (299.6 | ) | ||||
| | | | | | | | | | | |
ENI Revenues |
$ | 528.0 | $ | 452.2 | $ | 435.7 | ||||
| | | | | | | | | | | |
| | | | | | | | | | | |
87
Our ENI Revenues principally consist of:
- i.
- management
fees earned based on the level of assets under management (including management fees earned on Funds which are consolidated under
U.S. GAAP);
- ii.
- performance
fees earned when our Affiliates' investment performance over agreed time periods for certain clients has met or exceeded pre-determined hurdles;
- iii.
- other
income, predominantly composed of earnings of our equity-accounted Affiliates; and
- iv.
- interest income.
Management Fees
Our management fees are a function of the fee rates our Affiliates charge to their clients, which are typically expressed in basis points, and the levels of our assets under management.
Including assets managed by our equity-accounted Affiliates, average basis points earned on average assets under management were 34 for the year ended December 31, 2013, 34 for the year ended December 31, 2012 and 35 for the year ended December 31, 2011. The greatest driver of increases or decreases in this average fee rate is changes in the mix of our assets under management caused by net inflows or outflows in certain asset classes or disproportionate market movements.
Our average basis points by asset class (including both consolidated Affiliates that are included, and equity-accounted Affiliates that are not included in management fee revenue) over each of the periods indicated were:
| |
|
|
Years Ended December 31, | ||||||||||||||||||||||
|---|---|---|---|---|---|---|---|---|---|---|---|---|---|---|---|---|---|---|---|---|---|---|---|---|---|
| |
Six Months Ended June 30, 2014 |
||||||||||||||||||||||||
| |
2013 | 2012 | 2011 | ||||||||||||||||||||||
| (Revenue $ in millions) |
Revenue | Basis Pts |
Revenue | Basis Pts |
Revenue | Basis Pts |
Revenue | Basis Pts |
|||||||||||||||||
U.S. equity |
$ | 97.4 | 24 | $ | 174.1 | 24 | $ | 162.8 | 27 | $ | 166.7 | 28 | |||||||||||||
Global / non-U.S. equity |
161.3 | 42 | 275.5 | 42 | 213.2 | 43 | 214.6 | 43 | |||||||||||||||||
Fixed income |
15.4 | 22 | 29.8 | 23 | 27.0 | 22 | 21.4 | 23 | |||||||||||||||||
Alternative, real estate & timber |
65.2 | 42 | 117.9 | 41 | 104.6 | 40 | 95.9 | 40 | |||||||||||||||||
| | | | | | | | | | | | | | | | | | | | | | | | | | |
Weighted average fee rate on average AUM |
$ | 339.3 | 34 | $ | 597.3 | 34 | $ | 507.6 | 34 | $ | 498.6 | 35 | |||||||||||||
Less: Revenue from equity-accounted Affiliates |
(53.7 | ) | (97.5 | ) | (86.7 | ) | (78.5 | ) | |||||||||||||||||
| | | | | | | | | | | | | | | | | | | | | | | | | | |
ENI management fee revenue |
$ | 285.6 | $ | 499.8 | $ | 420.9 | $ | 420.1 | |||||||||||||||||
| | | | | | | | | | | | | | | | | | | | | | | | | | |
| | | | | | | | | | | | | | | | | | | | | | | | | | |
Year ended December 31, 2013 compared to year ended December 31, 2012: Management fees increased $78.9 million, or 18.7%, from $420.9 million for the year ended December 31, 2012 to $499.8 million for the year ended December 31, 2013. The increase was attributable to increases in average assets under management, from $148.2 billion in 2012 to $177.5 billion in 2013. Of the increase in average assets from 2012 to 2013, $23.6 billion was due to net appreciation of assets under management, while $5.7 billion was due to fluctuations in client flows.
Year ended December 31, 2012 compared to year ended December 31, 2011: Management fees increased $0.8 million, or 0.2%, from $420.1 million for the year ended December 31, 2011 to $420.9 million for the year ended December 31, 2012. The increase was primarily attributable to a 4.9% increase in average assets under management, from $143.0 billion in 2011 to $148.2 billion in 2012, offset by a 0.6 bps decrease in average basis points earned, which had the effect of decreasing management fees. Of the increase in average assets from 2011 to 2012, $6.6 billion was due to net appreciation of assets under management, while $(1.4) billion was due to fluctuations in client flows.
88
Performance Fees
Gross performance fees earned (excluding performance fees at equity-accounted Affiliates) were 3.4% of ENI revenue in 2013, 3.1% of ENI revenue in 2012 and 0.7% of ENI revenue in 2011. Performance fees are typically shared with our Affiliate key employees through various contractual compensation and profit-sharing arrangements, as illustrated in the following table:
| |
Years Ended December 31, |
|||||||||
|---|---|---|---|---|---|---|---|---|---|---|
| ($ in millions) |
2013 | 2012 | 2011 | |||||||
Gross performance fees included in ENI Revenue |
$ | 18.1 | $ | 14.1 | $ | 2.9 | ||||
Allocated to Affiliate key employees (through variable compensation and distributions) |
(9.2 | ) | (7.4 | ) | (1.7 | ) | ||||
| | | | | | | | | | | |
Net performance fees included in ENI after key employee distributions |
$ | 8.9 | $ | 6.7 | $ | 1.2 | ||||
| | | | | | | | | | | |
| | | | | | | | | | | |
Percentage of performance fees accruing to OMAM |
49.2 | % | 47.5 | % | 41.4 | % | ||||
Year ended December 31, 2013 compared to year ended December 31, 2012: Performance fees increased $4.0 million, or 28.4%, from $14.1 million for the year ended December 31, 2012 to $18.1 million for the year ended December 31, 2013. The increase was due to improved performance in equity and alternative products.
Year ended December 31, 2012 compared to year ended December 31, 2011: Performance fees increased $11.2 million, or 386%, from $2.9 million for the year ended December 31, 2011 to $14.1 million for the year ended December 31, 2012. The increase was primarily attributable to strong emerging market equity products investment performance relative to the wider markets.
Other Income
Year ended December 31, 2013 compared to year ended December 31, 2012: Other income decreased $6.2 million, or 39.2%, from $15.8 million for the year ended December 31, 2012 to $9.6 million for the year ended December 31, 2013 due in part to a restructuring of the split of performance fees at an equity-accounted Affiliate, as well as lower performance fees at equity-accounted Affiliates.
Year ended December 31, 2012 compared to year ended December 31, 2011: Other income increased $3.6 million, or 29.5%, from $12.2 million for the year ended December 31, 2011 to $15.8 million for the year ended December 31, 2012. The increase was attributable to higher operating results at equity-accounted Affiliates, which earned additional performance fees in 2012.
ENI Operating Expenses
Our ENI operating expenses principally consist of:
- i.
- fixed
compensation and benefits paid to our employees;
- ii.
- general
and administrative expenses, including sales-based compensation; and
- iii.
- depreciation and amortization.
Fixed Compensation and Benefits Expense
Our most significant category of operating expense is fixed compensation and benefits awarded to our and our Affiliates' employees. Fixed compensation and benefits include base salaries, payroll taxes and the cost of benefit programs provided. The following table reconciles U.S. GAAP compensation
89
expense for the years ended December 31, 2013, 2012 and 2011 to ENI fixed compensation and benefits expense:
| |
Years Ended December 31, | |||||||||
|---|---|---|---|---|---|---|---|---|---|---|
| ($ in millions) |
2013 | 2012 | 2011 | |||||||
Total U.S. GAAP compensation expense |
$ | 352.3 | $ | 267.2 | $ | 251.8 | ||||
Affiliate key employee equity revaluations excluded from ENI |
(47.7 | ) | (16.2 | ) | (11.5 | ) | ||||
Sales-based compensation reclassified to ENI general and administrative expenses |
(11.0 | ) | (6.9 | ) | (8.2 | ) | ||||
Affiliate key employee distributions |
(28.4 | ) | (19.1 | ) | (13.5 | ) | ||||
Variable compensation |
(153.8 | ) | (121.0 | ) | (118.4 | ) | ||||
| | | | | | | | | | | |
ENI fixed compensation and benefits |
$ | 111.4 | $ | 104.0 | $ | 100.2 | ||||
| | | | | | | | | | | |
| | | | | | | | | | | |
Year ended December 31, 2013 compared to year ended December 31, 2012: Fixed compensation and benefits expense increased $7.4 million, or 7.1%, from $104.0 million for the year ended December 31, 2012 to $111.4 million for the year ended December 31, 2013. This increase reflects increases in head count at certain Affiliates, normal increases in base salaries, wages and benefits, as well as higher average costs of medical benefit programs provided to our and our Affiliates' employees.
Year ended December 31, 2012 compared to year ended December 31, 2011: Fixed compensation and benefits expense increased $3.8 million, or 3.8%, from $100.2 million for the year ended December 31, 2011 to $104.0 million for the year ended December 31, 2012. This increase reflects increases in head count at certain Affiliates, as well as annual increases in base salaries and wages.
General and Administrative Expense
After compensation and benefits, the next most significant category of costs is our general and administrative expenses, which include significant fixed costs such as rent and facilities charges, travel and entertainment expenses, data and systems expenses, insurance, consultancy costs and legal and accounting fees. Sales-based compensation is also included in general and administrative expenses.
Year ended December 31, 2013 compared to year ended December 31, 2012: General and administrative expense increased $5.4 million, or 7.6%, from $71.1 million for the year ended December 31, 2012 to $76.5 million for the year ended December 31, 2013, driven by higher sales-based compensation due to increases in the sales of incremental assets under management for which commissions are calculated, as well as increased legal and consulting expenses in connection with succession planning activities.
Year ended December 31, 2012 compared to year ended December 31, 2011: General and administrative expense decreased $1.3 million, or 1.8%, from $72.4 million for the year ended December 31, 2011 to $71.1 million for the year ended December 31, 2012, due primarily to expense-reduction initiatives undertaken at the holding company level during 2012.
Depreciation and Amortization Expense
Year ended December 31, 2013 compared to year ended December 31, 2012: Depreciation and amortization expense decreased $0.8 million, or 14.0%, from $5.7 million for the year ended December 31, 2012 to $4.9 million for the year ended December 31, 2013. The decrease was primarily attributable to the effect of certain assets becoming fully depreciated.
90
Year ended December 31, 2012 compared to year ended December 31, 2011: Depreciation and amortization expense decreased $1.2 million, or 17.4%, from $6.9 million for the year ended December 31, 2011 to $5.7 million for the year ended December 31, 2012. The decrease was primarily attributable to the effect of certain assets becoming fully depreciated.
ENI Variable Compensation and Affiliate Key Employee Distributions
Variable Compensation
Variable compensation is usually awarded based on a contractual percentage of each Affiliate's ENI profits before variable compensation and may be paid in the form of cash or non-cash Affiliate equity or profit interests. Non-cash variable compensation awards typically vest over several years and are recognized as an amortization expense as services are rendered over that period.
| |
Years Ended December 31, | |||||||||
|---|---|---|---|---|---|---|---|---|---|---|
| ($ in millions) |
2013 | 2012 | 2011 | |||||||
Total value of variable compensation awarded (A) |
$ | 161.0 | $ | 124.4 | $ | 120.7 | ||||
Value of equity-based and profit interests awards granted in lieu of cash |
(22.7 | ) | (14.5 | ) | (11.6 | ) | ||||
| | | | | | | | | | | |
Cash variable compensation |
138.3 | 109.9 | 109.1 | |||||||
Non-cash equity-based award amortization |
15.5 | 11.1 | 9.3 | |||||||
| | | | | | | | | | | |
Variable compensation |
$ | 153.8 | $ | 121.0 | $ | 118.4 | ||||
| | | | | | | | | | | |
| | | | | | | | | | | |
Earnings before variable compensation (B) |
$ | 335.2 | $ | 271.4 | $ | 256.2 | ||||
Variable compensation awarded as a percentage of earnings before variable compensation (A/B) |
48.0 | % | 45.8 | % | 47.1 | % | ||||
Year ended December 31, 2013 compared to year ended December 31, 2012: Variable compensation increased $32.8 million, or 27.1%, from $121.0 million for the year ended December 31 2012 to $153.8 million for the year ended December 31, 2013, driven by higher pre-variable compensation earnings. Our ratio of variable compensation awarded to earnings before variable compensation was 48.0% for the year ended December 31, 2013 and 45.8% for the year ended December 31, 2012, with the increase driven by timing of equity and profits-interest awards.
Year ended December 31, 2012 compared to year ended December 31, 2011: Variable compensation increased $2.6 million, or 2.2%, from $118.4 million for the year ended December 31, 2011 to $121.0 million for the year ended December 31, 2012, driven by higher pre-variable compensation earnings. Our ratio of variable compensation awarded to earnings before variable compensation was 45.8% for the year ended December 31, 2012 and 47.1% for the year ended December 31, 2011.
Affiliate Key Employee Distributions
Affiliate key employee distributions represent the share of Affiliate profits after variable compensation that is attributable to Affiliate key employee equity and profit interests holders, according to their ownership interests. At certain Affiliates, OMUSH is entitled to an initial preference over profits after variable compensation, structured such that before a preference threshold is reached, there would be no required key employee distributions, whereas for profits above the threshold the key employee distribution amount would be calculated based on the key employee ownership percentages, which range from approximately 15% to 35% at our consolidated Affiliates. OMUSH's preference amounted to a total of $114.9 million for the year ended December 31, 2013, $101.1 million for the year ended December 31, 2012 and $100.0 million for the year ended December 31, 2011. The total preference amount increases annually in relation to growth in the relevant Affiliates' profits after variable compensation, and will be capped once it reaches $145.0 million.
91
Year ended December 31, 2013 compared to year ended December 31, 2012: Affiliate key employee distributions increased $9.3 million, or 48.7%, from $19.1 million for the year ended December 31, 2012 to $28.4 million for the year ended December 31, 2013. Increases were due to higher Affiliate profits after variable compensation and higher effective Affiliate key employee ownership following additional purchases of Affiliate equity and profit interests. The increase also reflects the preference structure of certain distribution plans described above, which provide for a distribution preference to us before Affiliate key employees participate in the profits of their firms. Our ratio of key employee distributions to earnings after variable compensation was 15.6% for the year ended December 31, 2013 and 12.7% for the year ended December 31, 2012. Approximately 2% of the year-over-year increase was due to the acquisition of additional equity and profit interests by Affiliate key employees. In aggregate, key employee ownership levels are expected to remain constant after 2014 once the ownership percentages of key employees in their respective Affiliates reach the maximum amount under our agreements with the respective Affiliates.
Year ended December 31, 2012 compared to year ended December 31, 2011: Affiliate key employee distributions increased $5.6 million, or 41.5%, from $13.5 million for the year ended December 31, 2011 to $19.1 million for the year ended December 31, 2012. Increases were due to both higher Affiliate profits after variable compensation, in addition to higher effective Affiliate key employee ownership through additional purchases of Affiliate equity and profit interests by Affiliate employees. The increase also reflects the preference structure of certain distribution plans, described above, which provide for a distribution preference to us before Affiliate key employees participate in the profits of their firms. Our ratio of key employee distributions to earnings after variable compensation was 12.7% for the year ended December 31, 2012 and 9.8% for the year ended December 31, 2011. Approximately 2% of this increase was due to the acquisition of additional equity and profit interests by Affiliate key employees.
Tax on Economic Net Income
The following table reconciles the United States statutory tax to tax on economic net income:
| |
Years Ended December 31, | |||||||||
|---|---|---|---|---|---|---|---|---|---|---|
| ($ in millions) |
2013 | 2012 | 2011 | |||||||
Economic net income before intercompany interest and tax |
$ | 153.0 | $ | 131.4 | $ | 124.3 | ||||
Deductible intercompany interest expense(1) |
(72.2 | ) | (84.1 | ) | (74.1 | ) | ||||
| | | | | | | | | | | |
Taxable economic net income |
80.8 | 47.3 | 50.2 | |||||||
Taxes at the U.S. federal and state statutory rates |
(32.5 |
) |
(19.0 |
) |
(20.2 |
) |
||||
Other reconciling tax adjustments |
2.4 | — | (2.2 | ) | ||||||
| | | | | | | | | | | |
Tax on economic net income |
(30.1 | ) | (19.0 | ) | (22.4 | ) | ||||
Add back intercompany interest expense previously excluded |
72.2 | 84.0 | 74.1 | |||||||
| | | | | | | | | | | |
Economic net income |
$ | 122.9 | $ | 112.3 | $ | 101.9 | ||||
Economic net income effective tax rate |
19.7 | % | 14.5 | % | 18.0 | % | ||||
- (1)
- Based on projected levels of economic net income and excluding impacts from other reconciling tax adjustments, the expected effective economic net income tax rate would approximate 29.5% assuming a fixed proportion of deductible interest to pre-tax economic net income. Please refer to "Reorganization" for a discussion of our corporate structure following this offering.
Year ended December 31, 2013 compared to year ended December 31, 2012: Tax on economic net income for the year ended December 31, 2013 was $30.1 million, an increase of $11.1 million or 58.4%
92
over the tax for the year ended December 31, 2012 of $19.0 million. The increase was primarily due to the reduction in interest expense and an increase in income.
Year ended December 31, 2012 compared to year ended December 31, 2011: Tax on economic net income for the year ended December 31, 2012 was $19.0 million, a decrease of $3.4 million or 15.2% over the tax for the year ended December 31, 2011 of $22.4 million. The decrease was primarily due to increases in interest expense.
Non-GAAP ENI Results of Operations
For the Six Months Ended June 30, 2014 and 2013
| |
|
|
Increase (Decrease) | |||||||
|---|---|---|---|---|---|---|---|---|---|---|
| |
For the Six Months ended June 30, |
|||||||||
| |
2014 vs. 2013 | |||||||||
| ($ in millions) |
2014 | 2013 | ||||||||
Economic Net Income |
||||||||||
Management fees |
$ | 285.6 | $ | 238.2 | $ | 47.4 | ||||
Performance fees |
2.4 | 8.3 | (5.9 | ) | ||||||
Other income, including equity-accounted subsidiaries |
4.0 | 5.7 | (1.7 | ) | ||||||
Interest income |
0.1 | 0.2 | (0.1 | ) | ||||||
| | | | | | | | | | | |
Total ENI Revenue |
$ | 292.1 | $ | 252.4 | $ | 39.7 | ||||
| | | | | | | | | | | |
Fixed compensation & benefits |
59.5 | 53.8 | 5.7 | |||||||
General and administrative expenses |
40.7 | 35.5 | 5.2 | |||||||
Depreciation and amortization |
2.9 | 2.4 | 0.5 | |||||||
| | | | | | | | | | | |
Total ENI Operating Expenses |
103.1 | 91.7 | 11.4 | |||||||
| | | | | | | | | | | |
Earnings before variable compensation |
189.0 | 160.7 | 28.3 | |||||||
Variable compensation |
80.2 | 75.2 | 5.0 | |||||||
| | | | | | | | | | | |
Earnings after variable compensation |
108.8 | 85.5 | 23.3 | |||||||
Affiliate key employee distributions |
17.6 | 11.8 | 5.8 | |||||||
| | | | | | | | | | | |
Pre-Tax Economic Net Income |
$ | 91.2 | $ | 73.7 | $ | 17.5 | ||||
Tax on Economic Net Income |
24.6 | 15.4 | 9.2 | |||||||
| | | | | | | | | | | |
Economic Net Income |
$ | 66.6 | $ | 58.3 | $ | 8.3 | ||||
| | | | | | | | | | | |
| | | | | | | | | | | |
Pre-tax ENI operating margin before affiliate key employee distributions* |
37% | 34% | ||||||||
Pre-tax ENI operating margin after affiliate key employee distributions* |
31% | 29% | ||||||||
- *
- Pre-tax ENI Operating margin is calculated based on pre-tax economic net income, divided by revenue, excluding the impact of consolidated Funds and including investment return on equity-accounted Affiliates and interest income.
ENI Revenues
Management Fees
Management fees increased $47.4 million, or 19.9%, from $238.2 million for the six months ended June 30, 2013 to $285.6 million for the six months ended June 30, 2014. The increase was attributable to increases in average assets under management, from $169.0 billion in the first half of 2013 to $203.8 billion in the first half of 2014. Of the increase in average assets from the first six months of
93
2013 to the first six months of 2014, $28.0 billion was due to net appreciation of assets under management, while $7.5 billion was due to fluctuations in client flows.
Performance Fees
Performance fees decreased $5.9 million, or 71.1%, from $8.3 million for the six months ended June 30, 2013 to $2.4 million for the six months ended June 30, 2014. The decrease was primarily due to a receipt in the prior period of $4.2 million in performance fees related to an emerging markets product that was not repeated in the first half of 2014.
Other Income
Other income decreased $1.7 million, or 29.8%, from $5.7 million for the six months ended June 30, 2013 to $4.0 million for the six months ended June 30, 2014, primarily as a result of a restructuring of the split of performance fees at an equity-accounted Affiliate, as well as lower performance fees at equity-accounted Affiliates.
ENI Operating Expenses
Fixed Compensation and Benefits Expense
Fixed compensation and benefits expense increased $5.7 million, or 10.6%, from $53.8 million for the six months ended June 30, 2013 to $59.5 million for the six months ended June 30, 2014. This increase reflects increases in head count at certain Affiliates, normal increases in base salaries, wages and benefits, as well as higher average costs of medical benefit programs provided to our and our Affiliates' employees.
General and Administrative Expense
General and administrative expense increased $5.2 million, or 14.7%, from $35.5 million for the six months ended June 30, 2013 to $40.7 million for the six months ended June 30, 2014, driven by higher rent and commission expense, period over period, as well as increased consulting expenses in connection with succession planning and restructuring activities.
Depreciation and Amortization Expense
Depreciation and amortization expense increased $0.5 million, or 20.8%, from $2.4 million for the six months ended June 30, 2013 to $2.9 million for the six months ended June 30, 2014. The increase was primarily due to additional leasehold improvements capitalized during 2013 in relation to enhancements of certain Affiliates' premises.
ENI Variable Compensation and Affiliate Key Employee Distributions
Variable Compensation
Variable compensation increased $5.0 million, or 6.7%, from $75.2 million for the six months ended June 30, 2013 to $80.2 million for six months ended June 30, 2014, principally driven by higher earnings before variable compensation at our Affiliates, offset in part by higher charges in the first six months of 2013 in connection with central headcount reduction as well as a Value Incentive Plan that vested during 2013, neither of which recurred in the first six months of 2014.
Affiliate Key Employee Distributions
Affiliate key employee distributions increased $5.8 million, or 49.2%, from $11.8 million for the six months ended June 30, 2013 to $17.6 million for the six months ended June 30, 2014, primarily due to both higher Affiliate earnings after variable compensation, as well as higher effective Affiliate key employee ownership through additional purchases of Affiliate equity by key employees and the manner in which various equity distribution plans are structured.
94
Tax on Economic Net Income
Tax on economic net income was $15.4 million for the six months ended June 30, 2013 and $24.6 million for the six months ended June 30, 2014. The increase of $9.2 million, or 59.7%, reflects our increases in profits, combined with lower levels of intercompany interest expense.
Capital Resources and Liquidity
Working Capital and Long-Term Debt
The following table summarizes certain key financial data relating to our capital resources and liquid net assets. All amounts presented exclude consolidated Funds:
| |
|
As of December 31, | |||||||||||
|---|---|---|---|---|---|---|---|---|---|---|---|---|---|
| |
As of June 30, 2014 |
||||||||||||
| ($ in millions) |
2013 | 2012 | 2011 | ||||||||||
Balance Sheet Data(1) |
|||||||||||||
Current assets |
|||||||||||||
Cash and cash equivalents |
$ | 113.7 | $ | 194.2 | $ | 197.0 | $ | 194.6 | |||||
Receivables |
134.7 | 154.9 | 136.4 | 111.0 | |||||||||
| | | | | | | | | | | | | | |
Total current assets |
248.4 | 349.1 | 333.4 | 305.6 | |||||||||
| | | | | | | | | | | | | | |
Current liabilities |
|||||||||||||
Accounts payable and accrued expenses |
30.0 | 43.9 | 30.8 | 42.7 | |||||||||
Accrued short-term incentive compensation |
79.1 | 128.7 | 109.5 | 108.9 | |||||||||
Other short-term liabilities |
10.0 | 21.3 | 24.9 | 22.7 | |||||||||
| | | | | | | | | | | | | | |
Total current liabilities |
119.1 | 193.9 | 165.2 | 174.3 | |||||||||
| | | | | | | | | | | | | | |
Working capital |
$ | 129.3 | $ | 155.2 | $ | 168.2 | $ | 131.3 | |||||
Long term notes payable and other debt |
1,006.0 | 1,043.2 | 1,147.5 | 1,198.3 | |||||||||
Other long-term liabilities |
220.9 | 223.0 | 167.3 | 132.3 | |||||||||
- (1)
- Excludes consolidated Funds.
Working capital is defined as current assets less current liabilities, excluding consolidated Funds. Our net working capital has been positive over the past several years and was $129.3 million at June 30, 2014. Our most significant current liabilities have been accounts payable, accrued compensation expense and interest payable to related parties. Accrued compensation expense has primarily consisted of variable compensation accruals made throughout the year based on contractual arrangements. We are current with interest payments owed to related parties.
Our cash management practices generally require that working capital be maintained at each Affiliate at a sufficient level to meet short-term operational needs, typically measured as two to three months' worth of operating expenses, plus accrued incentive compensation. Periodic distributions of Affiliate earnings to OMUSH and Affiliate key employee equity holders are made according to respective Affiliate distribution policies, with OMUSH having the ability to access any surplus cash at each Affiliate as necessary during interim periods.
Our long-term debt outstanding historically consisted of a related party term loan and a related party revolving credit facility, both due to our Parent, and a term loan payable to a third party. Certain Funds included in our Consolidated Financial Statements also include long-term debt obligations to both related parties and third parties, none of which are attributable to our controlling interest holders.
95
The following table summarizes our various historical financing arrangements, excluding consolidated Funds:
| |
|
Amounts outstanding at | |
|
||||||||||||
|---|---|---|---|---|---|---|---|---|---|---|---|---|---|---|---|---|
| |
|
|
December 31, | |
|
|||||||||||
| |
Total available at June 30, 2014 |
June 30, 2014 |
|
|
||||||||||||
| ($ in millions) |
2013 | 2012 | Interest rate | Maturity | ||||||||||||
Long term debt of OMAM |
||||||||||||||||
Related party obligations: |
||||||||||||||||
Term loan one |
900.0 | 900.0 | 900.0 | 900.0 | 6.34% | September 30, 2015 | ||||||||||
Revolving credit facility |
750.0 | 103.5 | 140.7 | 231.5 | LIBOR + 5.58% + 0.50% fee on undrawn amounts. |
March 31, 2018 | ||||||||||
Third party obligations: |
||||||||||||||||
Term loan two |
2.5 | 2.5 | 2.5 | 16.0 | 5.23% | August 15, 2014 | ||||||||||
Term Loan One
On December 31, 2008, we issued a $900.0 million promissory note to our Parent. The note is due on September 30, 2015 and bears interest at 6.34% per annum. Interest on the note is due annually, but may, at times, have been pre-paid at our discretion. In connection with the Reorganization, we intend to refinance this debt and the rights to the new debt will be contributed to OMAM which will result in its elimination upon consolidation.
Revolving Credit Facility
We also hold a revolving credit facility with our Parent. The revolving loan was entered into on September 30, 2005 with a five-year term. We agreed to several extensions of the term with our Parent and the loan was most recently extended to expire on March 31, 2018. We pay interest on the revolving credit facility to our Parent on a quarterly basis. In connection with the Reorganization, we intend to refinance this debt and the rights to the new debt will be contributed to OMAM, which will result in its elimination upon consolidation. In addition, we intend to enter into a revolving credit facility with a third party in connection with the Reorganization. For further discussion, see "Reorganization" and "Unaudited Pro Forma Consolidated Financial Data."
Term Loan Two
On September 30, 2010, we entered into a $16.5 million term note with American AgCredit, PCA. Through December 31, 2013, we made scheduled repayments of $14.0 million. The remaining $2.5 million owed under the note at June 30, 2014 was repaid in August 2014. Interest amounts are paid out of a third-party interest reserve account at no cost to us. The note is secured by an offsetting preferred equity investment held by us in a consolidated investment managed by one of our Affiliates, with a fair value equivalent to the carrying amount of the loan. The credit agreement requires that we maintain IFRS net assets in excess of $250.0 million, and access to at least $25.0 million in available liquidity. We were in compliance with these covenants as of June 30, 2014. Our Parent has also subordinated its interests in respect of the note and revolving credit facility discussed above in favor of this obligation.
96
Other long-term liabilities principally consist of cash-settled Affiliate equity and profit interests liabilities held by certain Affiliate key employees, and voluntary deferred compensation plans. The following table summarizes our other long-term liabilities, excluding consolidated Funds:
| |
|
As of December 31, | ||||||||
|---|---|---|---|---|---|---|---|---|---|---|
| |
As of June 30, 2014 |
|||||||||
| ($ in millions) |
2013 | 2012 | ||||||||
Share-based payments liability |
$ | 63.1 | $ | 86.0 | $ | 65.8 | ||||
Affiliate profit interests |
90.3 | 77.2 | 49.0 | |||||||
| | | | | | | | | | | |
Employee equity |
153.4 | 163.2 | 114.8 | |||||||
Voluntary deferral plan |
59.0 | 51.2 | 41.4 | |||||||
Loan funding committed to discontinued operations |
2.7 | 3.7 | 8.5 | |||||||
Other |
5.7 | 4.9 | 2.6 | |||||||
| | | | | | | | | | | |
Total |
$ | 220.8 | $ | 223.0 | $ | 167.3 | ||||
| | | | | | | | | | | |
| | | | | | | | | | | |
Share-based payments liability represents the value of Affiliate key employee-owned equity that may under certain circumstances be repurchased by us that is considered an equity award under U.S. GAAP based on the terms and conditions attached to these interests. Profit interests represent the value of Affiliate key employee-owned equity that may under certain circumstances be repurchased by us that is not considered an equity award under U.S. GAAP, but rather a form of compensation arrangement, based on the terms and conditions attached to these interests. Our obligation in any given period in respect of funding these potential repurchases of Affiliate equity is limited to only that portion that may be put to us by Affiliate key employees, which is typically capped annually under the terms of these arrangements such that we are not required to repurchase more than we can reasonably recycle by re-granting the interests in lieu of cash variable compensation owed to Affiliate key employees.
Certain of our and our Affiliates' key employees are eligible to participate in our voluntary deferral plan, which provides our senior personnel the opportunity to voluntarily defer a portion of their compensation. This obligation is offset by a voluntary deferral plan investment.
For additional discussion of our compensation programs, please refer to our compensation expense discussion under "Compensation Discussion and Analysis" and "—ENI Variable Compensation and Affiliate Key Employee Distributions."
Cash Flows
The following table summarizes certain key financial data relating to cash flows. All amounts presented exclude consolidated Funds.
| |
6 Months Ended | Years Ended December 31, | |
||||||||||||||||
|---|---|---|---|---|---|---|---|---|---|---|---|---|---|---|---|---|---|---|---|
| |
2014 | 2013 | 2013 | 2012 | 2011 | |
|||||||||||||
Cash provided by (used in)(1)(2) |
|||||||||||||||||||
Operating activities |
$ | (13.5 | ) | $ | 5.5 | $ | 113.3 | $ | 48.2 | $ | 33.5 | ||||||||
Investing activities |
(2.9 | ) | 0.1 | (10.0 | ) | (24.0 | ) | (1.5 | ) | ||||||||||
Financing activities |
(40.8 | ) | (35.7 | ) | (104.3 | ) | (50.8 | ) | (19.6 | ) | |||||||||
- (1)
- Excludes
consolidated Funds.
- (2)
- Cash flow data shown only includes cash flows from continuing operations.
97
Historically, our most significant uses of cash collected through Affiliate earnings have been related to funding intercompany interest and debt arrangements with our Parent. Other short-term uses of cash have included compensation and general and administrative expenses for our Boston-based head office.
We may use any retained cash to invest in our business. For additional discussion of our cash policies and balance sheet financing arrangements, and potential future uses of cash following restructuring actions to be undertaken in connection with this offering, please refer to our dividend policy in "Dividend Policy" and our pro forma financial information in "Unaudited Pro Forma Consolidated Financial Data" and "—Future Capital Needs."
Comparison for the Years Ended December 31, 2013, 2012 and 2011
Net cash provided by operating activities of continuing operations excluding consolidated Funds increased $65.1 million, or 135%, from $48.2 million for the year ended December 31, 2012 to $113.3 million for the year ended December 31, 2013. The increase was primarily due to higher pre-interest earnings, lower intercompany interest payments and the timing effect of fluctuations in our working capital.
Net cash provided by operating activities of continuing operations excluding consolidated Funds increased $14.7 million, or 43.9%, from $33.5 million for the year ended December 31, 2011 to $48.2 million for the year ended December 31, 2012. The increase was primarily due to higher earnings and the timing effect of fluctuations in our current assets and liabilities.
Net cash flows used in investing activities of continuing operations excluding consolidated Funds consist primarily of purchases and sales of investment securities as part of our co-investment program and voluntary deferral program, or VDP, and purchases of fixed assets for use within our premises. Cash used in investing activities was $10.0 million, $24.0 million and $1.5 million for the years ended December 31, 2013, 2012 and 2011, respectively. Net cash used in the purchase and sale of co-investments and VDP investments was $0.1 million, $11.3 million and $1.5 million for the years ended December 31, 2013, 2012 and 2011, respectively. Fluctuations are principally due to the timing of acquisitions of real estate and timber assets in which we are co-investing. Net cash used in the purchase of fixed assets was $9.9 million, $12.7 million and $3.6 million for the years ended December 31, 2013, 2012 and 2011, respectively. The higher levels in 2013 and 2012 versus 2011 were primarily a result of cyclical reinvestment by our Affiliates in the facilities and premises in which they operate.
Net cash used in financing activities excluding the Funds consist of repayments of the related party revolving credit facility and third-party borrowings. Increases in the level of repayments made from 2011 to 2013 were driven by corresponding increases in our available operating cash flows. In 2011 our Parent also made a $78.0 million capital contribution which was used in that year to repay intra-group debt owed to a former commonly-controlled related party.
Comparison for the Six Months Ended June 30, 2014 and 2013
Net cash used in operating activities of continuing operations excluding consolidated Funds increased $19.0 million, from net cash provided of $5.5 million for the six months ended June 30, 2013 to net cash used of $13.5 million for the six months ended June 30, 2014, driven by higher annual variable compensation payments made to Affiliate key employees, due to higher earnings. Net cash used in investing activities of continuing operations excluding consolidated Funds increased $3.0 million, from net cash provided of $0.1 million for the six months ended June 30, 2013 to net cash used of $2.9 million for the six months ended June 30, 2014, driven by $2.8 million in contingent acquisition payments and higher annual voluntary deferral plan contributions due to our improved financial performance in 2013 and higher resulting bonuses. Net cash used in financing activities of continuing operations excluding consolidated Funds increased $5.1 million, or 20.0%, from $35.7 million for the six months ended June 30, 2013 to $40.8 million for the six months ended June 30, 2014, driven by the purchase of Affiliate equity in 2014.
98
Supplemental Liquidity Measure—Adjusted EBITDA
As supplemental information, we provide information regarding Adjusted EBITDA, which we define as economic net income before income taxes, depreciation and amortization. We consider Adjusted EBITDA to be a non-GAAP liquidity measure that we provide in addition to, but not as a substitute for, cash flows from operating activities. It should therefore be noted that our calculation of Adjusted EBITDA may not be consistent with Adjusted EBITDA as calculated by other companies. We believe Adjusted EBITDA is a useful liquidity metric because it indicates our ability to make further investments in our business, service debt and meet working capital requirements.
The following table reconciles Adjusted EBITDA to our net income attributable to controlling interests and to economic net income for the six months ended June 30, 2013 and 2014 and for the years ended December 31, 2013, 2012 and 2011:
| |
For the Six Months Ended June 30 |
Years Ended December 31, |
||||||||||||||
|---|---|---|---|---|---|---|---|---|---|---|---|---|---|---|---|---|
| ($ in millions) |
2014 | 2013 | 2013 | 2012 | 2011 | |||||||||||
Net profit attributable to controlling interests |
$ | 19.1 | $ | 11.5 | $ | 25.7 | $ | 3.0 | $ | 10.3 | ||||||
Add back interest expense |
33.1 | 37.7 | 72.2 | 84.4 | 73.2 | |||||||||||
Add back income tax expense (including discontinued operations) |
16.4 | 10.3 | 16.3 | 7.2 | (29.8 | ) | ||||||||||
Add back depreciation and amortization (including discontinued operations) |
2.9 | 2.6 | 5.6 | 42.0 | 50.1 | |||||||||||
| | | | | | | | | | | | | | | | | |
EBITDA |
$ | 71.5 | $ | 62.1 | $ | 119.8 | $ | 136.6 | $ | 103.8 | ||||||
Non-cash compensation costs associated with revaluation of affiliate key employee-owned equity and profit-sharing interests |
16.1 | 20.5 | 47.7 | 16.2 | 11.5 | |||||||||||
EBITDA of discontinued operations attributable to controlling interests |
3.0 | (6.5 | ) | (9.9 | ) | (17.7 | ) | 7.8 | ||||||||
Non-cash parent corporate cost allocation |
1.6 | 1.1 | 3.3 | 2.8 | 3.2 | |||||||||||
Investment gains attributable to controlling interests |
2.0 | (1.0 | ) | (3.0 | ) | (1.2 | ) | (3.1 | ) | |||||||
Capital transaction costs |
— | — | — | 0.4 | 8.0 | |||||||||||
| | | | | | | | | | | | | | | | | |
Adjusted EBITDA |
94.2 | 76.2 | 157.9 | 137.1 | 131.2 | |||||||||||
Depreciation |
(2.9 | ) | (2.4 | ) | (4.9 | ) | (5.8 | ) | (6.9 | ) | ||||||
Tax on economic net income |
(24.6 | ) | (15.4 | ) | (30.1 | ) | (19.0 | ) | (22.4 | ) | ||||||
| | | | | | | | | | | | | | | | | |
Economic Net Income |
$ | 66.6 | $ | 58.4 | $ | 122.9 | $ | 112.3 | $ | 101.9 | ||||||
| | | | | | | | | | | | | | | | | |
| | | | | | | | | | | | | | | | | |
For a full discussion regarding the items excluded from Adjusted EBITDA above and the calculation of economic net income, refer to "—Non-GAAP Supplemental Performance Measure—Economic Net Income."
We use Adjusted EBITDA to evaluate the levels of pre-tax earnings produced that are available for reinvestment into our business and debt servicing. The following table reconciles operating cash
99
flows from continuing operations excluding consolidated Funds to Adjusted EBITDA for the six months ended June 30, 2013 and 2014 and for the years ended December 31, 2013, 2012 and 2011:
| |
For the Six Months Ended June 30, |
Years Ended December 31, |
||||||||||||||
|---|---|---|---|---|---|---|---|---|---|---|---|---|---|---|---|---|
| ($ in millions) |
2014 | 2013 | 2013 | 2012 | 2011 | |||||||||||
Operating cash flows from continuing operations |
$ | (13.5 | ) | $ | 5.5 | $ | 113.3 | $ | 48.2 | $ | 33.5 | |||||
Interest expense |
33.1 | 37.7 | 72.2 | 84.1 | 74.2 | |||||||||||
Current and deferred taxes |
(1.7 | ) | (2.5 | ) | 3.1 | (5.7 | ) | 26.4 | ||||||||
Gains on equity method investments, net of distributions |
2.2 | (9.7 | ) | (7.6 | ) | 4.6 | 0.7 | |||||||||
Capital transaction costs |
— | — | — | 0.4 | 8.0 | |||||||||||
Non-cash equity-based compensation |
(7.7 | ) | (6.8 | ) | (13.8 | ) | (11.0 | ) | (9.4 | ) | ||||||
Changes in current assets and liabilities and other(1) |
81.8 | 52.0 | (9.3 | ) | 16.5 | (2.2 | ) | |||||||||
| | | | | | | | | | | | | | | | | |
Adjusted EBITDA |
$ | 94.2 | $ | 76.2 | $ | 157.9 | $ | 137.1 | $ | 131.2 | ||||||
| | | | | | | | | | | | | | | | | |
| | | | | | | | | | | | | | | | | |
- (1)
- For the six months ended June 30, 2014 and 2013, this represents primarily the pay down of annual variable compensation accruals from the prior year end
Limitations of Adjusted EBITDA
As a non-GAAP, unaudited liquidity measure and derivation of EBITDA, Adjusted EBITDA has certain material limitations. It does not include cash costs associated with capital transactions and excludes certain U.S. GAAP expenses that fall outside the definition of EBITDA. Each of these categories of expense represents costs to us of doing business, and therefore any measure that excludes any or all of these categories of expense has material limitations.
Future Capital Needs
We believe that our available cash and cash equivalents to be generated from operations will be sufficient to fund current operations and capital requirements for at least the next twelve months. In addition, in connection with the Reorganization, we intend to enter into a revolving credit facility with a third party. Over the longer term, we expect that cash flow from operations, supplemented by short-term and long-term financing, as necessary, will be adequate to fund our day-to-day operations and future investment requirements. Our ability to secure short-term and long-term financing in the future will depend on several factors, including our future profitability, our relative levels of debt and equity and the overall condition of the credit markets.
In connection with this offering, we will enter into an agreement with our Parent and certain of its affiliates pursuant to which our Parent will continue to provide approximately $150 million in seed capital to our Affiliates and their investment products through January 15, 2018, at which time it must be returned to our Parent, unless we purchase the seed capital investments. Prior to the conclusion of that commitment, we will have to assess our required level of seed capital beyond January 2018. Although we may choose to arrange to purchase our Parent's seed capital investments at market value, we will have no obligation to do so. We also currently have no arrangements or commitments in place regarding the future funding of seed or co-investment capital. See "Certain Relationships and Related Party Transactions—Relationship with Our Parent and OMGUK Following This Offering—Seed Capital Management Agreement" for additional details on this agreement.
In connection with this offering, we will enter into a contractual arrangement with OMGUK with respect to $279.3 million of existing deferred tax assets as of June 30, 2014, such that following the Reorganization, any future amounts realized in respect of these assets, until the later of December 31, 2019 or December 31 of the year in which OMGUK ceases to own, directly or indirectly, at least 50%
100
of our outstanding ordinary shares, are entirely attributable and payable to OMGUK. This will result in the recording of an intercompany payable to OMGUK in our Consolidated Financial Statements, which will henceforth track the value of the deferred tax assets until the later of December 31, 2019 or December 31 of the year in which OMGUK ceases to own at least 50% of our Company, at which point in time the arrangement would be terminated and, on November 30 of the following year, the payable would be settled at its net present value subject to repayment if, and to the extent that, the deferred tax assets are determined not to be available. See "Certain Relationships and Related Party Transactions—Relationship with Our Parent and OMGUK Following This Offering—Deferred Tax Asset Arrangement" for additional details on this arrangement.
For additional discussion of our balance sheet financing arrangements, and potential future uses of cash following restructuring actions to be undertaken in connection with this offering, please refer to our dividend policy in "Dividend Policy" and our pro forma financial information under the heading "Unaudited Pro Forma Consolidated Financial Data."
Commitments, Contingencies and Off-Balance Sheet Obligations
Indemnifications
In the normal course of business, such as through agreements to enter into business combinations with and divestitures of Affiliates, we occasionally enter into contracts that contain a variety of representations and warranties and which provide general indemnifications. Our maximum exposure under these arrangements is unknown, as this would involve future claims that may be made against us that have not yet occurred.
Off-Balance Sheet Obligations
Off-balance sheet arrangements, as defined by the SEC, include certain contractual arrangements pursuant to which a company has an obligation, such as certain contingent obligations, certain guarantee contracts, retained or contingent interests in assets transferred to an unconsolidated entity, certain derivative instruments classified as equity or material variable interests in unconsolidated entities that provide financing, liquidity, market risk or credit risk support. Disclosure is required for any off-balance sheet arrangements that have, or are reasonably likely to have, a material current or future effect on our financial condition, results of operations, liquidity or capital resources. We generally do not enter into off-balance sheet arrangements, other than those described in "—Contractual Obligations" as well as Note 5 to our Consolidated Financial Statements, "Variable Interest Entities."
101
Contractual Obligations
The following table summarizes our contractual obligations as of December 31, 2013:
| |
Payments due by period | |||||||||||||||
|---|---|---|---|---|---|---|---|---|---|---|---|---|---|---|---|---|
| ($ in millions) |
Total | Less than 1 year |
1 - 3 years | 3 - 5 years | More than 5 years |
|||||||||||
Contractual Obligations |
||||||||||||||||
Intercompany notes payable |
$ | 1,040.7 | $ | — | $ | 900.0 | $ | 140.7 | $ | — | ||||||
Third party debt |
2.5 | 2.5 | — | — | — | |||||||||||
Amounts due to disposed affiliates |
3.7 | 3.7 | — | — | — | |||||||||||
Lease obligations(1) |
74.4 | 9.4 | 19.8 | 16.3 | 28.9 | |||||||||||
Maximum Affiliate equity and profits interests repurchase obligations(2) |
100.5 | 6.8 | 26.6 | 26.3 | 40.8 | |||||||||||
| | | | | | | | | | | | | | | | | |
Total contractual obligations |
1,221.8 | 22.4 | 946.4 | 183.3 | 69.7 | |||||||||||
| | | | | | | | | | | | | | | | | |
Contingent Obligations |
||||||||||||||||
Contingent liabilities related to business acquisition(3) |
11.1 | 11.1 | — | — | — | |||||||||||
| | | | | | | | | | | | | | | | | |
Total contractual and contingent obligations |
$ | 1,232.9 | $ | 33.5 | $ | 946.4 | $ | 183.3 | $ | 69.7 | ||||||
| | | | | | | | | | | | | | | | | |
| | | | | | | | | | | | | | | | | |
- (1)
- Amounts
are shown net of income from subleases, and exclude transferred Affiliates and consolidated Funds
- (2)
- Vested
amounts putable by Affiliate key employees, excluding discontinued operations
- (3)
- Obligation has been satisfied as of the second quarter of 2014.
In connection with the Reorganization, our Parent intends to refinance and reissue to a subsidiary of ours, the $900 million note payable and outstanding borrowing under the $140.7 million revolving credit facility identified above, which will result in their elimination upon consolidation. We therefore expect that following this offering, the above table will no longer reflect these instruments as our contractual obligations. In connection with the Reorganization, we also intend to enter into a revolving credit facility with a third party. Refer to "Reorganization" for a further discussion.
Market Risk
Our exposure to market risk is directly related to the role of our Affiliates as asset managers. Substantially all of our investment management revenues are derived from our Affiliates' agreements with their clients. Under these agreements, the revenues we receive are based on the value of our assets under management or the investment performance on client accounts for which we earn performance fees. Accordingly, our revenues and net income may decline as a result of our assets under management decreasing due to depreciation of our investment portfolios. In addition, such depreciation could cause our clients to withdraw their funds in favor of investments offering higher returns or lower risk, which would cause our revenues and net income to decline further.
The value of our assets under management was $214.9 billion as of June 30, 2014. A 10% increase or decrease in the value of our assets under management, if proportionally distributed over all of our investment strategies, asset classes and client relationships, would cause an annualized increase or decrease in our gross management fee revenues of approximately $72.2 million at our current weighted average fee rate of 34 basis points, including equity-accounted Affiliates, resulting in an annual change of approximately $22.6 million in our post-tax economic net income.
102
Among the market risks which could impact our assets under management and our business, including equity market risk, interest rate risk, and foreign currency risk, our greatest exposure is changes in equity markets. A 10% increase or decrease in equity markets would cause our $168.7 billion of equity assets under management to increase or decrease by $16.9 billion, resulting in a change in annualized management fee revenue of $55.5 million and an annual change in post-tax economic net income of approximately $18.5 million, given our current cost structure, operating model, and average equity fee rates of 33 bps. Likewise, were foreign exchange rates to appreciate or depreciate 10% against the U.S. dollar, our $73.2 billion of foreign denominated AUM would increase or decrease by $7.3 billion, resulting in a change in annualized management fee revenue of $32.5 million and an annual change in post-tax economic net income of $11.3 million, based on average fees earned on our non-U.S. products of 44 bps. A change in interest rates, resulting in a 10% increase or decrease in the value of our total fixed income AUM of $14.5 billion, would cause AUM to rise or fall by approximately $1.4 billion. Based on our fixed income average fee rates of 23 bps, annualized revenue would change by $3.3 million and post-tax economic net income would change by $1.0 million annually. The financial impact of a change in interest rates on our operating business would be accentuated by the impact of interest rate changes on our $175 million of third party floating rate debt to be outstanding following the Reorganization. Interest paid on our debt would go up or down by $1.75 million if interest rates increased or decreased by 100bps.
While the analysis above assumes that market changes occur in a uniform manner across the relevant portfolio, because of our declining fee rates for larger relationships and differences in our fee rates across asset classes, a change in the composition of our assets under management, in particular an increase in the proportion of our total assets under management attributable to strategies, clients or relationships with lower effective fee rates, could have a material negative impact on our overall weighted average fee rate.
As is customary in the asset management industry, clients invest in particular strategies to gain exposure to certain asset classes, which exposes their investment to the benefits and risks of such asset classes. We have not adopted a corporate-level risk management policy regarding client assets, nor have we attempted to hedge at the corporate level or within individual strategies the market risks that would affect the value of our overall assets under management and related revenues. Any reduction in the value of our assets under management would result in a reduction in our revenues. Furthermore, as further discussed in our significant accounting policies, we are required to consolidate certain Funds and negative returns in our investment strategies could result in reductions in the assets of consolidated Funds included in our consolidated balance sheets.
Critical Accounting Policies and Estimates
Our accompanying Consolidated Financial Statements were prepared in accordance with U.S. GAAP. The preparation of financial statements in conformity with U.S. GAAP requires us to make estimates or assumptions that affect the reported amounts of assets and liabilities at the date of the financial statements and the reported amounts of revenues and expenses during the periods presented. Due to their nature, estimates involve judgment based upon available information. Actual results could differ from these estimates or assumptions and may have a material effect on our Consolidated Financial Statements.
Management believes that the critical accounting policies and estimates discussed below involve significant estimates or judgment due to the sensitivity of the methods and assumptions used.
Basis of Presentation
Our Consolidated Financial Statements reflect our historical balance sheets; statements of operations and of comprehensive income; statements of changes in stockholders' equity; and statements of cash flows. These historical Consolidated Financial Statements have been prepared using our
103
Parent's historical basis in determining our assets and liabilities and our results. The financial information included herein may not reflect our consolidated financial position, operating results, changes in our Parent's equity investment and our cash flows in the future, and does not reflect what they would have been had we been a separate, stand-alone entity during the periods presented.
The Consolidated Financial Statements have been prepared in accordance with U.S. GAAP. All dollar amounts, except per share data in the text and tables herein, are stated in millions unless otherwise indicated. Transactions between us and our Parent are included in the Consolidated Financial Statements, however material intercompany balances and transactions among us, our consolidated Affiliates and consolidated Funds are eliminated in consolidation.
Allocated Costs from the Parent
Our Parent provides us with various services, including governance through the board of directors and executive committees, investor relations, procurement of insurance coverage, human resources, financial reporting, internal audit, treasury, systems, risk, working capital and tax services. Some of these services are directly attributable to us and some are of a more general nature. The costs associated with the services which are (i) directly attributable to us, (ii) have been charged directly to us by our Parent, and (iii) have been paid to our Parent by us have been reflected in our Consolidated Financial Statements. During the years ended December 31, 2013, 2012 and 2011, the amount of expenses charged directly to us from our Parent were $2.0 million, $2.7 million and $2.7 million, respectively.
With respect to the above services and benefits which are not directly attributable to us, costs are allocated to us and included in our Consolidated Financial Statements based generally on our proportion of our total Parent's consolidated, normalized revenues. During the years ended December 31, 2013, 2012 and 2011, costs allocated to us from our Parent were $3.3 million, $2.8 million and $3.2 million, respectively.
These cost allocations have been determined using a method that we and our Parent consider reasonably reflects the costs of such services attributable to us provided by our Parent. We believe the assumptions and allocations underlying the Consolidated Financial Statements are reasonable and the allocated amounts are representative of the amounts that would have been recorded in our Consolidated Financial Statements had we operated independent of our Parent for the historical periods presented. A more detailed discussion of the relationship with our Parent, including a description of the costs that have been allocated to us, as well as the allocation methods, is included in Note 10, "Related Party Transactions", to our Consolidated Financial Statements.
Consolidation of Affiliates
We evaluate each of our Affiliates and other operating entities to determine the appropriate method of accounting. Generally, majority-owned entities or otherwise controlled investments in which we hold a controlling financial interest as the principal shareholder, managing member, or general partner are consolidated.
Consolidation of Funds
In evaluating whether or not a legal entity must be consolidated, we determine if such entity is a variable interest entity, or VIE, or a voting interest entity, or VOE. A VOE is considered an entity in which (i) the total equity investment at risk is sufficient to enable the entity to finance its activities independently and (ii) the equity holders at risk have the obligation to absorb losses, the right to receive residual returns, and the right to direct the activities of the entity that most significantly impact the entity's economic performance. A VIE is an entity that lacks one or more of the characteristics of a VOE. Assessing whether an entity is a VIE or VOE involves judgment and analysis. Factors considered in this assessment include the entity's legal organization, the entity's capital structure and equity
104
ownership and any related party or de facto agent implications of our involvement with the entity. Investments that are determined to be VIEs are consolidated if we or a consolidated Affiliate is the primary beneficiary of the investment. VOEs are typically consolidated if we hold the majority voting interest or otherwise controls the entity.
In the normal course of business, our Affiliates sponsor and manage certain investment vehicles, or the Funds. We assess consolidation requirements with respect to our Funds pursuant to Accounting Standards Codification, or ASC, Topic 810 relating to the consolidation of VIEs. Substantially all of the Funds that are managed by us qualify for the deferral granted under Accounting Standards Updates, or ASU, 2010-10, "Amendments for Certain Investment Funds," or ASU 2010-10. As such, we evaluate these Funds for consolidation pursuant to guidance formerly in Financial Accounting Standards Board, or FASB, Interpretation No. 46(R), Consolidation of Variable Interest Entities. These Funds are typically owned entirely by third-party investors, however certain Funds are capitalized with seed capital investments from us or our related parties and may be owned partially by Affiliate key employees and/or individuals that own minority interests in an Affiliate.
In evaluating whether we are the primary beneficiary, we evaluate our economic interests in the entity held either directly by us or indirectly through related parties. For VIEs that are investment companies subject to ASU 2010-10, the primary beneficiary of the VIE is generally the variable interest holder that absorbs a majority of the expected losses of the VIE, receives a majority of the expected residual returns of the VIE, or both. We are generally not the primary beneficiary of Fund VIEs created to manage assets for clients unless our ownership interest, including interests of related parties, is substantial.
For VIEs that do not fall within the scope of ASU 2010-10, the primary beneficiary of a VIE is defined as the variable interest holder that has a controlling financial interest. A controlling financial interest is defined as (i) the power to direct the activities of the VIE that most significantly impacts its economic performance and (ii) the obligation to absorb losses of the entity or the right to receive benefits from the entity that could potentially be significant to the VIE. If no single party satisfies both criteria, but we and our related parties satisfy the criteria on a combined basis, then the primary beneficiary is the entity out of the related party group that is most closely associated to the VIE. The consolidation analysis can generally be performed qualitatively, however, if it is not readily apparent that we are not the primary beneficiary, a quantitative analysis may also be performed.
We consolidate VOEs when we have control over significant operating, financial and investing decisions of the entity. For VOEs organized as limited partnerships or as an entity with governance structures similar to a limited partnership (e.g., limited liability company with a managing member), we consolidate an entity when we hold the controlling general partnership interest and the limited partners do not hold substantive participating rights or rights to remove and replace the general partner or rights that could provide the limited partners with the ability to impact the ongoing governance and operating activities of the entity.
Other than Funds holding investments in timber assets, or the Timber Funds, our consolidated Funds are, investment companies, or the Investment Funds, and we have therefore retained their specialized investment company accounting in consolidation, pursuant to ASC 946, "Financial Services—Investment Companies."
Upon the occurrence of certain events (such as contributions and redemptions, either by us, our Affiliates, or third parties, or amendments to the governing documents of our investees or sponsored Funds) we review and reconsider our previous conclusion regarding the status of an entity as a VIE or a VOE. Additionally, we continually reconsider whether we are deemed to be a VIE's primary beneficiary who consolidates such entity.
105
Timber Funds
Timber assets and timber lease rights of consolidated Timber Funds are stated at historical cost less depletion for timber previously harvested and less accumulated amortization and depreciation for lease rights and roads. Timber investment values are adjusted for capital additions made to the property subsequent to the valuation date. All initial silviculture costs, including site preparation and planting costs are capitalized as stand establishment costs. Stand establishment costs are transferred to a merchantable timber classification as trees reach a certain size. Generally, costs incurred subsequent to two years after planting, such as fertilization, vegetation, insect control and pre-commercial thinning are considered to be maintenance and are expensed as incurred.
We estimate our timber inventory using statistical information and data obtained from physical measurements, site maps, photo-types and other information gathering techniques. These estimates are updated annually and may result in adjustments of timber volumes, including timber growth rates and depletion rates.
Depletion consists of costs attributed to harvesting timber and is recorded as an expense as timber is harvested. The depletion rate applied to the volume of timber sold is adjusted annually and is based on the relationship of incurred costs in the merchantable timber classification to estimated current merchantable volume.
Timber and timberlands are reviewed for impairment when events or changes in circumstances indicate that the carrying value of such assets may not be recoverable. We compare the carrying value of a timber asset with the asset's expected future undiscounted cash flows. If the carrying value of the asset exceeds the expected future cash flows, impairment exists, which is measured by the excess of the carrying value over the fair value of the assets.
Use of Estimates
The preparation of our Consolidated Financial Statements requires us to make estimates and assumptions that affect the reported amounts of assets and liabilities, the disclosure of contingent assets and liabilities at the date of the financial statements and the reported amounts of revenues and expenses during the period. Actual results could differ significantly from those estimates.
Operating Segment
We operate in one operating segment that provides investment management services and products primarily to institutional clients. Although we do make certain disclosures regarding assets under management by product and Affiliate, our determination that we operate one business segment is based on the fact that our Chief Operating Decision Maker reviews our financial performance on an aggregate level.
Fair Value Measurements
In accordance with the provisions of FASB ASC 820, "Fair Value Measurement," or ASC 820, fair value is the price that we expect to be paid upon the sale of an asset or expects to pay upon the transfer of a liability in an orderly transaction between market participants. Pursuant to ASC 820, there is a three-level hierarchy for fair value measurements based upon the transparency of inputs to the valuation of an asset or liability. Inputs may be observable or unobservable and refer broadly to the assumptions that market participants would use in pricing the asset or liability. Observable inputs reflect the assumptions market participants would use in pricing the asset or liability based on market data obtained from independent sources. Unobservable inputs reflect our own conclusions about the assumptions that market participants would use in pricing the asset or liability based on the best information available in the circumstances. Each investment is assigned a level based upon the
106
observability of the inputs which are significant to the overall valuation. Assets and liabilities measured and reported at fair value are classified and disclosed in one of the following categories:
- •
- Level I—Quoted prices are available in active markets for identical investments as of the reporting
date. The type of investments included in Level I include listed equities and listed derivatives. As required by U.S. GAAP, we do not adjust the quoted price for these investments, even
in situations where we hold a large position and the sale of such position would likely deviate from the quoted price.
- •
- Level II—Pricing inputs are other than quoted prices in active markets, which are either directly or
indirectly observable as of the reporting date, and fair value is determined through the use of models or other valuation methodologies utilizing observable market inputs other than quoted prices.
Investments which are generally included in this category include corporate bonds and loans, less liquid and restricted equity securities and certain over-the-counter derivatives.
- •
- Level III—Pricing inputs are unobservable for the asset or liability and include assets and liabilities where there is little, if any, market activity for the investment. The inputs into the determination of fair value require significant management judgment or estimation. Investments that are included in this category generally include general and limited partner interests in corporate private equity, real estate funds, and funds of hedge funds.
In certain cases, the inputs used to measure fair value may fall into different levels of the fair value hierarchy. In such cases, an investment's level within the fair value hierarchy is based on the lowest level of input that is significant to the fair value measurement. Our assessment of the significance of a particular input to the fair value measurement in its entirety requires judgment and considers factors specific to the investment.
Valuation of Investments Held at Fair Value
Valuation of Fund investments is evaluated pursuant to the fair value methodology discussed above. Our discretionary investments are categorized as trading and held at estimated fair value. Realized and unrealized gains and losses arising from changes in fair value of discretionary investments are reported within Investment income in the Consolidated Statements of Operations. See Note 4, "Fair Value Measurements" in our Consolidated Financial Statements for a summary of the fair value inputs of other discretionary investments held at fair value.
Investment advisory fees receivable
We earn management and performance fees which are billed monthly, quarterly or annually in arrears, according to the terms of the relevant investment management agreement. Management and performance fees that have been billed but have not yet been collected are presented as "Investment advisory fees receivable" on our Consolidated Balance Sheets. Due to the short-term nature and liquidity of these receivables, the carrying amounts approximate their fair values. Investment advisory fees receivable does not include any allowance for doubtful accounts, nor has any bad debt expense to accounts receivable been recorded for the period ended June 30, 2014 as we believe these balances are fully collectible.
Equity Method Investments
We use the equity method of accounting for investments that provide us with the ability to exercise significant influence over an entity, but that do not meet the requirements for consolidation. Equity method investments include two Affiliates, Heitman and ICM, as well as all unconsolidated Funds over which we exercise significant influence. Our share of earnings (losses) from equity method investments is included in "Investment Income" in the consolidated statements of operations. The carrying amounts of equity method investments are reflected in "Investments" in our consolidated balance sheets. We
107
evaluate our equity method investments for impairment whenever events or changes in circumstances indicate that the carrying amounts of such investments may not be recoverable. The difference between the carrying value and its estimated fair value is recognized as impairment when the loss is deemed other than temporary. Other investments, in which we or an Affiliate do not exercise significant influence are accounted for under the cost method. Under the cost method, income is recognized as dividends when, and if, declared.
Revenue Recognition
Our consolidated revenue primarily represents management fees billed monthly, quarterly and annually by Affiliates for managing the assets of clients. Asset-based management fees are recognized monthly as services are rendered and are primarily based upon a percentage of the market value of client assets managed. Affiliates that manage tangible property may also earn transaction fees at the time the underlying property is bought and sold. Any fees collected in advance are deferred and recognized as income over the period earned. Dividend income received by Investment Funds is recorded on the ex-dividend date. Performance fees are generally assessed as a percentage of the investment performance realized on a client's account. Performance fees, including those that are subject to clawback are recognized when (i) they become billable to customers (based on contractual terms of agreements), (ii) they are not subject to contingent repayment and (iii) collection is reasonably assured. Other income and revenues include interest income on cash and cash equivalents of Investment Funds and our share of earnings from joint venture partners.
Timber Funds' revenue is recognized from log and fiber sales upon delivery to the customer. We are typically responsible for all logging and hauling costs. However, under pay-as-cut timber contracts, title and risk of loss from stumpage sales transfer to the buyer as the trees are cut. Revenue is recognized as timber is harvested. The buyer is typically responsible for all logging and hauling costs.
Intangible Assets
Acquired Affiliates have identifiable intangible assets arising from contractual or other legal rights with their clients. In determining the value of acquired intangibles, we analyze the net present value of each acquired Affiliate's existing client relationships based on a number of factors. We analyze the Affiliate's historical and potential future operating performance, the Affiliate's historical and potential future rates of attrition among existing clients, the stability and longevity of existing client relationships, the Affiliate's recent and long-term investment performance, the characteristics of the firm's products and investment styles, the stability and depth of the Affiliate's management team and the Affiliate's history and perceived franchise or brand value. Our acquired intangibles assets are predominately definite-life intangible assets and are generally amortized on a straight line basis over their estimated useful lives, ranging from five to sixteen years, reflecting the expected duration of such relationships. We do not hold any indefinite-lived intangible assets other than goodwill.
We test for the possible impairment of acquired intangibles whenever events or changes in circumstances indicate that the carrying amount of the asset is not recoverable. If such indicators exist, we compare the undiscounted cash flows related to the asset to the carrying value of the asset. If the carrying value is greater than the undiscounted cash flow amount, an impairment charge is recorded in our consolidated statements of operations for amounts necessary to reduce the carrying value of the asset to fair value. Intangible assets to be disposed of are reported at the lower of carrying value or fair value less cost to sell.
Goodwill
We record goodwill when the consideration paid in a business acquisition exceeds the fair value of the net total of tangible assets acquired, identifiable intangible assets acquired and liabilities assumed. Goodwill is not amortized, but rather is tested for impairment annually or more frequently if events or
108
circumstances occur that indicate impairment may exist. Factors that could trigger an impairment review include significant underperformance relative to historical or projected future operating results, significant changes in our use of the acquired assets in a business combination or the strategy for our overall business, and significant negative industry or economic trends.
We perform our assessment for impairment of goodwill during the fourth quarter annually as of September 30 and we have determined that we have five reporting units, consisting of the five consolidated Affiliates, for testing goodwill for impairment. We first consider various qualitative factors to determine if it is more likely than not that the fair value of each of the reporting units is greater than its respective carrying amount, including goodwill. Only a material decline in the fair value of any reporting unit would indicate that impairment may exist, at which point the impact would be determined. For purposes of assessing potential impairment, the fair value of the reporting unit is estimated and compared to the carrying value of the reporting unit. The fair value of a reporting unit is based on discounted estimated future cash flows. The assumptions used to estimate fair value include management's estimates of future growth rates, operating cash flows, discount rates and terminal value. These assumptions and estimates can change in future periods based on market movement and factors impacting the expected business performance. Changes in assumptions or estimates could materially affect the determination of the fair value of a reporting unit. If it is determined that the carrying value of the reporting unit exceeds its fair value, we determine the implied fair value of the goodwill in the same manner used to determine the amount of goodwill in a business combination. If the carrying value of goodwill exceeds the implied fair value of the goodwill, an impairment charge is recognized in the amount equal to that excess. Based on our most recent annual goodwill impairment test, the fair value of all our reporting units were substantially in excess of their carrying value.
Earnings Per Share
We calculate basic and diluted pro forma earnings per share, or EPS, by dividing net income for the year ended December 31, 2013 by pro forma shares, as determined pursuant to the Reorganization.
Basic EPS attributable to our common shareholders is calculated by dividing "Net income (loss) from continuing operations attributable to controlling interest" by the weighted-average number of shares outstanding. Diluted EPS is similar to basic EPS, but adjusts for the effect of potential common shares unless they are antidilutive. For periods with a net loss, potential common shares are considered antidilutive.
Compensation Arrangements
We operate short-term variable compensation arrangements where generally, a percentage of each Affiliate's annual pre-variable compensation earnings, as defined in each arrangement, is allocated to a "pool" of each respective Affiliate's key employees, and subsequently distributed to individuals subject to recommendation and approval of a Remuneration Committee consisting of us and each respective Affiliate's management. Variable compensation expense is accrued and recognized in our consolidated statements of operations after services are provided by individual employees, and only after it has been formally awarded and communicated to those individuals. Variable compensation allocated to the "pools" of Affiliate key employees under the terms of the plans, where distribution has not yet been approved by the Remuneration Committee, is not recognized until the required service has been performed and the award is communicated to the individual.
We operate longer-term profit-interest plans whereby certain Affiliate key employees are granted (or have a right to purchase) awards representing a profit interests in their respective Affiliate, as distinct from an equity interest due to the lack of pari passu voting rights. Under these plans, we may award a portion of the aforementioned variable compensation arrangement through issuance of a profit interests in the Affiliate. The awards generally have a three to five year vesting period from the grant
109
date, and the service period commences at the commencement of the financial period to which the variable compensation relates. Under these plans, Affiliate key employees are eligible to share in the profits of their respective affiliates based on their respective percentage interest held.
In addition, under certain circumstances Affiliate key employees are eligible to receive a series of repurchase payments upon exiting the plans based on a multiple of the last twelve months profits of their respective Affiliate, as defined. Profits allocated and movements in the potential repurchase value, determined based on a fixed multiple times trailing twelve month profits, as defined, are recognized as compensation expense. Profit interests compensation liabilities are re-measured at each reporting date at the current trailing twelve month earnings multiple, with movements treated as compensation expense in our consolidated statements of operations.
Share-Based Compensation Plans
We recognize the cost of all share-based payments to directors, senior management and employees, including grants of restricted stock and stock options of our Parent and Affiliates, as compensation expense in our consolidated statements of operations over the respective vesting periods.
Awards made under our Parent's restricted stock and stock options plans are accounted for as equity settled, and the grant date fair value is recognized as compensation expense over the requisite service period, with a corresponding contribution to capital recorded. Options granted are measured at fair value using a standard option pricing valuation model. The valuation is consistent with generally accepted valuation methodologies for pricing financial instruments and incorporates all factors and assumptions that knowledgeable, willing market participants would consider in setting the price of the options.
Awards of equity made to Affiliate key employees are accounted for as cash settled, with the fair value recognized as compensation expense over the requisite service period, with a corresponding liability carried within other long-term liabilities on the consolidated balance sheet until the award is settled by us. The fair value of the liability is based on the expected cash to be paid, as determined according to trailing twelve months earnings multiples prescribed by each arrangement. The liability is revalued at each reporting period, with any movements recorded within compensation expense.
Deferred Offering Costs
We capitalize certain legal, accounting and other third-party fees that are directly associated with in-process equity financings as other assets until such financings are consummated. After consummation of the equity financing, these costs are recorded in total equity as a reduction of Parent equity (deficit) generated as a result of this offering. At the time in which the equity financing is no longer considered probable of being consummated, the deferred financing costs are expensed immediately as a charge to operating expenses in our consolidated statements of operations.
Income Taxes
We use the asset and liability method of accounting for income taxes on a "separate return" basis. Under this method, a subsidiary is assumed to file a separate return with the taxing authority, thereby reporting its taxable income or loss and paying the applicable tax to or receiving the appropriate refund from the parent. The rules followed by the subsidiary in computing its tax or refund should be the same as those followed by a taxpayer filing directly with the taxing authority.
We file tax returns directly with the U.S. and state tax authorities and, therefore, the computations under the separate return method follow our filings.
Deferred income taxes are recognized for the effects of temporary differences between the tax basis of an asset or liability and its reported amount in our Consolidated Financial Statements. Deferred tax assets and liabilities are measured using enacted tax rates expected to apply to taxable
110
income in the years in which those temporary differences are expected to be recovered or settled. The effect of a change in tax rates on deferred tax assets and liabilities is recognized in income in the period that includes the enactment date. Our deferred tax assets have been attributable to federal and state loss carry forwards, interest deductions, and accrued liabilities. Deferred tax liabilities have been attributable to undistributed earnings of subsidiaries.
Deferred income tax assets are subject to a valuation allowance if, in management's opinion, it is not more-likely-than-not that these benefits will be realized. In evaluating our ability to recover deferred tax assets, we consider all available positive and negative evidence including its past operating results, the existence of cumulative earnings or losses in the most recent years and its forecast of future taxable income. In estimating future taxable income, we develop assumptions including the amount of future pre-tax operating income and the reversal of temporary differences. These assumptions require significant judgment about the forecasts of future taxable income and are consistent with the plans and estimates we are using to manage the underlying businesses.
A tax benefit should only be recognized if it is more likely than not that the position will be sustained based on its technical merits. We recognize the financial statement benefit of a tax position only after considering the probability that a tax authority would uphold the position in an examination. For tax positions meeting a "more-likely-than-not" threshold, the amount recognized in the financial statements is the largest amount of benefit greater than 50% likely of being sustained. The more-likely-than-not threshold must continue to be met in each reporting period to support continued recognition of the benefit. Unrecognized tax benefits and related interest and penalties, are adjusted periodically to reflect changing facts and circumstances. Our accounting policy is to classify interest and related charges as a component of income tax expense.
Non-Controlling Interests
For entities that are consolidated, but not 100% owned, we report non-controlling interests as equity, separate from our Parent's equity, on our consolidated balance sheets. Our consolidated net income on our consolidated statements of operations includes the income (loss) attributable to non-controlling interest holders of our consolidated Affiliates and Funds. Non-controlling interests in consolidated Affiliates on our consolidated balance sheets include undistributed income owned by the key employees of the consolidated Affiliates.
Other Comprehensive Income (Loss)
Other comprehensive income (loss) is defined as the change in equity of a business enterprise during a period from transactions and other events and circumstances, excluding those resulting from investments by and distributions to owners. For our purposes, comprehensive income (loss) represents net income/loss, as presented in our consolidated statements of operations, adjusted for net foreign currency translation adjustments.
Restructuring Costs
A liability for restructuring is recognized only after our management has developed a formal plan, approved by our Board of Directors, to which it has committed. The costs included in a restructuring liability are those costs that are either incremental or incurred as a direct result of the plan, or are the result of a continuing contractual obligation with no continuing economic benefit to us, or a penalty incurred to cancel the contractual obligation.
Impact of New Accounting Standards
For a discussion of the impact that new accounting standards may have on our results of operations, please refer to the "Recent Accounting Developments" section of Note 2, "Significant Accounting Policies" of our Consolidated Financial Statements.
111
We present economic net income, or ENI, to help us describe our operating and financial performance. ENI is the key measure our management uses to evaluate the financial performance of, and make operational decisions for, our business. ENI is not audited, and is not a substitute for net income or other performance measures that are derived in accordance with U.S. GAAP. Furthermore, our calculation of ENI may differ from similarly titled measures provided by other companies. Please refer to "Management's Discussion and Analysis of Financial Condition and Results of Operations—Non-GAAP Supplemental Performance Measure—Economic Net Income" for a more thorough discussion of ENI and a reconciliation of ENI to U.S. GAAP net income.
Overview
We are a global, diversified, multi-boutique asset management company with approximately $214.9 billion of assets under management as of June 30, 2014. We currently operate our business through seven boutique asset management firms, which we refer to in this prospectus as our Affiliates. We are currently a wholly-owned indirect subsidiary of Old Mutual plc, an international investment, savings, insurance and banking group established in 1845.
Our business model combines the investment talent, entrepreneurialism, focus and creativity of leading asset management boutiques with the resources and capabilities of a larger firm. We have a permanent partnership structure with our Affiliates that preserves the unique culture that has made each of them successful and provides them with investment and day-to-day operational autonomy. We ensure that key management professionals at each Affiliate retain meaningful levels of equity in their own businesses to maintain strong alignment of interests between us, our Affiliates, their clients, and our shareholders. Our approach to investing in Affiliates includes a profit-sharing arrangement to provide incentives for growth and prudent business management across multiple generations of Affiliate partners.
We have broad and deep experience in working with boutique asset managers, and we leverage the expertise and resources within our organization to engage actively with our Affiliates and provide them with capabilities generally unavailable to specialist asset management firms. We work with Affiliates to identify and execute upon growth opportunities for their businesses in areas such as business line expansion and product development, as well as activities critical to the operational success of investment boutiques, including talent management, risk management and compliance support. Our Company-led Global Distribution team complements and enhances the distribution capabilities of our Affiliates. Furthermore, our collaboration with our Affiliates extends to the commitment of seed and co-investment capital to launch new products and investment capital to financially support new growth initiatives. Our business development professionals, all of whom have prior experience executing M&A transactions for asset managers, facilitate growth opportunities for both us and individual Affiliates by sourcing and structuring investments in new Affiliates as well as add-on acquisitions on behalf of existing Affiliates.
112
Currently, our business comprises interests in the following Affiliates:

Our diversification, by Affiliate, asset class, geography and investment strategy, enhances relative earnings stability and provides multiple sources of growth for us. Collectively, our Affiliates offer approximately 100 distinct, active investment strategies in U.S., global, international and emerging markets equities, U.S. and emerging markets fixed income, and alternative investments, including timber and real estate. In addition, there is significant diversification within each of our Affiliate firms through the breadth of their respective investment capabilities. We believe our Affiliates have generated strong absolute and relative performance records. As of June 30, 2014, the percentage of our revenue represented by AUM outperforming their investment benchmarks on a one-, three-, and five-year basis was 70%, 73% and 75%, respectively. As a result, our Affiliates have attracted significant net client cash flows in recent periods, aggregating $6.9 billion in positive flows for the twelve months ended June 30, 2014, representing approximately 4% of beginning-of-period AUM.
Through our Affiliates, we serve a diverse investor base in the institutional and sub-advisory channels in the U.S. and around the world. These client segments are highly sophisticated, value the stability and equity ownership of our Affiliates, and typically reward our Affiliates' strong process-driven investment performance with long-term relationships and asset flows. These segments also increasingly provide access to the growing retail and defined-contribution marketplace as decision-makers take a more institutional approach to choosing asset management providers. Our Affiliates currently manage assets for non-U.S. clients in 28 countries, including Australia, Canada, Ireland, Japan, the Netherlands, South Africa, South Korea, Switzerland, and the United Kingdom. Our Company-led Global Distribution platform, launched in 2012, has contributed to the increase of our non-U.S. assets under management. As a result of this effort, we have raised approximately $6.7 billion of new client assets for our current seven Affiliates from the start of 2013 through June 30, 2014.
Net inflows and positive investment performance, in conjunction with the successful execution of our business strategy, have led to growth in revenues and net income. We measure financial
113
performance primarily through ENI, a non-GAAP measure that we believe better reflects our underlying economic performance and returns to shareholders. Our ENI revenues from 2011 through 2013 grew from $435.7 million to $528.0 million, for a CAGR of 10.1%. Over this period, our pre-tax ENI grew from $124.3 million to $153.0 million, representing a CAGR of 10.9%. Our U.S. GAAP revenues from continuing operations attributable to controlling interests from 2011 through 2013 grew from $424.6 million to $519.8 million, representing a CAGR of 10.6%. Our U.S. GAAP pre-tax income from continuing operations attributable to controlling interests increased from $22.0 million to $32.7 million, a CAGR of 21.9%.
Total AUM: $214.9bn
Data as of June 30, 2014
Competitive Strengths
We believe our success as a multi-boutique asset management company is driven by the following competitive strengths:
Well-Established, Diverse Affiliates. Through our seven Affiliates, we are well-diversified by brand, strategy and asset class, providing multiple sources of revenue and growth opportunities for our business across global market cycles, while limiting downside risk. Each Affiliate has its own brand and investment processes and generally operates in distinct asset classes. Our assets under management across Affiliates are invested in both U.S. and global/non-U.S. equities (approximately 40% and 38%, respectively) as well as fixed income and alternative assets. We are also well-diversified by investment strategy within each asset class, with approximately 100 distinct investment strategy composites. The breadth of our investment capabilities and distinct brand identities appeal to a wide range of clients. We have a well-diversified client base with low levels of client concentration. Our business serves over 600 institutional and sub-advisory clients, with our top 25 client relationships representing approximately 35% of run rate ENI management fee revenue, including our equity-accounted Affiliates, as of June 30, 2014. Total run rate ENI management fee revenue reflects the sum for each account at each of our seven Affiliates, of the product of (a) assets under management in each account at June 30, 2014, multiplied by (b) the relevant management fee rate on that account. This calculation includes the management fees paid by consolidated Funds, as well as all accounts at each of our equity-accounted Affiliates.
Differentiated Multi-Boutique Model Drives Growth. Our business is differentiated among multi-boutique asset management firms by our focus on active engagement with our Affiliates to enhance their organic growth potential. We have a two-pronged approach for successfully collaborating with our Affiliate firms. First, we align our interests with those of our Affiliates by providing Affiliate partners with equity in their own firms and through a profit-sharing structure that sets bonuses as a percentage of pre-bonus profit. This structure gives our Affiliate partners meaningful wealth creation opportunities
114
through equity ownership and encourages investments in long-term growth while maintaining an appropriate focus on profitability, efficient capital management and risk control. Second, we offer our Affiliates strategic and financial support to grow and enhance their businesses. Strategic guidance includes helping Affiliates to expand into new products, strategies, geographies or channels, including through lift-outs of new investment teams or the acquisition of add-on businesses, as well as seed and co-investment capital to help launch new investment strategies. In addition, our Company-led Global Distribution team complements and enhances the distribution capabilities of our Affiliates. We also help Affiliates with talent management, risk management and compliance support, as well as other shared services. Utilizing our strategic capabilities enables our Affiliates to capitalize on growth opportunities while maintaining their focus on delivering superior investment performance, innovative offerings, and excellent service to their clients.
Track Record of Consistent Investment Performance Across Market Cycles. Our Affiliates have produced strong long-term investment performance across their product offerings, generating consistent outperformance relative to benchmarks. Through June 30, 2014, 79 of our Affiliates' 88 strategies which have performance benchmarks have outperformed their relevant benchmarks since inception. These strategies represent 97% of the total assets in the 88 strategies which have performance benchmarks. Investment performance is calculated on a gross basis, excluding the impact of management, administration, and performance fees. Based on our current average management fee rate, investment returns net of fees would be on average at least 34 bps lower than gross returns. For the rolling 10-year period ending June 30, 2014, approximately 99% of benchmarked assets have outperformed their relevant benchmarks. Our Affiliates' five largest benchmarked investment strategies, Barrow, Hanley, Mewhinney & Strauss (BHMS) Large Cap Value, Acadian Asset Management (AAM) Emerging Markets Equity, AAM Global Equity, BHMS Mid Cap Value Equity, and AAM All-Country World ex-U.S. have each outperformed their relevant benchmarks since inception by 1.4%, 3.1%, 2.0%, 1.4%, and 3.4%, respectively, on an annualized basis.
Attractive Financial Model. Our multi-boutique model generates strong, recurring free cash flow to our business that we can use for growth initiatives on behalf of existing Affiliates, investments in new Affiliates, or return to shareholders through dividends and stock repurchases. Our ENI revenue has grown 8.1% annually since 2009. Moreover, our ENI revenue growth since 2011 has accelerated to 10.1% annually as net client cash flows generated positive annualized increases in revenue in seven of the eight fiscal quarters in 2012 and 2013. Our revenue consists largely of recurring management fees on assets under management and is not heavily dependent upon more volatile performance fees. We earn an attractive margin on revenue enhanced by our profit-sharing model that enables us to participate directly in margin expansion as our Affiliates grow. Accordingly, from 2011 to 2013, our pre-tax ENI operating margin before Affiliate key employee distributions grew from 32% to 34%. Our comparable pre-tax U.S. GAAP controlling interests operating margin grew from 5% to 6% from 2011 to 2013.
Experienced Multi-Boutique Management Team. The members of our senior management team have significant experience in the asset management industry, with a particular focus on managing multi-boutique businesses. With an average industry tenure of approximately 24 years, each of our senior executives brings a deep understanding of how to structure and maintain relationships that provide Affiliate firms with the proper incentives and resources to continue to generate strong growth. In 2011, our senior management team took over a business that generated $112.3 million of pre-tax ENI (including discontinued operations). The team led a significant restructuring of the Company that resulted in a 36% increase in pre-tax ENI to $153.0 million in 2013, while significantly improving net client cash flows and pre-tax margins.
Strong Growth Prospects from New Affiliate Partnerships. We have established a reputation as a collaborative and supportive partner to our Affiliates and seek to partner with additional high quality
115
managers who provide scalable institutional quality investment capabilities in asset classes in which we seek an enhanced presence. While our most recent acquisition occurred in 2010, we have a strong pipeline of potential opportunities generated from our long-standing relationships across the industry, our internal prospecting activities, and our relationships with intermediaries. We have a well-defined set of criteria for executing investments in new Affiliates and believe we can enhance growth and diversify risk across our business by selectively expanding our portfolio of investment boutiques. We believe our business model is attractive to the owners of boutique asset management firms, as it provides them an opportunity to realize a portion of the value they have created, while maximizing the value of their retained equity by accelerating the growth of their businesses alongside an experienced and supportive partner.
Business Strategy
Our future growth and success will be driven by the following four core strategies:
Continue to Execute on Our Differentiated Multi-Boutique Model. The cornerstone of our multi-boutique model is to combine the investment talent, entrepreneurialism, focus and creativity of leading asset management boutiques with the expertise and capital of a larger firm in areas where our resources can provide distinct advantages. We provide strategic capabilities to our Affiliates, enabling them to focus on delivering superior investment performance, innovative offerings, and excellent service to their clients. We strive to maintain and enhance the characteristics which have made our Affiliates market leaders in their areas of expertise, namely their cultures, investment processes, incentive structures and brands. Our focus is working with a select group of diverse Affiliates with whom we can build scalable business platforms leveraging their core investment and distribution capabilities.
Drive Growth at our Existing Affiliates. We enhance the growth of our existing Affiliates by:
- •
- Aligning Incentives to Support Organic Growth: As a
permanent partner dedicated to providing our Affiliates with operational autonomy, our structure is designed to align our economic interests with those of our Affiliates to promote long-term
client-driven growth. Through retained Affiliate equity ownership and a profit-sharing partnership model, we ensure appropriate focus on key issues critical to the long-term success of each Affiliate,
particularly investment performance, client service, talent management and risk management.
- •
- Engaging in Collaborative Growth Initiatives: Our
collaboration with our Affiliates generally consists of strategic support across three primary activities. First, we leverage the broad industry experience of our senior management to evaluate,
structure, and support Affiliate growth opportunities, including expansion into new products and strategies, geographies and channels. Second, we provide seed and co-investment capital to help launch
new products. Finally, we provide selective shared services which leverage our scale across the Affiliate base or provide distinctive strategic operational expertise to our Affiliates.
- •
- Delivering Complementary Global Distribution Capabilities to Broaden Reach: Our Affiliates are recognized for their long-term investment performance and high quality client service, and have strong client and consultant relationships in their core institutional marketplaces. However, there are certain areas of distribution outside of their core markets that are more scale-oriented or specialized in nature. To assist our Affiliates in penetrating these markets, we offer a range of distribution capabilities in a transparent, opt-in partnership-based model that is supported by an experienced sales team focused on cultivating broad and deep relationships within the U.S. sub-advised, defined contribution and variable annuity channels and non-U.S. institutional markets.
Invest in New Affiliates. We will selectively pursue partnerships with additional boutique asset managers that can enhance our growth potential and diversify our earnings drivers. Our partnership strategy
116
targets asset classes that complement our existing Affiliates' capabilities or provide additional expertise in capacity-constrained investment strategies. Within each asset class, we seek to partner with market leaders that have track records of operating as successful, stand-alone enterprises. We target profitable and growing businesses that have the potential to build a meaningful global presence in a given asset class. Asset class attractiveness, operating scale, and depth of talent are prerequisites to partnership. However, cultural fit and a shared strategic vision ultimately provide the foundation for a successful relationship.
Strategically Manage Capital. Our asset management business generates significant, recurring free cash flow that can be re-invested in the growth-oriented strategies described above to create value for our shareholders. Strategic and efficient management of our Company's capital underpins our approach to investing in these strategies. In particular, we believe we can generate strong returns on allocated capital by (i) providing seed capital to fund new products and strategies; (ii) committing co-investment capital to launch new fund partnerships in which our Affiliates act as the general partner; (iii) providing investment capital to support organic growth; and (iv) investing in new Affiliates. Management undertakes detailed business case analyses with respect to all investment opportunities, and only considers those that yield an acceptable return while operating within the parameters of our risk appetite.
Multi-Boutique Operating Model
Overview
We manage our business through seven Affiliates, each of which operates autonomously and employs its own distinct investment processes. We work with our Affiliates to identify and execute upon growth opportunities in areas such as distribution, business line expansion and product development, as well as in activities critical to the success and stability of boutique asset managers, including talent management, risk management and compliance support. Our collaboration with our Affiliates extends to the commitment of seed and co-investment capital to launch new products and investment capital to financially support new growth initiatives. We also provide focused shared service support in areas our Affiliates desire. We align incentives with our Affiliates through our permanent partnership structure, which provides employee partners of our Affiliates with equity in their respective firms through an equity recycling program, and participation in established profit-sharing arrangements.
Holding Company Management Team
Since 2011, when a number of key executives joined OMUSH, including our CEO and CFO, our senior management team has defined a core set of operating principles and repositioned our business around them. As a result, we refocused our business strategy on market-leading, institutionally-driven, active investment management, which led to a rationalization of our Affiliate base. In addition, our senior management realigned our structure to focus on supporting our Affiliates in areas where we believe we can provide the greatest benefit, particularly collaborative growth initiatives, talent management and shared services. Our team also developed and launched our Global Distribution platform to expand our Affiliates' marketing reach into specialty U.S. distribution channels and non-U.S. markets. Additionally, our management team has led the Reorganization to prepare for this offering as a stand-alone company.
Affiliate Partnership Model
We are a permanent partner dedicated to providing our Affiliates with operational autonomy in a structure that aligns our common economic interests. By offering Affiliate management direct participation in the growth and profitability of their businesses through equity ownership and a profit-
117
share-based bonus pool, we provide our Affiliates with a strong incentive to manage their businesses for the long-term, investing with us to build equity value over time.
- •
- Affiliate Operating Autonomy. Affiliates retain
day-to-day operating autonomy over their businesses, including decisions related to hiring, compensation, investment processes, product distribution and branding. We retain oversight through Affiliate
board representation, remuneration committee participation, and certain approval rights, including approval of each Affiliate's annual business plan.
- •
- Affiliate Partners Have Retained Equity in their Own
Firms. Partners in each of our Affiliates own meaningful equity positions in their respective businesses. Among our consolidated
Affiliates, their equity stakes range from approximately 15% to 35%, in some cases following a distribution preference to OMUSH. Affiliate equity, which in certain cases may be put back to us over
time at a fixed multiple of trailing earnings, subject to limits, allows partners to benefit from long-term increases in their franchise value. We will facilitate the recycling of Affiliate equity
back to the next generation of Affiliate partners at the same multiple so that the impact to us is generally cash-neutral.
- •
- Profit-Share Economics. Rather than invest in a fixed percentage of Affiliate revenues (a "revenue-share" model), Affiliate partners and we each invest in the underlying profits of their respective businesses, a model we refer to as a "profit-share" model (with the exception of ICM, which has a revenue-share model). ICM's revenue share model is a legacy economic arrangement that has not been restructured. Distributions of profit to the Affiliate equity-holders are based on their proportionate ownership of their businesses, in some cases following a preferred return to us. In addition, bonus pools for Affiliates are typically contractually set at 25% to 30% of Affiliate pre-bonus profit. This enables us to participate in the margin increases of our Affiliates, while incentivizing Affiliate management and us to jointly support growth initiatives. For additional information on our profit-sharing model, see "Management's Discussion and Analysis of Financial Condition and Results of Operation—The Economics of Our Business."
Collaborative Growth Initiatives
Our business is differentiated from other multi-boutique asset management companies by our focus on active engagement with our Affiliates to enhance their organic growth potential. Our collaboration with Affiliates generally consists of the following:
- •
- Strategic Affiliate Growth Opportunities. While many of our growth initiatives originate within our Affiliates, we play an active role in analyzing the attractiveness and viability of the potential growth strategy, formulating a plan of execution and developing an economic structure to appropriately share risk and reward between us and Affiliate equity-holders.
Over the last 24 months, we have worked with several of our Affiliates on various strategic growth initiatives. In one instance, we worked with Campbell Global, our timber manager, to accelerate its strategic plan to expand into global markets. As a first step, we provided a co-investment to support Campbell Global's fully financed bid on behalf of its clients to acquire a sizeable asset outside the U.S., resulting in the successful conclusion of a strategic transaction. We then worked together to develop a framework for further international expansion of the business, including evaluating complementary acquisition opportunities, assisting in the process of hiring additional non-U.S. investment professionals and collaborating on the marketing of a global timber fund through our Global Distribution team. These efforts have strengthened the positioning of the business in its global market.
118
- •
- Seed Capital. As of June 30, 2014, we have approximately $150 million committed to seed capital in 16 products across eight different asset classes. Our Affiliates' use of seed capital generally falls into two categories: incubation capital and scale capital. Incubation capital is used to establish a track record for a new investment strategy. These new strategies generally take three to five years to season to the point where they are recommended by consultants or become attractive for clients. Alternatively, scale capital is used to extend a product with an established track record into a co-mingled fund, and is generally outstanding for a shorter period of time. Scale capital allows third-party clients to invest in the new fund without individually representing too substantial a percentage of the vehicle. Approximately $14 billion of our current AUM are in products which have been seeded by us since 2004, and our seeding program has generated an annualized internal rate of return to OMUSH and our Parent of approximately 24% over this period, including investment returns on the seeded products and the incremental value generated by third party assets raised, including annual profits and a terminal value.
Separately, we supported two strategic initiatives with Barrow Hanley to broaden its already diverse product set. First, we provided incremental support to expand operations for Barrow Hanley's fixed income product suite. This initiative continues today as we collaboratively explore opportunities to expand the business either through acquisitions or in-house development. Second, we supported the build-out and launch of a dedicated emerging markets equity strategy, which drew from the firm's current capabilities but also required additional staff. We worked with the firm to research the scope of the opportunity, provide seed capital to establish a marketable track record and develop a framework to support the team as their newly launched product develops.
- •
- Co-Investment Capital. We also provide co-investment capital to support the formation of closed-end, long-term partnerships managed by our Affiliates. These fixed-life partnerships typically require us and/or the Affiliate to invest 1% to 3% of the product's capital to align its interest with those of their clients. Of our current $62 million portfolio of co-investments at fair value, 69% is managed by Heitman (investing in real estate) and 31% is managed by Campbell Global (investing in timber). In consideration for providing co-investment capital, which is typically illiquid for approximately seven to ten years, we receive returns on our underlying partnership investment, our proportionate share of profits on assets in the fund, and the potential for fund incentive fee allocations. In connection with this offering, we will enter into an arrangement with OMGUK to provide it with the economic benefits related to the return of capital and incentive fee allocations with respect to specified co-investments currently held on our balance sheet. See "Certain Relationships and Related Party Transactions—Relationship with Our Parent and OMGUK Following This Offering—Co-Investment Arrangement" for further discussion. We will fund any new co-investment commitments we may make in the future.
We expect to maintain our seed portfolio at approximately $150 to $175 million to support product development on an ongoing basis. As part of our transition to a publicly-owned company, our Parent has agreed to provide access to existing seed capital through January 15, 2018. Thereafter, we will fund our own seed investments. See "Certain Relationships and Related Party Transactions—Relationship with Our Parent and OMGUK Following This Offering—Seed Capital Management Agreement" for further discussion regarding seed capital.
Global Distribution Platform
While our Affiliates have strong client and consultant relationships in their core institutional marketplaces, there are certain areas of distribution outside of their core markets that are more scale-oriented or specialized. To assist our Affiliates in penetrating these markets, we offer a range of distribution capabilities in an opt-in partnership-based model that is supported by an experienced sales
119
team focused on building client relationships by geography and client segment. See "—Distribution Model and Client Base" for further discussion of our Company-led Global Distribution platform.
Strategic Business Support
While each of our Affiliates operates on an autonomous basis, we seek opportunities to increase efficiency and promote the long-term stability of their respective businesses by offering strategic support.
- •
- Talent Management. We are highly focused on talent
management and have significant experience collaborating with Affiliates to develop talent, design incentive structures, promote continued Affiliate equity ownership and establish succession plans. A
key area of focus is senior management succession planning. While this is an infrequent occurrence at each Affiliate, it represents a key point of vulnerability and opportunity that is highly
scrutinized by both clients and employees. Our objectivity and experience as an external partner has been instrumental in managing through the challenges of a number of successful succession processes
at our Affiliates.
- •
- Risk Management and Compliance Support. Our Affiliates
maintain comprehensive risk management and compliance functions, supplemented by our own, Company-based risk management and compliance teams. Our dedicated risk, legal and compliance teams work
through a well-established reporting and communication structure to constantly assess risk in the context of the execution of our and our Affiliates' business strategies. We also provide a centralized
internal audit function. We view risk management as a continuous part of the management process and have created a consistent, holistic program to identify, assess, communicate and monitor risk
throughout our organization.
- •
- Shared Services. We offer shared services to our Affiliates in areas such as operational support, human resources, payroll and benefits administration, finance and accounting, information technology outsourcing and security, eBusiness support, and risk management systems. Affiliate participation in these services is optional; however, all of our Affiliates currently participate in one or more of our shared services. The shared services we provide generally are charged back to Affiliates on a cost-basis.
Overview of Affiliates
Our seven Affiliates are listed below in alphabetical order.
Acadian Asset Management ($71.0bn in AUM as of June 30, 2014), founded in 1986, is a leading quantitatively-oriented manager of active global and international equity, fixed income and alternative strategies. The firm pursues a fundamentally-based, data rich and highly structured process to investing that seeks to identify and exploit systematic and structural inefficiencies in the markets. Acadian employs a multi-faceted, proprietary analytic approach that applies a range of investment and risk considerations to a universe of over 40,000 securities taken from 60 global markets. Strategies managed include global, international and emerging markets equities, long/short strategies, managed volatility and fixed income strategies. Its flagship Emerging Markets Equity strategy has outperformed its benchmark, MSCI Emerging Markets (Net), by 3.1% on an annualized basis since its inception in 1994 through June 30, 2014.
Acadian invests on behalf of a wide range of institutional clients across the globe, including public and private funds, endowments and foundations, and retail clients through sub-advisory channels. The firm's clients are domiciled in over 25 countries across Asia, the Middle East, Europe and North America. Acadian's management team is led by Chief Executive Officer Churchill Franklin and Chief
120
Investment Officer John Chisholm. The firm has 72 investment and research professionals and manages over 40 distinct investment strategies.
Barrow, Hanley, Mewhinney & Strauss ($97.5bn in AUM as of June 30, 2014), founded in 1979, has an outstanding long-term track record of providing its clients with superior performance and client service in a wide range of value-oriented investment strategies. The firm applies a strict definition of value that guides all of its investment decisions, as it employs disciplined, bottom-up analysis to construct value equity portfolios of U.S., non-U.S., global and emerging market securities that exhibit below-market price-to-earnings ratios, below-market price-to-book ratios, and above-market dividend yields, regardless of market conditions. The firm's value-oriented fixed income portfolios seek to achieve higher total returns with below-benchmark volatility by identifying temporarily mispriced securities with yield-to-maturity advantages over Treasury bonds of comparable maturity. Barrow Hanley's flagship large cap value equity product, which had over $56 billion of assets at June 30, 2014, has a 30-year track record.
Barrow Hanley has a diverse and longstanding clientele; the average tenure of its client base is almost 10 years, and more than one-third of its assets are from clients who have maintained their relationships with Barrow Hanley for more than 20 years. In addition to direct relationships with institutional investors, the firm serves as the sub-advisor to more than 30 highly regarded mutual funds, and is one of five external sub-advisors managing the $50 billion Vanguard Windsor II Fund. The firm is led by Chief Executive Officer J. Ray Nixon, Jr. and a team of 17 Managing Directors specializing in multiple asset classes. The firm has 33 investment professionals managing 23 distinct strategy composites.
Campbell Global ($6.7bn in AUM as of June 30, 2014), founded in 1981, brings more than three decades of experience and leadership to sustainable timberland and natural resource investment management. As a full-service firm, it acquires and manages timberland for investors, while providing high quality service and expert management. The firm delivers superior investment performance by focusing on unique acquisition opportunities, client objectives, and disciplined management. Campbell Global currently manages more than 3.1 million acres (1.3 million hectares) worldwide.
Campbell Global has a diversified institutional client base that includes corporations, governments and endowments. As of June 30, 2014 the firm employed over 280 individuals across the U.S. and Australia, and provides its clients with an integrated, full-service approach to timberland investment through its broad expertise in sourcing and executing timberland acquisitions, as well as asset management and disposition. Campbell Global's management team is led by Chief Executive Officer and Chairman John Gilleland. The firm has 28 investment professionals managing its investment portfolio.
Copper Rock Capital Partners ($2.5bn in AUM as of June 30, 2014), founded in 2005, offers specialized, growth equity investment management focused on small and small/mid-capitalization strategies in international, global and emerging markets growth equities. Copper Rock's investment strategy seeks to outperform in up-markets due to the firm's pure fundamental growth approach and also to protect clients' capital through portfolio construction and a strong sell discipline.
Copper Rock's client base includes pension plans, institutional investors and mutual funds located in the U.S., Canada, the United Kingdom, Ireland, Denmark, South Africa and Australia. Copper Rock's management team is led by the firm's Chairman and Chief Investment Officer Steve Dexter and Chief Executive Officer Mike Forrester. The firm has seven investment professionals managing four distinct investment strategies.
Heitman* ($24.6bn in AUM as of June 30, 2014), founded in 1966, globally invests in and manages portfolios of real estate and real estate securities for its clients, which include public and corporate pension funds, endowments and foundations, and private investors. Heitman has substantial experience
121
investing in and managing portfolios of real estate assets across the globe and has been an active real estate market participant over multiple economic and property cycles. Heitman's investment acumen is centered in the three primary segments of the global real estate property and capital markets: private real estate equity, public real estate securities and real estate debt. The firm's private real estate equity investments focus on core, value-added and opportunistic investment strategies. Heitman's public real estate securities operations have continuously managed North American real estate securities portfolios since 1989, and managed global real estate securities portfolios for its clients since 2007. The firm's team of real estate debt investment and asset management specialists provide superior insight and strategic investment expertise in structuring and managing senior and mezzanine debt investment opportunities.
Regardless of market segment, Heitman constructs portfolios to achieve or exceed targeted results for its clients while prudently managing the underlying level of risk to maximize the probability of achieving the desired risk-adjusted outcome. All of its strategies are offered to a wide variety of investors in either a separate account or commingled fund format. The firm's clients are supported by 24 professionals situated around the globe whose sole responsibilities are dedicated to client service and marketing. With headquarters in Chicago and eleven other offices worldwide, Heitman's investment teams are based on the ground in the key global markets, providing its investment professionals with a deep understanding of the local and regional real estate dynamics needed to implement its strategies.
The firm's management team is led by its Chief Executive Officer, Maury Tognarelli. Jerry Claeys III serves as Heitman's non-executive Chairman. As of June 30, 2014, Heitman had 12 private equity portfolio managers overseeing eight commingled funds and 14 separate accounts with varying investment strategies. The firm also has three public securities portfolio managers overseeing five investment strategies and two real estate debt portfolio managers overseeing two investment strategies.
Investment Counselors of Maryland* ($2.4bn in AUM as of June 30, 2014), founded in 1972, focuses on value-driven equities and invests through a well-established, bottom-up investment process that it applies across the entire capitalization range, with an emphasis on small- and mid-cap companies. The firm employs a team orientation in making investment decisions. Each member of ICM's investment team has a sector focus and is responsible for generating and analyzing ideas within his sector. The most promising investment ideas are reviewed by the entire team, and the ultimate buy/sell decisions are made by the respective portfolio management teams.
ICM has been managing assets for over four decades for institutional clients and high net worth individuals through separate accounts and an institutional mutual fund, and has generated excellent results for its clients over this time. ICM's management team is led by Managing Partner and Chief Investment Officer, William V. Heaphy. The firm has ten investment professionals managing four distinct investment strategies.
Thompson, Siegel & Walmsley ($10.2bn in AUM as of June 30, 2014), founded in 1969, applies a value-oriented investment approach across a range of products in U.S. and international equities, fixed income and alternative investments. TS&W's singular investment objective is to outperform its benchmarks, net of fees, over rolling three- to five-year periods. TS&W employs a proprietary screening process to generate focused lists of companies that are most attractive within different market capitalization ranges. The firm's 21 investment professionals then use fundamental analysis to construct portfolios, which they believe possess catalysts that can unlock value.
TS&W has a diverse client base that includes corporations, public pensions, high-net-worth families and individuals, and sub-advisory clients through seven distinct investment platforms and has generated a strong track record of providing investors with excellent long-term results. The firm's management team is led by Co-Chief Executive Officers Lawrence Gibson and Horace Whitworth and Chief Investment Officer Frank Reichel. The firm has 21 investment professionals managing 13 investment strategy composites.
- *
- Accounted for under the equity method of accounting.
122
Distribution Model and Client Base
Our distribution is focused on the institutional and sub-advisory channels, reached through both Affiliate-led and complementary, Company-led sales efforts. Our Affiliates have teams of established sales and client service professionals with broad and deep relationships across the major segments of the institutional investor community. Consistent with our partnership philosophy, Affiliates develop and maintain client relationships independently of both us and each other, while maintaining the option to participate in Company-led complementary distribution initiatives in the domestic sub-advisory, defined contribution, and selected global markets. In aggregate, our Affiliates have approximately 150 sales and marketing professionals servicing over 600 institutional and sub-advisory clients.
Our Company-led Global Distribution platform was launched in 2012 and consists of a team of experienced channel and regional marketing specialists focused on developing new business opportunities for our Affiliates. In the U.S., complementing and enhancing the distribution capabilities of the Affiliates, we have four sales and marketing professionals focused on cultivating relationships in the sub-advisory (mutual fund and variable annuity) and defined contribution channels. We also maintain independent relationships with institutional investment consultants. If requested, our team also provides strategic marketing support for the Affiliates. Outside the U.S., where scale is a meaningful advantage to support geographic reach and servicing capabilities, we have a Global Distribution team consisting of ten dedicated and strategically deployed sales and marketing professionals focused on developing client relationships and gathering assets in Canada, the United Kingdom, continental Europe, Benelux, and the Nordics, Asia (excluding Japan) and the Middle East. Within these channels and jurisdictions, our objective is to cultivate broad and deep relationships with key consultants and institutional investors and to generate new client opportunities for those Affiliates who take advantage of our Global Distribution platform. From January 1, 2013 through June 30, 2014, we have raised approximately $6.7 billion in client assets for our current seven Affiliates. As a result of our Company-led Global Distribution platform, we expect our non-U.S. assets under management to increase.
The institutional channel accounts for 62% of our AUM. Within this channel, we have strong relationships in the public/government pension market (32% of our AUM) and the corporate plan market (20% of our AUM), which comprise a substantial portion of the institutional investment market overall, particularly in the U.S. Our institutional marketplace clients are highly diverse across segments and geographies and have various growth characteristics.
While our Affiliates market primarily to institutional investors, we participate in the individual investor market through the sub-advisory channel, which represents 34% of our AUM. Within this channel, we manage assets for mutual funds, giving us exposure to a retail investor base and the defined contribution market. We have approximately 60 sub-advisory mandates on 45 leading platforms, including Vanguard, American Beacon, Touchstone and Transamerica. Our top ten sub-advisory relationships account for approximately 30% of AUM and 16% of run rate ENI management fees, including equity-accounted Affiliates, and have an average tenure of over ten years. We have experienced rapid growth in this channel, with sub-advisory assets growing over 60%, or 15% annually, from December 31, 2010 through June 30, 2014.
Across our Affiliates, our client base is highly diverse with no significant concentration in our portfolio, though some Affiliates may have client exposures that are meaningful to their individual businesses. As of June 30, 2014, our Affiliates' top five client relationships represented 17% of total run rate ENI management fee revenue, including equity-accounted Affiliates, and our Affiliates' top 25 clients represented 35% of run rate ENI management fee revenue, including equity-accounted
123
Affiliates. Old Mutual plc and its subsidiaries (other than us and our Affiliates) contributed less than 2% of total ENI management fee revenue, including equity-accounted Affiliates.
| AUM ($bn) by Client Type | AUM ($bn) by Client Location | |
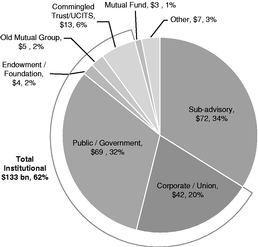
|
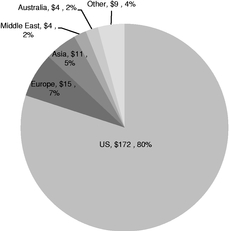
|
|
| Total AUM: $214.9bn | ||
Data as of June 30, 2014
Products and Investment Performance
Product Mix
Our Affiliates offer leading products in U.S., global, international and emerging markets equities, U.S. and emerging markets fixed income, and alternative investments, including timber and real estate.
The charts below present our average fee rates, assets under management, and ENI management fee revenue including equity-accounted Affiliates by asset class and illustrate the diversification benefits of our multi-boutique business model. Our largest asset class, U.S. large cap value equities, represents approximately 30% of our AUM as of June 30, 2014; however, with a weighted average fee rate of approximately 20 basis points, this asset class represents only 18% of our ENI management fee revenue, including equity-accounted Affiliates in 2013. Each of five asset classes represents approximately 15% of our ENI management fee revenue, including equity-accounted Affiliates, providing a balanced earnings stream to our business. Moreover, within our three largest asset classes by revenue—alternative investments, U.S. large cap value equities, and international equities—we offer a range of strategies which provide further stability to our earnings.
124
2013 weighted fee rate on average AUM*
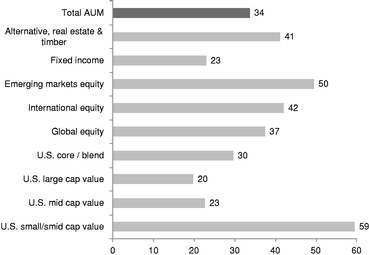
|
||
- *
- includes equity-accounted affliates
| Data as of December 31, 2013 | ||
AUM ($bn) Mix by Asset Class |
2013 ENI Management Fees ($m) Mix by Asset Class* |
|
|
|
|
* includes equity-accounted affliates |
||
Total AUM: $214.9bn |
Total Management Fees: $597m |
|
Data as of June 30, 2014 |
Data as of December 31, 2013 |
We have product breadth and diversity within individual Affiliates as well as across our Affiliates. For example, Barrow Hanley, whose core offerings consist of leading value-oriented U.S. equity strategies, also offers a highly-rated suite of non-U.S. equity and U.S. investment grade fixed income investment products that adhere to the firm's traditional value discipline. Similarly, Acadian applies its quantitative approach across a range of equities, in terms of geography as well as market capitalization.
Our Affiliates' product offerings are well-positioned in areas of investor demand, and the diversity of investment style and asset class enables us to participate in growing segments of the industry in multiple investing environments. The chart below illustrates the diversity of our assets under
125
management by asset class and Affiliate. In total, our Affiliates manage approximately 100 strategy composites, including four Affiliates that manage at least ten strategies each.
Investment Performance
While each of our Affiliates has distinct investment processes and generally operates in different asset classes, our unifying mission is to produce risk-adjusted performance, or alpha, for our clients. We measure alpha generation relative to the specific benchmarks our Affiliates' clients use to evaluate our performance in our Affiliates' strategies. Looking at this measure on a consolidated basis, our Affiliates have strong near- and long-term performance records and are well-positioned for continued growth.
In the chart below, which measures revenue-weighted performance relative to benchmarks over the last five years, we typically have had between 50% and 75% of our revenue derived from products performing ahead of their respective benchmarks on a one-, three- and five-year basis. In evaluating prospective investments, we believe institutional investors generally give the three-year performance of an investment product the greatest weighting. With 70% or more of our revenue driven by products outperforming benchmarks over the three-year period, we believe our Affiliates are well-positioned to meet their clients' performance objectives.
Data as of December 31, for the years 2010 to 2013 and June 30, for 2014.
126
In addition to analyzing our Affiliates' performance on a revenue-weighted basis, which gives us a perspective on product performance with respect to our Affiliates' existing client base, we also consider the number of our Affiliates' scale product strategies (defined as strategies with greater than $100 million of AUM) beating benchmarks. This latter measure, labeled as "equal-weighted", indicates the opportunity we have to generate sales in a variety of market environments. For instance, strong performance in a newer, smaller product such as small-cap emerging markets may not affect revenue-weighted performance, but it can have a meaningful effect on revenue growth given client demand for this higher fee product. The chart below indicates performance on a revenue-weighted and equal-weighted (by product) basis relative to benchmark, as at June 30, 2014. In addition, we have indicated the percentage of our assets beating their benchmarks over the same time periods. While we believe the first two methodologies provide better insight into our performance trends, we have also included AUM-weighted performance, as this is a more standard industry performance metric.
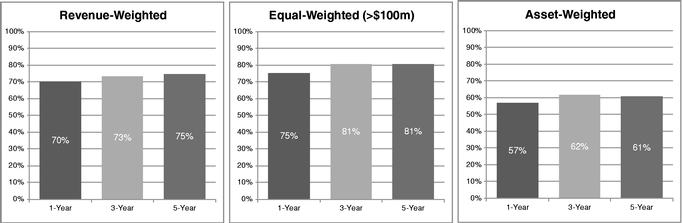
Data as of June 30, 2014
Competition
We and our Affiliates face competition from many segments in the asset management industry. At the Company level, we compete with other acquirers of investment management firms, including investment management holding companies, insurance companies, banks and private equity firms. Our Affiliates compete globally with international and domestic investment management firms, hedge funds and other subsidiaries of financial institutions for institutional assets.
Many of the organizations our Affiliates compete with offer investment strategies similar to those offered by our firms, and these organizations may have greater financial resources and distribution capabilities than we or our Affiliates are able to offer. Additionally, there are limited barriers to entry for new investment managers. Our Affiliates compete with these organizations to attract and retain institutional clients and their assets based on the following primary factors:
- •
- the investment performance records of our Affiliates' investment strategies;
- •
- the breadth of active investment strategies offered by our Affiliates in the asset classes in which they specialize;
- •
- the alignment of our Affiliates' investment strategies to the current market conditions and investment preferences of
potential clients;
- •
- the quality and reputation of the investment teams that execute the investment strategies at our Affiliates;
- •
- the strength of our Affiliates' and our distribution teams; and
- •
- the strength of our Affiliates' client service and long-term client relationships.
127
Business History
The predecessor of OMUSH was formed in 1980. In connection with this offering, OMUSH will be restructured as described in "Reorganization." As a part of that restructuring, OMAM was formed in May 2014 as a private limited company under the laws of England and Wales. Upon the consummation of the Reorganization, we will change our name to OM Asset Management plc and OMAM will be the indirect parent entity of OMUSH.
In 2011 and 2012, OMUSH appointed new members of senior management. The executive team undertook a strategic review and implemented a strategic repositioning of our business to focus on actively managed, alpha-generating institutional investment products. Pursuant to this assessment, during 2011 and 2012 we divested our interests in several former Affiliate firms, including the sale of stable-value manager Dwight Asset Management to Goldman Sachs Asset Management, and the exit from our former retail business, Old Mutual Capital, through the sale of selected mutual fund assets to Touchstone Investments. Each of Analytic Investors, Ashfield Capital Partners, Larch Lane Advisors, Lincluden Management Ltd, 300 North Capital and 2100 Xenon were sold to the management of the respective Affiliate. In early 2013, we outsourced the business of our Maryland trust company to a strategic partner, and, in the fourth quarter of 2013, we began to wind down the operations of Echo Point Investment Management. We substantially completed this process in the first quarter of 2014. In the second quarter of 2014, we transferred a former Affiliate, Rogge Global Partners plc, to a subsidiary of our Parent.
Employees
As of June 30, 2014, we had 1,115 full-time equivalent employees, of which 88 were employees of the Company and 1,027 were employees of our Affiliates. None of our employees or those of our Affiliates are subject to any collective bargaining agreements. We believe our relationships with our employees to be good and have not experienced interruptions to operations due to labor disagreements. We take great pride in our culture and our positive relationships with our employees.
Facilities
Our principal executive offices are located at 5th Floor, Millennium Bridge House, 2 Lambeth Hill, London EC4V 4GG, United Kingdom. Our principal office in the U.S. is located at 200 Clarendon Street, 53rd Floor, Boston, Massachusetts 02116. In Boston, we lease 37,946 square feet under a lease that expires on December 31, 2021. Each Affiliate has its own primary office where core investment management activities take place. Primary Affiliate-leased locations include Boston, MA; Chicago, IL; Dallas, TX; Baltimore, MD; Portland, OR; and Richmond, VA. In addition, both we and several of our Affiliates have leased secondary offices to help support research, distribution and/or client servicing. Key locations for secondary offices include (but are not limited to) Hong Kong, Singapore and Toronto. We believe existing facilities are appropriate in size, location and functionality to meet current and future business requirements.
Operations, Systems and Technology
We generally use both third-party commercial technology solutions and services to support investment management and operational activities, including functions such as portfolio management, trading, investment accounting, client reporting and financial reporting. Certain Affiliates have built proprietary systems to support the investment process where competitive advantages to do so exist. Systems and processes are customized as necessary to support our investment processes and operations. Information security, business continuity and data privacy programs have been implemented to help mitigate risks.
Legal Proceedings
From time to time, we and our Affiliates may be parties to various claims, suits and complaints in the ordinary course of our business. Although the amount of liability that may result from these matters cannot be ascertained, we do not currently believe that, in the aggregate, they will result in liabilities material to our consolidated financial condition, future results of operations or cash flow.
128
OMAM is a holding company for our Affiliates, each of which is subject to extensive regulation in the U.S. at the federal level and, to a lesser extent, the state level by virtue of operating in the financial services industry. Certain of our Affiliates also are subject to non-U.S. regulation. Under these laws and regulations, agencies that regulate investment advisers have broad administrative powers, including the power to limit, restrict or prohibit an investment adviser from carrying on its business in the event that it fails to comply with applicable laws and regulations. Possible sanctions that may be imposed include the suspension of individual employees, limitations on engaging in certain lines of business for specified periods of time, revocation of investment adviser and other registrations, censures and fines.
The legislative and regulatory environment in which we operate has undergone significant changes in the recent past. New laws or regulations, or changes in the enforcement of existing laws or regulations, applicable to our Affiliates and their clients may adversely affect our business. Our ability to function in this environment will depend on our ability to monitor and promptly react to legislative and regulatory changes. There have been a number of highly publicized regulatory inquiries that have focused on the investment management industry. These inquiries have resulted in increased scrutiny of the industry and new rules and regulations for investment managers. This regulatory scrutiny may limit our ability to engage in certain activities that might be beneficial to our shareholders.
In addition, as a result of recent market events, acts of serious fraud in the investment management industry, perceived lapses in regulatory oversight, future adverse market conditions or other reasons, U.S. and non-U.S. governmental and regulatory authorities may increase regulatory oversight of our business. We may be adversely affected as a result of new or revised legislation or regulations imposed by the SEC, the CFTC, other U.S. or non-U.S. regulatory authorities or self-regulatory organizations that supervise the financial markets. We also may be adversely affected by changes in the interpretation or enforcement of existing laws and rules by these governmental authorities and self-regulatory organizations, as well as by U.S. and non-U.S. courts. It is impossible to determine the extent of the impact of any new laws, regulations or initiatives that may be proposed on us or the markets in which our Affiliates trade, or whether any of the proposals will become law. Compliance with any new laws or regulations could add to our compliance burdens and costs and affect the manner in which we conduct our business.
Developments in the current regulatory environment may include heightened and additional examinations and inspections of our Affiliates by regulators. Regulators may also take a more aggressive posture on bringing enforcement proceedings.
SEC Investment Adviser Regulation
Each of our Affiliates is registered with the SEC as an investment adviser under the Advisers Act. The Advisers Act, together with the SEC's rules, regulations and interpretations thereunder, impose numerous substantive and material restrictions and requirements on the operations of investment advisers. The SEC is authorized to institute proceedings and impose sanctions for violations of the Advisers Act, ranging from penalties and censures to termination of an adviser's registration.
The Advisers Act imposes substantive regulation on virtually all aspects of our Affiliates' businesses and their relationships with their clients. As registered investment advisers, our Affiliates are subject to many requirements that cover, among other things, disclosure of information about their businesses to clients; maintenance of written policies and procedures; maintenance of extensive books and records; restrictions on the types of fees they may charge, including performance fees; requirements for participating in solicitation arrangements; restrictions when engaging in transactions with clients; maintenance of an effective compliance program; requirements imposed when taking custody of client assets; requirements for maintaining client privacy; restrictions when advertising; requirements when executing proxies on behalf of clients; as well as fiduciary obligations and
129
requirements to avoid certain prohibited activities. The SEC has authority to inspect any registered investment adviser and typically inspects a registered adviser periodically to determine whether the adviser is conducting its activities (i) in accordance with applicable laws, (ii) consistent with disclosures made to clients and (iii) with adequate systems and procedures to ensure compliance.
As investment advisers, our Affiliates have fiduciary duties to their clients. The SEC has interpreted this duty to impose standards, requirements and limitations on, among other things: trading for proprietary, personal and client accounts; allocations of investment opportunities among clients; use of soft dollars; execution of transactions; and recommendations to clients. Our Affiliates generally manage their client accounts on a discretionary basis, with authority to buy and sell securities for each portfolio, select broker-dealers to execute trades and negotiate brokerage commission rates.
In addition, certain of our Affiliates act as investment advisers or sub-advisers to funds that are registered under the Investment Company Act. The Investment Company Act and the rules and regulations thereunder regulate the structure and operations of funds through a combination of disclosure requirements and restrictions on day-to-day operations, which must be strictly adhered to by the funds and their investment advisers. Among other things, the Investment Company Act addresses investment company capital structures, custody of assets, investment activities (particularly with respect to transactions with affiliates and other transactions involving potential conflicts of interest), and the duties of fund boards.
The failure of our Affiliates to comply with the requirements of the Advisers Act or, as applicable, the Investment Company Act, and the regulations and interpretations thereunder, could have a material adverse effect on us.
CFTC Regulation
One of our largest Affiliates, Acadian, is registered with the CFTC, as a commodity pool operator and a commodity trading adviser and is a member of the National Futures Association, or the NFA, a self-regulatory organization for the U.S. futures industry. Registration and NFA membership subject Acadian to substantive and material restrictions and requirements, including, among other things, reporting, recordkeeping, disclosure, self-examination and training requirements. Registration also subjects Acadian to periodic on-site audits, and the CFTC is authorized to institute proceedings and impose sanctions for violations of the Commodity Exchange Act and/or CFTC rules.
Dodd-Frank
While the Dodd-Frank Act has not yet caused us to reconsider our business model, certain provisions will, and other provisions may, increase regulatory burdens and reporting and related compliance costs. In addition, the scope of many provisions of the Dodd-Frank Act is being determined by implementing regulations, some of which will require lengthy proposal and promulgation periods. Moreover, the Dodd-Frank Act mandates many regulatory studies, some of which pertain directly to the investment management industry, which could lead to additional legislation or regulation. The Dodd-Frank Act will affect a broad range of market participants with which our Affiliates interact or may interact, including banks, non-bank financial institutions, rating agencies, mortgage brokers, credit unions, insurance companies and broker-dealers. Regulatory changes that will affect other market participants are likely to change the way in which our Affiliates conduct business with their counterparties. While the majority of the Dodd-Frank requirements applicable to our business have been enacted, the uncertainty regarding further implementation of the Dodd-Frank Act and its effect on the investment management industry and us cannot be predicted at this time but will continue to be a risk for our business.
130
ERISA-Related Regulation
Certain of our Affiliates provide investment advisory or investment management services to employee benefit plans and collective investment vehicles that are subject to Title I of ERISA. In performing these services for their ERISA clients, our Affiliates are considered "fiduciaries" under ERISA, and are subject to the high standard of care, duty of loyalty, prohibited transaction rules and other requirements of ERISA and the parallel prohibited transaction rules of the Code. The U.S. Department of Labor's Employee Benefits Security Administration is responsible for the administration and enforcement of Title I of ERISA. An ERISA fiduciary that breaches its fiduciary duties to an ERISA plan client may be required to restore any losses to the plan and disgorge any profits it has made, and may also be subject to excise taxes and other monetary penalties. The failure of any of our Affiliates to comply with these requirements could have a material adverse effect on our business.
SEC Broker-Dealer Registration/FINRA Regulation
One of our Affiliates, Heitman, controls a U.S. domiciled broker-dealer and a U.K. domiciled broker-dealer that are subject to regulation by the SEC, FINRA, the states of Illinois and California, and/or the U.K. Financial Conduct Authority, as applicable. In addition, certain of our employees and certain Affiliate employees are registered with FINRA and subject to SEC and FINRA regulation and regulation by various states through an arrangement with a non-affiliated U.S. domiciled broker-dealer. The failure of these companies and/or employees to comply with relevant regulatory requirements in this area could have a material adverse effect on our business.
Environmental
Our Affiliate, Campbell Global, is subject to myriad federal, state and local laws and regulations regulating the harvesting of timber, the protection of the environment and the protection of non-timber resources such as wildlife and water. Included among these laws are the federal Endangered Species Act and the Clean Water Act. On the state level, some states in the U.S. have adopted forest practices acts that regulate harvest and forest management activities and some states and local governments regulate certain forest practices through various permit programs. Additional and more stringent regulations may be adopted by various state and local governments to achieve water-quality standards under the federal Clean Water Act, protect fish and wildlife habitats or achieve other public policy objectives.
Campbell Global's operations are also subject to federal, state and local pollution controls with regard to air, water and land, solid and hazardous waste management, disposal and remediation laws and regulations.
In addition, Campbell Global must comply with rules and regulations adopted in various non-U.S. jurisdictions where it operates, including Australia, which recently adopted the Australia Illegal Logging Prohibition Act that prohibits the importation and processing of illegal timber and requires importers and processors of timber to follow certain due diligence requirements. The failure of Campbell Global to comply with federal, state, local and non-U.S. requirements could have a material adverse effect on our business.
Anti-Money Laundering
Our Affiliates are required to comply with certain provisions of The Currency and Foreign Transactions Reporting Act of 1970, or the Bank Secrecy Act. The Bank Secrecy Act and regulations thereunder require U.S. financial institutions to assist U.S. government agencies in detecting and preventing money laundering by keeping records of cash purchases of negotiable instruments, filing reports of cash transactions exceeding $10,000, and, in the case of SEC-registered broker-dealers, reporting suspicious activity that might signify money laundering, tax evasion or other criminal
131
activities. The U.S. Department of Treasury is the agency charged with enforcement of these provisions of the Bank Secrecy Act.
In addition, the broker-dealer affiliate of Heitman is required to comply with the anti-money laundering provisions of the USA PATRIOT Act of 2001, as amended, or the Patriot Act. The Patriot Act amended the Bank Secrecy Act by mandating the implementation of various regulations applicable to broker-dealers, investment companies, futures commission merchants, and other financial services companies. Financial institutions subject to the Patriot Act and regulations adopted pursuant to the Patriot Act generally must have anti-money laundering procedures in place, implement specialized employee training programs, designate an anti-money laundering compliance officer, and be audited periodically by an independent party to test the effectiveness of compliance. Such financial institutions must also implement customer identification programs and comply with other anti-money laundering requirements. The U.S. Department of Treasury is also charged with enforcement of the Patriot Act.
Other Regulatory Reporting
Pursuant to regulations adopted by the U.S. Department of Treasury, our Affiliates are required to provide periodic reports to the Treasury Department on U.S. securities held by foreign residents, foreign securities held by U.S. residents and on U.S. liabilities to foreign residents that invest in U.S. securities. The reports are filed on a consolidated basis by us. In addition, our Affiliates are required to file periodic reports with the SEC relating to managed discretionary assets under management over certain amounts and relating to shareholder ownership in which our Affiliates hold on behalf of clients more than certain percentages of the voting equity securities of any SEC-reporting company, closed-end fund or insurance company. We are also required to file certain similar periodic informational reports with the SEC as the parent company of such filers. Given the nature of our business model, other regulatory reporting could be required of us and/or our Affiliates in the future pursuant to various regulatory requirements in the jurisdictions in which we operate.
Privacy
Regulatory activity in the areas of privacy and data protection continues to grow worldwide and generally is being driven by the growth of technology and related concerns about the rapid and widespread dissemination and use of information. Certain of our Affiliates must comply with Regulation S-P promulgated by the SEC under the Gramm-Leach-Bliley Act which governs the treatment of nonpublic personal information about clients and requires financial institutions, including investment advisers, to notify clients concerning the collection, use and sharing of nonpublic client information.
International Regulation
Investment Advisers
Certain of our Affiliates also have non-U.S. regulated entities. In addition, our Affiliates have increased their product offerings and international business activities over the past several years, resulting in increased exposure to the laws and regulations of a variety of non-U.S. jurisdictions and non-U.S. regulatory agencies and bodies.
Distributor
Old Mutual Asset Management International, Ltd, or OMI, one of our U.K. subsidiaries, serves as the distribution entity for our U.S. investment advisory Affiliates in non-U.S. markets and is regulated by the U.K. Financial Conduct Authority. OMI personnel market and/or promote the investment strategies and capabilities of our U.S. Affiliates in the European Union, Asia, the Middle East and Canada.
132
Non-U.S. Regulators
The non-U.S. regulatory agencies and bodies that regulate the activities in the various jurisdictions where the products of one or more of our Affiliates are distributed or where an Affiliate conducts business include, but are not necessarily limited to, the following:
- •
- Autorité des Marchés Financiers—France
- •
- Australian Securities and Investments Commission
- •
- Austrian Financial Market Authority
- •
- Canadian Provincial Securities Commissions
- •
- Central Bank of Ireland
- •
- Commission de Surveillance du Secteur Financier—Luxembourg
- •
- Commissione Nazionale per le Società e la Borsa—Italy
- •
- Committee for Systemic Risks & System-Relevant Financial Institutions—Belgium
- •
- Denmark Finanstilsynet
- •
- Dubai Financial Services Authority
- •
- Emirates Securities and Commodities Commission
- •
- Federal Financial Markets Service of Russia
- •
- Federal Financial Supervisory Authority of Germany (BaFin)
- •
- The Financial Conduct Authority and Prudential Regulation Authority in the United Kingdom
- •
- The Financial Supervisory Authority—Norway
- •
- Financial Supervisory Authority (Finansinspektionen)—Sweden
- •
- Financial Services Agency of Japan
- •
- Financial Supervision Service of South Korea
- •
- Hellenic Capital Market Commission—Greece
- •
- Malta Financial Services Authority
- •
- Monetary Authority of Singapore
- •
- Netherlands Authority for the Financial Markets
- •
- Polish Financial Supervision Authority (KNF)
- •
- Portuguese Securities Market Commission
- •
- Securities and Futures Commission of Hong Kong
- •
- Spanish Securities Market Commission (Comisión Nacional del Mercado de Valores)
These regulatory agencies have broad supervisory and disciplinary powers, including, among others, the power to temporarily or permanently revoke the authorization to conduct regulated business, suspend registered employees, and censure and fine both regulated businesses and their registered employees. As our Affiliates continue to expand their international presence, the costs and risks associated with doing business in foreign countries will continue to increase.
133
In addition, many non-U.S. securities exchanges and regulatory authorities have imposed rules (and others may impose rules) relating to capital requirements that may be applicable to our Affiliates or their foreign subsidiaries. These rules, which specify minimum capital requirements, are designed to measure general financial integrity and liquidity and require that a minimum amount of assets be kept in relatively liquid form.
European Union Regulation
European regulators have increased their focus on the financial services industry and have issued and are expected to continue issuing significant directives and regulations designed to protect investors. Of particular note is the European Directive on Alternative Investment Fund Managers, or AIFMD. AIFMD imposes significant regulatory requirements on alternative investment funds, other than the Undertakings for Collective Investments in Transferable Securities, or UCITS, domiciled in the European Union, or EU, or otherwise marketed in the EU. AIFMD's requirements include new compliance, reporting and disclosure obligations regarding remuneration, conduct of business, capital requirements, leverage, valuation and liquidity management.
AIFMD was required to be implemented in each EU country's national laws by July 22, 2013, although a number of the requirements were subject to transitional arrangements until July 22, 2014. Non-EU fund managers that market their funds to investors in the EU are required to do so in accordance with the AIFMD private placement rules (as implemented in each country), including requirements regarding pre-sale disclosures, post-sale disclosures and regular regulatory requirements. It is anticipated that the private placement rules will be phased out in July 2018, after which non-EU fund managers marketing their funds to investors in the EU will be required to become authorized pursuant to the AIFMD. There is an element of national discretion within the implementation and, therefore, private placement rules may vary from jurisdiction to jurisdiction. Although the Directive is complete from a European Parliament perspective, many aspects remain subject to further guidance and interpretation. It is possible that the significant administrative complexity and additional costs associated with AIFMD could limit the flexibility of our Affiliates to offer fund products and grow their businesses throughout Europe.
Other recent European regulatory developments that could have an effect on our business include the EU's regulation on short selling and certain aspects of credit default swaps, or Short Selling Regulations, and the EU Market Infrastructure Regulation, or EMIR. The Short Selling Regulations took effect in 2012 and restrict uncovered short sales in EU shares, EU sovereign debt and EU sovereign debt-related credit default swaps, thereby potentially raising regulatory risk, increasing the difficulty with which our Affiliates may employ hedging instruments in their investment strategies and increasing the transaction costs associated with short sales. EMIR also took effect in 2012, with implementation beginning in 2013. EMIR is designed to increase the stability of over-the-counter, or OTC, derivative markets throughout the EU by introducing new reporting obligations and registration requirements for OTC derivatives, increasing margin and capital requirements and other clearing obligations for eligible OTC derivatives, introducing measures designed to reduce counterparty credit and operational risk, common governance standards for central counterparties, or CCPs, and trade repositories and rules for the establishment of interoperability between CCPs. The increased trading and collateral costs associated with EMIR may negatively affect our business.
In addition to the recent European developments, we are subject to existing European Directives and frameworks that continually are updated by the regulators. Since 2007 our U.K. and other European regulated Affiliates have been required to comply with the regulatory framework established through the Markets in Financial Instruments Directive, or MiFID. MiFID regulates the provision of investment services and activities throughout the European Economic Area, or EEA, by establishing requirements governing the organization and conduct of business of investment firms. Each of the EEA countries has adopted the MiFID rules into national legislation and regulations, including, in the case
134
of the U.K., the Financial Conduct Authority regulations. On June 12, 2014, the final texts of "MiFID II", a package of reforms and amendments to MiFID, were published in the Official Journal of the European Union. The effect of MiFID II will be to broaden the scope of the directive to capture additional instruments, venues and activities. There is a two year implementation period for MiFID II. The MiFID II directive is required to be transposed into the national legislation of each EEA jurisdiction by July 3, 2016, with such national rules required to come into effect by January 3, 2017. The MiFID II regulation will come into effect on July 3, 2017.
Many of our Affiliates sub-advise EU-domiciled UCITS and therefore must comply with the UCITS Directives. The Directives provide requirements for management companies, investment managers and sub-advisers and has been revised several times. Most recently, in February 2014 the European Commission and European Parliament reached agreement on a package of revisions to the UCITS directives known as UCITS V. UCITS V creates increased liability for depositaries and custodians that potentially could cause depositaries and custodians to raise fees in a manner that would adversely affect UCITS fund economics.
Compliance with the requirements set out above may increase our operating expenses as a result of higher compliance costs.
In addition to the compliance requirements set forth above, AIFMD, UCITS V and MiFID II, as well as the European Commission's most recent Capital Requirements Directive, may place restrictions on the remuneration structures employed by European-domiciled investment managers and/or non-European firms that conduct certain investment activities in Europe. While the effect on our business of the various enacted and proposed regulations continues to be assessed, it is possible that certain of our Affiliates may be required to restructure compensation packages in a manner that will be perceived as unattractive by certain key employees, thereby increasing flight-risk, which could have a negative effect on our business.
Compliance
Our compliance functions are performed by teams of professionals at our Affiliates and integrated with OMUSH's legal and compliance functions. These groups are responsible for all legal and regulatory compliance matters related to our businesses, as well as for monitoring adherence to client investment guidelines. Senior management at both the Company and our Affiliates are involved at various levels in all of these functions.
For information about our regulatory environment, see "Risk Factors—Industry Risks—We operate in a highly regulated industry, and continually changing federal, state, local and foreign laws and regulations could materially adversely affect our business, financial condition and results of operations."
135
Executive Officers and Directors
Following this offering, our executive officers and directors will be:
Name
|
Age | Position(s) | |||
|---|---|---|---|---|---|
Peter L. Bain |
56 | President, Chief Executive Officer and Director | |||
Stephen H. Belgrad |
51 | Executive Vice President, Chief Financial Officer | |||
Linda T. Gibson |
49 | Executive Vice President, Head of Global Distribution | |||
Christopher Hadley |
45 | Executive Vice President, Chief Talent Officer | |||
Aidan J. Riordan |
42 | Executive Vice President, Head of Affiliate Management | |||
Julian Roberts |
57 | Chairman of the Board | |||
Ian D. Gladman |
49 | Director | |||
Kyle P. Legg |
62 | Director | |||
James J. Ritchie |
59 | Director | |||
John D. Rogers |
52 | Director | |||
Donald J. Schneider |
56 | Director | |||
Peter L. Bain is our President, Chief Executive Officer, a director of OMUSH and a member of our Executive Management Team, and will be a member of our Board of Directors following this offering. Mr. Bain has held these positions since joining us in February 2011 and is responsible for all aspects of our operations, including corporate strategy and development. Mr. Bain also is a member of the Group Executive Committee of our Parent. Prior to joining us, Mr. Bain held executive positions with Legg Mason, Inc., a global asset management company, from June 2000 until March 2009, including senior executive vice president and head of affiliate management and corporate strategy from 2008 until March 2009 and chief administrative officer from 2003 until 2006. From March 2009 until February 2011, Mr. Bain was not employed. Mr. Bain received a B.A. in American Studies from Trinity College, where he was elected to Phi Beta Kappa and graduated with honors in general scholarship, and a J.D. from Harvard Law School.
Mr. Bain's qualifications to serve on our Board include his extensive business, finance, distribution, marketing and leadership skills gained and developed through years of experience in the financial services industry. In particular, Mr. Bain has overseen a substantial number of transactions in the asset management sector and has significant expertise in identifying, structuring and executing strategic acquisitions, as well as in managing boutique firms post-acquisition. These skills, combined with Mr. Bain's extensive knowledge of our business and our industry, will enable him to provide valuable insights to the Board on the strategic direction of our Company.
Stephen H. Belgrad is one of our Executive Vice Presidents, our Chief Financial Officer and a member of our Executive Management Team. Mr. Belgrad has held these positions since joining us in June 2011. Mr. Belgrad has been a member of the Group Capital Management Committee of our Parent since October 2011 and is also a director of a number of our Affiliates. Mr. Belgrad is responsible for our finance, legal and IT/operations functions and jointly responsible for corporate development. Following this offering, he also will be responsible for investor relations. From 2008 to May 2011, Mr. Belgrad was chief financial officer of HarbourVest Global Private Equity Limited (HVPE), a publicly-traded closed-end investment company. Mr. Belgrad previously was a vice president in the new investments group at Affiliated Managers Group, Inc., a publicly traded global asset management company, and, prior to that, senior vice president and treasurer at Janus Capital Group Inc., a publicly traded investment management firm. He began his career at Morgan Stanley & Co. LLC, a global financial services firm, where, over the course of 15 years, he held various positions in financial institutions investment banking, corporate strategy and Morgan Stanley's asset
136
management division. Mr. Belgrad received a B.A. in economics from Princeton University and an M.B.A. from Harvard Business School.
Linda T. Gibson is one of our Executive Vice Presidents, our Head of Global Distribution and a member of our Executive Management Team. Ms. Gibson has served as an Executive Vice President since 2004. In July 2012, Ms. Gibson was appointed Head of Global Distribution. Ms. Gibson is Chief Executive Officer of Old Mutual Asset Management International, Ltd. and is currently responsible for global distribution, marketing and communications. Ms. Gibson joined us in 2000 and has held various executive positions, including Interim President and Chief Executive Officer from September 2010 to February 2011, Chief Operating Officer and Head of Affiliate Management from October 2008 to July 2012 and General Counsel from February 2001 to October 2009. Ms. Gibson also serves on the boards of a number of our Affiliates. Prior to joining us, Ms. Gibson was a senior vice president and senior counsel at Signature Financial Group, Inc., a third-party mutual fund administrator and distributor, where she oversaw the legal operations of the Boston, London and Grand Cayman offices, and provided consulting services with respect to global investment product design and strategy. Ms. Gibson received a B.A. in mathematics from Bates College, a J.D. from Boston University School of Law and is a graduate of the Advanced Management Program at Harvard Business School.
Christopher Hadley is one of our Executive Vice Presidents, our Chief Talent Officer and a member of our Executive Management Team. Mr. Hadley has held these positions since July 2012. Mr. Hadley is responsible for formulating the strategy and providing services for acquiring, developing and retaining our talent. Mr. Hadley also serves on the board of managers of Acadian, one of our Affiliates. Since Mr. Hadley joined us in 2006, he has held various positions in the Talent Department, including Senior Vice President and Head of Talent from May 2011 to June 2012, Vice President, Head of Compensation and Benefits from November 2008 to May 2011 and Vice President, Talent from August 2007 to October 2008. Prior to joining us, Mr. Hadley was head of compensation at Putnam Investments. Mr. Hadley received a B.S. from the University of Massachusetts, Amherst.
Aidan J. Riordan is one of our Executive Vice Presidents, our Head of Affiliate Management and a member of our Executive Management Team. Mr. Riordan joined us in June 2011 as Senior Vice President and Director of Affiliate Development and was appointed to his current position in July 2012. Mr. Riordan is responsible for oversight and development of our current portfolio of Affiliates and is jointly responsible for corporate development. Mr. Riordan is a member of the boards and remuneration committees of each of our Affiliates. From 2005 through May 2011, Mr. Riordan was a partner at Calvert Street Capital Partners, a middle market private equity firm based in Baltimore, Maryland, which he joined in 2003, and previously held positions at Castle Harlan, Inc., a private equity firm based in New York that focuses on buyouts and growth capital investments in middle-market companies across a range of industries. Mr. Riordan began his career at Berkshire Capital Corporation, a New-York based investment bank specializing in providing mergers and acquisitions services to the investment management industry. Mr. Riordan received a B.A. in economics from the University of Pennsylvania and an M.B.A. in finance from Columbia Business School.
Julian Roberts is Chairman of our Board of Directors. Mr. Roberts has been the Group Chief Executive of our Parent since September 2008 and a director of our Parent since August 2000. During his tenure as Chief Executive of our Parent, Mr. Roberts led the successful recapitalization of our Parent through the sale of non-core businesses in the U.S. and Europe and is responsible for our Parent's strategy and values. Mr. Roberts is a member of the nomination committee of our Parent and a non-executive director of Nedbank Group Limited, Nedbank Limited and Old Mutual Life Assurance Company (South Africa) Limited. He joined our Parent in August 2000 as Group Finance Director, moving on to become the group chief executive of Skandia, an investment services firm, following its purchase by our Parent in February 2006. Prior to joining our Parent, he was the group finance director of Sun Life & Provincial Holdings plc, an insurance company, and, before that, the chief financial officer of Aon UK Holdings Limited, a global professional services and insurance company.
137
Mr. Roberts received a BA in accountancy and business law from the University of Stirling. He is a Fellow of the Institute of Chartered Accountants, a Member of the Association of Corporate Treasurers and a Member of TheCityUK.
Mr. Roberts's qualifications to serve on our Board of Directors include his extensive business, finance, operational and leadership skills gained and developed through years of experience in the financial services industry. In particular, Mr. Roberts has substantial experience managing and leading a firm in the financial services industry. These skills, combined with Mr. Roberts's extensive knowledge of our business and our industry, will enable him to provide valuable insights to the Board of Directors on the strategic direction of our Company.
Ian D. Gladman will become a member of our Board of Directors following this offering. Since January 2012, Mr. Gladman has been the Group Strategy Director and a member of the Group Executive Committee of our Parent. He previously worked at UBS Investment Bank for sixteen years where his most recent position, commencing in March 2008 and ending in June 2010, was as Co-Head of Financial Institutions, EMEA, covering a range of U.K. and European insurance companies, banks and asset managers. During his time at UBS, Mr. Gladman advised a number of asset managers on initial public offerings and other strategic transactions. While at UBS, Mr. Gladman also served as Head of Corporate Finance South Africa from 1998 to 2001, during which time he led the local UBS team advising our Parent on its demutualization and original listing. Prior to joining UBS, Mr. Gladman worked at Goldman Sachs and JP Morgan. Mr. Gladman was appointed a non-executive director of Nedbank Group Limited in June 2012 and serves on the Group Credit Committee, Group Risk and Capital Management Committees, Group Finance and Oversight Committee and Large-Exposure Approval Committee of Nedbank. Mr. Gladman received a B.A. in History from Christ's College, Cambridge. Mr. Gladman took sabbatical leave from UBS from June 2010 until June 2011. From June 2011 until January 2012, he was not employed.
Mr. Gladman's qualifications to serve on our Board of Directors include his in-depth knowledge and experience in financial services, in particular his experience in the asset management sector, which has involved working with numerous companies on their initial public offerings as well as various other advisory and capital markets transactions. In addition, Mr. Gladman has deep experience in both the debt and equity global capital markets and has worked with investors in a range of jurisdictions. He has worked on numerous initial public offerings, rights issues, demutualizations and other listings in the United Kingdom, U.S. and other markets.
Kyle P. Legg will become a member of our Board of Directors following this offering. Ms. Legg is the former Chief Executive Officer of Legg Mason Capital Management (now ClearBridge Investments), an investment management firm and equity affiliate of Legg Mason, Inc., where she served as Chief Executive Officer from 2006 until her retirement in 2009 and as President from 1997 to 2006. Ms. Legg joined Legg Mason in 1991 as a Vice President and Senior Analyst. At Legg Mason, Ms. Legg built a leading global equity investment management business serving high-end institutional clients, including some of the world's largest sovereign wealth funds, domestic and foreign company pension plans, corporate funds, endowments, and foundations. Prior to joining Legg Mason, Ms. Legg began her career as a Securities Analyst at Alex Brown & Sons. Ms. Legg currently is a member of the board of directors, audit committee and executive committee, and is chair of the compensation committee, of SunTrust Banks, Inc. Ms. Legg previously served as a director of Eastman Kodak Company and as a member of its Corporate Responsibility and Governance Committee and its Executive Compensation and Development Committee. Ms. Legg, a Chartered Financial Analyst, received a B.A. in mathematics from Goucher College, a J.D. from the University of Baltimore and an M.B.A. from Loyola College.
Ms. Legg's deep investment, financial, and executive leadership experience, including experience with a regulated financial institution, qualify her to serve on our Board of Directors.
138
James J. Ritchie will become a member of our Board of Directors following this offering. Mr. Ritchie has served as a director of OMUSH since January 2007 and as chairman and a member of the audit and risk committee of the board of directors of OMUSH since August 2007. Mr. Ritchie also has served as a member of the board and chairman of the audit committee of Kinsale Capital Group, Ltd. since January 2013 and as a member of the board and chairman of the audit committee of Old Mutual (Bermuda) Ltd. since February 2009. Mr. Ritchie's former board experience includes: member of the board and chairman of the audit committee of Ceres Group, Inc.; member and non-executive chairman of the board and member of the compensation committee of Fidelity & Guaranty Life Insurance Company (formerly Old Mutual Financial Life Insurance Company, Inc.); member of the board and member of the audit and compensation committees of KMG America Corporation; member of the board, chairman of the audit committee and member of the compensation committee of Lloyd's Syndicate 4000; and member and non-executive chairman of the board and former chairman of the audit committee of Quanta Capital Holdings Ltd. From 2001 until his retirement in 2003, Mr. Ritchie served as managing director and chief financial officer of White Mountains Insurance Group, Ltd.'s OneBeacon Insurance Company, a specialty insurance company, and as the group chief financial officer for White Mountains Insurance Group, Ltd., a financial services holding company. From 1986 through 2000, Mr. Ritchie held various positions with CIGNA Corporation, an insurance company, including chief financial officer of the company's international division and head of its internal audit division. Mr. Ritchie began his career with PricewaterhouseCoopers LLP, an accounting firm. Mr. Ritchie is a member of the National Association of Corporate Directors and the American Institute of Certified Public Accountants. Mr. Ritchie received a B.A. in economics with honors from Rutgers College and an M.B.A. from Rutgers Graduate School of Business Administration.
Mr. Ritchie's qualifications to serve on our Board of Directors include his extensive background in finance, substantial board experience, strategic and operational leadership and wide-ranging knowledge of operational, risk and control initiatives. His background in financial risk and regulation will provide valuable guidance to our Board of Directors and our Company in addressing risk management.
John D. Rogers will become a member of our Board of Directors following this offering. Mr. Rogers is the former President, Chief Executive Officer and a member of the Board of Governors of CFA Institute, the world's largest association of investment professionals. Mr. Rogers served in these positions from January 2009 through May 2014. From May 2007 through December 2008, Mr. Rogers was the principal and founding partner in Jade River Capital Management, LLC, an investment adviser located in Atlanta, Georgia that served high net worth clients. From 1994 to 2007, Mr. Rogers served in several roles at Invesco Ltd., a global investment management firm, as President and Chief Investment Officer of Invesco Asset Management Ltd. (Japan), as Chief Executive Officer and Co-Chief Investment Officer of Invesco Global Asset Management, N.A., and as Chief Executive Officer of Invesco's Worldwide Institutional Division. Mr. Rogers has not been employed since May 2014. Since July 2009, Mr. Rogers has served on the board of directors and the audit committee, which he currently chairs, of Schweitzer-Mauduit International, Inc. Mr. Rogers previously served on the board of directors of AMVESCAP plc (now Invesco Ltd.). Mr. Rogers, a Chartered Financial Analyst, received a B.A. in history from Yale University and an M.A. in East Asian studies from Stanford University.
Mr. Roger's qualifications to serve on our Board of Directors include his extensive investment expertise, his business-building experiences in the global asset management industry and his various business and professional leadership roles. These skills will enable Mr. Rogers to provide our Board of Directors with a global perspective on the asset management business as well as the leadership expertise to help guide the growth of our business.
Donald J. Schneider is a member of our Board of Directors and has served as a director of OMUSH since November 2009. Mr. Schneider has been Group Human Resources Director at our Parent since May 2009. He is based in London and is responsible for all human resources functions
139
globally. Prior to joining our Parent, Mr. Schneider was Senior Vice President and Head of Human Resources for the Global Wealth Management Division of Merrill Lynch & Co., a financial services firm. Mr. Schneider originally joined Merrill Lynch in 1997 as Head of International Human Resources, based in London, where he was responsible for all human resource activities outside of the U.S. He later served as Head of Human Resources for Global Markets and Investment Banking. Previously, Mr. Schneider worked for Morgan Stanley & Co. LLC, a financial services firm, and held a variety of senior human resource roles, including Global Head of Compensation, Benefits and Human Resource Systems. Mr. Schneider received a B.A. in economics and English from Hamilton College, an M.A. in industrial relations from the University of Warwick and a Certificate in Corporate Governance from INSEAD.
Mr. Schneider's qualifications to serve on our Board of Directors include the breadth of his international business knowledge and experience in several sectors of financial services. His expertise in the field of human resources will provide our Board of Directors and our Company with professional guidance in the growth and development of our business, competitive compensation strategies and talent management.
Composition of Our Board of Directors and Director Independence
Our business and affairs are managed under the direction of our Board of Directors. Following this offering, our Board of Directors will be composed of seven directors and will have an Audit Committee, Compensation Committee and Nominating and Corporate Governance Committee. As discussed under "Certain Relationships and Related Party Transactions—Relationship with Our Parent and OMGUK Following This Offering—Shareholder Agreement—Board of Directors and Corporate Governance Rights," pursuant to a Shareholder Agreement we have entered into with our Parent, our Parent has the right to nominate certain of our directors to the Board of Directors and its committees and the right to increase the size of our Board of Directors from seven to nine directors.
The NYSE Listed Company Manual, or the NYSE Rules, requires that, subject to specified exceptions, each member of a listed company's audit committee, compensation committee and nominating and corporate governance committee be "independent." Our Board of Directors has determined that Messrs. and , each of whom will be a director upon or immediately following the closing of this offering, are independent under the NYSE Rules. In considering their independence, the Board of Directors considered the relationships between each of Messrs. and , on the one hand, and our Company and our Parent, on the other hand.
Because our Parent will continue to indirectly own a majority of our ordinary shares following this offering, we will be a "controlled company" for purposes of the NYSE Rules. Accordingly, our Board of Directors will not be required to have a majority of independent directors, and our Compensation Committee and Nominating and Corporate Governance Committee will not be required to meet the director independence requirements to which we would otherwise be subject until such time as we cease to be a "controlled company." We intend to utilize each of these exemptions from the requirements of the NYSE Rules for our Board of Directors and compensation committee and nominating/corporate governance committee.
Audit Committee
Our Audit Committee will be composed of Messrs. and immediately following the consummation of this offering, and Mr. will be the chair. Our Board of Directors has determined that each member of the Audit Committee meets the independence requirements of Rule 10A-3 under the Exchange Act and the NYSE Rules and is "financially literate" as such term is defined in the NYSE Rules. Our Board of Directors has determined that Mr. is an "audit committee financial expert" within the meaning of SEC regulations and the NYSE Rules.
140
The Audit Committee will have a charter that sets forth the Audit Committee's purpose and responsibilities, which include (i) assisting the Board of Directors in fulfilling its oversight responsibilities of the financial reports and other financial information filed with the SEC, (ii) recommending to the Board of Directors the appointment of our independent auditors and evaluating their independence, (iii) reviewing our audit procedures and controls, and (iv) overseeing our internal audit function.
Compensation Committee
The Compensation Committee will be composed of Messrs. and immediately following the consummation of this offering and Mr. will be the chair. Our Board has determined that Messrs. and are independent under the NYSE Rules. At such time as our Parent ceases to own more than 50% of our outstanding ordinary shares, the Compensation Committee must consist solely of independent directors.
The Compensation Committee will have a charter that sets forth the Compensation Committee's purpose and responsibilities, which include annually reviewing and approving the corporate goals and objectives relevant to the compensation of the Chief Executive Officer and evaluating his or her performance in light of these goals, determining the compensation of our executive officers and administering equity and incentive plans. Until such time as our Parent ceases to own more than 50% of our outstanding ordinary shares, our Board of Directors intends to adopt policies that will provide that (i) the charter of the Compensation Committee may not be amended without the consent of our Parent, (ii) all compensation decisions made by the Compensation Committee will be subject to the approval of our Parent and (iii) the policies adopted by the Compensation Committee must be consistent with the policies of our Parent.
Directors' Remuneration Reports
Under Section 385 of the U.K. Companies Act 2006, we will be required to produce a directors' remuneration report for each fiscal year. Directors' remuneration reports must include (i) a directors' remuneration policy, which is subject to a binding shareholder vote at least once every three years, and (ii) an annual report on remuneration in the financial year being reported on, and on how the current policy will be implemented in the next financial year, which is subject to an annual advisory shareholder vote. The Companies Act requires that remuneration payments to directors of the Company and payments to them for loss of office must be consistent with the approved directors' remuneration policy or, if not, must be specifically approved by the shareholders at a general meeting.
Nominating and Corporate Governance Committee
The Nominating and Corporate Governance Committee will be composed of Messrs. and immediately following the consummation of this offering, and Mr. will be the chairman. Our Board has determined that Messrs. and are independent under the NYSE Rules. At such time as our Parent ceases to own more than 50% of our outstanding ordinary shares, the Nominating and Corporate Governance Committee must consist solely of independent directors. Pursuant to the Shareholder Agreement, our Parent has certain rights to nominate directors as described in "Certain Relationships and Related Party Transactions—Relationship with Our Parent and OMGUK Following This Offering—Shareholder Agreement."
The Nominating and Corporate Governance Committee will have a charter that sets forth the Committee's purpose and responsibilities, which include reviewing and recommending nominees for election as directors, assessing the performance of our directors and developing corporate governance guidelines for our Company.
141
Compensation Committee Interlocks and Insider Participation
We do not anticipate any interlocking relationships between any member of our Compensation Committee and any of our executive officers that would require disclosure under the applicable rules promulgated under the federal securities laws.
Code of Business Conduct and Ethics
Prior to the closing of this offering, we will adopt a written code of business conduct and ethics that applies to our directors, officers and employees, including our principal executive officer and principal financial officer. Following this offering, a current copy of the code will be posted on the investor section of our website, www.omam.com. We intend to disclose any amendment to the code, or any waiver of its requirements, on our website.
142
COMPENSATION DISCUSSION AND ANALYSIS
Introduction
The following discussion and analysis of compensation arrangements of our named executive officers for 2013 should be read together with the compensation tables and related disclosures set forth below. This discussion contains certain forward-looking statements that are based on our current plans, considerations, expectations and determinations regarding future compensation programs. Actual compensation programs that we adopt in the future may differ from currently planned programs as summarized in this discussion.
Our Compensation Discussion and Analysis is presented in three sections:
- •
- Our Executive Compensation Practices and Policies provides a summary of
our Executive Compensation program along with subsections containing information on:
- •
- Comparator Group
- •
- Our Compensation Committee
- •
- Compensation Consultant
- •
- Risk Considerations in Our Compensation Programs
- •
- Elements of Compensation including Cash Base Salary, Incentive Compensation—Cash and Equity and Benefits
- •
- 2013 Compensation Process and Elements outlines our compensation practice
for fiscal year 2013. This includes an overview of:
- •
- Cash Base Salary
- •
- Incentive Pool Accrual and Annual Incentive Compensation
- •
- Benefits
- •
- One-Time Value Incentive Plan.
- •
- Compensation Plan Expected Post-Offering provides an overview of any
expected changes between our historic compensation practices and those to be provided after the consummation of this offering, including information on:
- •
- Incentive Compensation
- •
- Conversion from Old Mutual plc Restricted Shares
- •
- Benefits and other items
Following the Compensation Discussion and Analysis are the compensation tables and related discussion detailing compensation of our named executive officers for the fiscal year ended December 31, 2013.
Our named executive officers are Peter L. Bain, President and Chief Executive Officer, Stephen H. Belgrad, Executive Vice President and Chief Financial Officer, Linda T. Gibson, Executive Vice President and Head of Global Distribution, Aidan J. Riordan, Executive Vice President and Head of Affiliate Management, and Christopher Hadley, Executive Vice President and Chief Talent Officer. During 2013 and through the consummation of this offering, we were a wholly-owned indirect subsidiary of our Parent. We anticipate that in connection with the consummation of this offering, certain of our compensation policies and practices will be modified to reflect our new public company status. Those changes currently known are highlighted below.
143
Our Executive Compensation Practices and Policies
A compensation structure based on clear and consistent objectives, supported by a focused system of talent development and management, is a critical element of our business strategy. Our compensation program is designed to enable us to attract, retain and incentivize the highest caliber talent across our business. With respect to our named executive officers, our compensation methods are intended to provide a total rewards program that is competitive with our peers and supports our values, rewards individual efforts, and correlates with our financial success as a company.
As a wholly-owned indirect subsidiary of our Parent, our compensation policy has historically been guided by the compensation principles that our Parent applies across all of its businesses. Our Parent has been responsible for approving our overall compensation policy and philosophy, and ensuring that they are aligned with our long-term business strategy, objectives, risk appetite and values. Historically our Parent has determined the compensation of our Chief Executive Officer. In addition, our Parent has reviewed our other executive officers', including our named executive officers', base salaries and incentive compensation, which includes both an annual cash bonus as well as equity incentives, and adjusted them as necessary after taking into account both individual and company performance.
Following the consummation of this offering, the principles and objectives of our future compensation practices are likely to remain largely consistent with our Parent's compensation philosophy. Our Parent historically had significant discretion over the compensation of our named executive officers. Going forward, this function will be shared with a newly formed Compensation Committee. Our Parent, however, will make the ultimate decision to approve, reject or modify compensation decisions consistent with policies to be adopted by our Board of Directors. Our Parent's role in reviewing and approving our compensation levels and programs will terminate if our Parent ceases to own a majority of our outstanding ordinary shares. Historically, elements of our compensation framework were highly formulaic, whereas going forward the framework will be less quantitative and more flexible to allow our Compensation Committee and our Parent to exercise greater judgment. In addition, we intend for our compensation structure to continue to be competitive with our industry peers while supporting our goals.
Our compensation program is designed to contribute to our ability to:
- •
- support our business drivers, company vision, and strategy;
- •
- support and enhance our broader talent management practices and the achievement of our desired culture and behavior;
- •
- use performance-related incentives linked to success in delivering our business strategy and creating alignment with
shareholder interests;
- •
- pay employees at levels that are both competitive and sustainable; and
- •
- manage risk.
We aim to achieve these goals through a compensation structure that includes a moderate level of fixed compensation, as well as a larger portion of incentive compensation consisting of a combination
144
of cash and equity. Details of the split between fixed and incentive compensation for 2013 for each of the named executive officers is provided in the following table:
Named Executive Officer
|
Title | Fixed Compensation as % of Total Compensation |
Incentive Compensation as % of Total Compensation |
||||||
|---|---|---|---|---|---|---|---|---|---|
Peter L. Bain |
President and Chief Executive Officer | 7 | % | 93 | % | ||||
Stephen H. Belgrad. |
Executive Vice President, Chief Financial Officer | 15 | % | 85 | % | ||||
Linda T. Gibson |
Executive Vice President, Head of Global Distribution | 13 | % | 87 | % | ||||
Aidan J. Riordan |
Executive Vice President, Head of Affiliate Management | 18 | % | 82 | % | ||||
Christopher Hadley |
Executive Vice President, Chief Talent Officer | 32 | % | 68 | % | ||||
Our incentive opportunities are predominately contingent upon both individual and company performance.
We believe that our cash compensation and equity participation programs align the interests of our named executive officers and other employees with our shareholders and promote long-term value creation. As a public company, we plan to focus our compensation programs on rewarding performance that increases long-term shareholder value, including growing ENI, developing new client relationships, seeding new products at our Affiliates, investing in new Affiliates, improving operational efficiency and managing risks. Through the work of the Compensation Committee, as described more fully below, we intend to periodically evaluate the success of our compensation and equity participation programs in achieving these objectives and adapt these programs as we grow our Company in order to enable us to better achieve these, and future, objectives.
Comparator Group
We believe that ensuring that our compensation levels are competitive with the market for high caliber talent in our industry is an important attraction and retention tool. The compensation levels of our peer group companies are considered as one of several factors in assessing our total compensation and the form and mix of cash and equity incentives awarded to our employees and our named executive officers. We use our comparator group as a reference and a guide in making total compensation decisions, but the ultimate decision has historically been made by our Parent and is not driven by a desire to provide compensation that is at a certain level relative to the compensation provided at the peer companies. In selecting our comparator group we consider the following factors: business structure (multi-boutique model), assets under management, revenues and geographic location. The comparator group is evaluated on an annual basis and may change over time based upon the availability of peer data and the future characteristics of our business compared to peer companies, which includes both publicly-traded and privately-held asset management companies. The 2013 comparator group has been reviewed, and some additions and deletions have been made for 2014.
For 2013, our comparator group included:
| Allianz Asset Management of America L.P. | Natixis Global Associates | |
| Allianz Global Investors | New York Life Investment Management | |
| BNY Mellon Asset Management | Nuveen Investments | |
| Eaton Vance Investment Managers | OppenheimerFunds, Inc. | |
| Invesco Plc | Putnam Investments | |
| Janus Capital Group | Russell Investments | |
| MFS Investment Management | State Street Global Advisors | |
| Morgan Stanley Investment Management | T. Rowe Price Associates, Inc. |
145
Our Compensation Committee
In connection with this offering, we will form a Compensation Committee of our Board of Directors to assist our Board of Directors in making a recommendation on the compensation of our executive officers, including our named executive officers. We expect that, in the future, our Parent will continue to play a role in compensation matters involving our President and Chief Executive Officer, and our President and Chief Executive Officer will continue to play a role in making recommendations to our Compensation Committee regarding compensation matters involving the other executive officers, including the named executive officers. Our Parent will make the ultimate decision to approve, reject or modify compensation decisions. Our Parent's role in reviewing and approving our compensation levels and programs will terminate if our Parent ceases to own a majority of our outstanding ordinary shares.
Compensation Consultant
We have engaged a compensation consultant, McLagan Partners, to assist in the annual review of our compensation practices and the development of compensation and equity participation programs for our employees, including our named executive officers for 2013 and 2014. Historically, recommendations from McLagan were considered by our Parent in making compensation decisions. As we transition to a public company, we expect that our Compensation Committee will also select an independent compensation consultant to provide research, data analyses, survey information and design expertise in developing compensation and incentive programs for our named executive officers.
Risk Considerations in Our Compensation Programs
Our Parent has assessed our compensation structure to ensure that known and potential risks are considered in the compensation decisions for our employees, including our named executive officers. Compensation structures are designed with the goal of mitigating risk without diminishing their incentive nature, and they incorporate risk-based measures that are appropriate for our industry, transparent and aligned with risk-adjusted performance outcomes. To address the risk that our compensation programs might provide unintended incentives, we keep our compensation programs simple and tie the long-term component of equity-based compensation to our company-wide results. We have reviewed all of our compensation programs and found none that would be reasonably likely to have a material adverse effect on us.
To combat the risk that our compensation might not be sufficient, we strive to use a compensation structure, and set compensation levels, for all employees in a way that we believe contributes to low rates of employee attrition. We also make equity awards subject to multi-year vesting schedules to provide a long-term component to our compensation program, and will impose on our named executive officers ongoing restrictions on the disposition of their holdings of our ordinary shares granted through equity awards. We believe that both the structure and levels of compensation we provide have aided us in retaining key personnel.
In addition to structuring our compensation program and award levels to avoid risk, we have included an explicit business risk management factor as one of the performance objectives we use to determine compensation for our named executive officers, and intend to continue to do so. We believe that basing a portion of our compensation decision upon each executive's accomplishments in identifying and managing organizational risk strengthens his or her commitment to our business and its responsible growth.
Elements of Compensation
Elements of our compensation packages include (i) a cash base salary, (ii) incentive compensation, which includes both cash and equity components and (iii) participation in certain company-wide employee benefit programs, including participation in a 401(k) plan and medical insurance.
146
Cash Base Salary
Base salaries are intended to provide our named executive officers with a degree of financial certainty and stability that does not depend entirely on company or individual performance. They are also designed to attract and retain talented executives, and therefore take into account peer group comparisons to ensure competitiveness. Our 2013 peer group is described above under "—2013 Compensation Process and Elements—Comparator Group." Base salaries are reviewed on an annual basis and increases are considered only if salaries are found to be low relative to the median for our peer group. The median of the peer group is used as a reference with our Parent making the final decision based upon other factors such as experience, performance and scope of the role.
Incentive Compensation—Cash and Equity
Our annual incentive compensation, including for our named executive officers, has historically been based on a number of variables that are linked to individual- and company-based performance. As a subsidiary of our Parent, our incentive compensation was intended to share a portion of value created with the employees responsible for our business unit, and to align employee incentives to specific, measureable and relevant business results in a transparent manner. Discretionary incentive compensation has historically been determined first on a company-wide level through the accrual of a bonus pool, and then through individual allocations. The funds are distributed in a combination of cash and equity compensation. The split between cash and equity is formulaically determined based upon the total amount of the incentive award. The percentage of the total award that is paid in equity increases as the aggregate amount of the award increases.
Our incentive pool metrics are closely aligned with business performance and historically have been approved by our Parent early in the year. As a result, the amount of the bonus pool is tied closely to company performance. The resulting pool is then allocated on a discretionary basis to the named executive officers. While the metrics may be modified annually, the overall process is consistent year to year.
Our approach to performance-based compensation is to use independent judgment in determining the individual allocations of annual incentive compensation for our named executive officers. A number of factors are considered in making the decision of a particular individual's award level, including reviewing aggregate compensation levels to determine the amount available for the payment of bonuses, the comparator peer data, and the performance of each executive without being constrained by any particular formula (except to the extent of the ceiling of the total pool). Our Parent retains discretion to decrease the amount to be paid to named executive officers.
Following the consummation of this offering, the factors the Compensation Committee will continue to consider include its discretionary assessment of our actual results versus the established financial and operating metrics, changes in prior year compensation relative to changes in our overall performance and competitive market trends.
Equity Compensation Provisions
Equity ownership encourages employees to act in the best long-term interests of our Company. As such, our equity ownership plan is intended to effectively align interests between employees and shareholders. Historically, equity incentive compensation for our named executive officers consisted of grants of Old Mutual plc shares, subject to a three-year vesting period and a clawback provision. Upon the completion of this offering, we expect to maintain clawback provisions similar to those associated with outstanding Old Mutual plc share grants, and we also intend to continue to promote substantial equity ownership by our management in the form of grants of our ordinary shares which includes the conversion of existing restricted shares of our Parent issued to our named executive officers that will be converted into our restricted shares.
147
Under the terms of a clawback provision, for grants of equity that have not vested, our Parent may decide at any time to reduce the number of shares in whole or in part if, in its reasonable opinion, any of the following circumstances apply:
- •
- an employee is found to be directly or indirectly responsible for the results or accounts or consolidated accounts of our
business being materially incorrect or misleading;
- •
- an employee is found to be directly or indirectly responsible for generating a business loss due to poor risk management;
or
- •
- the performance (company or individual) upon which our Parent based its compensation decision is found to have been based upon any material misrepresentation.
Benefits
We believe that providing a competitive retirement benefit for all employees is an important tool for attracting and retaining high-caliber talent throughout our organization. We provide a Profit Sharing and 401(k) Plan for all employees and generally contribute a percentage of compensation to such plans. We also provide other benefits such as medical, dental and life insurance and disability coverage to all eligible employees. We also maintain two non-qualified deferred compensation plans for select employees, including our named executive officers, to provide additional retirement plan flexibility to notionally invest such deferred amounts into a number of investment options. The Voluntary Deferral Plan allows eligible employees to defer a portion of their compensation on a tax deferred basis. The Deferred Compensation Plan allows us to contribute to the Plan through a Board approved contribution. The contribution is declared as a percentage of compensation and the maximum contribution between the qualified Profit Sharing and 401(k) Plan and the Deferred Compensation Plan is $50,000 per person annually.
2013 Compensation Process and Elements
In 2013, the compensation process was centered on incentive compensation, as base salaries were unchanged from the prior year. The process began with a determination of the aggregate size of both the Incentive Pool Accrual and the Value Incentive Plan, both of which are described below. The Incentive Pool Accrual was largely based on a formula for specific financial and operating goals, with 75% of incentive compensation determined by the extent to which we met or exceeded such goals. The remaining 25% was determined based on non-financial metrics. Similarly, the Value Incentive Plan, a long-term incentive plan for the period from 2011 to 2013, which was intended to reward employees for executing on the business plan in connection with this offering was formulaic, with a 60% weighting ascribed to financial performance metrics, and 40% tied to strategic objectives. Following the completion of this offering, incentive compensation will be determined without strict reference to the factors used in 2013, as more fully described below under the heading "—Compensation Plans Expected Post-Offering—Incentive Compensation."
Following the determination of the aggregate size of the Incentive Pool Accrual as described below, our Parent assessed the individual performance of named executive officers against individual objectives agreed to at the beginning of the year, upon which basis incentive compensation was awarded. Both the award recommendation and approval for our Chief Executive Officer were performed by our Parent. Further, our Parent reviewed the peer group compensation data and exercised judgment regarding compensation decisions for each executive.
2013 Compensation Elements—Cash Base Salary
There were no changes to base salaries for our named executive officers in 2013.
148
2013 Compensation Elements—Incentive Pool Accrual and Annual Incentive Compensation
The Incentive Pool Accrual, in which our named executive officers were eligible to participate, was based on the achievement of financial targets and non-financial objectives determined at the beginning of the fiscal year.
The 2013 Incentive Pool Accrual metrics were weighted with 75% tied to financial metrics and 25% to non-financial metrics. The financial metrics were based upon the goals set during the business planning process with our Parent prior to the beginning of the fiscal year, and for 2013 included Adjusted Operating Profit, Net Client Cash Flow, and the financial results of our Global Distribution Growth Initiative. Adjusted Operating Profit, or AOP, is a key measure used by our Parent in calculating our profit and is defined as a measure of underlying profitability which excludes any distortions from one-off items, market volatility and accounting treatments that are not reflective of a company's performance in its reporting period. Net Client Cash Flow is the difference in the amount of funds contributed by clients net of those withdrawn or redeemed, in aggregate, at our Affiliates. Global Distribution Growth Initiative is a financial metric that measures the cost of running our centralized distribution group relative to the earnings contributed to OMAM from the assets raised. The overall plan goal is set at the amount that was approved in the business planning process. The threshold and stretch goals were then set from the plan at 70% and 150%, respectively. If the threshold had not been met for a particular metric, there would have been no incentive pool generated for that particular metric. The incentive pool generated by reaching a stretch goal was capped at 150% of plan. For a result between threshold and stretch a linear interpolation was used to generate the corresponding bonus pool outcome for each element. The non-financial goals are set each year and include projects that are planned and agreed upon with our Parent, which included Business Restructuring for 2013. In addition, we included an explicit business risk management factor as one of the performance objectives we used to determine compensation for our named executive officers. The determination of the non-financial outcome was made by our Parent.
The aggregate amount awarded under the 2013 Incentive Pool was determined on the basis of the extent to which we achieved the financial and non-financial metrics described above. The pool included both the named executive officers as well as other executives within the organization. The financial metrics were determined based on the year-end financial results of the Company (with actual results including Rogge, which was transferred to our Parent in the second quarter of fiscal 2014), and our Parent made the determination on achievement of the non-financial metrics. The overall outcome of the pool was $15.08 million or 114.7% of plan goal. As shown in the chart below, there were three financial metrics. The 2013 outcome of AOP was $173.8 million, which was above plan but not at the stretch goal. The result for Net Client Cash Flow for 2013 was $16.3 billion which exceeded the stretch goal. As stated above, because the result exceeded the stretch goal, the outcome for this metric was capped at 150% of plan. The outcome of the Global Distribution Growth Initiative for 2013 was ($9.5) million which, like the AOP, exceeded the plan but did not meet the stretch goal. For both AOP and Global Distribution Growth Initiative, linear interpolation was used to determine the pool outcome for these metrics. On the non-financial metrics, our Parent scored us on Business Restructuring, which included a number of business initiatives that we have managed with our Affiliates, as well as an overall Risk Management score. Our Parent provided a rating of 95% and 125% of the plan goals, respectively.
Below is a chart showing the 2013 Incentive Pool metrics.
149
Weight
|
|
Threshold | Plan | Stretch | ||||
|---|---|---|---|---|---|---|---|---|
|
Financial | |||||||
50% |
Adjusted Operating Profit | $108.15 million | $154.5 million | $231.75 million | ||||
15% |
Net Client Cash Flow | $0.7 billion | $5.7 billion | $10.7 billion | ||||
10% |
Global Distribution Growth Initiative | $(12.7) million | $(10.3) million | $(5.2) million | ||||
|
Non-Financial |
|||||||
20% |
Business Restructuring | 0% | 100% | 150% | ||||
5% |
Risk | 0% | 100% | 150% |
In determining incentive compensation awards for our executives, our Parent evaluated each executive's individual performance on an objective and subjective basis and also assessed leadership behaviors, as measured by a 360-degree review process. All executive officers, including our named executive officers, had individual goals established near the beginning of the fiscal year. The goal process involves Mr. Bain setting goals for the overall business and those goals then being applied to the named executive officers as applicable to his or her individual duties and responsibilities. The named executive officers' goals for 2013 included the following:
- •
- Mr. Bain, Chief Executive Officer: 2013 goals focused on working
with the Affiliates on identified strategic projects including restructuring of operating frameworks and enhancement of business and growth prospects, demonstration of momentum in global distribution
with the goal of increasing our assets under management, execution on the acquisition initiative, and the efficient management OMAM through resource alignment and culture initiatives.
- •
- Mr. Belgrad, Chief Financial Officer: 2013 goals focused on
managing the business to achieve financial targets for Adjusted Operating Profit and Net Client Cash Flow, improving margin, as well as providing leadership during the Affiliate restructuring and
growth initiatives.
- •
- Ms. Gibson. Head of Global Distribution: 2013 goals focused on
achieving targets for assets raised through central distribution efforts and partnering with sales and distribution professionals at the Affiliates, conducting a review and fact-based analysis of
growth initiatives in new jurisdictions and overseeing key hiring to cover Canada and the Middle East.
- •
- Mr. Riordan, Head of Affiliate Management: 2013 goals focused on
restructuring of certain Affiliates to enhance business and growth prospects, establishing a strategic acquisition process, developing a pipeline of acquisition prospects, and the successful execution
of growth initiatives at Affiliates.
- •
- Mr. Hadley, Chief Talent Officer: 2013 goals included succession planning at Affiliates, establishing infrastructure to support market-driven hires outside the US, execution of talent development processes, resource alignment, and culture and talent enhancements.
The executive's individual goals and measurement of success varied with the individual executive's area of responsibility. In addition to what the executive achieves with respect to his or her annual goals, all executives were also evaluated on how he or she demonstrated our values through behaviors.
Incentive compensation took the form of both cash and equity, with the percentage of equity ranging from 20% to 50% of the total incentive award. The determinant of the percentage of equity was the size of the award, as larger awards featured a higher percentage of equity.
Determination of the amount of each executive's 2013 incentive award was discretionary and based upon a number of factors including individual performance, leadership behaviors, historical compensation levels and relativity to our peer group companies.
150
The 2013 incentive awards for the named executive officers were as follows: for Peter L. Bain, total incentive award of $8,323,000 ($4,296,500 in cash and $4,026,500 in equity), for Stephen H. Belgrad, total incentive award of $1,725,000 ($997,500 in cash and $727,500 in equity), for Linda T. Gibson, total incentive award of $2,475,000 ($1,372,500 in cash and $1,102,500 in equity), for Aidan J. Riordan, total incentive award of $1,350,000 ($810,000 in cash and $540,000 in equity), and for Christopher Hadley, total incentive award of $530,000 ($378,000 in cash and $152,000 in equity).
2013 Compensation Elements—Benefits
See Non-Qualified Deferred Compensation table for details of named executive officers' 2013 contributions and earnings.
2013 Compensation Elements—One-Time Value Incentive Plan (For the Period from 2011 to 2013)
The board of directors of our Parent established the Value Incentive Plan in 2011 to reward certain of our key employees, including our named executive officers, for performance above the three-year business plan in place at the time and in preparation of our initial public offering. The Value Incentive Plan was implemented on July 1, 2011, and the performance measurement period began on that date, and ended on December 31, 2013. The plan paid a one-time special incentive award of cash and restricted ordinary shares of our Parent specifically linked to performance that was above the agreed business plan and that would enhance readiness for this offering. The restricted shares component of this plan was designed to retain key employees by providing them with the opportunity to participate in our growth and future value creation prospects through awards of equity, thereby aligning the interests of our named executive officers and other key employees with those of our shareholders. Eleven of our key employees, including our named executive officers, participated in the plan, and payments were made in early 2014.
The aggregate amount awarded under the Value Incentive Plan was determined on the basis of the extent to which we achieved the financial and strategic metrics described below during the duration of the plan. Individual opportunities varied with each participant having a target amount and ultimately receiving a percentage of that target amount. Our Parent retained discretion to adjust the amount of a participant's target amount to take into account extraneous factors impacting the financial metrics, particularly as they related to our fair market value at the time of this offering.
The Value Incentive Plan contained seven metrics, each with an assigned percentage weighting that in the aggregate totaled 100%. Each metric was measured against three levels of performance, a threshold level (50% payout), target level (100% payout) and maximum level (150% payout). Since the intent of this one-time Value Incentive Plan was to incentivize performance above that agreed to in the business plan, the threshold level was set above the business plan. Therefore, achieving the business plan each year would not be sufficient to merit a payment under this plan. The overall payout of the Value Incentive Plan was 109.6% of target and was allocated on a formulaic basis to the participants. There were three financial metrics. Net Client Cash Flow is the difference in the amount of funds contributed by clients net of those withdrawn or redeemed in aggregate at our Affiliates. The result for 2013 was $16.3 billion, which exceeded the stretch goal. As a result, the maximum amount was allocated to this component. AOP is a key measure used by our Parent in calculating our profit. The Post-Minority Interest Margin is the AOP divided by revenue. The outcome of the AOP was $200 million and the resulting amount under the Value Incentive Plan was just above threshold. The outcome of the Post-Minority Interest margin was 27% which was slightly above target. The Value Incentive Plan awards for the named executive officers were as follows: for Peter L. Bain, total award of $3,654,666 ($1,877,333 in cash and $1,777,333 in equity), for Stephen H. Belgrad, total award of $1,370,500 ($735,250 in cash and $635,250 in equity), for Linda T. Gibson, total award of $1,370,500 ($735,250 in cash and $635,250 in equity), for Aidan J. Riordan, total incentive award of $1,096,400
151
($598,200 in cash and $498,200 in equity), and for Christopher Hadley, total incentive award of $328,920 ($214,460 in cash and $114,460 in equity).
Weight
|
|
Threshold (50%) | Target (100%) | Maximum (150%) | ||||
|---|---|---|---|---|---|---|---|---|
20% |
Net Client Cash Flows | $6 billion | $9 billion | $12 billion | ||||
20% |
Post-Minority Interest Margin | 22.50% | 26.30% | 30% | ||||
20% |
Adjusted Operating Profit | $190 million | $250 million | $310 million |
10% |
Execute on Restructuring | Acceptable | Good | Superior | ||||
10% |
Distribution Effectiveness | Acceptable | Good | Superior | ||||
10% |
Optimized Center | Acceptable | Good | Superior | ||||
10% |
Complete S-1 | Acceptable | Good | Superior |
Compensation Plans Expected Post-Offering
Following the consummation of this offering, we expect to keep base salaries consistent with 2013 levels in the near-term, and do not anticipate any changes to other benefits offered, except for the changes to incentive and equity incentive compensation detailed below. Pursuant to the Shareholder Agreement and the policies to be adopted by our Board of Directors, our Parent will have final approval over compensation for our named executive officers.
Incentive Compensation
Elements of our incentive compensation framework were formulaic on an historic basis. Going forward, the framework will be less quantitative and more flexible to allow the Compensation Committee to exercise more judgment. The Compensation Committee will determine, subject to final approval by our Parent, incentive compensation for the named executive officers based on its discretionary assessment of our actual results versus financial and operating metrics agreed upon prior to the beginning of the calendar year, the named executive officer's prior year total compensation relative to changes in our overall performance, and competitive market trends. This process empowers the Compensation Committee to exercise more discretion.
Furthermore, the new compensation plan will be more consistent with that of other publicly-traded asset management companies. A portion of the incentive compensation will continue to be paid in the form of equity. We expect that the percentage paid in shares will remain at levels consistent with our historical practice. We expect that future grants will be split between a grant subject to a three-year ratable vesting schedule and a long-term incentive award of shares that will vest at the end of three years subject to performance conditions. These awards may include stock options, restricted stock, restricted stock units, stock appreciation rights or other stock-based awards based on our ordinary shares.
We intend that grants of our ordinary shares will be subject to a clawback provision, as detailed in "—Elements of Compensation—Equity Incentive Compensation."
As a public company, we expect to impose on our named executive officers ongoing restrictions on the disposition of their holding of our ordinary shares granted through equity awards in-line with our industry competitors. We believe that equity ownership guidelines align the interests of executive officers and directors with those of our shareholders.
152
Conversion from Old Mutual plc Restricted Shares
In connection with this offering, it is our intention to provide a program to allow the conversion of unvested Old Mutual plc restricted shares currently held by our named executive officers into restricted shares in our new restricted share plan with vesting conditions similar to those to which they are currently subject in order to strengthen the alignment between the shareholders and senior management.
Benefits
The Company does not plan to amend its policy on benefits following the completion of this offering.
Tax Deductibility of Compensation
When our Compensation Committee reviews compensation matters, it will consider the anticipated tax and accounting treatment of various payments and benefits to us and, when relevant, to our named executive officers, although these considerations are not dispositive. Section 162(m) of the Code, or Section 162(m), generally disallows a tax deduction to a publicly-traded corporation that pays compensation in excess of $1 million to any of its named executive officers (other than the chief financial officer) in any taxable year, unless the compensation plan and awards meet certain requirements. As a wholly-owned subsidiary of our Parent, Section 162(m) does not currently apply to our compensation arrangements. However, following this offering, we will become subject to the deduction limits of Section 162(m). Accordingly, following this offering, we will generally endeavor to structure compensation to qualify as performance-based under Section 162(m), where it is reasonable to do so while meeting our compensation objectives. However, our Compensation Committee may approve compensation arrangements, or changes to plans, programs or awards, that may cause the compensation or awards to our executive officers to exceed the limitation under Section 162(m) if it determines that such action is in our best interests and will promote our varying corporate goals.
Change of Control and Severance Arrangements
Change of Control
Equity compensation has historically been awarded in the form of restricted ordinary shares of our Parent. In the event of a change of control of our Parent current forfeitable share awards vest in full and are considered as deferred short-term incentive awards that have already been earned. It is our intention to continue this practice with respect to our own share programs, and we expect that shares would vest in the event of a change of control of our Company or our Parent's change of control, provided that our Parent retains majority ownership.
Currently we have no change-of-control agreements with any executives, and do not intend to enter into any such agreements following this offering.
We entered into employment agreements with Mr. Bain and Ms. Gibson upon the start of their employment with us in 2011 and 2002 respectively. See "—Employment Agreements" for further detail. We do not plan to change these agreements post-offering.
Except to the extent described in the employment agreements with Mr. Bain and Ms. Gibson (See "—Employment Agreements" for further detail), we have no severance agreements with any executives.
Pursuant to Mr. Bain's employment agreement, if Mr. Bain's employment had been terminated by us other than for cause and without notice on December 31, 2013, he would have been entitled to receive the following: a monthly severance payment of $54,167 for six months, a bonus payment of $7,405,400, which is based on Mr. Bain's 2012 bonus but would be subject to approval by our Parent,
153
and a payment of $15,207 relating to COBRA coverage. If Mr. Bain's employment was terminated due to disability or death on December 31, 2013, he (or his estate) would have been entitled to receive a bonus payment of $7,405,400, subject to approval by our Parent.
Pursuant to a severance arrangement and Ms. Gibson's employment agreement, if Ms. Gibson's employment had been terminated by us other than for cause and without notice on December 31, 2013, she would have been entitled to receive the following: a monthly severance payment of $216,667 for twelve months, a bonus payment of $2,225,000, which is based on Ms. Gibson's 2012 bonus but would be subject to approval by our Parent, and a payment of $30,414 relating to COBRA coverage. If Ms. Gibson's employment was terminated due to disability or death on December 31, 2013, she (or her estate) would have been entitled to receive a bonus payment of $2,225,000, subject to approval by our Parent.
2013 Summary Compensation Table
Name and Principal Position
|
Year | Salary ($) |
Stock Awards ($)(1) |
Non-Equity Incentive Plan Compensation ($)(2) |
All Other Compensation ($)(3) |
Total ($) |
||||||||||||
|---|---|---|---|---|---|---|---|---|---|---|---|---|---|---|---|---|---|---|
Peter L. Bain |
2013 | $ | 650,000 | $ | 2,888,106 | $ | 6,173,833 | $ | 311,309 | $ | 10,023,248 | |||||||
President & Chief |
||||||||||||||||||
Executive Officer and |
||||||||||||||||||
Director |
||||||||||||||||||
Stephen H. Belgrad |
2013 |
$ |
300,000 |
$ |
600,000 |
$ |
1,732,750 |
$ |
84,434 |
$ |
2,717,184 |
|||||||
Executive Vice President, |
||||||||||||||||||
Chief Financial Officer |
||||||||||||||||||
and Director |
||||||||||||||||||
Linda T. Gibson |
2013 |
$ |
375,000 |
$ |
830,000 |
$ |
2,107,750 |
$ |
136,312 |
$ |
3,449,062 |
|||||||
Executive Vice President, |
||||||||||||||||||
Head of Global |
||||||||||||||||||
Distribution and Director |
||||||||||||||||||
Aidan J. Riordan |
2013 |
$ |
300,000 |
$ |
340,000 |
$ |
1,408,200 |
$ |
62,803 |
$ |
2,111,003 |
|||||||
Executive Vice President, |
||||||||||||||||||
Head of Affiliate |
||||||||||||||||||
Management |
||||||||||||||||||
Christopher Hadley |
2013 |
$ |
250,000 |
$ |
85,000 |
$ |
592,460 |
$ |
56,237 |
$ |
983,697 |
|||||||
Executive Vice President, |
||||||||||||||||||
Chief Talent Officer |
||||||||||||||||||
- (1)
- The amount in the Stock Awards column is the grant date fair value of stock awards determined pursuant to FASB Topic 718. All of the stock awards reported in the Stock Awards column are restricted stock awards under the Old Mutual plc Restricted Share Plan for U.S. Employees. Grants were made on April 8, 2013 with respect to awards earned pursuant to our Annual Incentive Plan for the 2012 performance year. Stock awards attributable to the Annual Incentive Plan for 2013, as described in the "Compensation Discussion and Analysis," will be reported in the 2014 Summary Compensation Table. Restricted stock shares vest 100% on the third anniversary of the date of grant. Dividends are payable during the restricted period. See Note 2 "Significant Accounting Policies—Share-Based Compensation Plan" and Note 17 in the notes to our Consolidated Financial Statements for further discussion of the valuation methodology. To see the value actually received by the named executive officers in 2013 upon vesting of stock, refer to the
154
2013 Option Exercises and Stock Vested table. Additional information on all outstanding stock awards is reflected in the 2013 Outstanding Equity Awards table.
- (2)
- The
amounts reported in the Non-Equity Incentive Plan Compensation column reflect the cash portion of the amounts earned by each named executive officer
under the Company's Annual Incentive Plan in 2013 and paid to employees on February 28, 2014, including for Mr. Bain $4,296,500, for Mr. Belgrad $997,500, for Ms. Gibson
$1,372,500, for Mr. Riordan $810,000 and for Mr. Hadley $378,000. See "Compensation Discussion and Analysis—2013 Compensation Elements—Annual Incentive
Compensation" for a discussion of how the 2013 Annual Incentive Plan awards to the named executive officers were determined. The amount also includes the One-Time Value Incentive Plan cash award
amounts paid on March 7, 2014. Mr. Bain's cash portion of his Value Incentive Plan award was $1,877,333, Mr. Belgrad's was $735,250, Ms. Gibson's was $735,250,
Mr. Riordan's was $598,200 and Mr. Hadley's was $214,460. The Value Incentive Plan is non-recurring. See "Compensation Discussion and Analysis—2013 Compensation Process and
Elements—2013 Compensation Elements—One-Time Value Incentive Plan (For the Period from 2011 to 2013)" for further information.
- (3)
- The amounts reported in the All Other Compensation column reflect, for each named executive officer, the sum of (i) contributions by the Company under its Profit Sharing and 401(k) Plan and its non-qualified deferred compensation plan, (ii) dividends paid on unvested restricted stock of our Parent and (iii) perquisites including parking, club membership, supplemental long-term disability, spousal travel and entertainment and travel to an outside board meeting. See "—2013 All Other Compensation Detail."
The following table outlines those perquisites and other personal benefits and additional all other compensation.
2013 All Other Compensation Detail
Name
|
Year | Total Perquisites |
Defined Contribution Savings Plan Company Contributions |
Dividends Not Factored in Grant Date Fair Value of Equity Awards |
Total All Other Compensation |
||||||||||
|---|---|---|---|---|---|---|---|---|---|---|---|---|---|---|---|
Peter L. Bain(1) |
2013 | $ | 17,118 | $ | 50,000 | $ | 244,191 | $ | 311,309 | ||||||
Stephen H. Belgrad |
2013 | — | $ | 50,000 | $ | 34,434 | $ | 84,434 | |||||||
Linda T. Gibson(2) |
2013 | $ | 13,622 | $ | 50,000 | $ | 72,690 | $ | 136,312 | ||||||
Aidan J. Riordan |
2013 | — | $ | 50,000 | $ | 12,803 | $ | 62,803 | |||||||
Christopher Hadley |
2013 | — | $ | 50,000 | $ | 6,237 | $ | 56,237 | |||||||
- (1)
- Perquisites
for Mr. Bain include parking, club membership, supplemental long-term disability and spousal travel and entertainment.
- (2)
- Perquisites for Ms. Gibson include parking, supplemental long-term disability, spousal travel and entertainment and travel to an outside board meeting.
155
2013 Grants of Plan-Based Awards
| |
|
|
Estimated Future Payouts Under Nonequity Incentive Plan Awards |
Estimated Future Payouts Under Equity Incentive Plan Awards |
|
|
|||||||||||||
|---|---|---|---|---|---|---|---|---|---|---|---|---|---|---|---|---|---|---|---|
| |
|
|
All Other Stock Awards: Number of Shares of Stock or Units (#) |
|
|||||||||||||||
| |
|
|
Grant Date Fair Value of Stock and Option Awards ($)(3) |
||||||||||||||||
Name
|
Grant Date |
Approval or Action Date, if different |
Target ($)(1) |
Target ($)(2) |
|||||||||||||||
Peter L. Bain |
3/1/2013 | 2/27/2013 | $ | 3,870,000 | — | — | — | ||||||||||||
|
4/8/2013 | 2/27/2013 | — | $ | 2,480,000 | 967,725 | $ | 2,888,106 | |||||||||||
Stephen H. Belgrad |
3/1/2013 |
1/31/2013 |
$ |
930,000 |
— |
— |
— |
||||||||||||
|
4/8/2013 | 1/31/2013 | — | $ | 520,000 | 201,044 | $ | 600,000 | |||||||||||
Linda T. Gibson |
3/1/2013 |
1/31/2013 |
$ |
1,335,000 |
— |
— |
— |
||||||||||||
|
4/8/2013 | 1/31/2013 | — | $ | 790,000 | 278,111 | $ | 830,000 | |||||||||||
Aidan J. Riordan |
3/1/2013 |
1/31/2013 |
$ |
420,000 |
— |
— |
— |
||||||||||||
|
4/8/2013 | 1/31/2013 | — | $ | 180,000 | 113,925 | $ | 340,000 | |||||||||||
Christopher Hadley |
3/1/2013 |
1/31/2013 |
$ |
230,000 |
— |
— |
— |
||||||||||||
|
4/8/2013 | 1/31/2013 | — | $ | 70,000 | 28,482 | $ | 85,000 | |||||||||||
- (1)
- The
amounts represent the target awards under the Annual Incentive Plan relating to performance in fiscal 2012. The related awards were granted and paid on
March 1, 2013. The actual cash payments are not included in the Non-Equity Incentive Plan Compensation column of the 2013 Summary Compensation Table because they were earned in 2012 and paid in
2013.
- (2)
- The
amounts represent the target for the awards of restricted shares of our Parent under the Old Mutual plc Restricted Share Plan relating to
performance in fiscal 2012. The related awards were granted on April 8, 2013.
- (3)
- Market value was determined by multiplying the number of Old Mutual plc ordinary shares by $2.98, the closing price of Old Mutual plc ordinary shares in U.S. Dollars on April 8, 2013.
Employment Agreements
Mr. Bain's Employment Agreement. We entered into an employment agreement with Mr. Bain, our President and Chief Executive Officer, upon the start of his employment with us on February 22, 2011. Mr. Bain's agreement does not specify his salary; instead, his salary is reviewed annually and may be modified. In addition, Mr. Bain is eligible to participate in the following plans: (i) our bonus plan(s), (ii) the Old Mutual Share Reward Plan and (iii) the Value Incentive Plan described under "—2013 Compensation Elements—One-Time Value Incentive Plan (For the Period Between 2011-2013)."
Mr. Bain is an employee at-will. We may terminate the agreement and Mr. Bain's employment for cause, as that term is defined in the agreement, immediately upon written notice. Upon termination for cause, all of Mr. Bain's compensation and benefits under the agreement will cease. Either we or Mr. Bain may terminate the agreement and Mr. Bain's employment for any reason by giving the other party not less than six months' notice in writing. If notice is served by either party, we are entitled to terminate Mr. Bain's employment at any time during the six-month "notice period" starting on the day notice is served. If we serve notice to Mr. Bain, and whether or not we continue to employ him for the six-month notice period, we must (i) continue his salary in the form of salary continuation payments for the remainder of the notice period, and (ii) make a lump sum taxable payment to Mr. Bain sixty days following the date of termination equal to our share of the cost of family medical and dental benefits with respect to our similarly situated active employees for the remainder of the notice period. Mr. Bain would remain eligible for a bonus for the year in which his employment is terminated. Mr. Bain will not be automatically eligible for any payments under any severance plan that we may have in effect as of the date of his termination, and severance pay, if any, will be determined by the Remuneration
156
Committee based on the circumstances of the termination. If there are any contingent compensation arrangements in place, then Mr. Bain will be entitled to receive the contingent compensation owed to him subject to (i) his satisfactory individual performance to the end of the notice period or such shorter period as determined by us and (ii) his fulfillment of his obligations and covenants as set forth in his employment agreement. If Mr. Bain provides notice of the termination of his employment to us, then Mr. Bain will be eligible only for salary continuation payments during the notice period and will not be entitled to any further compensation. If Mr. Bain resigns prior to the expiration of a six-month notice period, then he will not be entitled to any further compensation or benefits. We have the right to terminate the agreement and Mr. Bain's employment on the 90th day after serving written notice to Mr. Bain that we have determined in good faith that a "disability", as that term is defined in the agreement, has occurred, provided that, within 90 days of such notice, Mr. Bain has not returned to full-time performance of his essential functions. If the agreement is terminated based on disability, Mr. Bain will remain eligible for a prorated bonus for the period up through the date of termination as well as any contingent compensation owed to him. The agreement will terminate automatically upon Mr. Bain's death, and all compensation and benefits under the agreement will cease effective as of the date of his death, except that his estate will be eligible to receive his bonus, prorated for the period up through the date of his death, as well as any contingent compensation owed to him. Mr. Bain's receipt of any of the compensation and benefits described in this paragraph will be subject to and conditioned upon his execution of a separation agreement that must include a complete customary release of claims by him to us and our Affiliates.
Mr. Bain is subject to non-compete covenants during the term of his employment, including the six-month notice period described above. In addition, Mr. Bain is subject to a non-solicitation of employees covenant and a non-interference covenant during the term of his employment, the six-month notice period, and for a period of one year after expiration of the later of the notice period or the date of his termination of employment.
Ms. Gibson's Employment Agreement. We entered into an employment agreement with Ms. Gibson, our Executive Vice President and Head of Global Distribution, on February 21, 2002. Ms. Gibson's agreement does not specify her salary; instead, her salary is reviewed annually and any modification is in our absolute discretion. In addition, Ms. Gibson is eligible to participate in the following plans: (i) our bonus plan(s) and (ii) the Old Mutual Share Reward Plan.
Ms. Gibson is an employee at-will. We may terminate the agreement and Ms. Gibson's employment for cause, as that term is defined in the agreement, immediately upon written notice. Upon termination for cause, all of Ms. Gibson's compensation and benefits under the agreement will cease. Either we or Ms. Gibson may terminate the agreement and Ms. Gibson's employment for any reason by giving the other party not less than six months' notice in writing. If notice is served by either party, we are entitled to terminate Ms. Gibson's employment at any time during the six-month "notice period" starting on the day notice is served. If we serve notice to Ms. Gibson, and whether or not we continue to employ her during the six-month notice period, we must (i) continue her compensation, medical and dental benefits for the remainder of the notice period and (ii) pay to Ms. Gibson other severance as may be provided for in our severance plan in effect as of the date of her termination. Ms. Gibson would remain eligible for a bonus for the year in which her employment is terminated. If there are any contingent compensation arrangements in place, then Ms. Gibson will be entitled to receive the contingent compensation owed to her subject to (i) her satisfactory individual performance to the end of the notice period or such shorter period as determined by us and (ii) her fulfillment of her obligations and covenants as set forth in her employment agreement. If Ms. Gibson provides notice of the termination of her employment to us, then Ms. Gibson will only be eligible to receive her compensation, medical and dental benefits for the remainder of the notice period and will not be entitled to any further compensation. If Ms. Gibson resigns prior to the expiration of a six-month notice period, then she will not be entitled to any further compensation or benefits. We have the right
157
to terminate the agreement and Ms. Gibson's employment on the 90th day after serving written notice to Ms. Gibson that we have determined in good faith that a "disability", as that term is defined in the agreement, has occurred, provided that, within 90 days of such notice, Ms. Gibson has not returned to full-time performance of her essential functions. If the agreement is terminated based on disability, Ms. Gibson will remain eligible for a prorated bonus for the period up through the date of termination as well as any contingent compensation owed to her. The agreement will terminate automatically upon Ms. Gibson's death, and all compensation and benefits under the agreement will cease effective as of the date of her death, except that her estate will be eligible to receive her bonus, prorated for the period up through the date of her death, as well as any contingent compensation owed to her. Ms. Gibson's receipt of any of the compensation and benefits described in this paragraph will be subject to and conditioned upon her execution of a separation agreement that must include a complete customary release of claims by her to us and our Affiliates. Pursuant to a severance arrangement, upon a termination by us other than for cause, Ms. Gibson will be entitled to (i) 12 months' base salary continuation, (ii) an amount equal to her most recent bonus and (iii) an amount equal to our portion of the cost of medical and dental benefits continuation for a period of 12 months.
Ms. Gibson is subject to non-compete covenants during the term of her employment, including the six-month notice period described above. In addition, Ms. Gibson is subject to a non-solicitation of employees covenant and a non-interference covenant during the term of her employment, the six-month notice period, and for a period of one year after expiration of the later of the notice period or the date of her termination of employment.
2013 Outstanding Equity Awards at Fiscal Year-End
| |
|
Stock Awards | |||||||
|---|---|---|---|---|---|---|---|---|---|
Name
|
Grant Date | Number of Shares or Units of Stock that Have Not Vested (#)(1) |
Market Value of Shares or Units of Stock that Have Not Vested ($)(2) |
||||||
Peter L. Bain |
4/8/2013 | 967,725 | $ | 2,922,530 | |||||
|
4/10/2012 | 588,225 | $ | 1,776,440 | |||||
|
4/11/2011 | 616,908 | $ | 1,863,062 | |||||
Stephen H. Belgrad |
4/8/2013 |
201,044 |
$ |
607,153 |
|||||
|
4/10/2012 | 105,354 | $ | 318,169 | |||||
Linda T. Gibson |
4/8/2013 |
278,111 |
$ |
839,895 |
|||||
|
4/10/2012 | 224,755 | $ | 678,760 | |||||
|
4/11/2011 | 143,941 | $ | 434,702 | |||||
Aidan J. Riordan |
4/8/2013 |
113,925 |
$ |
344,054 |
|||||
Christopher Hadley |
4/8/2013 |
28,482 |
$ |
86,016 |
|||||
|
4/10/2012 | 16,681 | $ | 50,377 | |||||
|
4/11/2011 | 10,334 | $ | 31,209 | |||||
- (1)
- The
grants of restricted shares of Old Mutual plc were made under the Old Mutual plc Restricted Stock Plan for U.S. Employees. The shares of
restricted stock vest three years following each grant date.
- (2)
- Market value was determined by multiplying the number of Old Mutual plc ordinary shares by $3.02, the closing price of Old Mutual plc ordinary shares in U.S. dollars on December 31, 2013.
158
2013 Options Exercised and Stock Vested
| |
Stock Awards | ||||||
|---|---|---|---|---|---|---|---|
Name
|
Number of Shares Acquired on Vesting (#) |
Value Realized on Vesting ($)(1) |
|||||
Peter L. Bain |
0 | $ | 0 | ||||
Stephen H. Belgrad |
0 | $ | 0 | ||||
Linda T. Gibson |
194,003 | $ | 598,533 | ||||
Aidan J. Riordan |
0 | $ | 0 | ||||
Christopher Hadley |
10,624 | $ | 32,777 | ||||
- (1)
- The value realized upon vesting of restricted stock is calculated by multiplying the fair market value of an ordinary share on the vesting date ($3.085, which was the average of the high and low trading prices of Old Mutual plc ordinary shares on the vesting date in U.S. dollars) by the number of shares vested.
2013 Non-Qualified Deferred Compensation
The following table provides information on the named executive officers' participation in the Voluntary Deferral Plan and the Deferred Compensation Plan. These plans either allow eligible employees to defer part of their salary and annual incentive compensation on a voluntary basis or provide additional pre-tax contributions by the Company to employees whose profit-sharing contributions were limited under the tax-qualified plan. The Company contribution under the Deferred Compensation Plan is at the same rate of contribution as the contribution to the Profit Sharing and 401(k) Plan. Additional details of the Voluntary Deferral Plan and the Deferred Compensation Plan are described in "—Our Executive Compensation Practices and Policies—Elements of Compensation—Benefits."
Name
|
Plan | Executive Contributions in Last FY ($)(1) |
Registrant Contribution in Last FY ($)(2) |
Aggregate Earnings in Last FY ($)(3) |
Aggregate Withdrawals/ Distributions in Last FY ($) |
Aggregate Balance at Last FYE ($) |
||||||||||||
|---|---|---|---|---|---|---|---|---|---|---|---|---|---|---|---|---|---|---|
Peter L. Bain |
Voluntary Deferral Plan | $ | 229,825 | — | $ | 30,255 | — | $ | 339,101 | |||||||||
|
Deferred Compensation Plan | — | $ | 24,500 | $ | 6,120 | — | $ | 58,037 | |||||||||
Stephen H. Belgrad |
Voluntary Deferral Plan |
$ |
273,750 |
— |
$ |
41,386 |
— |
$ |
341,386 |
|||||||||
|
Deferred Compensation Plan | — | $ | 24,500 | $ | 3,811 | — | $ | 28,811 | |||||||||
Linda T. Gibson |
Voluntary Deferral Plan |
— |
— |
— |
— |
— |
||||||||||||
|
Deferred Compensation Plan | — | $ | 24,500 | $ | 52,299 | — | $ | 359,050 | |||||||||
Aidan J. Riordan |
Voluntary Deferral Plan |
$ |
102,500 |
— |
— |
— |
— |
|||||||||||
|
Deferred Compensation Plan | — | $ | 24,500 | $ | 5,398 | — | $ | 30,398 | |||||||||
Christopher Hadley |
Voluntary Deferral Plan |
— |
— |
— |
— |
— |
||||||||||||
|
Deferred Compensation Plan | — | $ | 24,500 | $ | 21,299 | — | $ | 101,720 | |||||||||
- (1)
- The
amounts for Mr. Bain reflect deferral made from his 2013 salary and 2013 annual incentive compensation (paid in 2014). The amounts for
Mr. Belgrad and Mr. Riordan include deferrals from their 2013 annual incentive compensation paid in 2014. Salary deferrals are reported in the "Salary" column of the 2013 Summary
Compensation Table. The incentive deferrals are reported in the "Non-Equity Incentive Plan Compensation" column of the 2013 Summary Compensation Table.
- (2)
- All
company contributions are included in the "All Other Compensation" column of the 2013 Summary Compensation Tables.
- (3)
- The earnings reflected represent deemed investment earnings or losses from voluntary deferrals and Company contributions, as applicable. The Voluntary Deferral Plan and the Deferred Compensation Plan do not guarantee a
159
return on deferral amounts. For these plans, no earnings are reported in the 2013 Summary Compensation Table because the plans do not provide for above-market or preferential earnings.
Director Compensation
OMAM was formed in May 2014 and, therefore, did not pay any director compensation in 2013. We do not expect to pay our directors who are also our employees any compensation for their services as directors. OMAM anticipates compensating its non-employee directors with an annual cash retainer and an annual equity award. OMAM also anticipates providing additional compensation to the chairpersons of its Audit Committee, Compensation Committee and the Nominating and Corporate Governance Committee.
160
CERTAIN RELATIONSHIPS AND RELATED PARTY TRANSACTIONS
Relationship with Our and OMGUK Parent Following This Offering
Prior to the completion of this offering, we are a wholly-owned subsidiary of our Parent and have been included in our Parent's consolidated operations. Following this offering, we expect that our Parent will continue to indirectly own a majority of our ordinary shares for the foreseeable future, and as a result, our Parent will continue to have significant control over our business and affairs including the composition of our Board of Directors and with respect to any action requiring the approval of our shareholders. Please see "Risk Factors—Risks Related to Our Ownership Structure" for more information.
Prior to or concurrently with the completion of this offering, we will enter into certain agreements with our Parent and OMGUK. In addition, we expect that our Parent will continue to consolidate our financial results in its financial statements. The following descriptions of such agreements and transactions are summaries only and are qualified in their entirety by reference to the complete documents, each of which will be filed as an exhibit to the registration statement of which this prospectus is a part.
Shareholder Agreement
Concurrently with the completion of this offering, we will enter into a shareholder agreement with our Parent that will, together with our articles of association (as amended from time to time), govern certain aspects of our continuing relationship with our Parent, which we refer to as the Shareholder Agreement. The Shareholder Agreement will govern the composition of our Board of Directors and other corporate governance matters, consent rights that our Parent will have over certain business actions taken by us and our subsidiaries and information rights granted to our Parent.
Board of Directors and Corporate Governance Rights
The Shareholder Agreement will entitle our Parent to designate a specific number of nominees for election to our Board of Directors, which we refer to as the Parent Group Directors. The number of Parent Group Director nominees that our Parent is entitled to designate is based on its beneficial ownership of our ordinary shares as follows:
- •
- until and including the date on which our Parent first ceases to beneficially own more than 50% of our outstanding
ordinary shares (which we refer to as the Majority Holder Date), our Parent will be entitled to nominate a majority of our directors;
- •
- after the Majority Holder Date and until our Parent first ceases to beneficially own more than 35% of our outstanding
ordinary shares (which we refer to as the First Threshold Date), our Parent will be entitled to nominate three directors if there are at least eight directors on our Board of Directors or two
directors if there are fewer than eight directors on our Board of Directors;
- •
- after the First Threshold Date and until our Parent first ceases to beneficially own more than 20% of our outstanding
ordinary shares (which we refer to as the Second Threshold Date), our Parent will be entitled to nominate two directors; and
- •
- after the Second Threshold Date and until our Parent first ceases to beneficially own more than 7% of our outstanding ordinary shares (which we refer to as the Third Threshold Date), our Parent will be entitled to nominate one director.
Following the Third Threshold Date, our Parent will have no further rights to nominate Parent Group Directors.
161
The Shareholder Agreement will also provide that our Parent shall have the right to increase the size of our Board of Directors from seven to nine directors and designate the Chairman of our Board of Directors until the Majority Holder Date.
The Shareholder Agreement will require that (i) until the Majority Holder Date, at least two members of the Nominating Committee and Compensation Committee shall be Parent Group Directors, (ii) until the Second Threshold Date, at least one member of the Audit Committee, Nominating Committee and Compensation Committee shall be a Parent Group Director who must be an "Independent Director", as defined by NYSE listing rules and Rule 10A-3 under the Exchange Act, if our Parent has designated an Independent Director to so serve on our Board of Directors (which it will not be required to do) and (iii) each of the Audit, Compensation and Nominating Committees shall consist of at least three directors.
Consent Rights
The Shareholder Agreement will provide that, after the Majority Holder Date and until the first date on which our Parent no longer beneficially owns more than 25% of our outstanding ordinary shares, the prior consent of our Parent will be required before we may take any of the following actions, whether directly or indirectly through a subsidiary or controlled affiliate:
- •
- any merger or acquisition with consideration paid or payable (including a pro rata share of the debt assumed) of more than
$100 million, or any disposition of assets with a fair market value of more than $100 million, involving us or one of our subsidiaries or controlled affiliates, on the one hand, and any other
person, on the other hand;
- •
- any incurrence or guarantee of (or grant of a lien with respect to) external recourse debt in an amount greater than
$300 million, plus the principal amount of the outstanding external debt on the Majority Holder Date;
- •
- any issuance of share capital other than (i) issuances of equity awards to directors or employees pursuant to a
compensation plan or (ii) issuances of share capital in connection with an acquisition involving a consideration payable not exceeding $100 million;
- •
- entry into or termination of any strategic joint venture or strategic alliance involving assets in excess of
$100 million;
- •
- any declaration or payment of a dividend other than in accordance with our dividend policy in effect as of the Majority
Holder Date;
- •
- listing or delisting of any securities on a securities exchange;
- •
- any agreement or arrangement that would conflict with the terms of the Shareholder Agreement;
- •
- any amendment to our constitutional documents; and
- •
- any filing or petition under bankruptcy laws, admission of insolvency or similar actions by us or any of our subsidiaries or controlled affiliates, or our dissolution or winding-up.
Conflict of Interest Authorization and Change of Control Notification Rights
The Shareholder Agreement will provide that our Independent Directors authorize a conflict of interest right under the U.K. Companies Act in favor of our Parent's Board designees with respect to related party transactions and any merger, substantial sale of assets, acquisition of 30% or more of our ordinary shares, or any other change of control transaction between us and any unaffiliated third party. Based on this right, our articles of organization will include a provision granting OMGUK, and any other subsidiary of our Parent through which its interest in us is directly or indirectly held, information
162
rights with respect to discussions between us and any person regarding such transactions. In addition, until the Second Threshold Date, the Shareholder Agreement will provide that our organizational documents contain provisions obligating us to promptly inform our Parent of all inquiries made or received by us regarding potential change of control transactions.
Information and Consultation Rights; Disclosure and Financial Accounting
The Shareholder Agreement will require us to provide our Parent with information and data relating to our and our subsidiaries' business and financial results and access to our personnel, data and systems until the Second Threshold Date. Furthermore, the Shareholder Agreement will provide for the establishment of a reporting coordination committee to facilitate the financial reporting of our Company and our Parent. Until the Second Threshold Date, the Shareholder Agreement requires us to coordinate with our Parent with respect to the timing of earnings releases and the release of any material information related to our Company subject to our obligations to comply with applicable laws. To the extent practicable, we must provide our Parent with a copy of any public release prior to publication and consider in good faith incorporating any comments provided by our Parent.
Preemptive Rights
The Shareholder Agreement will provide OMGUK with the right to purchase its pro rata share of any issuances of share capital by us until the Third Threshold Date, other than issuances of (i) share capital as consideration for mergers, consolidations or similar transactions, (ii) equity awards to directors or employees pursuant to a compensation plan and (iii) share capital of one of our subsidiaries to or by one of our wholly-owned subsidiaries.
Lock-Up
The Shareholder Agreement will obligate our Parent to agree with the underwriters in any future public securities offering by us to a lock-up period of up to 90 days.
Non-Solicitation
We and our Parent will agree that, until the Third Threshold Date, without the prior written consent of either party, neither we nor they will solicit any then-current employee of the other party with respect to employment.
Term
The Shareholder Agreement will terminate on the Third Threshold Date.
Registration Rights Agreement
Concurrently with the closing of this offering, we expect to enter into a registration rights agreement with our Parent, pursuant to which our Parent may require us, beginning after the first anniversary of the consummation of this offering, to file one or more registration statements with the SEC covering the public resale of registrable securities beneficially owned by our Parent and its subsidiaries with expected aggregate gross proceeds of at least $50 million. We will not be obligated to effect more than one demand registration, in addition to any registration on a shelf registration statement, in any six-month period. We will be obligated to file a shelf registration statement upon any request made by our Parent after the first anniversary of the consummation of this offering. In addition, our Parent will have certain "piggy-back" registration rights, pursuant to which it will be entitled to register the resale of its registrable securities alongside any offering of securities that we may undertake, and the amount of securities we may offer may be subject to "cutback" in certain cases. We will be responsible for the expenses associated with any sale under the agreement by our Parent,
163
except for its legal fees and underwriting discounts, selling commissions and transfer taxes applicable to such sale.
Transitional Servicemark License Agreement
Immediately prior to the completion of this offering, we intend to enter into a transitional servicemark license agreement with OMUSH, our Parent, and, solely for the intellectual property owned by it applicable to the agreement, OMLACSA, which we refer to as the Servicemark Agreement. Pursuant to the Servicemark Agreement, our Parent and OMLACSA will grant us a limited, non-exclusive, fully paid-up, royalty-free, non-transferable, non-sublicensable license to use certain trademarks, servicemarks, names and logos, or, collectively, the Servicemarks, including the name "Old Mutual", with respect to our business and in connection with this offering, worldwide, subject to certain exceptions set forth in the Servicemark Agreement. The license term shall be for the period commencing on the date of the closing of this offering and ending six months after the date on which our Parent ceases to directly or indirectly own a majority of our outstanding ordinary shares.
At the end of the license term, we must cease using the Servicemarks, but we will be permitted to make historical reference to our affiliation with our Parent or OMLACSA solely to the extent required under applicable law to describe the historical performance of our business or to indicate that we were formerly operating under the name "Old Mutual".
Under the Servicemark Agreement, six months after our Parent ceases to directly or indirectly own a majority of our outstanding ordinary shares, we are obligated to cease use of any and all domain names containing the term "Old Mutual," "OMAM" or "OM" that we owned prior to the closing of this offering and transfer such domain names to our Parent. For a period of twelve months commencing on the date on which our Parent ceases to own a majority of our outstanding ordinary shares, our Parent will redirect all attempts by users to access such domain names to a single new domain name to be managed by us, which will not contain the terms "Old Mutual", "OMAM" or "OM."
Under the Servicemark Agreement, we will indemnify our Parent, OMLACSA, their respective affiliates, and their respective directors, officers, and employees from and against any third-party claims resulting from our breach of the Servicemark Agreement. Our Parent and OMLACSA, jointly and severally, will indemnify us, our subsidiaries, and our respective affiliates, directors, officers, and employees from and against any third-party claims resulting from our Parent's or OMLACSA's breach of the Servicemark Agreement.
Transition Services Agreement
Immediately prior to the completion of this offering, we intend to enter into a transition services agreement with our Parent. The transition services agreement will establish that our Parent will provide certain transition services to us for a -month period following the Majority Holder Date. The transition services include . We will pay our Parent for these services.
Deferred Tax Asset Arrangement
In connection with this offering, we will enter into an arrangement with OMGUK that will provide for the payment by OMAM to OMGUK of $279.3 million of existing deferred tax assets as of June 30, 2014 referred to as the Pre-IPO Tax Assets, subject to repayment if, and to the extent that, the Pre-IPO Tax Assets are determined not to be available. For the purposes of this arrangement, the tax savings we realize will be computed by comparing our actual tax liabilities with the liability for tax we would have had if the Pre-IPO Tax Assets had not existed.
164
Payments under the arrangement are expected to be made quarterly during the taxable year based on our estimated tax savings for that year, with a true-up no later than November 30 in the year following the relevant taxable year. The first payment under the agreement would be required to be made no later than December 15, 2014. However, the actual amount and timing of any payments will ultimately vary depending on a number of factors, including the timing and extent of our utilization of the Pre-IPO Tax Assets.
It is anticipated that the arrangement will terminate on the later of December 31, 2019 or, if OMGUK were to cease to own, directly or indirectly, at least 50% of the shares in OMAM, December 31 of the year of that cessation, unless the Pre-IPO Tax Assets have all been utilized or have expired before such termination date. No later than November 30 of the year following termination of the arrangement, we will make a payment to OMGUK in an amount equal to the net present value of the Pre-IPO Tax Assets which have yet to be utilized at the termination date, subject to repayment if, and to the extent that, the Pre-IPO Tax Assets are determined not to be available.
Co-Investment Arrangement
In connection with this offering, we will enter into a co-investment arrangement whereby we will be obligated to pay OMGUK an amount equal to the proceeds realized by us in respect of specified pre-offering co-investments received by OMUSH, or the Pre-IPO Co-Investments. These Pre-IPO Co-Investments include limited partnership interests and limited liability company interests in specified entities owned by OMUSH and its subsidiaries. As of June 30, 2014, the Pre-IPO Co-Investments had an aggregate fair value of approximately $51.4 million and a carrying value of $42.3 million.
During the term of the Co-Investment Arrangement, we will make quarterly cash payments to OMGUK in an amount equal to 100% of the after-tax cash distributions received by us or our subsidiaries during the three-month period ending on the last day of the month preceding the payment date. These distributions include all amounts received by us or our subsidiaries from or in respect of the Pre-IPO Co-Investments, including any distributions, disposal proceeds and carried interest less any taxes chargeable on those distributions assuming statutory tax rates. If any tax losses are realized in respect of a Pre-IPO Co-Investment during a tax year and have not been taken into account for that year, there will be a true-up, and any additional payment made to OMGUK will be made no later than November 30 of the year following that tax year.
Seed Capital Management Agreement
Immediately prior to the completion of this offering, we will enter into a seed capital management agreement with our Parent and certain of its affiliates, Millpencil Limited, or MPL, Millpencil (U.S.) LP, or the Limited Partnership, and a newly formed MPL entity, or MPLUK2. This agreement will govern, through January 15, 2018, the deployment of certain seed capital investments of MPL and all of the seed capital investments of MPLUK2 and the Limited Partnership in various mandates that our Affiliates manage. On or before December 31, 2014, MPL will transfer to MPLUK2 all of MPL's general partnership interest in the Limited Partnership and the seed capital investments of MPL that are managed under the seed capital management agreement, which will continue to be managed by us on behalf of MPLUK2. The fair market value of the seed capital investments that will be subject to the seed capital management agreement is expected to be approximately $150 million as of the closing of the Reorganization. After January 15, 2018, MPLUK2 and the Limited Partnership may withdraw all or any of such seed capital investments.
In addition, on or before December 15 of each year during the period between the date of the seed capital management agreement and January 15, 2018, we will meet with our Parent to determine the proposed seed capital budget for the next year, which shall set forth the aggregate proposed seed capital investments in each asset class including (i) U.S. equities and European, Australia, Far East
165
(EAFE) equities, (ii) real estate, (iii) emerging market equities, (iv) high-yield fixed income and (v) investment grade fixed income. The budget will include a maximum risk adjustment for the investments during the applicable year based on the risk adjusted value applicable to each asset class. Additionally, during each year, we will be able to change investments from those included in the budget without our Parent's approval, unless (i) during the period between the date of the seed capital management agreement and January 15, 2018, the investments exceed the maximum risk-weightings for that year; (ii) the investment in any Affiliate of OMUSH exceeds 1/3 of the aggregate amount of seed capital; or (iii) any asset class changes by more than 10% from that set forth in the budget, subject to certain other exceptions. After the Majority Holder Date, our Parent will have a right to approve the recycling of seed capital investments in excess of $10 million.
We will agree to take all actions necessary to ensure that on January 15, 2018, all seed capital investments held by the Limited Partnership and MPLUK2 will consist of cash or cash equivalents or we will have committed to purchase MPLUK2 at market value. On or before September 30, 2017, we and our Parent will discuss which of these alternatives will be selected.
Review and Approval of Transactions with Related Persons
Upon the consummation of this offering, our Board of Directors will adopt written policies and procedures for transactions with related persons. As a general matter, the policy will require our Audit Committee to review and approve or disapprove the entry by us into certain transactions with related persons. The policy will only apply to transactions, arrangements and relationships where the aggregate amount involved could reasonably be expected to exceed $120,000 in any calendar year and in which a related person has a direct or indirect interest. A related person is (i) any of our directors, nominees for director or executive officers, (ii) any immediate family member of any of our directors, nominees for director or executive officers and (iii) any person, and his or her immediate family members, or entity, including affiliates, that was a beneficial owner of 5% or more of any of our outstanding equity securities at the time the transaction occurred or existed.
The policy will provide that if advance approval of a transaction subject to the policy is not obtained, it must be promptly submitted to the Audit Committee for possible ratification, approval, amendment, termination or rescission. In reviewing any transaction, the Audit Committee will take into account, among other factors the Audit Committee deems appropriate, recommendations from senior management, whether the transaction is on terms no less favorable than the terms generally available to a third party in similar circumstances and the extent of the related person's interest in the transaction. Any related person transaction must be conducted at arm's length. Any member of the Audit Committee who is a related person with respect to a transaction under review may not participate in the deliberations or vote on the approval or ratification of the transaction. However, such a director may be counted in determining the presence of a quorum at a meeting of the Audit Committee that considers a transaction.
Historical Related Party Transactions
Seed Capital and Co-Investments
A related party subsidiary of our Parent provides seed capital that is invested in certain products of our Affiliates. No net new seed capital has been provided by the subsidiary since January 1, 2011 and certain amounts of seed capital invested in prior years were returned or re-invested in other products of our Affiliates during each of the years ended December 31, 2013, 2012 and 2011. The fair value of seed capital investments held by the subsidiary in our then-current Affiliates' products totaled $214.5 million, $204.2 million and $246.9 million at December 31, 2013, 2012 and 2011, respectively. Of these amounts, $108.9 million, $99.9 million and $81.7 million, respectively, were investments in products of our current Affiliates and $95.4 million, $93.7 million and $154.1 million, respectively, were
166
invested in our discontinued operations. In addition to seed investments, co-investments of $10.2 million, $10.6 million and $11.1 million, respectively, were held by the related party subsidiary of our Parent in products of our current Affiliates.
Notes and Loans Payable
On December 31, 2008, we issued a $900.0 million promissory note to our Parent. Amounts outstanding under this note were $900.0 million at both December 31, 2013 and 2012. The note is due on September 30, 2015 and bears interest at 6.34% per annum. We also have a revolving credit facility from our Parent. The revolving credit facility was entered into on September 30, 2005 with a five-year term. We have agreed to several extensions of the term with our Parent, and the credit facility currently has been extended to March 31, 2018. Amounts outstanding under this facility were $140.7 million and $231.5 million at December 31, 2013 and 2012, respectively. Interest expense incurred on the promissory note and the credit facility totaled $74.5 million, $86.0 million and $71.2 million for the years ended December 31, 2013, 2012 and 2011, respectively. We are current with respect to interest payments due on both the promissory note and the revolving credit facility. Immediately preceding this offering, our Parent intends to make a capital contribution in the amount of the balance outstanding on all outstanding related party debt.
As of December 31, 2012, our Parent assigned by way of security its interests in our intercompany notes and revolving credit facility to a commonly controlled, wholly-owned subsidiary of our Parent. This arrangement was terminated during the third quarter of 2013, and the notes were reassigned to our Parent.
Pursuant to the terms of a third-party term loan, our Parent agreed to subordinate all amounts we owed to it in favor of amounts owed to the third-party lender. The balance of the third-party term loan was $2.5 million and $16.0 million at December 31, 2013 and 2012, respectively.
Amounts Payable to Related Party Subsidiaries of our Parent
During 2011, we recognized $1.0 million of interest expense with respect to $76.0 million of debt obligations we owed to a related party subsidiary of our Parent. In the second quarter of 2011, our Parent disposed of the subsidiary and we repaid the debt obligations funded by a capital contribution from our Parent.
Benefits and Compensation
Our Parent maintains various equity-based compensation arrangements, including stock options and restricted stock awards, in which our employees may participate. Stock options are granted under a service and non-market based performance condition. The cost of these equity-based programs has been included in our financial results where applicable. Compensation expense recognized by us in respect of these arrangements was $5.1 million, $2.8 million and $3.0 million for the years ended December 31, 2013, 2012 and 2011, respectively. A corresponding capital contribution was recognized in each period.
Management Fees
We provide sub-advisory and advisory services to related party subsidiaries of our Parent and to our Parent. Including discontinued operations, we earned management fees for providing these services amounting to $9.7 million, $12.3 million and $14.1 million for the years ended December 31, 2013, 2012 and 2011, respectively. Excluding discontinued operations, we earned management fees for providing these services amounting to $8.8 million, $7.7 million and $8.6 million for the years ended December 31, 2013, 2012 and 2011, respectively.
167
Administrative Overhead Allocation
Our Parent provides us with various oversight services, including governance, employee benefits, investor relations, procurement of insurance, human resources, financial reporting, internal audit, treasury, systems and tax services. We have estimated the portion of our Parent's costs for projects and oversight services specific to our Company. This allocation amounted to $5.3 million, $5.5 million and $5.9 million for the years ended December 31, 2013, 2012 and 2011, respectively. The actual amounts our Parent billed us for services performed were $2.0 million, $2.7 million and $2.7 million for these periods, respectively, which were settled in cash. The remaining amounts allocated of $3.3 million, $2.8 million and $3.2 million for the years ended December 31, 2013, 2012 and 2011, respectively, were allocated to us via a non-cash capital contribution to Parent equity.
Rent and Facilities Costs
Our global distribution subsidiary has offices in the United Kingdom, and this subsidiary has entered into a contractual arrangement with a related party subsidiary of our Parent. Amounts paid for rent and administrative costs per this arrangement amounted to $1.0 million, $1.2 million and $1.2 million for the years ended December 31, 2013, 2012 and 2011, respectively.
We have a sub-lease arrangement with a related party subsidiary of our Parent in relation to premises we continue to lease in respect of a discontinued operation. We received sub-lease payments from the related party subsidiary of our Parent in the amount of $1.0 million for each of the years ended December 31, 2013, 2012 and 2011, respectively. Payments received under this arrangement are applied against a restructuring liability recognized by us in respect of the abandoned lease.
Guarantees
In connection with a sale by us in May of 2012 of one of our former Affiliates to a third party, our Parent entered into a letter agreement with the purchaser pursuant to which our Parent agreed to be bound, and agreed to cause its affiliates and any purchaser of all or a substantial portion of our Company, to be bound, by the terms of certain covenants and agreements contained in the agreement. The covenants relate to non-solicitation and non-hiring of the former Affiliate's personnel and non-competition with the business of the former Affiliate for a period of three-years following the closing date of the transaction. In addition, OMGUK unconditionally guaranteed the performance of all obligations of the sellers under the agreement, including obligations of payment pursuant to an indemnification or as otherwise required by the terms of the agreement.
Intellectual Property
We frequently make use of trademarks and other intellectual property owned by our Parent. There are no formal, written license agreements in place between us and our Parent or OMLACSA, and we have not historically paid license fees for the use of such intellectual property. Following this offering, our use of trademarks and intellectual property owned by our Parent or OMLACSA will be governed by the terms of the Servicemark Agreement described under "—Relationship with Our Parent and OMGUK Following This Offering—Transitional Servicemark License Agreement."
168
SECURITY OWNERSHIP OF CERTAIN BENEFICIAL OWNERS AND MANAGEMENT
The following table sets forth information regarding the beneficial ownership of our ordinary shares as of , 2014, after giving effect to the Reorganization, and as adjusted to reflect the sale of ordinary shares by the Selling Shareholder in this offering, by:
- •
- our Parent, through its wholly-owned subsidiary, OMGUK, which is the Selling Shareholder in this offering;
- •
- each of our directors;
- •
- each of our named executive officers;
- •
- each person, or group of affiliated persons, who is known by us to beneficially own more than 5% of our ordinary shares;
and
- •
- all of our directors and executive officers as a group.
Beneficial ownership is determined in accordance with the rules of the SEC. These rules generally attribute beneficial ownership of securities to persons who possess sole or shared voting power or investment power with respect to those securities and include ordinary shares issuable upon the exercise of stock options that are immediately exercisable or exercisable within 60 days after , 2014. Except as otherwise indicated, all persons listed below have sole voting and investment power with respect to the shares beneficially owned by them, subject to applicable community property laws. The information is not necessarily indicative of beneficial ownership for any other purpose.
Percentage ownership calculations for beneficial ownership prior to this offering are based on ordinary shares outstanding as of , 2014, after giving effect to the Reorganization. Percentage ownership calculations for beneficial ownership after this offering are based on ordinary shares outstanding. Except as otherwise indicated in the table below, addresses of named beneficial owners are care of Old Mutual (US) Holdings Inc., 200 Clarendon Street, 53rd Floor, Boston, Massachusetts 02116.
In computing the number of ordinary shares beneficially owned by a person and the percentage ownership of that person, we deemed outstanding ordinary shares that a person has the right to acquire within 60 days of 2014. We did not deem these ordinary shares outstanding, however, for the
169
purpose of computing the percentage ownership of any other person. Beneficial ownership representing less than 1% is denoted with an asterisk (*).
| |
|
|
|
|
|
Shares Beneficially Owned After Offering With Over-Allotment |
||||||||||||||||
|---|---|---|---|---|---|---|---|---|---|---|---|---|---|---|---|---|---|---|---|---|---|---|
| |
Shares Beneficially Owned Prior to Offering |
|
Shares Beneficially Owned After Offering |
|||||||||||||||||||
| |
Number of Shares Offered |
|||||||||||||||||||||
Name of Beneficial Owner
|
Number | Percentage | Number | Percentage | Number | Percentage | ||||||||||||||||
5% Shareholders |
||||||||||||||||||||||
Old Mutual plc(1)(2) |
||||||||||||||||||||||
Directors and Executive Directors |
||||||||||||||||||||||
Peter L. Bain |
— | |||||||||||||||||||||
Stephen H. Belgrad |
— | |||||||||||||||||||||
Linda T. Gibson |
— | |||||||||||||||||||||
Christopher Hadley |
— | |||||||||||||||||||||
Aidan J. Riordan |
— | |||||||||||||||||||||
Julian Roberts |
||||||||||||||||||||||
Ian D. Gladman |
||||||||||||||||||||||
Kyle P. Legg |
||||||||||||||||||||||
James J. Ritchie |
— | |||||||||||||||||||||
John D. Rogers |
||||||||||||||||||||||
Donald J. Schneider |
— | |||||||||||||||||||||
All current executive officers and directors as a group (eleven persons) |
— | |||||||||||||||||||||
- (1)
- The
address of Old Mutual plc is 5th Floor, Millennium Bridge House, 2 Lambeth Hill, London, England EC4V 4GG.
- (2)
- Old Mutual plc owns its ordinary shares indirectly through OMGUK, its wholly-owned subsidiary.
170
General
The following description of our share capital is intended as a summary only and is qualified in its entirety by reference to our articles of association to be in effect at the closing of this offering, which is filed as an exhibit to the registration statement of which this prospectus forms a part, and to the applicable provisions of the U.K. Companies Act 2006. The following description of our share capital is also subject to and qualified by the rights of our Parent under the Shareholder Agreement. See "Certain Relationships and Related Party Transactions—Relationship with Our Parent and OMGUK Following This Offering—Shareholder Agreement."
As of , we had issued and outstanding of our ordinary shares held by shareholders of record.
Immediately following the consummation of this offering, we will also have outstanding restricted ordinary shares.
Ordinary Shares
Dividend Rights
Subject to the provisions of English law and any preferences that may apply to preferred ordinary shares outstanding at the time, holders of outstanding ordinary shares will be entitled to receive dividends out of assets legally available at the times and in the amounts as our Board of Directors and our Parent, for so long as its approval is required, may determine from time to time. All dividends are declared and paid according to the amounts paid up on the shares in respect of which the dividend is paid. Any dividend unclaimed after a period of 12 years from the due date of payment of such dividend shall, if the Board of Directors so resolves, be forfeited and shall revert to us. In addition, the payment by our Board of Directors of any unclaimed dividend, interest or other sum payable on or in respect of an ordinary share into a separate account shall not constitute us as a trustee in respect thereof.
Voting Rights
Each outstanding ordinary share will be entitled to one vote on all matters submitted to a vote of shareholders. Holders of ordinary shares shall have no cumulative voting rights. Subject to any rights or restrictions attached to any shares on a poll every member present in person or by proxy shall have one vote for every share of which he is the holder. None of our shareholders will be entitled to vote at any general meeting or at any separate class meeting in respect of any share unless all calls or other sums payable in respect of that share have been paid. The directors may from time to time make calls on shareholders in respect of any amounts unpaid on their shares, whether in respect of nominal value of the shares or by way of premium. Shareholders are required to pay called amounts on shares subject to receiving at least 14 clear days' notice specifying the time and place for payment. If a shareholder fails to pay any part of a call, the directors may serve further notice naming another day not being less than 14 clear days from the date of the further notice requiring payment and stating that in the event of non-payment the shares in respect of which the call was made will be liable to be forfeited. Subsequent forfeiture requires a resolution by the directors.
Preemptive Rights
There are no rights of preemption under our articles of association in respect of transfers of issued ordinary shares. In certain circumstances, our shareholders may have statutory preemption rights under the Companies Act 2006 in respect of the allotment of new shares as described in "—Differences in Corporate Law—Preemptive Rights." These statutory pre-emption rights would require us to offer new shares for allotment to existing shareholders on a pro rata basis before allotting them to other persons,
171
unless shareholders disapply such rights by a special resolution at a shareholders' meeting. These pre-emption rights will have been dis-applied by our shareholder prior to completion of the offering and we shall propose equivalent resolutions in the future once the initial period of dis-application has expired. However, OMGUK will have pre-emption rights, subject to certain exceptions, until it ceases to own more than 7% of our outstanding ordinary shares. In any circumstances where the pre-emption rights have not been dis-applied, the procedure for the exercise of such statutory pre-emption rights would be set out in the documentation by which such ordinary shares would be offered to our shareholders.
Conversion or Redemption Rights
Our ordinary shares will be neither convertible nor redeemable, provided that our Board of Directors has the right to issue additional classes of shares in the Company (including redeemable shares) on such terms and conditions, and with such rights attached, as it may determine.
Liquidation Rights
Holders of ordinary shares are entitled to participate in any distribution of assets upon a liquidation after payment of all debts and other liabilities and subject to the prior rights of any holders of preferred ordinary shares then outstanding. A liquidator may, with the sanction of a special resolution and any other sanction required by the Insolvency Act 1986, divide among the members in specie the whole or any part of the assets of the Company and may, for that purpose, value any assets and determine how the division shall be carried out as between the members or different classes of members.
Variation of Rights
The rights or privileges attached to any class of shares may (unless otherwise provided by the terms of the issue of the shares of that class) be varied or abrogated by (i) the written consent of the holders of 3/4 in nominal value of the issued shares of that class or (ii) a special resolution passed at a general meeting of the shareholders of that class.
Capital Calls
Our Board of Directors has the authority to make calls upon the shareholders in respect of any money unpaid on their shares and each shareholder shall pay to us as required by such notice the amount called on its shares. If a call remains unpaid after it has become due and payable, and the 14 days' notice provided by our Board of Directors has not been complied with, any share in respect of which such notice was given may be forfeited by a resolution of our Board of Directors. None of our ordinary shares to be sold in this offering will be subject to a capital call.
Transfer of Shares
Our share register is maintained by our transfer agent, Computershare. Registration in this share register is determinative of share ownership. A shareholder who holds our shares through The Depository Trust Company, or DTC, is not the holder of record of such shares. Instead, the depositary (for example, Cede & Co., as nominee for DTC) or other nominee is the holder of record of such shares. Accordingly, a transfer of shares from a person who holds such shares through DTC to a person who also holds such shares through DTC will not be registered in our official share register, as the depositary or other nominee will remain the record holder of such shares. The directors may decline to register a transfer of a share that is:
- •
- not fully paid or on which we have a lien;
172
- •
- not lodged duly stamped at our registered office or at such other place as the directors may appoint, except where
uncertificated shares are transferred without a written instrument;
- •
- not accompanied by the certificate of the share to which it relates or such other evidence reasonably required by the
directors to show the right of the transferor to make the transfer, except where a certificate has not been issued;
- •
- a Default Share where the holder has failed to provide the required details to us under "—Other U.K. Law
Considerations—Disclosure of Interests in Shares";
- •
- in respect of more than one class of share; or
- •
- in the case of a transfer to joint holders of a share, the number of joint holders to whom the share is to be transferred exceeds four.
Limitations on Ownership
Under U.K. law and our articles of association, there are no limitations on the right of non-residents of the United Kingdom or owners who are not citizens of the United Kingdom to hold or vote our ordinary shares.
Listing
We will apply to have our ordinary shares listed on the New York Stock Exchange under the symbol "OMAM."
Preferred Ordinary Shares
Our Board of Directors may, from time to time, following an ordinary resolution of the ordinary shareholders granting authority to the directors to allot shares and a special resolution of the ordinary shareholders to amend the articles of association (and dis-apply pre-emption rights, if not already dis-applied), direct the issuance of preferred ordinary shares in series and may, at the time of issuance, determine the designations, powers, preferences, privileges, and relative participating, optional or special rights as well as the qualifications, limitations or restrictions thereof, including dividend rights, conversion rights, voting rights, terms of redemption and liquidation preferences, any or all of which may be greater than the rights of the ordinary shares. Satisfaction of any dividend preferences of outstanding preferred ordinary shares would reduce the amount of funds available for the payment of dividends on ordinary shares. Holders of preferred ordinary shares may be entitled to receive a preference payment in the event of our liquidation before any payment is made to the holders of ordinary shares. Upon consummation of this offering, there will be no preferred ordinary shares outstanding, and we have no present intention to issue any preferred ordinary shares.
Registration Rights
Concurrently with the closing of this offering, we expect to enter into a registration rights agreement with our Parent, pursuant to which our Parent may require us, beginning after the first anniversary of the consummation of this offering, to file one or more registration statements with the SEC covering the public resale of registrable securities beneficially owned by our Parent and its subsidiaries with expected aggregate gross proceeds of at least $50 million. We will not be obligated to effect more than one demand registration, in addition to any registration on a shelf registration statement, in any six-month period. We will be obligated to file a shelf registration statement, upon any request made by our Parent after the first anniversary of the consummation of this offering. In addition, our Parent will have certain "piggy-back" registration rights, pursuant to which it will be entitled to register the resale of its registrable securities alongside any offering of securities that we may undertake, and the amount of securities we may offer may be subject to "cutback" in certain cases.
173
We will be responsible for the expenses associated with any sale under the agreement by our Parent, except for its legal fees and underwriting discounts, selling commissions and transfer taxes applicable to such sale.
Articles of Association and U.K. Law Considerations
Directors
Number
Unless and until we, in a general meeting of our shareholders, otherwise determine, the number of directors shall not be more than nine and shall not be less than two. While our Board of Directors immediately following the closing of this offering will be seven, pursuant to the Shareholder Agreement, our Parent has the right to increase the size of our Board of Directors to nine. Directors may be appointed by any ordinary resolution of shareholders or by the board. A director appointed by the board holds office until the following annual general meeting and if not re-appointed at such annual general meeting shall vacate office at its conclusion.
Borrowing Powers
Under our directors' general power to manage our business, our directors may exercise all the powers of the Company to borrow money, to indemnify and to mortgage or charge our undertaking, property, assets (present and future) and uncalled capital or parts thereof and to issue debentures and other securities whether outright or as collateral security for any debt, liability or obligation of our Company or of any third party.
Directors' Interests and Restrictions
The following discussion should be read in conjunction with "Certain Relationships and Related Party Transactions".
Our Board of Directors may, in accordance with our articles of association and the requirements of the Companies Act 2006, authorize a matter proposed to us that would, if not authorized, involve a breach by a director of his duty under section 175 of the Companies Act 2006 to avoid a situation in which he or she has, or can have, a direct or indirect interest that conflicts, or possibly may conflict, with our interests. A director is not required, by reason of being a director, to account to us for any remuneration or other benefit that he or she derives from a relationship involving a conflict of interest or possible conflict of interest which has been authorized by our Board of Directors.
Provided that he or she has disclosed to the directors the nature and extent of any material interest, a director may be a party to, or otherwise interested in, any transaction, contract or arrangement with us and he or she may be a director or other officer of, or employed by, or a party to any transaction or arrangement with, or otherwise interested in any entity promoted by us or in which we are otherwise interested and that director shall not, by reason of his or her office, be accountable to us for any benefit that he or she derives from any such office or employment or from any such transaction or arrangement or from any interest in any such body corporate; and no such transaction or arrangement shall be required to be avoided because of any such interest or benefit.
Except as provided in our articles of association, a director shall not vote at a meeting of the directors on any resolution concerning a matter in which he or she has, directly or indirectly, an interest, other than (i) an interest in our shares or debentures or other securities, (ii) where permitted by the terms of any authorization of a conflict of interest or by an ordinary resolution, or (iii) in the circumstances set out in the following paragraph, and shall not be counted in the quorum at a meeting with respect to any resolution on which he or she is not entitled to vote.
174
A director shall be entitled to vote (and be counted in the quorum) in respect of any resolution concerning any of the following matters:
- •
- the giving of any guarantee, security or indemnity in respect of money lent or obligations incurred by him or her or any
other person at the request of or for the benefit of us or any of our subsidiary undertakings;
- •
- the giving of any guarantee, security or indemnity in respect of a debt or obligation of ours or any of our subsidiary
undertakings for which he or she has assumed responsibility in whole or in part under a guarantee or indemnity or by the giving of security;
- •
- any proposal concerning an offer of shares or debentures or other securities of or by us or any of our subsidiary
undertakings for subscription or purchase or exchange in which offer he or she is or will be interested as a participant in the underwriting or sub-underwriting of such offer;
- •
- any proposal concerning any other company in which he or she is interested, directly or indirectly and whether as an
officer or shareholder or otherwise, provided that he or she (together with persons connected with him or her) does not to his or her knowledge hold an interest in shares representing one percent or
more of the issued shares of any class of such company (or of any third company through which his or her interest is derived) or of the voting rights available to shareholders of the relevant company;
- •
- any proposal concerning the adoption, modification or operation of a pension, superannuation fund or retirement, death or
disability benefits scheme or an employees' share scheme under which he or she may benefit and which relates to our employees and/or directors and does not accord to such director any privilege or
benefit not generally accorded to the persons to whom such scheme relates;
- •
- any proposal under which he or she may benefit concerning the giving of indemnities to our directors or other officers
which the directors are empowered to give under our articles of association;
- •
- any proposal under which he or she may benefit concerning the purchase, funding and/or maintenance of insurance for any of
our directors or other officers that the directors are empowered to purchase, fund or maintain under our articles of association; and
- •
- any proposal under which he or she may benefit concerning the provision to directors of funds to meet expenditures in defending proceedings.
Where proposals are under consideration to appoint two or more directors to offices or employments with us or with any company in which we are interested or to fix or vary the terms of such appointments, such proposals may be divided and considered in relation to each director separately and in such case each of the directors concerned (if not prohibited from voting as noted above) shall be entitled to vote (and be counted in the quorum) in respect of each resolution except that concerning his or her own appointment.
If any question shall arise at any meeting as to the materiality of a director's interest or as to the entitlement of any director to vote and such question is not resolved by his or her agreeing voluntarily to abstain from voting, such question shall be referred to the chairman of the meeting (or, where the interest concerns the chairman, to the deputy chairman of the meeting) and his or her ruling in relation to any director shall be final and conclusive except in a case where the nature or extent of the interests of the director concerned have not been disclosed fairly.
175
Remuneration
The following discussion should be read in conjunction with "Compensation Discussion and Analysis".
Each of the directors may (in addition to any amounts payable as described below or under any other provision of our articles of association) be paid out of our funds such fees as the directors may from time to time determine.
Any director who is appointed to hold any employment or executive office with us or who, at our request, goes or resides abroad for any of our purposes or who otherwise performs services that in the opinion of the directors are outside the scope of his or her ordinary duties may be paid such additional remuneration (whether by way of salary, commission, participation in profits or otherwise) as the directors (or any duly authorized committee of the directors) may determine either in addition to or in lieu of any other remuneration.
Each director may be paid his or her reasonable traveling expenses (including hotel and incidental expenses) of attending and returning from meetings of the directors or committees of the directors or general meetings or any separate meeting of the holders of any class of our shares or any other meeting that as a director he or she is entitled to attend and shall be paid all expenses properly and reasonably incurred by him or her in the conduct of our Company's business or in the discharge of his or her duties as a director.
Pensions and Other Benefits
The directors may exercise all of the powers of the Company to provide benefits, either by the payment of gratuities or pensions or by insurance or in any other manner whether similar to the foregoing or not, for any director or former director, or any person who is or was at any time employed by, or held an executive or other office or place of profit in, us or any entity that is or has been a subsidiary of ours or a predecessor of our business or of any such subsidiary and for the families and persons who are or was a dependent of any such persons and for the purpose of providing any such benefits contribute to any scheme trust or fund or pay any premiums.
Appointment and Retirement of Directors
The directors shall have power to appoint any person who is willing to act to be a director, either to fill a casual vacancy or as an additional director so long as the total number of directors shall not exceed nine. Any director so appointed shall retire from office at our annual general meeting following such appointment. Any director so retiring shall be eligible for re-election.
We may by ordinary resolution elect any person who is willing to act as a director either to fill a vacancy or as an addition to the existing directors or to replace a director removed from office under our articles of association so long as the total number of directors does not at any time exceed nine.
Each director shall retire and shall (unless his or her terms of appointment with us specify otherwise) be eligible for re-election at the annual general meeting held in the third calendar year (or such earlier calendar year as may be specified for this purpose in his terms of appointment with us) following his last appointment, election or re-election at any general meeting of our shareholders.
At the meeting at which a director retires under any provision of our articles of association, we may by ordinary resolution fill the vacated office by appointing a person to it, and in default the retiring director shall be deemed to have been re-appointed except where:
- (i)
- that director has given notice to us that he or she is unwilling to be elected; or
176
- (ii)
- at such meeting it is expressly resolved not to fill such vacated office or a resolution for the reappointment of such director shall have been put to the meeting and not passed.
In the event of the vacancy not being filled at such meeting, it may be filled by the directors as a vacancy as described above.
The retirement of a director shall not have effect until the conclusion of the relevant meeting except where a resolution is passed to elect some other person in the place of the retiring director or a resolution for his re-election is put to the meeting and not passed and accordingly a retiring director who is re-elected or deemed to have been re-elected will continue in office without break.
Indemnity of Directors
Under our articles of association, and subject to the provisions of the Companies Act 2006, each of our directors is entitled to be indemnified by us against all costs, charges, losses, expenses and liabilities incurred by such director or officer in the execution and discharge of his or her duties or in relation to those duties. The Companies Act 2006 renders void an indemnity for a director against any liability attaching to him or her in connection with any negligence, default, breach of duty or breach of trust in relation to the company of which he or she is a director, as described in "—Differences in Corporate Law—Liability of Directors and Officers."
Shareholders' Meetings
Each year, we will hold a general meeting of our shareholders in addition to any other meetings in that year, and will specify the meeting as such in the notice convening it. The annual general meeting will be held at such time and place as the directors may appoint. The arrangements for the calling of general meetings are described in "—Differences in Corporate Law—Notice of General Meetings." No business shall be transacted at any general meeting unless a quorum is present when the meeting proceeds to business, but the absence of a quorum shall not preclude the appointment of a chairman, which appointment shall not be treated as part of the business of a meeting. Two persons present and entitled to vote upon the business to be transacted, each being either a shareholder or a proxy for a shareholder or a duly authorized representative of a corporation which is a shareholder shall be a quorum for all purposes.
Governing Law and Jurisdiction
The rights of our shareholders and any issues arising out of our articles of association will generally be governed by English law, and the English courts shall have exclusive jurisdiction with respect to any suits brought by shareholders (in their capacity as such) against us or our directors. For shareholders who hold our shares through DTC, your rights will also be governed by the rules and procedures of DTC and the terms of the relationship between you and the bank, broker or other financial institution through which you hold your interest.
Other U.K. Law Considerations
Mandatory Purchases and Acquisitions
Pursuant to sections 979 to 991 of the Companies Act 2006, where a takeover offer has been made for us and the offeror has, by virtue of acceptances of the offer, acquired or unconditionally contracted to acquire not less than 90% of the voting rights carried by the shares to which the offer relates, the offeror may give notice to the holder of any shares to which the offer relates that the offeror has not acquired or unconditionally contracted to acquire that it desires to acquire those shares on the same terms as the general offer.
177
U.K. City Code on Takeovers and Mergers
At. this time, we do not expect the Takeover Code to apply to us on the basis that the Takeover Panel has confirmed that, on the basis of our planned board of directors, it does not consider the Takeover Code to apply to the Company, although that position is subject to change if our center of management and control is subsequently found to move to the U.K. If, at the time of a takeover offer, the Takeover Panel determines that we have our place of central management and control in the U.K., we could be subject to the Takeover Code, which is issued and administered by the Takeover Panel. The Takeover Code provides a framework within which takeovers of companies subject to it are conducted. In particular, the Takeover Code contains certain rules in respect of mandatory offers. Under Rule 9 of the Takeover Code, if a person:
- •
- acquires an interest in our shares that, when taken together with shares in which persons acting in concert with such
person are interested, carries 30% or more of the voting rights of our shares; or
- •
- who, together with persons acting in concert with such person, is interested in shares that in the aggregate carry not less than 30% and not more than 50% of the voting rights in the company acquires additional interests in shares that increase the percentage of shares carrying voting rights in which that person is interested,
the acquirer, and, depending on the circumstances, its concert parties, would be required (except with the consent of the Takeover Panel) to make a cash offer for our outstanding shares at a price not less than the highest price paid for any interests in the shares by the acquirer or its concert parties during the previous 12 months. As noted above, at this time, we do not expect the Takeover Code to apply on the basis that our management and control is outside the U.K. However, the analysis of whether the Takeover Code applies is fact-specific and therefore subject to change.
Disclosure of Interest in Shares
Pursuant to Part 22 of the Companies Act 2006 and our articles of association, we are empowered by notice in writing to require any person whom we know to be, or have reasonable cause to believe to be, interested in our shares, or at any time during the three years immediately preceding the date on which the notice is issued has been so interested, within a reasonable time to disclose to us the details of that person's interest and (so far as is within such person's knowledge) details of any other interest that subsists or subsisted in those shares. Under our articles of association, if a person defaults in supplying us with the required details in relation to the shares in question, or Default Shares, a court may order, or we may direct, that in respect of the Default Shares:
- •
- the relevant member shall not be entitled to vote or exercise any other right conferred by membership in relation to
general meetings; and/or
- •
- (a) any dividend or other money payable in respect of the Default Shares shall be retained by us without liability to pay interest, and/or (b) no transfers by the relevant person of shares other than approved transfers may be registered (unless such transfer is approved in accordance with the terms of our articles of association or such person is not in default and the transfer does not relate to Default Shares), and/or (c) any shares held by the relevant person in uncertificated form shall be converted into certificated form, and/or (d) the Default Shares are transferred to a person(s) procured by us.
178
Purchase of Own Shares
Under English law, a public limited company may purchase its own shares only out of the distributable profits of the company or the proceeds of a new issue of shares made for the purpose of financing the purchase. A limited company may not purchase its own shares if as a result of the purchase there would no longer be any issued shares of the company other than redeemable shares or shares held as treasury shares. Subject to the foregoing, because the New York Stock Exchange is not a "recognized investment exchange" under the Companies Act 2006, we may purchase our own fully paid shares only pursuant to a purchase contract authorized by ordinary resolution of the holders of our ordinary shares before the purchase takes place. Any authority will not be effective if any shareholder from whom we propose to purchase shares votes on the resolution and the resolution would not have been passed if such shareholder had not done so. The resolution authorizing the purchase must specify a date, not being later than five years after the passing of the resolution, on which the authority to purchase is to expire.
A share buy-back by us of our ordinary shares will give rise to U.K. stamp duty currently at the rate of 0.5% of the amount or value of the consideration payable by us, and such stamp duty will be paid by us.
Differences in Corporate Law
Certain provisions of the Companies Act 2006 differ from laws applicable to U.S. corporations and their shareholders. Set forth below is a summary of certain differences between the provisions of the Companies Act 2006 applicable to us and the Delaware General Corporation Law relating to shareholders' rights and protections. This summary is not intended to be a complete discussion of the respective rights and it is qualified in its entirety by reference to Delaware law and English law.
| England and Wales | Delaware | |
|---|---|---|
| Number of Directors | ||
Under the Companies Act 2006, a public limited company must have at least two directors and the number of directors may be fixed by or in the manner provided in a company's articles of association. Our articles of association provide that the maximum number of directors is nine. |
Under Delaware law, a corporation must have at least one director. The number of directors of a corporation is fixed by, or in the manner provided in, the bylaws, unless the certificate of incorporation fixes the number of directors, in which case a change in the number of directors must be made by amendment of the certificate of incorporation. Delaware law does not contain specific provisions requiring a majority of independent directors. |
|
Removal of Directors |
||
Under the Companies Act 2006, shareholders may remove a director without cause by an ordinary resolution (which is passed by a simple majority of those voting in person or by proxy at a general meeting) irrespective of any provisions of any service contract the director has with the company, provided that 28 clear days' notice of the resolution is given to the company and its shareholders and certain other procedural requirements under the Companies Act 2006 are followed (such as allowing the director to make representations against his or her removal either at the meeting or in writing). |
Under Delaware law, unless otherwise provided in the certificate of incorporation, directors may be removed from office, with or without cause, by a majority stockholder vote, except: (i) in the case of a corporation whose board is classified, stockholders may effect such removal only for cause; and (ii) in the case of a corporation having cumulative voting, if less than the entire board is to be removed, no director can be removed without cause if the votes cast against such director's removal would be sufficient to elect such director if then cumulatively voted at an election of the entire board, or, if there are classes of directors, at an election of the class of directors of which such director is a part. |
179
| England and Wales | Delaware | |
|---|---|---|
| Vacancies on the Board of Directors | ||
Under English law, the procedure by which directors (other than a company's initial directors) are appointed is generally set out in a company's articles of association, provided that where two or more persons are appointed as directors of a public limited company by resolution of the shareholders, resolutions appointing each director must be voted on individually. |
Under Delaware law, unless otherwise provided in the certificate of incorporation or bylaws, vacancies on a corporation's board of directors, including those caused by an increase in the number of directors, may be filled by a majority of the remaining directors, although less than a quorum, or by a sole remaining director. |
|
Shareholder Action by Written Consent |
||
A public company can only pass a shareholders' resolution by way of a vote taken at a meeting of its members. Accordingly, public companies cannot pass a written resolution by sanction of its members, and the relevant approval must be obtained by the company in a duly convened and held general meeting. |
Under Delaware law, unless otherwise provided in the certificate of incorporation or bylaws, any action required or permitted to be taken at a meeting of stockholders may be taken without a meeting if a written consent to the action is signed by stockholders holding at least a majority of the voting power. If a different proportion of voting power is required for an action at a meeting, then that proportion of written consents is also required. |
|
Annual General Meeting |
||
Under the Companies Act 2006, a public limited company must hold an annual general meeting in each six-month period following the company's annual accounting reference date. |
Unless directors are elected by written consent in lieu of an annual meeting, an annual meeting of stockholders must be held for the election of directors on a date and at a time designated by or in the manner provided in the by-laws. |
|
Stockholders may, unless the certificate of incorporation otherwise provides, act by written consent to elect directors; provided, however, that, if such consent is less than unanimous, such action by written consent may be in lieu of holding an annual meeting only if all of the directorships to which directors could be elected at an annual meeting held at the effective time of such action are vacant and are filled by such action. Any other proper business may be transacted at the annual meeting. |
||
If there is a failure to hold the annual meeting or to take action by written consent to elect directors in lieu of an annual meeting for a period of 30 days after the date designated for the annual meeting, or if no date has been designated, for a period of 13 months after the latest to occur of the organization of the corporation, its last annual meeting or the last action by written consent to elect directors in lieu of an annual meeting, the Court of Chancery may order a meeting to be held upon the application of any stockholder or director. |
||
General Meeting |
||
Under the Companies Act 2006, a general meeting of the shareholders of a public limited company may be called by the directors. Shareholders holding at least 5% of the paid-up capital of the company carrying voting rights at general meetings can require the directors to call a general meeting. |
Under Delaware law, special meetings of the stockholders may be called by the board of directors or by such person or persons as may be authorized by the certificate of incorporation or by the bylaws. |
180
| England and Wales | Delaware | |
|---|---|---|
| Notice of General Meetings | ||
Under the Companies Act 2006, 21 clear days' notice must be given for an annual general meeting and any resolutions to be proposed at the meeting. Subject to a company's articles of association providing for a longer period, at least 14 clear days' notice is required for any other general meeting. In addition, certain matters (such as the removal of directors or auditors) require special notice, which is 28 clear days' notice. The shareholders of a company may in all cases consent to a shorter notice period, the proportion of shareholders' consent required being 100% of those entitled to attend and vote in the case of an annual general meeting and, in the case of any other general meeting, a majority in number of the members having a right to attend and vote at the meeting, being a majority who together hold not less than 95% in nominal value of the shares giving a right to attend and vote at the meeting. |
Under Delaware law, unless otherwise provided in the certificate of incorporation or bylaws or under other portions of Delaware law, written notice of any meeting of the stockholders must be given to each stockholder entitled to vote at the meeting not less than 10 nor more than 60 days before the date of the meeting and must specify the place, if any, date, hour, means of remote communications, if any, by which stockholders and proxy holders may be deemed to be present in person and vote at such meeting, the record date for determining the stockholders entitled to vote at the meeting, if such date is different from the record date for determining stockholders entitled to notice of the meeting, and, in the case of a special meeting, the purpose or purposes of the meeting. |
|
Proxy |
||
Under the Companies Act 2006, at any meeting of shareholders, a shareholder may designate another person to attend, speak and vote at the meeting on their behalf by proxy. |
Under Delaware law, at any meeting of stockholders, a stockholder may designate another person to act for such stockholder by proxy, but no such proxy shall be voted or acted upon after three years from its date, unless the proxy provides for a longer period. |
|
Issues of New Shares |
||
Under the Companies Act 2006, the board of directors may issue new shares in the company, provided that they are authorized to do so either by (i) a provision of the company's articles of association, or (ii) a resolution of the company's shareholders. Any authorization provided to the directors must specify (a) the maximum amount of shares which may be allotted under it, and (b) the expiry date of the authorization, which must not be more than five years following the date of incorporation of the company or the date of passing of the relevant authorizing resolution, as applicable. |
Under Delaware law, the directors may, at any time and from time to time, if all of the shares of capital stock which the corporation is authorized by its certificate of incorporation to issue have not been issued, subscribed for, or otherwise committed to be issued, issue or take subscriptions for additional shares of its capital stock up to the amount authorized in its certificate of incorporation. |
181
| England and Wales | Delaware | |
|---|---|---|
| Reduction of Share Capital | ||
Under the Companies Act 2006, a public company may reduce or cancel its issued share capital in accordance with the provisions of the Companies Act 2006 if the reduction of capital has been approved by a special resolution of shareholders in general meeting and the reduction of capital has been confirmed by the court. The special resolution of shareholders will need to specify the exact amount of the proposed reduction, although a public company cannot reduce its share capital below the minimum share capital requirements under the Companies Act 2006 (i.e. £50,000, of which at least one quarter must be fully paid up). |
Under Delaware law, a corporation, by resolution of its board of directors, may retire any shares of its capital stock that are issued but are not outstanding. Whenever any shares of the capital stock of a corporation are retired, they resume the status of authorized and unissued shares of the class or series to which they belong unless the certificate of incorporation otherwise provides. Under Delaware law, a corporation may, under certain circumstances, by resolution of its board of directors, reduce its capital. No reduction of capital may be made or effected unless the assets of the corporation remaining after such reduction are sufficient to pay any debts of the corporation for which payment has not been otherwise provided. A reduction of capital will not release any liability of any stockholder whose shares have not been fully-paid. |
|
Preemptive Rights |
||
Under the Companies Act 2006, equity securities proposed to be allotted for cash must be offered first to the existing equity shareholders in the company in proportion to the respective nominal value of their holdings, unless an exception applies or a special resolution to the contrary has been passed by shareholders in a general meeting or the articles of association provide otherwise, in each case in accordance with the provisions of the Companies Act 2006. |
Under Delaware law, unless otherwise provided in a corporation's certificate of incorporation or any amendment thereto, or in the resolution or resolutions providing for the issue of such shares adopted by the board of directors pursuant to authority expressly vested in it by the provisions of its certificate of incorporation, a stockholder does not, by operation of law, possess pre-emptive rights to subscribe to additional issuances of the corporation's capital stock. |
|
Bonus Issue of Shares |
||
Under the Companies Act 2006, if a company's articles of association permit a bonus issue of shares, the board of directors may be authorized to capitalize certain reserves or profits and use those to issue bonus shares in accordance with the terms of the articles of association and the provisions of the Companies Act 2006. |
Under Delaware law, by resolution of the board of directors, dividends may be paid in shares of the corporation's capital stock. |
182
| England and Wales | Delaware | |
|---|---|---|
| Distributions and Dividends | ||
Under English law, dividends and distributions may only be made from distributable profits. "Distributable profits" generally means accumulated realized profits, so far as not previously utilized by distribution or capitalization, less accumulated realized losses, so far as not previously written off in a reduction or reorganization of capital, duly made. This would include reserves created by way of a court-approved reduction of capital. In the case of a public limited company, additional rules relating to capital maintenance requirements are applicable and, accordingly, a public company can only make a distribution (a) if, at the time that the distribution is made, the amount of its net assets is not less than the total of its called up share capital and undistributable reserves, and (b) if, and to the extent that, the distribution itself , at the time it is made, does not reduce the amount of net assets to less than that total. Undistributable reserves include the share premium account, the capital redemption reserve, the amount by which the company's unrealized uncapitalised profits exceed its unrealized losses not written off, or any other reserve that the company is prohibited from distributing either by statute or by its constitutional documents. The determination as to whether or not the company has sufficient distributable profits to fund a dividend or distribution must be made by reference to the "relevant accounts" of the company. Relevant accounts are always individual (not group) accounts and may be any of the following: (i) the company's most recent annual accounts, (ii) specifically prepared interim accounts, or (iii) specifically prepared initial accounts. Irrespective of the accounts used to justify the dividend or distribution, they must enable reasonable judgment to be made of the company's profits, losses, assets and liabilities, include appropriate provisions, and include details of the company's share capital and reserves (including undistributable reserves). The process for declaring and paying dividends is usually set out in a company's articles of association. Typically these will provide that (a) final dividends are declared by shareholders following a recommendation from the board of directors (often at the company's annual general meeting), and (b) interim dividends can be decided solely by the board of directors. Dividends may be declared and paid in the form of cash, property, stock or other non-cash assets and may be paid in dollars or any other currency. |
Under Delaware law, unless otherwise provided in a corporation's certificate of incorporation, directors may declare and pay dividends upon the shares of its capital stock either (i) out of its surplus or (ii) if the corporation does not have surplus, out of its net profits for the fiscal year in which the dividend is declared and/or the preceding fiscal year. The excess, if any, at any given time, of the net assets of the corporation over the amount so determined to be capital is surplus. Net assets means the amount by which total assets exceed total liabilities. Dividends may be paid in cash, in property, or in shares of the corporation's capital stock. |
183
| England and Wales | Delaware | |
|---|---|---|
| Repurchases and Redemptions of Shares | ||
Under English law, a company is free to purchase its own shares, unless its articles of association expressly prohibit or limit share buybacks. A company's articles may also provide that repurchased shares are either cancelled or held as treasury shares. A share repurchase can be funded either out of distributable profits or from the proceeds of a fresh issue of shares made for the purpose of financing the buyback. Public companies are not permitted to purchase their own shares out of capital. Any repurchase of a company's shares will require shareholder approval. For an "off-market" purchase, the relevant buyback contract must be approved by shareholders either (i) before it was entered into, or (ii) after it was entered into, but provided that no shares may be purchased under the contract until it has been approved (by way of a special resolution). For a "market" purchase, the repurchase must be approved by an ordinary resolution of the shareholders (unless the company's articles require a higher percentage), and it is common for listed companies to seek an annual authority from shareholders to repurchase shares at their annual general meeting. A public limited company has the authority to issue redeemable shares provided that this is permitted by its articles of association (and the articles can be amended by way of special resolution if necessary for these purposes). Shares which are capable of being redeemed must be issued as redeemable shares from the outset and, accordingly, a company cannot amend the terms attaching to a non-redeemable class of shares to make them redeemable. Under the Companies Act 2006, a company which has issued redeemable shares must ensure that it has at least one non-redeemable share in issue and, in the case of a public limited company, that the redemption does not reduce the share capital of the company below the statutory minimum (£50,000, of which one-quarter must be fully paid up) unless the company intends to re-register as a private limited company. |
Under Delaware law, any stock of any class or series may be made subject to redemption by the corporation at its option or at the option of the holders of such stock or upon the happening of a specified event; provided however, that immediately following any such redemption the corporation must have outstanding one or more shares of one or more classes or series of shares, which share, or shares together, have full voting powers. Any stock which may be made redeemable may be redeemed for cash, property or rights, including securities of the same or another corporation, at such time or times, price or prices, or rate or rates, and with such adjustments, as stated in the certificate of incorporation or in the resolution or resolutions providing for the issue of such stock adopted by the board of directors. Every corporation may purchase, redeem, receive, take or otherwise acquire, own and hold, sell, lend, exchange, transfer or otherwise dispose of, pledge, use and otherwise deal in and with its own shares; provided, however, that no corporation may (i) purchase or redeem its own shares of capital stock for cash or other property when the capital of the corporation is impaired or when such purchase or redemption would cause any impairment of the capital of the corporation, except that a corporation other than a non-stock corporation may purchase or redeem out of capital any of its own shares which are entitled upon any distribution of its assets, whether by dividend or in liquidation, to a preference over another class or series of its stock, or, if no shares entitled to such a preference are outstanding, any of its own shares, if such shares will be retired upon their acquisition and the capital of the corporation reduced (ii) purchase, for more than the price at which they may then be redeemed, any of its shares which are redeemable at the option of the corporation; or (iii) redeem any of its shares, unless their redemption is authorized by Delaware law and then only in accordance with its certificate of incorporation. |
184
| England and Wales | Delaware | |
|---|---|---|
| Liability of Directors and Officers | ||
Under the Companies Act 2006, any provision (whether contained in a company's articles of association or any contract or otherwise) that purports to exempt a director of a company (to any extent) from any liability that would otherwise attach to him in connection with any negligence, default, breach of duty or breach of trust in relation to the company is void. Any provision by which a company directly or indirectly provides an indemnity (to any extent) for a director of the company or of an associated company against any liability attaching to him in connection with any negligence, default, breach of duty or breach of trust in relation to the company of which he is a director is also void except as permitted by the Companies Act 2006, which provides exceptions for a company to (a) purchase and maintain insurance against such liability; (b) provide a "qualifying third party indemnity" (being an indemnity against liability incurred by the director to a person other than the company or an associated company as long as he or she is successful in defending the claim or criminal proceedings); and (c) provide a "qualifying pension scheme indemnity" (being an indemnity against liability incurred in connection with the company's activities as trustee of an occupational pension plan). |
Under Delaware law, a corporation's certificate of incorporation may include a provision eliminating or limiting the personal liability of a director to the corporation and its stockholders for monetary damages arising from a breach of fiduciary duty as a director. However, no provision can limit the liability of a director for: (i) any breach of the director's duty of loyalty to the corporation or its stockholders; (ii) acts or omissions not in good faith or that involve intentional misconduct or a knowing violation of law; (iii) wilful or negligent declaration and payment of unlawful dividends, or unlawful share purchases or redemptions; or (iv) any transaction from which the director derives an improper personal benefit. In addition, under Delaware law, a corporation has the power to indemnify any person who was or is a party or is threatened to be made a party to any threatened, pending or completed action, suit or proceeding, whether civil, criminal, administrative or investigative (whether or not such action is by or in the right of the corporation) by reason of the fact that the person is or was a director, officer, employee or agent of the corporation, against expenses, judgments, fines and amounts paid in settlement actually and reasonably incurred by the person if the person acted in good faith and in a manner reasonably believed to be in or not opposed to the best interests of the corporation; provided, with respect to any criminal action or proceeding, there was no reasonable cause to believe the person's conduct was unlawful; provided, further, that the corporation may not indemnify any person in respect of any claim, issue or matter as to which such person shall have been adjudged to be liable to the corporation unless determined otherwise by court order. |
185
| England and Wales | Delaware | |
|---|---|---|
| Voting Rights | ||
Under English law, unless a poll is demanded by the shareholders of a company or is required by the chairman of the meeting or the company's articles of association, shareholders shall vote on all resolutions on a show of hands. Under the Companies Act 2006, a poll may be demanded by (a) not fewer than five shareholders having the right to vote on the resolution; (b) any shareholder(s) representing at least 10% of the total voting rights of all the shareholders having the right to vote on the resolution; or (c) any shareholder(s) holding shares in the company conferring a right to vote on the resolution (being shares on which an aggregate sum has been paid up equal to not less than 10% of the total sum paid up on all the shares conferring that right). A company's articles of association may provide more extensive rights for shareholders to call a poll. Under English law, an ordinary resolution is passed on a show of hands if it is approved by a simple majority (more than 50%) of the votes cast by shareholders present (in person or by proxy) and entitled to vote. If a poll is demanded, an ordinary resolution is passed if it is approved by holders representing a simple majority of the total voting rights of shareholders present (in person or by proxy) who (being entitled to vote) vote on the resolution. Special resolutions require the affirmative vote of not less than 75% of the votes cast by shareholders present (in person or by proxy) at the meeting. If a poll is demanded, a special resolution is passed if it is approved by holders representing not less than 75% of the total voting rights of shareholders present (in person or by proxy) who (being entitled to vote) vote on the resolution. |
Delaware law provides that, unless otherwise provided in the certificate of incorporation, each stockholder is entitled to one vote for each share of capital stock held by such stockholder. |
|
Shareholder Vote on Certain Transactions |
||
| The Companies Act 2006 provides for schemes of arrangement, which are arrangements or compromises between a company and any class of shareholders or creditors and used in certain types of restructurings, amalgamations,
capital reorganizations or takeovers. These arrangements require:
• the approval at a shareholders' or creditors' meeting convened by order of the court, of a majority in number of shareholders or creditors representing 75% in value of the capital held by, or debt owed to, the class of shareholders or creditors, or class thereof present and voting, either in person or by proxy; and
• the approval of the court. |
Generally, under Delaware law, unless the certificate of incorporation provides for the vote of a larger portion of the stock, completion of a merger, consolidation, sale, lease or exchange of all or substantially all of a corporation's assets or dissolution requires the approval of the board of directors and approval by the vote of the holders of a majority of the outstanding stock or, if the certificate of incorporation provides for more or less than one vote per share, a majority of the votes of the outstanding stock of a corporation entitled to vote on the matter. |
186
| England and Wales | Delaware | |
|---|---|---|
| Standard of Conduct for Directors | ||
| Under English law, a director owes various statutory and fiduciary duties to the company, including:
• to act in the way he or she considers, in good faith, would be most likely to promote the success of the company for the benefit of its members as a whole;
• to avoid a situation in which he or she has, or can have, a direct or indirect interest that conflicts, or possibly conflicts, with the interests of the company;
• to act in accordance with the company's constitution and only exercise his or her powers for the purposes for which they are conferred;
• to exercise independent judgment;
• to exercise reasonable care, skill and diligence;
• not to accept benefits from a third party conferred by reason of his or her being a director or doing (or not doing) anything as a director; and
• a duty to declare any interest that he or she has, whether directly or indirectly, in a proposed or existing transaction or arrangement with the company. |
Delaware law does not contain specific provisions setting forth the standard of conduct of a director. The scope of the fiduciary duties of directors is generally determined by the courts of the State of Delaware. In general, directors have a duty to act without self-interest, on a well-informed basis and in a manner they reasonably believe to be in the best interest of the stockholders. |
|
Shareholder Suits |
||
Under English law, generally, the company, rather than its shareholders, is the proper claimant in an action in respect of a wrong done to the company or where there is an irregularity in the company's internal management. Notwithstanding this general position, the Companies Act 2006 provides that (i) a court may allow a shareholder to bring a derivative claim (that is, an action in respect of and on behalf of the company) in respect of a cause of action arising from a director's negligence, default, breach of duty or breach of trust and (ii) a shareholder may bring a claim for a court order where the company's affairs have been or are being conducted in a manner that is unfairly prejudicial to some of its shareholders. |
Under Delaware law, a stockholder may initiate a derivative action to enforce a right of a corporation if the corporation fails to enforce the right itself. The complaint must:
• state that the plaintiff was a stockholder at the time of the transaction of which the plaintiff complains or that the plaintiffs shares thereafter devolved on the plaintiff by operation of law; and
• allege with particularity the efforts made by the plaintiff to obtain the action the plaintiff desires from the directors and the reasons for the plaintiff's failure to obtain the action; or
• state the reasons for not making the effort. Additionally, the plaintiff must remain a stockholder through the duration of the derivative suit. The action will not be dismissed or compromised without the approval of the Delaware Court of Chancery. |
187
| England and Wales | Delaware | |
|---|---|---|
| Inspection of Books and Records | ||
| Under the Companies Act 2006, shareholders have rights including the right to:
• inspect and obtain copies (for a fee) of the minutes of all general meetings of the company and all resolutions of members passed other than at a general meeting;
• inspect copies of the register of members, register of directors, register of secretaries and other statutory registers maintained by the company;
• receive copies of the company's annual report and accounts for each financial year;
• receive notices of general meetings of the company. A company's articles of association must be registered at Companies House and are therefore open to public inspection. Shareholders do not have any right to inspect board minutes of the company. |
Under Delaware law, any stockholder, in person or by attorney or other agent, does, upon written demand under oath stating the purpose thereof, have the right during the usual hours for business to inspect for any proper purpose, and to make copies and extracts from: (i) the corporation's stock ledger, a list of its stockholders, and its other books and records; and (ii) a subsidiary's books and records, to the extent that: (a) the corporation has actual possession and control of such records of such subsidiary; or (b) the corporation could obtain such records through the exercise of control over such subsidiary, provided that as of the date of the making of the demand: (1) the stockholder inspection of such books and records of the subsidiary would not constitute a breach of an agreement between the corporation or the subsidiary and a person or persons not affiliated with the corporation; and (2) the subsidiary would not have the right under the law applicable to it to deny the corporation access to such books and records upon demand by the corporation. |
|
Amendments of Constituent Documents |
||
Under the Companies Act 2006, companies may only alter their articles of association by way of passing a special resolution of shareholders in general meeting. A special resolution under English law requires the approval of not less than 75% of the votes cast at a general meeting at which a quorum is present. |
Under Delaware law, corporation may amend its certificate of incorporation, from time to time, in any and as many respects as may be desired, so long as its certificate of incorporation as amended would contain only such provisions as it would be lawful and proper to insert in an original certificate of incorporation filed at the time of the filing of the amendment; and, if a change in stock or the rights of stockholders, or an exchange, reclassification, subdivision, combination or cancellation of stock or rights of stockholders is to be made, such provisions as may be necessary to effect such change, exchange, reclassification, subdivision, combination or cancellation. |
|
The board of directors must adopt a resolution setting forth the amendment proposed, declaring its advisability, and either calling a special meeting of the stockholders entitled to vote in respect thereof for the consideration of such amendment or directing that the amendment proposed be considered at the next annual meeting of the stockholders. A majority of the outstanding shares entitled to vote thereon and a majority of the outstanding shares of each class entitled to vote thereon as a class must vote in favor of the amendment. |
||
The holders of the outstanding shares of a class must be entitled to vote as a class upon a proposed amendment, whether or not entitled to vote thereon by the certificate of incorporation, if the amendment would increase or decrease the aggregate number of authorized shares of such class, increase or decrease the par value of the shares of such class, or alter or change the powers, preferences, or special rights of the shares of such class so as to affect them adversely. |
188
ORDINARY SHARES ELIGIBLE FOR FUTURE SALE
Prior to this offering, there has been no established public market for our ordinary shares, and we cannot predict the effect, if any, that sales of ordinary shares or availability of any ordinary shares for sale will have on the market price of our ordinary shares prevailing from time to time. Issuances or sales of substantial amounts of ordinary shares (including ordinary shares issued on the exercise of options, warrants or convertible securities, if any) or the perception that such issuances or sales could occur, could adversely affect the market price of our ordinary shares and our ability to raise additional capital through a future sale of securities.
Upon completion of this offering, we will have ordinary shares issued and outstanding. All of the ordinary shares sold in this offering will be freely tradable without restriction or further registration under the Securities Act, unless such shares are purchased by "affiliates" as that term is defined in Rule 144 under the Securities Act or are subject to a lock-up agreement (described below). Upon completion of this offering, approximately % of our outstanding ordinary shares will be held by "affiliates" as that term is defined in Rule 144 or be subject to a lock-up agreement (assuming no shares are sold in this offering to a holder that is subject to a lock-up agreement). The ordinary shares held by "affiliates" will be "restricted securities" as that phrase is defined in Rule 144. Subject to certain contractual restrictions, including the lock-up agreements, holders of restricted shares will be entitled to sell those shares in the public market if they qualify for an exemption from registration under Rule 144 or any other applicable exemption under the Securities Act. Subject to the lock-up agreements and the provisions of Rules 144 and 701 under the Securities Act, additional shares will be available for sale as set forth below.
Registration Statement on Form S-8
In addition to our issued and outstanding ordinary shares, we intend to file a registration statement on Form S-8 to register an aggregate of approximately ordinary shares reserved for issuance under our incentive programs. That registration statement will become effective upon filing and ordinary shares covered by such registration statement are eligible for sale in the public market immediately after the effective date of such registration statement (unless held by affiliates), subject to the lock-up agreements described below. See "Compensation Discussion and Analysis—2013 Compensation Process and Elements—2013 Compensation Elements—Equity-based Compensation Awards."
Lock-Up Agreements
See "Underwriting" for a description of the lock-up agreements entered into with the underwriters in connection with this offering. Upon the completion of this offering, we, our executive officers and directors and the Selling Shareholder will agree with Merrill Lynch, Pierce, Fenner & Smith Incorporated and Morgan Stanley & Co. LLC to not sell or otherwise dispose of any ordinary shares owned by us or them (other than to certain permitted transferees) for a period of 180 days (subject to adjustment) following the completion of this offering.
Registration Rights
Concurrently with the closing of this offering, we expect to enter into a registration rights agreement with our Parent. Under this registration rights agreement, following the first anniversary of the closing of this offering, our Parent, which is the beneficial owner of ordinary shares, will have the right to require us to register the offer and sale of its shares, or to include its shares in registration statements we file, in each case as described in "Certain Relationships and Related Party Transactions—Relationship with Our Parent and OMGUK Following This Offering—Registration Rights Agreement".
189
Rule 144
In general, under Rule 144 under the Securities Act, a person (or persons whose shares are aggregated) who is not deemed to have been an affiliate of ours at any time during the three months preceding a sale, and who has beneficially owned restricted securities within the meaning of Rule 144 for at least six months (including any period of consecutive ownership of preceding non-affiliated holders), will be entitled to sell those shares, subject only to the availability of current public information about us. A non-affiliated person who has beneficially owned restricted securities within the meaning of Rule 144 for at least one year will be entitled to sell those shares without regard to the provisions of Rule 144.
A person (or persons whose shares are aggregated) who is deemed to be an affiliate of ours and who has beneficially owned restricted securities within the meaning of Rule 144 for at least six months would be entitled to sell within any three-month period a number of shares that does not exceed the greater of 1% of our then-outstanding ordinary shares, which will be equal to shares upon consummation of this offering, or the average weekly trading volume of our ordinary shares during the four calendar weeks preceding such sale. Such sales are also subject to certain manner of sales provisions, notice requirements and the availability of current public information about us. We are unable to estimate the number of shares that will be sold under Rule 144 since this will depend on the market price for our ordinary shares, the personal circumstances of the shareholder and other factors.
190
MATERIAL U.S. FEDERAL TAX CONSIDERATIONS FOR
HOLDERS OF ORDINARY SHARES
The following discussion addresses the material U.S. federal tax consequences to us of the Reorganization and to the beneficial owners (referred to in this discussion as "holders") of our ordinary shares of acquiring, holding, and disposing of our ordinary shares. The following discussion assumes that our acquisition of OMUSH will be consummated strictly in accordance with the terms of the agreements affecting the Reorganization and as described in this Registration Statement.
The discussion below is based upon the provisions of the Code, its legislative history, existing and proposed U.S. Treasury regulations, published rulings and other official guidance and court decisions, all as currently in effect, as well as the Treaty. These authorities are subject to change, possibly on a retroactive basis. No ruling is intended to be sought from the IRS with respect to the Reorganization or this offering, and there can be no assurance that the IRS or a court will not take a contrary position regarding the tax consequences described herein or that such a contrary position would not be sustained. This discussion is not a complete analysis of all the potential U.S. federal income tax consequences related to this offering. In addition, this discussion does not address any state, local or foreign tax consequences of this offering or, except as specifically set forth herein, any U.S. federal tax consequences of this offering other than U.S. federal income tax consequences, such as estate and gift tax consequences.
PROSPECTIVE INVESTORS ARE URGED TO CONSULT THEIR TAX ADVISERS WITH RESPECT TO THE APPLICATION OF THE U.S. FEDERAL INCOME TAX LAWS TO THEIR PARTICULAR SITUATIONS, AS WELL AS ANY INCOME TAX OR OTHER TAX CONSEQUENCES OF THE PURCHASE, OWNERSHIP OR DISPOSITION OF OUR ORDINARY SHARES ARISING UNDER THE LAWS OF THE U.S., ANY STATE, LOCAL, NON-U.S. OR OTHER TAXING JURISDICTION, OR UNDER ANY APPLICABLE TAX TREATY.
TAX CONSEQUENCES OF THE REORGANIZATION AND THIS OFFERING
Tax Consequences of the Reorganization
Tax Residence of OMAM
Under current U.S. federal income tax law, a corporation generally will be considered to be resident for U.S. federal income tax purposes in its place of organization or incorporation. Accordingly, under the generally applicable U.S. federal income tax rules, because we will be a company incorporated in England and Wales, we generally would be classified as a foreign corporation (and, therefore, a non-U.S. tax resident).
Section 7874 of the Code, however, contains rules that could result in adverse U.S. federal income tax consequences for us. These rules are relatively new, their application is complex and there is little guidance regarding their application. If these rules applied, we could be liable for substantial additional U.S. federal income taxes than otherwise would be the case.
Under section 7874 of the Code, a corporation created or organized outside the United States (i.e., a foreign corporation) will be treated as a U.S. corporation for U.S. federal income tax purposes (and, therefore, a U.S. tax resident and subject to U.S. federal income tax on its worldwide income) when (i) the foreign corporation acquires, directly or indirectly, substantially all of the assets held, directly or indirectly, by a U.S. corporation (including the indirect acquisition of assets by acquiring all the outstanding shares of the U.S. corporation), (ii) after the acquisition, the stockholders of the acquired U.S. corporation hold at least 80% (by vote or value) of the shares of the foreign corporation by reason of holding shares of the acquired U.S. corporation, excluding for this purpose stock owned by members of the "expanded affiliated group" (as defined below) including the foreign corporation, and (iii) after the acquisition, the foreign corporation's "expanded affiliated group" does not have
191
substantial business activities in the foreign corporation's country of organization or incorporation when compared to the expanded affiliated group's total business activities. For this purpose, "expanded affiliated group" means one or more chains of corporations including the foreign corporation that are connected through stock ownership with a common parent corporation, provided that the common parent owns directly stock in at least one other corporation in the group that possesses more than 50 percent of the total voting power, and has a value equal to more than 50 percent of the total value, of the stock of such corporation (the "50% ownership test") and stock of each corporation in the group (except the common parent) satisfying the 50% ownership test is owned directly by one or more of the other corporations in the group. If we were treated as a U.S. corporation under this rule, we could be subject to material additional U.S. federal income tax than otherwise would be the case.
Pursuant to the Reorganization, OMAM will indirectly acquire all of OMUSH's assets through the acquisition of shares of OMUSH common stock. As a result, for OMAM to avoid being treated as a U.S. corporation for U.S. federal income tax purposes under section 7874 of the Code, after the Reorganization either (i) the former stockholder of OMUSH i.e., OMGUK, must own (within the meaning of section 7874 of the Code) less than 80% (by both vote and value) of OMAM's ordinary shares by reason of holding shares in OMUSH prior to the Reorganization or (ii) OMAM must have substantial business activities in the United Kingdom after the transactions (taking into account the activities of OMAM's expanded affiliated group) (the "substantial business activities test").
Based on the rules for determining share ownership under section 7874 of the Code, specifically, the rule that excludes shares of OMAM owned by OMGUK due to OMGUK being a member of the expanded affiliated group that includes OMAM, we believe that OMGUK should be treated as owning less than 80% (by both vote and value) of the shares in OMAM by reason of its ownership of shares in OMUSH prior to the Reorganization. As a result, OMAM should be treated as a foreign corporation for U.S. federal tax purposes under section 7874 of the Code, and the remainder of this disclosure assumes such treatment. We cannot assure you that the IRS will agree with the analysis set forth above, however. In addition, there have been legislative proposals to expand the scope of U.S. corporate tax residence and there could be prospective or retroactive changes to section 7874 or the U.S. Treasury regulations thereunder or other official guidance that could result in OMAM being treated as a U.S. corporation.
Limitation on Utilization of Tax Attributes
Section 7874 of the Code also can limit the ability of an acquired U.S. corporation and its U.S. affiliates to utilize certain U.S. tax attributes, such as net operating losses, to offset U.S. taxable income resulting from certain transactions, in certain situations. These limitations generally apply if:
- •
- a foreign corporation acquires, directly or indirectly, substantially all of the assets held, directly or indirectly, by a
U.S. corporation (including the indirect acquisition of assets by acquiring all the outstanding shares of the U.S. corporation);
- •
- after the acquisition, at least 60% of the acquiring foreign corporation's stock (by vote or value) is considered to be
held by former shareholders of the acquired U.S. corporation by reason of holding stock of such U.S. corporation (excluding for this purpose stock owned by the expanded affiliated group including the
foreign corporation); and
- •
- the expanded affiliated group which includes the acquiring foreign corporation does not have substantial business activities in the country in which the acquiring foreign corporation is created or organized.
If these requirements were met, section 7874 of the Code would generally impose a minimum level of tax on any "inversion gain" of OMUSH and related U.S. persons (within the meaning of section 7874 of the Code) after the Reorganization. Generally, inversion gain is defined as (i) the
192
income or gain recognized by reason of the transfer of property to a foreign related person during the 10-year period following the acquisition, and (ii) any income received or accrued during such period by reason of a license of any property by OMUSH and related U.S. persons to a foreign related person. In general, the effect of this provision is to deny the use of net operating losses, certain tax credits or other tax attributes to offset the inversion gain.
As discussed above, pursuant to the Reorganization, OMAM will indirectly acquire all of OMUSH's assets through the acquisition of shares of OMUSH common stock in the Reorganization. As a result, for OMUSH to avoid the limitations on the use of its tax attributes against its "inversion gain" under section 7874 of the Code, after the Reorganization, either (i) the former stockholders of OMUSH, i.e., OMGUK, must own (within the meaning of section 7874 of the Code) less than 60% (by both vote and value) of OMAM's ordinary shares by reason of holding shares in OMUSH, excluding for this purpose stock owned by members of the expanded affiliated group including OMAM, or (ii) OMAM must satisfy the "substantial business activities test".
Based on the rules for determining share ownership under section 7874 of the Code and, specifically, the rule that excludes shares of OMAM owned by OMGUK due to OMGUK being a member of the expanded affiliated group that includes OMAM, we believe that OMGUK should be treated as owning less than 60% (by both vote and value) of the shares in OMAM by reason of its ownership of shares in OMUSH prior to the Reorganization. As a result, OMUSH's ability to utilize its tax attributes to offset its inversion gain should not be limited under section 7874 of the Code, and the remainder of this disclosure assumes such treatment. We cannot assure you that the IRS will agree with the analysis set forth above, however. In addition, there have been legislative proposals to expand the scope of U.S. corporate tax residence and there could be prospective or retroactive changes to section 7874 of the Code or the U.S. Treasury regulations thereunder or other official guidance that could result in a limitation on OMUSH's ability to utilize its tax attributes against its inversion gain.
If OMUSH were limited in its ability to utilize its tax attributes under section 7874 of the Code, the U.S. consolidated group that includes OMUSH would owe potentially more U.S. tax due to the inability to utilize these tax attributes, but there would likely be a corresponding reduction in the obligation of OMAM to make payments under the deferred tax asset arrangement in the same or subsequent periods. For further discussion of the deferred tax asset arrangement, see "Certain Relationships and Related Party Transactions—Relationship with Our Parent and OMGUK Following This Offering—Deferred Tax Asset Arrangement."
Tax Consequences of the Offering
This discussion does not address all aspects of U.S. federal taxation that may be relevant to a particular holder of our ordinary shares in light of that holder's particular circumstances or to holders subject to special treatment under the U.S. federal income tax laws, including without limitation:
- •
- dealers in securities;
- •
- tax-exempt organizations, qualified retirement plans, individual retirement accounts, or other tax-deferred accounts;
- •
- financial institutions, underwriters, insurance companies, real estate investment trusts, regulated investment companies;
- •
- broker-dealers, dealers, or traders in securities or currencies that elect to apply a mark-to-market accounting method;
- •
- holders who hold our ordinary shares as part of a hedge, appreciated financial position, straddle, constructive sale,
conversion transactions or other risk reduction transaction;
- •
- holders who purchase or sell securities as part of a wash sale for tax purposes;
193
- •
- holders who acquire their ordinary shares pursuant to the exercise of employee options or otherwise as compensation;
- •
- holders liable for the alternative minimum tax;
- •
- except as specifically set forth below, U.S. holders that actually or constructively own 10% or more of the total combined
voting power of our outstanding shares of stock;
- •
- except where noted, holders who do not hold our ordinary shares as capital assets within the meaning of
section 1221 of the Code, which generally means property held for investment; or
- •
- holders whose functional currency is not the U.S. dollar.
Accordingly, we urge prospective investors to consult with their own tax advisers regarding the federal, state, local and other tax considerations of acquiring, holding and disposing of our ordinary shares.
In addition, this discussion does not address the tax treatment of partnerships (or entities or arrangements that are treated as partnerships for U.S. federal income tax purposes) or persons who hold their ordinary shares through such entities for U.S. federal income tax purposes. If a partnership (or other entity or arrangement treated as a partnership for U.S. federal income tax purposes) is a beneficial owner of our ordinary shares, the tax treatment of a partner in the partnership (or member in such other entity) generally will depend upon the status of the partner and the activities of the partnership. Any partner in a partnership holding our ordinary shares should consult its own tax advisers.
Tax Consequences to U.S. Holders of Our Ordinary Shares
The discussion set forth below with respect to U.S. holders (as defined below) is applicable only to U.S. holders (i) who are residents of the U.S. for purposes of the current income tax treaty between the United Kingdom and the U.S. (the "Treaty"), (ii) whose ordinary shares are not, for purposes of the Treaty, effectively connected with such U.S. holder's permanent establishment in the United Kingdom and (iii) who otherwise qualify for the full benefits of the Treaty. As used herein, the term "U.S. holder" means a beneficial owner of our ordinary shares that is for U.S. federal income tax purposes:
- •
- a citizen or resident of the U.S.;
- •
- a corporation or other entity taxable as a corporation for U.S. federal income tax purposes created or organized in or
under the laws of the U.S., any state thereof or the District of Columbia;
- •
- an estate the income of which is subject to U.S. federal income taxation regardless of its source; or
- •
- a trust if (i) the trust is subject to the primary supervision of a court within the U.S. and one or more U.S. persons have the authority to control all substantial decisions of the trust or (ii) the trust has a valid election in effect under applicable U.S. Treasury Regulations to be treated as a U.S. person.
Characterization of OMAM as a "Controlled Foreign Corporation" for U.S. Federal Income Tax Purposes
There is a possibility that we will be classified as a "controlled foreign corporation", or CFC, for U.S. federal income tax purposes. We will generally be classified as a CFC if more than 50% of our outstanding shares, measured by reference to voting power or value, are owned (directly, indirectly or by attribution) by "10% U.S. Shareholders." For this purpose, a "10% U.S. Shareholder" is any U.S. person that owns directly, indirectly or by attribution, 10% or more of the voting power of our
194
outstanding ordinary shares. If we are classified as a CFC, a 10% U.S. Shareholder may be subject to U.S. federal income taxation at ordinary income tax rates on all or a portion of our undistributed earnings and profits attributable to certain categories of passive income and certain other income described in Subpart F of the Code, and may also be subject to U.S. federal income taxation at ordinary income tax rates on any gain realized on a sale of ordinary shares, to the extent of our current and accumulated earnings and profits attributable to such shares. The CFC rules are complex and U.S. holders that are, or may be, 10% U.S. Shareholders are urged to consult their own tax advisors regarding the possible application of the CFC rules to them in their particular circumstances. Based on our understanding of the direct and indirect ownership of our ordinary shares, we do not believe that we should be classified as a CFC, and the remainder of this discussion assumes that we will not be classified as a CFC for U.S. federal income tax purposes but no assurances can be offered in this regard.
Taxation of Dividends
Subject to the PFIC rules discussed below, the gross amount of cash distributions on our ordinary shares will be taxable as dividends to the extent paid out of our current or accumulated earnings and profits, as determined under U.S. federal income tax principles. However, we do not currently maintain, and do not intend to maintain, calculations of our earnings and profits under U.S. federal income tax principles. Therefore, a U.S. holder should expect that a distribution generally will be treated as a dividend. Such dividends will be includable in a U.S. holder's gross income as ordinary income on the day actually or constructively received by the U.S. holder. Such dividends will not be eligible for the dividends-received deduction generally allowed to U.S. corporations in respect of dividends received from other U.S. corporations.
Subject to the PFIC rules discussed below, certain dividends received by non-corporate U.S. holders, from a qualified foreign corporation (such dividends, "qualified dividend income") may be subject to reduced rates of taxation. Dividends on our ordinary shares will be treated as qualified dividend income if (1) either (a) we are eligible for the benefits of a comprehensive income tax treaty with the U.S. that the U.S. Treasury Department determines to be satisfactory for these purposes and that includes an exchange of information provision (such as the Treaty, which the U.S. Treasury Department has determined meets these requirements), or (b) our ordinary shares are considered to be readily tradable on an established securities market in the U.S. (which, based on guidance from the U.S. Treasury Department, should be the case with respect to our ordinary shares, which are expected to be listed on the NYSE, although there can be no assurance in this regard), (2) the U.S. holder has held our ordinary shares for at least 61 days of the 121-day holding period beginning on the date which is 60 days before the ex-dividend date (with any days during which the U.S. holder has diminished the U.S. holder's risk of loss with respect to our ordinary not being counted towards satisfaction of the holding period requirement), (3) the U.S. holder does not elect to treat the dividend income as "investment income" pursuant to section 163(d)(4) of the Code (dealing with the deduction for investment interest expense), and (5) the U.S. holder is not obligated to make related payments with respect to positions in substantially similar or related property.
Distributions in excess of our current and accumulated earnings and profits, as determined for U.S. federal income tax purposes, will be treated as a non-taxable return of (and will reduce, but not below zero) the U.S. holder's adjusted tax basis in our ordinary shares, and thereafter as capital gain, which will be either long-term or short-term depending on whether the U.S. holder's holding period in our ordinary shares exceeded one year.
It is possible that we are, or at some future time we will be, at least 50% owned by U.S. persons. Dividends paid by a foreign corporation that is at least 50% owned by U.S. persons may be treated as U.S. source income (rather than foreign source income) for foreign tax credit purposes to the extent the foreign corporation has more than an insignificant amount of U.S. source income. The effect of this
195
rule may be to treat a portion of any dividends paid by us as U.S. source income, which may affect the calculation of a U.S. holder's foreign tax credit. The rules related to foreign tax credits are complex, and U.S. holders should consult their own tax advisors regarding the calculation of such amounts.
The amount of any dividend paid in foreign currency will be the U.S. dollar value of the foreign currency distributed by us, calculated by reference to the exchange rate in effect on the date the dividend is includible in the U.S. holder's income, regardless of whether the payment is in fact converted into U.S. dollars on the date of receipt. Generally, a U.S. holder should not recognize any foreign currency gain or loss if the foreign currency is converted into U.S. dollars on the date the payment is received. However, any gain or loss resulting from currency exchange fluctuations during the period from the date the U.S. holder includes the dividend payment in income to the date such U.S. holder actually converts the payment into U.S. dollars will be treated as ordinary income or loss. That currency exchange income or loss (if any) generally will be income or loss from U.S. sources for foreign tax credit limitation purposes.
Taxation of Capital Gains
Subject to the PFIC rules discussed below, a U.S. holder that sells or otherwise disposes of our ordinary shares will recognize capital gain or loss for U.S. federal income tax purposes equal to the difference between the amount realized in respect of such disposition and such holder's adjusted tax basis in such ordinary shares. For U.S. holders of our ordinary shares, such holder's adjusted tax basis in such shares generally will equal the amount paid in respect thereof, and its holding period will begin on the date of acquisition. Capital gain of a non-corporate U.S. holder is generally taxed at preferential rates where the property is held for more than one year. The deductibility of capital losses is subject to significant limitations. Such capital gain or loss will generally be income or loss from sources within the United States for foreign tax credit limitation purposes.
Medicare Tax
A U.S. holder of our ordinary shares that is an individual, an estate, or a trust that does not fall into a special class of trusts that are exempt for these purposes, will be subject to a 3.8% tax on the lesser of (i) the U.S. holder's "net investment income" for the relevant taxable year and (ii) the excess of the U.S. holder's modified adjusted gross income for the taxable year over a certain threshold (which in the case of individuals is between $125,000 and $250,000, depending on the individual's circumstances). A U.S. holder's net investment income generally will include its dividend income and its net gains from the disposition of our ordinary shares, unless such dividend income or net gains are derived in the ordinary course of the conduct of a trade or business (other than a trade or business that consists of certain passive or trading activities). U.S. holders that are individuals, estates or trusts are urged to consult their tax advisors regarding the applicability of the Medicare tax to income and gains in respect of an investment in our ordinary shares.
PFIC Rules
The treatment of U.S. holders of our ordinary shares in some cases could be materially different from that described above if, at any relevant time, we are treated as a passive foreign investment company, or PFIC, for U.S. federal income tax purposes.
For U.S. federal income tax purposes, a foreign corporation is classified as a PFIC for any taxable year if either (i) 75% or more of its gross income for such taxable year is "passive income" (as defined for such purposes) or (ii) 50% or more of the value of the assets held by such corporation (based on an average of the quarterly values of the assets) during such taxable year is attributable to assets that produce passive income or that are held for the production of passive income. For purposes of applying the tests in the preceding sentence, the foreign corporation is deemed to own its proportionate share of
196
the assets, and to receive directly its proportionate share of the income, of any other corporation of which the foreign corporation owns, directly or indirectly, at least 25% (by value) of the stock. In addition, a "start-up" exception provides that a newly-formed foreign corporation will not be treated as a PFIC even if it meets the passive income and asset tests described above for its first taxable year so long as, in general, the foreign corporation is not expected to and actually does not meet such tests for any of the following two taxable years.
We do not believe that we are currently a PFIC and we do not anticipate becoming a PFIC in the forseeable future, taking into account the income and assets of OMUSH (of which we will own in excess of 25%), the expected treatment of intercompany interest income for purposes of these rules, and the start-up exception described above; however, no assurances can be offered in this regard. The tests for determining PFIC status are applied annually after the close of the taxable year, and it is difficult to accurately predict future income and assets relevant to this determination and no ruling from the IRS or opinion of counsel has been or will be sought with respect to PFIC status. The determination of whether we are a PFIC depends on our particular facts and circumstances (such as the valuation of our assets, including goodwill and other intangible assets, the treatment of intercompany interest income, etc.) and may also be impacted by the application of the PFIC rules, which are subject to differing interpretations. The fair market value of our assets is expected to depend, in part, upon (a) the market price of our ordinary shares and (b) the composition of our income and assets, which will be impacted by how, and how quickly, we spend any cash that is raised in any financing transaction. If we should determine that we are a PFIC, we will attempt to notify U.S. holders, although there can be no assurance that it will be able to do so in a timely and complete manner. If we are a PFIC for any taxable year during which a U.S. holder holds our ordinary shares, we generally will continue to be treated as a PFIC with respect to such U.S. holder for all succeeding taxable years during which such holder holds our ordinary shares, although a U.S. holder may avoid some of the adverse effects of the PFIC regime by making a deemed sale election with respect to our ordinary shares after we have ceased being treated as a PFIC. If we were treated as a PFIC, then, unless a U.S. holder elects to be taxed annually on a mark-to-market basis with respect to our ordinary shares, gain realized on any sale or other disposition of such shares and certain distributions with respect to such shares could be subject to additional U.S. federal income taxes, plus an interest charge on certain taxes treated as having been deferred under the PFIC rules. In addition, if we are treated as a PFIC with respect to such U.S. holder either in the taxable year of the dividend or the preceding taxable year, dividends that a U.S. holder receives from us would not be eligible for the reduced U.S. federal income tax rates applicable to certain dividends received from qualified foreign corporations, but instead would be subject to U.S. federal income tax rates applicable to ordinary income.
If we are a PFIC, a U.S. holder would be subject to potentially onerous additional U.S. federal income tax filing obligations with respect to our ordinary shares and, in the event that the U.S. holder does not comply with such filing obligations with respect to a tax year, the statute of limitations on the assessment and collection of U.S. federal income taxes of such U.S. holder for the related tax year may not close before the date which is three years after the date on which such information is filed.
Tax Consequences to Non-U.S. Holders of Our Ordinary Shares
The discussion set forth below is limited to non-U.S. holders of our ordinary shares. The term "non-U.S. holder" means a beneficial owner of our ordinary shares that is neither a U.S. holder nor a partnership (or an entity or arrangement treated as a partnership for U.S. federal income tax purposes).
Taxation of Dividends
A non-U.S. holder generally will not be subject to U.S. federal income or withholding tax on dividends received with respect to our ordinary shares unless: (i) the dividends are effectively connected
197
with the non-U.S. holder's conduct of a trade or business in the United States (and, if an income tax treaty applies, the dividends are attributable to a permanent establishment or fixed place of business maintained by the non-U.S. holder in the United States); or (ii) such non-U.S. holder is subject to backup withholding, as described more fully below.
Taxation of Capital Gains
Subject to the discussion below regarding backup withholding, a non-U.S. holder generally will not be subject to U.S. federal income tax on any gain realized on a sale or other taxable disposition of our ordinary shares unless:
- •
- the gain is "effectively connected" with the non-U.S. holder's conduct of a trade or business in the U.S., and, if
required by an applicable income tax treaty, the gain is attributable to a permanent establishment or fixed place of business that the non-U.S. holder maintains in the U.S., or
- •
- the non-U.S. holder is an individual, holds the ordinary shares as a capital asset, is present in the U.S. for 183 or more days in the taxable year of the sale, and certain other conditions exist.
Gain described in the first bullet point above will be subject to U.S. federal income tax on a net income basis at regular graduated U.S. federal income tax rates generally in the same manner as if such holder were a U.S. holder. A non-U.S. holder that is a non-U.S. corporation (or non-U.S. entity treated as a corporation for U.S. federal income tax purposes) also may be subject to an additional branch profits tax equal to 30% (or such lower rate specified by an applicable income tax treaty) of a portion of its effectively connected earnings and profits for the taxable year.
Gain described in the second bullet point above will be subject to U.S. federal income tax at a flat 30% rate (or such lower rate specified by an applicable income tax treaty), but may be offset by U.S. source capital losses (even though the individual is not considered a resident of the U.S.), provided that the non-U.S. holder has timely filed U.S. federal income tax returns with respect to such losses.
Backup Withholding and Information Reporting
The amounts of any dividend payments made to a non-corporate U.S. holder of our ordinary shares within the United States and any proceeds received from the sale or other taxable disposition of our ordinary shares effected within the United States by a U.S. holder may be subject to information reporting to the IRS. Backup withholding (currently at a rate of 28%) may apply to such amounts if the U.S. holder fails to provide an accurate taxpayer identification number (generally on an IRS Form W-9 provided to the U.S. holder's broker or other applicable withholding agent) or to otherwise establish its exemption from backup withholding.
In general, the payment of dividends or the proceeds received from the sale or other taxable disposition of our ordinary shares to a non-U.S. holder by a U.S. paying agent or other U.S. intermediary may be subject to information reporting, unless the non-U.S. holder certifies under penalties of perjury that it is a non-United States person and neither we nor our paying agent have actual knowledge to the contrary. In addition, backup withholding may apply to such payments if such non-U.S. holder fails to provide the certification on IRS Form W-8BEN or IRS Form W-8BEN-E, as applicable (or IRS Form W-8ECI, if applicable) (or successor forms), does not otherwise provide evidence of exempt status or we or our paying agent have actual knowledge, or reason to know, to the contrary.
Backup withholding is not an additional tax. Any amounts withheld under the backup withholding rules may be allowed as a credit against a holder's U.S. federal income tax liability, or refunded to such holder, provided the required information is timely furnished to the IRS.
198
Certain individual U.S. holders (and to the extent specified in applicable U.S. Treasury regulations, certain U.S. holders that are entities and certain non-U.S. holders) holding "specified foreign financial assets" (as defined in section 6038D of the Code) whose aggregate value exceeds $75,000 at any time during the taxable year or $50,000 on the last day of the taxable year (or such higher amounts as prescribed by applicable U.S. Treasury regulations) are required to report information relating to their ownership of such assets for each such taxable year to the IRS, by attaching a completed IRS Form 8938, Statement of Specified Foreign Financial Assets, with their tax return for such taxable year. Specified foreign financial assets would include, among other assets, our ordinary shares that are owned by a U.S. holder, unless the ordinary shares are held in an account maintained with a U.S. financial institution. Substantial penalties apply to any failure to file IRS Form 8938, unless the failure is shown to be due to reasonable cause and not due to willful neglect. Also, in the event a U.S. holder does not file IRS Form 8938 or fails to report a specified foreign financial asset that is required to be reported, the statute of limitations on the assessment and collection of U.S. federal income taxes of such U.S. holder for the related tax year may not close before the date which is three years after the date on which the required information is filed. U.S. holders should consult their own tax advisors regarding information reporting requirements relating to their ownership of our ordinary shares.
Foreign Account Tax Compliance Act
Provisions under the Code and Treasury regulations thereunder, commonly referred to as "FATCA," may impose a 30% withholding tax on certain "withholdable payments" and "foreign passthru payments" (each as defined in the Code) made by a "foreign financial institution" (as defined in the Code) that has entered into an agreement with the Internal Revenue Service to perform certain diligence and reporting obligations with respect to the foreign financial institution's accounts (each such foreign financial institution, a "Participating Foreign Financial Institution"). If we were treated as a foreign financial institution and become a Participating Foreign Financial Institution, such withholding may be imposed on payments on our ordinary shares (to the extent such payments are considered foreign passthru payments) to any foreign financial institution (including an intermediary through which a holder may hold ordinary shares) that is not a Participating Foreign Financial Institution or any other investor who does not provide information sufficient to establish that the investor is not subject to withholding under FATCA, unless such foreign financial institution or investor is otherwise exempt from FATCA. The term "foreign passthru payment" is not yet defined and it is therefore not clear whether or to what extent payments on the ordinary shares would be considered foreign passthru payments. Withholding on foreign passthru payments would not be required with respect to payments made before January 1, 2017. The United States has entered into intergovernmental agreements with the United Kingdom and other jurisdictions that will modify the FATCA withholding regime described above. It is not yet clear how these intergovernmental agreements will address foreign passthru payments and whether such intergovernmental agreements may relieve foreign financial institutions of any obligation to withhold on foreign passthru payments. Prospective investors should consult their tax advisors regarding the potential impact of FATCA, or any intergovernmental agreement or non-U.S. legislation implementing FATCA, on their investment in the ordinary shares.
FATCA IS PARTICULARLY COMPLEX AND ITS APPLICATION TO OMAM, THE ORDINARY SHARES AND THE HOLDERS IS SUBJECT TO CHANGE. EACH HOLDER OF ORDINARY SHARES SHOULD CONSULT ITS OWN TAX ADVISOR TO OBTAIN A MORE DETAILED EXPLANATION OF FATCA AND TO LEARN HOW FATCA MIGHT AFFECT EACH HOLDER IN ITS PARTICULAR CIRCUMSTANCE.
The preceding discussion is not tax advice. Each prospective investor should consult the prospective investor's own tax adviser regarding the particular U.S. federal, state and local and non-U.S. tax consequences of purchasing, holding and disposing of our ordinary shares, including the consequences of any proposed change in applicable laws.
199
MATERIAL UNITED KINGDOM TAX CONSIDERATIONS FOR
HOLDERS OF ORDINARY SHARES
The following statements do not constitute tax advice and are intended only as a general guide to current United Kingdom law and HMRC published practice, which may not be binding on HMRC, as at the date of this document (which are both subject to change at any time, possibly with retrospective effect). They relate only to certain limited aspects of the United Kingdom tax treatment of the beneficial owners of the ordinary shares which will form part of this offering (the "holders") and are intended to apply only to holders who are resident only in the United Kingdom for United Kingdom tax purposes (unless the context requires otherwise) and, if individuals, who are domiciled in the United Kingdom and to whom split-year treatment does not apply and who are and will be the absolute beneficial owners of the ordinary shares (otherwise than through an Individual Savings Account or a Self-Invested Personal Pension) and who hold, and will hold, the ordinary shares through the Depository Trust Company as investments (and not as securities to be realised in the course of a trade). They are not exhaustive and may not apply to certain holders, such as dealers in securities, broker dealers, insurance companies and collective investment schemes, holders who are exempt from taxation and holders who have (or are deemed to have) acquired the ordinary shares by virtue of an office or employment. Such persons may be subject to special rules. This summary does not address any inheritance tax considerations.
Prospective purchasers of the ordinary shares who are in any doubt as to their tax position, or who are subject to tax in any jurisdiction other than the United Kingdom, should consult an appropriate professional adviser.
Taxation of Dividends
General
OMAM is not required to make any withholding or deduction for or on account of United Kingdom tax in respect of dividends on the ordinary shares.
Individual Holders
When OMAM pays a dividend to a holder who is an individual resident (for tax purposes) in the United Kingdom, the holder will be entitled to a tax credit equal to one-ninth of the dividend received.
The dividend received plus the related tax credit, or the gross dividend, will be part of the holder's total income for United Kingdom income tax purposes and will be regarded as the top slice of that income. However, in calculating the holder's liability to income tax in respect of the gross dividend, the tax credit (which equates to 10% of the gross dividend) is set off against the tax chargeable on the gross dividend.
Basic Rate Taxpayers
In the case of a holder who is liable to income tax at the basic rate, the holder will be subject to tax on the gross dividend at the rate of 10%. The tax credit will, in consequence, satisfy in full the holder's liability to income tax on the gross dividend.
Higher Rate Taxpayers
In the case of a holder who is liable to income tax at the higher rate, the holder will be subject to tax on the gross dividend at the rate of 32.5%, to the extent that the gross dividend falls above the threshold for the higher rate of income tax but below the threshold for the additional rate of income tax when it is treated (as mentioned above) as the top slice of the holder's income.
200
This means that the tax credit will satisfy only part of the holder's liability to income tax on the gross dividend, so that the holder will have to account for income tax equal to 22.5% of the gross dividend (which equates to 25% of the dividend received). For example, a dividend of £90 from the Company would represent a gross dividend of £100 (after the addition of the tax credit of £10 (being one-ninth of £90)) and the holder would be required to account for income tax of £22.50 on the dividend, being £32.50 (i.e. 32.5% of £100) less £10 (the amount of the tax credit).
Additional Rate Taxpayers
In the case of a holder who is liable to income tax at the additional rate, the holder will be subject to tax on the gross dividend at the dividend additional rate of 37.5%, to the extent that the gross dividend falls above the threshold for the additional rate of income tax when it is treated (as mentioned above) as the top slice of the holder's income. This means that the tax credit will satisfy only part of the holder's liability to income tax on the gross dividend, so that the holder will have to account for income tax equal to 27.5% of the gross dividend (which equates to approximately 30.6% of the dividend actually received). For example, a dividend of £90 from the Company would represent a gross dividend of £100 (after the addition of the tax credit of £10 (being one-ninth of £90)) and the holder would be required to account for income tax of £27.50 on the dividend, being £37.50 (i.e. 37.5% of £100) less £10 (the amount of the tax credit).
Corporate Holders
Holders within the charge to United Kingdom corporation tax which are "small companies" (for the purposes of United Kingdom taxation of dividends) will not generally expect to be subject to tax on dividends from the Company.
Other holders within the charge to United Kingdom corporation tax will not be subject to tax on dividends (including dividends from the Company) so long as the dividends fall within an exempt class and certain conditions are met. For example: dividends paid to a person holding less than 10% of the issued share capital of the payer (or any class of that share capital) are generally dividends that fall within an exempt class subject to the application of relevant anti-avoidance rules.
Holders Resident outside the United Kingdom
Where a holder resident for tax purposes outside the United Kingdom carries on a trade, profession or vocation in the United Kingdom and the dividends are a receipt of that trade or, in the case of corporation tax, the ordinary shares are held by or for a United Kingdom permanent establishment through which a trade is carried on, the holder may be liable to United Kingdom tax on dividends paid by the Company.
Tax Credit
Other than as set out below, a holder (whether an individual or a company) who is not liable to tax on dividends from the Company will not be entitled to claim payment of the tax credit in respect of those dividends.
The right of a holder who is not resident (for tax purposes) in the United Kingdom to a tax credit in respect of a dividend received from the Company and to claim payment of any part of that tax credit will depend on the existence and terms of any double taxation convention between the United Kingdom and the country in which the holder is resident and the domestic law of that jurisdiction, although generally no such payment will be available.
201
Taxation of Chargeable Gains
Individual Holders
A disposal of the ordinary shares may give rise to a chargeable gain (or allowable loss) for the purposes of United Kingdom capital gains tax, depending on the circumstances and subject to any available exemption or relief. The rate of capital gains tax is 18% for individuals who are subject to income tax at the basic rate and 28% to the extent that an individual's chargeable gains, when aggregated with his or her income chargeable to income tax, exceeds the basic rate band for income tax purposes. An individual holder is entitled to realize an exempt amount of gains (currently £11,000) in each tax year without being liable to tax.
Corporate Holders
Where a holder is within the charge to corporation tax, including cases where it is not resident (for tax purposes) in the United Kingdom, a disposal of the ordinary shares may give rise to a chargeable gain (or allowable loss) for the purposes of United Kingdom corporation tax, depending on the circumstances and subject to any available exemption or relief. Indexation allowance may reduce the amount of chargeable gain that is subject to corporation tax, but may not create or increase any allowable loss.
Holders Resident outside the United Kingdom
A holder that is not resident in the United Kingdom (and, in the case of an individual, is not temporarily non-resident) for United Kingdom tax purposes and whose ordinary shares are not held in connection with carrying on a trade, profession or vocation in the United Kingdom generally will not be subject to United Kingdom tax on chargeable gains on the disposal of the ordinary shares.
Stamp Duty and Stamp Duty Reserve Tax (or SDRT)
The comments in this section relating to stamp duty and SDRT apply whether or not a holder is resident or domiciled in the United Kingdom. Special rules may apply to holders such as market makers, brokers, dealers and intermediaries.
No stamp duty should be payable on the acquisition or transfer of the beneficial ownership of the ordinary shares held by a nominee for a person whose business is or includes the provision of clearance services where that acquisition or transfer is settled within the clearance service. An agreement for the transfer of such ordinary shares will also not give rise to a SDRT liability, provided that no election has been made under section 97A of the United Kingdom Finance Act 1986 which is applicable to such ordinary shares. We understand that no such election has been made by the Depository Trust Company as respects the ordinary shares.
Any instrument of transfer of the ordinary shares that are not held by a nominee for a person whose business is or includes the provision of clearance services will generally attract stamp duty at a rate of 0.5% of the amount or value of the consideration for the transfer (rounded up, if necessary, to the next multiple of £5). No stamp duty is chargeable on an instrument transferring shares where the amount or value of the consideration is £1,000 or less and it is certified on the instrument that the transaction effected by the instrument does not form part of a larger transaction or series of transactions for which the aggregate consideration exceeds £1,000. An unconditional agreement for such transfer, or a conditional agreement which subsequently becomes unconditional, will also generally be liable to SDRT at the rate of 0.5% of the amount or value of the consideration for the transfer; but such liability will be cancelled if the agreement is completed by a duly stamped instrument of transfer within six years of the date of the agreement, or if the agreement was conditional, the date the
202
agreement became unconditional. Where stamp duty is paid, any SDRT previously paid will be repaid on the making of an appropriate claim generally with interest.
Therefore, a transfer of title in the ordinary shares or an agreement to transfer such shares from within the Depository Trust Company system out of the Depository Trust Company system, and any subsequent transfers or agreements to transfer outside the Depository Trust Company system, will generally attract a charge to United Kingdom stamp duty and/or United Kingdom stamp duty reserve tax. Holders of the ordinary shares should note in particular that a redeposit of the ordinary shares into the Depository Trust Company system, including by means of a transfer into a depositary receipt system, will generally attract United Kingdom stamp duty and/or United Kingdom stamp duty reserve tax at the higher rate of 1.5%.
203
Merrill Lynch, Pierce, Fenner & Smith Incorporated, Morgan Stanley & Co. LLC, Citigroup Global Markets Inc. and Credit Suisse Securities (USA) LLC are acting as representatives of each of the underwriters named below. Subject to the terms and conditions set forth in an underwriting agreement among OMAM, the Selling Shareholder and the underwriters, the Selling Shareholder has agreed to sell to the underwriters, and each of the underwriters has agreed, severally and not jointly, to purchase from the Selling Shareholder, the number of ordinary shares set forth opposite its name below.
| Underwriter |
Number of Ordinary shares |
|||
|---|---|---|---|---|
Merrill Lynch, Pierce, Fenner & Smith |
||||
Morgan Stanley & Co. LLC |
||||
Citigroup Global Markets Inc. |
||||
Credit Suisse Securities (USA) LLC |
||||
Total |
||||
| | | | | |
| | | | | |
Subject to the terms and conditions set forth in the underwriting agreement, the underwriters have agreed, severally and not jointly, to purchase all of the ordinary shares sold under the underwriting agreement if any of these ordinary shares are purchased. If an underwriter defaults, the underwriting agreement provides that the purchase commitments of the non-defaulting underwriters may be increased or the underwriting agreement may be terminated.
OMAM and the Selling Shareholder have agreed to indemnify the underwriters against certain liabilities, including liabilities under the Securities Act, or to contribute to payments the underwriters may be required to make in respect of those liabilities.
The underwriters are offering the ordinary shares, subject to prior sale, when, as and if issued to and accepted by them, subject to approval of legal matters by their counsel, including the validity of the ordinary shares, and other conditions contained in the underwriting agreement, such as the receipt by the underwriters of officer's certificates and legal opinions. The underwriters reserve the right to withdraw, cancel or modify offers to the public and to reject orders in whole or in part.
Commissions and Discounts
The representatives have advised us and the Selling Shareholder that the underwriters propose initially to offer the ordinary shares to the public at the public offering price set forth on the cover page of this prospectus and to dealers at that price less a concession not in excess of $ per share. After the initial offering, the public offering price, concession or any other term of this offering may be changed.
The following table shows the public offering price, underwriting discount and proceeds before expenses to the Selling Shareholder. The information assumes either no exercise or full exercise by the underwriters of their option to purchase additional ordinary shares.
| |
Per Share | Without Option |
With Option |
|||||||
|---|---|---|---|---|---|---|---|---|---|---|
Public offering price |
$ | $ | $ | |||||||
Underwriting discount |
$ | $ | $ | |||||||
Proceeds, before expenses, to the Selling Shareholder |
$ | $ | $ | |||||||
204
The expenses of this offering, not including the underwriting discount, are estimated at $ and are payable by us and the Selling Shareholder.
Option to Purchase Additional Ordinary shares
The Selling Shareholder has granted an option to the underwriters, exercisable for 30 days after the date of this prospectus, to purchase up to additional ordinary shares at the public offering price, less the underwriting discount. If the underwriters exercise this option, each will be obligated, subject to conditions contained in the underwriting agreement, to purchase a number of additional ordinary shares proportionate to that underwriter's initial amount reflected in the above table.
Reserved Shares
At the request of the Selling Shareholder, the underwriters have reserved for sale, at the initial public offering price, up to ordinary shares offered by this prospectus for sale to some of our directors, officers and employees. If these persons purchase reserved shares, this will reduce the number of shares available for sale to the general public. Any reserved shares that are not so purchased will be offered by the underwriters to the general public on the same terms as the other shares offered by this prospectus.
No Sales of Similar Securities
We, the Selling Shareholder and our executive officers and directors have agreed not to sell or transfer any ordinary shares or securities convertible into, exchangeable for, exercisable for, or repayable with ordinary shares, for 180 days after the date of this prospectus without first obtaining the written consent of Merrill Lynch, Pierce, Fenner & Smith Incorporated and Morgan Stanley & Co. LLC. Merrill Lynch, Pierce, Fenner & Smith Incorporated and Morgan Stanley & Co. LLC, in their sole discretion, may release the ordinary shares and other securities subject to the lock-up agreements in whole or in part at any time. Specifically, we and these other persons have agreed, with certain limited exceptions, not to directly or indirectly, during such 180-day period:
- •
- offer, pledge, sell or contract to sell any ordinary shares,
- •
- sell any option or contract to purchase any ordinary shares,
- •
- purchase any option or contract to sell any ordinary shares,
- •
- grant any option, right or warrant for the sale of any ordinary shares,
- •
- lend or otherwise dispose of or transfer any ordinary shares,
- •
- request or demand that we file a registration statement related to the ordinary shares, or
- •
- enter into any swap or other agreement that transfers, in whole or in part, the economic consequence of ownership of any ordinary shares whether any such swap or transaction is to be settled by delivery of ordinary shares or other securities, in cash or otherwise.
This lock-up provision applies to ordinary shares and to securities convertible into or exchangeable or exercisable for or repayable with ordinary shares. It also applies to ordinary shares owned now or acquired later by the person executing the agreement or for which the person executing the agreement later acquires the power of disposition. In the event that either (x) during the last 17 days of the lock-up period referred to above, we issue an earnings release or material news or a material event relating to us occurs or (y) prior to the expiration of the lock-up period, we announce that we will release earnings results or become aware that material news or a material event will occur during the 16-day period beginning on the last day of the lock-up period, the restrictions described above shall
205
continue to apply until the expiration of the 18-day period beginning on the issuance of the earnings release or the occurrence of the material news or material event.
New York Stock Exchange Listing
We will apply to have the ordinary shares listed on the New York Stock Exchange, subject to notice of issuance, under the symbol "OMAM." In order to meet the requirements for listing on that exchange, the underwriters have undertaken to sell a minimum number of shares to a minimum number of beneficial owners as required by that exchange.
Before this offering, there has been no public market for our ordinary shares. The initial public offering price will be determined through negotiations among us, the Selling Shareholder and the representatives. In addition to prevailing market conditions, the factors to be considered in determining the initial public offering price are:
- •
- the valuation multiples of publicly traded companies that the representatives believe to be comparable to us,
- •
- our financial information,
- •
- the history of, and the prospects for, our Company and the industry in which we compete,
- •
- an assessment of our management, its past and present operations, and the prospects for, and timing of, our future
revenues,
- •
- the present state of our development, and
- •
- the above factors in relation to market values and various valuation measures of other companies engaged in activities similar to ours.
An active trading market for the ordinary shares may not develop. It is also possible that after this offering the ordinary shares will not trade in the public market at or above the initial public offering price.
The underwriters do not expect to sell more than 5% of the ordinary shares in the aggregate to accounts over which they exercise discretionary authority.
Price Stabilization, Short Positions and Penalty Bids
Until the distribution of the ordinary shares is completed, SEC rules may limit underwriters and selling group members from bidding for and purchasing our ordinary shares. However, the representatives may engage in transactions that stabilize the price of the ordinary shares, such as bids or purchases to peg, fix or maintain that price.
In connection with this offering, the underwriters may purchase and sell our ordinary shares in the open market. These transactions may include short sales, purchases on the open market to cover positions created by short sales and stabilizing transactions. Short sales involve the sale by the underwriters of a greater number of ordinary shares than they are required to purchase in this offering. "Covered" short sales are sales made in an amount not greater than the underwriters' option to purchase additional ordinary shares described above. The underwriters may close out any covered short position by either exercising their option to purchase additional ordinary shares or purchasing ordinary shares in the open market. In determining the source of ordinary shares to close out the covered short position, the underwriters will consider, among other things, the price of ordinary shares available for purchase in the open market as compared to the price at which they may purchase ordinary shares through the option granted to them. "Naked" short sales are sales in excess of such option. The underwriters must close out any naked short position by purchasing ordinary shares in the open market. A naked short position is more likely to be created if the underwriters are concerned that there may be
206
downward pressure on the price of our ordinary shares in the open market after pricing that could adversely affect investors who purchase in this offering. Stabilizing transactions consist of various bids for or purchases of ordinary shares made by the underwriters in the open market prior to the completion of this offering.
The underwriters may also impose a penalty bid. This occurs when a particular underwriter repays to the underwriters a portion of the underwriting discount received by it because the representatives have repurchased ordinary shares sold by or for the account of such underwriter in stabilizing or short covering transactions.
Similar to other purchase transactions, the underwriters' purchases to cover the syndicate short sales may have the effect of raising or maintaining the market price of our ordinary shares or preventing or retarding a decline in the market price of our ordinary shares. As a result, the price of our ordinary shares may be higher than the price that might otherwise exist in the open market. The underwriters may conduct these transactions on the New York Stock Exchange, in the over-the-counter market or otherwise.
Neither we nor any of the underwriters make any representation or prediction as to the direction or magnitude of any effect that the transactions described above may have on the price of our ordinary shares. In addition, neither we nor any of the underwriters make any representation that the representatives will engage in these transactions or that these transactions, once commenced, will not be discontinued without notice.
Electronic Distribution
In connection with this offering, certain of the underwriters or securities dealers may distribute prospectuses by electronic means, such as e-mail.
Other Relationships
Some of the underwriters and their affiliates have engaged in, and may in the future engage in, investment banking and other commercial dealings in the ordinary course of business with us or our affiliates. They have received, or may in the future receive, customary fees and commissions for these transactions. In 2012, Morgan Stanley & Co. LLC or one of its affiliates acted as our financial advisor in our sale of one of our former affiliates.
In addition, in the ordinary course of their business activities, the underwriters and their affiliates may make or hold a broad array of investments and actively trade debt and equity securities (or related derivative securities) and financial instruments (including bank loans) for their own account and for the accounts of their customers. Such investments and securities activities may involve securities and/or instruments of ours or our affiliates. The underwriters and their affiliates may also make investment recommendations and/or publish or express independent research views in respect of such securities or financial instruments and may hold, or recommend to clients that they acquire, long and/or short positions in such securities and instruments.
Notice to Prospective Investors in the European Economic Area
In relation to each Member State of the European Economic Area that has implemented the Prospectus Directive (each, a "Relevant Member State"), no offer of ordinary shares may be made to the public in that Relevant Member State other than:
- A.
- to
any legal entity which is a qualified investor as defined in the Prospectus Directive;
- B.
- to fewer than 100 or, if the Relevant Member State has implemented the relevant provision of the 2010 PD Amending Directive, 150, natural or legal persons (other than qualified investors
207
- C.
- in any other circumstances falling within Article 3(2) of the Prospectus Directive;
as defined in the Prospectus Directive), as permitted under the Prospectus Directive, subject to obtaining the prior consent of the representatives; or
provided that no such offer of ordinary shares shall require the Company or the representatives to publish a prospectus pursuant to Article 3 of the Prospectus Directive or supplement a prospectus pursuant to Article 16 of the Prospectus Directive.
Each person in a Relevant Member State who initially acquires any ordinary shares or to whom any offer is made will be deemed to have represented, acknowledged and agreed that it is a "qualified investor" within the meaning of the law in that Relevant Member State implementing Article 2(1)(e) of the Prospectus Directive. In the case of any ordinary shares being offered to a financial intermediary, as that term is used in Article 3(2) of the Prospectus Directive, each such financial intermediary will be deemed to have represented, acknowledged and agreed that the ordinary shares acquired by it in the offer have not been acquired on a non-discretionary basis on behalf of, nor have they been acquired with a view to their offer or resale to, persons in circumstances which may give rise to an offer of any ordinary shares to the public other than their offer or resale in a Relevant Member State to qualified investors as so defined or in circumstances in which the prior consent of the representatives has been obtained to each such proposed offer or resale.
The Company, the representatives and their affiliates will rely upon the truth and accuracy of the foregoing representations, acknowledgements and agreements.
This prospectus has been prepared on the basis that any offer of ordinary shares in any Relevant Member State will be made pursuant to an exemption under the Prospectus Directive from the requirement to publish a prospectus for offers of ordinary shares. Accordingly, any person making or intending to make an offer in that Relevant Member State of ordinary shares that are the subject of the offering contemplated in this prospectus may only do so in circumstances in which no obligation arises for the Company or any of the underwriters to publish a prospectus pursuant to Article 3 of the Prospectus Directive in relation to such offer. Neither the Company nor the underwriters have authorized, nor do they authorize, the making of any offer of ordinary shares in circumstances in which an obligation arises for the Company or the underwriters to publish a prospectus for such offer.
For the purpose of the above provisions, the expression "an offer to the public" in relation to any ordinary shares in any Relevant Member State means the communication in any form and by any means of sufficient information on the terms of the offer and the ordinary shares to be offered so as to enable an investor to decide to purchase or subscribe the ordinary shares, as the same may be varied in the Relevant Member State by any measure implementing the Prospectus Directive in the Relevant Member State and the expression "Prospectus Directive" means Directive 2003/71/EC (and any amendments thereto, including the 2010 PD Amending Directive, to the extent implemented in the Relevant Member State) and includes any relevant implementing measure in the Relevant Member State and the expression "2010 PD Amending Directive" means Directive 2010/73/EU.
Notice to Prospective Investors in the United Kingdom
In addition, in the United Kingdom, this document is being distributed only to, and is directed only at, and any offer subsequently made may only be directed at persons who are "qualified investors" (as defined in the Prospectus Directive) (i) who have professional experience in matters relating to investments falling within Article 19 (5) of the Financial Services and Markets Act 2000 (Financial Promotion) Order 2005, as amended (the "Order") and/or (ii) who are high net worth companies (or persons to whom it may otherwise be lawfully communicated) falling within Article 49(2)(a) to (e) of the Order (all such persons together being referred to as "relevant persons"). This document must not be acted on or relied on in the United Kingdom by persons who are not relevant persons. In the
208
United Kingdom, any investment or investment activity to which this document relates is only available to, and will be engaged in with, relevant persons.
Notice to Prospective Investors in Switzerland
The ordinary shares may not be publicly offered in Switzerland and will not be listed on the SIX Swiss Exchange, or the SIX, or on any other stock exchange or regulated trading facility in Switzerland. This document has been prepared without regard to the disclosure standards for issuance prospectuses under art. 652a or art. 1156 of the Swiss Code of Obligations or the disclosure standards for listing prospectuses under art. 27 ff. of the SIX Listing Rules or the listing rules of any other stock exchange or regulated trading facility in Switzerland. Neither this document nor any other offering or marketing material relating to the ordinary shares or this offering may be publicly distributed or otherwise made publicly available in Switzerland.
Neither this document nor any other offering or marketing material relating to this offering, the Company, the ordinary shares have been or will be filed with or approved by any Swiss regulatory authority. In particular, this document will not be filed with, and the offer of ordinary shares will not be supervised by, the Swiss Financial Market Supervisory Authority, or FINMA, and the offer of ordinary shares has not been and will not be authorized under the Swiss Federal Act on Collective Investment Schemes, or the CISA. The investor protection afforded to acquirers of interests in collective investment schemes under the CISA does not extend to acquirers of ordinary shares.
Notice to Prospective Investors in the Dubai International Financial Centre
This prospectus relates to an Exempt Offer in accordance with the Offered Securities Rules of the Dubai Financial Services Authority, or the DFSA. This prospectus is intended for distribution only to persons of a type specified in the Offered Securities Rules of the DFSA. It must not be delivered to, or relied on by, any other person. The DFSA has no responsibility for reviewing or verifying any documents in connection with Exempt Offers. The DFSA has not approved this prospectus nor taken steps to verify the information set forth herein and has no responsibility for the prospectus. The ordinary shares to which this prospectus relates may be illiquid and/or subject to restrictions on their resale. Prospective purchasers of the ordinary shares offered should conduct their own due diligence on the ordinary shares. If you do not understand the contents of this prospectus you should consult an authorized financial advisor.
Notice to Prospective Investors in Australia
No placement document, prospectus, product disclosure statement or other disclosure document has been lodged with the Australian Securities and Investments Commission, or the ASIC, in relation to this offering. This prospectus does not constitute a prospectus, product disclosure statement or other disclosure document under the Corporations Act 2001, or the Corporations Act, and does not purport to include the information required for a prospectus, product disclosure statement or other disclosure document under the Corporations Act.
Any offer in Australia of the ordinary shares may only be made to persons (the "Exempt Investors") who are "sophisticated investors" (within the meaning of section 708(8) of the Corporations Act), "professional investors" (within the meaning of section 708(11) of the Corporations Act) or otherwise pursuant to one or more exemptions contained in section 708 of the Corporations Act so that it is lawful to offer the ordinary shares without disclosure to investors under Chapter 6D of the Corporations Act.
The ordinary shares applied for by Exempt Investors in Australia must not be offered for sale in Australia in the period of 12 months after the date of allotment under this offering, except in circumstances where disclosure to investors under Chapter 6D of the Corporations Act would not be
209
required pursuant to an exemption under section 708 of the Corporations Act or otherwise or where the offer is pursuant to a disclosure document which complies with Chapter 6D of the Corporations Act. Any person acquiring ordinary shares must observe such Australian on-sale restrictions.
This prospectus contains general information only and does not take account of the investment objectives, financial situation or particular needs of any particular person. It does not contain any securities recommendations or financial product advice. Before making an investment decision, investors need to consider whether the information in this prospectus is appropriate to their needs, objectives and circumstances, and, if necessary, seek expert advice on those matters.
Notice to Prospective Investors in Hong Kong
The ordinary shares have not been offered or sold and will not be offered or sold in Hong Kong, by means of any document, other than (a) to "professional investors" as defined in the Securities and Futures Ordinance (Cap. 571) of Hong Kong and any rules made under that Ordinance; or (b) in other circumstances which do not result in the document being a "prospectus" as defined in the Companies Ordinance (Cap. 32) of Hong Kong or which do not constitute an offer to the public within the meaning of that Ordinance. No advertisement, invitation or document relating to the ordinary shares has been or may be issued or has been or may be in the possession of any person for the purposes of issue, whether in Hong Kong or elsewhere, which is directed at, or the contents of which are likely to be accessed or read by, the public of Hong Kong (except if permitted to do so under the securities laws of Hong Kong) other than with respect to ordinary shares which are or are intended to be disposed of only to persons outside Hong Kong or only to "professional investors" as defined in the Securities and Futures Ordinance and any rules made under that Ordinance.
Notice to Prospective Investors in Japan
The ordinary shares have not been and will not be registered under the Financial Instruments and Exchange Law of Japan (Law No. 25 of 1948, as amended) and, accordingly, will not be offered or sold, directly or indirectly, in Japan, or for the benefit of any Japanese Person or to others for re-offering or resale, directly or indirectly, in Japan or to any Japanese Person, except in compliance with all applicable laws, regulations and ministerial guidelines promulgated by relevant Japanese governmental or regulatory authorities in effect at the relevant time. For the purposes of this paragraph, "Japanese Person" shall mean any person resident in Japan, including any corporation or other entity organized under the laws of Japan.
Notice to Prospective Investors in Singapore
This prospectus has not been registered as a prospectus with the Monetary Authority of Singapore. Accordingly, this prospectus and any other document or material in connection with the offer or sale, or invitation for subscription or purchase, of ordinary shares may not be circulated or distributed, nor may the ordinary shares be offered or sold, or be made the subject of an invitation for subscription or purchase, whether directly or indirectly, to persons in Singapore other than (i) to an institutional investor under Section 274 of the Securities and Futures Act, Chapter 289 of Singapore, or the SFA, (ii) to a relevant person pursuant to Section 275(1), or any person pursuant to Section 275(1A), and in accordance with the conditions specified in Section 275, of the SFA, or (iii) otherwise pursuant to, and in accordance with the conditions of, any other applicable provision of the SFA.
Where the ordinary shares are subscribed or purchased under Section 275 of the SFA by a relevant person which is:
- (a)
- a corporation (which is not an accredited investor (as defined in Section 4A of the SFA)) the sole business of which is to hold investments and the entire share capital of which is owned by one or more individuals, each of whom is an accredited investor; or
210
- (b)
- a trust (where the trustee is not an accredited investor) whose sole purpose is to hold investments and each beneficiary of the trust is an individual who is an accredited investor,
securities (as defined in Section 239(1) of the SFA) of that corporation or the beneficiaries' rights and interest (howsoever described) in that trust shall not be transferred within six months after that corporation or that trust has acquired the ordinary shares pursuant to an offer made under Section 275 of the SFA except:
- (a)
- to
an institutional investor or to a relevant person defined in Section 275(2) of the SFA, or to any person arising from an offer referred to in
Section 275(1A) or Section 276(4)(i)(B) of the SFA;
- (b)
- where
no consideration is or will be given for the transfer;
- (c)
- where
the transfer is by operation of law;
- (d)
- as
specified in Section 276(7) of the SFA; or
- (e)
- as specified in Regulation 32 of the Securities and Futures (Offers of Investments) (Shares and Debentures) Regulations 2005 of Singapore.
211
The validity of the issuance of our ordinary shares offered hereby will be passed upon for us by Bingham McCutchen (London) LLP, our English counsel, and certain other matters will be passed upon for us by Bingham McCutchen LLP, New York, New York. Certain legal matters with respect to this offering will be passed upon for the underwriters by Fried, Frank, Harris, Shriver & Jacobson LLP, New York, New York.
INDEPENDENT REGISTERED PUBLIC ACCOUNTING FIRM
KPMG LLP, independent registered public accounting firm, has audited our Consolidated Financial Statements at December 31, 2012 and December 31, 2013, and for each of the years ended December 31, 2011, 2012 and 2013, as set forth in their report. We have included our financial statements in this prospectus and elsewhere in the registration statement in reliance on KPMG LLP's report, given on its authority as experts in accounting and auditing.
212
WHERE YOU CAN FIND MORE INFORMATION
We have filed with the SEC a registration statement on Form S-1 under the Securities Act with respect to our ordinary shares. This prospectus does not contain all of the information set forth in the registration statement and the exhibits and schedules to the registration statement. For further information with respect to us and our ordinary shares, we refer you to the registration statement and the exhibits and schedules filed as a part of the registration statement. Each statement in this prospectus relating to a contract or document filed as an exhibit is qualified in all respects by the filed exhibit.
You may read and copy any document we have filed or may file in the future at the SEC's public reference facility in Room 1580, 100 F Street, N.E., Washington, D.C. 20549. Please call the SEC at 1-800-SEC-0330 for further information on the public reference room. The SEC maintains a website that contains reports, proxy and information statements and other information regarding registrants that file electronically with the SEC at http://www.sec.gov.
Upon completion of this offering, we will be subject to the information and periodic reporting requirements of the Exchange Act and, accordingly, file periodic reports and other information, including proxy statements, with the SEC.
213
F-1
WHEN THE TRANSACTIONS REFERRED TO IN NOTE 1 OF THE NOTES TO THE CONSOLIDATED FINANCIAL STATEMENTS HAVE BEEN CONSUMMATED, WE WILL BE IN A POSITION TO RENDER THE FOLLOWING REPORT.
/s/ KPMG LLP
REPORT OF INDEPENDENT REGISTERED PUBLIC ACCOUNTING FIRM
The
Board of Directors
Old Mutual (U.S.) Holdings Inc.:
We have audited the accompanying consolidated balance sheets of Old Mutual (U.S.) Holdings Inc. and subsidiaries (the "Company") (d/b/a Old Mutual Asset Management) as of December 31, 2013 and 2012, and the related consolidated statements of operations, comprehensive income, changes in stockholders' equity, and cash flows for each of the years in the three-year period ended December 31, 2013. These consolidated financial statements are the responsibility of the Company's management. Our responsibility is to express an opinion on these consolidated financial statements based on our audits.
We conducted our audits in accordance with the standards of the Public Company Accounting Oversight Board (United States). Those standards require that we plan and perform the audit to obtain reasonable assurance about whether the consolidated financial statements are free of material misstatement. An audit includes examining, on a test basis, evidence supporting the amounts and disclosures in the consolidated financial statements. An audit also includes assessing the accounting principles used and significant estimates made by management, as well as evaluating the overall financial statement presentation. We believe that our audits provide a reasonable basis for our opinion.
In our opinion, the consolidated financial statements referred to above present fairly, in all material respects, the financial position of Old Mutual (U.S.) Holdings Inc. and subsidiaries as of December 31, 2013 and 2012, and the results of their operations and their cash flows for each of the years in the three-year period ended December 31, 2013, in conformity with U.S. generally accepted accounting principles.
Boston,
Massachusetts
June 30, 2014
F-2
Old Mutual Asset Management
Consolidated Balance Sheets
(in millions)
| |
December 31, | ||||||
|---|---|---|---|---|---|---|---|
| |
2013 | 2012 | |||||
Assets |
|||||||
Cash and cash equivalents |
$ | 194.2 | $ | 197.0 | |||
Investment advisory fees receivable |
154.9 | 136.4 | |||||
Property and equipment, net |
24.1 | 19.1 | |||||
Investments (includes balances reported at fair value of $95.2 and $86.8) |
148.1 | 138.2 | |||||
Acquired intangibles, net |
1.2 | 1.4 | |||||
Goodwill |
117.8 | 117.8 | |||||
Other assets |
24.8 | 24.1 | |||||
Note receivable due from related party |
32.2 | 32.2 | |||||
Deferred tax assets |
294.2 | 302.2 | |||||
Assets of consolidated Funds: |
|||||||
Cash and cash equivalents |
88.0 | 71.6 | |||||
Restricted cash |
2,557.0 | 2,509.0 | |||||
Investments, at fair value |
406.2 | 104.4 | |||||
Timber assets |
4,422.1 | 4,806.4 | |||||
Other assets |
87.0 | 70.0 | |||||
| | | | | | | | |
Total assets |
$ | 8,551.8 | $ | 8,529.8 | |||
| | | | | | | | |
| | | | | | | | |
Liabilities and stockholders' equity |
|||||||
Accounts payable and accrued expenses |
$ | 43.9 | $ | 30.8 | |||
Accrued incentive compensation |
128.7 | 109.5 | |||||
Interest payable to related parties |
14.6 | 14.9 | |||||
Other amounts due to related parties |
1.0 | 0.4 | |||||
Long-term compensation liabilities |
216.6 | 156.2 | |||||
Accrued income taxes |
6.7 | 10.0 | |||||
Notes payable to related parties |
1,040.7 | 1,131.5 | |||||
Third party borrowings |
2.5 | 16.0 | |||||
Other liabilities |
6.4 | 11.1 | |||||
Liabilities of consolidated Funds: |
|||||||
Accounts payable and accrued expenses |
33.5 | 23.7 | |||||
Long term debt |
3,783.1 | 3,831.7 | |||||
Related party debt |
604.7 | 662.6 | |||||
Securities sold, not yet purchased, at fair value |
24.6 | 26.0 | |||||
Other liabilities |
108.9 | 73.4 | |||||
| | | | | | | | |
Total liabilities |
6,015.9 | 6,097.8 | |||||
| | | | | | | | |
Commitments and contingencies |
|||||||
Redeemable non-controlling interests in consolidated Funds |
403.3 |
88.9 |
|||||
Equity: |
|||||||
Parent equity deficit |
(449.8 | ) | (483.8 | ) | |||
Other comprehensive income |
3.0 | 1.6 | |||||
Non-controlling interests |
0.1 | 0.9 | |||||
Non-controlling interests in consolidated Funds |
2,579.3 | 2,824.4 | |||||
| | | | | | | | |
Total equity and redeemable non-controlling interest in consolidated Funds |
2,535.9 | 2,432.0 | |||||
| | | | | | | | |
Total liabilities and equity |
$ | 8,551.8 | $ | 8,529.8 | |||
| | | | | | | | |
| | | | | | | | |
See Notes to Consolidated Financial Statements
F-3
Old Mutual Asset Management
Consolidated Statements of Operations
(in millions except for per share data)
| |
For the years ended December 31, |
|||||||||
|---|---|---|---|---|---|---|---|---|---|---|
| |
2013 | 2012 | 2011 | |||||||
Revenue: |
||||||||||
Management fees |
$ | 478.2 | $ | 399.3 | 398.2 | |||||
Performance fees |
18.1 | 14.1 | 4.3 | |||||||
Other revenue |
1.8 | 0.5 | 0.3 | |||||||
Consolidated Funds' revenue: |
||||||||||
Revenue from timber |
401.1 | 257.1 | 287.7 | |||||||
Other revenue |
29.4 | 32.5 | 33.7 | |||||||
| | | | | | | | | | | |
Total revenue |
928.6 | 703.5 | 724.2 | |||||||
Operating expenses: |
||||||||||
Compensation and benefits |
352.3 | 267.2 | 251.8 | |||||||
General and administrative expense |
68.7 | 68.6 | 76.8 | |||||||
Amortization of acquired intangibles |
0.1 | 0.1 | 0.9 | |||||||
Impairment of goodwill and acquired intangibles |
— | 1.7 | 7.7 | |||||||
Depreciation and amortization |
4.9 | 5.8 | 6.9 | |||||||
Consolidated Funds' expense: |
||||||||||
Interest and dividend expense |
150.1 | 121.1 | 120.0 | |||||||
Timber expense |
238.4 | 164.6 | 172.2 | |||||||
Other expense |
213.6 | 136.9 | 166.8 | |||||||
| | | | | | | | | | | |
Total operating expenses |
1,028.1 | 766.0 | 803.1 | |||||||
| | | | | | | | | | | |
Operating loss |
(99.5 | ) | (62.5 | ) | (78.9 | ) | ||||
| | | | | | | | | | | |
Non-operating income and (expense): |
||||||||||
Investment income |
10.7 | 16.5 | 13.8 | |||||||
Interest income |
0.5 | 1.4 | 0.5 | |||||||
Interest expense |
(72.2 | ) | (84.1 | ) | (74.2 | ) | ||||
Net consolidated Funds gains |
76.7 | 82.0 | 65.9 | |||||||
| | | | | | | | | | | |
Total non-operating income |
15.7 | 15.8 | 6.0 | |||||||
| | | | | | | | | | | |
Loss from continuing operations before taxes |
(83.8 | ) | (46.7 | ) | (72.9 | ) | ||||
Income tax expense (benefit) |
13.3 | 3.3 | (4.2 | ) | ||||||
| | | | | | | | | | | |
Loss from continuing operations |
(97.1 | ) | (50.0 | ) | (68.7 | ) | ||||
Gain (loss) from discontinued operations, net of tax expense (benefit) of $5.2, $(3.7) and $(6.3) |
2.7 | (27.0 | ) | (45.4 | ) | |||||
Gain (loss) on disposal from discontinued operations, net of tax expense (benefit) of $(2.3), $7.7 and $(19.3) |
(2.1 | ) | 10.8 | 22.9 | ||||||
| | | | | | | | | | | |
Net loss |
(96.5 | ) | (66.2 | ) | (91.2 | ) | ||||
Net income from continuing operations attributable to non-controlling interests |
0.1 | — | — | |||||||
Net loss from continuing operations attributable to non-controlling interests in consolidated Funds |
(122.3 | ) | (69.2 | ) | (101.5 | ) | ||||
| | | | | | | | | | | |
Net income attributable to controlling interest |
$ | 25.7 | $ | 3.0 | $ | 10.3 | ||||
| | | | | | | | | | | |
| | | | | | | | | | | |
Pro forma earnings (loss) per share (basic) attributable to controlling interests |
||||||||||
Pro forma earnings (loss) per share (diluted) attributable to controlling interests |
||||||||||
Pro forma continuing operations earnings (loss) per share (basic) attributable to controlling interests |
||||||||||
Pro forma continuing operations earnings (loss) per share (diluted) attributable to controlling interests |
||||||||||
Pro forma weighted average ordinary shares outstanding |
||||||||||
Pro forma weighted average diluted ordinary shares outstanding |
||||||||||
See Notes to Consolidated Financial Statements
F-4
Old Mutual Asset Management
Consolidated Statements of Comprehensive Income
(in millions)
| |
For the years ended December 31, |
|||||||||
|---|---|---|---|---|---|---|---|---|---|---|
| |
2013 | 2012 | 2011 | |||||||
Net loss |
$ | (96.5 | ) | $ | (66.2 | ) | $ | (91.2 | ) | |
Foreign currency translation adjustment |
(19.1 | ) | 1.2 | 1.7 | ||||||
| | | | | | | | | | | |
Total other comprehensive loss |
(115.6 | ) | (65.0 | ) | (89.5 | ) | ||||
Comprehensive income attributable to non-controlling interests, net of tax |
0.1 | — | — | |||||||
Comprehensive loss attributable to non-controlling interests in consolidated Funds, net of tax |
(142.7 | ) | (69.6 | ) | (101.5 | ) | ||||
| | | | | | | | | | | |
Total comprehensive income attributable to controlling interests |
27.0 | 4.6 | 12.0 | |||||||
| | | | | | | | | | | |
| | | | | | | | | | | |
See Notes to Consolidated Financial Statements
F-5
Consolidated Statements of Changes in Stockholders' Equity
(in millions)
| |
Parent equity deficit |
Accumulated other comprehensive income (loss) |
Total parent equity deficit |
Non-controlling interests |
Non-controlling interests in consolidated Funds |
Total equity |
Redeemable non-controlling interest in consolidated Funds |
Total equity and redeemable non-controlling interest in consolidated Funds |
|||||||||||||||||
|---|---|---|---|---|---|---|---|---|---|---|---|---|---|---|---|---|---|---|---|---|---|---|---|---|---|
January 1, 2011 |
$ | (652.4 | ) | $ | (1.7 | ) | $ | (654.1 | ) | $ | 43.1 | $ | 3,041.7 | $ | 2,430.7 | $ | 98.3 | $ | 2,529.0 | ||||||
Capital contributions |
108.1 | — | 108.1 | — | 215.6 | 323.7 | 15.7 | 339.4 | |||||||||||||||||
Equity-based compensation |
38.3 | — | 38.3 | (38.0 | ) | — | 0.3 | — | 0.3 | ||||||||||||||||
Foreign currency translation adjustment |
— | 1.7 | 1.7 | — | — | 1.7 | — | 1.7 | |||||||||||||||||
Parent company corporate cost allocation |
3.2 | — | 3.2 | — | — | 3.2 | — | 3.2 | |||||||||||||||||
Redemptions |
— | — | — | — | — | — | (4.7 | ) | (4.7 | ) | |||||||||||||||
Distributions |
— | — | — | (0.6 | ) | (101.1 | ) | (101.7 | ) | — | (101.7 | ) | |||||||||||||
Net income (loss) |
10.3 | — | 10.3 | — | (101.0 | ) | (90.7 | ) | (0.5 | ) | (91.2 | ) | |||||||||||||
| | | | | | | | | | | | | | | | | | | | | | | | | | |
December 31, 2011 |
(492.5 | ) | — | (492.5 | ) | 4.5 | 3,055.2 | 2,567.2 | 108.8 | 2,676.0 | |||||||||||||||
| | | | | | | | | | | | | | | | | | | | | | | | | | |
Capital contributions (redemptions) |
— | — | — | — | 613.0 | 613.0 | (26.5 | ) | 586.5 | ||||||||||||||||
Equity-based compensation |
2.9 | — | 2.9 | (3.6 | ) | — | (0.7 | ) | — | (0.7 | ) | ||||||||||||||
Foreign currency translation adjustment |
— | 1.6 | 1.6 | — | (0.4 | ) | 1.2 | — | 1.2 | ||||||||||||||||
Parent company corporate cost allocation |
2.8 | — | 2.8 | — | — | 2.8 | — | 2.8 | |||||||||||||||||
Redemptions |
— | — | — | — | — | — | (5.3 | ) | (5.3 | ) | |||||||||||||||
Net consolidation (deconsolidation) of funds |
— | — | — | — | (226.5 | ) | (226.5 | ) | — | (226.5 | ) | ||||||||||||||
Distributions |
— | — | — | — | (535.8 | ) | (535.8 | ) | — | (535.8 | ) | ||||||||||||||
Net income (loss) |
3.0 | — | 3.0 | — | (81.1 | ) | (78.1 | ) | 11.9 | (66.2 | ) | ||||||||||||||
| | | | | | | | | | | | | | | | | | | | | | | | | | |
December 31, 2012 |
(483.8 | ) | 1.6 | (482.2 | ) | 0.9 | 2,824.4 | 2,343.1 | 88.9 | 2,432.0 | |||||||||||||||
| | | | | | | | | | | | | | | | | | | | | | | | | | |
Capital contributions (redemptions) |
— | — | — | — | (0.4 | ) | (0.4 | ) | 268.1 | 267.7 | |||||||||||||||
Equity-based compensation |
5.0 | — | 5.0 | (0.9 | ) | — | 4.1 | — | 4.1 | ||||||||||||||||
Foreign currency translation adjustment |
— | 1.4 | 1.4 | — | (20.5 | ) | (19.1 | ) | — | (19.1 | ) | ||||||||||||||
Parent company corporate cost allocation |
3.3 | — | 3.3 | — | — | 3.3 | — | 3.3 | |||||||||||||||||
Redemptions |
— | — | — | — | — | — | — | — | |||||||||||||||||
Net consolidation (deconsolidation) of funds |
— | — | — | — | — | — | 109.0 | 109.0 | |||||||||||||||||
Distributions |
— | — | — | — | (99.3 | ) | (99.3 | ) | (65.3 | ) | (164.6 | ) | |||||||||||||
Net income (loss) |
25.7 | — | 25.7 | 0.1 | (124.9 | ) | (99.1 | ) | 2.6 | (96.5 | ) | ||||||||||||||
| | | | | | | | | | | | | | | | | | | | | | | | | | |
December 31, 2013 |
$ | (449.8 | ) | $ | 3.0 | $ | (446.8 | ) | $ | 0.1 | $ | 2,579.3 | $ | 2,132.6 | $ | 403.3 | $ | 2,535.9 | |||||||
| | | | | | | | | | | | | | | | | | | | | | | | | | |
| | | | | | | | | | | | | | | | | | | | | | | | | | |
See Notes to Consolidated Financial Statements
F-6
Old Mutual Asset Management
Consolidated Statements of Cash Flows
(in millions)
| |
For the years ended December 31, |
|||||||||
|---|---|---|---|---|---|---|---|---|---|---|
| |
2013 | 2012 | 2011 | |||||||
Cash flow from operating activities: |
||||||||||
Net loss |
$ | (96.5 | ) | $ | (66.2 | ) | $ | (91.2 | ) | |
Less: Net loss attributable to non-controlling interests in consolidated Funds |
122.3 | 69.2 | 101.5 | |||||||
Adjustments to reconcile net income (loss) to net cash provided by (used in) operating activities from continuing operations: |
||||||||||
Net income (loss) from discontinued operations, excluding consolidated Funds |
(6.3 | ) | 21.0 | 15.9 | ||||||
Amortization of acquired intangibles |
0.1 | 1.8 | 8.6 | |||||||
Depreciation and other amortization |
4.9 | 5.7 | 6.9 | |||||||
Amortization and revaluation of non-cash compensation awards |
61.6 | 27.2 | 20.9 | |||||||
Parent company corporate cost allocation |
3.3 | 2.8 | 3.2 | |||||||
Net earnings from affiliates accounted for using the equity method |
(7.7 | ) | (14.8 | ) | (10.2 | ) | ||||
Distributions received from equity method affiliates |
15.3 | 10.1 | 9.5 | |||||||
Deferred income taxes |
10.3 | 9.1 | (30.5 | ) | ||||||
(Gains) losses on other investments |
(3.0 | ) | (1.8 | ) | (3.6 | ) | ||||
Changes in operating assets and liabilities (excluding discontinued operations): |
||||||||||
(Increase) decrease in investment advisory fees receivable |
(22.9 | ) | (27.6 | ) | 14.5 | |||||
(Increase) decrease in other receivables, prepayments, deposits and other assets |
(3.6 | ) | 0.8 | 1.3 | ||||||
Increase (decrease) in accrued incentive compensation and other long term liabilities |
25.8 | 6.1 | (12.5 | ) | ||||||
Increase (decrease) in accounts payable and accruals and accrued income taxes |
9.7 | 4.8 | (0.8 | ) | ||||||
| | | | | | | | | | | |
Net cash flows from operating activities of continuing operations, excluding consolidated Funds |
113.3 | 48.2 | 33.5 | |||||||
Net loss attributable to non-controlling interests in consolidated Funds |
(122.3 |
) |
(69.2 |
) |
(101.5 |
) |
||||
Net income (loss) from discontinued operations |
— | (4.9 | ) | 6.6 | ||||||
(Gains) losses on other investments |
115.2 | 50.2 | 107.4 | |||||||
(Increase) decrease in receivables other assets |
(52.3 | ) | 1.3 | 24.7 | ||||||
Increase (decrease) in accounts payable and other liabilities |
76.9 | 13.2 | (4.2 | ) | ||||||
| | | | | | | | | | | |
Net cash flows from operating activities of continuing operations of consolidated Funds |
17.5 | (9.4 | ) | 33.0 | ||||||
| | | | | | | | | | | |
Net cash flows from operating activities of continuing operations |
130.8 | 38.8 | 66.5 | |||||||
| | | | | | | | | | | |
Net cash flows from operating activities of discontinued operations |
13.7 | (32.4 | ) | 34.3 | ||||||
| | | | | | | | | | | |
Total net cash flows from operating activities |
144.5 | 6.4 | 100.8 | |||||||
| | | | | | | | | | | |
Cash flow from investing activities: |
||||||||||
Purchase of fixed assets, excluding discontinued operations |
(9.9 | ) | (12.7 | ) | (3.6 | ) | ||||
Proceeds from note receivable from related party |
— | — | 3.6 | |||||||
Purchase of investment securities |
(15.2 | ) | (66.9 | ) | (15.5 | ) | ||||
Sale of investment securities |
15.1 | 55.6 | 14.0 | |||||||
Cash flows from investing activites of consolidated Funds: |
||||||||||
Purchase of investments |
(191.7 | ) | (934.1 | ) | (230.8 | ) | ||||
Redemption of investments |
333.3 | 364.9 | 213.3 | |||||||
Change in restricted cash |
(48.0 | ) | 75.2 | (148.8 | ) | |||||
Deconsolidation of funds |
(0.4 | ) | (58.8 | ) | — | |||||
| | | | | | | | | | | |
Net cash flows from investing activities of continuing operations |
83.2 | (576.8 | ) | (167.8 | ) | |||||
Net cash flows from investing activities of discontinued operations |
(181.0 | ) | 30.5 | (3.1 | ) | |||||
| | | | | | | | | | | |
Total net cash flows from investing activities |
(97.8 | ) | (546.3 | ) | (170.9 | ) | ||||
| | | | | | | | | | | |
Cash flow from financing activities: |
||||||||||
Repayment of related party borrowings |
(90.8 | ) | (80.3 | ) | (112.0 | ) | ||||
Proceeds from related party borrowings |
— | 30.0 | 15.0 | |||||||
Repayment of third party borrowings |
(13.5 | ) | (0.5 | ) | — | |||||
Capital contribution from parent company |
— | — | 78.0 | |||||||
Dividends paid to non-controlling interests |
— | — | (0.6 | ) | ||||||
Cash flows from financing activities of consolidated Funds: |
||||||||||
Proceeds from debt raised |
— | 137.3 | (1.7 | ) | ||||||
Repayment of debt |
(30.3 | ) | (72.1 | ) | (8.4 | ) | ||||
Non-controlling interest capital raised |
29.0 | 587.0 | 192.1 | |||||||
Non-controlling interest capital redeemed |
(91.2 | ) | (77.9 | ) | (57.7 | ) | ||||
Redeemable non-controlling interest capital raised |
— | — | 19.4 | |||||||
Redeemable non-controlling interest capital redeemed |
(8.8 | ) | (16.1 | ) | (4.5 | ) | ||||
| | | | | | | | | | | |
Net cash flows from financing activities of continuing operations |
(205.6 | ) | 507.4 | 119.6 | ||||||
Net cash flows from financing activities of discontinued operations |
174.1 | 22.9 | (13.7 | ) | ||||||
| | | | | | | | | | | |
Total net cash flows from financing activities |
(31.5 | ) | 530.3 | 105.9 | ||||||
| | | | | | | | | | | |
Effect of foreign exchange rate changes on cash and cash equivalents |
(1.6 |
) |
1.0 |
0.4 |
||||||
Net increase (decrease) in cash and cash equivalents |
13.6 | (8.6 | ) | 36.2 | ||||||
Cash and cash equivalents at beginning of year |
268.6 | 277.2 | 241.0 | |||||||
| | | | | | | | | | | |
Cash and cash equivalents at end of year |
$ | 282.2 | $ | 268.6 | $ | 277.2 | ||||
| | | | | | | | | | | |
| | | | | | | | | | | |
Supplemental disclosure of cash flow information: |
||||||||||
Interest paid (excluding consolidated Funds) |
$ | 72.5 | $ | 83.9 | $ | 74.4 | ||||
Income taxes paid |
$ | 5.5 | $ | 0.8 | $ | 4.7 | ||||
Non-cash capital contribution from parent |
$ | — | $ | — | $ | 30.1 | ||||
F-7
Old Mutual Asset Management
Notes to Consolidated Financial Statements
1) Organization and Description of the Business
Old Mutual Asset Management ("OMAM" or the "Company") is a global asset management business with interests in a diverse group of boutique investment management firms (the "Affiliates") individually headquartered in the United States. The Company provides investment management services globally to predominantly institutional investors, in asset classes that include U.S. and global equities, fixed income, real estate and timber. Fees for services are largely asset-based and, as a result, the Company's revenue fluctuates based on the performance of financial markets and investors' asset flows in and out of the Company's products.
The Company's Affiliates are organized limited liability companies. The Company generally utilizes a profits interest model in structuring its compensation and ownership arrangements with Affiliates. The Affiliates' variable compensation is generally based on each firm's profitability. OMAM and Affiliates' key employees' share in profits after variable compensation according to their respective equity or profit interests. The profits interest model results in alignment of OMAM and the Affiliates' key employees' economic interests, which is critical to the Company's talent management strategy and long-term growth of the business. The Company operates in one reportable segment.
Reorganization
The Company's US Holding entity Old Mutual (US) Holdings, Inc ("OMUSH") is a direct subsidiary of OM Group (UK) Limited ("OMGUK") which is in turn wholly owned by Old Mutual plc (UK) ("the Parent"). The board of directors of the Parent elected to undertake an initial public offering of the Company's business.
The Company and the Parent determined that certain transactions should be undertaken in preparation for the offering. Specifically, the Company and the Parent undertook the pre-offering restructuring steps described below ("the Reorganization"):
- 1.
- OMGUK
has incorporated OMAM in the United Kingdom as a direct, wholly-owned subsidiary of OMGUK.
- 2.
- OMAM
has incorporated OMAM US, Inc. in the State of Delaware ("U.S. Sub") as a direct, wholly-owned subsidiary of OMAM.
- 3.
- US
Sub has incorporated OMAM UK Limited in the United Kingdom ("U.K. Sub") as a direct, wholly-owned subsidiary of US Sub.
- 4.
- The
Company's existing intercompany debt, which was owed by OMUSH to OMGUK, was refinanced with new intercompany debt.
- 5.
- OMGUK
contributed its shares in OMUSH and the new intercompany debt to OMAM in return for an issuance of shares by OMAM resulting in the elimination of this
debt in our pro forma consolidated balance sheet, as it constituted an arrangement between two of the Company's subsidiaries.
- 6.
- The
OMUSH shares have been transferred to UK Sub via a series of share exchanges, and the new intercompany debt has been contributed among OMAM, US Sub and
UK Sub.
- 7.
- OMAM underwent a reduction of share capital to maximize distributable reserves, has re-registered in the United Kingdom as a public limited company, amended its articles of association to reflect the same and organized its share capital for purposes of this offering.
F-8
Old Mutual Asset Management
Notes to Consolidated Financial Statements (Continued)
1) Organization and Description of the Business (Continued)
- 8.
- OMAM issued third-party debt amounting to $175.0 million and paid a $175.0 million pre-offering dividend to OMGUK. OMAM also accrued a payable to OMGUK of $10 million which will be paid as funds become available from Affiliate distributions, subject to the maintenance of a minimum level of OMUSH cash holdings.
2) Significant Accounting Policies
The Company's significant accounting policies are as follows:
Basis of presentation
These Consolidated Financial Statements reflect the historical balance sheets; statements of operations and of comprehensive income; statements of changes in stockholders' equity; and statements of cash flows of the Company. The Company is anticipating an offering by its Parent of the Company's ordinary stock pursuant to the Securities Act of 1933. Within these financial statements, entities that are part of the Parent's consolidated results, but are not part of OMAM, as defined above, are referred to as "related parties." These historical Consolidated Financial Statements have been prepared using the Parent's historical basis in determining the assets and liabilities and the results of the Company. The financial information included herein may not reflect the consolidated financial position, operating results, changes in the Parent's equity investment and cash flows of the Company in the future, and does not reflect what they would have been had the Company been a separate, stand-alone entity during the periods presented.
The Consolidated Financial Statements are prepared in accordance with accounting principles generally accepted in the United States ("U.S. GAAP"). All dollar amounts, except per share data in the text and tables herein, are stated in millions unless otherwise indicated. Transactions between the Company and the Parent are included in the Consolidated Financial Statements, however material intercompany balances and transactions among the Company, its consolidated Affiliates and consolidated Funds are eliminated in consolidation.
Allocated Costs from the Parent
The Company's Parent provides the Company with various services, including governance through the board of directors and executive committees, investor relations, procurement of insurance coverage, human resources, financial reporting, internal audit, treasury, systems, risk, working capital and tax services. Some of these services are directly attributable to the Company and some a more of a general nature. The costs associated with the services which are (i) directly attributable to the Company, (ii) have been charged directly to the Company by the Company's Parent, and (iii) have been paid to the Company's Parent by the Company have been reflected in the Company's Consolidated Financial Statements. During the years ended December 31, 2013, 2012 and 2011, the amount of expenses charged directly to the Company from the Company's Parent were $2.0 million, $2.7 million and $2.7 million, respectively.
With respect to the above services and benefits which are not directly attributable to the Company, costs are allocated to the Company and included in the Consolidated Financial Statements, based generally on the Company's proportion of the total Parent's consolidated, normalized revenues. During the years ended December 31, 2013, 2012 and 2011, costs allocated to the Company from Parent were $3.3 million, $2.8 million and $3.2 million, respectively.
F-9
Old Mutual Asset Management
Notes to Consolidated Financial Statements (Continued)
2) Significant Accounting Policies (Continued)
These cost allocations have been determined using a method that Parent and the Company considered reasonably reflect the costs of such services attributable to the Company provided by Parent. The Company believes the assumptions and allocations underlying the Consolidated Financial Statements are reasonable and the allocated amounts are representative of the amounts that would have been recorded in the Consolidated Financial Statements had the Company operated independent of Parent for the historical periods presented. A more detailed discussion of the relationship with Parent, including a description of the costs that have been allocated to the Company, as well as the allocation methods, is included in Note 10, "Related Party Transactions", to the Consolidated Financial Statements.
Consolidation
Affiliates
The Company evaluates each of its Affiliate and other operating entities to determine the appropriate method of accounting. Generally, majority-owned entities or otherwise controlled investments in which the Company holds a controlling financial interest as the principal shareholder, managing member, or general partner are consolidated.
Funds
In evaluating whether or not a legal entity must be consolidated, the Company determines if such entity is a variable interest entity ("VIE") or a voting interest entity ("VOE"). A VOE is considered an entity in which (i) the total equity investment at risk is sufficient to enable the entity to finance its activities independently and (ii) the equity holders at risk have the obligation to absorb losses, the right to receive residual returns, and the right to direct the activities of the entity that most significantly impact the entity's economic performance. A VIE is an entity that lacks one or more of the characteristics of a VOE. Assessing whether an entity is a VIE or VOE involves judgment and analysis. Factors considered in this assessment include the entity's legal organization, the entity's capital structure and equity ownership and any related party or de facto agent implications of the Company's involvement with the entity. Investments that are determined to be VIEs are consolidated if the Company or a consolidated Affiliate is the primary beneficiary of the investment. VOEs are typically consolidated if the Company holds the majority voting interest or otherwise controls the entity.
In the normal course of business, the Company's Affiliates sponsor and manage certain investment vehicles (the "Funds"). The Company assesses consolidation requirements with respect to its Funds pursuant to Accounting Standards Codification ("ASC") Topic 810 relating to the consolidation of VIEs. Substantially all of the Funds that are managed by the Company qualify for the deferral granted under Accounting Standards Updates ("ASU") 2010-10, "Amendments for Certain Investment Funds" ("ASU 2010-10"). As such, the Company evaluates these Funds for consolidation pursuant to guidance formerly in Financial Accounting Standards Board ("FASB") Interpretation No. 46(R), Consolidation of Variable Interest Entities. These Funds are typically owned entirely by third-party investors, however certain Funds are capitalized with seed capital investments from the Company or its related parties and may be owned partially by Affiliate key employees and/or individuals that own minority interests in an Affiliate.
In evaluating whether the Company is the primary beneficiary, the Company evaluates its economic interests in the entity held either directly by the Company or indirectly through related parties. For VIEs that are investment companies subject to ASU 2010-10, the primary beneficiary of
F-10
Old Mutual Asset Management
Notes to Consolidated Financial Statements (Continued)
2) Significant Accounting Policies (Continued)
the VIE is generally the variable interest holder that absorbs a majority of the expected losses of the VIE, receives a majority of the expected residual returns of the VIE, or both. The Company generally is not the primary beneficiary of Fund VIEs created to manage assets for clients unless the Company's ownership interest, including interests of related parties, is substantial.
For VIEs that do not fall within the scope of ASU 2010-10, the primary beneficiary of a VIE is defined as the variable interest holder that has a controlling financial interest. A controlling financial interest is defined as (i) the power to direct the activities of the VIE that most significantly impacts its economic performance and (ii) the obligation to absorb losses of the entity or the right to receive benefits from the entity that could potentially be significant to the VIE. If no single party satisfies both criteria, but the Company and its related parties satisfy the criteria on a combined basis, then the primary beneficiary is the entity out of the related party group that is most closely associated to the VIE. The consolidation analysis can generally be performed qualitatively, however, if it is not readily apparent that the Company is not the primary beneficiary, a quantitative analysis may also be performed.
The Company consolidates VOEs when it has control over significant operating, financial and investing decisions of the entity. For VOEs organized as limited partnerships or as an entity with governance structures similar to a limited partnership (e.g., limited liability company with a managing member), the Company consolidates an entity when it holds the controlling general partnership interest and the limited partners do not hold substantive participating rights or rights to remove and replace the general partner or rights that could provide the limited partners with the ability to impact the ongoing governance and operating activities of the entity.
Other than Funds holding investments in timber assets (the "Timber Funds"), the Company's consolidated Funds are, investment companies (the "Investment Funds") and the Company has therefore retained their specialized investment company accounting in consolidation, pursuant to ASC 946, "Financial Services—Investment Companies."
Upon the occurrence of certain events (such as contributions and redemptions, either by the Company, its Affiliates, or third parties, or amendments to the governing documents of the Company's investees or sponsored Funds) management reviews and reconsiders its previous conclusion regarding the status of an entity as a VIE or a VOE. Additionally, management continually reconsiders whether the Company is deemed to be a VIE's primary beneficiary who consolidates such entity.
Timber Funds
Timber assets and timber lease rights of consolidated Timber Funds are stated at historical cost less depletion for timber previously harvested and less accumulated amortization and depreciation for lease rights and roads. Timber investment values are adjusted for capital additions made to the property subsequent to the valuation date. All initial silviculture costs, including site preparation and planting costs are capitalized as stand establishment costs. Stand establishment costs are transferred to a merchantable timber classification as trees reach a certain size. Generally, costs incurred subsequent to two years after planting, such as fertilization, vegetation, insect control and pre-commercial thinning are considered to be maintenance and are expensed as incurred.
The Company estimates its timber inventory using statistical information and data obtained from physical measurements, site maps, photo-types and other information gathering techniques. These
F-11
Old Mutual Asset Management
Notes to Consolidated Financial Statements (Continued)
2) Significant Accounting Policies (Continued)
estimates are updated annually and may result in adjustments of timber volumes, including timber growth rates and depletion rates.
Depletion consists of costs attributed to harvesting timber and is recorded as an expense as timber is harvested. The depletion rate applied to the volume of timber sold is adjusted annually and is based on the relationship of incurred costs in the merchantable timber classification to estimated current merchantable volume.
Timber and timberlands are reviewed for impairment when events or changes in circumstances indicate that the carrying value of such assets may not be recoverable. The Company compares the carrying value of a timber asset with the asset's expected future undiscounted cash flows. If the carrying value of the asset exceeds the expected future cash flows, impairment exists, which is measured by the excess of the carrying value over the fair value of the assets. The Company recognized no timber impairment losses for the years ended December 31, 2013, 2012 and 2011.
Use of estimates
The preparation of these Consolidated Financial Statements requires management to make estimates and assumptions that affect the reported amounts of assets and liabilities, the disclosure of contingent assets and liabilities at the date of the financial statements and the reported amounts of revenues and expenses during the period. Actual results could differ significantly from those estimates.
Operating segment
The Company operates in one operating segment that provides investment management services and products primarily to institutional clients. Although the Company does make certain disclosures regarding assets under management by product and affiliate, the Company's determination that it operates one business segment is based on the fact that the Chief Operating Decision Maker ("CODM") reviews the Company's financial performance on an aggregate level.
Cash and cash equivalents
The Company considers all highly liquid investments, including money market mutual funds, with original maturities of three months or less to be cash equivalents. Cash equivalents are stated at cost, which approximates market value due to the short-term maturity of these investments. Cash held by consolidated Funds is not available to fund general liquidity needs of the Company.
Restricted cash consists primarily of deposits in time deposit accounts, earning interest at LIBOR + a margin, which are restricted to payment of certain Notes payable of consolidated Funds of the Company (also see Note 13). Restricted cash of the consolidated Funds may only be drawn upon to meet debt service payments (corrective coverage payments) or to pay certain Fund operating expenses through December 31, 2014. During the period thereafter, the restricted reserve balance may only be drawn upon for principal payments.
F-12
Old Mutual Asset Management
Notes to Consolidated Financial Statements (Continued)
2) Significant Accounting Policies (Continued)
Fair value measurements
In accordance with the provisions of FASB ASC 820, "Fair Value Measurement" ("ASC 820"), fair value is the price that the Company expects to be paid upon the sale of an asset or expects to pay upon the transfer of a liability in an orderly transaction between market participants. Pursuant to ASC 820, there is a three-level hierarchy for fair value measurements based upon the transparency of inputs to the valuation of an asset or liability. Inputs may be observable or unobservable and refer broadly to the assumptions that market participants would use in pricing the asset or liability. Observable inputs reflect the assumptions market participants would use in pricing the asset or liability based on market data obtained from independent sources. Unobservable inputs reflect the Company's own conclusions about the assumptions that market participants would use in pricing the asset or liability based on the best information available in the circumstances. Each investment is assigned a level based upon the observability of the inputs which are significant to the overall valuation. Assets and liabilities measured and reported at fair value are classified and disclosed in one of the following categories:
- •
- Level I—Quoted prices are available in active markets for identical investments as of the reporting
date. The type of investments included in Level I include listed equities and listed derivatives. As required by U.S. GAAP, the Company does not adjust the quoted price for these
investments, even in situations where the Company holds a large position and the sale of such position would likely deviate from the quoted price.
- •
- Level II—Pricing inputs are other than quoted prices in active markets, which are either directly or
indirectly observable as of the reporting date, and fair value is determined through the use of models or other valuation methodologies utilizing observable market inputs other than quoted prices.
Investments which are generally included in this category include corporate bonds and loans, less liquid and restricted equity securities and certain over-the-counter derivatives.
- •
- Level III—Pricing inputs are unobservable for the asset or liability and include assets and liabilities where there is little, if any, market activity for the investment. The inputs into the determination of fair value require significant management judgment or estimation. Investments that are included in this category generally include general and limited partner interests in corporate private equity, real estate funds, and funds of hedge funds.
In certain cases, the inputs used to measure fair value may fall into different levels of the fair value hierarchy. In such cases, an investment's level within the fair value hierarchy is based on the lowest level of input that is significant to the fair value measurement. The Company's assessment of the significance of a particular input to the fair value measurement in its entirety requires judgment and considers factors specific to the investment.
Investments and Investment Transactions
Valuation of Investments held at Fair Value
Valuation of Fund investments is evaluated pursuant to the fair value methodology discussed above. The Company's discretionary investments are categorized as trading and held at estimated fair value. Realized and unrealized gains and losses arising from changes in fair value of discretionary investments are reported within Investment income in the Consolidated Statements of Operations. See Note 4 for a summary of the fair value inputs utilized to determine the fair value of other discretionary investments held at fair value.
F-13
Old Mutual Asset Management
Notes to Consolidated Financial Statements (Continued)
2) Significant Accounting Policies (Continued)
Security Transactions
The Investment Funds generally record securities transactions on a trade-date basis. Realized gains and losses on securities transactions are generally determined on the average-cost method (net of foreign capital gain taxes) and for certain transactions determined based on the specific identification method.
Income and Expense Recognition
The Investment Funds record interest income on an accrual basis and include amortization of premiums and accretion of discounts. Dividend income and expense on dividends sold short are recorded on the ex-dividend date, net of applicable withholding taxes. Expenses are recorded on an accrual basis.
Foreign Currency Translation
The books and records of the Company and its Affiliates are maintained in U.S. dollars. Except for one timber Fund in Australia, the books and records of the Funds are maintained in U.S. dollars. Investment securities and other assets and liabilities denominated in a foreign currency are translated into U.S. dollars on the date of valuation. Income and expense transactions denominated in foreign currencies are translated into U.S. dollars using the average exchange rate over the period presented. The portion of realized or unrealized gains and losses resulting from changes in foreign exchange rates and from fluctuations arising from changes in the market prices of the underlying securities are included in the net realized and unrealized gain and loss on investments on the consolidated statement of operations. Net realized and unrealized gains and losses on foreign currency transactions represent net foreign exchange gains or losses from forward foreign currency exchange contracts, disposition of foreign currencies, currency gains or losses between the trade and settlement date on security transactions, and the difference between the amount of the investment income and foreign withholding taxes recorded on the Funds books and the U.S. dollar equivalent amounts actually received or paid.
Short Sales
Certain of the Funds may sell a security they do not own in anticipation of a decline in the fair value of that security. When a Fund sells a security short, it must borrow the security sold short and deliver it to the broker-dealer through which it made the short sale. The short sales are secured by the long portfolio and available cash. The Fund records a gain, limited to the price at which the Fund sold the security short, or a loss, unlimited in size, upon the termination of a short sale. The amount of the gain or loss will be equal to the proceeds received in entering into the short sale less the cost of buying back the short security to close the short position. While the transaction is open, the Fund will incur an expense for any accrued dividends or interest which is paid to the lender of the securities. These short sales may involve a level of risk in excess of the liability recognized in the accompanying consolidated balance sheet. The extent of such risk cannot be quantified.
Derivatives
Certain Funds use derivative instruments. However, there is minimal risk to the Company in relation to the derivative assets and liabilities of the Funds in excess of its investment in the respective Funds holding the investment. The Funds' derivative instruments include foreign currency exchange contracts, credit default swaps, interest rate swaps, financial futures contracts and warrants. The fair
F-14
Old Mutual Asset Management
Notes to Consolidated Financial Statements (Continued)
2) Significant Accounting Policies (Continued)
values of derivative instruments are recorded as other assets or other liabilities on the Company's Consolidated Balance Sheets. The Company has used foreign exchange forwards to hedge the risk of movement in exchange rates on financial assets on a limited basis.
The Company's Funds have not designated any financial instruments for hedge accounting, as defined in the accounting literature, during the periods presented. The gains or losses on derivative instruments not designated for hedge accounting are included as investment income in the Company's Consolidated Statements of Operations.
Equity method investments
The Company uses the equity method of accounting for investments that provide the Company with the ability to exercise significant influence over an entity, but that do not meet the requirements for consolidation. Equity method investments include two Affiliates, Heitman LLC and Investment Counselors of Maryland, LLC as well as all unconsolidated Funds over which the Company exercises significant influence. The Company's share of earnings (losses) from equity method investments is included in Investment Income in the Consolidated Statements of Operations. The carrying amounts of equity method investments are reflected in Investments in the Consolidated Balance Sheets. The Company evaluates its equity method investments for impairment whenever events or changes in circumstances indicate that the carrying amounts of such investments may not be recoverable. The difference between the carrying value and its estimated fair value is recognized as impairment when the loss is deemed other than temporary. Other investments, in which OMAM or an Affiliate do not exercise significant influence are accounted for under the cost method. Under the cost method, income is recognized as dividends when, and if, declared.
Revenue recognition
The Company's consolidated revenue primarily represents management fees billed monthly, quarterly and annually by Affiliates for managing the assets of clients. Asset-based management fees are recognized monthly as services are rendered and are primarily based upon a percentage of the market value of client assets managed. Affiliates that manage tangible property may also earn transaction fees at the time the underlying property is bought and sold. Any fees collected in advance are deferred and recognized as income over the period earned. Dividend income received by Investment Funds is recorded on the ex-dividend date. Performance fees are generally assessed as a percentage of the investment performance realized on a client's account. Performance fees, including those that are subject to clawback are recognized when they (i) become billable to customers (based on contractual terms of agreements), (ii) are not subject to contingent repayment and (iii) when collection is reasonably assured. Other income and revenues include interest income on cash and cash equivalents of Investment Funds and the Company's share of earnings from joint venture partners.
Timber Funds' revenue is recognized from log and fiber sales upon delivery to the customer. The Company is typically responsible for all logging and hauling costs. However, under pay-as-cut timber contracts, title and risk of loss from stumpage sales transfer to the buyer as the trees are cut. Revenue is recognized as timber is harvested. The buyer is typically responsible for all logging and hauling costs.
F-15
Old Mutual Asset Management
Notes to Consolidated Financial Statements (Continued)
2) Significant Accounting Policies (Continued)
Investment advisory fees receivable
The Company earns management and performance fees which are billed monthly, quarterly and annually in arrears, according to the terms of the relevant investment management agreement. Management and performance fees that have been billed but have not yet been collected are presented as "Investment advisory fees receivable" on the Consolidated Balance Sheets. Due to the short-term nature and liquidity of these receivables, the carrying amounts approximate their fair values. The Company's accounts receivable balances do not include any allowance for doubtful accounts, nor has any bad debt expense attributable to accounts receivable been recorded for the years ended December 31, 2013, 2012, and 2011. The Company believes all accounts receivable balances are fully collectible.
Property and equipment
Property and equipment are recorded at historical cost and depreciated using the straight-line method over its estimated useful lives. The estimated useful lives of office equipment and furniture and fixtures range from three to seven years. Leasehold improvements are amortized over the shorter of their estimated useful lives or the remaining term of the lease. Computer software developed or obtained for internal use is amortized using the straight-line method over the estimated useful life of the software, which is generally three years or less. The costs of improvements that extend the life of a fixed asset are capitalized, while the cost of repairs and maintenance is expensed as incurred.
Intangible assets
Acquired Affiliates have identifiable intangible assets arising from contractual or other legal rights with their clients. In determining the value of acquired intangibles, the Company analyzes the net present value of each acquired Affiliate's existing client relationships based on a number of factors. The Company analyzes the Affiliate's historical and potential future operating performance, the Affiliate's historical and potential future rates of attrition among existing clients, the stability and longevity of existing client relationships, the Affiliate's recent and long-term investment performance, the characteristics of the firm's products and investment styles, the stability and depth of the Affiliate's management team and the Affiliate's history and perceived franchise or brand value. The Company's acquired intangibles assets are predominately definite-life intangible assets and are generally amortized on a straight line basis over their estimated useful lives, ranging from five to sixteen years, reflecting the expected duration of such relationships. The Company does not hold any indefinite-lived intangible assets other than goodwill.
The Company tests for the possible impairment of acquired intangibles whenever events or changes in circumstances indicate that the carrying amount of the asset is not recoverable. If such indicators exist, the Company compares the undiscounted cash flows related to the asset to the carrying value of the asset. If the carrying value is greater than the undiscounted cash flow amount, an impairment charge is recorded in the Consolidated Statements of Operations for amounts necessary to reduce the carrying value of the asset to fair value. Intangible assets to be disposed of are reported at the lower of carrying value or fair value less cost to sell.
F-16
Old Mutual Asset Management
Notes to Consolidated Financial Statements (Continued)
2) Significant Accounting Policies (Continued)
Goodwill
The Company records goodwill when the consideration paid in a business acquisition exceeds the fair value of the net total of tangible assets acquired, identifiable intangible assets acquired and liabilities assumed. Goodwill is not amortized, but rather is tested for impairment annually or more frequently if events or circumstances occur that indicate impairment may exist. Factors that could trigger an impairment review include significant underperformance relative to historical or projected future operating results, significant changes in the Company's use of the acquired assets in a business combination or the strategy for the Company's overall business, and significant negative industry or economic trends.
The Company performs its assessment for impairment of goodwill during the fourth quarter annually as of September 30 and the Company has determined that it has five reporting units, consisting of the five consolidated Affiliates, for testing goodwill for impairment. The Company first considers various qualitative factors to determine if it is more likely than not that the fair value of each of the reporting units is greater than its respective carrying amount, including goodwill. Only a material decline in the fair value of any reporting unit would indicate that impairment may exist, at which point the impact would be determined. For purposes of assessing potential impairment, the fair value of the reporting unit is estimated and compared to the carrying value of the reporting unit. The fair value of a reporting unit is based on discounted estimated future cash flows. The assumptions used to estimate fair value include management's estimates of future growth rates, operating cash flows, discount rates and terminal value. These assumptions and estimates can change in future periods based on market movement and factors impacting the expected business performance. Changes in assumptions or estimates could materially affect the determination of the fair value of a reporting unit. If it is determined that the carrying value of the reporting unit exceeds its fair value, the Company determines the implied fair value of the goodwill in the same manner used to determine the amount of goodwill in a business combination. If the carrying value of goodwill exceeds the implied fair value of the goodwill, an impairment charge is recognized in the amount equal to that excess. Based on the Company's most recent annual goodwill impairment test, the fair value of all its reporting units were substantially in excess of their carrying value.
Leases
The Company and its Affiliates currently lease office space and equipment under various leasing arrangements, classified as operating leases. As these leases expire, it can be expected that in the normal course of business they will be renewed or replaced. Some lease agreements contain renewal options, rent escalation clauses or other inducements provided by the landlord. Rent expense is accrued to recognize lease escalation provisions and inducements provided by the landlord, if any, on a straight-line basis over the lease term.
Earnings per share
The Company calculates basic and diluted pro forma earnings per share ("EPS") by dividing net income for the year ended December 31, 2013 by its pro forma shares, following the corporate restructuring described in Note 1.
F-17
Old Mutual Asset Management
Notes to Consolidated Financial Statements (Continued)
2) Significant Accounting Policies (Continued)
Compensation arrangements
Basic EPS attributable to the Company's common shareholders is calculated by dividing "Net income (loss) from continuing operations attributable to controlling interest" by the weighted-average number of shares outstanding. Diluted EPS is similar to basic EPS, but adjusts for the effect of potential common shares unless they are antidilutive. For periods with a net loss, potential common shares are considered antidilutive.
The Company operates short term variable compensation arrangements where generally, a percentage of each Affiliate's annual pre-variable compensation earnings, as defined in each arrangement, is allocated to a "pool" of each respective Affiliate's key employees, and subsequently distributed to individuals subject to recommendation and approval of a Remuneration Committee comprised of both the Company's and each respective Affiliate's management. Variable compensation expense is accrued and recognized in the Consolidated Statements of Operations after services are provided by individual employees, and only after it has been formally awarded and communicated to those individuals. Variable compensation allocated to the "pools" of Affiliate key employees under the terms of the plans, where distribution has not yet been approved by the Remuneration Committee, is not recognized until the required service has been performed and the award is communicated to the individual.
The Company operates longer term profit-interest plans whereby certain Affiliate key employees are granted (or have a right to purchase) awards representing a profits interest in their respective Affiliate, as distinct from an equity interest due to the lack of pari passu voting rights. Under these plans, the Company may award a portion of the aforementioned variable compensation arrangement through issuance of a profits interest in the Affiliate. The awards generally have a three to five year vesting period from the grant date, and the service period commences at the commencement of the financial period to which the variable compensation relates. Under these plans, Affiliate key employees are eligible to share in the profits of their respective affiliates based on their respective percentage interest held.
In addition, under certain circumstances Affiliate key employees are eligible to receive a series of repurchase payments upon exiting the plans based on a multiple of the last twelve months profits of their respective Affiliate, as defined. Profits allocated and movements in the potential repurchase value, determined based on a fixed multiple times trailing twelve month profits, as defined, are recognized as compensation expense. Profits interests compensation liabilities are re-measured at each reporting date at the current trailing twelve month earnings multiple, with movements treated as compensation expense in the Company's Consolidated Statements of Operations.
Share-based compensation plans
The Company recognizes the cost of all share-based payments to directors, senior management and employees, including grants of restricted stock and stock options of its Parent and its Affiliates, as compensation expense in the Consolidated Statements of Operations over the respective vesting periods.
Awards made under the Parent's restricted stock and stock options plans are accounted for as equity settled, and the grant date fair value is recognized as compensation expense over the requisite service period, with a corresponding contribution to capital recorded. Options granted are measured at
F-18
Old Mutual Asset Management
Notes to Consolidated Financial Statements (Continued)
2) Significant Accounting Policies (Continued)
fair value using a standard option pricing valuation model. The valuation is consistent with generally accepted valuation methodologies for pricing financial instruments and incorporates all factors and assumptions that knowledgeable, willing market participants would consider in setting the price of the options.
Awards of equity made to Affiliate key employees are accounted for as cash settled, with the fair value recognized as compensation expense over the requisite service period, with a corresponding liability carried within other long term liabilities on the Consolidated Balance Sheet until the award is settled by the Company. The fair value of the liability is based on the expected cash to be paid, as determined according to trailing twelve months earnings multiples prescribed by each arrangement. The liability is revalued at each reporting period, with any movements recorded within compensation expense.
Deferred financing costs
The Company capitalizes certain legal, accounting and other third-party fees that are directly associated with in-process equity financings as other assets until such financings are consummated. After consummation of the equity financing, these costs are recorded in total equity as a reduction of Parent equity (deficit) generated as a result of the offering. As of December 31, 2013 and December 31, 2012, the Company recorded deferred financing costs of $3.2 million and $0.0 million, respectively, in other assets in the accompanying Consolidated Balance Sheet in contemplation of a probable equity financing. At the time in which the equity financing is no longer considered probable of being consummated, the deferred financing costs are expensed immediately as a charge to operating expenses in the Consolidated Statement of Income. Costs associated with an unconsummated transaction amounted to $0, $0.4 million and $8.0 million expensed in the years ended December 31, 2013, 2012 and 2011, respectively.
Income taxes
The Company uses the asset and liability method of accounting for income taxes on a "separate return" basis. Under this method, a subsidiary is assumed to file a separate return with the taxing authority, thereby reporting its taxable income or loss and paying the applicable tax to or receiving the appropriate refund from the parent. The rules followed by the subsidiary in computing its tax or refund should be the same as those followed by a taxpayer filing directly with the taxing authority.
The Company files tax returns directly with the U.S. and state tax authorities and therefore, the computations under the separate return method follow the Company's filings.
Deferred income taxes are recognized for the effects of temporary differences between the tax basis of an asset or liability and its reported amount in the Consolidated Financial Statements. Deferred tax assets and liabilities are measured using enacted tax rates to taxable income in the years in which those temporary differences are expected to be recovered or settled. The effect of a change in tax rates on deferred tax assets and liabilities is recognized in income in the period that includes the enactment date. The Company's deferred tax assets have been attributable to federal and state loss carry forwards, interest deductions, and accrued liabilities. Deferred tax liabilities have been attributable to undistributed earnings of subsidiaries.
F-19
Old Mutual Asset Management
Notes to Consolidated Financial Statements (Continued)
2) Significant Accounting Policies (Continued)
Deferred income tax assets are subject to a valuation allowance if, in management's opinion, it is not more-likely-than-not that these benefits will be realized. In evaluating the Company's ability to recover its deferred tax assets, the Company considers all available positive and negative evidence including its past operating results, the existence of cumulative earnings or losses in the most recent years and its forecast of future taxable income. In estimating future taxable income, the Company develops assumptions including the amount of future pre-tax operating income and the reversal of temporary differences. These assumptions require significant judgment about the forecasts of future taxable income and are consistent with the plans and estimates the Company is using to manage the underlying businesses.
A tax benefit should only be recognized if it is more likely than not that the position will be sustained based on its technical merits. The Company recognizes the financial statement benefit of a tax position only after considering the probability that a tax authority would uphold the position in an examination. For tax positions meeting a "more-likely-than-not" threshold, the amount recognized in the financial statements is the largest amount of benefit greater than 50% likely of being sustained. The more-likely-than-not threshold must continue to be met in each reporting period to support continued recognition of the benefit. Unrecognized tax benefits and related interest and penalties, are adjusted periodically to reflect changing facts and circumstances. The Company's accounting policy is to classify interest and related charges as a component of income tax expense.
Non-controlling interests
For entities that are consolidated, but not 100% owned, the Company reports non-controlling interests as equity, separate from the Parent's equity, on the Consolidated Balance Sheets. The Company's consolidated net income on the Consolidated Statements of Operations includes the income (loss) attributable to non-controlling interest holders of the Company's consolidated Affiliates and Funds. Non-controlling interests on the Consolidated Balance Sheets include undistributed income owned by the key employees of the consolidated Affiliates. Non-controlling interests in Consolidated Funds on the Consolidated Balance Sheets include undistributed income owned by the investors in the respective Funds.
Redeemable non-controlling interests
The Company includes redeemable non-controlling interests related to certain consolidated Funds as temporary equity on the Consolidated Balance Sheets. Non-controlling interests in certain consolidated Funds are subject to monthly or quarterly redemption by the investors. When redeemable amounts become legally payable to investors, they are classified as a liability and included in other liabilities of consolidated Funds on the Consolidated Balance Sheets.
Other comprehensive income (loss)
Other comprehensive income (loss) is defined as the change in equity of a business enterprise during a period from transactions and other events and circumstances, excluding those resulting from investments by and distributions to owners. For the Company's purposes, comprehensive income (loss) represents net income/loss, as presented in the accompanying Consolidated Statements of Operations, adjusted for net foreign currency translation adjustments.
F-20
Old Mutual Asset Management
Notes to Consolidated Financial Statements (Continued)
2) Significant Accounting Policies (Continued)
Restructuring costs
A liability for restructuring is recognized only after management has developed a formal plan, approved by the Board of Directors, to which it has committed. The costs included in a restructuring liability are those costs that are either incremental or incurred as a direct result of the plan, or are the result of a continuing contractual obligation with no continuing economic benefit to the Company, or a penalty incurred to cancel the contractual obligation. Refer to Note 21 for details of the Company's restructuring activities.
Recent accounting developments
In June 2013, the Financial Accounting Standards Board ("FASB") issued ASU 2013-08, Financial Services—Investment Companies: Amendments to the Scope, Measurement and Disclosure Requirements. ASU 2013-08 updates the guidance for determining whether a public or private company is an investment company. The new guidance clarifies the characteristics of an investment company and amends certain disclosure and measurement requirements. The new guidance is effective for interim and fiscal periods beginning after December 15, 2013 (early application is prohibited). The Company is evaluating the impact of ASU 2013-08, however it does not expect it to have a significant impact on its Consolidated Financial Statements.
In July 2013, the FASB issued ASU No. 2013-11, Income Taxes: Presentation of an Unrecognized Tax Benefit When a Net Operating Loss Carryforward, a Similar Tax Loss, or a Tax Credit Carryforward Exists. ASU 2013-11 provides guidance on the financial statement presentation of an unrecognized tax benefit when a net operating loss carryforward, a similar tax loss, or a tax credit carryforward exists. ASU 2013-11 is effective for the Company on January 1, 2014. The Company has evaluated the impact of ASU 2013-11 and has determined it will not have a significant impact on its Consolidated Financial Statements.
In April 2014, the FASB issued ASU 2014-08, Presentation of Financial Statements and Property Plant and Equipment: Reporting Discontinued Operations and Disclosures of Disposals of Components of an Entity. ASU 2014-08 amends the criteria for reporting a component of an entity as discontinued operations. The new guidance only allows disposals of components of an entity that represent a strategic shift or will have a major effect on operations to be classified as discontinued operations. Additionally, the guidance allows for an entity to have significant continuing involvement in the operations of a component after the disposal transaction. The new guidance is effective for interim and fiscal periods beginning on or after December 15, 2014. The Company has elected not to early adopt ASU 2014-08. The Company is evaluating the impact of ASU 2014-08, however it does not expect it to have a significant impact on its Consolidated Financial Statements.
In May 2014, the FASB issued ASU 2014-09, Revenue from Contracts with Customers. ASU 2014-09 modifies existing U.S. GAAP revenue recognition standards to more closely align with international accounting standards. Additionally, the guidance requires improved disclosures around the nature, amount, timing and uncertainty of revenue recognized. This new guidance will be effective for annual reporting periods beginning after December 15, 2016 and early adoption is not permitted. The Company is evaluating the impact of ASU 2014-09, however it does not expect it to have a significant impact on its Consolidated Financial Statements.
F-21
Old Mutual Asset Management
Notes to Consolidated Financial Statements (Continued)
3) Investments
Investments are comprised of the following at December 31 (in millions):
| |
2013 | 2012 | |||||
|---|---|---|---|---|---|---|---|
Investments by consolidated funds in related, unconsolidated master funds |
19.8 | 13.4 | |||||
Other investments of consolidated funds attributable to non-controlling interests |
386.4 | 91.0 | |||||
| | | | | | | | |
Investments of consolidated funds attributable to non-controlling interests held at fair value |
406.2 | 104.4 | |||||
| | | | | | | | |
Equity-accounted investments in unconsolidated funds (Note 6) |
43.1 | 44.7 | |||||
Other discretionary investments held at fair value |
0.7 | 0.5 | |||||
| | | | | | | | |
Total investments in products held at fair value attributable to controlling interests |
43.8 | 45.2 | |||||
Investments related to voluntary deferred compensation plans held at fair value |
51.4 | 41.6 | |||||
| | | | | | | | |
Total investments held at fair value |
501.4 | 191.2 | |||||
Equity-accounted investments in affiliates (Note 6) |
48.5 | 45.8 | |||||
Investments in joint ventures |
2.9 | 3.1 | |||||
Other investments |
1.5 | 2.5 | |||||
| | | | | | | | |
Total investments per Consolidated Balance Sheet |
$ | 554.3 | $ | 242.6 | |||
| | | | | | | | |
| | | | | | | | |
Investment income is comprised of the following for the years ended December 31 (in millions):
| |
2013 | 2012 | 2011 | |||||||
|---|---|---|---|---|---|---|---|---|---|---|
Investment return of equity-accounted investments in unconsolidated Funds (Note 6) |
$ | 2.9 | $ | 1.7 | $ | 3.6 | ||||
Realized and unrealized gains/losses on other discretionary investments held at fair value |
0.1 | — | — | |||||||
| | | | | | | | | | | |
Total investment return on OMAM products |
3.0 | 1.7 | 3.6 | |||||||
Investment return of equity-accounted investments in affiliates (Note 6) |
7.7 | 14.8 | 10.2 | |||||||
| | | | | | | | | | | |
Total investment income per Consolidated Statement of Operations |
10.7 | 16.5 | 13.8 | |||||||
| | | | | | | | | | | |
| | | | | | | | | | | |
F-22
Old Mutual Asset Management
Notes to Consolidated Financial Statements (Continued)
4) Fair Value Measurements
The following table summarizes the Company's assets and liabilities that are measured at fair value on a recurring basis at December 31, 2013 (in millions):
| |
Quoted prices in active markets (Level I) |
Significant other observable inputs (Level II) |
Significant unobservable inputs (Level III) |
Total value, December 31, 2013 |
|||||||||
|---|---|---|---|---|---|---|---|---|---|---|---|---|---|
Assets of consolidated Funds(1) |
|||||||||||||
Investments owned, at fair value |
|||||||||||||
Common and preferred stock |
$ | 52.0 | $ | — | $ | — | $ | 52.0 | |||||
Short-term investment funds |
8.8 | — | — | 8.8 | |||||||||
Fixed Income Securities |
— | 207.0 | — | 207.0 | |||||||||
Collective Investment Funds |
— | 9.1 | — | 9.1 | |||||||||
Corporate Debt |
— | 54.1 | — | 54.1 | |||||||||
Other investments |
0.9 | 70.2 | — | 71.1 | |||||||||
Derivatives |
2.8 | 1.3 | — | 4.1 | |||||||||
| | | | | | | | | | | | | | |
Total investments at fair value |
64.5 | 341.7 | — | 406.2 | |||||||||
Restricted cash held at fair value |
80.5 | 93.6 | — | 174.1 | |||||||||
| | | | | | | | | | | | | | |
Consolidated Funds Total |
145.0 | 435.3 | — | 580.3 | |||||||||
| | | | | | | | | | | | | | |
Investment securities(2) |
52.1 | — | — | 52.1 | |||||||||
Investments in unconsolidated Funds(3) |
— | — | 43.1 | 43.1 | |||||||||
| | | | | | | | | | | | | | |
OMAM Total |
52.1 | — | 43.1 | 95.2 | |||||||||
| | | | | | | | | | | | | | |
Total fair value assets |
$ | 197.1 | $ | 435.3 | $ | 43.1 | $ | 675.5 | |||||
| | | | | | | | | | | | | | |
| | | | | | | | | | | | | | |
Liabilities of consolidated Funds(1) |
|||||||||||||
Common stock |
$ | (24.6 | ) | $ | — | $ | — | $ | (24.6 | ) | |||
Forward Exchange Contracts |
(3.4 | ) | (0.1 | ) | — | (3.5 | ) | ||||||
Interest Rate Swaps |
— | (0.1 | ) | — | (0.1 | ) | |||||||
Other derivatives |
(0.2 | ) | (0.4 | ) | — | (0.6 | ) | ||||||
| | | | | | | | | | | | | | |
Total fair value liabilities |
$ | (28.2 | ) | $ | (0.6 | ) | $ | — | $ | (28.8 | ) | ||
| | | | | | | | | | | | | | |
| | | | | | | | | | | | | | |
F-23
Old Mutual Asset Management
Notes to Consolidated Financial Statements (Continued)
4) Fair Value Measurements (Continued)
The following table summarizes the Company's assets and liabilities that are measured at fair value on a recurring basis at December 31, 2012 (in millions):
| |
Quoted prices in active markets (Level I) |
Significant other observable inputs (Level II) |
Significant unobservable inputs (Level III) |
Total value, December 31, 2012 |
|||||||||
|---|---|---|---|---|---|---|---|---|---|---|---|---|---|
Assets of consolidated Funds(1) |
|||||||||||||
Investments owned, at fair value |
|||||||||||||
Common and preferred stock |
$ | 45.0 | $ | — | $ | — | $ | 45.0 | |||||
Short-term investment funds |
2.6 | — | — | 2.6 | |||||||||
Fixed Income Securities |
— | 28.8 | — | 28.8 | |||||||||
Collective Investment Funds |
— | 8.0 | — | 8.0 | |||||||||
Corporate Debt |
— | 4.1 | — | 4.1 | |||||||||
Other investments |
0.6 | 13.8 | — | 14.4 | |||||||||
Derivatives |
— | 1.5 | — | 1.5 | |||||||||
| | | | | | | | | | | | | | |
Total investments at fair value |
48.2 | 56.2 | — | 104.4 | |||||||||
Restricted cash held at fair value |
49.8 | 76.3 | — | 126.1 | |||||||||
| | | | | | | | | | | | | | |
Consolidated Funds Total |
98.0 | 132.5 | — | 230.5 | |||||||||
| | | | | | | | | | | | | | |
Investment securities(2) |
42.3 | — | — | 42.3 | |||||||||
Investments in unconsolidated Funds(3) |
— | — | 44.5 | 44.5 | |||||||||
| | | | | | | | | | | | | | |
OMAM Total |
42.3 | — | 44.5 | 86.8 | |||||||||
| | | | | | | | | | | | | | |
Total fair value assets |
$ | 140.3 | $ | 132.5 | $ | 44.5 | $ | 317.3 | |||||
| | | | | | | | | | | | | | |
Liabilities of consolidated Funds(1) |
|||||||||||||
Common stock |
$ | (26.0 | ) | $ | — | $ | — | $ | (26.0 | ) | |||
Interest Rate Swaps |
— | (0.4 | ) | — | (0.4 | ) | |||||||
| | | | | | | | | | | | | | |
Total fair value liabilities |
$ | (26.0 | ) | $ | (0.4 | ) | $ | — | $ | (26.4 | ) | ||
| | | | | | | | | | | | | | |
| | | | | | | | | | | | | | |
- (1)
- Assets
and liabilities measured at fair value are comprised of financial investments managed by the Company's Affiliates. $406.2 million in assets
and $28.8 million in liabilities at December 31, 2013 and $104.4 million in assets and $26.4 million in liabilities at December 31, 2012 are the result from the
consolidation of Funds sponsored by the Company's Affiliates.
Of these, collective investment funds are multi-strategy products categorized as Level II because they are redeemable monthly and valued at NAV per share of the fund without adjustment which the Company believes represents the fair value of the investments. The fair value of fixed income securities, corporate debt, and other investments is estimated based on quoted market prices, dealer quotations or alternative pricing sources supported by observable inputs and therefore classified within Level II. The Company obtains prices from independent pricing services that may utilize broker quotes, but generally uses various other pricing techniques which take into account appropriate factors such as yield, quality, coupon rate, maturity, type of issue, trading characteristics and other data.
F-24
Old Mutual Asset Management
Notes to Consolidated Financial Statements (Continued)
4) Fair Value Measurements (Continued)
Equity, short-term investment funds and derivatives which are traded on a national securities exchange are stated at the last reported sales price on the day of valuation. To the extent these securities are actively traded and valuation adjustments are not applied, they are classified as Level I. These securities that trade in markets that are not considered to be active but are valued based on quoted market prices, dealer quotations or alternative pricing sources supported by observable inputs obtained by the Company from independent pricing services are classified as Level II.
- (2)
- $52.1 million
and $42.3 million at December 31, 2013 and 2012, respectively, of investment securities are investments in publicly
registered daily redeemable funds (some managed by Affiliates) which the Company has classified as trading securities and valued using the published price as of the measurement dates. Accordingly, the
Company has classified these investments as Level I.
- (3)
- The remaining $43.1 million and $44.5 million at December 31, 2013 and 2012, respectively, relate to investments in unconsolidated Funds which consist primarily of investments in funds advised by Affiliates and are valued using NAV which the Company relies on to determine their fair value. The NAVs that have been provided by investees have been derived from the fair values of the underlying investments as of the measurement dates. The Company has classified investments in unconsolidated Funds as Level III given the nature of redemption restrictions that are in place. These unconsolidated Funds consist primarily of Real Estate investments funds. These investments are subject to longer than monthly or quarterly redemption restrictions, and due to their nature, distributions are received only as cash flows are generated from underlying assets over the life of the Funds. The range of time over which the underlying assets are expected to be liquidated by the investees is approximately 1-8 years from December 31, 2013.
The following table presents changes in Level III assets and liabilities, comprised of significant unobservable inputs, for the years ended December 31, 2012 and 2013 (in millions):
| |
Asset-backed securities |
Investments in unconsolidated OMAM funds |
Total | |||||||
|---|---|---|---|---|---|---|---|---|---|---|
Balance, January 1, 2012 |
$ | 0.1 | $ | 44.3 | $ | 44.4 | ||||
Realized and unrealized gain (loss) |
(0.3 | ) | 9.5 | 9.2 | ||||||
Net change in unrealized appreciation (depreciation) |
0.2 | (7.8 | ) | (7.6 | ) | |||||
Purchases, issuances or settlements |
— | 9.7 | 9.7 | |||||||
Dispositions |
— | (11.2 | ) | (11.2 | ) | |||||
| | | | | | | | | | | |
Balance, December 31, 2012 |
— | 44.5 | 44.5 | |||||||
Realized and unrealized gain (loss) |
— | 7.1 | 7.1 | |||||||
Net change in unrealized depreciation |
— | (4.2 | ) | (4.2 | ) | |||||
Purchases, issuances or settlements |
— | 0.6 | 0.6 | |||||||
Dispositions |
— | (4.9 | ) | (4.9 | ) | |||||
| | | | | | | | | | | |
Balance, December 31, 2013 |
$ | — | $ | 43.1 | $ | 43.1 | ||||
| | | | | | | | | | | |
| | | | | | | | | | | |
F-25
Old Mutual Asset Management
Notes to Consolidated Financial Statements (Continued)
4) Fair Value Measurements (Continued)
Gains attributable to controlling interests recorded on our Consolidated Statements of Operations related to the above Level III changes were $2.9 million, $1.7 million and $3.6 million at December 31, 2013, 2012 and 2011, respectively. There were no significant transfers of financial assets or liabilities among Levels I, II or III during the years ended December 31, 2013 and 2012.
5) Variable Interest Entities
The Company sponsors the formation of various entities considered to be VIEs. The Company consolidates these entities pursuant to Accounting Standards Codification ("ASC") Topic 810 relating to the consolidation of VIEs. These VIEs are primarily Funds managed by Affiliates that qualify for the deferral granted under ASU 2010-10, "Amendments for Certain Investment Funds." As such, the Company evaluates these Funds for consolidation pursuant to FASB Interpretation No. 46(R), "Consolidation of Variable Interest Entities." These investment vehicles are typically owned entirely by third-party investors, however, certain Funds are capitalized with seed capital investments from the Company and its related parties and may be owned partially by Affiliate key employees and/or individuals that own minority interests in an Affiliate.
The Company's determination of whether it is the primary beneficiary of a Fund that is a VIE is based in part on an assessment of whether or not the Company and its related parties are exposed to the majority of the risks and rewards of the entity. Typically the Fund's investors are entitled to substantially all of the economics of these VIEs with the exception of the management fees and performance fees, if any, earned by the Company or any investment the Company has made into the Funds. The Company generally is not the primary beneficiary of Fund VIEs created to manage assets for clients unless the Company's ownership interest, including interests of related parties, is substantial.
The Company's Timber Funds do not qualify for the deferral under ASU 2010-10 and therefore must be evaluated for consolidation pursuant to FAS 167, "Amendments to FASB Interpretation No. 46(R)", ("FAS 167"). Under FAS 167 as codified by ASC 810, the trigger for consolidation of a VIE has been revised such that the Company must consolidate the VIE if the Company's interest in the VIE is significant to the VIE's economics.
The following table presents the assets and liabilities of Funds that are VIEs and consolidated by the Company at December 31 (in millions):
| |
2013 | 2012 | |||||
|---|---|---|---|---|---|---|---|
Assets |
|||||||
Investments, at fair value |
$ | 90.9 | $ | 24.8 | |||
Restricted cash held by timber Funds |
2,557.0 | 2,509.0 | |||||
Timber assets |
4,172.5 | 4,544.1 | |||||
Other assets of consolidated OMAM Funds |
145.0 | 106.2 | |||||
| | | | | | | | |
Total Assets |
$ | 6,965.4 | $ | 7,184.1 | |||
| | | | | | | | |
| | | | | | | | |
Liabilities |
|||||||
Borrowings of timber Funds |
$ | 4,146.0 | $ | 4,236.4 | |||
Other liabilities of consolidated OMAM Funds |
77.2 | 57.3 | |||||
| | | | | | | | |
Total Liabilities |
$ | 4,223.2 | $ | 4,293.7 | |||
| | | | | | | | |
| | | | | | | | |
F-26
Old Mutual Asset Management
Notes to Consolidated Financial Statements (Continued)
5) Variable Interest Entities (Continued)
The assets of consolidated VIEs presented in the table above belong to the investors in those Funds, are available for use only by the Fund to which they belong, and are not available for use by the Company. Any debt or liabilities held by consolidated Funds have no recourse to the Company's general credit. The Company also consolidates Funds that are not VIEs, and therefore the assets and liabilities of those Funds are not included in the table above.
The Company's involvement with Funds that are VIEs and unconsolidated by the Company is generally limited to that of an investment manager and its investment in the unconsolidated VIE, if any. The Company's investment in any unconsolidated VIE generally represents an insignificant interest of the Fund's net assets and assets under management, such that the majority of the VIE's results are attributable to third parties. The Company's exposure to risk in these entities is generally limited to any capital contribution it has made or is required to make and any earned but uncollected management fees. The Company has not issued any investment performance guarantees to these VIEs or their investors.
The following information pertains to unconsolidated VIEs for which the Company holds a significant variable interest at December 31 (in millions):
| |
2013 | 2012 | |||||
|---|---|---|---|---|---|---|---|
Unconsolidated VIE assets |
$ | 12,156.8 | $ | 11,270.7 | |||
Unconsolidated VIE liabilities |
$ | 1,720.4 | $ | 1,098.9 | |||
Equity interests on the Consolidated Balance Sheet |
$ | 78.4 | $ | 74.1 | |||
Maximum risk of loss(1) |
$ | 81.1 | $ | 77.5 | |||
- (1)
- Includes equity investments the Company has made or is required to make and any earned but uncollected management/incentive fees. The Company does not record performance/incentive allocations until the respective measurement period has ended.
In addition to the multiple unconsolidated VIE Funds, the Company determined that Heitman LLC, one of the Company's Affiliates, is a VIE. The Company concluded that it is not the primary beneficiary of Heitman LLC because it does not hold the power to direct its most economically significant activities. The assets and liabilities of Heitman LLC include the management company itself as well as certain Funds that Heitman LLC consolidates. The Company aggregated Heitman LLC with the Company's other unconsolidated VIE Funds due to their similar risk profiles given that the risks and rewards are driven by changes in investment values and the Affiliates' ability to manage those assets.
F-27
Old Mutual Asset Management
Notes to Consolidated Financial Statements (Continued)
6) Equity Accounted Investees
The following tables present summarized financial information for Affiliates and Funds accounted for under the equity method (in millions):
| |
2013 | 2012 | |||||||||||||||||
|---|---|---|---|---|---|---|---|---|---|---|---|---|---|---|---|---|---|---|---|
Statements of Income for the year ended December 31, |
Heitman LLC | Other | Total | Heitman LLC | Other | Total | |||||||||||||
Net revenues(1) |
$ | 163.5 | $ | 80.1 | $ | 243.6 | $ | 242.3 | $ | 85.0 | $ | 327.3 | |||||||
| | | | | | | | | | | | | | | | | | | | |
Operating income |
47.0 | 20.8 | 67.8 | 72.2 | 26.6 | 98.8 | |||||||||||||
Other income (expense), net |
161.1 | (13.4 | ) | 147.7 | 129.3 | (66.9 | ) | 62.4 | |||||||||||
| | | | | | | | | | | | | | | | | | | | |
Income (loss) before income taxes |
208.1 | 7.4 | 215.5 | 201.5 | (40.3 | ) | 161.2 | ||||||||||||
Less income tax expense benefit |
1.8 | (0.4 | ) | 1.4 | 0.6 | — | 0.6 | ||||||||||||
Excluding noncontrolling interests |
183.5 | 7.6 | 191.1 | 173.6 | (42.7 | ) | 130.9 | ||||||||||||
| | | | | | | | | | | | | | | | | | | | |
Net income attributable to controlling interests |
$ | 22.8 | $ | 0.2 | $ | 23.0 | $ | 27.3 | $ | 2.4 | $ | 29.7 | |||||||
| | | | | | | | | | | | | | | | | | | | |
| | | | | | | | | | | | | | | | | | | | |
OMAM Equity in net income of equity method investees |
$ | 10.4 | $ | 0.2 | $ | 10.6 | $ | 14.1 | $ | 2.4 | $ | 16.5 | |||||||
| |
2011 | |||||||||
|---|---|---|---|---|---|---|---|---|---|---|
Statements of Income for the year ended December 31,
|
Heitman LLC | Other | Total | |||||||
Net revenues(1) |
$ | 159.8 | $ | 85.0 | $ | 244.8 | ||||
| | | | | | | | | | | |
Operating income |
39.2 | 22.3 | 61.5 | |||||||
Other income (expense), net |
77.4 | (10.3 | ) | 67.1 | ||||||
| | | | | | | | | | | |
Income (loss) before income taxes |
116.6 | 12.0 | 128.6 | |||||||
Less income tax expense |
0.4 | — | 0.4 | |||||||
Excluding noncontrolling interests |
97.2 | 7.6 | 104.8 | |||||||
| | | | | | | | | | | |
Net income (loss) attributable to controlling interests |
$ | 19.0 | $ | 4.4 | $ | 23.4 | ||||
| | | | | | | | | | | |
| | | | | | | | | | | |
OMAM Equity in net income of equity method investees |
$ | 9.4 | $ | 4.4 | $ | 13.8 | ||||
F-28
Old Mutual Asset Management
Notes to Consolidated Financial Statements (Continued)
6) Equity Accounted Investees (Continued)
| |
2013 | 2012 | |||||||||||||||||
|---|---|---|---|---|---|---|---|---|---|---|---|---|---|---|---|---|---|---|---|
Balance Sheets, as of December 31,
|
Heitman LLC | Other | Total | Heitman LLC | Other | Total | |||||||||||||
Current assets |
$ | 125.7 | $ | 58.7 | $ | 184.4 | $ | 156.0 | $ | 84.2 | $ | 240.2 | |||||||
Noncurrent assets |
1,936.2 | 1,027.4 | 2,963.6 | 1,689.7 | 956.3 | 2,646.0 | |||||||||||||
| | | | | | | | | | | | | | | | | | | | |
Total Assets |
2,061.9 | 1,086.1 | 3,148.0 | 1,845.7 | 1,040.5 | 2,886.2 | |||||||||||||
Current liabilities |
69.6 | 378.9 | 448.5 | 60.3 | 182.0 | 242.3 | |||||||||||||
Long-term liabilities |
831.5 | 48.8 | 880.3 | 590.4 | 252.0 | 842.4 | |||||||||||||
Non-controlling interests in subsidiaries |
1,101.3 | 643.7 | 1,745.0 | 1,129.1 | 588.2 | 1,717.3 | |||||||||||||
| | | | | | | | | | | | | | | | | | | | |
Members' equity |
$ | 59.5 | $ | 14.7 | $ | 74.2 | $ | 65.9 | $ | 18.3 | $ | 84.2 | |||||||
| | | | | | | | | | | | | | | | | | | | |
| | | | | | | | | | | | | | | | | | | | |
OMUSH Equity investment and undistributed earnings of affiliated companies, before consolidating and reconciling adjustments |
$ | 47.1 | $ | 14.7 | $ | 61.8 | $ | 52.4 | $ | 18.3 | $ | 70.7 | |||||||
Consolidating and reconciling adjustments: |
|||||||||||||||||||
Goodwill attributable to equity method investment |
29.8 | — | 29.8 | 19.8 | — | 19.8 | |||||||||||||
| | | | | | | | | | | | | | | | | | | | |
OMAM Investment in equity method investees at cost plus equity in undistributable earnings since acquisition |
$ | 76.9 | $ | 14.7 | $ | 91.6 | $ | 72.2 | $ | 18.3 | $ | 90.5 | |||||||
| | | | | | | | | | | | | | | | | | | | |
| | | | | | | | | | | | | | | | | | | | |
- (1)
- Net revenue includes advisory fees for asset management services and investment income, including interest and dividends from consolidated investment partnerships.
During the period, certain affiliates held investments in joint ventures. These investments were accounted for using the equity method of accounting. Acadian Asset Management LLC had a joint venture investment in Acadian Asset Management (Australia) Limited. Rogge Global Partners Plc had two joint ventures; in Tokio Marine Rogge Asset Management Limited and in Alfi Rogge Partners S.A. Net loss in the Consolidated Statement of Operations includes $2.1 million, $2.4 million and $2.2 million of income for the year ending December 31, 2013, 2012 and 2011 respectively, and investment in joint ventures includes $2.9 million and $3.1 million for the periods ending at December 31, 2013 and 2012, respectively. There are no material differences between the carrying value of these investments and the amounts of their underlying net asset value.
F-29
Old Mutual Asset Management
Notes to Consolidated Financial Statements (Continued)
7) Property and Equipment and Lease Commitments
Property and equipment consisted of the following at December 31 (in millions):
| |
2013 | 2012 | |||||
|---|---|---|---|---|---|---|---|
Leasehold improvements |
$ | 27.6 | $ | 23.0 | |||
Office equipment |
24.4 | 22.0 | |||||
Furniture and fixtures |
8.0 | 6.8 | |||||
Software and web development |
24.9 | 23.1 | |||||
| | | | | | | | |
Total property and equipment, at cost |
84.9 | 74.9 | |||||
Accumulated depreciation and amortization |
(60.8 | ) | (55.8 | ) | |||
| | | | | | | | |
Property and equipment, net |
$ | 24.1 | $ | 19.1 | |||
| | | | | | | | |
| | | | | | | | |
Depreciation and software and web development amortization expense for continuing operations was $4.9 million, $5.8 million and $6.9 million for the years ended December 31, 2013, 2012 and 2011, respectively.
The Company and its Affiliates lease office space for their operations. At December 31, 2013, the Company's aggregate future minimum payments for operating leases having initial or non-cancelable lease terms greater than one year are (in millions):
| |
Gross minimum rentals |
Sub-lease rentals |
Net minimum rentals |
|||||||
|---|---|---|---|---|---|---|---|---|---|---|
2014 |
$ | 9.6 | $ | (0.2 | ) | $ | 9.4 | |||
2015 |
10.3 | (0.1 | ) | 10.2 | ||||||
2016 |
9.6 | — | 9.6 | |||||||
2017 |
8.1 | — | 8.1 | |||||||
2018 |
8.2 | — | 8.2 | |||||||
Thereafter |
28.9 | — | 28.9 | |||||||
| | | | | | | | | | | |
Total |
$ | 74.7 | $ | (0.3 | ) | $ | 74.4 | |||
| | | | | | | | | | | |
| | | | | | | | | | | |
The Company is responsible for other expenses under these leases as well. Such expenses include operating costs, insurance, taxes and broker fees. Consolidated rent & occupancy expenses for 2013, 2012 and 2011 were $8.8 million, $8.0 million and $8.6 million, respectively.
F-30
Old Mutual Asset Management
Notes to Consolidated Financial Statements (Continued)
7) Property and Equipment and Lease Commitments (Continued)
The Company's Affiliates also have timber lease rights for use in their continuing operations. At December 31, 2013, the Company's unrecognized aggregate future minimum payments for timber rights leases having initial or non-cancelable lease terms greater than one year are (in millions):
| |
Net minimum rentals |
|||
|---|---|---|---|---|
2014 |
$ | 1.4 | ||
2015 |
1.2 | |||
2016 |
1.1 | |||
2017 |
1.1 | |||
2018 |
1.0 | |||
Thereafter |
13.5 | |||
| | | | | |
Total |
$ | 19.3 | ||
| | | | | |
| | | | | |
Consolidated funds timber lease rights expense for 2013, 2012 and 2011 was $9.2 million, $9.2 million and $7.1 million, respectively.
8) Goodwill and Intangible Assets
The following table presents the changes in goodwill in 2013, and 2012 (in millions):
| |
Gross Book Value |
Accumulated Impairment |
Net Book Value |
|||||||
|---|---|---|---|---|---|---|---|---|---|---|
Balance at December 31, 2011 |
$ | 470.2 | $ | (344.8 | ) | $ | 125.4 | |||
Impairments |
— | (7.6 | ) | (7.6 | ) | |||||
Disposals |
(309.6 | ) | 309.6 | — | ||||||
| | | | | | | | | | | |
Balance at December 31, 2012 |
160.6 | (42.8 | ) | 117.8 | ||||||
Impairments |
— | — | — | |||||||
Disposals |
— | — | — | |||||||
| | | | | | | | | | | |
Balance at December 31, 2013 |
$ | 160.6 | $ | (42.8 | ) | $ | 117.8 | |||
| | | | | | | | | | | |
| | | | | | | | | | | |
During its annual impairment assessment of goodwill, the Company recognized charges of $0 in 2013, $7.6 million in 2012 and $25.0 million in 2011 reflecting the excess by which certain Affiliates' carrying amount, including allocated goodwill, exceeded fair value. The amount of the impairment charge attributable to continuing operations was $0 in 2013, $1.7 million in 2012 and $0 in 2011. The amount of the impairment charge attributable to discontinued operations was $0 in 2013, $5.9 million in 2012 and $25.0 million in 2011. The impairment amount represents the write down necessary to adjust the affiliates' goodwill to equal current fair value. Fair value is determined using a discounted cash flow analysis performed for each Affiliate, derived based on appropriate assumptions around long-term growth projections and discount rates.
F-31
Old Mutual Asset Management
Notes to Consolidated Financial Statements (Continued)
8) Goodwill and Intangible Assets (Continued)
The following table presents the change in acquired intangible assets in 2013, 2012 and 2011, composed of client relationships (in millions):
| |
Gross Book Value |
Accumulated Amortization & Impairment |
Net Book Value |
|||||||
|---|---|---|---|---|---|---|---|---|---|---|
Balance at December 31, 2011 |
$ | 494.0 | $ | (465.8 | ) | $ | 28.2 | |||
Amortization |
— | (2.3 | ) | (2.3 | ) | |||||
Impairments |
— | (24.5 | ) | (24.5 | ) | |||||
Disposals |
(467.2 | ) | 467.2 | — | ||||||
| | | | | | | | | | | |
Balance at December 31, 2012 |
26.8 | (25.4 | ) | 1.4 | ||||||
Amortization |
— | (0.2 | ) | (0.2 | ) | |||||
| | | | | | | | | | | |
Balance at December 31, 2013 |
$ | 26.8 | $ | (25.6 | ) | $ | 1.2 | |||
| | | | | | | | | | | |
| | | | | | | | | | | |
The Company's definite-lived acquired intangibles are amortized over their expected useful lives. As of December 31, 2013, these assets were being amortized over an average remaining useful life of nine years. The Company recorded amortization expense of $0.2 million, $2.3 million and $3.4 million, respectively, for the years ended December 31, 2013, 2012 and 2011. The amount of amortization attributable to continuing operations was $0.1 million, $0.1 million and $0.9 million for the years ended December 31, 2013, 2012 and 2011, respectively. The amount of amortization attributable to discontinuing operations was $0.1 million, $2.2 million and $2.5 million for the years ended December 31, 2013, 2012 and 2011, respectively.
The Company recorded impairment charges of $7.7 million in 2011 against the carrying amount of its definite-lived intangible assets as a result of terminated client accounts and ongoing operating losses at its continuing operations. Impairment charges of $24.5 million and $4.0 million were recognized in relation to discontinued operations in 2012 and 2011, respectively, as a result of ongoing operating losses and management's subsequent decision to sell these businesses, at which point in time it was determined that the carrying amount of their intangibles exceeded the amount expected to be recovered through their sale. All disposal charges have been included in discontinued operations.
The Company estimates that its consolidated annual amortization expense, assuming no useful life changes or additional investments in new or existing Affiliates, for each of the next five fiscal years is as follows (in millions):
2014 |
$ | 0.2 | ||
2015 |
0.2 | |||
2016 |
0.1 | |||
2017 |
0.1 | |||
2018 |
0.1 | |||
2019 and thereafter |
0.5 | |||
| | | | | |
Total |
$ | 1.2 | ||
| | | | | |
| | | | | |
F-32
Old Mutual Asset Management
Notes to Consolidated Financial Statements (Continued)
9) Timber and Timberlands
Timber and timberlands consisted of the following at December 31 (in millions):
| |
2013 | 2012 | |||||
|---|---|---|---|---|---|---|---|
Timber |
$ | 3,027.7 | $ | 3,225.1 | |||
Timberlands |
1,913.6 | 2,011.0 | |||||
Timber lease rights |
198.8 | 201.4 | |||||
Other(1) |
74.7 | 74.7 | |||||
| | | | | | | | |
Total timber and timberlands, at cost |
5,214.8 | 5,512.2 | |||||
Accumulated depletion and amortization |
(792.7 | ) | (705.8 | ) | |||
| | | | | | | | |
Timber and timberlands, net |
$ | 4,422.1 | $ | 4,806.4 | |||
| | | | | | | | |
| | | | | | | | |
- (1)
- The category "Other" includes buildings, roads, quarries, hunting lease rights and other similar tangible and intangible assets related to timber cutting operations.
10) Related Party Transactions
Amounts due from related parties were comprised of the following at December 31 (in millions):
| |
2013 | 2012 | |||||
|---|---|---|---|---|---|---|---|
Interest receivable from Parent(1) |
$ | 1.8 | $ | 1.8 | |||
Fees receivable from unconsolidated Funds |
26.8 | 22.2 | |||||
Fees receivable from commonly controlled Old Mutual plc business units |
2.2 | 2.0 | |||||
Receivable from joint venture partners |
7.6 | 8.4 | |||||
Other amounts due from Parent |
0.1 | — | |||||
Other amounts due from related parties |
0.2 | 0.2 | |||||
| | | | | | | | |
Total current receivables from related parties |
38.7 | 34.6 | |||||
Other long-term amounts due from Parent |
2.1 | 2.1 | |||||
Loan notes receivable from Parent(1) |
30.1 | 30.1 | |||||
| | | | | | | | |
Total long-term receivables from related parties |
32.2 | 32.2 | |||||
| | | | | | | | |
Total amounts due from related parties |
$ | 70.9 | $ | 66.8 | |||
| | | | | | | | |
| | | | | | | | |
F-33
Old Mutual Asset Management
Notes to Consolidated Financial Statements (Continued)
10) Related Party Transactions (Continued)
Amounts due to related parties were comprised of the following at December 31 (in millions):
| |
2013 | 2012 | |||||
|---|---|---|---|---|---|---|---|
Interest payable to Parent (Note 13) |
$ | 14.6 | $ | 14.9 | |||
Other amounts due to related parties |
1.0 | 0.4 | |||||
Preferred dividend payable of consolidated Fund |
16.3 | 16.3 | |||||
| | | | | | | | |
Total current payables to related parties |
31.9 | 31.6 | |||||
Revolving credit facility payable to Parent (Note 13) |
140.7 | 231.5 | |||||
Loan notes payable to Parent (Note 13) |
900.0 | 900.0 | |||||
Promissory note payable to related parties of consolidated Fund (Note 13) |
604.7 | 662.6 | |||||
| | | | | | | | |
Total long-term payables to related parties |
1,645.4 | 1,794.1 | |||||
| | | | | | | | |
Total amounts due to related parties |
$ | 1,677.3 | $ | 1,825.7 | |||
| | | | | | | | |
| | | | | | | | |
Investments in related parties consisted of the following at December 31 (in millions):
| |
2013 | 2012 | |||||
|---|---|---|---|---|---|---|---|
Investment in unsconsolidated master funds(2) |
$ | 19.8 | $ | 13.4 | |||
Investments in joint ventures |
2.9 | 3.1 | |||||
Investments in equity-accounted investees (note 6) |
91.6 | 90.5 | |||||
| | | | | | | | |
Total related party investments |
$ | 114.3 | $ | 107.0 | |||
| | | | | | | | |
| | | | | | | | |
F-34
Old Mutual Asset Management
Notes to Consolidated Financial Statements (Continued)
10) Related Party Transactions (Continued)
Related party transactions included in the Company's Consolidated Statement of Operations for the years ended December 31 consisted of (in millions):
| |
2013 | 2012 | 2011 | |||||||
|---|---|---|---|---|---|---|---|---|---|---|
Management fees collected from commonly controlled Old Mutual business units(3) |
$ | 9.6 | $ | 12.2 | $ | 14.1 | ||||
Management fees collected from unconsolidated Funds(2) |
46.4 | 43.3 | 39.9 | |||||||
Performance fees collected/(performance penalties paid) from/(to) unconsolidated Funds(2) |
0.5 | (0.2 | ) | (2.3 | ) | |||||
Management fees collected from joint venture partners |
13.7 | 11.0 | 9.7 | |||||||
| | | | | | | | | | | |
Total related party revenues (including discontinued operations) |
70.2 | 66.3 | 61.4 | |||||||
| | | | | | | | | | | |
| | | | | | | | | | | |
Interest expense owed to parent (Note 13) |
72.1 | 84.1 | 73.2 | |||||||
Interest expense owed to commonly controlled Old Mutual business units(4) |
— | — | 1.0 | |||||||
Rent and administrative costs recharged by commonly controlled Old Mutual business units(5) |
0.1 | 1.7 | 0.2 | |||||||
Restricted stock grants of parent equity to OMAM employees (Note 17) |
5.0 | 2.9 | 3.0 | |||||||
Recharged parent operational costs(6) |
5.3 | 5.5 | 5.9 | |||||||
| | | | | | | | | | | |
Total related party expenses (including discontinued operations) |
82.5 | 94.2 | 83.3 | |||||||
| | | | | | | | | | | |
| | | | | | | | | | | |
- (1)
- In
December 2011 the Company's Parent transferred a loan note receivable with a carrying value of $30.1 million to the Company from a commonly
controlled business unit (sister entity). The acquisition of the loan note was funded via a non-cash contribution to capital from the Company's Parent. The loan note, issued by the Parent, bears
interest at the two year U.S. dollar swap rate plus 7.28%, with a maturity date of April 1, 2014. Interest is payable annually in arrears.
- (2)
- Transactions
with unconsolidated Affiliate-sponsored Funds are considered related party items on the basis of the Company's significant influence over the
activities of such entities in its capacity as investment advisor thereto. These transactions are comprised of fees for advisory services and investments in unconsolidated "master" Funds held by
consolidated OMAM "feeder" Funds.
- (3)
- The
Company provides sub-advisory services in the ordinary course of business to commonly controlled Old Mutual business units. Management fees include
amounts earned from these related parties. For the years ended December 31, 2013, 2012 and 2011, $0, $4.6 million and $5.5 million, respectively, were earned from discontinued
operations.
- (4)
- During
2011, interest expense of $1.0 million was recognized in respect to $76.0 million in debt obligations owed by the Company to a Related
Business Unit that were repaid during the first quarter of that year, upon the disposition of that entity by the Parent.
- (5)
- The
Company conducts a portion of its distribution activities out of the United Kingdom, and has entered into contractual arrangements with a Related
Business Unit domiciled there to share its premises and leverage certain of its administrative functions.
- (6)
- The Company's Parent provides the Company with various oversight services, including governance, which includes compensation for board and executive committees, investor relations, procurement of insurance coverage, human resources, financial reporting, internal audit, treasury, systems and tax services. These costs (i) are directly attributable to the Company, (ii) have been charged to the Company by the Company's Parent, (iii) have been paid to Parent by Company and (iv) have been recorded in the Company's Consolidated Financial Statements and were $2.0 million, $2.7 million and $2.7 million for fiscal 2013, 2012 and 2011, respectively. Additionally, the Company has historically used certain services performed by Parent for the benefit of several
F-35
Old Mutual Asset Management
Notes to Consolidated Financial Statements (Continued)
10) Related Party Transactions (Continued)
of Parent's subsidiaries, including providing working capital, as well as certain finance, internal audit, insurance, human resources, investor relations, risk, governance and other corporate functions and projects. Costs associated with these services were generally allocated based on the Company's proportion of the total Parent's consolidated, normalized revenues. In the years ended December 31, 2013, 2012 and 2011, $3.3 million, $2.8 million and $3.2 million, respectively, of these costs incurred have been allocated to the Company through a non-cash contribution to Parent equity, with the balance of the charges settled in cash.
Other related party arrangements
As of December 31, 2012, the Company's Parent had assigned its interests in the Company's intercompany loan notes and revolving credit facility to a commonly controlled, wholly owned business unit within the Parent, as collateral over a separate intragroup lending arrangement between the Parent and that entity. This assignment was terminated during the third quarter of 2013.
The Company has entered into a sub-lease arrangement with a Related Business Unit subsidiary of the Parent in relation to premises it continues to lease in respect of a discontinued operation. During 2009, as of the date this operation was discontinued, the Company recorded a liability in respect of the present value of future lease payments it remained contractually obligated to incur, net of the future sub-lease income on the intercompany sub-lease arrangement (see Note 7). During the years ended December 31, 2013, 2012, and 2011 the Company received sub-lease payments of $1.0 million, $1.2 million and $1.2 million, respectively, as a result of this related party arrangement.
In certain instances the Company pays the compensation for employees of Related Business Units who are based at its location. Conversely, employees of the Company operating at locations of Related Business Units are paid by those entities. In both cases these costs are recharged back to the business to which the employee is providing services.
As part of its profit-interests plan, an Affiliate made tax payments on behalf of its employees who became vested in profit interests of the Affiliate. Payments totaling $4.5 million and $5.6 million made in the years ended December 31, 2013 and 2012, respectively, are included on the Company's balance sheet in Amounts due from related parties. The balance as of December 31, 2013 was repaid by the employees of the Affiliate in February 2014.
The Company uses the equity-method to account for its interests in Affiliates where it exercises significant influence over their operations, but does not hold a controlling interest, as well as its joint venture partners. During 2013, 2012 and 2011, the Company recorded earnings in respect of these investees of $9.8 million, $17.2 million and $12.4 million respectively. During 2013, 2012 and 2011 respectively the Company received dividends from joint ventures of $1.9 million, $1.2 million and $1.4 million, and the Company recharged expenses of $0.3 million, $0.3 million and $0.3 million to joint venture partners during the same respective periods. The Company also exercises significant influence over unconsolidated OMAM Funds, however in order to report in a manner consistent with consolidated Funds, it has elected to apply the fair value option for its investments therein. Total investment return recognized during 2013, 2012 and 2011 in respect of these entities was $2.9 million, $1.7 million and $3.6 million respectively. Additional information with respect to equity-method investees is disclosed in Note 6.
As the Company is a member of a group of related businesses, it is possible that the terms of certain related party transactions are not the same as those that would result from transactions with wholly unrelated parties.
F-36
Old Mutual Asset Management
Notes to Consolidated Financial Statements (Continued)
11) Accounts Payable and Accrued Liabilities
Accounts payable and accrued liabilities consisted of the following at December 31 (in millions):
| |
2013 | 2012 | |||||
|---|---|---|---|---|---|---|---|
Accounts payable |
$ | 16.3 | $ | 12.1 | |||
Accrued expenses |
25.8 | 17.5 | |||||
Forward foreign exchange contract liability |
0.1 | 0.2 | |||||
Other |
1.7 | 1.0 | |||||
| | | | | | | | |
Total accounts payable and accruals |
$ | 43.9 | $ | 30.8 | |||
| | | | | | | | |
| | | | | | | | |
12) Other Compensation Liabilities
Other compensation liabilities consisted of the following at December 31 (in millions):
| |
2013 | 2012 | |||||
|---|---|---|---|---|---|---|---|
Share-based payments liability (Note 17) |
$ | 86.0 | $ | 65.8 | |||
Non-current compensation payable |
2.2 | — | |||||
Profit interests compensation liabilty (Note 2) |
77.2 | 49.0 | |||||
Voluntary deferral plan liability (Note 16) |
51.2 | 41.4 | |||||
| | | | | | | | |
Total other compensation liabilities |
216.6 | 156.2 | |||||
| | | | | | | | |
| | | | | | | | |
Profit interests compensation expense including discontinued operations amounted to $29.0 million in 2013, $12.3 million in 2012 and $5.9 million in 2011. Issuances of additional profit sharing interests to key employees for cash amounted to $0.2 million in 2013, $0 in 2012 and $0.1 million in 2011. Redemption of profit sharing interests by OMAM from key employees for cash were $0.9 million in 2013, $0.4 million in 2012 and $0.1 million in 2011.
13) Borrowings and Debt
Borrowings and debt of OMAM
The Company's long term debt at December 31, excluding the long term debt of the Company's consolidated Funds was comprised of the following (in millions):
| (in millions) |
2013 | 2012 | Interest rate | Maturity | ||||||
|---|---|---|---|---|---|---|---|---|---|---|
Related party obligations: |
||||||||||
Term loan one |
$ | 900.0 | $ | 900.0 | 6.34% | September 30, 2015 | ||||
Revolving credit facility |
140.7 | 231.5 | LIBOR + 5.58% | March 31, 2018 | ||||||
|
+ 0.50% fee on undrawn amounts |
|||||||||
| | | | | | | | | | | |
Total related party obligations |
1,040.7 | 1,131.5 | ||||||||
Third party obligations: |
||||||||||
Term loan two |
2.5 | 16.0 | 5.23% | August 15, 2014 | ||||||
| | | | | | | | | | | |
Total long term debt of the Company |
$ | 1,043.2 | $ | 1,147.5 | ||||||
| | | | | | | | | | | |
| | | | | | | | | | | |
F-37
Old Mutual Asset Management
Notes to Consolidated Financial Statements (Continued)
13) Borrowings and Debt (Continued)
The fair value of borrowings approximated their cost basis as of December 31, 2013 and 2012. Fair value was determined based on future cash flows, discounted to present value using current market rates. The inputs are categorized as level 3 in the fair value hierarchy, as defined in Note 4, "Fair Value Measurements".
Term loan one
On December 31, 2008, the Company issued a $900.0 million promissory note to its Parent. The note is due on September 30, 2015 and bears interest at a rate of 6.34% per annum. In connection with and immediately preceding the Company's initial public offering, the Parent intends to refinance and reissue this debt into a subsidiary of the Company which will result in its elimination upon consolidation.
Term loan two
On September 30, 2010, the Company entered into a $16.5 million term note to American AgCredit, PCA. The note was repayable in installments of $0.5 million on December 1, 2012, $12.0 million on November 1, 2013, $1.5 million on December 15, 2013 and $2.5 million on August 15, 2014, and bears interest at a rate of 5.23% per annum, paid out of a third party-funded interest reserve account at no cost to the Company. The note is secured by an offsetting preferred equity investment held by the Company in a consolidated OMAM Fund. The credit agreement requires that the Company maintain International Financial Reporting Standards ("IFRS") net assets in excess of $250 million, and access to at least $25 million in available liquidity resources. The Company's parent has subordinated its interests in respect of Term Loan 1 and the Revolving Credit Facility in favor of this obligation.
Revolving credit facility
On September 30, 2005, the Company entered into a five year revolving credit facility with its Parent where the Parent agreed to make available up to an aggregate maximum amount of $850.0 million to facilitate cash transfers between the Company and Parent. The agreement was subsequently amended effective September 30, 2010 to extend the maturity date by 12 months. The agreement was again amended effective September 30, 2011 to extend maturity date to March 28, 2013, adjust the contractual interest rate from LIBOR + 1.65% to LIBOR + 5.58% and adjust the commitment fee on undrawn amounts from 0.82% per annum to 1.95% per annum. During March 2013, the Company and its Parent agreed to extend the agreement through March 31, 2018, lower the facility to $750 million and reduce the fee on undrawn amounts to 0.5%. The Company made repayments of $90.8 million, $50.3 million and $21.0 million during the years ended December 31, 2013, 2012 and 2011, respectively. In connection with and immediately preceding the Company's initial public offering, the Parent intends to refinance and reissue this debt into a subsidiary of the Company which will result in its elimination upon consolidation.
Intercompany interest expense amounted to $72.2 million, $84.1 million and $74.2 million for the years ended December 31, 2013, 2012 and 2011 respectively. The weighted average interest rate on all debt obligations, excluding consolidated OMAM funds, was 6.53%, 7.30% and 7.16% in each of 2013, 2012 and 2011, respectively.
F-38
Old Mutual Asset Management
Notes to Consolidated Financial Statements (Continued)
13) Borrowings and Debt (Continued)
Borrowings and debt of consolidated Funds
The long term debt of the Company's consolidated Funds was comprised of the following at December 31 (in millions):
| (in millions) |
2013 | 2012 | Interest rate | Maturity | ||||||
|---|---|---|---|---|---|---|---|---|---|---|
Related party obligations: |
||||||||||
Promissory note |
$ | 265.0 | $ | 265.0 | 4.00% | August 2019 | ||||
Shareholder loans and note interest |
339.7 | 397.6 | BBSW* + 5.5% | October 2022 | ||||||
Third party obligations: |
||||||||||
Term loan A |
163.0 | 163.0 | 6% - 6.26% | May 2016 | ||||||
Term loan B |
261.5 | 288.3 | 5.93% - LIBOR + 1.61% | October, 2016 | ||||||
Revolving loan A |
— | — | N/A | May 2016 | ||||||
Revolving loan B |
— | 2.2 | LIBOR + 2.0% | October 2016 | ||||||
Senior secured notes |
860.0 | 860.0 | 6.19% - 6.38% | December 2019 | ||||||
Secured bank loan |
115.4 | 135.0 | variable | October 2017 | ||||||
Notes payable |
2,383.2 | 2,383.2 | LIBOR + margin | October 2027 | ||||||
| | | | | | | | | | | |
Total third party obligations: |
3,783.1 | 3,831.7 | ||||||||
| | | | | | | | | | | |
Total long term debt of consolidated Funds |
$ | 4,387.8 | $ | 4,494.3 | ||||||
| | | | | | | | | | | |
| | | | | | | | | | | |
- *
- BBSW refers to the Australian Bank-Bill Reference Rate
The fair value of borrowings was approximately $4,600.3 million as of December 31, 2013. Fair value was determined based on future cash flows, discounted to present value using current market rates. The inputs are categorized as level 3 in the fair value hierarchy, as defined in Note 4, "Fair Value Measurements".
Related Party Obligations
Promissory note
A Fund consolidated by the Company has borrowed $265.0 million on a ten-year, $269.0 million Promissory Note, secured by Deeds of Trust, from a Fund's common limited partner. Interest payments are due annually. The Fund records interest expense using the effective-interest method, which is different from the contractual rate, taking into consideration an increase from 4% to 11% that goes into effect from August 2014.
Shareholder loans and note interest
A Fund consolidated by the Company has borrowed $339.7 million from a related party. The note is collateralized by assets of the Fund. Interest accrues at an annual rate of BBSW plus a margin of 5.5% and is due to mature in October 2022.
Third Party Obligations
Term loan A
Term Loan A is collateralized by a consolidated Fund's assets and contains various restrictive covenants which limit the incurrence of additional indebtedness and require the Fund to maintain minimum amounts of interest coverage and earnings before interest, taxes, depreciation, depletion and
F-39
Old Mutual Asset Management
Notes to Consolidated Financial Statements (Continued)
13) Borrowings and Debt (Continued)
amortization ("EBITDDA"). The loan is comprised of three tranches totaling $163.0 million. Interest accrues at fixed rates between 5.875% and 6.135% per annum among the tranches, but is subject to an increase of 0.125% upon certain events. The rate of interest for the three tranches was between 6.0% and 6.26% for each of the years ended December 31, 2013 and 2012. Interest is payable semi-annually in arrears. The loan requires no principal payment until maturity in May 2016, except for prepayment requirements upon certain events.
Term loan B
Term loan B is collateralized by a consolidated Fund's assets, and contains various restrictive covenants, which limit the incurrence of additional indebtedness and require the fund to maintain minimum amounts of interest coverage and EBITDDA. The first tranche of $259.0 million has a fixed interest rate of 5.93% per annum, but is subject to an increase of 0.25% upon certain events. The second tranche of $2.5 million has a variable rate of LIBOR plus an applicable margin, which was set at a rate of 1.61% for the year ended December 31, 2013 and 1.69% for the year ended December 31, 2012. Interest is payable semi-annually in arrears. The loan requires no principal payment until maturity in October 2016, except for prepayment requirements upon certain events.
Revolving loan A
The $5.0 million facility is collateralized by a consolidated Fund's assets, and contains various restrictive covenants, which limit the incurrence of additional indebtedness and require the Fund to maintain minimum amounts of interest coverage and EBITDDA. As of December 31, 2013, 2012 and 2011, the Fund had no outstanding borrowings under this facility, and no interest was paid in any year. Proceeds from the loan must be used for working capital and other general corporate purposes within the Fund.
Revolving loan B
The $2.2 million facility is collateralized by a consolidated Fund's assets, and contains various restrictive covenants, which limit the incurrence of additional indebtedness and require the fund to maintain minimum amounts of interest coverage and EBITDDA. As of December 31, 2013 and 2012 the Fund has outstanding borrowings of $0 million and $2.2 million under this facility, respectively. Interest is variable at LIBOR plus 2.0% per annum, subject to an increase of 0.25% upon certain events. Interest is payable at the end of the month following each quarter end, in arrears. Proceeds from the loan must be used for working capital and other general corporate purposes within the fund. The loan requires no principal payment until maturity in October 2016.
Senior secured notes
The total loan commitment of $860 million across five tranches is collateralized by a consolidated Fund's assets, and contains various restrictive covenants that limited the incurrence of additional indebtedness and required the Fund to maintain minimum amounts of interest coverage and EBITDDA. The rate of interest on each individual note is fixed, subject to an increase of 0.25% upon certain events. The rate of interest for the three tranches was between 6.19% and 6.38% for each of the years ended December 31, 2013 and 2012. Interest is payable semi-annually. The loan requires principal payments of the five tranches in order from December 2014 to December 2019.
F-40
Old Mutual Asset Management
Notes to Consolidated Financial Statements (Continued)
13) Borrowings and Debt (Continued)
Secured bank loan
A Fund consolidated by the Company has borrowed $115.4 million through a secured bank loan which is collateralized by the Fund's assets. Interest accrues at a variable rate and the loan is due to mature in October 2017.
Notes payable
A Fund consolidated by the Company issued notes in the amount of $2,383.2 million at December 31, 2013 and 2012. Interest on the notes, based on LIBOR plus a margin, is payable quarterly and reset at the same time. A letter of credit was issued to the third-party by four separate banks as security for the notes. The notes are due October 2027. The note payable is secured by restricted cash contributed by the limited partners of the Fund.
Total interest expense recognized in relation to debt from consolidated Funds during the years ended December 31, 2013, 2012 and 2011 respectively, was $149.3 million, $127.2 million and $119.6 million.
As of December 31, 2013, the aggregate maturities of debt commitments, based on their contractual terms, are as follows:
| |
Long term debt of OMAM |
Long term debt of consoldiated Funds |
Future minimum debt commitments |
|||||||
|---|---|---|---|---|---|---|---|---|---|---|
2014 |
$ | 2.5 | $ | — | $ | 2.5 | ||||
2015 |
900.0 | 20.0 | 920.0 | |||||||
2016 |
— | 444.5 | 444.5 | |||||||
2017 |
— | 80.0 | 80.0 | |||||||
2018 |
140.7 | 75.0 | 215.7 | |||||||
Thereafter |
— | 3,768.3 | 3,768.3 | |||||||
| | | | | | | | | | | |
Total |
$ | 1,043.2 | $ | 4,387.8 | $ | 5,431.0 | ||||
| | | | | | | | | | | |
| | | | | | | | | | | |
The Company and its consolidated Funds are not in default with the required covenants related to borrowings and debt facilities.
F-41
Old Mutual Asset Management
Notes to Consolidated Financial Statements (Continued)
14) Income Taxes
The components of income tax expense (benefit) from continuing operations for the years ended December 31 are as follows (in millions):
| |
2013 | 2012 | 2011 | |||||||
|---|---|---|---|---|---|---|---|---|---|---|
Current: |
||||||||||
Federal |
$ | — | $ | — | $ | — | ||||
State |
4.5 | (8.0 | ) | (6.8 | ) | |||||
Foreign |
0.5 | 0.6 | 0.4 | |||||||
| | | | | | | | | | | |
Total current |
5.0 | (7.4 | ) | (6.4 | ) | |||||
| | | | | | | | | | | |
Deferred: |
||||||||||
Federal |
12.0 | 20.6 | 16.3 | |||||||
State |
(3.9 | ) | (10.8 | ) | (13.3 | ) | ||||
Foreign |
0.2 | 0.9 | (0.8 | ) | ||||||
| | | | | | | | | | | |
Total deferred |
8.3 | 10.7 | 2.2 | |||||||
| | | | | | | | | | | |
Total tax expense |
$ | 13.3 | $ | 3.3 | $ | (4.2 | ) | |||
| | | | | | | | | | | |
| | | | | | | | | | | |
Income tax expense (benefits) of $5.2 million, $(3.7) million and $(6.3) million in the years ended December 31, 2013, 2012 and 2011, respectively, are included in discontinued operations. Income tax expense (benefits) of $(2.3) million, $7.7 million and $(19.3) million in the years ended December 31, 2013, 2012 and 2011, respectively, are included in gain (loss) on disposal of discontinued operations.
The provision for income taxes in 2013, 2012 and 2011 included benefits of $33.8 million, $23.9 million and $10.9 million, respectively, related to the utilization of net operating loss carryforwards.
Due to the use of federal net operating loss carry forwards and an election pursuant to Internal Revenue Code § 172(b)(1)(H), the Company's current federal tax liability for the years ended December 31, 2013, 2012 and 2011 was reduced to zero.
F-42
Old Mutual Asset Management
Notes to Consolidated Financial Statements (Continued)
14) Income Taxes (Continued)
The reconciliation of the difference between the Company's U.S. Federal statutory income tax rate and the effective income tax rate for continuing operations for the years ended December 31 is as follows:
| |
For the years ended December 31, |
|||||||||
|---|---|---|---|---|---|---|---|---|---|---|
| |
2013 | 2012 | 2011 | |||||||
Tax at U.S. federal statutory income tax rate |
35.0 | % | 35.0 | % | 35.0 | % | ||||
State income taxes, net of federal benefit |
(2.7 | )% | (3.1 | )% | (2.1 | )% | ||||
Non-deductible expenses |
(0.1 | )% | — | (0.4 | )% | |||||
Dividends from foreign subsidiaries |
— | (0.5 | )% | (1.5 | )% | |||||
Parent company expense carve-out adjustment |
(1.4 | )% | (2.1 | )% | (1.5 | )% | ||||
IPO preparation costs |
— | (0.3 | )% | (3.8 | )% | |||||
Adjustment to liabilities for uncertain tax positions |
1.3 | % | 19.6 | % | 0.9 | % | ||||
Change in valuation allowance |
1.0 | % | 2.5 | % | 17.5 | % | ||||
Effect of foreign operations |
0.7 | % | 1.1 | % | (0.9 | )% | ||||
Effect of changes in tax law, rates |
(1.6 | )% | (0.1 | )% | (0.1 | )% | ||||
Effect of income from non-controlling interest |
(48.6 | )% | (55.5 | )% | (45.6 | )% | ||||
Adjustments to deferred tax assets |
0.5 | % | (3.7 | )% | 3.8 | % | ||||
State tax refund claim received |
— | — | 4.7 | % | ||||||
Other |
— | — | (0.3 | )% | ||||||
| | | | | | | | | | | |
|
(15.9 | )% | (7.1 | )% | 5.7 | % | ||||
| | | | | | | | | | | |
| | | | | | | | | | | |
During 2011, the Company removed $11.5 million of its valuation allowance against Massachusetts deferred tax assets following new state tax legislation enacted which increased the net operating loss carryforward period from 5 to 20 years and allows net operating losses generated in 2009 and thereafter to be shared among unitary group members. The Company continues to maintain a valuation allowance against a portion of its Massachusetts net operating losses generated prior to 2009, however $13.1 million of the net operating loss carryforwards and the valuation allowance were written off in 2011 due to the expiration of the statute.
In 2013, 2012, and 2011 the Company received dividends from foreign operations for which the benefit from foreign tax credits will not be realized.
In general, it is the practice and intention of the Company to reinvest earnings of its non-U.S. subsidiaries in those operations. The Company's foreign unremitted earnings that are indefinitely reinvested are estimated to be $10.5 million at December 31, 2013. It is not practicable to estimate the amount of deferred tax liability related to investments in these foreign subsidiaries. At December 31, 2013, the Company has recorded deferred tax liabilities in the amount of $0.4 million for additional tax on unremitted earnings of certain non-U.S. subsidiaries that have regularly remitted earnings, and that are expected to in the foreseeable future.
Deferred tax assets and liabilities reflect the expected future tax consequences of temporary differences between the book carrying amounts and tax bases of the Company's assets and liabilities.
F-43
Old Mutual Asset Management
Notes to Consolidated Financial Statements (Continued)
14) Income Taxes (Continued)
The significant components of deferred tax assets and deferred tax liabilities for the years ended December 31 are as follows (in millions):
| |
2013 | 2012 | |||||
|---|---|---|---|---|---|---|---|
Deferred Tax Assets: |
|||||||
Interest expense |
$ | 193.3 | $ | 211.0 | |||
Federal net operating loss |
12.8 | 44.7 | |||||
State net operating loss carry forwards |
28.4 | 34.4 | |||||
Investment partnerships |
82.7 | 45.7 | |||||
Foreign tax credit carry forwards |
6.4 | 6.4 | |||||
Intangible assets |
3.4 | 4.3 | |||||
Employee compensation |
4.7 | 3.5 | |||||
Other |
8.8 | 7.9 | |||||
| | | | | | | | |
Total deferred tax assets |
340.5 | 357.9 | |||||
Valuation allowance |
(45.9 | ) | (52.7 | ) | |||
| | | | | | | | |
Deferred tax assets, net of valuation allowance |
294.6 | 305.2 | |||||
| | | | | | | | |
Deferred Tax Liabilities: |
|||||||
Undistributed earnings of subsidiaries |
0.4 | 3.0 | |||||
| | | | | | | | |
Net Deferred Tax Asset |
$ | 294.2 | $ | 302.2 | |||
| | | | | | | | |
| | | | | | | | |
At December 31, 2013, the Company has tax attributes that carry forward for varying periods. The Company's federal net operating loss carryforward of $30.1 million predominately originated during 2007 and 2008 and will expire over a 12 to 16 year period. State net operating losses of $539.1 million expire over a 2 to 16-year period. In 2012, the Company established a full valuation allowance of $12.1 million against the federal net operating loss carryforwards of Skandia America Corporation, a newly acquired company, as they are limited on an annual basis under Internal Revenue Code Section 382. The Company has recorded a valuation allowance in connection with state net operating loss carryforwards and foreign tax credit carryforwards for which the Company believes it is more likely than not that the tax benefits will not be recognized. In evaluating the Company's ability to recover its deferred tax assets, the Company considers all available positive and negative evidence including the existence of cumulative income in the most recent fiscal years, changes in the business in which the Company operates, and the Company's ability to forecast future taxable income. The weight given to the evidence is commensurate with the extent to which it can be objectively verified. The more negative evidence that exists, the more positive evidence is necessary and the more difficult it is to support a conclusion that a valuation allowance is not needed. The Company has cumulative earnings as of December 31, 2013, 2012 and 2011 and the existing levels of pre-tax income are sufficient to realize the Company's deferred tax assets. As of December 31, 2013, management believes it is more likely than not that the balance of the deferred tax assets will be realized based on the generation of sufficient taxable income before their expiration.
F-44
Old Mutual Asset Management
Notes to Consolidated Financial Statements (Continued)
14) Income Taxes (Continued)
A reconciliation of the change in gross unrecognized tax benefits for the years ended December 31 is as follows (in millions):
| |
2013 | 2012 | 2011 | |||||||
|---|---|---|---|---|---|---|---|---|---|---|
Balance as of January 1 |
$ | 106.2 | $ | 119.7 | $ | 122.9 | ||||
Additions based on tax positions of prior years |
0.1 | 0.5 | 0.7 | |||||||
Reductions for tax provisions of prior years |
(6.9 | ) | — | (2.1 | ) | |||||
Reductions related to lapses of statutes of limitations |
(2.2 | ) | (13.8 | ) | (2.0 | ) | ||||
Settlements |
— | (0.2 | ) | — | ||||||
Additions based on tax positions related to current year |
— | — | 0.2 | |||||||
| | | | | | | | | | | |
Balance as of December 31 |
$ | 97.2 | $ | 106.2 | $ | 119.7 | ||||
| | | | | | | | | | | |
| | | | | | | | | | | |
The Company's liability for uncertain tax positions includes benefits of $94.4 million, $100.3 million and $109.2 million at December 31, 2013, 2012, and 2011, that if recognized would affect the effective tax rate on income from continuing operations.
The Company recognized $(0.2) million, $0.2 million, and $0.4 million in interest and penalties in its income tax provision for the years ended December 31, 2013, 2012, and 2011, respectively.
The Company recognizes accrued interest and penalties relating to unrecognized tax benefits as income tax expense. The Company's liability for uncertain tax benefits at December 31, 2013, 2012, and 2011 includes accrued interest and penalties of $4.0 million, $4.2 million and $4.0 million respectively.
The Company believes that it is reasonably possible that a decrease of up to $0.8 million in unrecognized tax benefits relating to the Company's state tax exposures may be necessary within the next 12 months, as the result of a lapse of statute of limitations.
The Company is periodically under examination by various taxing authorities. The Company has paid all assessments relating to closed examinations.
The Company and its subsidiaries file tax returns in U.S. federal, state, local, and foreign jurisdictions. As of December 31, 2013, the Company is generally no longer subject to income tax examinations by U.S. federal, state, local, or foreign tax authorities for calendar years prior to 2007.
15) Commitments and Contingencies
Operational commitments
As of December 31, 2012, the Company had maximum potential contingent acquisition payment obligations of $11.0 million related to the acquisition of an Affiliate in a prior period. As a result of specific hurdles being met during 2014 and following a restructuring this amount has now been settled in full.
Certain Affiliates operate under regulatory authorities that require that they maintain minimum financial or capital requirements. Management is not aware of any violations of such financial requirements occurring during the period.
F-45
Old Mutual Asset Management
Notes to Consolidated Financial Statements (Continued)
15) Commitments and Contingencies (Continued)
Litigation
The Company and its Affiliates may be subject to claims, legal proceedings and other contingencies in the ordinary course of their business activities. Each of these matters is subject to various uncertainties, and it is possible that some of these matters may be resolved in a manner unfavorable to the Company or its Affiliates. The Company and its Affiliates establish accruals for matters for which the outcome is probable and can be reasonably estimated. Management believes that any liability in excess of these accruals upon the ultimate resolution of these matters will not have a material adverse effect on the Consolidated Financial Statements or results of operations of the Company. As of December 31, 2013, there were no accruals for claims, legal proceedings or other contingencies.
Indemnifications
In the normal course of business, such as through agreements to enter into business combinations and divestitures of Affiliates, the Company may enter into contracts that contain a variety of representations and warranties and which provide general indemnifications. The Company's maximum exposure under these arrangements is unknown, as this would involve future claims that may be made against the Company that have not yet occurred.
Concentrations of credit risk
Financial instruments that potentially subject the Company to significant concentrations of credit risk consist principally of cash investments. The Company maintains cash and cash equivalents and short term investments with various financial institutions. These financial institutions are typically located in cities in which the Company and its Affiliates operate. For the Company and certain Affiliates, cash deposits at a financial institution may exceed Federal Deposit Insurance Corporation insurance limits.
16) Employee Benefits
The Company has various defined contribution plans covering substantially all of its full-time employees and several of its Affiliates. In addition to pre-tax contributions made by employees, the Company also makes contributions to the qualified plans annually.
The Company also has non-qualified defined contribution plans covering certain senior employees. The Company has established a Deferred Compensation Plan under which the Board of Directors makes awards that may be invested by the recipient in investments deemed available under the plan. Vesting of awards under the Deferred Compensation Plan is based on the number of years of service already provided by the employee at the date of the grant. In addition, the Company has established a Voluntary Deferral Plan that provides officers of the Company the opportunity to voluntarily defer a portion of their compensation. The compensation deferred is deemed to be invested in one or more investment options available under the plan. These non-qualified plans are unfunded, although the Company does make contributions to a Rabbi Trust to hedge its risks in terms of providing returns to employees on their deemed investments held in the plan.
F-46
Old Mutual Asset Management
Notes to Consolidated Financial Statements (Continued)
16) Employee Benefits (Continued)
As of December 31, 2013, and 2012, a total of $51.2 million and $41.4 million, respectively, had been recorded as other non-current liabilities and a total of $51.4 million and $41.3 million, respectively, had been invested under the Deferred Compensation and Voluntary Deferral plans. The Company recorded total expenses in relation to its qualified and non-qualified plans within compensation and benefits in its Consolidated Statements of Operations for the years ended December 31, 2013, 2012 and 2011 of $8.7 million, $6.5 million and $7.7 million, respectively.
17) Equity-based Compensation
Cash-settled Affiliate awards
The Company has entered into compensation arrangements with several of its Affiliates whereby in exchange for continued service, Affiliate equity is either purchased by or granted to Affiliate key employees subject to a limit imposed by the Company, and may be repurchased either by Affiliate key employees or by the Company at a future date at the then applicable fair value, subject to service requirements having been met. Compensation expense is recognized over the requisite service period equal to the cumulative vested fair value of the award at the end of each period up to vesting date. The Company accounts for these arrangements as "cash settled" share based payments, and accordingly a corresponding share-based payments liability is recorded. Vested share-based payments liabilities are revalued at each period end until settlement date, with changes in the liabilities included within compensation expense.
The following table presents the changes in share-based payments liability for the years ended December 31 (in millions):
| |
2013 | 2012 | 2011 | |||||||
|---|---|---|---|---|---|---|---|---|---|---|
Balance, beginning of period |
$ | 65.8 | $ | 47.3 | $ | 38.4 | ||||
Amortization and revaluation of granted awards |
30.0 | 19.1 | 12.8 | |||||||
Reclassification of modified equity-settled award |
0.9 | 3.6 | 2.7 | |||||||
Purchases by Affiliate employees |
— | — | 0.3 | |||||||
Affiliate disposals |
— | (2.4 | ) | — | ||||||
Repurchases by OMAM (cash settled) |
(10.7 | ) | (1.8 | ) | (6.9 | ) | ||||
| | | | | | | | | | | |
Balance, end of period |
$ | 86.0 | $ | 65.8 | $ | 47.3 | ||||
| | | | | | | | | | | |
| | | | | | | | | | | |
The amount of unrecognized compensation expense in relation to non-vested cash-settled equity interests as of December 31, 2013 is $2.5 million, and will be expensed as follows (in millions):
2014 |
$ | 0.8 | ||
2015 |
0.8 | |||
2016 |
0.9 | |||
2017 |
— | |||
2018 |
— | |||
| | | | | |
Total |
$ | 2.5 | ||
| | | | | |
| | | | | |
F-47
Old Mutual Asset Management
Notes to Consolidated Financial Statements (Continued)
17) Equity-based Compensation (Continued)
Equity-settled Affiliate awards
Class B equity interests in Acadian Asset Management ("AAM") were acquired by employees during 2007 entitling the participating employees to 28.57% of the earnings of AAM in excess of the Company's Class A equity interest minimum preference, and to a liquidation preference proportionate to their shareholding. In consideration for the equity acquired, the participating employees agreed to forego a portion of existing long-term incentive payments owed. The difference between the carrying amount of this consideration and the fair value of the interest acquired was treated as share-based compensation expense. Fair value was determined based on the discounted projected future cash flows of AAM, amounting to $42.5 million at the grant date.
Effective April 1, 2011, certain terms of the plan were modified to provide for greater participation by Class B interest holders in Acadian's profits and cash distributions. In addition, provisions were added to provide greater liquidity and transferability to the holders of Class B interests. The plan was also amended to include a feature whereby participating employees may redeem their equity based on a multiple of prior twelve-month earnings above a Class A equity holders' minimum preference amount, subject to certain restrictions. The surrender-date fair value of the Class B interests prior to these modifications amounted to $7.2 million, and this amount has been reclassified from non-controlling interests to cash-settled share-based payments liabilities as a result of the liquidity features added. For the years ending December 31, 2013, 2012 and 2011, $0.9 million, $3.6 million and $2.7 million were reclassified, respectively. The excess of the fair value of the modified award over its pre-modification fair value was $21.1 million and was accounted for as incremental cash-settled share-based payments compensation expense and liability. As the implementation of the modifications were subject to a two year vesting period, the incremental cash-settled share-based payments compensation expense and subsequent revaluations of the liability to its fair value each period, along with the reclassification of the $7.2 million pre-modification fair value of the award from non-controlling interests as a liability is being recognized ratably over that period commencing April 1, 2011. The remaining $35.3 million of the initial fair value of the equity-settled plan that was surrendered by Class B interest holders was transferred from non-controlling interests to the parent equity (deficit) at the modification date.
Equity-settled corporate awards
Old Mutual plc, the Company's Parent, maintains various equity-based compensation arrangements, including stock options and restricted stock awards, in which the Company's employees participated in the periods presented. The cost of these equity-based programs has been included in the Company's financial results where applicable. Compensation expense recognized by the Company in respect of these arrangements was $5.0 million for the year ended December 31, 2013; $2.9 million for the year ended December 31, 2012 and $3.0 million for the year ended December 31, 2011. A corresponding capital contribution was recognized in each period. The related income tax benefit recognized for the years ended December 31, 2013, 2012 and 2011 was $1.8 million, $0.8 million, and $1.1 million, respectively.
The following disclosures represent the Company's portion of the various equity compensation arrangements maintained by the Parent in which the Company's employees participated.
F-48
Old Mutual Asset Management
Notes to Consolidated Financial Statements (Continued)
17) Equity-based Compensation (Continued)
Options for shares in Old Mutual plc traded on the London Stock Exchange
An Affiliate of the Company subsequently classified as held for sale participated in a plan featuring options over Old Mutual plc shares. Shares granted during the years ended December 31, 2013, 2012 and 2011 were 93,410, 176,240 and 99,131, respectively. Shares outstanding at December 31, 2013, 2012 and 2011 were 437,999, 444,299 and 930,718, respectively. Shares exercisable at December 31, 2013, 2012 and 2011 were 0, 45,749 and 10,522, respectively.
The options outstanding at December 31, 2013 have an exercise price in the range of $0.58 to $2.55 (2012: $0.57 to $2.03) and a weighted average remaining contractual life of 1.2 years (2012: 1.4 years). The weighted average share price at date of exercise for options exercised during the year was $0.94 and $0.56 at December 31, 2013 and 2012, respectively. At December 31, 2013, the weighted average exercise price was $1.96. The Company recognized expense in connection with the exercise of options of $0.1 million, $0.1 million and $0 for the years ended December 31, 2013, 2012 and 2011, respectively.
The estimated fair value of options awarded was $0.1 million in each of the years ended December 31, 2013, 2012 and 2011. The fair value of services received in return for share options granted are measured by reference to the fair value of share options granted. The estimate of the fair value of share options granted is measured using a Black-Scholes option pricing model.
Grants of restricted shares in Old Mutual plc traded on the London Stock Exchange
The following summarizes the grant date fair value of restricted shares granted by the Company in the years ended December 31:
| |
2013 | 2012 | 2011 | |||||||
|---|---|---|---|---|---|---|---|---|---|---|
Shares granted during the year |
1,996,967 | 1,682,389 | 1,513,612 | |||||||
Weighted average grant date fair value per share GBP |
£ | 1.94 | £ | 1.57 | £ | 1.45 | ||||
Weighted average grant date fair value per share USD |
$ | 3.03 | $ | 2.49 | $ | 2.33 | ||||
The grant date fair value per share, calculated based on the closing share price as quoted on the London Stock Exchange on the measurement date, was used to determine the fair value of restricted shares granted to employees. There is a mechanism at Old Mutual plc to ensure sufficient shares are available under the plan each year for grants issued. Restricted shares under the plan generally have a vesting period of three years. Expected dividends were not incorporated into the measurement of fair value where the holder of the restricted share is entitled to dividends throughout the vesting period.
F-49
Old Mutual Asset Management
Notes to Consolidated Financial Statements (Continued)
17) Equity-based Compensation (Continued)
The following table summarizes the activity related to restricted shares.
| |
2013 | 2012 | 2011 | |||||||||||||||||||||||||
|---|---|---|---|---|---|---|---|---|---|---|---|---|---|---|---|---|---|---|---|---|---|---|---|---|---|---|---|---|
| |
Number of restricted shares |
Weighted average grant date fair value per share GBP |
Weighted average grant date fair value per share USD |
Number of restricted shares |
Weighted average grant date fair value per share GBP |
Weighted average grant date fair value per share USD |
Number of restricted shares |
Weighted average grant date fair value per share GBP |
Weighted average grant date fair value per share USD |
|||||||||||||||||||
Outstanding at beginning of the year |
2,888,925 | £1.47 | $ | 2.30 | 3,103,308 | £1.03 | $ | 1.63 | 5,529,733 | £0.96 | $ | 1.54 | ||||||||||||||||
Granted during the year |
1,996,967 | 1.94 | 3.03 | 1,682,389 | 1.57 | 2.49 | 1,513,612 | 1.45 | 2.33 | |||||||||||||||||||
Forfeited during the year |
(64,778 | ) | 1.51 | 2.36 | — | — | — | — | — | — | ||||||||||||||||||
Exercised during the year |
(543,708 | ) | 1.25 | 1.95 | (1,882,278 | ) | 0.88 | 1.40 | (3,764,702 | ) | 1.10 | 1.77 | ||||||||||||||||
Expired during the year |
— | — | — | (34,190 | ) | 1.31 | 2.00 | (175,335 | ) | 1.04 | 1.67 | |||||||||||||||||
Other transfers |
(322,872 | ) | — | — | 19,696 | n/a | — | — | n/a | — | ||||||||||||||||||
| | | | | | | | | | | | | | | | | | | | | | | | | | | | | |
Outstanding at end of the year |
3,954,534 | £1.73 | $ | 2.70 | 2,888,925 | £1.47 | $ | 2.33 | 3,103,308 | £1.03 | $ | 1.66 | ||||||||||||||||
| | | | | | | | | | | | | | | | | | | | | | | | | | | | | |
| | | | | | | | | | | | | | | | | | | | | | | | | | | | | |
The grant date for the annual awards is deemed to be January 1 in the year prior to the date of issue. As such the Company is required to estimate, at the reporting date, the number and fair value of the options that will be granted in the following year. The fair value of awards expected to be granted in 2014 which will have a grant date of January 1 2013, is $7.1 million, consisting of an estimated 2,321,987 shares. The fair value of awards granted in 2013 with a grant date of January 1, 2012 was $6.1 million, consisting of 1,996,967 shares. The fair value of awards granted in 2012 with a grant date of January 1, 2011 was $4.2 million, consisting of 1,682,389 shares.
Cash-settled corporate awards
During 2011, an equity-based compensation plan was implemented for certain Affiliate key employees of OMAM in connection with the stated intention of exploring a potential initial public offering ("IPO") of the business. The plan is designed to reward participants for achievement of strategic objectives and metrics and value creation over the period leading up to an initial public offering, should one proceed. The awards consist of a mix of cash, payable at completion of an IPO, and restricted shares in the newly-listed U.S. entity, which would be granted upon completion of an IPO and vest ratably over three years from that date. Should an IPO not proceed before the plan termination date of December 31, 2013, the awards will be paid out in cash and grants of restricted shares in Old Mutual plc. The value and quantity of the cash and share portions of the awards will vary until an IPO is completed or the plan is terminated, depending on the achievement of performance objectives, financial targets and potential IPO proceeds. Accordingly, the awards are currently accounted for as a share-based payment liability, recognized over the vesting period and revalued at each period end for projected results of the performance conditions, with fair value-measured using a Monte Carlo simulation. The expense recognized during the years ended December 31, 2013, 2012 and 2011 in relation to this plan was $3.8 million, $2.4 million and $1.3 million, respectively, and the corresponding liability recorded at December 31, was $7.0 million, and $3.4 million in 2013 and 2012, respectively. The amount of unrecognized expense as of December 31, 2013 was $1.8 million, which will be recognized over 2014–2016 at $0.6 million per annum. The total income tax benefit recognized in
F-50
Old Mutual Asset Management
Notes to Consolidated Financial Statements (Continued)
17) Equity-based Compensation (Continued)
relation to this plan for the years ended December 31, 2013, 2012 and 2011 was $1.6 million, $0.9 million, and $0.5 million, respectively.
18) Accumulated Other Comprehensive Income
The components of accumulated other comprehensive income at December 31, were as follows (in millions):
| |
2013 | 2012 | 2011 | |||||||
|---|---|---|---|---|---|---|---|---|---|---|
Foreign currency translation including proportion attributable to non-controlling interests |
$ | (17.9 | ) | $ | 1.2 | — | ||||
19) Non-controlling interests
Net income from continuing operations attributable to non-controlling interests in the Consolidated Statements of Operations is comprised of the income allocated to equity-holders of consolidated Affiliates, other than OMAM. Non-controlling interests on the Consolidated Balance Sheets includes capital and undistributed profits attributable to those equity holders, which amounted to $0.1 million at December 31, 2013, $0.9 million at December 31, 2012 and $4.5 million at December 31, 2011.
As described in Note 17, during the third quarter of 2011, the Company modified the terms then in place of the equity-based compensation arrangement at an Affiliate. The arrangement, which was previously accounted for as a fully vested, equity-settled scheme valued at $42.5 million within non-controlling interests in the Consolidated Balance Sheet, was modified to a cash-settled scheme, subject to two years of additional vesting commencing from the fourth quarter of 2011. The fair value of the previously equity-settled scheme at the modification date was determined to be $7.2 million, and this amount is being re-classified from non-controlling interests to share-based payments liabilities ratably over the incremental two year vesting period. The forfeited value of the previously equity-settled scheme at modification date was $35.3 million, and this amount was reclassified from non-controlling interests to Parent equity (deficit) at the modification date.
Non-controlling interests in consolidated Funds
Net loss from continuing operations attributable to non-controlling interests in consolidated Funds in the Consolidated Statements of Operations is comprised of the net income or loss and net gains and losses allocated to equity-holders, other than OMAM, of consolidated Funds. For the years ended December 31, 2013, 2012 and 2011, this net loss was $122.3 million, $69.2 million, and $101.5 million, respectively. Non-controlling interests in consolidated Funds on the Consolidated Balance Sheets represents the share of net assets of the funds attributable to those equity holders who are restricted in their ability to redeem their interests, which amounted to $2,579.3 million at December 31, 2013, and $2,824.4 million at December 31, 2012.
Redeemable non-controlling interests in consolidated Funds on the Consolidated Balance Sheets represents the share of net assets of the Funds attributable to those equity holders who are not restricted in their ability to redeem their interests, which amounted to $403.3 million at December 31, 2013, and $88.9 million at December 31, 2012.
F-51
Old Mutual Asset Management
Notes to Consolidated Financial Statements (Continued)
20) Funds' Derivatives and Hedging
The Company enters into the following types of derivatives:
Forward foreign currency exchange contracts: The Funds are subject to foreign currency exchange rate risk in the normal course of pursuing their investment objectives. A forward foreign currency exchange contract is an agreement between two parties to purchase or sell a specific currency for an agreed-upon price at a future date. The Funds enter into forward foreign currency exchange contracts to facilitate transactions in foreign-denominated securities and to attempt to minimize the risk to the Funds from adverse changes in the relationship between currencies. Forward foreign currency exchange contracts are recorded at the forward rate and marked-to-market daily. When the contracts are closed, realized gains and losses arising from such transactions are recorded as realized gains or losses on foreign currency transactions. The Funds could be exposed to risks if the counterparties to the contracts are unable to meet the terms of their contracts or if the value of the foreign currency changes unfavorably. The Funds maximum risk of loss from counterparty credit risk is the unrealized gains or losses on the contracts. This risk is mitigated by having a master netting arrangement between the Funds and the counterparty.
Credit default swaps: The Funds are subject to credit risk in the normal course of pursuing their investment objectives. The Funds entered into credit default swaps to manage its exposure to the market or certain sectors of the market, to reduce its risk exposure to defaults of corporate and sovereign issuers, or to create exposure to corporate or sovereign issuers to which they are not otherwise exposed. Credit default swaps involve the exchange of a fixed rate premium for protection against the loss in value of an underlying security in the event of a defined credit event, such as payment default or bankruptcy. Under a credit default swap one party acts as a guarantor by receiving the fixed periodic payment in exchange for the commitment to purchase the underlying security at par if the defined credit event occurs. Upon the occurrence of a defined credit event, the difference between the value of the reference obligation and the swaps notional amount is recorded as realized gain (for protection written) or loss (for protection sold) on swap transactions in the consolidated statement of operations. The Funds maximum risk of loss from counterparty risk, either as the protection seller or as the protection buyer, is the fair value of the contract. This risk is mitigated by having a master netting arrangement between the fund and the counterparty and by the posting of collateral by the counterparty to the Funds to cover the Funds exposure to the counterparty.
Interest rate swaps: The Funds are subject to interest rate risk exposure in the normal course of pursuing its investment objectives. Because the Funds hold fixed rate bonds, the value of these bonds may decrease if interest rates rise. To help hedge against this risk and to maintain their ability to generate income at prevailing market rates, the Funds entered into interest rate swap contracts. Interest rate swaps are agreements between two parties to exchange cash flows based on a notional principal amount. The Funds may elect to pay a fixed rate and receive a floating rate, or receive a fixed rate and pay a floating rate on a notional principal amount. The net interest received or paid on interest rate swap agreements is recorded as realized gains or losses. Interest rate swaps are marked to market daily based upon quotations from the market makers and the change, if any, is recorded as an unrealized gain or loss in the consolidated statement of operations. When the swap contract is terminated earlier, the Funds record a realized gain or loss equal to the difference between the current realized value and the expected cash flows. The risk of interest rate swaps include changes in market conditions will affect the value of the contract or the cash flows and the possible inability of the counterparty to fulfill its obligations under the agreement. The Funds maximum risk of loss from counterparty credit risk is the
F-52
Old Mutual Asset Management
Notes to Consolidated Financial Statements (Continued)
20) Funds' Derivatives and Hedging (Continued)
discounted net value of the cash flows to be received from the counterparty over the contracts remaining life, to the extent that that amount is positive. The risk is mitigated by having a master netting arrangement between the Funds and the counterparty and by the posting of collateral by the counterparty to the Funds to cover the Funds exposure to the counterparty.
Financial futures contracts: Certain of the Funds may enter into futures contracts for liquidity and hedging purposes. The potential risk to the Funds is that the change in value of futures contracts may not correspond to the change in value of the hedged instruments. In addition, losses may arise from changes in the value of the underlying instruments, if there is an illiquid secondary market for the contracts, or if the counterparty to the contract is unable to perform. Risks may exceed amounts recognized on the consolidated balance sheet. When the contract is closed, the Funds recognize a realized gain or loss equal to the difference between the value of the contract at the time it was opened and the value at the time it was closed.
Upon entering into a financial futures contract, the Funds are required to pledge to the broker an amount of cash and/or other assets equal to a certain percentage of the contract amount, known as initial margin deposit. Futures contracts are valued at the quoted daily settlement prices established by the exchange on which they trade. The Funds agree to receive from, or pay to, the broker an amount of cash equal to the daily fluctuation in the value of the futures contract. Such receipts or payments are known as variation margin. At December 31, 2013, the Funds had no open futures contracts.
Certain of the Funds derivative instruments contain provisions that allow for early termination of those derivative contracts if the net assets of the Funds decline by certain thresholds within specified periods of time. If the Fund's net assets were to fall below these thresholds it would be in violation of these provisions and the counterparties to the derivative instruments could request immediate payment or demand immediate and ongoing full overnight collateralization on derivative instruments in net liability positions. If the credit-risk-related contingent features underlying these agreements were triggered on December 31, 2013, the Funds would not be required to post any additional collateral to their counterparties, as the Funds were in a gain position.
Warrants:
The average value of derivative instruments during the year ended December 31, 2013 was as follows (in millions):
| |
2013 | 2012 | |||||
|---|---|---|---|---|---|---|---|
Average notional value of swaps |
$ | 7.1 | $ | 4.5 | |||
Average value of contracts to buy |
$ | 14.0 | $ | 0.6 | |||
Average value of contracts to sell |
$ | 11.5 | $ | 6.4 | |||
F-53
Old Mutual Asset Management
Notes to Consolidated Financial Statements (Continued)
20) Funds' Derivatives and Hedging (Continued)
The fair values of derivatives were as follows at December 31 (in millions):
| |
Balance sheet classification within consolidated funds |
2013 | 2012 | ||||||||||||||
|---|---|---|---|---|---|---|---|---|---|---|---|---|---|---|---|---|---|
| |
Assets | Liabilities | Assets | Liabilities | Assets | Liabilities | |||||||||||
Derivatives with unrealized gains & losses: |
|||||||||||||||||
Forward foreign currency exchange contracts |
Other assets | Other liabilities | $ | 2.2 | $ | 3.5 | $ | 0.6 | $ | 0.4 | |||||||
Interest rate contracts |
Other assets | Other liabilities | 1.4 | 0.2 | 0.4 | — | |||||||||||
Warrants |
Investments | N/A | — | — | 0.5 | — | |||||||||||
Total return swap contracts |
Other assets | Other liabilities | 0.1 | 0.1 | — | — | |||||||||||
Other derivatives |
Investments | Other liabilities | 0.4 | 0.4 | — | — | |||||||||||
| | | | | | | | | | | | | | | | | | |
Total |
$ | 4.1 | $ | 4.2 | $ | 1.5 | $ | 0.4 | |||||||||
| | | | | | | | | | | | | | | | | | |
| | | | | | | | | | | | | | | | | | |
The effect of derivative instruments on the Company's Consolidated Statements of Operations for the years ended December 31 were as follows (in millions):
| |
|
2013 | 2012 | 2011 | |||||||||||||||||
|---|---|---|---|---|---|---|---|---|---|---|---|---|---|---|---|---|---|---|---|---|---|
| |
Income statement classification | Gains | Losses | Gains | Losses | Gains | Losses | ||||||||||||||
Realized gains (losses): |
|||||||||||||||||||||
Forward foreign currency exchange contracts |
OMAM funds net gains (losses): | $ | — | $ | 0.1 | $ | 0.9 | $ | — | $ | — | $ | 0.3 | ||||||||
Total return swap contracts |
OMAM funds net gains (losses): | — | — | — | — | — | 0.1 | ||||||||||||||
Unrealized gains (losses): |
|||||||||||||||||||||
Forward foreign currency exchange contracts |
OMAM funds net gains (losses): | — | 1.7 | — | — | — | — | ||||||||||||||
Interest rate contracts |
OMAM funds net gains (losses): | 0.5 | — | — | — | — | — | ||||||||||||||
Other derivatives |
OMAM funds net gains (losses): | 1.1 | — | — | — | — | — | ||||||||||||||
Net change in unrealized appreciation (depreciation): |
|||||||||||||||||||||
Forward foreign currency exchange contracts |
OMAM funds net gains (losses): | — | 4.9 | 0.4 | — | — | 0.3 | ||||||||||||||
Futures contracts |
OMAM funds net gains (losses): | 0.4 | — | — | — | — | — | ||||||||||||||
Other derivatives |
OMAM funds net gains (losses): | 0.6 | — | — | — | — | 0.6 | ||||||||||||||
| | | | | | | | | | | | | | | | | | | | | | |
Total |
$ | 2.6 | $ | 6.7 | $ | 1.3 | $ | — | $ | — | $ | 1.3 | |||||||||
| | | | | | | | | | | | | | | | | | | | | | |
| | | | | | | | | | | | | | | | | | | | | | |
F-54
Old Mutual Asset Management
Notes to Consolidated Financial Statements (Continued)
21) Discontinued Operations and Restructuring
Discontinued operations
The Company's gain (loss) from discontinued operations was comprised of the following at December 31 (in millions):
| |
2013 | 2012 | 2011 | |||||||
|---|---|---|---|---|---|---|---|---|---|---|
Revenues |
$ | 84.8 | $ | 137.6 | $ | 166.4 | ||||
Compensation expense |
50.7 | 102.1 | 130.9 | |||||||
Depreciation |
0.5 | 1.7 | 3.1 | |||||||
Other operating expenses |
16.2 | 37.6 | 48.5 | |||||||
Amortization and impairment of goodwill & intangibles |
0.1 | 32.7 | 31.5 | |||||||
| | | | | | | | | | | |
Operating income (loss) |
17.3 | (36.5 | ) | (47.6 | ) | |||||
Investment gain (loss) of consolidated Funds |
(9.4 | ) | 6.0 | (5.1 | ) | |||||
Net interest income (expense) |
— | (0.2 | ) | 1.0 | ||||||
| | | | | | | | | | | |
Loss before taxes |
7.9 | (30.7 | ) | (51.7 | ) | |||||
Income taxes |
5.2 | (3.7 | ) | (6.3 | ) | |||||
| | | | | | | | | | | |
Discontinued net income (loss) |
2.7 | (27.0 | ) | (45.4 | ) | |||||
Gain (loss) on disposal |
(4.4 | ) | 18.5 | 3.6 | ||||||
Tax on gain (loss) on disposal |
2.3 | (7.7 | ) | 19.3 | ||||||
| | | | | | | | | | | |
Total Discontinued Operations |
0.6 | (16.2 | ) | (22.5 | ) | |||||
Attributable to non-controlling interests |
(5.8 | ) | 4.9 | (6.6 | ) | |||||
| | | | | | | | | | | |
Attributable to controlling interests |
$ | 6.4 | $ | (21.1 | ) | $ | (15.9 | ) | ||
| | | | | | | | | | | |
| | | | | | | | | | | |
During the second quarter of 2014, the Company transferred the operations of Rogge Global Partners plc to its Parent, Old Mutual Plc, and has accordingly presented its results within discontinued operations for historical periods. The Company, as a controlled subsidiary of its Parent, is expecting to provide information to its Parent on the transferred operations of Rogge over the next quarter to ensure an orderly transition of operations.
During 2013, the Company committed to a plan to wind up the operations of Echo Point Investment Management, and has accordingly presented its results within discontinued operations for historical periods. The shutdown process was completed during the first quarter of 2014. The Company recorded a liability for incremental costs expected to be incurred, and recognized a loss in relation to the excess of carrying amount over recoverable amount of the net assets of the business. The total loss on disposal for the year ended December 31, 2013 amounted to $4.4 million.
During 2012, the Company sold its interest in Dwight Asset Management to Goldman Sachs Asset Management, and completed management buy-out transactions with the key employees of Analytic Investors, Ashfield Capital Partners, Larch Lane Advisors, 300 North Capital and 2100 Xenon. The Company also sold its advisory mandates on several Old Mutual Capital mutual funds to Touchstone Investments during 2012, subsequently shutting down the Old Mutual Capital business. At the date the assets attributable to these discontinued operations became held for sale, their carrying amount was assessed for impairment by comparison to their fair value, less costs to sell. This assessment resulted in the recognition of an impairment charge of $25.2 million. The sale proceeds recognized from these transactions, in addition to contingent earn-out revenue from disposals completed in prior periods, net
F-55
Old Mutual Asset Management
Notes to Consolidated Financial Statements (Continued)
21) Discontinued Operations and Restructuring (Continued)
of disposal costs incurred and post-closing funding commitments exceeded the fair value of assets and liabilities disposed of at closing by $18.5 million, resulting in a net gain on disposal.
During 2011, the Company sold its interest in Lincluden Management Limited. The net sale proceeds received from this transaction, in addition to contingent earn-out revenue from disposals completed in prior periods, net of disposal costs incurred exceeded the fair value of assets and liabilities disposed of at closing by $3.6 million, resulting in a net gain on disposal.
Restructuring costs
During 2012, the Company commenced the process of closing its corporate trustee entity, Old Mutual Asset Management Trust Company, and moving to an outsourced provider for its ongoing corporate trustee activities. This decision was taken so as to more efficiently support the Company's private fund and collective vehicle offerings in the future. As a result, severance costs of $0.3 million were incurred during 2012, which have been included within compensation and benefits in the Consolidated Statement of Operations.
During 2011, the Company undertook a strategic review of several of its corporate head office functions, resulting in exit from its central Retail Distribution activities and revision of the composition of its Executive Management function, including the appointment of a new Chief Executive Officer, a new Chief Financial Officer, a new Head of Global Distribution and a new Head of Affiliate Management. As a result of the actions taken, severance costs of $3.9 million were incurred during 2011, which have been included within compensation and benefits in the Consolidated Statement of Operations.
Liabilities associated with discontinued operations and restructuring are summarized as follows as of December 31 (in millions):
| |
2013 | 2012 | |||||
|---|---|---|---|---|---|---|---|
Beginning balance at January 1 |
$ | 11.1 | $ | 2.6 | |||
Abandoned lease liability principle payments |
(0.7 | ) | (0.3 | ) | |||
Accrual of wind-up costs in relation to discontinued operation |
2.8 | — | |||||
Payment of wind-up costs in relation to discontinued operation |
(0.2 | ) | — | ||||
Adjustment to sub-lease arrangement on abandoned lease |
0.6 | — | |||||
Loan funding committed to disposed firms |
— | 8.9 | |||||
Capital funding committed to disposed firms |
— | 0.3 | |||||
Drawdowns on committed funding |
(5.0 | ) | (0.4 | ) | |||
| | | | | | | | |
Ending balance at December 31 |
$ | 8.6 | $ | 11.1 | |||
| | | | | | | | |
| | | | | | | | |
No additional costs are expected to be incurred in connection with discontinued operations restructuring for the events described above.
22) Segment Information
The Company operates one business segment that provides investment management services and products to predominantly institutional clients. The primary measure used by the CODM in measuring performance and allocating resources is Economic Net Income ("ENI").
F-56
Old Mutual Asset Management
Notes to Consolidated Financial Statements (Continued)
22) Segment Information (Continued)
The Company uses ENI to make resource allocation decisions, determine appropriate levels of investment or dividend payout, manage balance sheet leverage, determine Affiliate variable compensation and equity distributions, and incentivize management. These ENI adjustments include both reclassifications of U.S. GAAP revenue and expense items, as well as adjustments to U.S. GAAP results, primarily to exclude non-cash, non-economic expenses, or to reflect cash benefits not recognized under U.S. GAAP. Adjustments in the calculation of ENI made to U.S. GAAP results include, but are not limited to, the following adjustments:
The Company re-categorizes certain line items on the income statement to reflect the following:
- •
- It excludes the effect of Fund consolidation by removing the portion of fund revenues, expenses and investment return
which is not attributable to our shareholders;
- •
- It includes within management fee revenue any fees paid to Affiliates by consolidated Funds, which are viewed as
investment income under U.S. GAAP;
- •
- It includes interest income within total revenues;
- •
- It includes our share of earnings from equity-accounted Affiliates within other income, rather than investment income;
- •
- It treats sales-based compensation as an operating expense, rather than part of compensation and benefits;
- •
- It identifies separately, the fixed and variable components of compensation and benefits expense; and
- •
- It identifies separately as Affiliate distributions the component of U.S. GAAP compensation that represents earnings shared with Affiliate key employee equity and profit-interest holders.
The Company has made the following adjustments to reflect the effect of restructuring and reorganization activities undertaken in connection with this initial public offering:
- i.
- It
excludes notional corporate cost allocations which are non-cash expenses that will not recur following this offering.
- ii.
- It
excludes interest expense historically paid to our Parent, as the related debt was restructured in connection with this transaction and the intercompany
interest will be eliminated from the consolidated results of the Company going forward.
- iii.
- It
excludes historic mark-to-market co-investment gains and losses, because these investments and ongoing returns thereon have been allocated to our Parent
in connection with this offering.
- iv.
- It excludes costs related to this IPO which were expensed in prior periods.
The Company also makes the following adjustments to U.S. GAAP results to more closely reflect the economic results of the Company:
- v.
- The Company excludes non-cash expenses representing changes in the value of Affiliate equity and profit-interests held by Affiliate key employees. These interests may in certain circumstances be repurchased by OMAM at a value based on a pre-determined fixed multiple of trailing earnings and as such this value is carried on our balance sheet as a liability.
F-57
Old Mutual Asset Management
Notes to Consolidated Financial Statements (Continued)
22) Segment Information (Continued)
- vi.
- The
Company excludes non-cash amortization or impairment expenses related to acquired goodwill and other intangibles.
- vii.
- The Company excludes the results of discontinued operations attributable to controlling interests since they are not part of the Company's ongoing business, and restructuring costs incurred in continuing operations which represent an exit from a distinct product or line of business.
Non-cash movements in the value of this liability are treated as compensation expense under U.S. GAAP. However, any equity or profit-interests repurchased by OMAM can be used to fund a portion of future variable compensation awards, resulting in savings in cash variable compensation that offset the negative cash effect of repurchasing the equity. The Company's Affiliate equity and profit-interest plans have been designed to ensure OMAM is never required to repurchase more equity than the Company can reasonably recycle through variable compensation awards in any given twelve month period. OMAM may also choose to retain repurchased Affiliate equity or profit-interests, entitling it to an additional share of future Affiliate earnings that represents an unrecognized economic asset to the Company. The value of this unrecognized asset offsets the value of the U.S. GAAP liability
The Company also restates its income tax expense to reflect any tax impact of its ENI adjustments.
F-58
Old Mutual Asset Management
Notes to Consolidated Financial Statements (Continued)
22) Segment Information (Continued)
Economic Net Income is comprised of the following for each of the years ended December 31 (in millions):
| |
Years Ended December 31, | |||||||||
|---|---|---|---|---|---|---|---|---|---|---|
($ in millions) Economic Net Income |
2013 | 2012 | 2011 | |||||||
Management fees |
$ | 499.8 | $ | 420.9 | $ | 420.1 | ||||
Performance fees |
18.1 | 14.1 | 2.9 | |||||||
Other income, including equity-accounted subsidiaries |
9.6 | 15.8 | 12.2 | |||||||
Interest income |
0.5 | 1.4 | 0.5 | |||||||
| | | | | | | | | | | |
Total ENI Revenue |
528.0 | 452.2 | 435.7 | |||||||
| | | | | | | | | | | |
Fixed compensation and benefits |
111.4 | 104.0 | 100.2 | |||||||
General and administrative expenses |
76.5 | 71.1 | 72.4 | |||||||
Depreciation and amortization |
4.9 | 5.7 | 6.9 | |||||||
| | | | | | | | | | | |
Total ENI Operating Expenses |
192.8 | 180.8 | 179.5 | |||||||
| | | | | | | | | | | |
Earnings before variable compensation |
335.2 | 271.4 | 256.2 | |||||||
Variable compensation |
153.8 | 121.0 | 118.4 | |||||||
| | | | | | | | | | | |
Earnings after variable compensation |
181.4 | 150.4 | 137.8 | |||||||
Affiliate key employee distributions |
28.4 | 19.1 | 13.5 | |||||||
| | | | | | | | | | | |
Pre-Tax Economic Net Income |
153.0 | 131.3 | 124.3 | |||||||
Tax on Economic Net Income |
30.1 | 19.0 | 22.4 | |||||||
| | | | | | | | | | | |
Economic Net Income |
$ | 122.9 | $ | 112.3 | $ | 101.9 | ||||
| | | | | | | | | | | |
| | | | | | | | | | | |
Pre-tax ENI operating margin before Affiliate key employee distributions* |
34 | % | 33 | % | 32 | % | ||||
Pre-tax ENI operating margin after Affiliate key employee distributions* |
29 | % | 29 | % | 29 | % | ||||
Pre-tax U.S. GAAP controlling interests operating margin |
6 | % | 6 | % | 5 | % | ||||
- *
- Pre-tax ENI operating margin is calculated based on pre-tax economic net income divided by ENI revenue.
F-59
Old Mutual Asset Management
Notes to Consolidated Financial Statements (Continued)
22) Segment Information (Continued)
The following table reconciles Economic Net Income to U.S. GAAP net income (loss) attributable to controlling interests and EBITDA for the years ended December 31 (in millions):
| |
|
2013 | 2012 | 2011 | ||||||||
|---|---|---|---|---|---|---|---|---|---|---|---|---|
U.S. GAAP net income (loss) attributable to controlling interests |
$ | 25.7 | $ | 3.0 | $ | 10.3 | ||||||
Adjustments related to restructuring and reorganization actions undertaken in connection with this offering: |
||||||||||||
i |
Non-cash notional parent corporate cost allocation | 3.3 | 2.8 | 3.2 | ||||||||
ii |
Intercompany interest expense | 72.2 | 84.0 | 74.1 | ||||||||
iii |
Co-investment (gain) loss | (3.0 | ) | (1.2 | ) | (3.1 | ) | |||||
iv |
Initial public offering costs | — | 0.4 | 8.0 | ||||||||
Adjustments to reflect the economic earnings of our Company: |
||||||||||||
v |
Non-cash key employee-owned equity and profit-interest revaluations | 47.7 | 16.2 | 11.5 | ||||||||
vi |
Amortization and impairment of goodwill and acquired intangible assets | 0.1 | 1.8 | 8.6 | ||||||||
vii |
Discontinued operations attributable to controlling interests | (6.3 | ) | 21.0 | 15.9 | |||||||
Tax effect of above adjustments |
(16.8 | ) | (15.7 | ) | (26.6 | ) | ||||||
| | | | | | | | | | | | | |
Economic net income after taxes |
$ | 122.9 | $ | 112.3 | $ | 101.9 | ||||||
| | | | | | | | | | | | | |
| | | | | | | | | | | | | |
Other segmental information is provided as follows for the years ended December 31, (in millions):
| |
2013 | 2012 | 2011 | |||||||
|---|---|---|---|---|---|---|---|---|---|---|
Revenue included within Economic Net Income(1) |
$ | 528.0 | $ | 452.2 | $ | 435.7 | ||||
Exclude interest income |
(0.5 | ) | (1.4 | ) | (0.5 | ) | ||||
Exclude investment return on equity-accounted affiliates |
(7.7 | ) | (15.3 | ) | (10.6 | ) | ||||
Additional Revenue from consolidated Funds |
408.8 | 268.0 | 299.6 | |||||||
| | | | | | | | | | | |
U.S. GAAP Revenue |
$ | 928.6 | $ | 703.5 | $ | 724.2 | ||||
| | | | | | | | | | | |
| | | | | | | | | | | |
- (1)
- Sourced entirely from operations in the United States
| |
2013 | 2012 | |
|||||||
|---|---|---|---|---|---|---|---|---|---|---|
Total assets domiciled in the United Kingdom |
$ | 51.8 | $ | 52.1 | ||||||
Total assets domiciled in the United States |
962.6 | 947.1 | ||||||||
| | | | | | | | | | | |
Total assets, excluding impact of consolidated Funds |
$ | 1,014.4 | $ | 999.2 | ||||||
| | | | | | | | | | | |
| | | | | | | | | | | |
F-60
Old Mutual Asset Management
Condensed Consolidated Balance Sheets
(in millions, unaudited)
| |
June 30, 2014 |
December 31, 2013 |
|||||
|---|---|---|---|---|---|---|---|
Assets |
|||||||
Cash and cash equivalents |
$ | 113.7 | $ | 194.2 | |||
Investment advisory fees receivable |
134.7 | 154.9 | |||||
Property and equipment, net |
23.1 | 24.1 | |||||
Investments (includes balances reported at fair value of $101.5 and $95.2) |
158.7 | 148.1 | |||||
Acquired intangibles, net |
1.1 | 1.2 | |||||
Goodwill |
126.5 | 117.8 | |||||
Other assets |
41.9 | 24.8 | |||||
Note receivable due from related party |
32.2 | 32.2 | |||||
Deferred tax assets |
274.4 | 294.2 | |||||
Assets of consolidated Funds: |
|||||||
Cash and cash equivalents |
107.1 | 88.0 | |||||
Restricted cash |
2,487.6 | 2,557.0 | |||||
Investments, at fair value |
62.4 | 406.2 | |||||
Timber assets |
4,394.0 | 4,422.1 | |||||
Other assets |
91.8 | 87.0 | |||||
| | | | | | | | |
Total assets |
$ | 8,049.2 | $ | 8,551.8 | |||
| | | | | | | | |
| | | | | | | | |
Liabilities and stockholders' equity |
|||||||
Accounts payable and accrued expenses |
$ | 30.0 | $ | 43.9 | |||
Accrued incentive compensation |
79.1 | 128.7 | |||||
Interest payable to related parties |
— | 14.6 | |||||
Other amounts due to related parties |
5.0 | 1.0 | |||||
Long-term compensation liabilities |
215.6 | 216.6 | |||||
Accrued income taxes |
5.0 | 6.7 | |||||
Notes payable to related parties |
1,003.5 | 1,040.7 | |||||
Third party borrowings |
2.5 | 2.5 | |||||
Other liabilities |
5.3 | 6.4 | |||||
Liabilities of consolidated Funds: |
|||||||
Accounts payable and accrued expenses |
41.6 | 33.5 | |||||
Long term debt |
3,797.3 | 3,783.1 | |||||
Related party debt |
625.9 | 604.7 | |||||
Securities sold, not yet purchased, at fair value |
22.2 | 24.6 | |||||
Other liabilities |
129.3 | 108.9 | |||||
| | | | | | | | |
Total liabilities |
5,962.3 | 6,015.9 | |||||
| | | | | | | | |
Commitments and contingencies |
|||||||
Redeemable non-controlling interests in consolidated Funds |
49.7 | 403.3 | |||||
Equity: |
|||||||
Parent equity (deficit) |
(443.5 | ) | (449.8 | ) | |||
Other comprehensive income |
7.4 | 3.0 | |||||
Non-controlling interests |
(3.6 | ) | 0.1 | ||||
Non-controlling interests in consolidated Funds |
2,476.9 | 2,579.3 | |||||
| | | | | | | | |
Total equity |
2,086.9 | 2,535.9 | |||||
| | | | | | | | |
Total liabilities and equity |
$ | 8,049.2 | $ | 8,551.8 | |||
| | | | | | | | |
| | | | | | | | |
F-61
Old Mutual Asset Management
Condensed Consolidated Statements of Operations
(in millions, except for per share data)
(Unaudited)
| |
For the Six Months Ended June 30, | ||||||
|---|---|---|---|---|---|---|---|
| |
2014 | 2013 | |||||
Revenue: |
|||||||
Management fees |
$ | 275.4 | $ | 233.1 | |||
Performance fees |
2.4 | 8.3 | |||||
Other revenue |
0.3 | 1.1 | |||||
Consolidated Funds' revenue: |
|||||||
Revenue from timber |
239.4 | 209.9 | |||||
Other revenue |
12.2 | 17.9 | |||||
| | | | | | | | |
Total revenue |
529.7 | 470.3 | |||||
Operating expenses: |
|||||||
Compensation and benefits |
181.3 | 165.9 | |||||
General and administrative expense |
37.1 | 32.0 | |||||
Amortization of acquired intangibles |
0.1 | 0.1 | |||||
Impairment of goodwill and acquired intangibles |
— | — | |||||
Depreciation and amortization |
2.9 | 2.4 | |||||
Consolidated Funds' expense: |
|||||||
Interest and dividend expense |
67.2 | 80.5 | |||||
Timber expense |
144.9 | 123.6 | |||||
Other expense |
136.2 | 131.1 | |||||
| | | | | | | | |
Total operating expenses |
569.7 | 535.6 | |||||
| | | | | | | | |
Operating income |
(40.0 | ) | (65.3 | ) | |||
| | | | | | | | |
Non-operating income and (expense): |
|||||||
Investment income |
5.9 | 3.6 | |||||
Interest income |
0.1 | 0.2 | |||||
Interest expense |
(33.2 | ) | (37.8 | ) | |||
Net gains from consolidated Funds |
31.5 | 31.3 | |||||
| | | | | | | | |
Total non-operating income (expense) |
4.3 | (2.7 | ) | ||||
| | | | | | | | |
Income (loss) from continuing operations before taxes |
(35.7 | ) | (68.0 | ) | |||
Provision for income taxes |
16.2 | 6.0 | |||||
| | | | | | | | |
Income (loss) from continuing operations |
(51.9 | ) | (74.0 | ) | |||
Income from discontinued operations, net of tax expense of $2.0 and $3.5 |
(2.0 | ) | (6.5 | ) | |||
Net gain loss on disposal from discontinued operations, net of tax expense (benefit) of $1.0 and $(0.4) |
2.4 | (1.0 | ) | ||||
| | | | | | | | |
Net income (loss) |
(51.5 | ) | (81.5 | ) | |||
Net income (loss) from continuing operations attributable to non-controlling interests in consolidated Funds |
(70.6 | ) | (93.0 | ) | |||
| | | | | | | | |
Net income attributable to controlling interest |
$ | 19.1 | $ | 11.5 | |||
| | | | | | | | |
| | | | | | | | |
F-62
Old Mutual Asset Management
Condensed Consolidated Statements of Comprehensive Income
(in millions)
(Unaudited)
| |
For the Six Months Ended June 30, |
||||||
|---|---|---|---|---|---|---|---|
| |
2014 | 2013 | |||||
Net income (loss) |
$ | (51.5 | ) | $ | (81.5 | ) | |
Foreign currency translation adjustment |
2.9 | (22.6 | ) | ||||
| | | | | | | | |
Total other comprehensive income (loss) |
(48.6 | ) | (104.1 | ) | |||
Comprehensive income (loss) attributable to non-controlling interests in consolidated Funds |
(70.5 | ) | (113.7 | ) | |||
| | | | | | | | |
Total comprehensive income attributable to controlling interests |
$ | 21.9 | $ | 9.6 | |||
| | | | | | | | |
| | | | | | | | |
F-63
Condensed Consolidated Statements of Changes in Stockholders' Equity
(in millions)
(Unaudited)
| |
Parent company's deficit |
Accumulated other comprehensive income (loss) |
Total parent company deficit |
Non-controlling interests |
Non-controlling interests in consolidated Funds |
Total equity |
Redeemable non-controlling interest in consolidated Funds |
Total equity and redeemable non-controlling interest in consolidated Funds |
|||||||||||||||||
|---|---|---|---|---|---|---|---|---|---|---|---|---|---|---|---|---|---|---|---|---|---|---|---|---|---|
December 31, 2012 |
$ | (483.8 | ) | $ | 1.6 | (482.2 | ) | $ | 0.9 | $ | 2,824.4 | $ | 2,343.1 | $ | 88.9 | 2,432.0 | |||||||||
Capital contributions (redemptions) |
0.1 | — | 0.1 | — | (34.1 | ) | (34.0 | ) | 158.1 | 124.1 | |||||||||||||||
Equity-based compensation |
2.3 | — | 2.3 | (0.9 | ) | — | 1.4 | — | 1.4 | ||||||||||||||||
Foreign currency translation adjustment |
— | (1.9 | ) | (1.9 | ) | — | (20.7 | ) | (22.6 | ) | — | (22.6 | ) | ||||||||||||
Parent company corporate cost allocation |
1.2 | — | 1.2 | — | — | 1.2 | — | 1.2 | |||||||||||||||||
Net consolidation (deconsolidation) of funds |
— | — | — | — | — | — | 119.8 | 119.8 | |||||||||||||||||
Net income (loss) |
11.5 | — | 11.5 | — | (83.8 | ) | (72.3 | ) | (9.2 | ) | (81.5 | ) | |||||||||||||
| | | | | | | | | | | | | | | | | | | | | | | | | | |
June 30, 2013 |
$ | (468.7 | ) | $ | (0.3 | ) | $ | (469.0 | ) | $ | — | $ | (2,685.8 | ) | $ | 2,216.8 | $ | 357.6 | $ | 2,574.4 | |||||
| | | | | | | | | | | | | | | | | | | | | | | | | | |
| | | | | | | | | | | | | | | | | | | | | | | | | | |
December 31, 2013 |
$ | (449.8 | ) | $ | 3.0 | $ | (446.8 | ) | $ | 0.1 | $ | 2,579.3 | $ | 2,132.6 | $ | 403.3 | $ | 2,535.9 | |||||||
Transfer of subsidiary to Parent |
(15.6 | ) | 1.6 | (14.0 | ) | — | — | (14.0 | ) | (327.4 | ) | (341.4 | ) | ||||||||||||
Tax on gain from transfer of subsidiary to Parent |
(3.7 | ) | — | (3.7 | ) | — | — | (3.7 | ) | — | (3.7 | ) | |||||||||||||
Capital contributions/(redemptions) |
— | — | — | (3.7 | ) | (25.7 | ) | (29.4 | ) | (14.0 | ) | (43.4 | ) | ||||||||||||
Equity-based compensation |
3.1 | — | 3.1 | — | — | 3.1 | — | 3.1 | |||||||||||||||||
Transfer of IPO share award |
1.8 | — | 1.8 | — | — | 1.8 | — | 1.8 | |||||||||||||||||
Foreign currency translation adjustment |
— | 2.8 | 2.8 | — | 0.1 | 2.9 | — | 2.9 | |||||||||||||||||
Parent company corporate cost allocation |
1.6 | — | 1.6 | — | — | 1.6 | — | 1.6 | |||||||||||||||||
Net consolidation/(deconsolidation) of funds |
— | — | — | — | — | — | (18.4 | ) | (18.4 | ) | |||||||||||||||
Net income/(loss) |
19.1 | — | 19.1 | — | (76.8 | ) | (57.7 | ) | 6.2 | (51.5 | ) | ||||||||||||||
| | | | | | | | | | | | | | | | | | | | | | | | | | |
June 30, 2014 |
$ | (443.5 | ) | $ | 7.4 | $ | (436.1 | ) | $ | (3.6 | ) | $ | 2,476.9 | $ | 2,037.2 | $ | 49.7 | $ | 2,086.9 | ||||||
| | | | | | | | | | | | | | | | | | | | | | | | | | |
| | | | | | | | | | | | | | | | | | | | | | | | | | |
F-64
Old Mutual Asset Management
Condensed Consolidated Statements of Cash Flows
(in millions, Unaudited)
| |
For the Six Months Ended June 30, |
||||||
|---|---|---|---|---|---|---|---|
| |
2014 | 2013 | |||||
Cash flow from operating activities: |
|||||||
Net income (loss) |
$ | (51.5 | ) | $ | (81.5 | ) | |
Less: Net loss attributable to non-controlling interests in consolidated Funds |
70.6 | 93.0 | |||||
Adjustments to reconcile net income (loss) to net cash provided by (used in) operating activities from continuing operations: |
|||||||
Net income (loss) from discontinued operations, excluding consolidated Funds |
(0.4 | ) | (4.3 | ) | |||
Amortization of acquired intangibles |
0.1 | 0.1 | |||||
Depreciation and other amortization |
2.9 | 2.4 | |||||
Amortization and revaluation of non-cash compensation awards |
28.5 | 36.7 | |||||
Parent company corporate cost allocation |
1.6 | 1.2 | |||||
Earnings from affiliates accounted for using the equity method |
(3.8 | ) | (4.6 | ) | |||
Distributions received from equity method affiliates |
1.5 | 14.3 | |||||
Deferred income taxes |
17.7 | 8.5 | |||||
(Gains) losses on other investments |
(2.1 | ) | 1.0 | ||||
Changes in operating assets and liabilities (excluding discontinued operations): |
|||||||
Decrease in investment advisory fees receivable |
(9.3 | ) | 5.4 | ||||
(Increase) decrease in other receivables, prepayments, deposits and other assets |
(7.3 | ) | 2.1 | ||||
Decrease in accrued incentive compensation and other long term liabilities |
(47.8 | ) | (27.5 | ) | |||
Decrease in accounts payable and accruals and accrued income taxes |
(14.2 | ) | (41.3 | ) | |||
| | | | | | | | |
Net cash flows from operating activities of continuing operations, excluding consolidated Funds |
(13.5 | ) | 5.5 | ||||
Net cash flows from operating activities of continuing operations of consolidated Funds |
(4.9 | ) | (20.8 | ) | |||
| | | | | | | | |
Net cash flows from operating activities of continuing operations |
(18.4 | ) | (15.3 | ) | |||
Net cash flows from operating activities of discontinued operations |
0.5 | (288.2 | ) | ||||
| | | | | | | | |
Net cash flows from operating activities |
(17.9 | ) | (303.5 | ) | |||
| | | | | | | | |
| | | | | | | | |
Cash flow from investing activities: |
|||||||
Purchase of fixed assets, excluding discontinued operations |
(2.9 | ) | (1.8 | ) | |||
Contingent payments for affiliate equity |
(11.0 | ) | — | ||||
Purchase of investment securities |
(7.0 | ) | (2.0 | ) | |||
Sale of investment securities |
18.0 | 3.9 | |||||
Cash flows from investing activites of consolidated Funds: |
|||||||
Purchase of investments |
(45.9 | ) | (102.6 | ) | |||
Redemption of investments |
111.2 | 94.7 | |||||
Deconsolidation of funds |
— | 128.1 | |||||
| | | | | | | | |
Net cash flows from investing activities of continuing operations |
62.4 | 120.3 | |||||
Net cash flows from investing activities of discontinued operations, including consolidated Funds |
(26.5 | ) | 136.3 | ||||
| | | | | | | | |
Net cash flows from investing activities |
35.9 | 256.6 | |||||
| | | | | | | | |
| | | | | | | | |
Cash flow from financing activities: |
|||||||
Repayment of related party borrowings |
(37.1 | ) | (35.8 | ) | |||
Capital contribution from parent company |
— | 0.1 | |||||
Capital redeemed to non-controlling interests |
(3.7 | ) | — | ||||
Cash flows from financing activities of consolidated Funds: |
|||||||
Deposits of restricted cash |
31.6 | 86.2 | |||||
Debt raised |
2.5 | — | |||||
Debt repaid |
— | (1.6 | ) | ||||
Redeemable non-controlling interest capital raised |
1.0 | 9.4 | |||||
Redeemable non-controlling interest capital redeemed |
(29.9 | ) | (13.6 | ) | |||
Distributions to non-controlling interests |
— | ||||||
Distributions to redeemable non-controlling interests |
(42.7 | ) | (30.7 | ) | |||
| | | | | | | | |
Net cash flows from financing activities of continuing operations |
(78.3 | ) | 14.0 | ||||
Net cash flows from financing activities of discontinued operations of consolidated Funds |
(1.2 | ) | 144.8 | ||||
| | | | | | | | |
Net cash flows from financing activities |
(79.5 | ) | 158.8 | ||||
| | | | | | | | |
| | | | | | | | |
Effect of foreign exchange rate changes on cash and cash equivalents |
0.1 | (1.1 | ) | ||||
Net increase (decrease) in cash and cash equivalents |
(61.5 | ) | 111.9 | ||||
Cash and cash equivalents at beginning of period |
282.2 | 268.6 | |||||
| | | | | | | | |
Cash and cash equivalents at end of period |
$ | 220.8 | $ | 379.5 | |||
| | | | | | | | |
| | | | | | | | |
Supplemental disclosure of cash flow information: |
|||||||
Interest paid (excluding consolidated Funds) |
$ | 62.4 | $ | 67.3 | |||
Income taxes paid |
$ | 2.5 | $ | 3.3 | |||
Non-cash contribution to Parent |
$ | 15.6 | $ | — | |||
F-65
Old Mutual Asset Management
Notes to Condensed Consolidated Financial Statements
(Unaudited)
1) Organization and Description of the Business
Old Mutual Asset Management ("OMAM" or the "Company") is a global asset management business with interests in a diverse group of boutique investment management firms (the "Affiliates") individually headquartered in the United States. The Company provides investment management services globally to predominantly institutional investors, in asset classes that include U.S. and global equities, fixed income, real estate and timber. Fees for services are largely asset-based and, as a result, the Company's revenue fluctuates based on the performance of financial markets and investors' asset flows in and out of the Company's products.
The Company's Affiliates are organized limited liability companies. The Company generally utilizes a profit-sharing model in structuring its compensation and ownership arrangements with Affiliates. The Affiliates' variable compensation is generally based on each firm's profitability. OMAM and Affiliate key employees share in profits after variable compensation according to their respective ownership interests. The profit-sharing model results in alignment of OMAM and Affiliate key employee economic interests, which is critical to the Company's talent management strategy and long-term growth of the business. The Company operates in one reportable segment.
The Company is a wholly-owned subsidiary of Old Mutual plc (the "Parent"), an international long-term savings, protection and investment group, listed on the London Stock Exchange.
Reorganization
The Company's US Holding entity Old Mutual (US) Holdings, Inc ("OMUSH") is a direct subsidiary of OM Group (UK) Limited ("OMGUK") which is in turn wholly owned by Old Mutual plc (UK) ("the Parent"). The board of directors of the Parent elected to undertake an initial public offering of the Company's business.
The Company and the Parent determined that certain transactions should be undertaken in preparation for the offering. Specifically, the Company and the Parent undertook the pre-offering restructuring steps described below ("the Reorganization"):
- 1.
- OMGUK
has incorporated OMAM in the United Kingdom as a direct, wholly-owned subsidiary of OMGUK.
- 2.
- OMAM
has incorporated OMAM US, Inc. in the State of Delaware ("U.S. Sub") as a direct, wholly-owned subsidiary of OMAM.
- 3.
- US
Sub has incorporated OMAM UK Limited in the United Kingdom ("U.K. Sub") as a direct, wholly-owned subsidiary of US Sub.
- 4.
- The
Company's existing intercompany debt, which was owed by OMUSH to OMGUK, was refinanced with new intercompany debt.
- 5.
- OMGUK
contributed its shares in OMUSH and the new intercompany debt to OMAM in return for an issuance of shares by OMAM resulting in the elimination of this
debt in our pro forma consolidated balance sheet, as it constituted an arrangement between two of the Company's subsidiaries.
- 6.
- The OMUSH shares have been transferred to UK Sub via a series of share exchanges, and the new intercompany debt has been contributed among OMAM, US Sub and UK Sub.
F-66
Old Mutual Asset Management
Notes to Condensed Consolidated Financial Statements (Continued)
(Unaudited)
1) Organization and Description of the Business (Continued)
- 7.
- OMAM
underwent a reduction of share capital to maximize distributable reserves, has re-registered in the United Kingdom as a public limited company, amended
its articles of association to reflect the same and organized its share capital for purposes of this offering.
- 8.
- OMAM issued third-party debt amounting to $175.0 million and paid a $175.0 million pre-offering dividend to OMGUK, OMAM also accrued a payable to OMGUK of $10 million which will be paid as funds become available from Affiliate distributions, subject to the maintenance of a minimum level of OMUSH cash holdings.
2) Basis of Presentation and Significant Accounting Policies
The Company's significant accounting policies are as follows:
Basis of presentation
These Condensed Consolidated Financial Statements reflect the historical balance sheets; statements of operations and of comprehensive income; statements of changes in stockholders' equity; and statements of cash flows of the Company. The Company is anticipating an offering by its Parent of the Company's ordinary stock pursuant to the Securities Act of 1933. Within these financial statements, entities that are part of the Parent's consolidated results, but are not part of OMAM, as defined above, are referred to as "related parties." These historical Condensed Consolidated Financial Statements have been prepared using the Parent's historical basis in determining the assets and liabilities and the results of the Company. The financial information included herein may not reflect the consolidated financial position, operating results, changes in the Parent's equity investment and cash flows of the Company in the future, and does not reflect what they would have been had the Company been a separate, stand-alone entity during the periods presented.
The Company historically has utilized the services of the Parent for certain functions. These services include providing working capital, as well as certain finance, internal audit, insurance, human resources, investor relations, risk, governance and other corporate functions and projects. The cost of these services has been allocated to the Company and included in the Consolidated Financial Statements. The allocations have been determined on the basis which the Parent and the Company considered to be reasonable reflections of the utilization of services provided by the Parent.
The Condensed Consolidated Financial Statements are prepared in accordance with accounting principles generally accepted in the United States ("U.S. GAAP"). All dollar amounts, except per share data in the text and tables herein, are stated in millions unless otherwise indicated. Transactions between the Company and the Parent are included in the Condensed Consolidated Financial Statements, however material intercompany balances and transactions among the Company, its consolidated Affiliates and consolidated Funds are eliminated in consolidation.
These unaudited Condensed Consolidated Financial Statements should be read in conjunction with the audited Consolidated Financial Statements and notes thereto for the year ended December 31, 2013 included elsewhere in this Registration Statement on Form S-1 as filed with the Securities and Exchange Commission ("SEC"). The Companies' significant accounting policies, which have been consistently applied, are summarized in this Registration Statement.
F-67
Old Mutual Asset Management
Notes to Condensed Consolidated Financial Statements (Continued)
(Unaudited)
2) Basis of Presentation and Significant Accounting Policies (Continued)
Consolidation
Affiliates
The Company evaluates each of its Affiliate and other operating entities to determine the appropriate method of accounting. Generally, majority-owned entities or otherwise controlled investments in which the Company holds a controlling financial interest as the principal shareholder, managing member, or general partner are consolidated.
Funds
In evaluating whether or not a legal entity must be consolidated, the Company determines if such entity is a variable interest entity ("VIE") or a voting interest entity ("VOE"). A VOE is considered an entity in which (i) the total equity investment at risk is sufficient to enable the entity to finance its activities independently and (ii) the equity holders at risk have the obligation to absorb losses, the right to receive residual returns, and the right to direct the activities of the entity that most significantly impact the entity's economic performance. A VIE is an entity that lacks one or more of the characteristics of a VOE. Assessing whether an entity is a VIE or VOE involves judgment and analysis. Factors considered in this assessment include the entity's legal organization, the entity's capital structure and equity ownership and any related party or de facto agent implications of the Company's involvement with the entity. Investments that are determined to be VIEs are consolidated if the Company or a consolidated Affiliate is the primary beneficiary of the investment. VOEs are typically consolidated if the Company holds the majority voting interest or otherwise controls the entity.
In the normal course of business, the Company's Affiliates sponsor and manage certain investment vehicles (the "Funds"). The Company assesses consolidation requirements with respect to its Funds pursuant to Accounting Standards Codification ("ASC") Topic 810 relating to the consolidation of VIEs. Substantially all of the Funds that are managed by the Company qualify for the deferral granted under Accounting Standards Updates ("ASU") 2010-10, "Amendments for Certain Investment Funds" ("ASU 2010-10"). As such, the Company evaluates these Funds for consolidation pursuant to guidance formerly in Financial Accounting Standards Board ("FASB") Interpretation No. 46(R), Consolidation of Variable Interest Entities. These Funds are typically owned entirely by third-party investors, however certain Funds are capitalized with seed capital investments from the Company or its related parties and may be owned partially by Affiliate key employees and/or individuals that own minority interests in an Affiliate.
In evaluating whether the Company is the primary beneficiary, the Company evaluates its economic interests in the entity held either directly by the Company or indirectly through related parties. For VIEs that are investment companies subject to ASU 2010-10, the primary beneficiary of the VIE is generally the variable interest holder that absorbs a majority of the expected losses of the VIE, receives a majority of the expected residual returns of the VIE, or both. The Company generally is not the primary beneficiary of Fund VIEs created to manage assets for clients unless the Company's ownership interest, including interests of related parties, is substantial.
For VIEs that do not fall within the scope of ASU 2010-10, the primary beneficiary of a VIE is defined as the variable interest holder that has a controlling financial interest. A controlling financial interest is defined as (i) the power to direct the activities of the VIE that most significantly impacts its
F-68
Old Mutual Asset Management
Notes to Condensed Consolidated Financial Statements (Continued)
(Unaudited)
2) Basis of Presentation and Significant Accounting Policies (Continued)
economic performance and (ii) the obligation to absorb losses of the entity or the right to receive benefits from the entity that could potentially be significant to the VIE. If no single party satisfies both criteria, but the Company and its related parties satisfy the criteria on a combined basis, then the primary beneficiary is the entity out of the related party group that is most closely associated to the VIE. The consolidation analysis can generally be performed qualitatively, however, if it is not readily apparent that the Company is not the primary beneficiary, a quantitative analysis may also be performed.
The Company consolidates VOEs when it has control over significant operating, financial and investing decisions of the entity. For VOEs organized as limited partnerships or as an entity with governance structures similar to a limited partnership (e.g., limited liability company with a managing member), the Company consolidates an entity when it holds the controlling general partnership interest and the limited partners do not hold substantive participating rights or rights to remove and replace the general partner or rights that could provide the limited partners with the ability to impact the ongoing governance and operating activities of the entity.
Other than Funds holding investments in timber assets (the "Timber Funds"), the Company's consolidated Funds are investment companies (the "Investment Funds") and the Company has therefore retained their specialized investment company accounting in consolidation, pursuant to ASC 946, "Financial Services—Investment Companies."
Upon the occurrence of certain events (such as contributions and redemptions, either by the Company, its Affiliates, or third parties, or amendments to the governing documents of the Company's investees or sponsored Funds) management reviews and reconsiders its previous conclusion regarding the status of an entity as a VIE or a VOE. Additionally, management continually reconsiders whether the Company is deemed to be a VIE's primary beneficiary who consolidates such entity.
Timber Funds
Timber assets and timber lease rights of consolidated Timber Funds are stated at historical cost less depletion for timber previously harvested and less accumulated amortization and depreciation for lease rights and roads. Timber investment values are adjusted for capital additions made to the property subsequent to the valuation date. All initial silviculture costs, including site preparation and planting costs are capitalized as stand establishment costs. Stand establishment costs are transferred to a merchantable timber classification as trees reach a certain size. Generally, costs incurred subsequent to two years after planting, such as fertilization, vegetation, insect control and pre-commercial thinning are considered to be maintenance and are expensed as incurred.
The Company estimates its timber inventory using statistical information and data obtained from physical measurements, site maps, photo-types and other information gathering techniques. These estimates are updated annually and may result in adjustments of timber volumes, including timber growth rates and depletion rates.
Depletion consists of costs attributed to harvesting timber and is recorded as an expense as timber is harvested. The depletion rate applied to the volume of timber sold is adjusted annually and is based on the relationship of incurred costs in the merchantable timber classification to estimated current merchantable volume.
F-69
Old Mutual Asset Management
Notes to Condensed Consolidated Financial Statements (Continued)
(Unaudited)
2) Basis of Presentation and Significant Accounting Policies (Continued)
Use of estimates
The preparation of these Condensed Consolidated Financial Statements requires management to make estimates and assumptions that affect the reported amounts of assets and liabilities, the disclosure of contingent assets and liabilities at the date of the financial statements and the reported amounts of revenues and expenses during the period. Actual results could differ significantly from those estimates.
3) Fair Value Measurements
The following table summarizes the Company's assets and liabilities that are measured at fair value on a recurring basis at June 30, 2014 (in millions):
| |
Quoted prices in active markets (Level I) |
Significant other observable inputs (Level II) |
Significant unobservable inputs (Level III) |
Total value, June 30, 2014 |
|||||||||
|---|---|---|---|---|---|---|---|---|---|---|---|---|---|
Assets of consolidated Funds(1) |
|||||||||||||
Investments owned, at fair value |
|||||||||||||
Common and preferred stock |
$ | 30.5 | $ | — | $ | — | $ | 30.5 | |||||
Short-term investment funds |
0.1 | — | — | 0.1 | |||||||||
Fixed Income Securities |
1.1 | — | — | 1.1 | |||||||||
Collective Investment Funds |
— | 20.3 | — | 20.3 | |||||||||
Corporate Debt |
— | 8.6 | — | 8.6 | |||||||||
Other Investments |
0.3 | 1.5 | — | 1.8 | |||||||||
| | | | | | | | | | | | | | |
Total investments at fair value |
32.0 | 30.4 | — | 62.4 | |||||||||
Restricted cash held at fair value |
104.4 | — | — | 104.4 | |||||||||
| | | | | | | | | | | | | | |
Consolidated Funds Total |
136.4 | 30.4 | — | 166.8 | |||||||||
| | | | | | | | | | | | | | |
Investment securities(2) |
59.2 | — | — | 59.2 | |||||||||
Investments in unconsolidated Funds(3) |
— | — | 42.3 | 42.3 | |||||||||
| | | | | | | | | | | | | | |
OMAM total |
59.2 | — | 42.3 | 101.5 | |||||||||
| | | | | | | | | | | | | | |
Total fair value assets |
$ | 195.6 | $ | 30.4 | $ | 42.3 | $ | 268.3 | |||||
| | | | | | | | | | | | | | |
Liabilities of consolidated Funds(1) |
|||||||||||||
Common stock |
$ | (22.1 | ) | $ | — | $ | — | $ | (22.1 | ) | |||
Other |
— | (0.1 | ) | — | (0.1 | ) | |||||||
| | | | | | | | | | | | | | |
Total fair value liabilities |
$ | (22.1 | ) | $ | (0.1 | ) | $ | — | $ | (22.2 | ) | ||
| | | | | | | | | | | | | | |
| | | | | | | | | | | | | | |
F-70
Old Mutual Asset Management
Notes to Condensed Consolidated Financial Statements (Continued)
(Unaudited)
3) Fair Value Measurements (Continued)
The following table summarizes the Company's assets and liabilities that are measured at fair value on a recurring basis at December 31, 2013 (in millions):
| |
Quoted prices in active markets (Level I) |
Significant other observable inputs (Level II) |
Significant unobservable inputs (Level III) |
Total value, December 31, 2013 |
|||||||||
|---|---|---|---|---|---|---|---|---|---|---|---|---|---|
Assets of consolidated Funds(1) |
|||||||||||||
Investments owned, at fair value |
|||||||||||||
Common and preferred stock |
$ | 52.0 | $ | — | $ | — | $ | 52.0 | |||||
Short-term investment funds |
8.8 | — | — | 8.8 | |||||||||
Fixed Income Securities |
— | 207.0 | — | 207.0 | |||||||||
Collective Investment Funds |
— | 9.1 | — | 9.1 | |||||||||
Corporate Debt |
— | 54.1 | — | 54.1 | |||||||||
Other investments |
0.9 | 70.2 | — | 71.1 | |||||||||
Derivatives |
2.8 | 1.3 | — | 4.1 | |||||||||
| | | | | | | | | | | | | | |
Total investments at fair value |
64.5 | 341.7 | — | 406.2 | |||||||||
Restricted cash held at fair value |
80.5 | 93.6 | — | 174.1 | |||||||||
| | | | | | | | | | | | | | |
Consolidated Funds Total |
145.0 | 435.3 | — | 580.3 | |||||||||
| | | | | | | | | | | | | | |
Investment securities(2) |
52.1 | — | — | 52.1 | |||||||||
Investments in unconsolidated Funds(3) |
— | — | 43.1 | 43.1 | |||||||||
| | | | | | | | | | | | | | |
OMAM Total |
52.1 | — | 43.1 | 95.2 | |||||||||
| | | | | | | | | | | | | | |
Total fair value assets |
$ | 197.1 | $ | 435.3 | $ | 43.1 | $ | 675.5 | |||||
| | | | | | | | | | | | | | |
| | | | | | | | | | | | | | |
Liabilities of consolidated Funds(1) |
|||||||||||||
Common stock |
$ | (24.6 | ) | $ | — | $ | — | $ | (24.6 | ) | |||
Forward Exchange Contracts |
(3.4 | ) | (0.1 | ) | — | (3.5 | ) | ||||||
Interest Rate Swaps |
— | (0.1 | ) | — | (0.1 | ) | |||||||
Other derivatives |
(0.2 | ) | (0.4 | ) | — | (0.6 | ) | ||||||
| | | | | | | | | | | | | | |
Total fair value liabilities |
$ | (28.2 | ) | $ | (0.6 | ) | $ | — | $ | (28.8 | ) | ||
| | | | | | | | | | | | | | |
| | | | | | | | | | | | | | |
- (1)
- Assets
and liabilities measured at fair value are comprised of financial investments managed by the Company's Affiliates. $62.4 million in assets and
$22.2 million in liabilities at June 30, 2014 and $406.2 million in assets and $28.5 million in liabilities at December 31, 2013 are the result from the
consolidation of Funds sponsored by the Company's Affiliates.
Of these, collective investment funds are multi-strategy products categorized as Level II because they are redeemable monthly and valued at NAV per share of the fund without adjustment which the Company believes represents the fair value of the investments. The fair value of fixed income securities, corporate debt, and other investments is estimated based on quoted market prices, dealer quotations or alternative pricing sources supported by observable inputs and therefore classified within Level II. The Company obtains prices from independent pricing services that generally utilize broker quotes and may use various other pricing techniques which take into
F-71
Old Mutual Asset Management
Notes to Condensed Consolidated Financial Statements (Continued)
(Unaudited)
3) Fair Value Measurements (Continued)
account appropriate factors such as yield, quality, coupon rate, maturity, type of issue, trading characteristics and other data.
Equity, short-term investment funds and derivatives which are traded on a national securities exchange are stated at the last reported sales price on the day of valuation. To the extent these securities are actively traded and valuation adjustments are not applied, they are classified as Level I. These securities that trade in markets that are not considered to be active but are valued based on quoted market prices, dealer quotations or alternative pricing sources supported by observable inputs obtained by the Company from independent pricing services are classified as Level II.
- (2)
- $59.2 million
and $52.1 million at June 30, 2014 and December 31, 2013, respectively, of investment securities are investments
in publicly registered daily redeemable funds (some managed by Affiliates), which the Company has classified as trading securities and valued using the published price as of the measurement dates.
Accordingly, the Company has classified these investments as Level I.
- (3)
- The remaining $42.3 million and $43.1 million at June 30, 2014 and December 31, 2013, respectively, relate to investments in unconsolidated Funds which consist primarily of investments in funds advised by Affiliates and are valued using NAV which the Company relies on to determine their fair value. The NAVs that have been provided by investees have been derived from the fair values of the underlying investments as of the measurement dates. The Company has classified investments in unconsolidated Funds as Level III given the nature of redemption restrictions that are in place. These unconsolidated Funds consist primarily of Real Estate investments funds. These investments are subject to longer than monthly or quarterly redemption restrictions, and due to their nature, distributions are received only as cash flows are generated from underlying assets over the life of the funds. The range of time over which the underlying assets are expected to be liquidated by the investees is approximately 1-8 years from June 30, 2014.
The following table presents changes in Level III assets and liabilities, comprised of significant unobservable inputs, at June 30, 2014:
| |
Investments in unconsolidated OMAM funds |
|||
|---|---|---|---|---|
Balance, December 31, 2013 |
$ | 43.1 | ||
Realized gain |
1.0 | |||
Net change in unrealized appreciation (depreciation) |
0.2 | |||
Dispositions |
(2.0 | ) | ||
| | | | | |
Balance, June 30, 2014 |
$ | 42.3 | ||
| | | | | |
| | | | | |
F-72
Old Mutual Asset Management
Notes to Condensed Consolidated Financial Statements (Continued)
(Unaudited)
3) Fair Value Measurements (Continued)
Unrealized gains recorded on our Condensed Consolidated Statements of Income related to the above Level III changes were $0.2 million for the six months ended June 30, 2014. There were no significant transfers of financial assets or liabilities among Levels I, II or III during the six months ended June 30, 2014.
4) Variable Interest Entities
The Company sponsors the formation of various entities considered to be VIEs. The Company consolidates these entities pursuant to Accounting Standards Codification ("ASC") Topic 810 relating to the consolidation of VIEs. These VIEs are primarily Funds managed by Affiliates that qualify for the deferral granted under ASU 2010-10, "Amendments for Certain Investment Funds." As such, the Company evaluates these Funds for consolidation pursuant to FASB Interpretation No. 46(R), "Consolidation of Variable Interest Entities." These investment vehicles are typically owned entirely by third-party investors; however, certain Funds are capitalized with seed capital investments from the Company and may be owned partially by Affiliate key employees and/or individuals that own minority interests in an Affiliate.
The Company's determination of whether it is the primary beneficiary of a Fund that is a VIE is based in part on an assessment of whether or not the Company and its related parties are exposed to the majority of the risks and rewards of the entity. Typically the Fund's investors are entitled to substantially all of the economics of these VIEs with the exception of the management fees and performance fees, if any, earned by the Company or any investment the Company has made into the Funds. The Company generally is not the primary beneficiary of Fund VIEs created to manage assets for clients unless the Company's ownership interest, including interests of related parties, is substantial.
The following table presents the assets and liabilities of Funds that are VIEs and consolidated by the Company (in millions):
| |
June 30, 2014 |
December 31, 2013 |
|||||
|---|---|---|---|---|---|---|---|
Assets |
|||||||
Investments at fair value |
$ | — | $ | 90.9 | |||
Restricted cash held by timber Funds |
2,487.6 | 2,557.0 | |||||
Timber investments at cost |
4,152.4 | 4,172.5 | |||||
Other assets of consolidated Funds |
179.9 | 145.0 | |||||
| | | | | | | | |
Total Assets |
$ | 6,819.9 | $ | 6,965.4 | |||
| | | | | | | | |
| | | | | | | | |
Liabilities |
|||||||
Borrowings of timber Funds |
4,172.3 | $ | 4,146.0 | ||||
Other liabilities of consolidated Funds |
99.0 | 77.2 | |||||
| | | | | | | | |
Total Liabilities |
$ | 4,271.3 | $ | 4,223.2 | |||
| | | | | | | | |
| | | | | | | | |
"Investments at fair value" consist of investments in securities and investments in related parties.
The assets of consolidated VIEs presented in the table above belong to the investors in those Funds, are available for use only by the Fund to which they belong, and are not available for use by the
F-73
Old Mutual Asset Management
Notes to Condensed Consolidated Financial Statements (Continued)
(Unaudited)
4) Variable Interest Entities (Continued)
Company. Any debt or liabilities held by consolidated Funds have no recourse to the Company's general credit. The Company also consolidates Funds that are not VIEs, and therefore the assets and liabilities of those Funds are not included in the table above.
The Company's involvement with Funds that are VIEs and unconsolidated by the Company is generally limited to that of an investment manager and its investment in the unconsolidated VIE, if any. The Company's investment in any unconsolidated VIE generally represents an insignificant interest of the Fund's net assets and assets under management, such that the majority of the VIE's results are attributable to third parties. The Company's exposure to risk in these entities is generally limited to any capital contribution it has made or is required to make and any earned but uncollected management fees. The Company has not issued any investment performance guarantees to these VIEs or their investors.
The following information pertains to unconsolidated VIEs for which the Company holds a significant variable interest (in millions):
| |
June 30, 2014 |
December 31, 2013 |
|||||
|---|---|---|---|---|---|---|---|
Unconsolidated VIE assets |
$ | 11,654.0 | $ | 12,156.8 | |||
Unconsolidated VIE liabilities |
$ | 1,592.0 | $ | 1,720.4 | |||
Equity interests on the Condensed and Consolidated Balance Sheet |
$ | 76.1 | $ | 78.4 | |||
Maximum risk of loss(1) |
$ | 76.7 | $ | 81.1 | |||
- (1)
- Includes equity investments the Company has made or is required to make and any earned but uncollected management / incentive fees. The Company does not record performance / incentive allocations until the respective measurement period has ended.
In addition to the multiple unconsolidated VIE Funds, the Company determined that Heitman LLC, one of the Company's Affiliates, is a VIE. The Company concluded that it is not the primary beneficiary of Heitman LLC because it does not hold the power to direct its most economically significant activities. The assets and liabilities of Heitman LLC include the management company itself as well as certain funds that Heitman LLC consolidates. The Company aggregated Heitman LLC with the Company's other unconsolidated VIE Funds due to their similar risk profiles given that the risks and rewards are driven by changes in investment values and the Affiliates' ability to manage those assets.
F-74
Old Mutual Asset Management
Notes to Condensed Consolidated Financial Statements (Continued)
(Unaudited)
5) Equity-Accounted Investees
The following tables present summarized financial information for Affiliates and Funds accounted for under the equity method (in millions):
| |
For the Six Months Ended June 30, 2014 |
For the Six Months Ended June, 2013 |
|||||||||||||||||
|---|---|---|---|---|---|---|---|---|---|---|---|---|---|---|---|---|---|---|---|
Statement of Income
|
Heitman LLC | Other | Total | Heitman LLC | Other | Total | |||||||||||||
Net revenues(1) |
$ | 116.4 | $ | 38.7 | $ | 155.1 | 128.2 | 40.1 | $ | 195.2 | |||||||||
| | | | | | | | | | | | | | | | | | | | |
Operating income (loss) |
27.5 | 17.7 | 45.2 | 44.4 | 12.6 | 57.0 | |||||||||||||
Other income (expense), net |
59.2 | (1.6 | ) | 57.6 | 94.5 | 22.3 | 116.8 | ||||||||||||
| | | | | | | | | | | | | | | | | | | | |
Income (loss) before income taxes |
86.7 | 16.1 | 102.8 | 138.9 | 34.8 | 173.8 | |||||||||||||
Income tax (expense) benefit |
(0.7 | ) | (0.1 | ) | (0.8 | ) | (1.1 | ) | (0.1 | ) | (1.2 | ) | |||||||
Noncontrolling interests (expense) benefit |
(80.4 | ) | (15.0 | ) | (95.4 | ) | 119.0 | (36.1 | ) | (155.1 | ) | ||||||||
| | | | | | | | | | | | | | | | | | | | |
Net income (loss) attributable to controlling interests |
5.6 | 1.0 | 6.6 | 18.8 | (1.3 | ) | 17.5 | ||||||||||||
OMAM Equity in net income (loss) of equity method investees |
$ | 4.0 | $ | 1.0 | $ | 5.0 | 4.7 | (1.3 | ) | $ | 3.4 | ||||||||
| |
As of June 30, 2014 | As of December 31, 2013 | |||||||||||||||||
|---|---|---|---|---|---|---|---|---|---|---|---|---|---|---|---|---|---|---|---|
Balance Sheet
|
Heitman LLC | Other | Total | Heitman LLC | Other | Total | |||||||||||||
Current assets |
$ | 103.2 | $ | 517.8 | $ | 621.0 | $ | 125.7 | $ | 58.7 | $ | 184.4 | |||||||
Noncurrent assets |
1,758.2 | 542.7 | 2,300.9 | 1,936.2 | 1,027.4 | 2,963.6 | |||||||||||||
| | | | | | | | | | | | | | | | | | | | |
Total Assets |
1,861.5 | 1,060.5 | 2,921.9 | 2,061.9 | 1,086.1 | 3,148.0 | |||||||||||||
Current liabilities |
52.3 | 328.7 | 381.0 | 69.6 | 378.9 | 448.5 | |||||||||||||
Long-term liabilities |
634.5 | 43.5 | 678.0 | 831.5 | 48.8 | 880.3 | |||||||||||||
Non-controlling interests in subsidiaries |
1,124.6 | 674.2 | 1,798.8 | 1,101.3 | 643.7 | 1,745.0 | |||||||||||||
| | | | | | | | | | | | | | | | | | | | |
Members' equity |
$ | 50.0 | $ | 14.1 | 64.1 | $ | 59.5 | $ | 14.7 | $ | 74.2 | ||||||||
| | | | | | | | | | | | | | | | | | | | |
| | | | | | | | | | | | | | | | | | | | |
OMUSH Equity investment and undistributed earnings of affiliated companies, before consolidating and reconciling adjustments |
46.3 | $ | 14.1 | $ | 60.4 | $ | 47.1 | $ | 14.7 | $ | 61.8 | ||||||||
Consolidating and reconciling adjustments: |
|||||||||||||||||||
Goodwill attributable to equity method investment |
29.9 | — | 29.9 | 29.8 | — | 29.8 | |||||||||||||
Other |
— | — | — | — | — | — | |||||||||||||
| | | | | | | | | | | | | | | | | | | | |
OMAM Investment in equity method investees at cost plus equity in undistributable earnings since acquisition |
$ | 76.1 | $ | 14.1 | $ | 90.2 | $ | 76.9 | $ | 14.7 | $ | 91.6 | |||||||
| | | | | | | | | | | | | | | | | | | | |
| | | | | | | | | | | | | | | | | | | | |
- (1)
- Net revenue includes advisory fees for asset management services and investment income, including interest and dividends from consolidated investment partnerships.
6) Related Party Transactions
Transactions with unconsolidated Affiliate-sponsored Funds are considered related party items on the basis of the Company's significant influence over the activities of such entities in its capacity as investment advisor thereto. These transactions are comprised of fees for advisory services and investments in unconsolidated "master" Funds held by consolidated OMAM "feeder" Funds.
F-75
Old Mutual Asset Management
Notes to Condensed Consolidated Financial Statements (Continued)
(Unaudited)
6) Related Party Transactions (Continued)
The Company's Parent provides the Company with various oversight services, including governance, which includes compensation for board and executive committees, investor relations, procurement of insurance coverage, human resources, financial reporting, internal audit, treasury, systems and tax services. The Company has also been allocated the costs associated with projects specific to or involving the Company. The costs associated with these services generally include employee related costs, including payroll and benefit as well as overhead related to support functions. Costs associated with these services were generally allocated based on the Company's proportion of the total Parent's consolidated, normalized revenues. In the six months ended June 30, 2014 and 2013,$1.6 million and $1.2 million, respectively, of these costs incurred have been allocated to the Company through a non-cash contribution to Parent equity, with the balance of the charges settled in cash.
7) Borrowings and Debt
The Company's long term debt at June 30, 2014 and December 31, 2013 excluding the long term debt of the Company's consolidated Funds was comprised of the following (in millions):
| (in millions) |
June 30, 2014 |
December 31, 2013 |
Interest rate | Maturity | ||||||
|---|---|---|---|---|---|---|---|---|---|---|
Related party obligations: |
||||||||||
Term loan one |
$ | 900.0 | $ | 900.0 | 6.34% | September 30, 2015 | ||||
Revolving credit facility |
103.5 | 140.7 | LIBOR + 5.58% + 0.50% fee on undrawn amounts | March 31, 2018 | ||||||
| | | | | | | | | | | |
Total related party obligations |
1,003.5 | 1,040.7 | ||||||||
Third party obligations: |
||||||||||
Term loan two |
2.5 | 2.5 | 5.23% | August 15, 2014 | ||||||
| | | | | | | | | | | |
Total long term debt of the Company |
$ | 1,006.0 | $ | 1,043.2 | ||||||
| | | | | | | | | | | |
| | | | | | | | | | | |
The fair value of borrowings approximated net cost basis as of June 30, 2014. Fair value was determined based on future cash flows, discounted to present value using current market rates. The inputs are categorized as level 3 in the fair value hierarchy.
Interest expense incurred on Term Loan 1 and the Revolving Credit Facility amounted to $34.0 million and $39.0 million for the six months ended June 30, 2014 and 2013 respectively.
F-76
Old Mutual Asset Management
Notes to Condensed Consolidated Financial Statements (Continued)
(Unaudited)
7) Borrowings and Debt (Continued)
The long term debt of the Company's consolidated Funds was comprised of the following at June 30, 2014 and December 31, 2013 (in millions):
| (in millions) |
June 30, 2014 |
December 31, 2013 |
Interest rate | Maturity | ||||||
|---|---|---|---|---|---|---|---|---|---|---|
Related party obligations: |
||||||||||
Promissory note |
$ | 265.0 | $ | 265.0 | 4.00% | August 2019 | ||||
Shareholder loans and note interest |
360.9 | 339.7 | BBSW* + 5.5% | October 2022 | ||||||
| | | | | | | | | | | |
Total related party obligations: |
625.9 | 604.7 | ||||||||
| | | | | | | | | | | |
Third party obligations: |
||||||||||
Term loan A |
163.0 | 163.0 | 6% - 6.26% | May 2016 | ||||||
Term loan B |
261.5 | 261.5 | 5.93% - LIBOR + 1.61% | October 2016 | ||||||
Senior secured notes |
860.0 | 860.0 | 6.19% - 6.38% | December 2019 | ||||||
Secured bank loan |
129.6 | 115.4 | variable | October 2017 | ||||||
Notes payable |
2,383.2 | 2,383.2 | LIBOR + margin | October 2017 | ||||||
| | | | | | | | | | | |
Total third party obligations: |
3,797.3 | 3,783.1 | ||||||||
| | | | | | | | | | | |
Total long term debt of consolidated Funds |
$ | 4,423.2 | $ | 4,387.8 | ||||||
| | | | | | | | | | | |
| | | | | | | | | | | |
- *
- BBSW refers to the Australian Bank-Bill Reference Rate
The fair value of borrowings was approximately $4,621.5 million as of June 30, 2014. Fair value was determined based on future cash flows, discounted to present value using current market rates. The inputs are categorized as level 3 in the fair value hierarchy.
Total interest expense recognized in relation to the above obligations of consolidated Funds during the six months ended June 30, 2014 and 2013 was $67.1 million and $80.3 million, respectively.
The Company and its consolidated Funds are not in default with the required covenants related to borrowings and debt facilities.
8) Commitments and Contingencies
Operational commitments
As of June 30, 2014, the Company had no operational commitments.
Litigation
The Company and its Affiliates are subject to claims, legal proceedings and other contingencies in the ordinary course of their business activities. Each of these matters is subject to various uncertainties, and it is possible that some of these matters may be resolved in a manner unfavorable to the Company or its Affiliates. The Company and its Affiliates establish accruals for matters for which the outcome is probable and can be reasonably estimated. Management believes that any liability in excess of these accruals upon the ultimate resolution of these matters will not have a material adverse effect on the Condensed Consolidated Financial Statements or results of operations of the Company. As of June 30, 2014 there were no accruals for claims, legal proceedings or other contingencies.
F-77
Old Mutual Asset Management
Notes to Condensed Consolidated Financial Statements (Continued)
(Unaudited)
8) Commitments and Contingencies (Continued)
Indemnifications
In the normal course of business, such as through agreements to enter into business combinations and divestitures of Affiliates, the Company may enter into contracts that contain a variety of representations and warranties and which provide general indemnifications. The Company's maximum exposure under these arrangements is unknown, as this would involve future claims that may be made against the Company that have not yet occurred.
Concentrations of credit risk
Financial instruments that potentially subject the Company to significant concentrations of credit risk consist principally of cash investments. The Company maintains cash and cash equivalents and short term investments with various financial institutions. These financial institutions are typically located in cities in which the Company and its Affiliates operate. For the Company and certain Affiliates, cash deposits at a financial institution may exceed Federal Deposit Insurance Corporation insurance limits.
9) Accumulated Other Comprehensive Income
The components of accumulated other comprehensive income at June 30 were as follows (in millions) including proportions attributable to non-controlling interests:
| |
(unaudited) June 30, 2014 |
(audited) December 31, 2013 |
|||||
|---|---|---|---|---|---|---|---|
Foreign currency translation |
$ | (15.0 | ) | $ | (17.9 | ) | |
| | | | | | | | |
| | | | | | | | |
F-78
Old Mutual Asset Management
Notes to Condensed Consolidated Financial Statements (Continued)
(Unaudited)
10) Discontinued Operations and Restructuring
Discontinued operations
The Company's gain (loss) from discontinued operations was comprised of the following at June 30 (in millions):
| |
For the Six Months Ended June 30, |
||||||
|---|---|---|---|---|---|---|---|
| |
2014 | 2013 | |||||
Revenues |
$ | 38.0 | $ | 42.9 | |||
Compensation expense |
31.0 | 23.8 | |||||
Depreciation |
0.2 | 0.9 | |||||
Other operating expenses |
9.8 | 8.2 | |||||
Amortization and impairment of goodwill & intangibles |
— | 0.1 | |||||
| | | | | | | | |
Operating loss |
(3.0 | ) | 9.9 | ||||
Investment gain (loss) of consolidated OMAM Funds |
2.8 | (13.0 | ) | ||||
Net interest income (expense) |
0.2 | 0.1 | |||||
| | | | | | | | |
Loss before taxes |
— | (3.0 | ) | ||||
Income taxes |
2.0 | 3.5 | |||||
| | | | | | | | |
Discontinued net loss |
(2.0 | ) | (6.5 | ) | |||
Gain (loss) on disposal |
2.4 | (1.0 | ) | ||||
| | | | | | | | |
Total Discontinued Operations |
0.4 | (7.5 | ) | ||||
Attributable to non-controlling interests |
4.7 | (11.8 | ) | ||||
| | | | | | | | |
Attributable to controlling interests |
$ | (4.3 | ) | $ | 4.3 | ||
| | | | | | | | |
| | | | | | | | |
In the second quarter of 2014, the Company transferred the operations of Rogge Global Partners plc to the Company's Parent and has accordingly presented its results within discontinued operations for historical periods.
During 2013, the Company committed to a plan to wind up the operations of Echo Point Investment Management, and has accordingly presented its results within discontinued operations for historical periods. The Company recorded a liability for incremental costs expected to be incurred, and recognized a loss in relation to the excess of carrying amount over recoverable amount of the net assets of the business. The shutdown process was completed during the first quarter of 2014.
The Company recognized a gain (loss) on disposal, net of taxes, of $2.4 million and $(1.0) million for the six months ended June 30, 2014 and 2013, respectively.
11) Subsequent Events
On August 15, 2014, the Company entered into an agreement to purchase a portion of one of its Affiliates' equity interests for $60.0 million, contingent upon the pricing of the initial public offering. The excess of the purchase price over its recorded value is estimated to be $32.8 million and will be accounted for as a cash-settled share based payment compensation expense.
F-79
Ordinary Shares

OM Asset Management Limited
Ordinary Shares
Prospectus
BofA Merrill Lynch
Morgan Stanley
Citigroup
Credit Suisse
, 2014
Until , all dealers that effect transactions in these securities, whether or not participating in this offering, may be required to deliver a prospectus. This is in addition to the dealers' obligation to deliver a prospectus when action as underwriters and with respect to their unsold allotments or subscriptions.
PART II
INFORMATION NOT REQUIRED IN PROSPECTUS
Item 13. Other Expenses of Issuance and Distribution.
The estimated expenses payable by us in connection with this offering described in this registration statement (other than the underwriting discount and commissions) will be as follows:
SEC Registration Fee |
$ | 12,880 | ||
FINRA filing fee |
$ | 15,500 | ||
Accounting fees and expenses |
||||
New York Stock Exchange listing fee |
||||
Printing and engraving expenses |
||||
Directors' & Officers' liability insurance premiums |
||||
Legal fees and expenses |
||||
Transfer agent and registrar fees |
||||
Miscellaneous |
||||
| | | | | |
Total |
$ | |||
| | | | | |
| | | | | |
Item 14. Indemnification of Directors and Officers.
Our articles of association provide that, subject to the Companies Act 2006, we shall indemnify, out of our assets, any director of the Company or any associated company against all losses, liabilities and expenditures which he or she may sustain or incur in the execution of the duties of his or her office or otherwise in relation thereto.
The relevant provisions under the Companies Act 2006 are sections 205, 206, 232, 233, 234, 235, 236, 237, 238 and 1157.
Section 205 provides that a company can provide a director with funds to meet expenditures incurred or to be incurred by him or her in defending any criminal or civil proceedings or in connection with any application under sections 661(3) and 661(4) (acquisition of shares by an innocent nominee) or section 1157 (as described below). Such financial assistance must be repaid if the director is convicted in the proceedings, judgment is found against such director in the proceedings or the court refuses to grant the relief on the application.
Section 206 provides that a company can provide a director with funds to meet expenditures incurred or to be incurred by him or her in defending in an investigation by a regulatory authority, or against action proposed to be taken by a regulatory authority, in connection with any alleged negligence, default, breach of duty or breach of trust by him or her in relation to the company or an associated company.
Section 232 provides that any provision that purports to exempt a director from liability for negligence, default, breach of duty or breach of trust by him or her in relation to the company is void. Any provisions by which a company directly or indirectly provides an indemnity (to any extent) for a director of the company or an associated company against any such liability is also void unless it is a qualifying third-party indemnity provision (as described below).
Notwithstanding the provisions of section 232 above, section 233 permits liability insurance, commonly known as directors' and officers' liability insurance, to be purchased and maintained by a company against liability of its directors for negligence, default, breach of duty or breach of trust in relation to a company or an associated company.
II-1
Pursuant to section 234, an indemnity is a qualifying third-party indemnity as long as it does not provide any indemnity against (i) any liability incurred by the director to the company or to any associated company; (ii) any liability incurred by the director to pay a fine imposed in criminal proceedings, or a sum payable to a regulatory authority by way of a penalty in respect of non-compliance with any requirement of a regulatory nature (howsoever arising); and (iii) any liability incurred by the director in defending criminal proceedings in which he or she is convicted, civil proceedings brought by the company or an associated company in which judgment is given against such director, or where the court refuses to grant such director relief under an application under sections 661(3) and 661(4) (acquisition of shares by an innocent nominee) or its power under section 1157 (as described below).
Section 235 allows a company to provide an indemnity to a director if the company is a trustee of an occupational pension scheme, and such indemnity provides protection against liability incurred in connection with the company's activities as trustee of the scheme.
Any indemnity provided under section 234 or section 235 in force for the benefit of one or more directors of the company or an associated company must be disclosed in the directors' annual report in accordance with section 236 and copies of such indemnification provisions (or, if not in writing, a written memorandum setting out their terms) must be made available for inspection by members of the company at the company's registered office in accordance with section 237 (and every member of the company has a right to inspect and request such copies under section 238).
Section 1157 provides that in proceedings against an officer of a company for negligence, default, breach of duty or breach of trust, the court may relieve such officer, either wholly or in part, from liability, on such terms as it thinks fit, if it appears to the court that such officer may be liable but acted honestly and reasonably and that having regard to all the circumstances of the case, such officer ought fairly to be excused. Further, an officer who has reason to apprehend that a claim of negligence, default, breach of duty or breach of trust will or might be made against him or her, such officer may apply to the court for relief, and the court will have the same power to relieve such officer as it would if the proceedings had actually been brought.
A court has wide discretion in granting relief, and may authorize civil proceedings to be brought in the name of the company by a shareholder on terms that the court directs. Except in these limited circumstances, English law does not generally permit class action lawsuits by shareholders on behalf of the company or on behalf of other shareholders.
We will obtain and expect to continue to maintain insurance policies under which our directors and officers are insured, within the limits and subject to the limitations of those policies, against certain expenses in connection with the defense of, and certain liabilities that might be imposed as a result of, actions, suits or proceedings to which they are parties by reason of being or having been directors or officers. The coverage provided by these policies may apply whether or not we would have powers to indemnify such person against such liability under the provisions of English law.
Insofar as indemnification for liabilities arising under the Securities Act may be permitted to our directors, officers, and controlling persons pursuant to the foregoing provisions, or otherwise, we have been advised that, in the opinion of the SEC, such indemnification is against public policy as expressed in the Securities Act and is, therefore, unenforceable. In the event that a claim for indemnification against such liabilities (other than the payment of expenses incurred or paid by a director, officer or controlling person in a successful defense of any action, suit or proceeding) is asserted by such director, officer or controlling person in connection with the securities being registered, we will, unless in the opinion of its counsel the matter has been settled by controlling precedent, submit to the court of appropriate jurisdiction the question whether such indemnification by it is against public policy as expressed in the Securities Act and will be governed by the final adjudication of such issue.
II-2
Pursuant to the Underwriting Agreement filed as Exhibit 1.1 to this Registration Statement, we have agreed to indemnify the underwriters and the underwriters have agreed to indemnify us against certain civil liabilities that may be incurred in connection with this offering, including certain liabilities under the Securities Act.
Item 15. Recent Sales of Unregistered Securities.
In connection with our Reorganization, ordinary shares were issued to OMGUK.
Item 16. Exhibits and Financial Statement Schedules.
- (a)
- The following exhibits are filed as part of this Registration Statement:
| Exhibit No. | Description | |
|---|---|---|
| 1.1 | * | Form of Underwriting Agreement. |
3.1 |
* |
Memorandum of Association. |
3.2 |
* |
Articles of Association. |
4.1 |
* |
Specimen Ordinary Share Certificate. |
5.1 |
* |
Opinion of Bingham McCutchen LLP. |
10.1 |
* |
Revolving Credit Facility. |
10.2 |
* |
Employment Agreement with Peter L. Bain. |
10.3 |
* |
Employment Agreement with Linda T. Gibson. |
10.4 |
* |
Long-Term Equity Incentive Plan and Agreement for Awards under Such Plan. |
10.5 |
* |
Seed Capital Management Agreement. |
10.6 |
* |
Co-Investment Arrangement. |
10.7 |
* |
Transitional Intellectual Property Agreement. |
10.8 |
* |
Transition Services Agreement with Old Mutual plc. |
10.9 |
* |
Deferred Tax Asset Arrangement. |
10.10 |
* |
Registration Rights Agreement. |
10.11 |
* |
Shareholder Agreement. |
10.12 |
* |
Indemnification Agreement for Directors. |
14 |
* |
Code of Ethics. |
21.1 |
* |
Subsidiaries. |
23.1 |
Consent of KPMG LLP. |
|
23.2 |
* |
Consent of Bingham McCutchen LLP (included in Exhibit 5.1). |
23.3 |
** |
Consent of Peter L. Bain. |
23.4 |
** |
Consent of Ian D. Gladman. |
23.5 |
** |
Consent of James J. Ritchie. |
23.6 |
Consent of Kyle P. Legg. |
II-3
| Exhibit No. | Description | |
|---|---|---|
| 23.7 | Consent of John D. Rogers. | |
24 |
** |
Power of Attorney. |
- *
- To
be filed by amendment.
- **
- Previously filed.
The undersigned Registrant hereby undertakes that:
- 1.
- The
undersigned registrant hereby undertakes to provide to the underwriter at the closing specified in the underwriting agreements, certificates in such
denominations and registered in such names as required by the underwriter to permit prompt delivery to each purchaser.
- 2.
- Insofar
as indemnification for liabilities arising under the Securities Act of 1933 may be permitted to directors, officers and controlling persons of the
registrant pursuant to the foregoing provisions, or otherwise, the registrant has been advised that in the opinion of the Securities and Exchange Commission such indemnification is against public
policy as expressed in the Act and is, therefore, unenforceable. In the event that a claim for indemnification against such liabilities (other than the payment by the registrant of expenses incurred
or paid by a director, officer, or controlling person of the registrant in the successful defense of any action, suit or proceeding) is asserted by such director, officer or controlling person in
connection with the securities being registered hereunder, the registrant will, unless in the opinion of its counsel the matter has been settled by controlling precedent, submit to a court of
appropriate jurisdiction the question of whether such indemnification by it is against public policy as expressed in the Securities Act and will be governed by the final adjudication of such issue.
- 3.
- For
purposes of determining any liability under the Securities Act, the information omitted from the form of prospectus filed as part of this registration
statement in reliance upon Rule 430A and contained in a form of prospectus filed by the Registrant pursuant to Rule 424(b)(1) or (4) or 497(h) under the Securities Act shall be
deemed to be part of this registration statement as of the time it was declared effective.
- 4.
- For the purpose of determining any liability under the Securities Act, each post-effective amendment that contains a form of prospectus shall be deemed to be a new registration statement relating to the securities offered therein, and the offering of such securities at that time shall be deemed to be the initial bona fide offering thereof.
II-4
Pursuant to the requirements of the Securities Act of 1933, the registrant has duly caused this Amendment No. 1 to the Registration Statement to be signed on its behalf by the undersigned, thereunto duly authorized, in the City of Boston, Commonwealth of Massachusetts, on the 18th day of August, 2014.
| OM Asset Management Limited | ||||
By: |
/s/ PETER L. BAIN Peter L. Bain President and Chief Executive Officer (Principal Executive Officer) |
|||
By: |
/s/ STEPHEN H. BELGRAD Stephen H. Belgrad Executive Vice President and Chief Financial Officer (Principal Financial Officer and Principal Accounting Officer) |
|||
Pursuant to the requirements of the Securities Act of 1933, this Amendment No. 1 to the Registration Statement has been signed by the following persons in the capacities and on the dates indicated.
Name
|
Position
|
Date
|
||
|---|---|---|---|---|
| * Julian Roberts |
Chairman of the Board | August 18, 2014 | ||
/s/ PETER L. BAIN Peter L. Bain |
President and Chief Executive Officer (Principal Executive Officer) |
August 18, 2014 |
||
/s/ STEPHEN H. BELGRAD Stephen H. Belgrad |
Executive Vice President and Chief Financial Officer (Principal Financial Officer and Principal Accounting Officer) |
August 18, 2014 |
||
* Donald J. Schneider |
Director |
August 18, 2014 |
||
/s/ STEPHEN H. BELGRAD Stephen H. Belgrad |
Authorized Representative in the United States |
August 18, 2014 |
| *By: | /s/ STEPHEN H. BELGRAD Stephen H. Belgrad as attorney-in-fact |
II-5
| Exhibit No. | Description | |
|---|---|---|
| 1.1 | * | Form of Underwriting Agreement. |
3.1 |
* |
Memorandum of Association. |
3.2 |
* |
Articles of Association. |
4.1 |
* |
Specimen Ordinary Share Certificate. |
5.1 |
* |
Opinion of Bingham McCutchen LLP. |
10.1 |
* |
Revolving Credit Facility. |
10.2 |
* |
Employment Agreement with Peter L. Bain. |
10.3 |
* |
Employment Agreement with Linda T. Gibson. |
10.4 |
* |
Long-Term Equity Incentive Plan and Agreement for Awards under Such Plan. |
10.5 |
* |
Seed Capital Management Agreement. |
10.6 |
* |
Co-Investment Arrangement. |
10.7 |
* |
Transitional Intellectual Property Agreement. |
10.8 |
* |
Transition Services Agreement with Old Mutual plc. |
10.9 |
* |
Deferred Tax Asset Arrangement. |
10.10 |
* |
Registration Rights Agreement. |
10.11 |
* |
Shareholder Agreement. |
10.12 |
* |
Indemnification Agreement for Directors. |
14 |
* |
Code of Ethics. |
21.1 |
* |
Subsidiaries. |
23.1 |
Consent of KPMG LLP. |
|
23.2 |
* |
Consent of Bingham McCutchen LLP (included in Exhibit 5.1). |
23.3 |
** |
Consent of Peter L. Bain. |
23.4 |
** |
Consent of Ian D. Gladman. |
23.5 |
** |
Consent of James J. Ritchie. |
23.6 |
Consent of Kyle P. Legg. |
|
23.7 |
Consent of John D. Rogers. |
|
24 |
** |
Power of Attorney. |
- *
- To
be filed by amendment.
- **
- Previously filed
II-6