Attached files
| file | filename |
|---|---|
| EX-32.2 - EXHIBIT 32.2 - BrightSphere Investment Group plc | omam123116ex322.htm |
| EX-32.1 - EXHIBIT 32.1 - BrightSphere Investment Group plc | omam123116ex321.htm |
| EX-31.2 - EXHIBIT 31.2 - BrightSphere Investment Group plc | omam123116ex312.htm |
| EX-31.1 - EXHIBIT 31.1 - BrightSphere Investment Group plc | omam123116ex311.htm |
| EX-23.1 - EXHIBIT 23.1 - BrightSphere Investment Group plc | omam123116ex231.htm |
| EX-21.1 - EXHIBIT 21.1 - BrightSphere Investment Group plc | omam123116ex211.htm |
UNITED STATES
SECURITIES AND EXCHANGE COMMISSION
Washington, D.C. 20549
FORM 10-K
(Mark One) | |
ý | ANNUAL REPORT PURSUANT TO SECTION 13 OR 15(d) OF THE SECURITIES EXCHANGE ACT OF 1934 |
For the fiscal year ended December 31, 2016 | |
OR | |
o | TRANSITION REPORT PURSUANT TO SECTION 13 OR 15(d) OF THE SECURITIES EXCHANGE ACT OF 1934 |
For the transition period from to | |
Commission File Number 001-3668
OM Asset Management plc
(Exact name of registrant as specified in its charter)
England and Wales (State or other jurisdiction of incorporation or organization) | 98-1179929 (IRS Employer Identification Number) | ||
Ground Floor, Millennium Bridge House
2 Lambeth Hill
London EC4V 4GG, United Kingdom
+44-20-7002-7000
(Address, including zip code, and telephone number, including area code, of registrant’s principal executive offices)
Securities registered pursuant to Section 12(b) of the Act:
Ordinary Shares ($.001 par value) | New York Stock Exchange | |
(Title of each class) | Name of each exchange on which registered | |
Securities registered pursuant to Section 12(g) of the Act:
None | ||
Indicate by check mark if the registrant is a well-known seasoned issuer, as defined in Rule 405 of the Securities Act. Yes ý No o
Indicate by check mark if the registrant is not required to file reports pursuant to Section 13 or Section 15(d) of the Act. Yes o No ý
Indicate by check mark whether the registrant (1) has filed all reports required to be filed by Section 13 or 15(d) of the Securities Exchange Act of 1934 during the preceding 12 months (or for such shorter period that the Registrant was required to file such reports), and (2) has been subject to such filing requirements for the past 90 days. Yes ý No o
Indicate by check mark whether the registrant has submitted electronically and posted on its corporate Web site, if any, every Interactive Data File required to be submitted and posted pursuant to Rule 405 of Regulation S-T (§232.405 of this chapter) during the preceding 12 months (or for such shorter period that the registrant was required to submit and post such files). Yes ý No o
Indicate by check mark if disclosure of delinquent filers pursuant to Item 405 of Regulation S-K (229.405 of this chapter) is not contained herein, and will not be contained, to the best of registrant’s knowledge, in definitive proxy or information statements incorporated by reference in Part III of this Form 10-K or any amendment to this Form 10-K. ý
Indicate by check mark whether the registrant is a large accelerated filer, an accelerated filer, a non-accelerated filer or a smaller reporting company. See the definitions of “large accelerated filer,” “accelerated filer” and “smaller reporting company” in Rule 12b-2 of the Exchange Act.
Large accelerated filer ý | Accelerated filer o | Non-accelerated filer o | Smaller reporting company o |
(Do not check if a smaller reporting company) | |||
Indicate by check mark whether the Registrant is a shell company (as defined in Rule 12b-2 of the Act). Yes o No ý
At June 30, 2016, the aggregate market value of the common stock held by non-affiliates of the registrant, based upon the closing price of $13.35 on that date on the New York Stock Exchange, was $525,482,139. Calculation of holdings by non-affiliates is based upon the assumption, for this purpose only, that executive officers, directors and any persons holding 10% or more of the registrant’s common stock are affiliates. There were 114,704,674 shares of the registrant’s common stock outstanding on February 17, 2017.
DOCUMENTS INCORPORATED BY REFERENCE
Portions of the definitive Proxy Statement to be delivered to shareholders in connection with the Annual Meeting of Shareholders to be held on or about April 29, 2017 are incorporated by reference into Part III.
TABLE OF CONTENTS
Page | ||
Part I | ||
Item 1. | ||
Item 1A. | ||
Item 1B. | ||
Item 2. | ||
Item 3. | ||
Item 4. | ||
Part II | ||
Item 5. | ||
Item 6. | ||
Item 7. | ||
Item 7A. | ||
Item 8. | ||
Item 9. | ||
Item 9A. | ||
Item 9B. | ||
Part III | ||
Item 10. | ||
Item 11. | ||
Item 12. | ||
Item 13. | ||
Item 14. | ||
Part IV | ||
Item 15. | ||
Forward-Looking Statements
This Annual Report on Form 10-K includes forward-looking statements, as that term is used in the Private Securities Litigation Reform Act of 1995, including information relating to anticipated growth in revenues, margins or earnings, anticipated changes in our business, anticipated future performance of our business, anticipated future investment performance of our Affiliates, our expected future net cash flows, our anticipated expense levels, changes in expense, the expected effects of acquisitions and expectations regarding market conditions, and other statements that are not historical facts. The words or phrases “will likely result,” “are expected to,” “will continue,” “is anticipated,” “can be,” “may be,” “aim to,” “may affect,” “may depend,” “intends,” “expects,” “believes,” “estimate,” “project,” and other similar expressions are intended to identify such forward-looking statements. Such statements are subject to various known and unknown risks and uncertainties and we caution readers that any forward-looking information provided by or on behalf of us is not a guarantee of future performance.
Actual results may differ materially from those in forward-looking information as a result of various factors, some of which are beyond our control, including but not limited to those discussed under the heading “Risk Factors” in Item 1A of this Annual Report on Form 10-K. Due to such risks and uncertainties and other factors, we caution each person receiving such forward-looking information not to place undue reliance on such statements. Further, such forward-looking statements speak only as of the date of this Annual Report and we undertake no obligations to update any forward looking statement to reflect events or circumstances after the date of this Annual Report or to reflect the occurrence of unanticipated events.
Our future revenue, earnings and financial performance may fluctuate due to numerous factors, such as: the earnings of our Affiliates; the total value and composition of our Affiliates’ assets under management; the concentration of revenues in limited numbers of Affiliates and asset classes; the quality and autonomous nature of our relations with our Affiliates; our Affiliates’ exposure to liability; our ability to grow our Affiliates or acquire new firms; the nature of our Affiliates’ advisory agreements; market fluctuations, client investment decisions and investment returns; our or our Affiliates’ levels of debt and expenses; our Affiliates’ ability to maintain fee levels; the integrity of our and our Affiliates’ brands and reputations; our and our Affiliates’ ability to limit employee misconduct; our and our Affiliates’ ability to manage actual or potential conflicts of interest that may arise in our business; our competitors’ performance; the performance and retention of existing personnel; our or our Affiliates’ ability to recruit new personnel; our or our Affiliates ability to launch new products; our reliance on third-party service providers; our and our Affiliates’ ability to execute strategies; our and our Affiliates’ ability to conform to compliance guidelines; potential litigation (including administrative or tax proceedings) or regulatory actions; software and insurance costs; our access to capital; fluctuations in and risks associated with real estate and timber markets; modifications of relevant tax laws or interpretations thereof and potential increases in our tax liability; the level of control over us retained by our Parent, or the outcome of our Parent’s plan to divest of us in the future; and the other factors discussed in Item 1A, “Risk Factors.”
Unless we state otherwise or the context otherwise requires, references in this Annual Report on Form 10-K to “OMAM” refer to OM Asset Management plc and for all periods after our reorganization (as described in this report, which we refer to as the Reorganization), references to the “Company” refer to OMAM, and references to “we,” “our” and “us” refer to OMAM and its consolidated subsidiaries and equity accounted Affiliates, excluding discontinued operations, after giving effect to the Reorganization. For all periods prior to the Reorganization, references to the “Company” refer to Old Mutual (US) Holdings Inc., or OMUSH, a Delaware corporation and indirect, wholly owned subsidiary of OMAM, and references to “we,” “our” and “us” refer to OMUSH and its predecessors and their respective consolidated subsidiaries and equity accounted Affiliates, excluding discontinued operations. For periods subsequent to the Reorganization, references to the “Center” refer to the holding company excluding the Affiliates and/or OMAM Inc., or OMUS, a Delaware corporation and indirect, wholly owned subsidiary of OMAM. Unless we state otherwise or the context otherwise requires, references in this Annual Report on Form 10-K to “Affiliates” or an “Affiliate” refer to the boutique asset management firms in which we have an ownership interest, and references to our Affiliates’ sponsored investment entities are “Funds.” References in this Annual Report to our “Parent” refer to Old Mutual plc. References to the “Offering” refer to our initial public offering which occurred on October 8, 2014. None of the information in this Annual Report on Form 10-K
1
constitutes either an offer or a solicitation to buy or sell any of our Affiliates’ products or services, nor is any such information a recommendation for any of our Affiliates’ products or services.
Performance measures used in this report
We present economic net income, or ENI, to help us describe our operating and financial performance. ENI is the key measure our management uses to evaluate the financial performance of, and make operational decisions for, our business. ENI is not audited, and is not a substitute for net income or other performance measures that are derived in accordance with accounting principles generally accepted in the United States, or U.S. GAAP. Furthermore, our calculation of ENI may differ from similarly titled measures provided by other companies. Please refer to “Item 7. Management’s Discussion and Analysis of Financial Condition and Results of Operations—Non-GAAP Supplemental Performance Measure—Economic Net Income” for a more thorough discussion of ENI and a reconciliation of ENI to U.S. GAAP net income.
PART I
Item 1. Business.
Overview
We are a global, diversified, multi-boutique asset management company with $240.4 billion of assets under management as of December 31, 2016. We currently operate our business through our eight Affiliates. We are currently a majority-owned indirect subsidiary of Old Mutual plc, an international investment, savings, insurance and banking group established in 1845.
Our business model combines the investment talent, entrepreneurialism, focus and creativity of leading asset management boutiques with the resources and capabilities of a larger firm. We have a permanent partnership structure with our Affiliates that preserves the unique culture that has made each of them successful and provides them with investment and day-to-day operational autonomy. We ensure that key management professionals at each Affiliate retain meaningful levels of equity in their own businesses to maintain strong alignment of interests between us, our Affiliates, their clients, and our shareholders. Our approach to investing in Affiliates includes a profit-sharing arrangement to provide incentives for growth and prudent business management across multiple generations of Affiliate partners.
We have broad and deep experience in working with boutique asset managers, and we leverage the expertise and resources within our organization to engage actively with our Affiliates and provide them with capabilities generally unavailable to specialist asset management firms. We work with our Affiliates to identify and execute upon growth opportunities for their businesses in areas such as business line expansion and product development, as well as activities critical to the operational success of investment boutiques, including talent management, risk management and compliance support. Our Center-led Global Distribution team complements and enhances the distribution capabilities of our Affiliates. Furthermore, our collaboration with our Affiliates extends to the commitment of seed and co-investment capital to launch new products and investment capital to financially support new growth initiatives. Our business development professionals, all of whom have prior experience executing M&A transactions for asset managers, facilitate growth opportunities for both us and individual Affiliates by sourcing and structuring investments in new Affiliates as well as add-on acquisitions on behalf of existing Affiliates.
2
Currently, our business comprises interests in the following Affiliates:
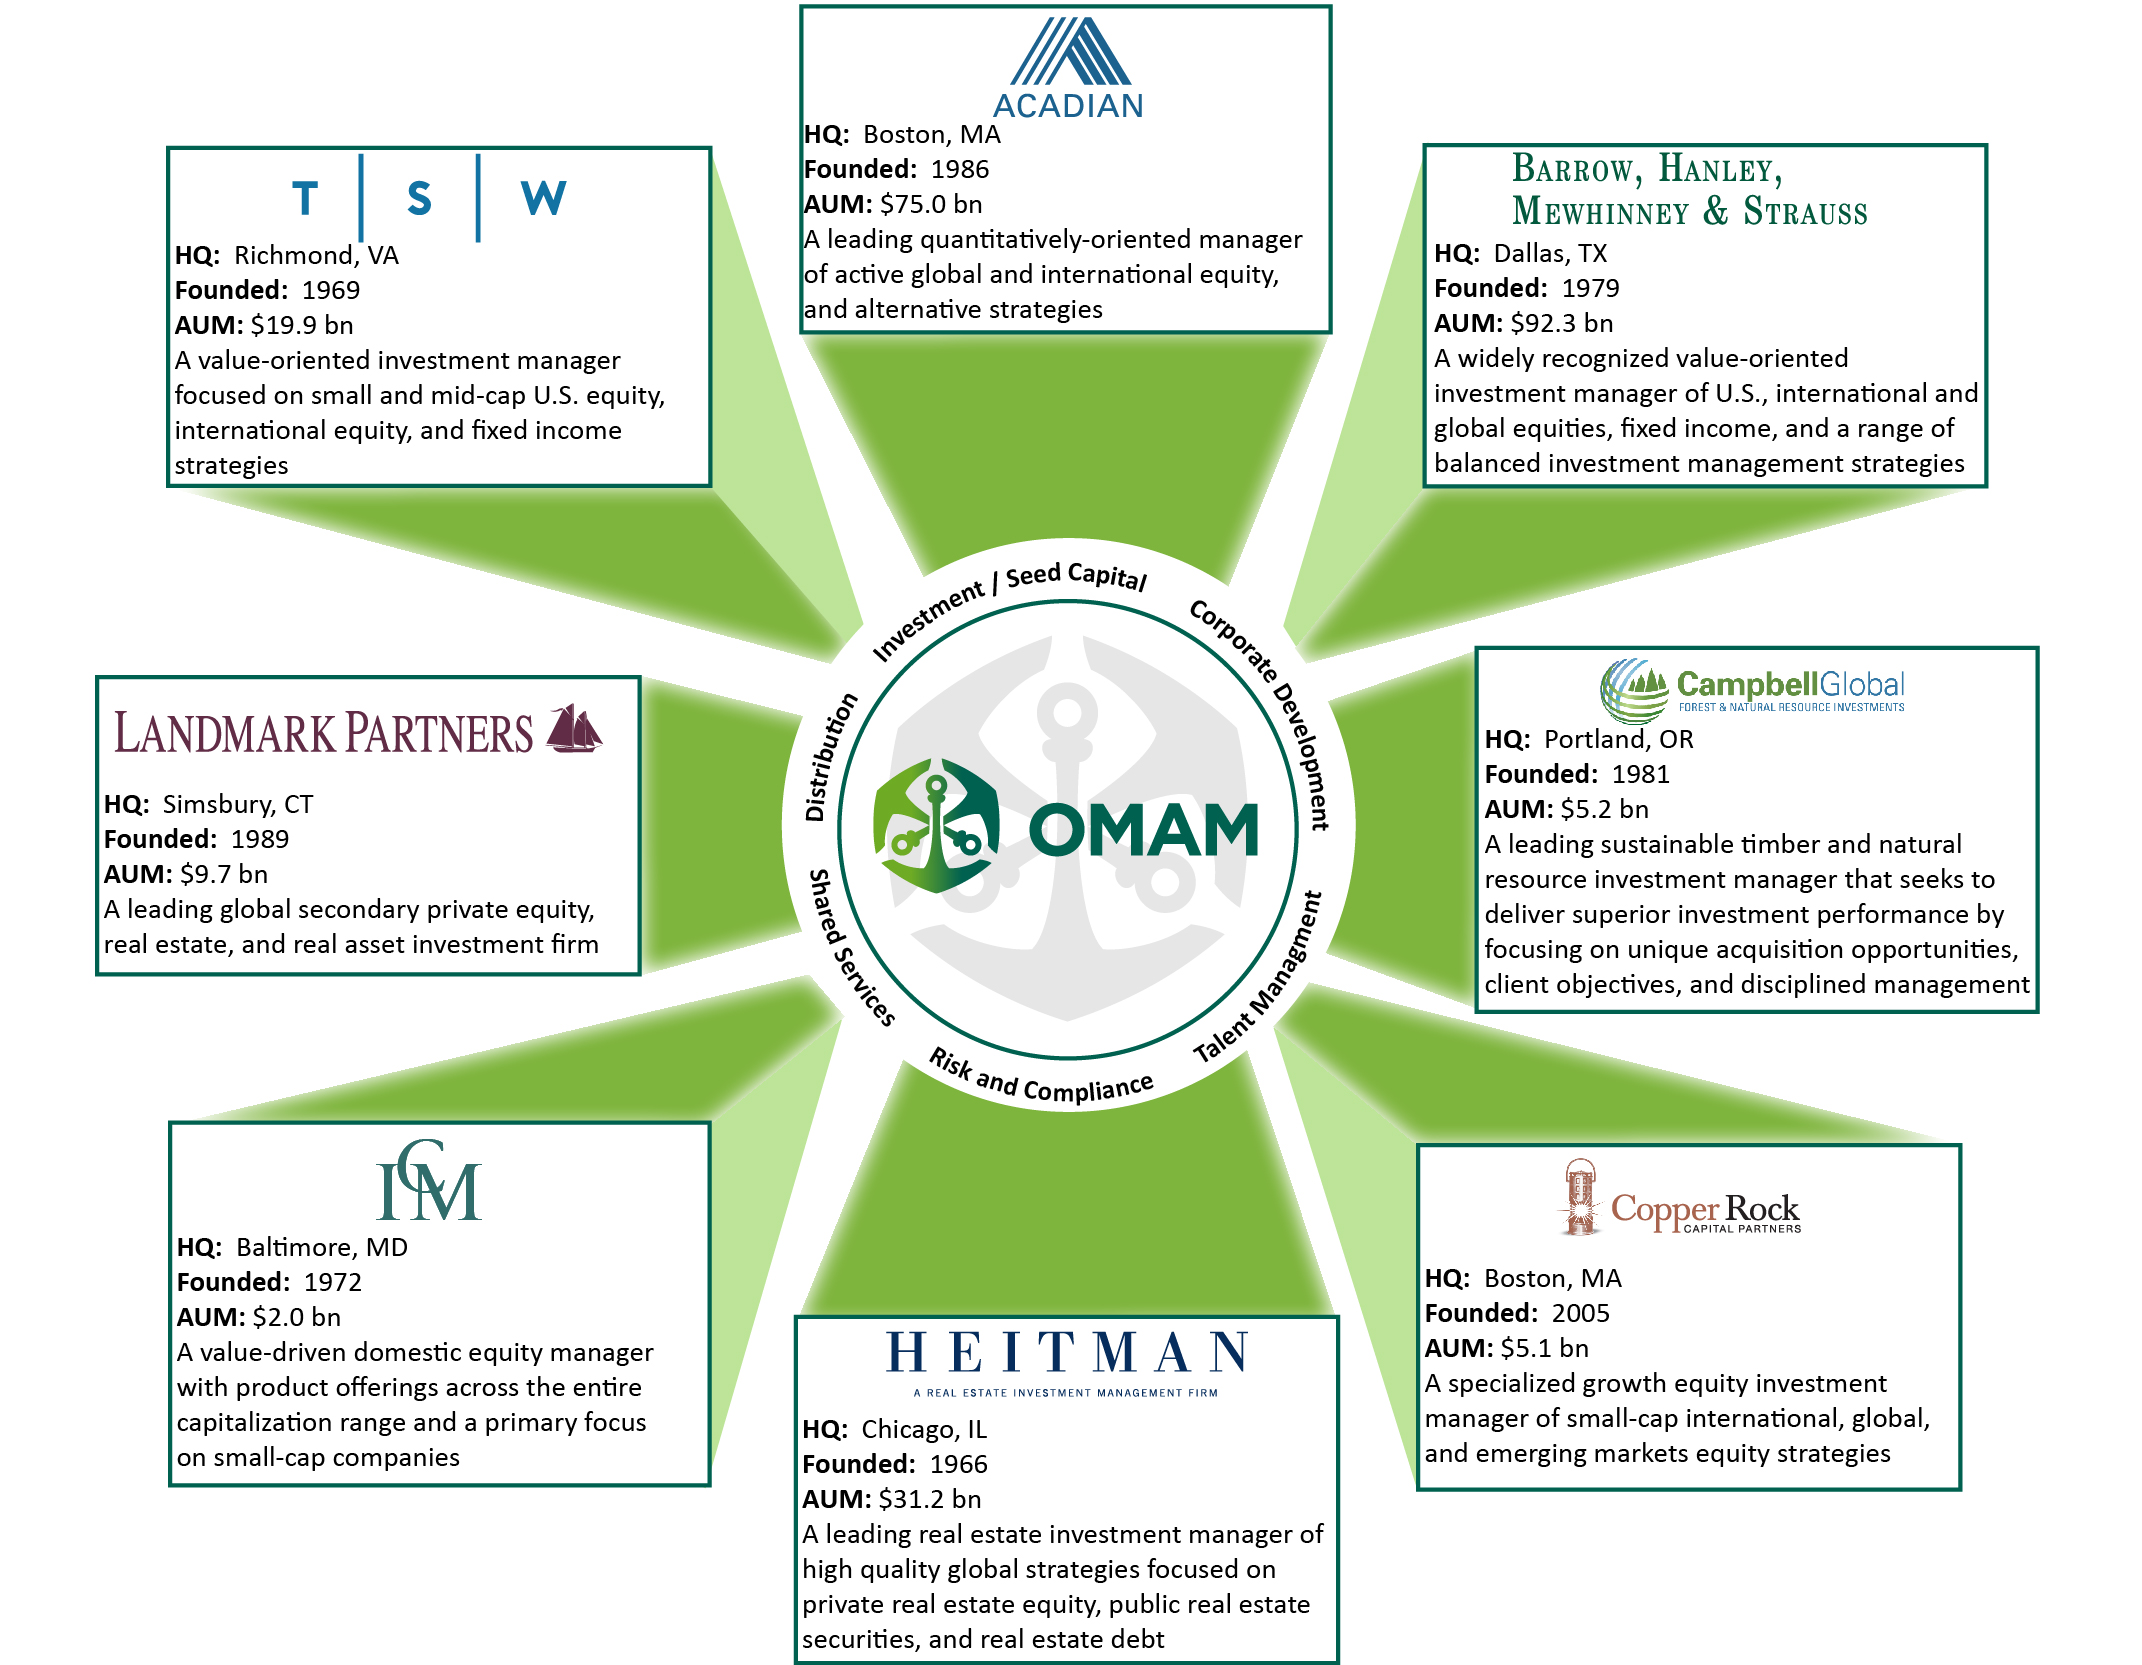
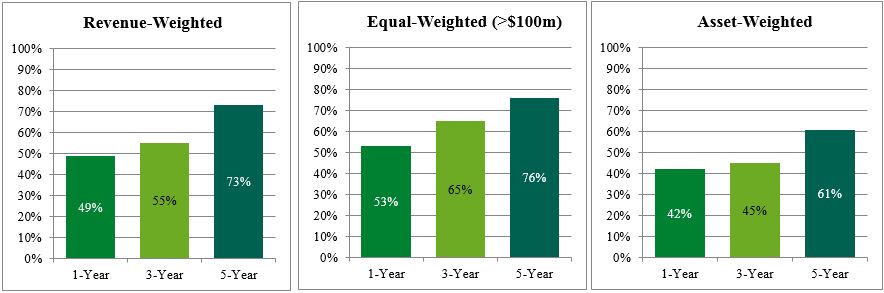
Our diversification, by Affiliate, asset class, geography and investment strategy, enhances relative earnings stability and provides multiple sources of growth for us. Collectively, our Affiliates offer 120 distinct, active investment strategies in U.S., global, international and emerging markets equities; U.S. fixed income; and alternative investments, including timber, real estate and secondary Funds. In addition, there is significant diversification within each of our Affiliate firms through the breadth of their respective investment capabilities. We believe our Affiliates have generated competitive absolute and relative performance records. As of December 31, 2016, the percentage of our revenue represented by assets under management, or AUM, outperforming their investment benchmarks on a one-, three-, and five-year basis was 49%, 55% and 73%, respectively. As a result, our Affiliates have, from 2012 through 2016, attracted five straight years of positive net revenue flows, including $11.0 million for the year ended December 31, 2016, representing 1.5% of beginning-of-period run rate management fee revenue, including equity-accounted Affiliates. For the year ended December 31, 2016, our client inflows of $29.9 billion earned a blended annualized fee rate of 41.9 bps and were concentrated in higher fee rate global/non-U.S. equities and alternative assets, while our outflows and hard asset disposals of $(31.5) billion earned a blended annualized fee rate of 36.3 bps and were concentrated in lower fee rate U.S. equity and sub-advisory assets. Client asset flows were $(1.6) billion in net flows for the twelve months ended December 31, 2016, representing (0.7)% of beginning-of-period AUM.
3
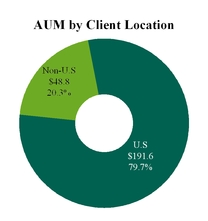
Through our Affiliates, we serve a diverse investor base in the institutional and sub-advisory channels in the U.S. and around the world. These clients are highly sophisticated, value the stability and equity ownership of our Affiliates, and typically reward our Affiliates’ strong process-driven investment performance with long-term relationships and asset flows. Our sub-advisory clients also provide access to the growing retail and defined-contribution marketplace where decision makers take a more institutional approach to choosing asset management providers. Our Affiliates currently manage assets for non-U.S. clients in 30 countries, including Australia, Canada, Ireland, Japan, the Netherlands, South Africa, South Korea, Switzerland, and the United Kingdom. Our Center-led Global Distribution platform, launched in 2012, has contributed to the increase of our non-U.S. assets under management. As a result of this effort, in the past five years, we have raised $12.9 billion of new client assets for our Affiliates.
Positive net revenue flows and investment performance, in conjunction with the successful execution of our business strategy, have led to growth in revenues and net income. We measure financial performance primarily through ENI, a non-GAAP measure that we believe better reflects our underlying economic performance and returns to shareholders. Our ENI revenues grew from $450.8 million in 2012 to $678.5 million in 2016, or a compound annual growth rate, or CAGR, across those years of 10.8%. Over this period, our pre-tax ENI grew from $131.3 million in 2012 to $190.7 million in 2016, a CAGR of 9.8%. Our U.S. GAAP revenues excluding consolidated Funds were $435.6 million in 2012 and $663.4 million in 2016, representing a CAGR of 11.1%. Our U.S. GAAP net income from continuing operations attributable to controlling interests increased from $24.0 million in 2012 to $120.2 million in 2016, a CAGR of 49.6%. For additional information regarding economic net income, and reconciliations to U.S. GAAP, see “Management’s Discussion and Analysis of Financial Condition and Results of Operations—Non-GAAP Supplemental Performance Measure—Economic Net Income.”

Total AUM: $240.4 billion
$ in billions as of December 31, 2016
4
Competitive Strengths
We believe our success as a multi-boutique asset management company is driven by the following competitive strengths:
Well-Established, Diverse Affiliates. Through our eight Affiliates, we are well-diversified by brand, strategy and asset class, providing multiple sources of revenue and growth opportunities for our business across global market cycles, while limiting downside risk. Each Affiliate has its own brand and investment processes and generally operates in distinct asset classes. Our assets under management across Affiliates are invested in both U.S. and global/non-U.S. equities (34.1% and 40.1%, respectively) as well as fixed income and alternative assets, including timber, real estate and secondary Funds. We are also well-diversified by investment strategy within each asset class, with 120 distinct investment strategy composites. The breadth of our investment capabilities and distinct brand identities appeal to a wide range of clients. We have a well-diversified client base with low levels of client concentration. Our business serves over 900 institutional and sub-advisory clients, with our top 25 client relationships representing approximately 31% of run rate gross management fee revenue, including our equity-accounted Affiliates, as of December 31, 2016. Total run rate gross management fee revenue reflects the sum for each account at each of our eight Affiliates, of the product of (a) assets under management in each account at December 31, 2016, multiplied by (b) the relevant management fee rate on that account. This calculation includes all accounts at each of our equity-accounted Affiliates.
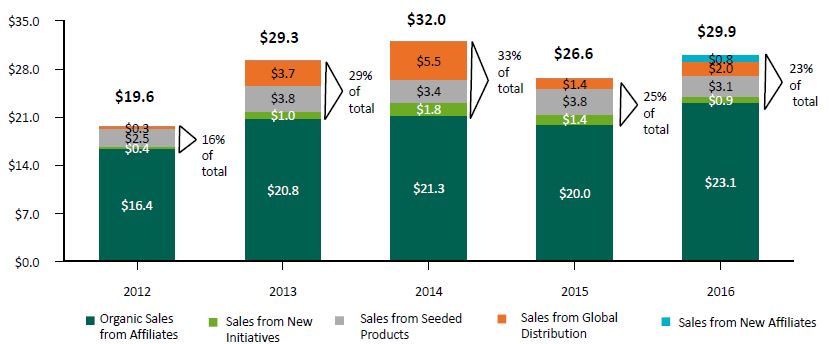
Differentiated Multi-Boutique Model Drives Growth. Our business is differentiated among multi-boutique asset management firms by our focus on active engagement with our Affiliates to enhance their organic growth potential. We have a two-pronged approach for successfully collaborating with our Affiliate firms. First, we align our interests with those of our Affiliates by providing Affiliate partners with equity in their own firms and through a profit-sharing structure that sets bonuses as a percentage of pre-bonus profit. This structure gives our Affiliate partners meaningful wealth creation opportunities through equity ownership and encourages investments in long-term growth while maintaining an appropriate focus on profitability, efficient capital management and risk control. Second, we offer our Affiliates strategic and financial support to grow and enhance their businesses. Strategic guidance includes helping Affiliates to expand into new products, strategies, geographies or channels, including through lift-outs of new investment teams or the acquisition of add-on businesses, as well as seed and co-investment capital to help launch new investment strategies. In addition, our Center-led Global Distribution team complements and enhances the distribution capabilities of our Affiliates. We also help Affiliates with talent management, risk management and compliance support, as well as other shared services. Utilizing our strategic capabilities enables our Affiliates to capitalize on growth opportunities while maintaining their focus on delivering superior investment performance, innovative offerings, and excellent service to their clients. In 2016, 23% of the Company’s gross sales resulted from Center-led initiatives, including sales from a new Affiliate.
Track Record of Competitive Investment Performance Across Market Cycles. Our Affiliates have produced competitive long-term investment performance across their product offerings, generating outperformance relative to benchmarks across market cycles. Through December 31, 2016, 96 of our Affiliates’ 114 strategies that have performance benchmarks have outperformed their relevant benchmarks since inception. These strategies represent 96% of the total assets in the 114 strategies that have performance benchmarks. Investment performance is calculated on a gross basis, excluding the impact of management, administration, and performance fees. Based on our current average management fee rate, investment returns net of fees would be on average approximately 35 bps lower than gross returns (excluding products which are not benchmarked). For the rolling 10-year period ending December 31, 2016, approximately 92% of benchmarked assets have outperformed their relevant benchmarks. Our Affiliates’ five largest benchmarked investment strategies, Barrow, Hanley, Mewhinney & Strauss (BHMS) Large Cap Value, Acadian Asset Management (AAM) Emerging Markets Equity, AAM Global Equity, AAM Global Managed Volatility, and TSW International have each outperformed their relevant benchmarks since inception by 1.3%, 2.9%, 1.7%, 2.4%, and 1.9%, respectively, on an annualized basis.
5
Attractive Financial Model. Our multi-boutique model generates strong, recurring free cash flow to our business that we can use for growth initiatives on behalf of existing Affiliates, investments in new Affiliates, or return to shareholders through dividends and stock repurchases. Our ENI revenue has grown 10.8% annually since 2012 as net client cash flows generated positive annualized revenue in each year from 2012 through 2016. Our revenue consists largely of recurring management fees on assets under management and is not heavily dependent upon more volatile performance fees. We earn an attractive margin on revenue enhanced by our profit-sharing model that enables us to participate directly in margin expansion as our Affiliates grow. Our ENI operating margin (calculated before Affiliate key employee distributions) grew from 33% for 2012 to 37% for 2015, before falling to 35% in 2016 as we continued to invest in the business. Our comparable U.S. GAAP operating margin was (9)% for 2012 (21% excluding consolidated Funds) and 23% for 2016 (23% excluding consolidated Funds).
Experienced Multi-Boutique Management Team. The members of our senior management team have significant experience in the asset management industry, with a particular focus on managing multi-boutique businesses. With an average industry tenure of approximately 27 years, each of our senior executives brings a deep understanding of how to structure and maintain relationships that provide Affiliate firms with the proper incentives and resources to continue to generate strong growth. In 2011, our senior management team took over a business that generated $112.3 million of pre-tax ENI (including discontinued operations). The team led a significant restructuring of the Company that resulted in an 81.7% increase in pre-tax ENI to $204.1 million in 2014, while significantly improving net client revenue flows and margins.
Strong Growth Prospects from New Affiliate Partnerships. We have established a reputation as a collaborative and supportive partner to our Affiliates and seek to partner with additional high quality managers who provide scalable institutional quality investment capabilities in asset classes in which we seek an enhanced presence. We have a strong pipeline of potential opportunities generated from our long-standing relationships across the industry, our internal prospecting activities, and our relationships with intermediaries. We have a well-defined set of criteria for executing investments in new Affiliates and believe we can enhance growth and diversify risk across our business by selectively expanding our portfolio of investment boutiques. We believe our business model is attractive to the owners of boutique asset management firms, as it provides them an opportunity to realize a portion of the value they have created, while maximizing the value of their retained equity by accelerating the growth of their businesses alongside an experienced and supportive partner.
In August 2016, we acquired a majority equity interest in Landmark Partners, LLC, or Landmark, a leading, global secondary private equity, real estate, and real asset investment firm. Landmark has produced strong returns for its investors since inception in 1989, and is well positioned for continued growth. In addition, our partnership will enable us to work collaboratively with the Landmark team to expand their product set and further diversify their business into emerging secondary asset classes. Our Global Distribution team will also work with Landmark to bring its products to new markets outside the U.S.
6
Growth Strategy
The cornerstone of our multi-boutique model is to combine the investment talent, entrepreneurialism, focus and creativity of leading asset management boutiques with the expertise and capital of a larger firm in areas where our resources can provide distinct advantages. We provide strategic capabilities to our Affiliates, enabling them to focus on delivering superior investment performance, innovative offerings, and excellent service to their clients. We strive to maintain and enhance the characteristics which have made our Affiliates market leaders in their areas of expertise, namely their cultures, investment processes, incentive structures and brands. Our focus is working with a select group of diverse Affiliates with whom we can build scalable business platforms leveraging their core investment and distribution capabilities.
Our growth strategy is based on the incentives inherent in our aligned partnership model. As a permanent partner dedicated to providing our Affiliates with operational autonomy, our structure is designed to align our economic interests with those of our Affiliates to promote long-term client-driven growth. Through retained Affiliate equity ownership and a profit-sharing partnership model, we ensure appropriate focus on key issues critical to the long-term success of each Affiliate, particularly investment performance, client service, talent management and risk management.
Our future growth and success will be driven by the following four core strategies:
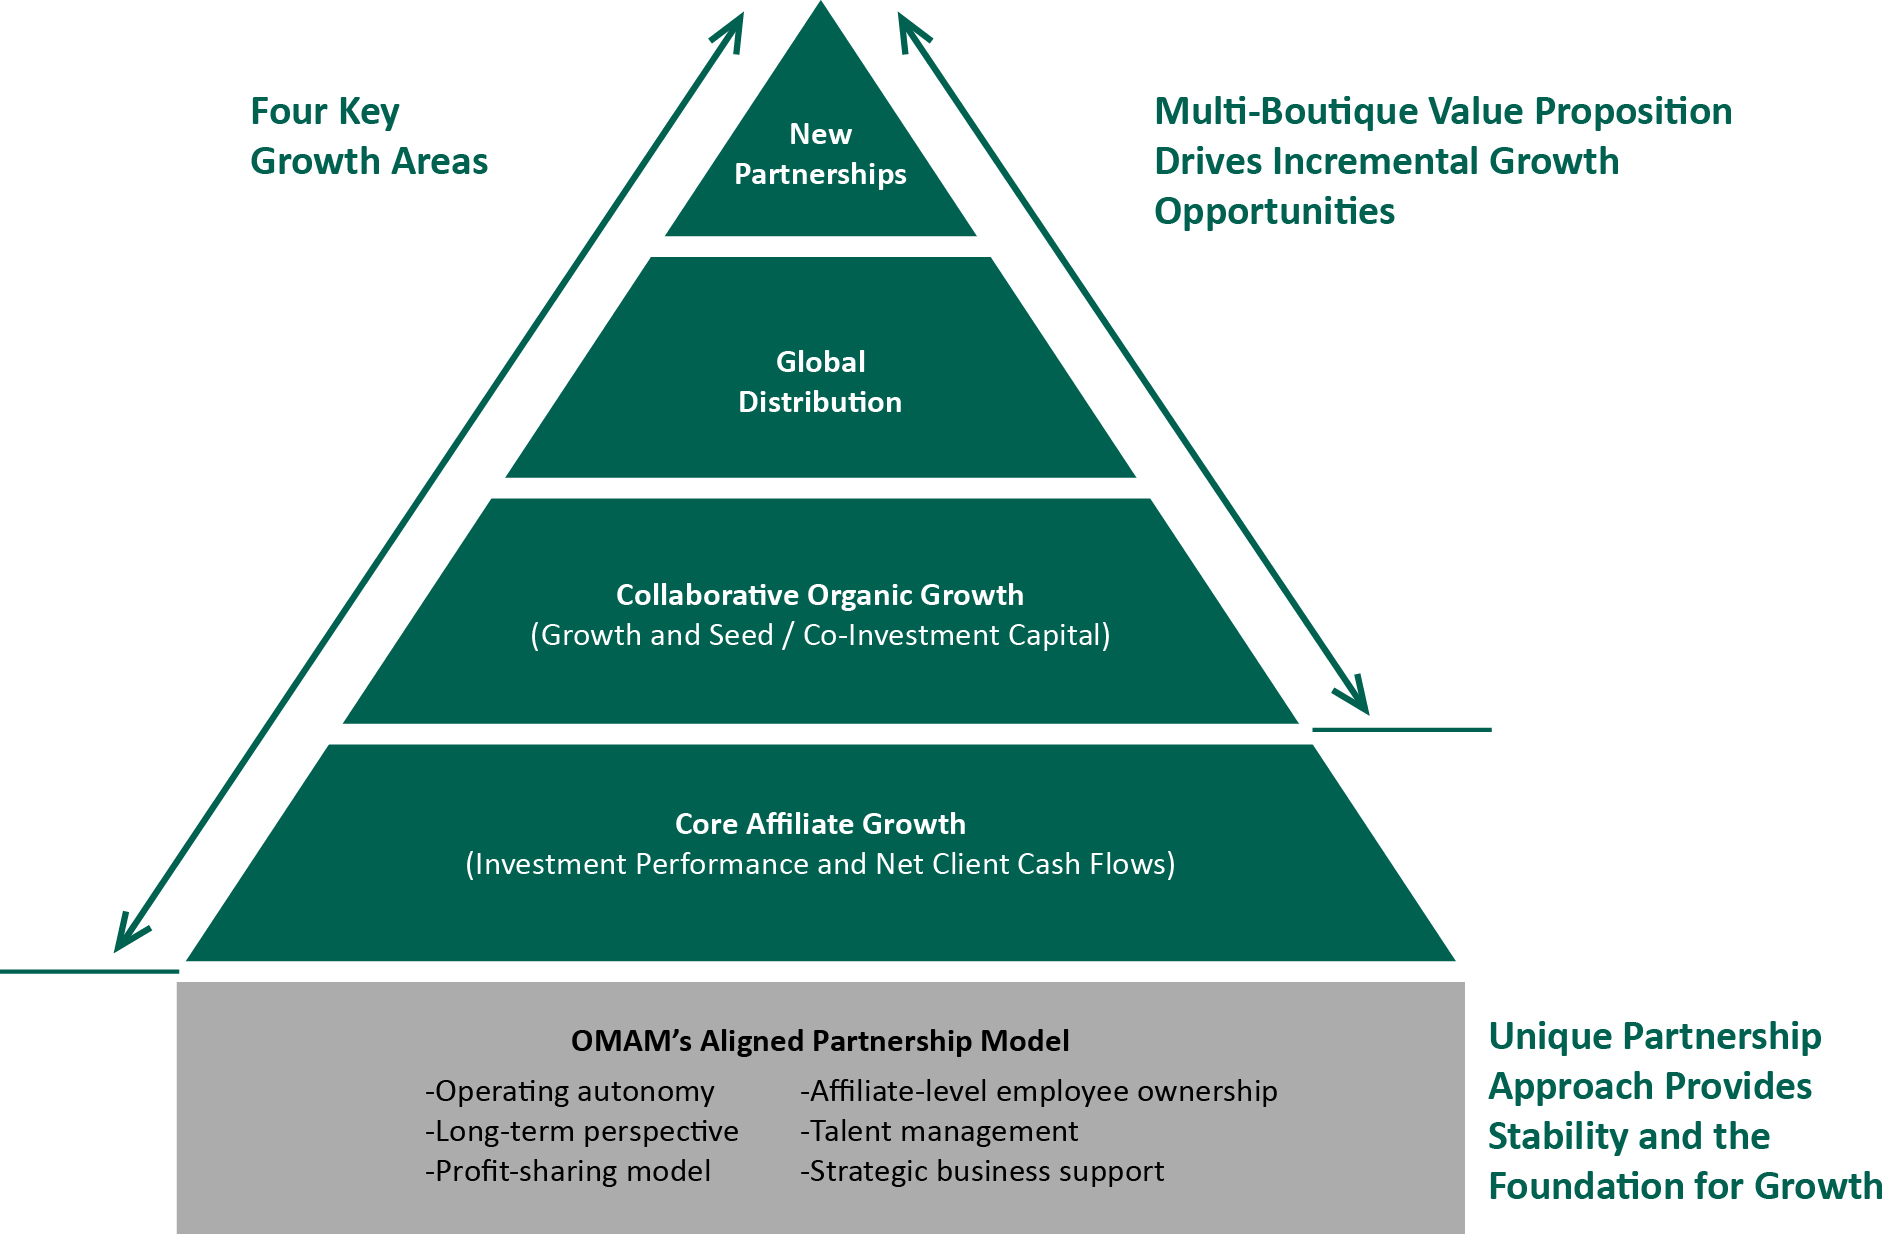
Core Affiliate Growth. Our growth strategy is rooted in core Affiliate growth. Our Affiliates are strong, at-scale investment management boutiques with highly-defined and rigorous investment strategies for which there is real demand in the institutional marketplace. Our Affiliates have excellent long-term performance records and have generated strong growth through net client revenue flows. See “—Affiliates”
7
Collaborative Organic Growth. Our collaboration with our Affiliates enables them to grow and enhance their businesses in ways that they could not do on their own. We leverage the broad industry experience of our senior management to evaluate, structure, and support Affiliate growth opportunities, including expansion into new products and strategies, geographies and channels. In addition, we provide seed and co-investment capital to help launch new products. See “—Collaborative Growth Initiatives”
Global Distribution. Our Affiliates are recognized for their long-term investment performance and high quality client service, and have strong client and consultant relationships in their core institutional marketplaces. However, there are certain areas of distribution outside of their core markets that are more scale-oriented or specialized in nature. To assist our Affiliates in penetrating these markets, we offer a range of distribution capabilities in a transparent, opt-in partnership-based model that is supported by an experienced sales team focused on cultivating broad and deep relationships within the U.S. sub-advised and variable annuity channels and non-U.S. institutional markets. See “—Distribution Model and Client Base” for further discussion of our Center-led Global Distribution platform.
Investments in New Affiliates. We will selectively pursue partnerships with additional boutique asset managers that can enhance our growth potential and diversify our earnings drivers. Our partnership strategy targets asset classes that complement our existing Affiliates’ capabilities or provide additional expertise in capacity-constrained investment strategies. Within each asset class, we seek to partner with market leaders that have track records of operating as successful, stand-alone enterprises. We target profitable and growing businesses that have the potential to build a meaningful global presence in a given asset class. Asset class attractiveness, operating scale, and depth of talent are prerequisites to partnership. However, cultural fit and a shared strategic vision ultimately provide the foundation for a successful relationship.
Successful Execution of the Growth Strategy
Since 2012, the execution of the growth strategy described above has contributed meaningfully to an increase in gross sales at the Company. On an annual basis, between 16% and 33% of gross sales can be directly tracked to Center-led activities including new initiatives, product seeding, global distribution, and sales from new Affiliates acquired by the Company. The chart below breaks out these sales contributions by category.
Sources of Gross Sales, 2012 through 2016 ($ in billions)
8
Our Operating Model and Holding Company Activities
Overview
We manage our business through eight Affiliates, each of which operates autonomously and employs its own distinct investment processes. We work with our Affiliates to identify and execute upon growth opportunities in areas such as distribution, business line expansion and product development, as well as in activities critical to the success and stability of boutique asset managers, including talent management, risk management and compliance support. Our collaboration with our Affiliates extends to the commitment of seed and co-investment capital to launch new products and investment capital to financially support new growth initiatives. We also provide focused shared service support in areas our Affiliates desire. We align incentives with our Affiliates through our permanent partnership structure, which provides employee partners of our Affiliates with equity in their respective firms through an equity recycling program, and participation in established profit-sharing arrangements.
Affiliate Partnership Model
We are a permanent partner dedicated to providing our Affiliates with operational autonomy in a structure that aligns our common economic interests. By offering Affiliate management direct participation in the growth and profitability of their businesses through equity ownership and a profit-share-based bonus pool, we provide our Affiliates with a strong incentive to manage their businesses for the long-term, investing with us to build equity value over time.
• | Affiliate Operating Autonomy. Affiliates retain day-to-day operating autonomy over their businesses, including decisions related to hiring, compensation, investment processes, product distribution and branding. We retain oversight through Affiliate board representation, remuneration committee participation, and certain approval rights, including approval of each Affiliate’s annual business plan. |
• | Affiliate Partners Have Retained Equity in their Own Firms. Partners in each of our Affiliates own meaningful equity positions in their respective businesses. Among our consolidated Affiliates, their equity stakes range from approximately 15% to 40%, in some cases following a distribution preference to OMAM. Affiliate equity, which in certain cases may be put back to us over time at a fixed multiple of trailing earnings, subject to limits, allows partners to benefit from long-term increases in their franchise value. We facilitate the recycling of Affiliate equity back to the next generation of Affiliate partners at the same multiple so that the impact to us is generally cash-neutral. |
• | Profit-Share Economics. Rather than invest in a fixed percentage of Affiliate revenues (a “revenue-share” model), Affiliate partners and we each invest in the underlying profits of their respective businesses, a model we refer to as a “profit-share” model (with the exception of ICM, which has a revenue-share model). ICM’s revenue share model is a legacy economic arrangement that has not been restructured. Distributions of profit to the Affiliate equity-holders are based on their proportionate ownership of their businesses, in some cases following a preferred return to us. In addition, bonus pools for Affiliates are typically contractually set at 25% to 35% of Affiliate pre-bonus profit. This enables us to participate in the margin increases of our Affiliates, while incentivizing Affiliate management and us to jointly support growth initiatives. For additional information on our profit-sharing model, see “Management’s Discussion and Analysis of Financial Condition and Results of Operations—The Economics of Our Business.” |
Collaborative Growth Initiatives
Our business is differentiated from other multi-boutique asset management companies by our focus on active engagement with our Affiliates to enhance their organic growth potential. Our collaboration with Affiliates generally consists of the following:
• | Strategic Affiliate Growth Opportunities. As part of our partnership approach with Affiliates, we play an active role in working alongside Affiliates to identify and analyze potential growth strategies for their businesses. Dedicated professionals at OMAM help to formulate a plan of execution and develop an economic structure to appropriately share risk and reward between us and Affiliate equity-holders. |
We have collaborated with our Affiliates on a number of growth initiatives to further diversify and strengthen our business. Our Affiliates have been able to leverage our strategic capabilities in areas such as capital support (including seed capital and co-investments), corporate development, global distribution, product expansion, and talent acquisition and management to strengthen their franchises. Our strategic
9
support has accelerated, and continues to accelerate, our Affiliates’ growth through a range of collaborative projects including, among other things, (i) the creation of new and complementary investment products through both the extension of existing proficiencies as well as the acquisition of new talent, (ii) the introduction of an Affiliate’s business line into global markets through the development and support of a framework for expansion (including evaluating acquisition opportunities and advancing distribution), and (iii) the development of best in class operational infrastructure to support further growth.
• | Seed Capital. As of December 31, 2016, we have approximately $125 million committed to seed capital, which is currently invested in 27 products across seven different asset classes. Our Affiliates’ use of seed capital generally falls into two categories: incubation capital and scale capital. Incubation capital is used to establish a track record for a new investment strategy. These new strategies generally take three to five years to season to the point where they are recommended by consultants or become attractive for clients. Alternatively, scale capital is used to extend a product with an established track record into a co-mingled fund, and is generally outstanding for a shorter period of time. Scale capital allows third-party clients to invest in the new fund without individually representing too substantial a percentage of the vehicle. Over $18 billion of our current AUM are in products which have been seeded by us since 2004, and our seeding program has generated an annualized internal rate of return to OMAM and our Parent of approximately 26% over this period, including investment returns on the seeded products and the incremental value generated by third party assets raised, including annual profits and a terminal value. |
We expect to maintain our seed portfolio at approximately $125 - $150 million to support product development on an ongoing basis. At December 31, 2016, approximately $83 million of seed capital under management was provided by our Parent. As part of the ongoing evolution of our relationship with our Parent, in June 2016 we agreed to purchase all remaining seed capital investments provided by our Parent on or around June 30, 2017.
• | Co-Investment Capital. We also provide co-investment capital to support the formation of closed-end, long-term partnerships managed by our Affiliates. These fixed-life partnerships typically require us and/or the Affiliate to invest 1% to 3% of the product’s capital to align interests with those of their clients. Of our current $35.0 million portfolio of co-investments at fair value ($18.8 million of which is owed to or directly owned by our Parent), 87% is managed by Heitman (investing in real estate) and 13% is managed by Campbell Global (investing in timber). In consideration for providing co-investment capital, which is typically illiquid for approximately seven to ten years, we receive returns on our underlying partnership investment, our proportionate share of profits on assets in the fund, and the potential for fund incentive fee allocations. In connection with the Offering, as discussed further in “—Business History” herein, we entered into a co-investment deed with our Parent to provide it with the economic benefits related to the return of capital and incentive fee allocations with respect to specified co-investments currently held on our balance sheet. In addition, in the fourth quarter of 2015 we provided approximately $50 million of interim financing to Campbell Global for a $420 million U.S. timberland acquisition. This financing was repaid when the property was sold to a third-party investor in January 2017. |
Strategic Business Support
While each of our Affiliates operates on an autonomous basis, we seek opportunities to increase efficiency and promote the long-term stability of their respective businesses by offering strategic support. This support typically leverages our scale across the Affiliate base or provides distinctive strategic operational expertise to our Affiliates.
• | Talent Management. We are highly focused on talent management and have significant experience collaborating with Affiliates to develop talent, design incentive structures, promote continued Affiliate equity ownership and establish succession plans. A key area of focus is senior management succession planning. While this is an infrequent occurrence at each Affiliate, it represents a key point of vulnerability and opportunity that is highly scrutinized by both clients and employees. Our objectivity and experience as an external partner has been instrumental in managing through the challenges of a number of successful succession processes at our Affiliates. |
10
• | Risk Management and Compliance Support. Our Affiliates maintain comprehensive risk management and compliance functions, supplemented by our own, Company-based risk management and compliance teams. Our dedicated risk, legal and compliance teams work through a well-established reporting and communication structure to constantly assess risk in the context of the execution of our and our Affiliates’ business strategies. We also provide a centralized internal audit function. We view risk management as a continuous part of the management process and have created a consistent, holistic program to identify, assess, communicate and monitor risk throughout our organization. |
• | Shared Services. We offer shared services to our Affiliates in areas such as operational support, human resources, payroll and benefits administration, finance and accounting, information technology outsourcing and security, eBusiness support, and risk management systems. Affiliate participation in these services is optional; however, all of our Affiliates currently participate in one or more of our shared services. The shared services we provide generally are charged back to Affiliates on a cost-basis. |
Capital Management
Our asset management business generates significant, recurring free cash flow that can be re-invested in the growth-oriented strategies described above to create value for our shareholders. Strategic and efficient management of our Company’s capital underpins our approach to investing in these strategies. In particular, we believe we can generate strong returns on allocated capital by (i) providing seed capital to fund new products and strategies; (ii) committing co-investment capital to launch new fund partnerships in which our Affiliates act as the general partner; (iii) providing investment capital to support organic growth; (iv) investing in new Affiliates; and (v) implementing opportunistic share repurchase programs. Management undertakes detailed business case analyses with respect to all investment opportunities, and only considers those that yield an acceptable return while operating within the parameters of our risk appetite.
Holding Company Management Team
Since 2011, when a number of key executives joined OMAM, including our CEO and CFO, our senior management team has defined a core set of operating principles and repositioned our business around them. As a result, we refocused our business strategy on market-leading, institutionally-driven, active investment management, which led to a rationalization of our Affiliate base. In addition, our senior management realigned our structure to focus on supporting our Affiliates in areas where we believe we can provide the greatest benefit, particularly collaborative growth initiatives, talent management and shared services. Our team also developed and launched our Global Distribution platform to expand our Affiliates’ marketing reach into specialty U.S. distribution channels and non-U.S. markets. Additionally, our management team successfully led our Company through its initial public offering, two subsequent secondary offerings, as well as the acquisition of Landmark Partners in 2016, which represented the first new Affiliate investment since our management team joined OMAM. For additional details, refer to “—Business History” herein.
11
Overview of Affiliates

Acadian Asset Management LLC, or Acadian ($75.0 billion in AUM as of December 31, 2016), founded in 1986, is a leading quantitatively-oriented manager of active global and international equity, and alternative strategies. The firm pursues a fundamentally-grounded, data rich and highly structured approach to investing that seeks to identify and exploit systematic and structural inefficiencies in the markets. Acadian applies a range of investment and risk considerations to a universe of over 33,500 securities taken from 100 global markets. Managed strategies include global, international and emerging markets equities, long/short strategies, and managed volatility strategies. Its flagship Emerging Markets Equity strategy has outperformed its benchmark, MSCI Emerging Markets (Net), by 2.9% (USD, gross of fees) on an annualized basis since its inception in 1994 through December 31, 2016.
Acadian invests on behalf of a wide range of institutional clients across the globe, including public and private funds, endowments and foundations, and retail clients through sub-advisory channels. The firm’s clients are domiciled in over 17 countries across Asia, Australia, Europe and North America. Acadian’s management team is led by Chief Executive Officer Churchill Franklin and Chief Investment Officer John Chisholm. The firm has 94 investment and research professionals and manages approximately 60 distinct investment strategies.

Barrow, Hanley, Mewhinney & Straus LLC, or Barrow Hanley ($92.3 billion in AUM as of December 31, 2016), founded in 1979, has an outstanding long-term track record of providing its clients with superior performance and client service in a wide range of value-oriented investment strategies. The firm applies a strict definition of value that guides all of its investment decisions, as it employs disciplined, bottom-up analysis to construct value equity portfolios of U.S., non-U.S., global and emerging market securities that exhibit below-market price-to-earnings ratios, below-market price-to-book ratios, and above-market dividend yields, regardless of market conditions. The firm’s value-oriented fixed income portfolios seek to achieve higher total returns with below-benchmark volatility by identifying temporarily mispriced securities with yield-to-maturity advantages over Treasury bonds of comparable maturity. Barrow Hanley’s flagship large cap value equity product, which had over $45.7 billion in assets at December 31, 2016, has a 37-year track record.
Barrow Hanley has a diverse and longstanding clientele; more than 25 of its clients have maintained their relationships with Barrow Hanley for more than 20 years. In addition to direct relationships with institutional investors, the firm serves as a sub-advisor to more than 45 highly regarded mutual funds, and is one of four external sub-advisors managing the $47 billion Vanguard Windsor II Fund. The firm is led by executive directors James Barrow and Ray Nixon, Jr. and a team of 20 managing directors specializing in multiple asset classes. The firm has 41 investment professionals managing 25 distinct strategy composites.
12
Overview of Affiliates (cont.)

Campbell Global LLC, or Campbell Global ($5.2 billion in AUM as of December 31, 2016), founded in 1981, brings more than three decades of experience and leadership to sustainable timberland and natural resource investment management. As a full-service firm, it acquires and manages timberland for investors, while providing high quality service and expert management. The firm delivers superior investment performance by focusing on unique acquisition opportunities, client objectives, and disciplined management. Campbell Global currently manages more than 2.6 million acres (1.1 million hectares) worldwide.
Campbell Global has a diversified institutional client base that includes corporations, governments and endowments. As of December 31, 2016 the firm employed over 231 individuals across the U.S., Australia, Brazil and New Zealand, and provides its clients with an integrated, full-service approach to timberland investment through its broad expertise in sourcing and executing timberland acquisitions, as well as asset management and disposition. Campbell Global’s management team is led by Chief Executive Officer and Chairman John Gilleland. The firm has 34 investment professionals managing its investment portfolio.

Copper Rock Capital Partners LLC, or Copper Rock ($5.1 billion in AUM as of December 31, 2016), founded in 2005, offers specialized, growth equity investment management focused on small and small/mid-capitalization strategies in international, global and emerging markets growth equities. Copper Rock’s investment strategy seeks to outperform in up-markets due to the firm’s pure fundamental growth approach and also to protect clients’ capital through portfolio construction and a strong sell discipline.
Copper Rock’s client base includes pension plans, institutional investors and mutual funds located in the U.S., Canada, the United Kingdom, Ireland, Denmark, South Africa and Australia. Copper Rock’s management team is led by the firm’s Chairman and Chief Investment Officer Steve Dexter and Chief Executive Officer Mike Forrester. The firm has seven investment professionals managing four distinct investment strategies.
13
Overview of Affiliates (cont.)

Heitman LLC,* or Heitman ($31.2 billion in AUM as of December 31, 2016), founded in 1966, globally invests in and manages portfolios of real estate and real estate securities for its clients, which include public and corporate pension funds, endowments and foundations, and private investors. Heitman’s investment expertise is centered in the three primary segments of the global real estate property and capital markets: private real estate equity, public real estate securities and real estate debt.
With headquarters in Chicago and ten other offices worldwide, Heitman’s investment teams are based on the ground in the key global markets, providing its investment professionals with a deep understanding of the local and regional real estate dynamics needed to implement its strategies.
The firm’s management team is led by its Chief Executive Officer, Maury Tognarelli. As of December 31, 2016, Heitman had eighteen portfolio managers covering private equity, public securities and real estate debt. The firm’s clients are supported by 34 professionals situated around the globe whose sole responsibilities are dedicated to client service and marketing.
* accounted for under the equity method of accounting.

Investment Counselors of Maryland, LLC,* or ICM ($2.0 billion in AUM as of December 31, 2016), founded in 1972, focuses on value-driven equities and invests through a well-established, bottom-up investment process that it applies across the entire capitalization range, with an emphasis on small- and mid-cap companies. The firm employs a team orientation in making investment decisions. Each member of ICM’s investment team has a sector focus and is responsible for generating and analyzing ideas within that sector. The most promising investment ideas are reviewed by the entire team, and the ultimate buy/sell decisions are made by the respective portfolio manager teams.
For over four decades, ICM has been managing assets for institutional clients and high net worth individuals through separate accounts and an institutional mutual fund, and has generated excellent results for its clients over this time. ICM’s management team is led by Managing Partner and Chief Investment Officer, William V. Heaphy. The firm has eight investment professionals managing four distinct investment strategies.
* accounted for under the equity method of accounting.
14
Overview of Affiliates (cont.)

Landmark Partners, LLC, or Landmark ($9.7 billion in AUM as of December 31, 2016), founded in 1989 and acquired by OMAM in August 2016, specializes in secondary market transactions of private equity and real estate investments. The firm has one of the longest track records in the industry and is a leading source of liquidity to owners of interests in real estate, real asset, venture, mezzanine, and buyout limited partnerships. Landmark has formed 29 Funds over the last 26 years. These Funds have been capitalized at more than $15.5 billion, which has been deployed across over 1,900 partnership interests that comprise over 25,000 underlying company and property investments.
Landmark’s investor base is mostly comprised of institutional investors including: sovereign wealth funds, public pensions, corporate pensions, insurance companies, asset managers, and foundations located globally.
Landmark is led by President and Managing Partner, Timothy Haviland and Chairman and Managing Partner, Francisco Borges, supported by a team of ten Partners. As of December 31, 2016, Landmark employed 92 individuals across four offices in Boston, MA; New York, NY; and Simsbury, CT in the United States and London in the United Kingdom.

Thompson, Siegel & Walmsley LLC, or TSW ($19.9 billion in AUM as of December 31, 2016), founded in 1969, applies a value-oriented investment approach across a range of products in U.S. and international equities, fixed income and alternative investments. TSW’s singular investment objective is to outperform its benchmarks, net of fees, over rolling three- to five-year periods. TSW employs a proprietary screening process to generate focused lists of companies that are most attractive within different market capitalization ranges. The firm’s investment teams then use fundamental analysis to construct portfolios, which they believe possess catalysts that can unlock value.
TSW has a diverse client base that includes corporations, public pensions, high-net-worth families and individuals, and sub-advisory clients and has generated a strong track record of providing investors with excellent long-term results. The firm’s management team is led by Chairman Lawrence Gibson, Chief Executive Officer Horace Whitworth, President Frank Reichel, Managing Director, John Reifsnider and Director of Operations, Lori Anderson. The firm has 26 investment professionals managing thirteen investment strategy composites.
15
Distribution Model and Client Base
Our distribution is focused on the institutional and sub-advisory channels, reached through both Affiliate-led and complementary, Center-led sales efforts. Our Affiliates have teams of established sales and client service professionals with broad and deep relationships across the major segments of the institutional investor community. Consistent with our partnership philosophy, Affiliates develop and maintain client relationships independently of both us and each other, while maintaining the option to participate in Center-led complementary distribution initiatives in the domestic sub-advisory and selected global markets. In aggregate, our Affiliates have approximately 170 sales and marketing professionals servicing over 900 institutional and sub-advisory clients.
We launched our Center-led Global Distribution platform in 2012, which consists of a team of experienced channel and regional marketing specialists focused on developing new business opportunities for our Affiliates. In the U.S., complementing and enhancing the distribution capabilities of the Affiliates, we have one executive and four sales and marketing professionals focused on cultivating relationships in the sub-advisory (mutual fund and variable annuity) channel. We also maintain independent relationships with institutional investment consultants. If requested, our team also provides strategic marketing support for the Affiliates. Outside the U.S., where scale is a meaningful advantage to support geographic reach and servicing capabilities, we have a Global Distribution team consisting of ten dedicated and strategically deployed sales and marketing professionals focused on developing client relationships and gathering assets in Canada, the United Kingdom, Europe, Asia (excluding Japan) and the Middle East. Within these channels and jurisdictions, our objective is to cultivate broad and deep relationships with key consultants and institutional investors and to generate new client opportunities for those Affiliates who take advantage of our Global Distribution platform. From January 1, 2012 through December 31, 2016, we have raised $12.9 billion in client assets for our Affiliates. As a result of our Center-led Global Distribution platform, we expect our non-U.S. assets under management to increase.
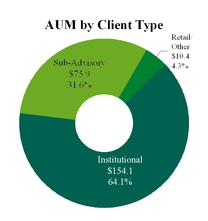
The institutional channel accounts for 64% of our AUM. Within this channel, we have strong relationships in the public/government pension market (33% of our AUM) and the corporate plan market (20% of our AUM), which comprise a substantial portion of the institutional investment market overall, particularly in the U.S. Our institutional marketplace clients are highly diverse across segments and geographies and have various growth characteristics.
While our Affiliates market primarily to institutional investors, we participate in the individual investor market through the sub-advisory channel, which represents 32% of our AUM. Within this channel, we manage assets for mutual funds, giving us exposure to a retail investor base and the defined contribution market. We have approximately 75 sub-advisory mandates on over 55 leading platforms, including Vanguard, American Beacon, Principal and Transamerica. Our top ten sub-advisory relationships account for approximately 26% of AUM and 15% of run rate ENI management fees, including equity-accounted Affiliates, and have an average tenure of over ten years. We have experienced rapid growth in this channel, with sub-advisory assets growing over 85%, or 13% annually, from January 1, 2012 through December 31, 2016.
16
Across our Affiliates, our client base is highly diverse with no significant concentration in our portfolio, though some Affiliates may have client exposures that are meaningful to their individual businesses. As of December 31, 2016, our Affiliates’ top five client relationships represented 15% of total run rate gross management fee revenue, including equity-accounted Affiliates, and our Affiliates’ top 25 clients represented 31% of run rate gross management fee revenue, including equity-accounted Affiliates. Old Mutual plc and its subsidiaries (other than us and our Affiliates) contributed less than 1% of total gross management fee revenue, including equity-accounted Affiliates.
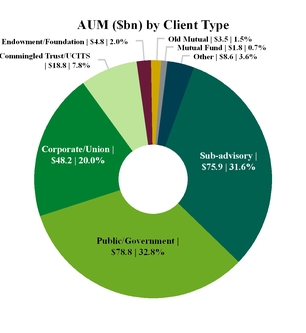
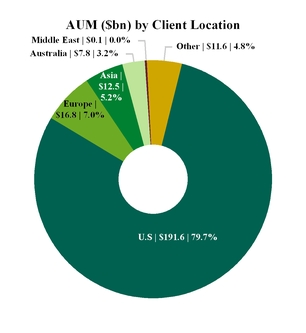
Total AUM: | $240.4 bn |
Data as of December 31, 2016
Products and Investment Performance
Product Mix
Our Affiliates offer leading products in U.S., global, international and emerging markets equities; U.S. fixed income; and alternative investments, including timber, real estate and secondary Funds.
The charts below present our average fee rates, assets under management, and gross management fee revenue including equity-accounted Affiliates by asset class and illustrate the diversification benefits of our multi-boutique business model. Our largest asset class, U.S. large cap value equities, represents 24.6% of our AUM as of December 31, 2016; however, with a weighted average fee rate of approximately 21 basis points, this asset class represents only 15.4% of our gross management fee revenue, including equity-accounted Affiliates in 2016. Each of five asset classes represents 13% or more of our gross management fee revenue, including equity-accounted Affiliates, providing a balanced earnings stream to our business. Moreover, within our three largest asset classes by revenue—alternative investments, U.S. large cap value equities, and international equities—we offer a range of strategies which provide further stability to our earnings.
17
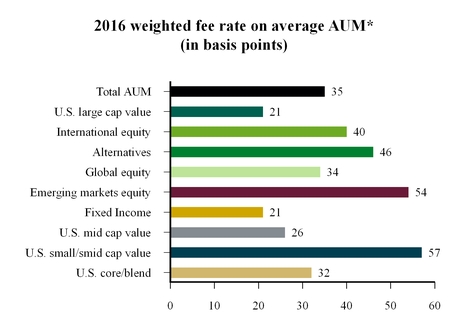
Data as of December 31, 2016
* Includes equity-accounted Affiliates
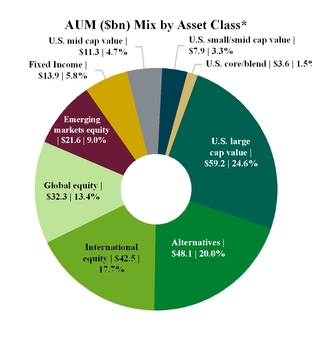
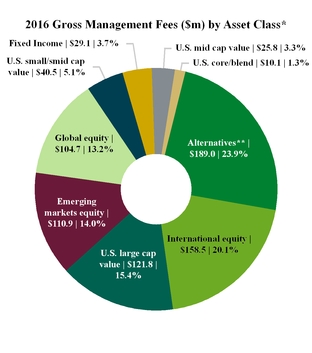
Total AUM: $240.4 bn | Total Management Fees: $790.4 m* |
Data as of December 31, 2016 | Data as of December 31, 2016 |
* Includes equity-accounted Affiliates
** Alternatives include gross management fees of Landmark from date of acquisition in August 2016
18
We have product breadth and diversity within individual Affiliates as well as across our Affiliates. For example, Barrow Hanley, whose core offerings consist of leading value-oriented U.S. equity strategies, also offers a highly-rated suite of non-U.S. equity and U.S. investment grade fixed income investment products that adhere to the firm’s traditional value discipline. Similarly, Acadian applies its quantitative approach across a range of equities, in terms of geography as well as market capitalization.
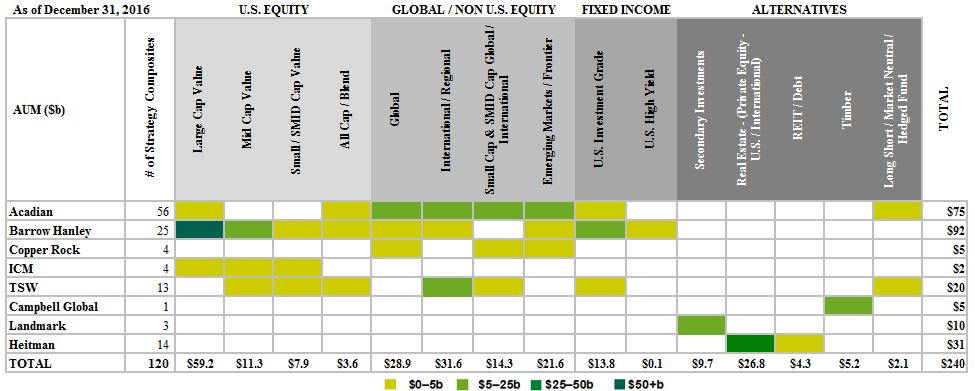
Our Affiliates’ product offerings are well-positioned in areas of investor demand, and the diversity of investment style and asset class enables us to participate in growing segments of the industry in multiple investing environments. The chart below illustrates the diversity of our assets under management by asset class and Affiliate. In total, our Affiliates manage 120 strategy composites, including four Affiliates that manage at least ten strategies each.
 Investment Performance
While each of our Affiliates has distinct investment processes and generally operates in different asset classes, our unifying mission is to produce risk-adjusted performance, or alpha, for our clients. We measure alpha generation relative to the specific benchmarks our Affiliates’ clients use to evaluate our performance in our Affiliates’ strategies. Looking at this measure on a consolidated basis, our Affiliates have competitive near- and long-term performance records and are well-positioned for continued growth.
19
In the chart below, which measures revenue-weighted performance relative to benchmarks over the last five years, we typically have had between 50% and 90% of our revenue derived from products performing ahead of their respective benchmarks on a one-, three- and five-year basis. In evaluating prospective investments, we believe institutional investors generally give the three-year performance of an investment product the greatest weighting. The overall decline in investment performance during 2016 reflects an investing environment characterized by macroeconomic-driven volatility and higher demand for bond proxies in the equities markets in the first three quarters of 2016. This has presented challenges for our Affiliates who employ long-term strategies in value portfolios. In the fourth quarter of 2016, there was a strong shift in the broader market away from yield securities, toward financials and value equities, which has resulted in improved 1-year investment performance from previous interim periods.
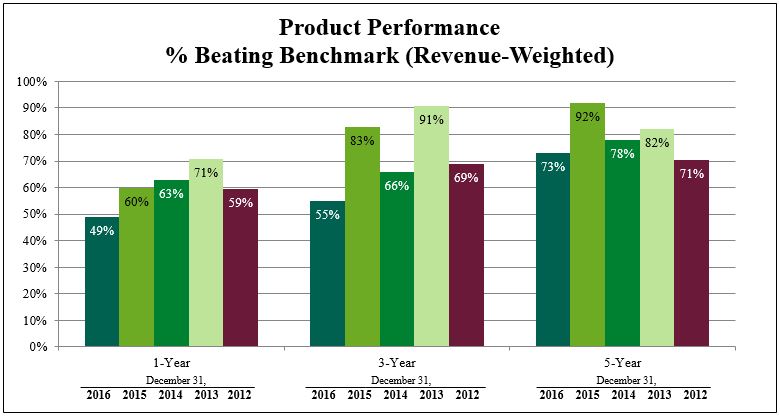
Data as of December 31 for the years 2012 to 2016
20
In addition to analyzing our Affiliates’ performance on a revenue-weighted basis, which gives us a perspective on product performance with respect to our Affiliates’ existing client base, we also consider the number of our Affiliates’ at-scale product strategies (defined as strategies with greater than $100 million of AUM) beating benchmarks. This latter measure, labeled as “equal-weighted,” indicates the opportunity we have to generate sales in a variety of market environments. For instance, strong performance in a newer, smaller product such as small-cap emerging markets may not affect revenue-weighted performance, but it can have a meaningful effect on revenue growth given client demand for this higher fee product. The chart below indicates performance on a revenue-weighted and equal-weighted (by product) basis relative to benchmark, as at December 31, 2016. In addition, we have indicated the percentage of our assets beating their benchmarks over the same time periods. While we believe the first two methodologies provide better insight into our performance trends, we have also included AUM-weighted performance, as this is a more standard industry performance metric.
Data as of December 31, 2016
Competition
We and our Affiliates face competition from many segments in the asset management industry. At the Company level, we compete with other acquirers of investment management firms, including investment management holding companies, insurance companies, banks and private equity firms. Our Affiliates compete globally with international and domestic investment management firms, hedge funds and other subsidiaries of financial institutions for institutional assets.
Many of the organizations our Affiliates compete with offer investment strategies similar to those offered by our firms, and these organizations may have greater financial resources and distribution capabilities than we or our Affiliates are able to offer. Additionally, there are limited barriers to entry for new investment managers. Our Affiliates compete with these organizations to attract and retain institutional clients and their assets based on the following primary factors:
• | the investment performance records of our Affiliates’ investment strategies; |
• | the breadth of active investment strategies offered by our Affiliates in the asset classes in which they specialize; |
• | the alignment of our Affiliates’ investment strategies to the current market conditions and investment preferences of potential clients; |
• | the quality and reputation of the investment teams that execute the investment strategies at our Affiliates; |
• | the strength of our Affiliates’ and our distribution teams; and |
• | the strength of our Affiliates’ client service and long-term client relationships. |
21
Business History
The predecessor of OMAM was formed in 1980. OMAM was formed on May 29, 2014 as a private limited company under the laws of England and Wales. Upon the consummation of the Reorganization (discussed below), we changed our name to OM Asset Management plc.
In 2011 and 2012, OMAM appointed new members of senior management. The executive team undertook a strategic review and implemented a strategic repositioning of our business to focus on actively managed, alpha-generating institutional investment products. Pursuant to this assessment, during 2011 through 2013 we divested our interests in several former Affiliate firms. We substantially completed this process in the first quarter of 2014. In the second quarter of 2014, we transferred a former Affiliate, Rogge Global Partners plc, to a subsidiary of our Parent. In August 2016, we completed the acquisition of Landmark Partners.
At January 1, 2014, OMUSH was a subsidiary of OM Group (UK) Limited, or OMGUK, which was and is in turn wholly owned by our Parent. The board of directors of our Parent elected to undertake an initial public offering of the Company’s ordinary shares, or the Offering. We and our Parent determined that certain transactions, the Reorganization, should be undertaken in preparation for the Offering, which are more fully described in Note 1, “Organization and Description of the Business” in our Consolidated Financial Statements included in Item 8 herein. On October 8, 2014, we priced our initial public offering and on October 9, 2014, began trading on the New York Stock Exchange under the ticker symbol “OMAM”.
On June 22, 2015, we completed a secondary public offering by our Parent of 13,300,000 ordinary shares of our Company pursuant to the Securities Act of 1933, as amended, or the Securities Act. Additionally, the underwriters in the secondary public offering exercised their full overallotment option and purchased an additional 1,995,000 shares of our Company from our Parent. On December 16, 2016, we completed an additional secondary public offering by our Parent of 13,000,000 ordinary shares of our Company pursuant to the Securities Act of 1933. Additionally, the underwriters in the secondary public offering exercised their full overallotment option and purchased an additional 1,950,000 shares of our Company from our Parent. Concurrently with that offering, we repurchased and retired six million ordinary shares from our Parent in a private transaction pursuant to a share repurchase program approved by our shareholders. At December 31, 2016, our Parent owned 51.1% of our outstanding ordinary shares.
On March 11, 2016, our Parent announced the results of a strategic review, which included a plan to separate its underlying businesses, including OMAM. Our Parent further announced on December 12, 2016 its intention to continue the reduction of its holdings in OMAM in an orderly manner which balances value, cost, time and risk.
Employees
As of December 31, 2016, we had 1,286 full-time equivalent employees, of which 87 were employees of the Company and 1,199 were employees of our Affiliates. None of our employees or those of our Affiliates are subject to any collective bargaining agreements. We believe our relationships with our employees to be good and have not experienced interruptions to operations due to labor disagreements.
22
Operations, Systems and Technology
We generally use both third-party commercial technology solutions and services to support investment management and operational activities, including functions such as portfolio management, trading, investment accounting, client reporting and financial reporting. Certain Affiliates have built proprietary systems to support the investment process where competitive advantages to do so exist. Systems and processes are customized as necessary to support our investment processes and operations. Information security, business continuity and data privacy programs have been implemented to help mitigate risks.
Our web site is www.omam.com. Our web site provides information about us, and from time to time we may use it as a distribution channel of material company information. We routinely post financial and other important information in the “Investor Relations” section of our web site and we encourage investors to consult that section regularly. That section of our web site includes “Public Filings” where one can download copies of our Annual Reports on Form 10-K, Quarterly Reports on Form 10-Q, Current Reports on Form 8-K, including exhibits, and any other report filed or furnished with the U.S. Securities and Exchange Commission, or the SEC, pursuant to Section 13(a) or 15(d) of the Securities Exchange Act of 1934, as amended. We make these reports available through our web site as soon as reasonably practicable after our electronic filing of such materials with, or the furnishing of them to, the SEC. The information contained or incorporated on our web site is not a part of this Annual Report on Form 10-K.
23
Item 1A. Risk Factors
You should carefully consider the following risk factors in addition to the other information included or incorporated by reference in this Annual Report on Form 10-K before investing in our ordinary shares. Any of the following risks could have a material adverse effect on our business, financial condition, results of operations or cash flow. If any of the following risks and uncertainties actually occurs, you may lose all or part of your investment. The risks and uncertainties described below are not the only ones we face. Additional risks and uncertainties not presently known to us or that we currently believe to be immaterial may also adversely affect our business.
Business Risks
Our overall financial results are dependent on the ability of our Affiliates to generate earnings.
OMAM is a holding company and is not a registered investment adviser under United States, or U.S., federal or state law. As such, OMAM does not manage investments for clients and does not directly receive management fees. All of OMAM’s revenue generation is dependent on our Affiliates who are (or have subsidiaries who are) registered investment advisers under the Investment Advisers Act of 1940, as amended, or the Advisers Act, and receive the majority of their fees based on the market values of assets under management. Substantially all of OMAM’s cash flows consist of distributions received from our Affiliates. As a result, OMAM’s cash flows and ability to fund operations are largely dependent upon the profitability of our Affiliates.
Each Affiliate is required to make certain cash distributions to us under the operating agreement we enter into with such Affiliate. Distributions to us from an Affiliate may be subject to the Affiliate maintaining sufficient working capital, regulatory requirements, claims of creditors of the Affiliate and applicable bankruptcy and insolvency laws. Any material decrease in profits at, or material reduction in distributions from, our Affiliates could negatively impact our business and results of operations.
The ability of our Affiliates to attract and retain assets under management and generate earnings is dependent on our Affiliates maintaining competitive investment performance, as well as market and other factors.
Our financial performance is dependent upon the abilities of our Affiliates to minimize the risk of outflows through sound relative investment performance over measured periods of time compared to relevant benchmarks and peer performance results. The performance of our Affiliates’ investment strategies, which can be impacted by factors within and/or outside the control of our Affiliates, including general market and economic conditions, is critical to retaining existing client assets and investors, including in mutual funds and private funds our Affiliates advise or sub-advise, and attracting new client and investor assets. Poor performance can be caused by our Affiliates’ choices in investing in sectors, industries, companies or assets that do not perform as well as others. Additionally, companies in which our Affiliates invest may incur negative changes in their financial conditions or suffer other adverse events that could reduce the values of the Affiliates’ investments in those companies.
Net flows related to our investment strategies can be affected by investment performance relative to other competing investment strategies or to established benchmarks. Investment management strategies are rated, ranked or assessed by independent third parties, distribution partners, and industry periodicals and services. These assessments often influence the investment decisions of our Affiliates’ clients and investors in mutual funds and private funds our Affiliates advise or sub-advise. If the performance or assessment of our Affiliates’ investment strategies is seen as underperforming relative to peers, it could, among other things, result in an increase in the withdrawal of assets by existing clients and investors in mutual funds and private funds our Affiliates advise or sub-advise, the termination of an Affiliate as a sub-adviser to a mutual fund and the inability to attract additional investments from existing and new clients or investors. If a significant portion of clients or investors decides to withdraw their investments or terminate their investment management agreements or sub-advisory agreements with our Affiliates, our Affiliates’ abilities to generate earnings would decline and our results of operations and financial condition would be affected.
24
In addition, assets could be withdrawn for any number of reasons other than poor absolute or relative investment performance, including macro-economic factors unrelated to investment performance, a reduction in market demand for the asset classes, products or strategies offered by our Affiliates, the loss of key personnel, price declines in the securities markets generally, price declines in those assets in which client assets are concentrated or changes in investment patterns of clients. Any of these factors could have a negative impact on the revenues and profits of an Affiliate and an adverse impact on our results of operations and financial condition.
Our relationships with our Affiliates are critical to our success.
Maintaining strong relationships with our Affiliates is critical to our business model. Any potential disagreements over matters such as economics or management policies, growth strategies and compensation philosophy would impact our relationships with our Affiliates if not effectively managed. Furthermore, dissatisfaction by the management teams of our Affiliates with the services that we provide to them and the conditions upon which such services are provided also could result in a strained relationship with the management of that Affiliate. Any strains in the relationships that we have with our Affiliates could be detrimental to our overall business.
Each of our Affiliates operates under ownership, governance and economic arrangements that we and such Affiliate negotiated either at inception or during the course of our relationship. Periodically, these arrangements are reviewed and, in some instances, may be renegotiated and revised. Any renegotiation that results in a reduction in our ownership interest in an Affiliate and/or a revision to the economic arrangements could reduce the economic benefits derived by us from that Affiliate.
We derive a substantial portion of our revenue from a limited number of Affiliates and investment strategies.
As of December 31, 2016, Acadian and Barrow Hanley represented approximately 70% of our assets under management, from which we derive a substantial portion of our revenue. An adverse change in the operating results of either of these Affiliates, whether as a result of poor investment performance, withdrawals of assets under management or otherwise, could have a substantial impact on our results of operations.
While our Affiliates invest in a number of asset classes, a significant portion of our assets are invested in a limited number of investment strategies. As of December 31, 2016, $106.9 billion, or 44%, of our assets under management were concentrated across five investment strategies: Barrow Hanley’s Large Cap Value Equity ($45.7 billion, or 19%), Heitman’s Real Estate Domestic Private Equity ($23.0 billion, or 9%), Acadian’s Emerging Markets Equity ($16.9 billion, or 7%), Acadian’s Global Equity ($12.0 billion, or 5%) and Acadian’s Global Managed Volatility Equity ($9.3 billion, or 4%). Consequently, our results of operations are dependent upon the abilities of our Affiliates that manage these investment strategies to minimize the risk of outflows through relatively strong performance over measured periods of time compared to relevant benchmarks and peer performance results. Also, certain investors may evaluate us on the basis of the asset-weighted performance of our assets under management. A relatively small change in the relative performance of one of our largest strategies, such as Barrow Hanley’s large-cap value equity, could have a significant impact on the asset-weighted performance of our assets under management. Such volatility could adversely affect investors’ perception of us.
Our business model limits our ability to manage our Affiliates’ investment management practices and certain other aspects of their day-to-day operations.
Our multi-boutique affiliate structure offers a diversity of investment styles and client bases. While our agreements with the majority of our Affiliates typically give us ultimate control over the business activities of those Affiliates, we generally do not become directly involved in managing their day-to-day operations, including investment management practices, policies and procedures, fee levels, marketing and product development, client relationships and employment and compensation programs. If we fail to intervene in potentially serious matters arising out of the day-to-day operations of our Affiliates, our reputation could be damaged and our results of operations adversely affected.
25
For each of Heitman and ICM, we exercise significant influence rather than control. Our ability to (i) direct the activities of these Affiliates, (ii) influence their decision-making processes and (iii) require that our risk management and governance practices are applied may be limited and not consistent with those of our controlled Affiliates.
Our growth strategy is dependent upon continued growth of our existing Affiliates and our ability to successfully acquire or invest in new affiliates.
Since we depend on distributions from our Affiliates to conduct our operations, the inability of our Affiliates to meet projected distribution levels could impact their ability to grow their businesses and contribute to our future growth at current or historical levels. In addition, capacity constraints, particularly on our Affiliates’ smaller strategies, or the unavailability of appropriate investment opportunities could limit their ability to accept new client assets and, therefore, limit the growth of their and our revenue.
Our growth strategy is also enhanced by our ability to successfully make new acquisitions or investments, which will depend on our ability to find suitable firms to acquire or invest in, our ability to negotiate agreements with such firms on acceptable terms, and our ability to raise the capital necessary to finance such transactions. There is no certainty that we will identify suitable candidates at prices and terms we consider attractive, consummate any such acquisition or investment on acceptable terms, have sufficient resources to complete an identified acquisition or investment or that our strategy for pursuing acquisitions or investments will be effective. Our ability to make new acquisitions or investments may be restricted or limited by the regulations that govern our Parent’s operations and our Parent’s approval rights over acquisitions. In addition, any acquisition or investment can involve a number of risks, including the existence of known liabilities or contingent liabilities or those not disclosed or known by us prior to closing an acquisition or investment. An acquisition or investment may impose additional demands on our staff that could strain our operational resources and increase the possibility of operational error, and require expenditure of substantial legal, investment banking and accounting fees. We may be required to issue ordinary shares or spend significant cash to consummate an acquisition or investment, resulting in dilution of ownership or additional debt leverage, or spend additional time and money on facilitating the acquisition or investment that otherwise would be spent on the development and expansion of our existing businesses. Following a completed acquisition or investment, failure by us and the target firm to achieve a strong, long-term relationship, or failure of the firm to realize incremental organic growth and growth through leveraging its relationship with us may result in our inability to achieve the anticipated benefits of the acquisition or investment, and could have an adverse impact on our business, financial condition and results of operations. In addition, the capital available for our use and the nature by which we deploy it is subject to the approval of our Parent in certain circumstances. Any capital constraints imposed by our Parent may inhibit our ability to partner with new firms. In June 2016, we entered into an Amended Seed Capital Management Agreement and an Amended Deferred Tax Asset Deed which will result in total payments to our Parent of approximately $225 million from June 30, 2017 through June 30, 2018. While we are exploring opportunities to finance a portion of these obligations, they will result in a significant use of cash generated from operations over the next eighteen months, which will not be available for acquisitions.
The failure to consummate announced investments in new affiliates could have an adverse effect on our operating results and financial condition.
Our ability to successfully acquire or invest in new affiliates may be subject to certain contingencies and approvals or dependent on the satisfaction of certain closing conditions (which may not be in our control), including, but not limited to, obtaining certain consents of the target’s clients and, depending on the jurisdiction, approval of certain regulatory authorities. In the event that an announced transaction is not consummated, we may experience a decline in the price of our ordinary shares. In addition, the fact that a transaction did not close after we announced it publicly may negatively affect our ability to consummate transactions in the future. Finally, we must pay costs related to these transactions, including legal and accounting fees, even if the transactions are not completed, which may have an adverse effect on our results of operations and financial condition.
26
We and our Affiliates rely on certain key personnel, and our results are dependent upon our ability to retain and attract key personnel.
We and our Affiliates depend on the skills and expertise of our key investment and management personnel, and our success and growth depends on our ability to attract and retain key personnel. Our Affiliates rely heavily upon the services of certain key investment and management personnel, many of whom have managed their firms for a number of years and who primarily guide the investment decision-making processes and strategies at the firms. The loss of key investment and management personnel at any of our Affiliates for any reason could have an adverse impact upon our business, results of operations and financial condition. Any of our key investment or management personnel could resign at any time, join a competitor or form a competing company. We have entered into non-competition agreements with some, but not all, of our investment and management personnel, but these agreements may not be enforceable or may not be enforceable to their full extent. In addition, we may agree to waive a non-competition agreement applicable to investment or management personnel in light of the circumstances of our relationship with that person.
All of our Affiliates have established equity plans which are intended to attract, retain and motivate key personnel and pursuant to which key Affiliate personnel may be awarded or be able to purchase equity in their firm. The equity plans provide key employees with the opportunity to participate in the appreciation in the value of their businesses. Award documents under these plans typically limit a recipient’s right to provide competitive services to clients of the Affiliates or solicit employees of the Affiliates for prescribed periods. Additionally, certain of our Affiliates’ key executive management personnel may have entered into, or been offered the opportunity to enter into, agreements with us that are structured to motivate and retain such personnel. However, retention strategies we and our Affiliates have put into place may not be successful and, to the extent the plans do not produce the desired results, our Affiliates may suffer a loss of valued personnel.
For certain of our Affiliates, a number of key management personnel are arriving at the point in their careers where they may be looking to limit their day-to-day involvement in their businesses or withdraw entirely. We have instituted succession planning at our Affiliates in an attempt to mitigate any disruption caused by these changes but cannot predict whether such efforts will be successful and whether the firms will be able to retain clients, assets and personnel or attract new assets and talent.
We rely upon the contributions of our senior management team to establish and implement our strategy and to manage the future growth of our business. The amount and structure of compensation and opportunities for equity ownership we offer are key components of our ability to attract and retain qualified management personnel. There is no assurance that we will be successful in designing and implementing an attractive compensation model.
Our Affiliates’ business operations are complex, and a failure to properly perform operational tasks or maintain infrastructure could have an adverse effect on our revenues and income.
In addition to providing investment management services, our Affiliates must have the necessary operational capabilities to manage their businesses effectively in accordance with client expectations and applicable law. The required non-investment management functions include sales, marketing, portfolio recordkeeping and accounting, security pricing, trading activity, investor reporting, corporate governance, compliance, net asset value computations, account reconciliations and calculations of required distributions to accounts. Some of these functions are performed either independently or with the support of or in conjunction with us or third-party service providers that are overseen by our Affiliates. Also, certain of our Affiliates are highly dependent on specially developed proprietary systems. Any material failure to properly perform and monitor these non-investment management functions and operations, or adequately oversee the entities that provide the services, could result in potential liability to clients, regulatory sanctions, investment losses, loss of clients and damage to the reputation of our Affiliates or to our reputation.
27
Reputational harm could result in a loss of assets under management and revenues for our Affiliates and us.
The integrity of our brand and reputation, as well as the integrity of the brand and reputation of each of our Affiliates, is critical to the ability of us and our Affiliates to attract and retain clients, business partners and employees and maintain relationships with consultants. We operate within the highly regulated financial services industry and various potential scenarios could result in harm to our reputation. They include internal operational failures, failure to follow investment or legal guidelines in the management of accounts, intentional or unintentional misrepresentation of our Affiliates’ products and services in offering or advertising materials, public relations information, social media or other external communications, employee misconduct or investments in businesses or industries that are controversial to certain special interest groups. Such factors could potentially result in regulatory actions and litigation. The negative publicity associated with any of these factors could harm our reputation and those of our Affiliates and adversely impact relationships with existing and potential clients, third-party distributors, consultants and other business partners and subject us to regulatory sanctions. Damage to our brands or reputations would negatively impact our standing in the industry and result in loss of business in both the short term and the long term.
Our brand and reputation are also tied to the brand and reputation of our Parent and those of our Parent’s other subsidiaries. As of December 31, 2016, our Parent indirectly owned 51.1% of our outstanding ordinary shares. We exercise no control over the activities of our Parent or its affiliates. We may be subject to reputational harm, or our relationships with existing and potential clients, third-party distributors, consultants and other business partners could be harmed, if our Parent or any of its affiliates, previously, or in the future, among other things, engages in poor business practices, experiences adverse results, becomes subject to litigation or otherwise damages its reputation or business prospects. Any of these events might in turn adversely affect our own reputation, our results of operations and our business prospects.
We or our Affiliates may not always successfully manage actual or potential conflicts of interests that may arise in our businesses.
As we continue to expand the scope of our business, we increasingly confront actual, potential and perceived conflicts of interest relating to our activities and the investment activities of our Affiliates. Conflicts may arise with respect to decisions by our Affiliates regarding, among other things, the allocation of specific investment opportunities among accounts in which Affiliates may receive an allocation of profits and accounts in which they do not receive such an allocation or among client accounts that have overlapping investment objectives yet different fee structures, including certain accounts which may pay Affiliates performance-based fees.
Certain client accounts of our Affiliates have similar investment objectives and may engage in transactions in the same types of securities and instruments. These transactions could impact the prices and availability of the securities and instruments in which a client account invests and could have an adverse impact on an account’s performance. An Affiliate may also buy or sell positions in a client account while that or another Affiliate, on behalf of other client accounts, is undertaking a similar, differing or opposite strategy, which could disadvantage the other accounts.
The SEC and other regulators have increased their scrutiny of conflicts of interest. Our Affiliates have implemented procedures and controls to identify, manage, mitigate (where possible) and disclose actual, potential or perceived conflicts of interest, but it is possible that the procedures adopted by our Affiliates may not be effective in identifying, managing or mitigating all conflicts which could give rise to the dissatisfaction of, or litigation by, investors or regulatory enforcement actions. Appropriately dealing with conflicts of interest is complex and difficult, and the reputations of us and our Affiliates could be damaged if we or they fail, or appear to fail, to deal appropriately with one or more potential or actual conflicts of interest. Regulatory scrutiny, litigation or reputational risk incurred in connection with conflicts of interest would adversely impact our business in a number of ways, including by making counterparties reluctant to do business with us, impeding our ability to retain or increase our assets under management, subjecting us to potential litigation and adversely impacting our results of operations.
28
Conflicts of interest also may arise between our Affiliates where, for example, for competitive business reasons, more than one Affiliate may seek the same business opportunity, clients or talent or make other competitive business decisions.
We may make business decisions which we believe are in the best interests of the Company but that may have indirect negative effects on one or more of our Affiliates. We also may be required to make strategic and financial or other resource allocation decisions that may directly benefit one or more Affiliates and not others. Any decision that does not directly or indirectly benefit an Affiliate could negatively impact our relationship with that Affiliate.
Equity ownership by key employees of each Affiliate is at the level of the applicable Affiliate and not at the holding company level, although employees of our Affiliates may acquire our ordinary shares. Therefore, there may be instances where the interests of an Affiliate and its key employee equity-holders may not align with ours in effecting a desired outcome.
While we endeavor to assess and resolve any conflicts in a manner that is not disruptive or detrimental to us, our Affiliates, or our Parent, there is no assurance that a resolution may be possible or the interests of all parties can be taken into account.
Impairment of our Affiliates’ relationships with clients and/or consultants may negatively impact their businesses and our results of operations.
Our Affiliates have strong client and consultant relationships in their core institutional marketplaces, and they depend upon these relationships to successfully market their existing products and strategies and to introduce new products and strategies. Some Affiliates may have client exposures that are meaningful to their individual businesses. As of December 31, 2016, our Affiliates’ top five client relationships represented 15% of total run rate gross management fee revenue, including equity-accounted Affiliates, and our Affiliates’ top 25 clients represented 31% of run rate gross management fee revenue, including equity-accounted Affiliates. Total run rate gross management fee revenue reflects the sum for each account at each of our eight Affiliates, of the product of (a) assets under management in each account at December 31, 2016, multiplied by (b) the relevant management fee rate on that account. This calculation includes the management fees paid by accounts at each of our equity-accounted Affiliates. Any negative changes in these relationships that reduce the number of client or consultant contacts, restrict access to existing or potential clients, or result in negative statements by a consultant, could have an adverse impact on our Affiliates’ businesses and negatively impact our results of operations.
The business of our Affiliates is dependent upon investment advisory agreements that are subject to negotiation, non-renewal, or termination, including termination upon assignment.
Our Affiliates derive substantially all of their revenues from the fees charged to their clients under their investment advisory agreements with those clients. The agreements generally provide for fees to be paid on the basis of the market values of assets under management, although a portion also provide for performance-based fees to be paid on the basis of investment performance against stated benchmarks.
An investment advisory agreement may be terminated by a client without penalty upon relatively short notice (typically no more than 30 days). In addition, the investment advisory agreements and sub-advisory agreements with respect to registered investment companies generally may be terminated by the mutual fund or, in those instances where an Affiliate serves as a sub-adviser, the mutual fund’s adviser, without penalty, upon 60 days’ notice and are subject to annual approval by the mutual fund’s board of directors or trustees. Clients may decide to terminate or not renew an agreement for poor investment performance or any variety of reasons which may be beyond the control of our Affiliates. A decrease in revenues resulting from termination of an investment advisory agreement or sub-advisory agreement for any reason could have a material adverse effect on the revenue and profits of our Affiliates and a negative effect on our results of operations.
29
Pursuant to the Advisers Act, investment advisory agreements between our Affiliates, who are (or who have subsidiaries who are) U.S. registered investment advisers, and their clients are not assignable without the consent of the client. As required by the Investment Company Act of 1940, or the Investment Company Act, investment advisory agreements and sub-advisory agreements between our Affiliates and investment company clients and/or the investment advisers to those investment companies terminate upon their assignment. Assignment, as generally defined, includes direct assignments as well as assignments that may be deemed to occur, under certain circumstances, upon the direct or indirect transfer of a “controlling block” of the voting securities of the respective Affiliate. A transaction is not deemed an assignment under the Advisers Act or the Investment Company Act, however, if it does not result in a change of actual control or management of the relevant Affiliate.
Our Parent could decide to sell a controlling block of our voting securities in the future, in which event the contractual anti-assignment and termination provisions of the investment advisory and sub-advisory agreements between our Affiliates and their clients may be implicated. If an assignment of an investment advisory or sub-advisory agreement is deemed to occur, and clients do not consent to the assignment or, with respect to investment company clients, enter into a new agreement, which may require the approval of the investment company’s shareholders in addition to its board of directors or trustees, our results of operations could be materially and adversely affected.
The historical returns of our existing investment strategies may not be indicative of their future results or of the investment strategies we may develop in the future.
We have presented information with respect to the historical returns of our existing investment strategies throughout this Annual Report on Form 10-K, including under “Business—Products and Investment Performance.” The historical returns of our Affiliates’ strategies and the ratings and rankings our Affiliates or their strategies have received in the past should not be considered indicative of the future results of these strategies or of any other strategies that our Affiliates may develop in the future. The investment performance our Affiliates achieve for their clients varies over time and the variance can be wide. The ratings and rankings our Affiliates or their strategies have received are typically revised monthly. The historical performance and ratings and rankings presented herein are as of December 31, 2016 and for periods then ended unless otherwise indicated. The returns on the strategies of our Affiliates’ have benefited during some periods from investment opportunities and positive economic and market conditions. In other periods, general economic and market conditions have negatively affected investment opportunities and the returns on our Affiliates’ strategies. These negative conditions may occur again, and in the future our Affiliates may not be able to identify and invest in profitable investment opportunities within their current or future strategies.
Pressure on fee levels of our Affiliates and changes to their mix of assets could impact our results of operations.
Our profit margins and net income are dependent on the ability of our Affiliates to maintain current fee levels for the products and services they offer. The competitive nature of the asset management industry has led to a trend toward lower fees in certain segments of the asset management market, and there can be no assurance that our Affiliates will be able to maintain their current pricing structures. Our Affiliates also may be required to restructure their fees due to regulatory changes. These factors also could inhibit the ability of our Affiliates to increase fees for certain products. A reduction in the fees charged by our Affiliates, or limited opportunities to increase fees, will reduce or limit our revenues and could reduce or limit our net income.
The fees charged by our Affiliates on their assets under management vary by asset class and produce different revenues per dollar of assets under management based on factors such as the type of assets being managed, the applicable investment strategy, the type of client and the client fee schedule. Institutional clients may have significant negotiating leverage in establishing the terms of an advisory relationship, particularly with respect to the level of fees paid, and the competitive pressure to attract and retain institutional clients may impact the level of fee income earned by an Affiliate. In order for an Affiliate to maintain its fee structure in a competitive environment, it may elect to decline to manage additional assets from potential clients who demand lower fees even though our revenues may be adversely affected in the short term.
30
Furthermore a shift in the mix of assets under management from asset classes or products that generate higher fees to those that generate lower fees may result in a decrease in revenues while aggregate assets under management remain unchanged or increase. Such shifts can occur as various investment strategies go in and out of favor due to competition in the industry or as a result of movements between asset classes or certain products no longer being available to investors. In addition, in the event current or future Affiliates have or develop a focus on strategies that generate lower fees, a decrease in revenues may result. A decrease in revenues without a reduction in expenses will result in reduced net income.
Changes in how clients choose to access asset management services may also exert downward pressure on fees. Some investment consultants, for example, are implementing programs in which the consultant provides a range of services, including selection, in a fiduciary capacity, of asset managers to serve as sub-adviser at lower fee rates than the manager’s otherwise applicable rates, with the expectation of a larger amount of assets under management through that consultant. The expansion of those and similar programs could, over time, make it more difficult for us to maintain our fee rates.
Failure by our Affiliates to comply with investment guidelines set by their clients, including the boards of mutual funds that they sub-advise, or limitations imposed by applicable law could result in a loss of assets, potential damage awards or regulatory sanctions, which could adversely impact our results of operations or financial condition.
As investment advisers, our Affiliates (or their registered subsidiaries) have fiduciary duties to their clients. Our Affiliates are required to follow specified investment guidelines established by their clients in the management of client accounts. Our Affiliates that advise or sub-advise registered investment companies are also required to invest fund assets in accordance with guidelines contained in the Investment Company Act and applicable provisions of the Internal Revenue Code of 1986, as amended, or the Code, as well as any guidelines established by the boards of the investment companies. Affiliates that manage accounts subject to the fiduciary responsibility provisions of the Employee Retirement Income Security Act of 1974, as amended, or ERISA, must comply with the requirements of ERISA and regulations of the Department of Labor in their management of those plan accounts. An Affiliate’s failure to comply with applicable client and regulatory guidelines could result in losses to a client which, depending on the circumstances, could result in an Affiliate’s obligation to reimburse the client in whole for such losses. If an Affiliate believed that the circumstances did not justify a reimbursement, or a client believed the reimbursement offered was insufficient, the client could seek to recover damages from the Affiliate, withdraw assets from management by the Affiliate or terminate its investment advisory agreement with the Affiliate. An Affiliate that fails to follow investment guidelines or other limitations in the management of a client account may be subject to actual and threatened lawsuits, or be subject to investigations and proceedings by governmental and self-regulatory organizations and potential damages, fines or sanctions. Any of these events could harm the reputations of us and our Affiliates and adversely impact our and their results of operations and financial condition.
If our techniques for managing risk are ineffective, we may be exposed to material unanticipated losses.
In order to manage the significant risks inherent in our business, we must maintain effective policies, procedures and systems that enable us to identify, monitor and control our exposure to operational, legal and reputational risks. Our risk management methods may prove to be ineffective due to their design or implementation, or as a result of the lack of adequate, accurate or timely information or otherwise. If our risk management efforts are ineffective, we could suffer losses that could have a material adverse effect on our financial condition or results of operations. The potential for some types of operational risks, including, for example, trading errors, may be increased or amplified in periods of increased volatility, which can magnify the cost of an error. Although we have not suffered operational errors, including trading errors, of significant magnitude in the past, we may experience such errors in the future, which could be significant and the losses related to which we could be required to absorb. Additionally, we could be subject to litigation, particularly from our clients, and investigations and enforcement proceedings by and sanctions or fines from regulators. Our Affiliates’ techniques for managing operational, legal and reputational risks in client portfolios may not fully mitigate the risk exposure in all economic or market environments, including exposure to risks that we might fail to identify or anticipate.
31
We or our Affiliates may be exposed to potential liability as a general partner or a controlling person.
Our Affiliates are limited liability companies of which we are, or an entity controlled by us is, either the managing member or the majority member, except for ICM in which case we have certain consent and management rights. Certain of our Affiliates may serve as general partners, managing members or their equivalents for investment products that are organized as partnerships or other commingled vehicles. As such, we or an Affiliate may be exposed to liability in the limited liability company, partnership or investment vehicle or required to undertake certain obligations under applicable law that we or they otherwise would not be required to undertake as a holding company or investment adviser. In addition we may be deemed to be a control person of our Affiliates, as that term is defined in various U.S. federal and state statutes and, as such, potentially liable for the acts of our Affiliates or their employees. Consequently, if under such circumstances any of our Affiliates incurs liabilities or expenses that exceed its ability to pay, we may be directly or indirectly liable for its payment to the extent provided in the governing documents of the limited liability company, partnership or investment vehicle or under applicable law. While we and our Affiliates maintain errors and omissions and general liability insurance in amounts believed to be adequate to cover certain potential liabilities, we cannot be certain that claims will not be made against us that exceed the limits of available insurance coverage, that the insurers will remain solvent and will meet their obligations to provide coverage or that an adequate amount of insurance coverage will continue to be available to us and our Affiliates at a reasonable cost. A judgment against any of our Affiliates and/or us in excess of available insurance coverage could have a material adverse impact on our business and financial condition.
Our expenses are subject to fluctuations that could materially impact our results of operations.
Our results of operations are dependent upon the level of our expenses and those of our Affiliates, which can vary from period to period. We and our Affiliates have certain fixed expenses that we incur as going concerns, and some of those expenses are not subject to adjustment. If our revenues decrease, without a corresponding decrease in expenses, our results of operations would be negatively impacted. While we and our Affiliates attempt to project expense levels in advance, there is no guarantee that an unforeseen expense will not arise or that we will be able to adjust our variable expenses quickly enough to match a declining asset base. Consequently, either event could have either a temporary or permanent negative impact on our results of operations.
The cost of insuring our business is meaningful and may increase.
Our insurance costs are meaningful and can fluctuate significantly from year to year. In addition, certain insurance coverage may not be available or may only be available at prohibitive costs. As we renew our insurance coverage, we may be subject to additional costs caused by premium increases, higher deductibles, co-insurance liability, changes in the size of our business or nature of our operations, litigation or acquisitions or dispositions. Higher insurance costs and incurred deductibles, as with any expense, would reduce our net income. In addition, we may obtain additional liability insurance for our directors and officers. There have been historical periods in which directors’ and officers’ liability insurance and errors and omissions insurance have been available only with limited coverage amounts, less favorable terms or at prohibitive cost, and these conditions could recur.
Investments in non-U.S. markets and in securities of non-U.S. companies may involve foreign currency exchange risk, and tax, political, social and economic uncertainties, and a reduction in assets under management associated with investments in non-U.S. equities could have a disproportionate adverse impact on our results of operations.
A significant amount of our Affiliates’ assets under management is represented by strategies that primarily invest in securities of non-U.S. companies. Fluctuations in foreign currency exchange rates could negatively impact the account values and the investment returns of clients who are invested in these strategies, with a corresponding reduction in management fee income. In addition, an increase in the value of the U.S. dollar relative to non-U.S. currencies could result in a decrease in the U.S. dollar value of assets under management that are denominated in non-U.S. currencies, which in turn would result in lower revenues.
32
Many non-U.S. financial markets are not as developed or as efficient as the U.S. financial markets and, as a result, have limited liquidity and greater price volatility and may lack established regulations. Liquidity in such markets also may be adversely impacted by political or economic events, government policies, expropriation, volume trading limits by foreign investors, and social or civil unrest. The ability to dispose of an investment and its market value may be adversely impacted by any of these factors. In addition, non-U.S. legal and regulatory financial accounting standards and practices may be different from those of the U.S., and there may be less publicly available information about non-U.S. companies and non-U.S. markets. Governments of foreign jurisdictions may assert their abilities to tax local gains and/or income of foreign investors, including clients of our Affiliates, which could adversely impact the economics associated with investing in foreign jurisdictions or non-U.S. based companies. These risks also could impact the performance of strategies that invest in such markets and, in particular, strategies that concentrate investments in emerging market companies and countries.
In general, management fees for accounts that invest in non-U.S. equity markets, particularly emerging markets, are higher than those for accounts that invest in the domestic markets. Since approximately 40% of our Affiliates’ total assets under management as of December 31, 2016 were invested in global, international and emerging markets equities, a significant reduction in assets under management associated with such investments could have a disproportionately adverse impact on our results of operations.
Our non-U.S. distribution initiatives may be unsuccessful, may expose us to other tax and regulatory risks and may not facilitate the growth of our business.
One of the primary opportunities for growth lies in expanding the geographic regions in which our Affiliates’ investment products and services are distributed. To assist our Affiliates in their non-U.S. distribution, we offer the assistance of our Center-led Global Distribution team. The success of these non-U.S. initiatives is therefore dependent upon the ability of our and our Affiliates’ teams to successfully partner in non-U.S. distribution efforts and to structure products that appeal to the global markets. The inability of the Global Distribution team and our Affiliates to successfully execute on their non-U.S. distribution plans may adversely impact the growth prospects of our Affiliates.
Our non-U.S. distribution initiative has required and will continue to require us to incur a number of up-front expenses, including those associated with obtaining regulatory approvals, as well as additional ongoing expenses, including those associated with the employment of additional support staff and regulatory compliance. Our employees routinely travel outside the U.S. in connection with our distribution efforts and may spend extended periods of time in one or more non-U.S. jurisdictions. Their activities outside the U.S. on our behalf may raise both tax and regulatory issues. If we are incorrect in our analysis of the applicability or the extent of the impact of non-U.S. tax or regulatory requirements, we could incur costs, penalties or be the subject of an enforcement or other action. We also expect that operating our business in non-U.S. markets generally will be more expensive than in the U.S. To the extent that our revenues do not increase as much as our expenses in connection with our distribution initiatives outside the U.S., our profitability could be adversely affected. Expanding our distribution initiatives into non-U.S. markets may also place significant demands on our existing infrastructure and employees.
Our outstanding indebtedness may impact our business and may restrict our growth and results of operations.
We have $392.3 million of long-term bonds outstanding as of December 31, 2016 and $0.0 million of debt outstanding under our revolving credit facility with third-party lenders. For additional information regarding our revolving credit facility and our long-term bonds, see “Management’s Discussion and Analysis of Financial Condition and Results of Operations—Capital Resources and Liquidity—Working Capital and Long-Term Debt.”
We may incur additional indebtedness in the future for a variety of business reasons, including in relation to our acquisition strategy (e.g. initial purchase price and/or earnout), share repurchases, our obligations under the Deferred Tax Asset Deed that we have entered into with OMGUK and for seed or co-investment capital. We will be dependent on the cash flow generated from our Affiliates to service any indebtedness that is taken on by us.
33
The level of our indebtedness has important consequences to investors in our securities. For example, our level of indebtedness may require us to use a substantial portion of our cash flow from operations to pay interest and principal on our debt, which would reduce the funds available to us for working capital, capital expenditures and other general corporate purposes and may limit our ability to pay future dividends. Too much debt may limit our ability to implement our business strategy; heighten our vulnerability to downturns in our business, the financial services industry or in the general economy and limit our flexibility in planning for, or reacting to, changes in our business and the financial services industry; limit our access to additional debt; or prevent us from taking advantage of business opportunities as they arise or successfully carrying out our plans to expand our business and our Affiliates’ product offerings. Any of these consequences could have a material adverse effect on our financial condition or results of operations.
We may be unable to obtain sufficient capital and liquidity to meet the financing requirements of our business.
In connection with the Reorganization, we established an independent facility with third party lenders to facilitate the growth of our business and, in particular, to finance our acquisition strategy and investments in new products. In July 2016 we issued an aggregate of $400 million of long-term bonds. Our ability to finance our operations through borrowing from our lenders under the credit facility or through future issuances of long-term bonds, and our ability to repay maturing obligations under our credit facility and long-term bonds, will be dependent in large part on the profitability of our Affiliates and our future operating performance. Any future inability to obtain financing on reasonable terms and with reasonable restrictions on the operation of our business could impair our liquidity, have a negative impact on our growth and that of our Affiliates and negatively impact our financial condition. Our future ability to incur additional debt may be restricted or limited by the regulations that govern our Parent’s operations and our Parent’s approval rights over our incurrence of indebtedness.
Our business involves risks of potential litigation that could harm our business.
We and our Affiliates may be named as defendants or co-defendants in lawsuits, or may be involved in disputes that include the threat of lawsuits seeking substantial damages. Any such legal action, whether threatened or actual, could result in reputational damage, loss of clients and assets, increased costs and expenses in resolving a claim, diversion of employee resources and resulting financial losses.
Our Affiliates make investment decisions on behalf of their clients that could result in substantial losses to those clients. If their clients suffer significant losses or otherwise are dissatisfied with the service of one of our Affiliates, that Affiliate could be subject to the risk of legal liability or actions alleging, among other theories, negligent misconduct, breach of fiduciary duty, breach of contract, unjust enrichment and/or fraud. These risks often are difficult to assess or quantify and their existence and magnitude often remain unknown for substantial periods of time, even after an action has been commenced. Our Affiliates may incur substantial legal expenses in defending against litigation commenced by a client or regulatory authority. Substantial legal liability levied on any one of our Affiliates could have a material adverse effect on our business, financial condition, or results of operations and could cause significant reputational harm.
Any significant limitation on the use of our facilities or the failure or security breach of our software applications or operating systems and networks, including the potential risk of cyber-attacks, could result in the disclosure of confidential client information, damage to our reputation, additional costs, regulatory penalties and financial losses.
We and our Affiliates depend upon our principal business offices and our various centers of operation for the continued operations of our businesses. A disruption in the infrastructure that supports our businesses or prevents our employees from performing their job functions, including communication failures, natural disasters, terrorist attacks and international hostilities, may have a material impact on our ability to continue business operations without interruption. Insurance and other safeguards might not be available or might only partially reimburse us for our losses.
34
Although we have back-up systems and disaster recovery programs in place and test their uses periodically, there can be no assurance that the recovery programs will be sufficient to mitigate any harm that may result from a disruption or disaster. Additionally, it is possible that any such disruption or disaster could have a significant impact on the general economy, domestic and local financial and capital markets or specific industries, including the financial services industry.
A significant portion of our operations relies heavily on the secure processing, storage and transmission of confidential and other information as well as the monitoring of a large number of complex transactions. With the evolving proliferation of new technologies and the increasing use of the Internet and mobile devices to conduct financial transactions, financial institutions such as us have been, and will continue to be, subject to an increasing risk of cyber incidents from these activities. We and our Affiliates take protective measures to secure information, including through system security technology. However, our technology systems may still be vulnerable to unauthorized access, computer malware or other events that have a security impact, such as an authorized employee or vendor inadvertently causing the release of confidential information or third-party unauthorized access or account takeovers, which could materially damage our operations or cause the disclosure or modification of sensitive or confidential information. Breach of our technology systems through cyber-attacks, or failure to manage and secure our technology environment, could result in interruptions or malfunctions in the operations of our business, loss of valuable information, liability for stolen assets or information, remediation costs to repair damage caused by a breach, additional costs to mitigate against future incidents and litigation costs resulting from an incident. Moreover, loss of confidential client information could harm our reputation and subject us to liability under the laws that protect personal data, resulting in increased costs or loss of revenues.
Our Affiliates and third parties with which we do business may also be sources of cybersecurity or other technological risks as we outsource certain functions. While we engage in certain actions to reduce the exposure resulting from outsourcing, such as performing onsite security control assessments, limiting third-party access to the least privileged level necessary to perform job functions, and restricting third-party processing to systems stored within our data centers, ongoing threats may result in unauthorized access, loss or destruction of data or other cyber incidents with increased costs and consequences to us such as those discussed above.
The carrying value of goodwill and other intangible assets on our balance sheet could become impaired, which would adversely affect our financial condition and results of operations.
We have recorded goodwill and intangible asset impairments in the past and could incur such charges in the future as acquisitions occur and we take on more goodwill. We review the carrying value of goodwill and intangible assets not subject to amortization on an annual basis, or more frequently if indications exist suggesting that the fair value of our intangible assets may be below their carrying values. We test the values of intangible assets subject to amortization whenever events or changes in circumstances indicate that the carrying amount of an asset may not be recoverable. Should such review indicate impairment, a write-down of the carrying value of goodwill or the intangible asset could occur, resulting in a non-cash charge that may, in turn, affect our reported results of operations, financial condition and shareholders’ equity.
Claims for indemnification may be substantial and have a negative impact on our financial condition.
We have engaged in a number of transactions involving the sale of businesses to third parties and to members of management of former Affiliates. As is customary in business transactions of these types, we were required to and did provide indemnifications with respect to third-party claims arising out of these transactions for limited periods of time with respect to certain claims, and for unlimited periods of time with respect to other claims. While we currently are not aware of exposure or potential exposure to any claim against us for indemnification, there can be no guarantee that a claim will not arise during the relevant indemnification period and that we will not have to provide the requisite indemnification. In addition, legal challenges to any potential claim for indemnification could result in increased legal expenses.
35
The failure of a counterparty to meet its obligations could affect our business adversely.
Our Affiliates routinely execute transactions with counterparties in the financial industry and for the provision of services that are important to the business, and we may engage in transactions with counterparties as part of our corporate finance management function and for the provision of services. As a result, we and our Affiliates and clients have exposure to the credit, operational and other risks posed by such counterparties, including the risk of default by or bankruptcy of a counterparty. The failure of a counterparty to meet its obligations or provide the services we depend on for these or other reasons could adversely affect our ability to conduct our businesses and result in loss of client assets and potential liability. With respect to the Deferred Tax Asset Deed, our Parent will remain a significant counterparty with respect to an indemnity which covers the historical and future payments made under such Deed since the Offering.
We may be subject to financial criminal activity which could result in financial loss or damage to our reputation.
Instances of financial criminal activity, personal trading violations and other abuses, including misappropriation of assets by internal or external perpetrators, may arise despite our internal control policies and procedures. Instances of such criminal activity by financial firms and their personnel, including those in the investment management industry, have led the U.S. government and regulators to increase enforcement of existing rules relating to such activities, adopt new rules and regulations and enhance oversight of the U.S. financial industry. As we expand our international operations, we will be subject to the rules of other jurisdictions that govern and control financial criminal activities and exposed to financial criminal activities on a more global scale. Compliance with existing and new rules and regulations may have the effect of increasing our expenses. Further, should any of our or our Affiliates’ personnel be linked to financial criminal activity, either domestically or internationally, we would suffer material damage to our reputation which could result in a corresponding loss of clients and/or client assets and revenue.
We and our Affiliates are vulnerable to reputational harm because we operate in an industry in which personal relationships, integrity and client confidences are of critical importance. For example, if an employee were to engage in illegal or suspicious activities, we or an Affiliate could be subject to legal or regulatory sanctions and suffer serious harm to our reputations (as a consequence of the negative perception resulting from such activities), and impairment to client relationships and the ability to attract new clients. Our Affiliates’ businesses often require that they deal with confidential information. If their employees were to improperly use or disclose this information, even if inadvertently, our Affiliates and we could be subject to legal or regulatory action and suffer serious harm to our reputations and current and future business relationships.
It is not always possible to deter employee misconduct, and the precautions we take to detect and prevent this activity may not always be effective. In addition, the SEC has increased its scrutiny of the use of non-public information obtained from corporate insiders by professional investors. Employee misconduct, or even unsubstantiated allegations of misconduct, could adversely impact our reputation, current and future business relationships and our financial condition.
36
We are subject to the U.K. Bribery Act, the U.S. Foreign Corrupt Practices Act and other anti-corruption laws, as well as export control laws, customs laws, sanctions laws and other laws governing our operations. If we fail to comply with these laws, we could be subject to civil or criminal penalties, other remedial measures, and legal expenses, which could adversely affect our business, results of operations and financial condition.
Our operations are subject to anti-corruption laws, including the U.K. Bribery Act 2010, or the Bribery Act, the U.S. Foreign Corrupt Practices Act, or the FCPA, and other anti-corruption laws that apply in countries where we do business. The Bribery Act, the FCPA and these other laws generally prohibit us and our employees and intermediaries from bribing, being bribed or making other prohibited payments to government officials or other persons to obtain or retain business or gain some other business advantage. We and our commercial partners operate in a number of jurisdictions that may pose a risk of potential Bribery Act or FCPA violations, and we participate in collaborations and relationships with third parties whose actions could potentially subject us to liability under the Bribery Act, the FCPA or local anti-corruption laws. In addition, we cannot predict the nature, scope or effect of future regulatory requirements to which our internal operations might be subject or the manner in which existing laws might be administered or interpreted.
We are also subject to other laws and regulations governing our international operations, including regulations administered by the governments of the United Kingdom, or U.K., and the U.S., and authorities in the European Union, including applicable export control regulations, economic sanctions on countries or persons, customs requirements and currency exchange regulations, or Trade Control Laws.
There is no assurance that we will be completely effective in ensuring our compliance with all applicable anti-corruption laws, including the Bribery Act, the FCPA or other legal requirements, including Trade Control Laws. If we are not in compliance with the Bribery Act, the FCPA and other anti-corruption laws or Trade Control Laws, we may be subject to criminal and civil penalties, disgorgement and other sanctions and remedial measures, and legal expenses, which could have an adverse impact on our business, financial condition, results of operations and liquidity. Likewise, any investigation of any potential violations of the Bribery Act, the FCPA, other anti-corruption laws or Trade Control Laws by U.K., U.S. or other authorities could also have an adverse impact on our reputation, business, results of operations and financial condition.
A U.K. exit from the European Union could adversely impact our business.
On June 23, 2016, U.K. citizens voted in a referendum to leave the European Union. The consequences of this vote, and the possible exit of the U.K., together with what may be protracted negotiations around the terms of any exit, are uncertain. The exit of the U.K. from the European Union and the uncertainty regarding the form and timing of such exit may have adverse effects on the U.K., European and worldwide economy and market conditions and contribute to currency exchange fluctuations. Any negative impact to overall investor confidence or instability in the global macroeconomic environment could have an adverse economic impact on our results of operations. Although an immaterial portion of our revenue is impacted by changes in value of the British pound, certain of our subsidiaries are domiciled in the U.K. and authorized by the Financial Conduct Authority to carry on certain activity, such as investment management and distribution. In addition, a withdrawal of the U.K. from the European Union could lead to legal uncertainty and potential regulatory and tax changes including a loss of certain “passporting” benefits currently afforded to firms authorized by the Financial Conduct Authority. The effect of any of these risks, were they to materialize, is difficult to quantify, but could increase our operating and compliance costs and could negatively impact the value of our securities.
37
Industry Risks
We operate in a competitive environment.
The investment management industry is highly competitive, with competition based on a variety of factors, including investment performance, investment management fee rates, continuity of investment professionals and client relationships, the quality of services provided to clients, reputation and the strategies offered. We and our Affiliates compete against a broad range of domestic and international asset management firms, broker-dealers, hedge funds, investment banking firms and other financial institutions. We directly compete against these organizations with respect to investment products, distribution channels, opportunities to acquire other investment management firms and retention and recruitment of talent. The capital resources, scale, name recognition and geographic footprints of many of these organizations are greater than ours. The recent trend toward consolidation in the investment management industry, and the financial services industry in general, has served to increase the size and strength of a number of our competitors. Some investors may prefer to invest with an investment manager that is not publicly traded based on the perception that a publicly traded asset manager may focus on the manager’s own growth to the detriment of investment performance for clients. Some competitors may operate in a different regulatory environment than we do, which may give them certain competitive advantages in the investment products and portfolio structures that they offer.
In addition, each of our Affiliates competes against other investment managers offering the same or different investment strategies. The competition in our industry results in pressure on fees which may hinder the ability of our Affiliates to compete. All of our Affiliates rely upon their investment performance as a competitive advantage, which may not always position them to compare favorably to their competitors. In certain instances, our Affiliates also may compete against one another for clients. It is likely that new competitors will enter the market as there are low costs and limited barriers to entry.
Our ability to attract assets also is dependent upon the ability of our Affiliates to offer a mix of products and services that meet client demand and their abilities to maintain investment management fees at competitive levels. There are a number of asset classes and product types that currently are not well covered by our Affiliates, such as index funds, passive exchange-traded funds and hedge funds. When these asset classes or products are in favor with either existing or potential clients, our Affiliates will miss the opportunity to attract and manage these assets and face the risk of assets being withdrawn in favor of competitors who manage the asset classes and/or provide these products. If our Affiliates are unable to compete effectively in their markets, our results of operations and potential business growth could be adversely affected.
Our sole business is asset management. As a result, we may be more impacted by trends and issues and more susceptible to negative events impacting the asset management industry than other more diversified financial services companies that provide asset management and other financial services.
We operate in a highly regulated industry, and continually changing federal, state, local and foreign laws and regulations could materially adversely affect our business, financial condition and results of operations.
The investment management business is highly regulated and, as a result, our Affiliates are required to comply with a wide array of domestic and international laws and regulations. The requirements imposed by our regulators are designed to ensure the integrity of the financial markets and to protect customers and other third parties who deal with us, and are not designed to protect our shareholders. Accordingly, these regulators often serve to limit our activities, including through client protection and market conduct requirements.
38
Our Affiliates are subject to extensive regulation in the U.S. through their primary regulator, the SEC, under the Advisers Act. Those of our Affiliates that act as investment advisers or sub-advisers to registered investment companies must comply with the terms of the Investment Company Act and the rules thereunder. The Advisers Act imposes numerous obligations on registered investment advisers, including fiduciary, record keeping, advertising and operational requirements, disclosure obligations, and prohibitions on fraudulent activities. The Investment Company Act regulates the structure and operations of registered investment companies and imposes additional obligations on advisers to registered investment companies, including detailed disclosure and regulatory requirements applicable to the registered investment companies and additional compliance responsibilities which must strictly be adhered to by the funds and their advisers. Certain of our advisory Affiliates also are subject to the rules and regulations adopted by the Commodity Futures Trading Commission, under the Commodity Exchange Act; by the Department of Labor, under ERISA; the Financial Industry Regulatory Authority, Inc., or FINRA; and state regulators.
The domestic regulatory environment in which we operate has seen significantly increased regulation in recent years. In particular, the Dodd-Frank Wall Street Reform and Consumer Protection Act, or the Dodd-Frank Act, represents a comprehensive overhaul of the financial services industry in the U.S. and includes, among other things: (i) the creation of a Financial Stability Oversight Council to identify emerging systemic risks posed by financial firms, activities and practices, and to improve cooperation among federal agencies, (ii) the creation of the Consumer Financial Protection Bureau authorized to promulgate and enforce consumer protection regulations relating to financial products and services, and (iii) enhanced regulation of financial markets, including the derivatives and securitization markets. Certain provisions of the Dodd-Frank Act may require our Affiliates to change, or adopt new limitations on, the manner in which they conduct their business. The Dodd-Frank Act and the rules promulgated thereunder have also increased regulatory burdens and related reporting and compliance costs. Certain provisions may have unintended adverse consequences on the liquidity or structure of the financial markets. In addition, the scope and impact of many provisions of the Dodd-Frank Act remain to be determined by implementing regulations, some of which have involved lengthy proposal and promulgation periods and could lead to additional legislation or regulation. The Dodd-Frank Act impacts a broad range of market participants with whom our Affiliates interact or may interact. These changes may also impact the way in which our Affiliates conduct business with their counterparties and many aspects of the regulatory landscape continue to evolve. As a result of these uncertainties, the full impact of the Dodd-Frank Act on the investment management industry and on our and our Affiliates’ businesses, in particular, cannot be predicted at this time.
Developments in the current regulatory environment in the U.S. may include heightened and additional examinations and inspections by regulators and the imposition of additional reporting and disclosure obligations. Regulators also may take a more aggressive posture on bringing enforcement proceedings which could result in fines, penalties and additional remedial activities.
We and our Affiliates also are subject to the regulatory environments of the non-U.S. jurisdictions in which we and they operate, some of which also recently implemented or are in the process of implementing changes in regulations. In the U.K. we and our Affiliates are subject to regulation by two regulators, the Prudential Regulation Authority and the Financial Conduct Authority, which impose a comprehensive system of regulation on investment advisers and the manner in which we and they conduct our businesses. Some Affiliates are subject to and required to comply with the rules and regulations of the Irish Central Bank and the Luxembourg CSSF. We and our Affiliates are additionally subject to regulation relating to the offer and sale of financial products in each of the European Union countries in which we and they operate. The system of financial regulation in the European Union (including the U.K., Germany, Ireland, Luxembourg and Sweden) continues to develop and evolve and, as a result, the rules to which we and our Affiliates are subject (including rules relating to the remuneration of staff) are and will continue to be subject to change. Other Affiliates that are registered in Australia, Canada, China, Hong Kong, Japan, South Korea, Russia, Singapore and the United Arab Emirates are subject to applicable regulations in those jurisdictions. As we execute on our growth strategy and continue to expand our distribution efforts into non-U.S. jurisdictions, including other member countries of the European Union, Latin America, the Middle East and certain other Asian countries, our Affiliates may be required to register with additional foreign regulatory authorities or otherwise comply with non-U.S. rules and regulations that currently are not applicable to our businesses and with respect to which we may have limited or no compliance experience. Our lack of experience in complying with any such non-U.S. or non-English
39
laws and regulations may increase our risk of becoming a party to litigation or subject to regulatory actions. Additionally, one or more of the jurisdictions in which we operate may require our shareholders to seek the approval of, or provide notice to, an applicable regulator before acquiring a substantial amount of our outstanding shares.
Policy and legislative changes in the U.S. and in other countries are affecting many aspects of financial regulation. Our business, results of operations and financial condition may be adversely affected as a result of new or revised legislation or regulations or by changes in the interpretation or enforcement of existing laws and regulations in any of the jurisdictions in which we and our Affiliates conduct business. The ability of us and our Affiliates to function in this legislative and regulatory environment will depend on our and our Affiliates’ ability to monitor and promptly react and adapt to legislative and regulatory changes, including situations where such changes in regulatory requirements may be driven by internal factors such as a reduction in ownership by our Parent or possibly other unilateral actions taken by our Parent. It is impossible to determine the extent of the impact of any new laws, regulations or initiatives that may be proposed, or whether any of the proposals will become law. Any new laws or regulations could make compliance more difficult and expensive and affect the manner in which we and our Affiliates conduct business.
Failure to comply with applicable laws or regulations could result in fines, suspension or revocation of an Affiliate’s registration as an investment adviser, suspensions of individual employees, revocation of licenses to operate in certain jurisdictions or other sanctions, which could materially adversely affect our business, financial condition and results of operations. Even if an investigation or proceeding did not result in a fine or sanction, or the fine or sanction imposed against an Affiliate or us or our respective employees by a regulator were small in monetary amount, the adverse publicity relating to an investigation, proceeding or imposition of a fine or sanction could cause us to suffer financial loss, harm our reputation and cause us to lose business or fail to attract new business which would have a direct adverse impact on our business, financial condition and results of operations.
If we were deemed an investment company under the Investment Company Act, we would become subject to burdensome regulatory requirements and our business activities could be restricted.
We do not believe that we are an “investment company” under the Investment Company Act. Generally, a company is an “investment company” if, absent an applicable exemption, it (i) is, or holds itself out as being, engaged primarily, or proposes to engage primarily, in the business of investing, reinvesting or trading in securities or (ii) engages, or proposes to engage, in the business of investing, reinvesting, owning, holding or trading in securities and owns or proposes to acquire “investment securities” having a value exceeding 40% of the value of its total assets (exclusive of U.S. government securities and cash items) on an unconsolidated basis. We believe we are primarily engaged in a non-investment company business and that less than 40% of our total assets (exclusive of U.S. government securities and cash items) on an unconsolidated basis are comprised of assets that could be considered investment securities.
We and our Affiliates intend to conduct our operations so that we will not be deemed an investment company under the Investment Company Act. However, if we were to be deemed an investment company, restrictions imposed by the Investment Company Act, including limitations on our capital structure and our ability to transact with our Affiliates, could make it impractical for us to continue our business as currently conducted and could have a material adverse effect on our financial performance and operations.
ERISA fiduciary regulations issued by the Department of Labor could have a material adverse effect on our financial performance and operations.
On April 6, 2016, the Department of Labor issued a final fiduciary rule expanding the circumstances in which advice furnished to retirement investors will be treated as fiduciary in nature as well as related prohibited transaction class exemptions. The fiduciary rule and exemptions are focused on financial intermediaries who provide advice to institutional and retail retirement plan clients and mandate increased disclosure of financial intermediary compensation and mitigation of conflicts of interest. To the extent that the fiduciary rule and exemptions lead to changes in financial intermediary and retirement plan investment preferences, and increased pressure on product fees and expenses, such changes could have a material adverse effect on our financial performance and operations.
40
Risks Related to Our Ownership Structure
Our Parent controls us and has significant power to control our business, affairs and policies.
At December 31, 2016, our Parent beneficially owned 51.1% of our outstanding ordinary shares. As a result of its majority ownership, and pursuant to the rights of our Parent under the shareholder agreement that we have entered into with our Parent, or the Shareholder Agreement, and, as required by the Shareholder Agreement, policies and procedures adopted by our Board of Directors, our Parent has significant power to control our business, affairs and policies, including the right to appoint a majority of the directors to our Board of Directors, and, accordingly, the appointment of management, the adoption of amendments to our articles of association and the number of ordinary shares available for issuance under our equity incentive plans for our prospective and existing employees. This concentration of ownership may have the effect of delaying or preventing a change in control of us or discouraging others from making tender offers for our ordinary shares, or could result in a change of control in which only our Parent’s shares are sold, which could prevent shareholders from receiving a premium for their ordinary shares. It also may make it difficult for other shareholders to replace management and may adversely impact the trading price of our ordinary shares because investors often perceive disadvantages in owning ordinary shares in companies with controlling shareholders.
Pursuant to the Shareholder Agreement, our Parent, for so long as it remains the majority owner of our outstanding ordinary shares, has the right to appoint a majority of the directors to our Board of Directors. At such time as our Parent ceases to own a majority of our outstanding shares, our Parent will no longer have the right to appoint a majority of the directors to our Board of Directors but will have the right to appoint a lesser number of directors for so long as it owns certain specified percentages of our outstanding ordinary shares that are less than a majority but greater than or equal to 7%. In addition, our Board of Directors has adopted policies and procedures which give our Parent significant control over certain matters, including budgets, business strategy, acquisitions, expenditures, insurance and compensation, and require us to comply with certain policies and procedures similar to those at our Parent.
At such time as our Parent ceases to own a majority of our ordinary shares, any or all such policies and procedures may be amended or terminated in the sole discretion of our Board of Directors and therefore any control maintained by our Parent solely as a result of such policies or procedures may be reduced or eliminated.
In addition, pursuant to the Shareholder Agreement, our Parent has approval rights over various matters until the date our Parent ceases to beneficially own at least 20% of our outstanding ordinary shares, including:
• | any merger or acquisition with consideration paid or payable (including a pro rata share of the debt assumed) of more than $100 million, or any disposition of assets with a fair market value of more than $100 million, involving us or one of our subsidiaries or controlled Affiliates, on the one hand, and any other person, on the other hand; |
• | any incurrence or guarantee of (or grant of a lien with respect to) external recourse debt in an amount greater than $300 million, plus the principal amount of the outstanding external debt on the date that our Parent ceases to beneficially own more than 50% of our outstanding ordinary shares; |
• | any issuance of share capital other than (i) issuances of equity awards to directors or employees pursuant to a compensation plan or (ii) issuances of share capital in connection with an acquisition involving a consideration payable not exceeding $100 million; |
• | entry into or amendment or termination of any material joint venture or strategic alliance; |
• | any declaration or payment of a dividend other than in accordance with our dividend policy approved by our Board of Directors as of the date that our Parent ceases to beneficially own more than 50% of our outstanding ordinary shares; |
• | listing or delisting of any securities on a securities exchange; |
41
• | any agreement or arrangement that would conflict with the terms of the Shareholder Agreement; |
• | any amendment, termination or waiver of any rights under our constitutional documents; and |
• | any filing or petition under bankruptcy laws, admission of insolvency or similar actions by us or any of our subsidiaries or controlled affiliates, or our dissolution or winding-up. |
The foregoing approval rights may be transferred to a third party if our Parent sells that third party a majority of our outstanding ordinary shares. Once our Parent ceases to own a majority of our outstanding ordinary shares, it will no longer be able to transfer such approval rights.
The ownership by our Parent of a significant percentage of our ordinary shares, its right to appoint directors and its significant control with respect to certain matters as described above limits the ability of other shareholders to influence corporate matters.
We are a “controlled company” within the meaning of the NYSE Listed Company Manual while our Parent owns more than 50% of our outstanding ordinary shares and, as a result, qualify for, and rely on, exemptions from certain corporate governance requirements.
At December 31, 2016, our Parent continues to beneficially own a majority of our ordinary shares. As a result, we are a “controlled company” within the meaning of the NYSE Listed Company Manual. Under the NYSE Listed Company Manual, a company of which more than 50% of the voting power is held by an individual, group or another company is a “controlled company” and may elect not to comply with certain corporate governance requirements in the NYSE Listed Company Manual, including:
• | the requirement that a majority of our Board of Directors consist of independent directors; |
• | the requirement that we have a nominating/corporate governance committee that is composed entirely of independent directors; and |
• | the requirement that we have a compensation committee that is composed entirely of independent directors. |
As of December 31, 2016, we utilized the exemptions to each of the requirements listed above. Accordingly, shareholders will not have the same protections afforded to shareholders of companies that are subject to all of the NYSE corporate governance requirements of the NYSE Listed Company Manual until such time as our Parent ceases to own a majority of our outstanding shares. Even if we are no longer a “controlled company” our Parent still may have significant influence over us depending upon the level of ownership retained by our Parent, including the right to appoint directors. For further information on our Parent’s rights under the Shareholder Agreement, see “Certain Relationships and Related Party Transactions-Relationship with our Parent and OMGUK” in our 2016 Proxy Statement on Schedule 14A filed with the SEC on April 6, 2016.
If our Parent sells a controlling interest in us to a third party in a private transaction, other shareholders may not realize any change-of-control premium on our ordinary shares.
Our Parent owns a majority of our ordinary shares. Our Parent has the ability, should it choose to do so, to sell some or all of our ordinary shares in a privately negotiated transaction, which, if sufficient in size, could result in a change of control of us. The ability of our Parent to privately sell such shares may not be subject to any requirement for a concurrent offer to be made to acquire all of our ordinary shares that are publicly traded, which could prevent other shareholders from realizing any change-of-control premium on their ordinary shares that may otherwise accrue to our Parent upon its private sale of our ordinary shares. A sale of shares which resulted in a change of control could have a negative impact on our business.
42
For so long as our Parent owns a majority of our outstanding ordinary shares, it will have significant influence over our business and strategy and it will have the right to transfer such influence to a third party. Our Parent’s interest or the interest of any third party transferee may differ from the interests of our other shareholders.
For so long as our Parent owns a majority of our outstanding ordinary shares, it has approval rights over significant business decisions, it has the right to appoint a majority of our Board of Directors and our Board of Directors has policies and procedures in place which give our Parent approval rights over budgets, business strategy, acquisitions, expenditures, insurance and compensation. In addition, as long as our Parent retains ownership of a majority of our outstanding ordinary shares, our Parent may transfer the foregoing rights to a third party transferee of a majority of our ordinary shares, at which point we will become subject to the control of that third party. Any third party that acquires a controlling interest in us from our Parent may be unknown or unfamiliar to our management and our Affiliates. Our Parent’s interests or the interests of a new majority owner in our long-term business strategy may differ from that of our shareholders and management. As a result, our Parent or a new majority owner may make decisions about the long-term strategy of our company that may be in its own interest and conflict with the interests of our minority shareholders.
On March 11, 2016, our Parent announced the results of a strategic review, which included a plan to separate its underlying businesses, including OMAM. Were the structure and form of this separation to result in a change in our control as described below, it could adversely impact our relationship with our Affiliates and their clients and, under certain circumstances, could result in the acceleration of our outstanding indebtedness and/or the redemption of our outstanding long-term debt.
On March 11, 2016, our Parent announced the results of a strategic review, which included a plan to separate its underlying businesses, including OMAM. Our Parent further announced on December 12, 2016 its intention to continue the reduction of its holdings in OMAM in an orderly manner which balances value, cost, time and risk. We can provide no assurances as to the timing or manner in which our Parent may execute upon its strategy with respect to the separation process and any impact such separation may have on us. In this regard, our Parent has engaged from time to time in discussions with, and continues to consider expressions of interest from, third parties to acquire a majority of our outstanding shares from our Parent. There can be no assurance that any discussions will result in a sale of our ordinary shares held by our Parent or that shareholders other than our Parent would be afforded the opportunity to participate in such sale.
A sale of the majority of our outstanding ordinary shares by our Parent to a third party could result in disruption to our relationships with our Affiliates and their clients and therefore our assets under management and net client cash flows if the new owner is deemed to be unattractive or unsupportive of our, and our Affiliates’, strategy. Any potential disagreements between our management and a new majority owner over matters such as the economic arrangements or management policies with our Affiliates, growth strategies and compensation philosophy of our Affiliates could adversely affect our relationships with our Affiliates. Furthermore, dissatisfaction by the management teams of our Affiliates with the services that we provide to them and the conditions upon which such services are provided also could result in a strained relationship with the management of that Affiliate. Any strains in the relationships that we have with our Affiliates could be detrimental to our overall business. See “—Our Relationships with our Affiliates are Critical to Our Success”.
The investment advisory agreements between our Affiliates, who are (or who have subsidiaries who are) U.S. registered investment advisers, and their clients are not assignable without the consent of the client. A future sale of a controlling block of our voting securities by our Parent to a third party could be deemed an “assignment” of the underlying investment advisory agreements between our Affiliates and their clients under the Advisers Act and Investment Company Act. If an assignment of an investment advisory agreement is deemed to occur, and clients do not consent to the assignment or enter into a new advisory agreement, our results of operations could be materially and adversely affected. In addition, in the event our Parent sells a controlling block of our voting securities to a third party, prospective clients and consultants may be reluctant to commit to make new investments with our Affiliates, or invest in funds sponsored by our Affiliates, for some period of time following the sale, which may adversely affect our results of operations.
43
In a proposed transfer of a controlling block of our ordinary shares, our Affiliates will be asked to seek the consent of their clients to the assignment of their advisory contracts. Our Affiliates may not support a proposed transfer of a controlling block of our securities or the proposed transferee of the controlling block. As a result, our Affiliates may be reluctant to solicit the consents of their clients to the assignments of their advisory contracts that would result from such proposed transfer of a controlling block or may do so only if certain commitments are made by the proposed purchaser to such Affiliates. An agreement for a sale of a control block of the securities of a company such as ours often provides that the closing of the transaction is conditioned upon receipt of consents of clients representing a specified percentage of the assets under management or revenues of the target company. The announcement of a transaction that fails to close for this reason could have an adverse effect on the relationship between our Affiliates and their clients and thus an adverse effect on us. Even if a transaction were to be completed, revenue attributable to non-consenting clients could be lost which could have a material adverse effect on our results of operations.
Finally, if our Parent sells a majority of our outstanding ordinary shares to a third party, an event of default under our revolving credit facility will occur, which would entitle the lenders to accelerate any indebtedness outstanding under the facility and to terminate the facility. If an acceleration of at least $50 million of indebtedness occurs and such amount is not repaid within 30 days, there will be a cross default with respect to our $400 million (in aggregate) senior unsecured notes, or the Notes. Upon the occurrence of a default, the trustee or holders of 25% of the aggregate principal amount of the Notes may declare the Notes immediately due and payable. Our future debt instruments may contain similar restrictions and provisions. In addition, a sale of a majority of our outstanding shares to a third party could result in a downgrade in our credit rating to below investment grade. Were such a downgrade to occur with respect to both Moody’s Investors Service, Inc. and Standard & Poor’s Financial Services LLC, noteholders would have the right to require us to repurchase the Notes at a price equal to 101% of the principal amount, plus accrued and unpaid interest to but excluding the repurchase date. The source of funds that will be required to repurchase the Notes and repay any outstanding indebtedness under our revolving credit facility will be our available cash or cash generated from our subsidiaries’ operations or other potential sources, including borrowings, sales of assets or sales of equity. We cannot assure you that sufficient funds from such sources will be available to make required repurchases of the Notes tendered or repay outstanding indebtedness if accelerated.
In the event of a “Control Change” under the Heitman operating documents, Heitman management would have the right to purchase our ownership interest in Heitman at our estimate of the value of such interest.
Under the Third Amended and Restated Limited Liability Company Operating Agreement of Heitman LLC, or the Heitman Agreement, a “control change” of Heitman may not take place unless the subsidiary through which OMUS owns an interest in Heitman, or the Class B Member, first offers to the employee-owned entity that is the other member of Heitman, or the Heitman Employee Entity, the right to purchase the Class B Member’s interest in Heitman at a price equal to the Class B Member’s good faith estimate of the reasonable value of its interest in Heitman. A “control change” is deemed to occur if (i) OMUS, Heitman Financial Ltd., a wholly- owned subsidiary of OMUS, or a permitted transferee of these entities ceases to be controlled by our Parent, or (ii) a sale, exchange, transfer or assignment of shares in our Parent takes place, the effect of which is a change of control of our Parent. A “control change” does not include (x) a sale, exchange, transfer or assignment of the Class B Member’s interest in Heitman or any economic interest therein to a bona fide secured creditor of OMUS resulting from the lender exercising its rights pursuant to a pledge of the interests in Heitman, (y) a sale, exchange, transfer or assignment of the Class B Member’s interests in Heitman or any economic interest therein to any business entity that is controlled by our Parent or (z) an initial public offering of the shares of any entity which owns a direct or indirect interest in the Class B Member. The Heitman Employee Entity has advised us it believes a sale by OMGUK of ordinary shares, the effect of which is a reduction in OMGUK’s ownership of OMAM below 50%, would represent a “control change” of Heitman. We disagree with this interpretation of the Heitman Agreement. If a “control change” were deemed to occur and the Heitman Employee Entity were to exercise its right to purchase the Class B Member’s interest in Heitman, then, upon the closing of the purchase, Heitman would no longer be one of our Affiliates. For the year ended December 31, 2016, earnings received from our investment in Heitman represented approximately 5% of our total economic net income and Heitman had no impact on our $11.0 million NCCF revenue flow.
44
Our Parent’s continuing significant interest in us may result in conflicts of interest.
For as long as our Parent continues to beneficially own a significant amount of our outstanding ordinary shares, it will continue to be able to strongly influence or effectively control our decisions. See “—Our Parent controls us and has significant power to control our business, affairs and policies.” Moreover, as long as our Parent continues to beneficially own more than 50% of our issued share capital, it will be able to determine the outcome of any corporate actions requiring approval of our shareholders by way of ordinary resolution (as such matters require approval by at least 50% of shareholders present and voting at the meeting at which the resolution is proposed).
Our Parent also has the right to appoint a majority of our Board of Directors and approval rights over certain enumerated corporate actions pursuant to the Shareholder Agreement. Because our Parent’s interests may differ from those of other shareholders, actions our Parent takes or omits to take with respect to us, for as long as it has these rights, including those corporate or business actions requiring its prior affirmative written consent or vote, may not be as favorable to other shareholders as they are to our Parent.
The interests of our Parent could conflict in material respects with those of our other shareholders. For example, our Parent (through its control of our Board of Directors or pursuant to consent rights in the Shareholder Agreement) may prevent us from incurring indebtedness or making acquisitions with our own capital for any reason, including if such actions would adversely affect its capital ratios on a consolidated basis, negatively affect its credit rating or otherwise influence its financial metrics. Our Parent also could, for similar or other reasons, exert control over the amount and timing of our investments and dispositions, cause us to sell revenue-generating assets or control the issuance of additional ordinary shares. Any such actions by our Parent could affect the amount of cash available for distribution to shareholders. In addition, our Parent may from time to time acquire and hold interests in businesses that compete directly or indirectly with us. It also may pursue acquisition opportunities that may be complementary to our business and, as a result, those acquisition opportunities may not be available to us. Our Parent may have tax positions that are different from ours which could influence its decisions regarding whether and when to dispose of assets and whether and when to incur new or refinance existing indebtedness. In addition, the structuring of future transactions may take into consideration our Parent’s tax considerations even where no similar benefit would accrue to us.
Our Parent is also allowed to take into account the interests of parties other than us in resolving conflicts of interest. As an English plc our Parent owes no duty to our other shareholders. Furthermore, our articles of association specify that no officer or director owes any duty to any individual shareholder. Other affiliates of our Parent and existing and former personnel employed by our Parent may not be subject to non-competition, non-solicitation and confidentiality agreements to which members of our management and those of our Affiliates are subject and thus may not be prohibited from engaging in other businesses or activities, including those that might be in direct competition with us. Our Parent also may control the enforcement of obligations owed to us by it and its affiliates and decide whether to retain separate counsel or others to perform services for us.
The Shareholder Agreement and the approach of our Board of Directors to corporate governance and risk management gives our Parent significant control over our business and may impose additional controls and information sharing by us and our Affiliates from that deemed to be standard in the investment management industry. While overlaying these additional governance and risk management structures onto the highly regulated investment management business may be viewed as a desirable added layer of regulatory oversight, it may be viewed by Affiliates and potential acquisition targets as being overly cumbersome, controlling and costly and thus a competitive deterrent to a third party becoming affiliated with us.
45
Our ability to pay regular dividends to our shareholders is subject to the discretion of our Board of Directors and our Parent and may be limited by our holding company structure and applicable provisions of the laws of England and Wales.
We target a dividend payout in the range of 25% of ENI, subject to maintaining a sustainable quarterly dividend per share. Beginning on the date our Parent ceases to own more than 50% of our ordinary shares and ending on the date that our Parent ceases to beneficially own at least 20% of our outstanding ordinary shares, the approval of our Parent will be required to declare any dividend other than in accordance with the dividend policy approved by our Board of Directors as of the date our Parent ceases to beneficially own more than 50% of our outstanding ordinary shares. Any declaration of dividends will be at the discretion of our Board of Directors and subject to the approval of our Parent (for so long as required), and will depend on our financial condition, earnings, cash needs, regulatory constraints, capital requirements and any other factors that our Board of Directors or Parent deems relevant in making such a determination. Under English law, we may only pay dividends out of our accumulated, realized profits, so far as not previously utilized by distribution or capitalization and provided that at the time of payment of the dividend, the amount of our net assets is not less than the total of our called-up share capital and undistributable reserves. In addition, as a holding company, we will be dependent upon the ability of our Affiliates to generate earnings and cash flows and distribute them to us so that we may pay dividends to our shareholders. The ability of our Affiliates to distribute cash to OMUS will be subject to their operating results, cash requirements and financial condition, the applicable provisions of governing law which may limit the amount of funds available for distribution, their compliance with covenants and financial ratios related to existing or future indebtedness, and their other agreements with third parties. As a consequence of these various limitations and restrictions, we may not be able to make, or may have to reduce or eliminate, the payment of dividends on our ordinary shares.
Some of our directors are employees of our Parent.
As of December 31, 2016, a majority of our directors have been designated to our Board of Directors by our Parent. Three of these directors are officers or employees of our Parent. Because of each of these three director’s positions as an officer or employee of our Parent, these three directors may own substantial amounts of shares of our Parent. Ownership interests of these three directors in shares of our Parent, or service of certain of our directors as officers or employees of our Parent, may create, or may create the appearance of, conflicts of interest when a director is faced with a decision that could have different implications for the two companies. These potential conflicts could arise, for example, over matters such as the desirability of an acquisition opportunity, employee retention or recruiting, capital management or our dividend policy and could result in the Company taking actions that are in the best interests of our Parent but not our other shareholders. Our Board of Directors has authorized any conflict of interest that any director appointed to our Board of Directors by our Parent from time to time may have with respect to any position held, or other interest, in any member of our Parent’s group of companies. Notwithstanding any such conflict, directors appointed to our Board of Directors by our Parent are entitled to receive all information provided to, and participate fully in all deliberations and participate in any vote of, our Board of Directors, for all matters.
46
Our separation from our Parent could have a negative impact on our business and results of operations due to our Parent’s strong brand, reputation and existing regulatory relationships.
Prior to the initial public offering, we benefited from being a wholly-owned subsidiary of our Parent and a member of our Parent’s group of companies as we believe the association has provided us with preferred status among a variety of service providers, vendors and others due to our Parent’s globally recognized brand, perceived high quality products and services and strong capital base and financial strength. In connection with the initial public offering, we entered into an intellectual property license agreement with our Parent and, solely for the intellectual property owned by it applicable to the agreement, Old Mutual Life Assurance Company (South Africa) Ltd., or OMLACSA, which we refer to as the Intellectual Property Agreement. Pursuant to the Intellectual Property Agreement, our Parent and OMLACSA have granted us a limited, non-exclusive, fully paid-up, royalty-free, non-transferable, non-sublicensable license to use certain trademarks, servicemarks, names and logos, including the names “Old Mutual”, “OM” and the “OM 3 anchor design logo” with respect to our business worldwide, subject to certain exceptions set forth in the Intellectual Property Agreement. The license term is through the period ending six months after the date on which our Parent ceases to directly or indirectly own a majority of our outstanding ordinary shares; provided, however that under the Intellectual Property Agreement, our Parent and OMLACSA have given us a perpetual right (i) to use the name “OM Asset Management” as all or part of our corporate or trade names, (ii) to use “OMAM” in all or part of our corporate or trade names, businesses and activities, including in any advertising or promotional materials, and as a ticker symbol and (iii) to use omam.com as a website and an email address. After this license expires, we must cease using the licensed intellectual property (other than as described above and in the Intellectual Property Agreement) and any benefits that we derived from the use of the “Old Mutual” brand name and logo will likely be diminished or eliminated.
In addition, certain of our Parent’s other affiliates have established investment advisory and other investment-advisory related relationships with our Affiliates pursuant to which our Affiliates derive revenue. For the year ended December 31, 2016, our Parent and its subsidiaries (other than the Company and our Affiliates) contributed less than 1% of total gross management fee revenue, including equity-accounted Affiliates. We cannot predict whether these relationships would continue when we are no longer a majority-owned subsidiary of our Parent.
The separation from our Parent could adversely impact our relationships with certain of our current or potential business partners and/or regulators as we may no longer be viewed as a part of our Parent’s group of companies. If we no longer are entitled to benefit from the relationship with our Parent, we may not be able to obtain certain services at the same level or obtain the same benefit through new, independent relationships with third-party vendors. Likewise, we may not be able to replace the service and arrangement in a timely manner or on terms and conditions, including cost, as favorable as those we previously have received as a subsidiary of our Parent. Some third parties may re-price, modify or terminate their vendor relationships with us were we no longer a majority-owned subsidiary of our Parent. Additionally, if we are no longer included as part of our Parent’s group for consolidated supervision by the Prudential Regulation Authority, we may become subject to regulation by the Financial Conduct Authority (FCA) as a result of our three FCA regulated subsidiaries. If the FCA subjects us to consolidated supervision, we may become subject to distinct or more onerous requirements with respect to, among other things, compensation practices, risk reporting and/or regulatory capital than those imposed in our current regulatory environment.
The risks relating to our separation from our Parent could materialize or evolve at any time and we cannot accurately predict the impact that our separation from our Parent will have on our business and the businesses of our Affiliates, distribution partners, service providers, vendors and other business partners.
47
Risks Related to Our Tax Matters
The Internal Revenue Service, or the IRS, may not agree to treat OMAM as a foreign corporation for U.S. federal tax purposes and Section 7874 of the Code could limit our ability to use our U.S. tax attributes.
Although OMAM is incorporated in England and Wales, which are part of the U.K., the IRS may assert that it should be treated as a U.S. corporation (and, therefore, a U.S. tax resident) for U.S. federal tax purposes pursuant to section 7874 of the Code. For U.S. federal tax purposes, a corporation generally is considered a tax resident in the jurisdiction of its organization or incorporation. Because OMAM is a U.K. incorporated entity, it would generally be classified as a foreign corporation (and, therefore, a non-U.S. tax resident) under these rules. Section 7874 of the Code provides an exception under which a foreign incorporated entity may, in certain circumstances, be treated as a U.S. corporation for U.S. federal tax purposes.
For OMAM to be treated as a foreign corporation for U.S. federal tax purposes under section 7874 of the Code, after the Reorganization (including for this purpose all the transactions treated as part of a plan or series of related transactions with respect to the Reorganization) either (i) the former stockholder of OMUS, i.e., OMGUK, must have owned (within the meaning of section 7874 of the Code) less than 80% (by both vote and value) of our ordinary shares by reason of holding shares in OMUS immediately prior to the Reorganization, excluding for this purpose shares owned by the expanded affiliated group including OMAM, or (ii) OMAM must have had substantial business activities in the U.K. (taking into account the activities of our expanded affiliated group).
Based on the rules for determining share ownership under section 7874 of the Code, in particular the rule excluding shares owned by OMGUK, which should be treated as a member of the expanded affiliated group including OMAM, we have taken and continue to take the position that OMGUK should be treated as owning less than 80% of our ordinary shares after the Reorganization and that, therefore, OMAM should be treated as a foreign corporation for U.S. federal income tax purposes, although no assurances can be given in this regard. If OMAM were to be treated as a U.S. corporation, income it earned would become subject to U.S. taxation, and the gross amount of any dividend payments to its non-U.S. shareholders could be subject to 30% U.S. withholding tax, depending on the application of any income tax treaty that might apply to reduce the withholding tax.
Following the acquisition of a U.S. corporation by a foreign corporation, section 7874 of the Code can limit the ability of the acquired U.S. corporation and its U.S. affiliates to utilize U.S. tax attributes such as net operating losses to offset U.S. taxable income resulting from certain transactions.
These limitations will apply if, after the Reorganization (including for this purpose all transactions treated as part of a plan or series of related transactions with respect to the Reorganization), (i) the former stockholder of OMUS, i.e., OMGUK, owned (within the meaning of section 7874 of the Code) at least 60% (by both vote and value) of our ordinary shares by reason of holding shares in OMUS immediately prior to the Reorganization, excluding for this purpose shares owned by the expanded affiliated group including OMAM, and (ii) we did not have substantial business activities in the U.K. (taking into account the activities of our expanded affiliated group).
Based on the rules for determining share ownership under section 7874 of the Code, in particular the rule excluding shares owned by OMGUK, which should be treated as a member of the expanded affiliated group including OMAM, we have taken and continue to take the position that OMGUK should be treated as owning less than 60% of our ordinary shares, and that therefore OMUS should not be subject to the limitations described above, although no assurances can be offered in this regard. If such limitations were to apply, the U.S. consolidated group that includes OMUS would owe potentially more U.S. tax due to the inability to utilize these tax attributes, but there would likely be a corresponding reduction in the obligation of OMAM to make payments under the Deferred Tax Asset Deed, in the same or subsequent periods.
48
Future changes to the tax laws under which we should be treated as a foreign corporation for U.S. federal tax purposes and changes in other tax laws or tax treaties relating to multinational corporations could adversely affect us.
Under current law, as noted above, OMAM should be treated as a foreign corporation for U.S. federal income tax purposes. Changes to Section 7874 of the Code or the U.S. Treasury regulations promulgated thereunder or future IRS guidance could affect OMAM’s status as a foreign corporation for U.S. federal tax purposes, and any such changes or future IRS guidance could have prospective or retroactive application.
For instance, on April 4, 2016, the IRS issued a package of temporary regulations, addressing so-called inversion transactions under sections 7874 and 367 and certain post-inversion transactions such as under sections 304 and 956, which rules are generally effective for certain inversion transactions completed on or after November 19, 2015 or, in certain cases, to certain specified post-inversion transactions occurring after that date provided that an inversion transaction had occurred on or after September 22, 2014. While those rules would, in certain cases, apply to transactions, such as our initial public offering, that occurred after September 22, 2014, we believe that those rules would not impact the treatment of the Reorganization or OMAM’s status as a foreign corporation under Section 7874 of the Code. The IRS issued final regulations on June 3, 2015, which address the “substantial business activities” test of Section 7874 of the Code. We believe that those regulations, which have an effective date of June 4, 2015, also do not impact the treatment of the Reorganization or OMAM’s status as a foreign corporation under Section 7874.
In addition, recent legislative proposals have aimed to expand the scope of Section 7874 and/or to expand the scope of U.S. corporate tax residence. If any such legislation (or similar legislation) were enacted, or if future IRS guidance were issued addressing the scope of U.S. corporate tax residence, it could cause OMAM to be treated as a domestic corporation for U.S. federal income tax purposes as of or after the Reorganization or could otherwise adversely affect us.
In July 2013, The Organization for Economic Co-operation and Development launched an Action Plan on Base Erosion and Profit Shifting, or the BEPS Action Plan. The BEPS Action Plan identified 15 specific actions to address Base Erosion and Profit Shifting, set deadlines to implement the actions and identified the resources needed and the methodology to implement these actions. The OECD published their final package of reports relating to the 15 actions outlined in the BEPS Action Plan in October 2015. These contemplated changes, if finalized and adopted by countries, could adversely affect our provision for income taxes.
In connection with BEPS Action Plan 2, the U.K. Government has enacted legislation designed to neutralize the effects of hybrid mismatch arrangements, which took effect from January 1, 2017. Our financing structure includes an entity which could be treated as a hybrid for the purposes of these rules, but we have received a written opinion from Deloitte LLP that this U.K. legislation should not apply to our financing structure, although no assurances can be offered in this regard. While we intend to take the position that the rules do not apply, we continue to evaluate whether an annual tax reserve of approximately $11 million will be required under U.S. GAAP accounting in 2017. Based on our established definition of economic net income (see “—Non-GAAP Supplemental Performance Measure—Economic Net Income” within Management’s Discussion and Analysis section), any U.S. GAAP tax reserve would not impact our economic net income.
The Office of Revenue Commissioners, U.S Congress and government agencies in other jurisdictions where we and our Affiliates do business have each recently focused on issues related to the taxation of multinational corporations. As a result, the tax laws in the U.K., U.S. and other countries in which we and our Affiliates do business could change on a prospective or retroactive basis and any such changes could adversely affect us.
49
Dividends and interest from OMUS to OMAM, and dividends, interest or other income from foreign entities owned by Affiliates or investment in other foreign countries may be subject to withholding taxes.
Under U.S. federal income tax law, dividends and other distributions from Affiliates of OMUS to OMUS and from OMUS to OMAM UK Limited, or UK Sub, should not be subject to U.S. withholding tax. Additionally, dividends from OMAM US, Inc., or US Sub, to OMAM should not be subject to U.S. withholding tax under the income tax treaty between the U.K. and the U.S., or the Treaty, provided that OMAM satisfies the minimum holding period requirements set forth in the Treaty. Under U.S. federal income tax law, interest paid by OMUS to UK Sub should not be subject to U.S. withholding tax and, under the Treaty, interest paid by US Sub to OMAM should also not be subject to U.S. withholding tax. The IRS, however, may challenge any determination that OMAM is eligible for benefits under the Treaty, or may assert that OMAM does not qualify for a complete exemption from withholding tax on dividends under the Treaty. If OMAM is not eligible for benefits under the Treaty, the gross amount of any such dividends or interest would be subject to a 30% U.S. withholding tax. If OMAM qualifies for benefits under the Treaty, but not for a complete exemption from withholding tax on dividends, the gross amount of such dividends should nevertheless qualify for a reduced withholding tax rate of 5%.
Under U.K. tax law, dividends and other distributions from the U.K. companies in our group are not subject to U.K. withholding tax. However, dividends, interest or other income earned by OMUS or Affiliates of OMUS from foreign entities that OMUS or such Affiliates control or have invested in may be subject to foreign withholding taxes. Unless our share of these withholding taxes is fully credited against our U.S. or U.K. income tax liability or otherwise fully refunded, it could increase our aggregate tax burden. Although we intend to arrange the ownership of our foreign subsidiaries, our intercompany dividends, interest and other payments and our investments in foreign countries on our own behalf and on behalf of our clients with a view to minimizing the incurrence of such withholding taxes, there can be no assurance that such arrangements will have the intended result.
If we were treated as a “controlled foreign corporation” for U.S. federal income tax purposes, U.S. holders of 10% or more of the voting power of our ordinary shares may be subject to U.S. federal income taxation at ordinary income tax rates on undistributed earnings and profits.
While we do not believe that we should be treated as a controlled foreign corporation, or CFC, for U.S. federal income tax purposes, no assurances can be offered in this regard. We will generally be classified as a CFC if more than 50% of our outstanding ordinary shares, measured by reference to voting power or value, are owned (directly, indirectly or by attribution) by “10% U.S. Shareholders.” For this purpose, a “10% U.S. Shareholder” is any U.S. person that owns directly, indirectly or by attribution, 10% or more of the voting power of our outstanding ordinary shares. If we are classified as a CFC, a 10% U.S. Shareholder may be subject to U.S. federal income taxation at ordinary income tax rates on all or a portion of our undistributed earnings and profits attributable to certain categories of passive income and certain other income described in Subpart F of the Code, and may also be subject to U.S. federal income taxation at ordinary income tax rates on any gain realized on a sale of ordinary shares, to the extent of our current and accumulated earnings and profits attributable to such shares.
The CFC rules are complex, and U.S. persons that are, or may be, 10% U.S. Shareholders are urged to consult their own tax advisors regarding the possible application of the CFC rules to them in their particular circumstances.
If we were treated as a passive foreign investment company for U.S. federal income tax purposes, U.S. investors in our ordinary shares could be subject to adverse U.S. federal income tax consequences.
For U.S. federal income tax purposes, a foreign corporation is classified as a passive foreign investment company, or PFIC, for any taxable year if either (i) 75% or more of its gross income for such taxable year is “passive income” (as defined for such purposes) or (ii) 50% or more of the value of the assets held by such corporation (based on an average of the quarterly values of such assets) during such taxable year is attributable to assets that produce passive income or that are held for the production of passive income.
50
We do not believe that we are currently a PFIC, and we do not anticipate becoming a PFIC in the foreseeable future; however, no assurances can be offered in this regard. The tests for determining PFIC status are applied annually after the close of the taxable year. It is difficult to accurately predict future income and assets relevant to this determination and no ruling from the IRS or opinion of counsel has been or will be sought with respect to PFIC status. Whether we are a PFIC will depend on our particular facts and circumstances (such as the valuation of our assets, including goodwill and other intangible assets, the treatment of intercompany interest income, etc.) and may also be impacted by the application of the PFIC rules, which are subject to differing interpretations. The fair market value of our assets is expected to depend, in part, upon (a) the market price of our ordinary shares and (b) the composition of our income and assets, which will be impacted by how, and how quickly, we spend any cash that is raised in any financing transaction. Accordingly, we cannot assure U.S. holders that we are not, or will not become, a PFIC. If we should determine that we are a PFIC, we will attempt to notify U.S. holders, although there can be no assurance that we will be able to do so in a timely and complete manner. If we are a PFIC for any taxable year during which a U.S. holder holds our ordinary shares, we generally will continue to be treated as a PFIC with respect to such U.S. holder for all succeeding taxable years during which such holder holds our ordinary shares, although a U.S. holder may avoid some of the adverse effects of the PFIC regime by making a deemed sale election with respect to our ordinary shares after we have ceased being treated as a PFIC.
If we are properly characterized as a PFIC, U.S. holders of our ordinary shares would be subject to adverse U.S. federal income tax consequences, such as ineligibility for any preferred tax rates on capital gains, or on actual or deemed dividends, interest charges on certain taxes treated as deferred, and additional annual reporting requirements under U.S. federal income tax laws and regulations. Whether or not U.S. holders of our ordinary shares make a timely mark-to-market election may impact the U.S. federal income tax consequences to U.S. holders with respect to the acquisition, ownership and disposition of our ordinary shares and any distributions such U.S. holders may receive. Investors should consult their own tax advisors regarding all aspects of the application of the PFIC rules to our ordinary shares.
Failure to comply with the tax laws of the U.S., the U.K. or other jurisdictions, which laws are subject to potential legislative, judicial or administrative change and differing interpretations, possibly on a retroactive basis, may result in erroneous filings, negative impact to income and reputational damage.
We and our Affiliates are subject to a range of taxes and tax audits. Tax and other regulatory authorities may disagree with tax positions taken by us and our Affiliates based on our, or their, interpretations of the relevant tax laws, which could result in erroneous filings, retroactive adverse impact on income, the loss of tax benefits and reputational damage. We will regularly assess the likelihood of favorable or unfavorable outcomes resulting from these examinations to determine the adequacy of our provision for income taxes, which will require estimates and judgments. Although we will make these tax estimates on a reasonable basis, there can be no assurance that the tax authorities will agree with such estimates and judgments. From time to time, we may have to engage in litigation to attempt to achieve the results reflected in our estimates, which may be time-consuming and expensive and may have other adverse impacts. There can be no assurance that we will be successful in any such litigation or that any final determination of our tax liability will not be materially different from the historical treatment reflected in our historical income tax provisions and accruals. Any future changes to tax laws or interpretations could have a material impact on our effective tax rate and subsequently our results of operations.
While we believe that being incorporated in the U.K. should help us maintain a competitive worldwide effective corporate tax rate, we cannot give any assurance as to what our effective tax rate will be. This is because of, among other things, uncertainties regarding the tax policies of all the jurisdictions where we operate our business and uncertainties regarding the application to our structure, which is complex, of the tax laws of various jurisdictions, including, without limitation, the U.S. and the U.K. Because of this uncertainty, our actual effective tax rate may vary from our expectation and that variance could be material. Additionally, the tax laws of the U.S., the U.K. or other jurisdictions, or the administrative or judicial interpretations thereof, could change in the future, possibly with retroactive effect, and such changes could cause a material change in our effective tax rate.
51
If various U.S. federal legislative proposals and modifications to existing tax treaties between the U.S. and foreign countries are enacted, they could result in a material increase in our U.S. and state taxes.
Proposals have been introduced in the U.S. Congress that, if ultimately enacted, could either limit treaty benefits on certain payments made by our Affiliates or their subsidiaries or subject the earnings from non-U.S. subsidiaries of our Affiliates to taxation, or both. In addition, the U.S. Treasury Department has recently published a new model U.S. income tax treaty that would, if incorporated into existing U.S. income tax treaties, potentially limit benefits on which we expect to rely. We cannot predict the outcome of any specific legislative proposals or amendments to existing treaties. However, since we operate or have operations in a number of foreign jurisdictions, our plans for expansion or our results of operations in such jurisdictions could be adversely affected if any adopted proposals resulted in an increase in our tax burden, costs of our tax compliance or otherwise adversely affected our results of operations and cash flows.
Our global effective tax rate is subject to a variety of different factors, which could create volatility in that rate, expose us to greater than anticipated tax liabilities and cause us to adjust previously recognized tax assets and liabilities.
We are subject to income taxes in the U.K., U.S. and many other jurisdictions. As a result, our global effective tax rate from period to period can be affected by many factors, including our global mix of earnings, the tax characteristics of our income and changes in tax legislation. Significant judgment is required in determining our worldwide provision for income taxes, and our determination of our tax liability is always subject to review by applicable tax authorities.
We cannot provide any assurances as to what our tax rate will be in any period because of, among other things, uncertainty regarding the nature and extent of our business activities in any particular jurisdiction in the future and the tax laws of such jurisdictions, as well as changes in U.S. and other tax laws, treaties and regulations. Our actual global tax rate may vary from our expectation and that variance may be material. Additionally, the tax laws of the U.K. and other jurisdictions could change in the future, and such changes could cause a material change in our tax rate.
We also could be subject to future audits conducted by foreign and domestic tax authorities, and the resolution of such audits could impact our tax rate in future periods, as would any reclassification or other matter (such as changes in applicable accounting rules) that increases the amounts we have provided for income taxes in our Consolidated Financial Statements. There can be no assurance that we would be successful in attempting to mitigate the adverse impacts resulting from any changes in law, audits and other matters. Our inability to mitigate the negative consequences of any changes in the law, audits and other matters could cause our global tax rate to increase, our use of cash to increase and our financial condition and results of operations to suffer.
Risks Related to Investing in our Ordinary Shares
Our efforts to raise capital could be dilutive to our ordinary shareholders and could cause our share price to decline.
If we raise additional funds by issuing additional ordinary shares, dilution to our shareholders could result. If we raise additional funds by issuing additional debt securities, these additional debt securities may have rights, preferences and privileges senior to those of holders of our ordinary shares, and the terms of the additional debt securities issued could impose significant restrictions on our operations. A failure to obtain adequate funds may affect our ability to make acquisitions of new affiliates or to seed new products of existing Affiliates, and may have a material adverse effect on our business and financial condition.
52
Future sales of our ordinary shares by us, OMGUK or other shareholders could cause our share price to decline.
If we, OMGUK or other shareholders sell, or indicate an intention to sell, or there is a perception that they might sell substantial amounts of our ordinary shares in the public market, the trading price of our ordinary shares could decline below the current trading level.
Sales by OMGUK or other shareholders or the possibility that these sales may occur also may make it more difficult for us to raise additional capital by selling equity securities in the future, at a time and price that we deem appropriate.
Pursuant to a registration rights agreement that we have entered into with our Parent, we agreed to use our reasonable best efforts to file registration statements and prospectus supplements from time to time for the sale of ordinary shares held by OMGUK now or in the future. We filed a registration statement on Form S-3 registering all of the ordinary shares held by OMGUK, which was declared effective on December 3, 2015.
We cannot predict the size of future issuances of our ordinary shares or the effect, if any, that future issuances and sales of our ordinary shares may have on the market price of our ordinary shares. Sales or distributions of substantial amounts of our ordinary shares, including shares issued in connection with an acquisition, or the perception that such sales or distributions could occur, may cause the market price of our ordinary shares to decline.
As a public company whose ordinary shares are publicly traded in the U.S., our management devotes substantial time to compliance with our public company legal and reporting obligations.
We are subject to the reporting requirements of the Securities Exchange Act of 1934, as amended, or the Exchange Act, and are required to implement specific corporate governance practices and adhere to a variety of reporting requirements under the Sarbanes-Oxley Act of 2002, or Sarbanes-Oxley, and the related rules and regulations of the SEC, as well as the rules of the NYSE. The Exchange Act requires us to file annual, quarterly and current reports with respect to our business and financial condition. Our management and other personnel devote substantial time to compliance with our public company obligations. Moreover, these rules and regulations increase our legal and financial compliance costs and make some activities more time-consuming and costly.
In addition, Sarbanes-Oxley requires, among other things, that we maintain effective internal control over financial reporting and disclosure controls and procedures. In particular, commencing with our Annual Report on Form 10-K for fiscal year 2015, we have performed system and process evaluations and we have tested our internal control over financial reporting to allow management to report on the effectiveness of our internal control over financial reporting, as required by Section 404 of Sarbanes-Oxley, and obtain an auditor attestation as to the effectiveness of our internal controls.
Testing may reveal deficiencies in our internal control over financial reporting that are deemed to be material weaknesses. Our compliance with Section 404 has required that we incur additional accounting expense and expend additional management time on compliance-related issues. Moreover, if at any time we are not able to comply with the requirements of Section 404 in a timely manner, or if we identify deficiencies in our internal control over financial reporting that are deemed to be material weaknesses, the market price of our ordinary shares could decline, and we could be subject to sanctions or investigations by the NYSE, the SEC or other regulatory authorities, which would require additional financial and management resources.
53
Risks Related to Being an English Company Listing Ordinary Shares
U.S. investors may have difficulty enforcing civil liabilities against the Company, our directors or members of senior management.
We are incorporated under the laws of England and Wales. Several of our directors reside outside the U.S. and all or a substantial portion of the assets of such persons are located outside the U.S. As a result, it may be difficult for you to serve legal process on us or our directors or have any of them appear in a U.S. court. The U.S. and the U.K. do not currently have a treaty providing for the recognition and enforcement of judgments, other than arbitration awards, in civil and commercial matters. The enforceability of any judgment of a U.S. federal or state court in the U.K. will depend on the laws and any treaties in effect at the time, including conflicts of laws principles (such as those bearing on the question of whether a U.K. court would recognize the basis on which a U.S. court had purported to exercise jurisdiction over a defendant). In this context, there is doubt as to the enforceability in the U.K. of civil liabilities based solely on the federal securities laws of the U.S. In addition, awards for punitive damages in actions brought in the U.S. or elsewhere may be unenforceable in the U.K. An award for monetary damages under the U.S. securities laws would likely be considered punitive if it did not seek to compensate the claimant for loss or damage suffered and was intended to punish the defendant.
English law and provisions in our articles of association may have anti-takeover effects that could discourage an acquisition of us by others, even if an acquisition would be beneficial to our shareholders, and may prevent attempts by our shareholders to replace or remove our current management.
Certain provisions of English law and our articles of association (as currently in effect) may have the effect of delaying or preventing a change in control of us or changes in our management. For example, English law and our articles of association include provisions that:
• | establish an advance notice procedure for shareholder approvals to be brought before an annual meeting of our shareholders, including proposed nominations of persons for election to our Board of Directors; and |
• | provide that vacancies on our Board of Directors may, in certain specified circumstances, be filled only by a majority of directors then in office, even though less than a quorum. |
These provisions, alone or together, could delay or prevent hostile takeovers and changes in control or changes in our management. In addition, these provisions may adversely affect the market price of our ordinary shares or inhibit fluctuations in the market price of our ordinary shares that could otherwise result from actual or rumored takeover attempts.
The U.K. City Code on Takeovers and Mergers, or the Takeover Code, applies, among other things, to an offer for a public company whose registered office is in the U.K. (or the Channel Islands or the Isle of Man) and whose securities are not admitted to trading on a regulated market in the U.K. (or the Channel Islands or the Isle of Man) if the company is considered by the Panel on Takeovers and Mergers, or the Takeover Panel, to have its place of central management and control in the U.K. (or the Channel Islands or the Isle of Man). This is known as the “residency test.” Under the Takeover Code, the Takeover Panel will determine whether we have our place of central management and control in the U.K. by looking at various factors, including the structure of our Board of Directors, the functions of the directors and where they are resident.
If at the time of a takeover offer the Takeover Panel determines that we have our place of central management and control in the U.K., we would be subject to a number of rules and restrictions, including but not limited to the following: (i) our ability to enter into deal protection arrangements with a bidder would be extremely limited; (ii) we might not, without the approval of our shareholders, be able to perform certain actions that could have the effect of frustrating an offer, such as issuing shares or carrying out acquisitions or disposals; and (iii) we would be obliged to provide equality of information to all bona fide competing bidders.
54
At December 31, 2016, our Parent was interested in over 50% of our voting share capital, and therefore, if the Takeover Panel were to determine that we were subject to the Takeover Code, our Parent would be able to increase its aggregate holding in us without triggering the requirement under Rule 9 of the Takeover Code to make a cash offer for the outstanding shares in the Company.
The Takeover Panel has confirmed to our representatives that, on the basis of our Board of Directors, it does not consider the Takeover Code to apply to the Company, although that position is subject to change if our center of management and control is subsequently found to move to the U.K.
We are subject to data protection laws under U.K. legislation, and any breaches of such legislation could adversely affect our business, reputation, results of operations and financial condition.
Our ability to obtain, retain and otherwise manage personal data is governed by data protection and privacy requirements and regulatory rules and guidance. In the U.K., we must comply with the Data Protection Act 1998 in relation to processing certain personal data. The application of data privacy laws is often uncertain, and as business practices are challenged by regulators, private litigants and consumer protection agencies, it is possible that these laws may be interpreted and applied in a manner that is inconsistent with our data protection practices. Additionally, under European data protection laws, distributing personal data into the U.S. may constitute an offense.
Pre-emption rights for U.S. and other non-U.K. holders of shares may be unavailable.
In the case of certain increases in our issued share capital, under English law, existing holders of shares are entitled to pre-emption rights to subscribe for such shares, unless shareholders dis-apply such rights by a special resolution at a shareholders’ meeting. These pre-emption rights were dis-applied by our shareholder prior to our initial public offering and we shall propose equivalent resolutions in the future once the initial period of dis-application has expired. However, OMGUK will have pre-emption rights, subject to certain exceptions, until it ceases to own at least 7% of our outstanding ordinary shares. In any event, U.S. holders of ordinary shares in U.K. companies are customarily excluded from exercising any such pre-emption rights they may have, unless a registration statement under the Securities Act is effective with respect to those rights, or an exemption from the registration requirements thereunder is available. We cannot assure U.S. investors that any exemption from the registration requirements of the Securities Act or applicable non-U.S. securities laws would be available to enable U.S. or other non-U.K. holders to exercise such pre-emption rights or, if available, that we will utilize any such exemption.
55
Item 1B. Unresolved Staff Comments.
There are no unresolved written comments that were received from the Securities and Exchange Commission staff 180 days or more before the end of our fiscal year relating to our periodic or current reports under the Securities Exchange Act of 1934, as amended.
Item 2. Properties.
Our principal executive offices are located at Ground Floor, Millennium Bridge House, 2 Lambeth Hill, London EC4V 4GG, United Kingdom. Our principal office in the U.S. is located at 200 Clarendon Street, 53rd Floor, Boston, Massachusetts 02116. In Boston, we lease 37,946 square feet under a lease that expires on December 31, 2021. Each Affiliate has its own primary office where core investment management activities take place. Primary Affiliate-leased locations include Boston, MA; Chicago, IL; Dallas, TX; Baltimore, MD; Portland, OR; and Richmond, VA, as well as an owed property in Simsbury, CT. In addition, both we and several of our Affiliates have leased secondary offices to help support research, distribution and/or client servicing. Key locations for secondary offices include (but are not limited to) Hong Kong, Singapore and Toronto. We believe existing facilities are appropriate in size, location and functionality to meet current and future business requirements.
Item 3. Legal Proceedings.
From time to time, we and our Affiliates may be parties to various claims, suits and complaints in the ordinary course of our business. Although the amount of liability that may result from these matters cannot be ascertained, we do not currently believe that, in the aggregate, they will result in liabilities material to our consolidated financial condition, future results of operations or cash flow.
Item 4. Mine Safety Disclosures.
Not applicable.
56
PART II
Item 5. Market for Registrant’s Common Equity, Related Stockholder Matters and Issuer Purchases of Equity Securities.
Market Information for Ordinary Shares
Our ordinary shares are traded on the New York Stock Exchange under the symbol “OMAM.” The following table sets forth the high and low sales price per ordinary share as reported on the New York Stock Exchange and dividends declared for the period indicated:
Share price: | Dividends Declared | ||||||||||
For the year ended December 31, 2015 | High | Low | |||||||||
First quarter | $ | 19.00 | $ | 14.94 | $ | 0.08 | |||||
Second quarter | $ | 20.05 | $ | 16.56 | $ | 0.08 | |||||
Third quarter | $ | 18.22 | $ | 14.54 | $ | 0.08 | |||||
Fourth quarter | $ | 17.04 | $ | 13.86 | $ | 0.08 | |||||
For the year ended December 31, 2016 | |||||||||||
First quarter | $ | 15.03 | $ | 10.27 | $ | 0.08 | |||||
Second quarter | $ | 15.52 | $ | 12.58 | $ | 0.08 | |||||
Third quarter | $ | 14.25 | $ | 12.69 | $ | 0.08 | |||||
Fourth quarter | $ | 15.51 | $ | 12.10 | $ | 0.08 | |||||
The closing price per ordinary share as reported on the New York Stock Exchange on February 17, 2017 was $15.08. As of February 17, 2017, there were four shareholders of record, including banks, brokers and other financial institutions holding shares in omnibus accounts for their customers (in total representing substantially all of the beneficial holders of our ordinary shares).
Dividend policy
Our current dividend policy targets a dividend payout in the range of 25% of ENI, subject to maintaining a sustainable quarterly dividend per share. Any declaration of dividends will be at the discretion of our Board of Directors and subject to the approval of our Parent (for so long as it is required under the Shareholder Agreement), and will depend on our financial condition, earnings, cash needs, regulatory constraints, capital requirements and any other factors that our Board of Directors or Parent deems relevant in making such a determination. Under English law, we may only pay dividends out of our accumulated, realized profits, so far as not previously utilized by distribution or capitalization and provided that at the time of payment of the dividend, the amount of our net assets is not less than the total of our called-up share capital and undistributable reserves. Because we are a holding company and have no direct operations, we will only be able to pay dividends from our available cash on-hand and any funds we receive from our subsidiaries, including OMUS. Therefore, there can be no assurance that we will pay any dividends in the future to holders of our ordinary shares, or as to the amount of any such dividends.
57
Repurchases of equity securities
The following table sets out information regarding purchases of equity securities by the Company for the first three quarters in 2016 and the three months ended December 31, 2016:
Period | Total number of shares purchased | Average price paid per share | Total number of shares purchased as part of publicly announced plans or programs | Approximate dollar value that may yet be purchased under the plans or programs(1) (in millions) | ||||||||||
First quarter, 2016 | 300,983 | $ | 12.64 | 300,983 | $ | 146.2 | ||||||||
Second quarter, 2016 | 620,757 | 13.52 | 620,757 | 137.8 | ||||||||||
Third quarter, 2016 | — | — | — | 137.8 | ||||||||||
October 1-31, 2016 | — | — | — | 137.8 | ||||||||||
November 1-30, 2016 | — | — | — | 137.8 | ||||||||||
December 1-31, 2016 | 6,000,000 | 14.25 | 6,000,000 | 137.8 | (2) | |||||||||
Total | 6,921,740 | 13.30 | 6,921,740 | |||||||||||
(1) | On February 3, 2016, our Board of Directors authorized a $150.0 million open market share repurchase program, which was approved by shareholders on March 15, 2016. We repurchased 921,740 shares during the year ended December 31, 2016 under this program. As of December 31, 2016, $137.8 million remained available to repurchase shares under the February 2016 program. The February 2016 program expires on March 15, 2021. |
(2) | On April 29, 2016, at the Company’s Annual General Meeting, shareholders (excluding OM Group UK Ltd) authorized a form of contract by which OMAM would be permitted to repurchase shares directly from OM Group UK Ltd. The shareholder authorization does not contain a maximum dollar or share amount for such purchases individually or in aggregate from OM Group UK Ltd. This program expires on April 29, 2021. |
58
Financial performance graph
This performance graph shall not be deemed “soliciting material” or to be “filed” with the SEC for purposes of Section 18 of the Securities Exchange Act of 1934, as amended, or the Exchange Act, or otherwise subject to the liabilities under that Section, and shall not be deemed to be incorporated by reference into any filing of OMAM under the Securities Act.
The following graph compares the cumulative shareholder return on our ordinary shares from October 8, 2014, the date of our initial public offering through December 31, 2016, with the cumulative total return, during the same period, of the Standard & Poor’s 500 Index, the Standard & Poor’s 500 Financial Sector Index and a peer group comprised of AllianceBernstein Holding L.P., Affiliated Managers Group, Inc., Artisan Partners Asset Management Inc., Calamos Asset Management, Inc., Cohen & Steers, Inc., Eaton Vance Corp., Federated Investors, Inc., Franklin Resources, Inc., Invesco Ltd., Janus Capital Group, Inc., Legg Mason, Inc., T. Rowe Price Group, Inc., Virtus Investment Partners, Inc. and Waddell & Reed Financial, Inc. The comparison assumes the investment of $100 at the time of our initial public offering on October 8, 2014 in our ordinary shares at the initial offering price of $14.00 per share and each of the comparison indices and, in each case, assumes reinvestment of all dividends.
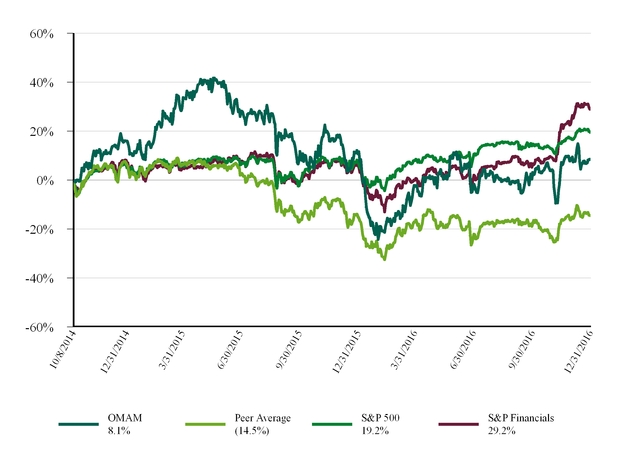
59
Item 6. Selected Financial Data.
We present economic net income, or ENI, to help us describe our operating and financial performance. ENI is the key measure our management uses to evaluate the financial performance of, and make operational decisions for, our business. ENI is not audited, and is not a substitute for net income or other performance measures that are derived in accordance with U.S. GAAP. Furthermore, our calculation of ENI may differ from similarly titled measures provided by other companies. Please refer to “Management’s Discussion and Analysis of Financial Condition and Results of Operations—Non-GAAP Supplemental Performance Measure—Economic Net Income” for a more thorough discussion of ENI and a reconciliation of ENI to U.S. GAAP net income.
The following table sets forth selected historical consolidated financial data for our Company as of the dates and for the periods indicated. The data for each of the five years presented have been derived from our historical Consolidated Financial Statements audited under U.S. GAAP.
You should read our following selected historical consolidated financial data together with “Management’s Discussion and Analysis of Financial Condition and Results of Operations” and the historical Consolidated Financial Statements and the related notes thereto, included elsewhere in this Annual Report.
Years ended December 31, | |||||||||||||||||||
($ in millions, except per share data as noted) | 2016 | 2015 | 2014 | 2013 | 2012 | ||||||||||||||
U.S. GAAP Statement of Operations Data(1): | |||||||||||||||||||
Management fees(2) | $ | 659.9 | $ | 637.2 | $ | 569.7 | $ | 478.2 | $ | 399.3 | |||||||||
Performance fees | 2.6 | 61.8 | 34.3 | 18.1 | 14.1 | ||||||||||||||
Other revenues | 0.9 | 0.3 | 1.6 | 1.8 | 0.5 | ||||||||||||||
Consolidated Funds’ revenue(2) | 0.1 | — | 450.7 | 430.5 | 289.6 | ||||||||||||||
Total Revenue(2) | $ | 663.5 | $ | 699.3 | $ | 1,056.3 | $ | 928.6 | $ | 703.5 | |||||||||
Net income before tax from continuing operations attributable to controlling interests(3) | $ | 161.0 | $ | 201.3 | $ | 68.1 | $ | 32.7 | $ | 27.3 | |||||||||
Net income from continuing operations attributable to controlling interests(2)(3) | 120.2 | 154.7 | 55.3 | 19.4 | 24.0 | ||||||||||||||
Net income (loss) from continuing operations(2) | 120.0 | 154.7 | (45.0 | ) | (97.1 | ) | (50.0 | ) | |||||||||||
U.S. GAAP operating margin(2)(4) | 23 | % | 27 | % | (6 | )% | (11 | )% | (9 | )% | |||||||||
U.S. GAAP basic earnings per share from continuing operations attributable to controlling interests | $ | 0.98 | $ | 1.28 | $ | 0.46 | $ | 0.16 | $ | 0.20 | |||||||||
U.S. GAAP diluted earnings per share from continuing operations attributable to controlling interests | $ | 0.98 | $ | 1.28 | $ | 0.46 | $ | 0.16 | $ | 0.20 | |||||||||
60
Years ended December 31, | |||||||||||||||||||
($ in millions, unless otherwise noted) | 2016 | 2015 | 2014 | 2013 | 2012 | ||||||||||||||
Non-GAAP Data(6): | |||||||||||||||||||
Economic net income(5): | |||||||||||||||||||
Management fees | $ | 659.9 | $ | 637.2 | $ | 589.9 | $ | 499.8 | $ | 420.9 | |||||||||
Performance fees | 2.6 | 13.7 | 34.3 | 18.1 | 14.1 | ||||||||||||||
Other revenues | 16.0 | 13.0 | 11.2 | 9.6 | 15.8 | ||||||||||||||
Total ENI revenue | $ | 678.5 | $ | 663.9 | $ | 635.4 | $ | 527.5 | $ | 450.8 | |||||||||
Pre-tax economic net income | $ | 190.7 | $ | 203.5 | $ | 204.1 | $ | 153.0 | $ | 131.3 | |||||||||
Economic net income, excluding non-recurring performance fee(6) | 145.1 | 149.7 | 151.3 | 122.9 | 112.3 | ||||||||||||||
ENI operating margin(7) | 35 | % | 37 | % | 39 | % | 34 | % | 33 | % | |||||||||
ENI earnings per share, excluding non-recurring performance fee, diluted(6) | 1.21 | 1.24 | 1.26 | 1.02 | 0.94 | ||||||||||||||
Other Operational Information: | |||||||||||||||||||
Assets under management at period end (in billions) | $ | 240.4 | $ | 212.4 | $ | 220.8 | $ | 198.8 | $ | 156.7 | |||||||||
Net client cash flows (in billions) | (1.6 | ) | (5.1 | ) | 9.5 | 10.5 | 0.4 | ||||||||||||
Annualized revenue impact of net flows (in millions)(8) | 11.0 | 18.9 | 54.5 | 42.5 | 11.2 | ||||||||||||||
Years ended December 31, | |||||||||||||||||||
($ in millions) | 2016 | 2015 | 2014 | 2013 | 2012 | ||||||||||||||
U.S. GAAP Balance Sheet Data: | |||||||||||||||||||
Total assets(9) | $ | 1,294.3 | $ | 1,014.1 | $ | 7,772.9 | $ | 8,551.8 | $ | 8,529.8 | |||||||||
Total assets attributable to controlling interests | 1,283.0 | 1,014.1 | 993.2 | 1,014.4 | 999.2 | ||||||||||||||
Total borrowings and debt(9) | 392.3 | 90.0 | 4,309.9 | 5,469.0 | 5,641.8 | ||||||||||||||
Total borrowings and debt attributable to controlling interests | 392.3 | 90.0 | 214.0 | 1,043.2 | 1,147.5 | ||||||||||||||
Total liabilities(9) | 1,123.8 | 848.2 | 5,215.5 | 6,015.9 | 6,097.8 | ||||||||||||||
Total liabilities attributable to controlling interests | 1,118.0 | 848.2 | 956.7 | 1,461.1 | 1,480.5 | ||||||||||||||
Total Equity(9) | $ | 170.5 | $ | 165.9 | $ | 2,557.4 | $ | 2,535.9 | $ | 2,432.0 | |||||||||
Redeemable non-controlling interests in consolidated Funds(2) | (5.5 | ) | — | (61.9 | ) | (403.3 | ) | (88.9 | ) | ||||||||||
Non-controlling interests in consolidated Funds(2) | — | — | (2,459.0 | ) | (2,579.3 | ) | (2,824.4 | ) | |||||||||||
Non-controlling interests | (1.0 | ) | — | — | (0.1 | ) | (0.9 | ) | |||||||||||
Shareholders’ equity (deficit) | $ | 164.0 | $ | 165.9 | $ | 36.5 | $ | (446.8 | ) | $ | (482.2 | ) | |||||||
(1) | The U.S. GAAP Statement of Operations Data above has been presented on a continuing operations basis. Please refer to “Management’s Discussion and Analysis of Financial Condition and Results of Operations” for further discussion of our results of operations, including discontinued operations, and a reconciliation to the results from continuing operations. |
61
(2) | Statement of operations data presented in accordance with U.S. GAAP include the results of consolidated Funds managed by our Affiliates where it has been determined these entities are controlled by our Company. The effects of consolidating these entities include a reduction in management fee revenue ranging from $20.2 million to $21.7 million per annum for fiscal years 2012 through 2014 with offsetting increases in the results of consolidated Funds. There was no management fee elimination associated with Funds consolidation in 2015 or 2016. The net income from continuing operations presented as attributable to controlling interests exclude the income or loss directly attributable to third-party Fund investors, and represent the net amounts attributable to our shareholders. In the first quarter of 2015, we elected to adopt the provisions of Accounting Standard Update 2015-02, Consolidation: Amendments to the Consolidation Analysis, or ASU 2015-02, effective on January 1, 2015 using the modified retrospective method, which resulted in the de-consolidation of all Funds previously consolidated as of December 31, 2014. For the year ended December 31, 2015, there were no Funds which required consolidation pursuant to ASU 2015-02, and total revenue, U.S. GAAP operating margin and net income (loss) from continuing operations for the year ended December 31, 2015 are therefore not directly comparable to 2012 through 2014. As of and for the year ended December 31, 2016, following the purchase of seed capital investments from our Parent in the third quarter of 2016, we consolidated certain Funds pursuant to ASU 2015-02. |
(3) | The following table reconciles our net income attributable to controlling interests to our net income from continuing operations attributable to controlling interests and our pre-tax income from continuing operations attributable to controlling interests: |
Years ended December 31, | |||||||||||
($ in millions) | 2016 | 2015 | 2014 | ||||||||
Net income attributable to controlling interests | $ | 126.4 | $ | 155.5 | $ | 51.7 | |||||
Exclude: Loss (profit) on discontinued operations attributable to controlling interests | (6.2 | ) | (0.8 | ) | 3.6 | ||||||
Net income from continuing operations attributable to controlling interests | 120.2 | 154.7 | 55.3 | ||||||||
Add: Income tax expense | 40.8 | 46.6 | 12.8 | ||||||||
Pre-tax income from continuing operations attributable to controlling interests | $ | 161.0 | $ | 201.3 | $ | 68.1 | |||||
(4) | U.S. GAAP operating margin equals operating income (loss) from continuing operations divided by total revenue. In the first quarter of 2015, we elected to adopt the provisions of ASU 2015-02, effective on January 1, 2015 using the modified retrospective method, which resulted in the de-consolidation of all Funds previously consolidated as of December 31, 2014. As of and for the year ended December 31, 2016, following the purchase of seed capital investments from our Parent in the third quarter of 2016, we consolidated certain Funds pursuant to ASU 2015-02. Excluding the effect of Funds consolidation, our U.S. GAAP operating margin would be 23% for the year ended December 31, 2016, 27% for the year ended December 31, 2015, 17% for the year ended December 31, 2014, 18% for the year ended December 31, 2013 and 21% for the year ended December 31, 2012. |
(5) | Economic net income, including a reconciliation to U.S. GAAP net income (loss) attributable to controlling interests, is discussed in “Management’s Discussion and Analysis of Financial Condition and Results of Operations—Non-GAAP Supplemental Performance Measure—Economic Net Income.” Pre-tax and post-tax ENI are presented after Affiliate key employee distributions. These measures are conceptually equivalent to net income before tax from continuing operations attributable to controlling interests and net income from continuing operations attributable to controlling interests, respectively. |
62
(6) | In the second quarter of 2015, we recorded a non-recurring performance fee of $11.4 million, net of associated expenses and taxes. While all performance fees fall within OMAM’s definition of economic net income, we believe that the unique characteristics of this fee, including its size and the extraordinary investment performance of the underlying product, make it unrepresentative of our recurring economics. We have therefore presented our economic net income with this non-recurring performance fee excluded from revenue and expenses. This presentation provides a more comparative view across reporting periods of the line items which make up ENI revenue and expense. Unless explicitly noted, the revenue, expense and key metrics herein exclude the impact of the non-recurring performance fee. Including the non-recurring performance fee in 2015, economic net income was $161.1 million and diluted economic net income per share was $1.34. |
(7) | ENI operating margin is a non-GAAP efficiency measure, calculated based on ENI operating earnings divided by ENI revenue. For a more detailed discussion of the differences between U.S. GAAP net income and economic net income, see “—Non-GAAP Supplemental Performance Measure—Economic Net Income.” |
(8) | Annualized revenue impact of net flows excludes market appreciation or depreciation. Annualized revenue impact of net flows represents the difference between annualized management fees expected to be earned on new accounts and net assets contributed to existing accounts, less the annualized management fees lost on terminated accounts or net assets withdrawn from existing accounts, including equity-accounted Affiliates. The annualized management fees are calculated by multiplying the annual gross fee rate for the relevant account by the net assets gained in the account in the event of a positive flow, excluding any current or future market appreciation or depreciation, or the net assets lost in the account in the event of an outflow, excluding any current or future market appreciation or depreciation. For a further discussion of the uses and limitations of the annualized revenue impact of net flows, see “Management’s Discussion and Analysis of Financial Condition and Results of Operations—Overview—Assets Under Management.” |
(9) | Balance sheet data presented in accordance with U.S. GAAP for the years 2012 through 2014 and 2016 include the results of Funds managed by our Affiliates where it has been determined these entities are controlled by our Company. Consolidated assets and liabilities of these entities that are attributable to third-party investors, or non-controlling interests, have the effect of increasing our consolidated assets and liabilities. The net assets and liabilities presented as attributable to controlling interests exclude the portions directly attributable to these third-party investors, and represent the net amounts attributable to our shareholders. Similarly, Shareholders’ equity (deficit) represents our net assets after excluding net assets directly attributable to these third-party investors. |
63
Item 7. Management’s Discussion and Analysis of Financial Condition and Results of Operations.
The following discussion of our financial condition and results of operations should be read in conjunction with our Consolidated Financial Statements and related notes which appear in this Annual Report on Form 10-K in Item 8, Financial Statements and Supplementary Data.
This discussion contains forward-looking statements that involve risks and uncertainties. See “Special Note Regarding Forward-Looking Statements” for more information. Our actual results could differ materially from those anticipated in these forward-looking statements as a result of various factors, including those discussed below and elsewhere in this Annual Report on Form 10-K, particularly under Item 1A, Risk Factors.
This Management’s Discussion and Analysis of Financial Condition and Results of Operations, or MD&A, is designed to provide a reader of our financial statements with a narrative from the perspective of our management on our financial condition, results of operations, liquidity and certain other factors that may affect our future results.
Our MD&A is presented in five sections:
• | Overview provides a brief description of our Affiliates, a summary of The Economics of Our Business and an explanation of How We Measure Performance using a non-GAAP measure which we refer to as economic net income, or ENI. This section also provides a Summary Results of Operations and information regarding our Assets Under Management by Affiliate and asset class. |
• | U.S. GAAP Results of Operations for the years ended December 31, 2016, 2015, and 2014 includes an explanation of changes in our U.S. GAAP revenue, expense, and other items over the last three years as well as key U.S. GAAP operating metrics. |
• | Non-GAAP Supplemental Performance Measure—Economic Net Income includes an explanation of the key differences between U.S. GAAP net income and ENI, the key measure management uses to evaluate our performance. This section also provides a reconciliation between U.S. GAAP net income and ENI for the years ended December 31, 2016, 2015, and 2014, as well as a reconciliation of key ENI operating items including ENI revenue and ENI operating expenses. In addition, this section provides key Non-GAAP operating metrics and a calculation of tax on economic net income. |
• | Capital Resources and Liquidity discusses our key balance sheet data including Working Capital and Long-Term Debt. This section also discusses Cash Flows from the business; Adjusted EBITDA; Future Capital Needs; and Commitments, Contingencies and Off-Balance Sheet Obligations. The discussion of Adjusted EBITDA includes an explanation of how we calculate Adjusted EBITDA and a reconciliation of Adjusted EBITDA to net income attributable to controlling interests. |
• | Critical Accounting Policies and Estimates provides a discussion of the key accounting policies used in the preparation of our U.S. GAAP financial statements. |
64
Overview
We are a diversified, multi-boutique asset management firm headquartered in London, UK. We operate our business through eight affiliate firms to whom we refer in this Annual Report as our Affiliates. Through our Affiliates, we offer a diverse range of actively-managed investment strategies and products to institutional investors around the globe. While our Affiliates maintain autonomy in the investment process and the day-to-day management of their businesses, our strategy is to work with them to accelerate the growth and profitability of their firms.
Under U.S. GAAP, our Affiliates may be consolidated into our operations or may be accounted for as equity investments. We may also be required to consolidate certain of our Affiliates’ Funds, due to the nature of our decision-making rights, our economic interests in these Funds or the rights of third-party clients in those Funds.
Our Affiliates and their principal strategies include:
• | Acadian Asset Management LLC (“Acadian”)—a leading quantitatively-oriented manager of active global and international equity, and alternative strategies. |
• | Barrow, Hanley, Mewhinney & Strauss, LLC (“Barrow Hanley”)—a widely recognized value-oriented investment manager of U.S., international and global equities, fixed income and a range of balanced investment management strategies. |
• | Campbell Global, LLC (“Campbell Global”)—a leading sustainable timber and natural resource investment manager that seeks to deliver superior investment performance by focusing on unique acquisition opportunities, client objectives and disciplined management. |
• | Copper Rock Capital Partners LLC (“Copper Rock”)—a specialized growth equity investment manager of small-cap international, global and emerging markets equity strategies. |
• | Heitman LLC (“Heitman”)*—a leading real estate investment manager of high-quality global strategies focused on private real estate equity, public real estate securities and real estate debt. |
• | Investment Counselors of Maryland, LLC (“ICM”)*—a value-driven domestic equity manager with product offerings across the entire capitalization range and a primary focus on small-cap companies. |
• | Landmark Partners, LLC (“Landmark”)—a leading global secondary private equity, real estate and real asset investment firm. |
• | Thompson, Siegel & Walmsley LLC (“TSW”)—a value-oriented investment manager focused on small- and mid-cap U.S. equity, international equity and fixed income strategies. |
* Accounted for under the equity method of accounting.
65
The Economics of Our Business
Our profitability is affected by a variety of factors including the level and composition of our average assets under management, or AUM, fee rates charged on AUM and our expense structure. Our Affiliates earn management fees based on assets under management. Approximately 70% of our management fees are calculated based on average AUM (calculated on either a daily or monthly basis) with the remainder of our management fees calculated based on period end AUM or other measuring methods. Changes in the levels of our AUM are driven by our investment performance and net client cash flows. Our Affiliates may also earn performance fees when certain accounts add value in relation to relevant benchmarks or exceed required returns. Approximately $50 billion, or 24% of our AUM in consolidated Affiliates, are in accounts with incentive fee or carried interest features in which OMAM participates in the performance fee. The majority of these incentive fees are calculated based on value added over the relevant benchmarks on a rolling three year basis. Carried interests are features of private equity funds, which are calculated based on long-term cumulative returns. In addition, approximately $11 billion of performance fee eligible AUM is managed by our equity-accounted Affiliates. Fees earned on these assets are not reflected as part of ENI or GAAP performance fee revenue.
Our largest expense item is compensation and benefits paid to our and our Affiliates’ employees, which consists of both fixed and variable components. Fixed compensation and benefits represents base salaries and wages, payroll taxes and the costs of our employee benefit programs. Variable compensation, calculated as described below, may be awarded in cash, equity or profit interests.
The arrangements in place with our Affiliates result in the sharing of economics between OMUS and each Affiliate’s key management personnel using a profit-sharing model, except for ICM, which uses a revenue share model as a result of a legacy economic arrangement that has not been restructured. Profit sharing affects two elements within our earnings: (i) the calculation of variable compensation and (ii) the level of each Affiliate’s equity or profit interests distribution to its employees. Variable compensation is the portion of earnings that is contractually allocated to Affiliate employees as a bonus pool, typically representing a fixed percentage of earnings before variable compensation, which is measured as revenues less fixed compensation and benefits and other operating and administrative expenses. Profits after variable compensation are shared between us and Affiliate key employee equity holders according to our respective equity or profit interests ownership. The sharing of profits in this manner ensures that the economic interests of Affiliate key employees and those of OMUS are aligned, both in terms of generating strong annual earnings as well as investing those earnings back into the business in order to generate growth over the long term. We view profit sharing as an attractive operating model, as it allows us to share in the benefits of operating leverage as the business grows, and ensures all equity and profit interests holders are incentivized to achieve that growth.
Equity or profit interests owned by Affiliate key employees are either awarded as part of their variable compensation arrangements, or alternatively, may have originally resulted from OMUS acquiring less than 100% of the Affiliate. Over time, Affiliate key employee-owned equity or profit interests are recycled from one generation of employee-owners to the next either by the next generation purchasing equity or profit interests directly from retiring principals, or by Affiliate key employees forgoing cash bonuses in exchange for the equivalent value in Affiliate equity or profit interests. The recycling of equity or profit interests is often facilitated by OMUS; see “—U.S. GAAP Results of Operations—U.S. GAAP Expenses—Compensation and Benefits Expense” for a further discussion.
66
The diagram below provides an illustrative example of how the profit-sharing model would work initially and over time if the affiliate grew its revenue and profits. In this example, the employees’ variable compensation has been contractually set at 30% of earnings before variable compensation, and the earnings after variable compensation are split 60% to OMUS and 40% to the affiliate key employees. Revenue initially equals $200 and operating expenses equal $100. Therefore, earnings before variable compensation equal $100 and the contractual bonus pool (variable compensation) equals $30. The owners split the $70 profit after variable compensation, with OMUS receiving $42, or 60%, and the Affiliate key employees receiving $28, or 40%. Including both the contractual employee bonus pool and the key employees’ share of profit, the employees receive $58, or 58% of profit before variable compensation. Employee equity is valued at a fixed multiple of this $28 share of profits, so employees have transparency into both their earning potential in any year from the bonus pool and share of profits, as well as the current value of their equity and the long-term potential to realize value from its growth. In this structure, key employees who are managing their business have incentives to manage for profit, but also to manage the business prudently, in the interest of their clients, and invest for growth, since they will benefit over the long term as both employees and equity holders. In this way, each Affiliate is aligned with OMUS and the public shareholders to generate profits and growth over time.
Illustrative Structure: Profit-Sharing Economics
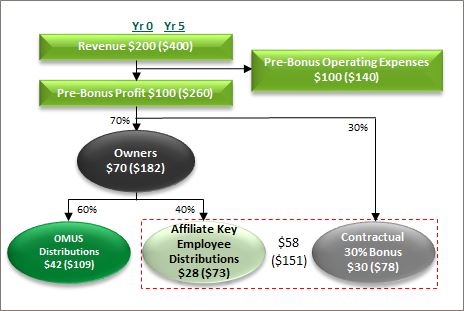
Figures in parenthesis indicate impact of model after five years if revenue and pre-bonus operating expenses grew 15% and 7% annually, respectively.
The alignment of interests is even clearer if we consider the impact of growth on the profit-sharing model. The numbers in parenthesis in the diagram represent the financial results of the illustrative business in five years, assuming revenue has grown at 15% annually and operating expenses have grown at 7% annually. With revenue of $400 and operating expenses of $140, profit before variable compensation has now increased to $260, representing an annual growth rate of 21%. The 30% contractual bonus pool of $78 has also grown 21% annually, as has OMUS’s 60% share of profits, which equals $109, and the affiliate’s 40% share of profits, which equals $73. From this example, it is clear that as profit in the affiliate’s business grows and the operating margin increases, both of the stakeholders—OMUS and the key employees—are benefiting in a proportionate way. This means that both parties are aligned to invest in the business by hiring new investment professionals, developing new products, or establishing new distribution channels. We believe this investment in turn benefits clients and should generate growth over time.
67
The alternative structure common in the industry is the revenue share model. In the revenue share model, the affiliate’s revenue is typically divided into two fixed percentages—the operating allocation and the owners’ allocation. All operating expenses of the business, including employee bonuses, must be covered by the operating allocation. The owners’ allocation can be owned entirely by the multi-boutique owner or ownership can be divided between the multi-boutique owner and the affiliate’s key employees. In either case, the multi-boutique owner effectively owns a fixed percentage of the affiliates’ revenue, which typically does not change as the business grows. While the initial economics of the profit share model and the revenue share model can be similar, over time the economic split and incentive structure can be quite different, leading to less alignment between the affiliate and the multi-boutique owner. The multi-boutique owner’s share of profits grows in line with revenue, while any operating leverage in the business is retained entirely by the affiliate’s employees. Likewise, new costs and investments to drive growth are borne entirely by the affiliate employees, while the revenue generated by these investments is shared with the multi-boutique owner. While the revenue share structure has been successfully implemented by a number of our peers who have a more autonomous strategy, for OMAM, which emphasizes collaborative engagement and joint investment with our Affiliates, the alignment of the profit-sharing model is mutually reinforcing with our overall growth strategy and operating philosophy.
How We Measure Performance
We manage our business in aggregate based on a single reportable segment, reflecting how our management assesses the performance of our business. Within our organizational framework, the same operational resources support multiple products and Affiliates and performance is evaluated at a consolidated level.
In measuring and monitoring the key components of our earnings, our management uses a non-GAAP financial measure, ENI, to evaluate the financial performance of, and to make operational decisions for, our business. We also use ENI to make resource allocation decisions, determine appropriate levels of investment or dividend payout, manage balance sheet leverage, determine Affiliate variable compensation and equity distributions, and incentivize management. It is an important measure in evaluating our financial performance because we believe it most accurately represents our operating performance and cash generation capability.
ENI differs from net income determined in accordance with U.S. GAAP as a result of both the reclassification of certain income statement items and the exclusion of certain non-cash or non-recurring income statement items. In particular, ENI excludes non-cash charges representing the changes in the value of Affiliate equity and profit interests held by Affiliate key employees, and the results of discontinued operations which are no longer part of our business and that portion of consolidated Funds which are not attributable to our shareholders. ENI is also adjusted to reflect the effect of restructuring and reorganization activity undertaken in connection with the Offering and amortization of acquisition-related contingent consideration and pre-acquisition retained equity with service components.
ENI revenue is primarily comprised of the fee revenues paid to us by our clients for our advisory services and earnings from our equity-accounted Affiliates. Revenue included within ENI differs from U.S. GAAP revenue in that it excludes amounts from consolidated Funds which are not attributable to our shareholders and includes our share of earnings from equity-accounted Affiliates.
ENI expenses are calculated to reflect all usual expenses from ongoing continuing operations attributable to our shareholders. Expenses included within ENI differ from U.S. GAAP expenses in that they exclude amounts from consolidated Funds which are not attributable to our shareholders, revaluations of Affiliate key employee owned equity and profit interests, amortization and impairment of acquired intangibles and other acquisition-related items, and certain other non-cash expenses.
“Non-controlling interests” is a concept under U.S. GAAP that identifies net components of revenues and expenses that are not attributable to our shareholders. For example, the portion of the net income (loss) of any consolidated Funds that is attributable to the outside investors or clients of the consolidated Funds is included in “Non-controlling interests” in our Consolidated Financial Statements. Conversely, “controlling interests” is the portion of revenue or expense that is attributable to our shareholders.
68
In the third quarter of 2016, we began making additional disclosures and refined our definition of economic net income to better reflect the economics of transactions which closed in the quarter, including the purchase of seed capital from our Parent and the acquisition of Landmark Partners. For a more detailed discussion of the differences between U.S. GAAP net income and economic net income, see “—Non-GAAP Supplemental Performance Measure—Economic Net Income.”
Summary Results of Operations
The following table summarizes our results of operations for the years ended December 31, 2016, 2015, and 2014. On January 1, 2015, in conjunction with the adoption of ASU 2015-02, the Company de-consolidated all Funds that had been consolidated as of December 31, 2014. Following the purchase of seed capital investments from our Parent in the third quarter of 2016, we consolidated certain Funds pursuant to ASU 2015-02:
Years ended December 31, | Increase (Decrease) | ||||||||||||||||||
($ in millions, unless otherwise noted) | 2016 | 2015 | 2014 | 2016 vs. 2015 | 2015 vs. 2014 | ||||||||||||||
U.S. GAAP Basis | |||||||||||||||||||
Revenue | $ | 663.5 | $ | 699.3 | $ | 1,056.3 | $ | (35.8 | ) | $ | (357.0 | ) | |||||||
Pre-tax income from continuing operations attributable to controlling interests | 161.0 | 201.3 | 68.1 | (40.3 | ) | 133.2 | |||||||||||||
Net income attributable to controlling interests(1) | 126.4 | 155.5 | 51.7 | (29.1 | ) | 103.8 | |||||||||||||
U.S. GAAP operating margin(2) | 23 | % | 27 | % | (6 | )% | (389) bps | n/m | |||||||||||
Earnings per share, basic ($) (9) | $ | 1.05 | $ | 1.29 | $ | 0.43 | $ | (0.24 | ) | $ | 0.86 | ||||||||
Earnings per share, diluted ($) (9) | 1.05 | 1.29 | 0.43 | $ | (0.24 | ) | $ | 0.86 | |||||||||||
Basic shares outstanding (in millions)(9) | 119.2 | 120.0 | 120.0 | (0.8 | ) | — | |||||||||||||
Diluted shares outstanding (in millions)(9) | 119.5 | 120.5 | 120.0 | (1.0 | ) | 0.5 | |||||||||||||
Economic Net Income Basis | |||||||||||||||||||
(Non-GAAP measure used by management) | |||||||||||||||||||
ENI revenue(3)(4)(6) | $ | 678.5 | $ | 663.9 | $ | 635.4 | $ | 14.6 | $ | 28.5 | |||||||||
Pre-tax economic net income(3)(4)(7) | 190.7 | 203.5 | 204.1 | (12.8 | ) | (0.6 | ) | ||||||||||||
Economic net income, excluding non-recurring performance fee(3)(4)(8) | 145.1 | 149.7 | 151.3 | (4.6 | ) | (1.6 | ) | ||||||||||||
ENI diluted earnings per share, excluding non-recurring performance fee, ($) (4)(9) | $ | 1.21 | $ | 1.24 | $ | 1.26 | $ | (0.03 | ) | $ | (0.02 | ) | |||||||
ENI operating margin(4)(5) | 35 | % | 37 | % | 39 | % | (137) bps | (165) bps | |||||||||||
Adjusted EBITDA(4) | $ | 208.5 | $ | 212.7 | $ | 210.7 | $ | (4.2 | ) | $ | 2.0 | ||||||||
Economic net income (including non-recurring performance fee)(6) | 145.1 | 161.1 | 151.3 | (16.0 | ) | 9.8 | |||||||||||||
ENI diluted EPS (including non-recurring performance fee),($) | $ | 1.21 | $ | 1.34 | $ | 1.26 | $ | (0.13 | ) | $ | 0.08 | ||||||||
Other Operational Information | |||||||||||||||||||
Assets under management (AUM) at year end (in billions) | $ | 240.4 | $ | 212.4 | $ | 220.8 | $ | 28.0 | $ | (8.4 | ) | ||||||||
Net client cash flows (in billions) | (1.6 | ) | (5.1 | ) | 9.5 | 3.5 | (14.6 | ) | |||||||||||
Annualized revenue impact of net flows (in millions)(10) | 11.0 | 18.9 | 54.5 | (7.9 | ) | (35.6 | ) | ||||||||||||
(1) | Net income attributable to controlling interests excludes the results of consolidated Funds. |
(2) | U.S. GAAP operating margin equals operating income (loss) from continuing operations divided by total revenue. Excluding the effect of Funds consolidation, the U.S. GAAP operating margin would be 23% for the year ended December 31, 2016, 27% for the year ended December 31, 2015 and 17% for the year ended December 31, 2014. |
69
(3) | Economic net income, which is presented after Affiliate key employee distributions, is a non-GAAP measure we use to evaluate the performance of our continuing operations. For a reconciliation to U.S. GAAP financial information and a further discussion of economic net income refer to “—Non-GAAP Supplemental Performance Measures—Economic Net Income.” |
(4) | In the second quarter of 2015, we recorded a non-recurring performance fee of $11.4 million, net of associated expenses and taxes. While all performance fees fall within OMAM’s definition of economic net income, we believe that the unique characteristics of this fee, including its size and the extraordinary investment performance of the underlying product, make it unrepresentative of our recurring economics. We have therefore presented economic net income with this non-recurring performance fee excluded from revenue and expenses. This presentation provides a more comparative view across reporting periods of the line items which make up ENI revenue and expense. Unless explicitly noted, the revenue, expense and key ENI metrics herein exclude the impact of the non-recurring performance fee. |
(5) | ENI operating margin is a non-GAAP efficiency measure, calculated based on ENI operating earnings divided by ENI revenue. The ENI operating margin is most comparable to our U.S. GAAP operating margin (excluding the effect of consolidated Funds) of 23% for the year ended December 31, 2016, 27% for the year ended December 31, 2015 and 17% for the year ended December 31, 2014. |
(6) | ENI revenue is the ENI measure which corresponds to U.S. GAAP revenue. |
(7) | Pre-tax Economic net income is the ENI measure which corresponds to U.S. GAAP pre-tax income from continuing operations attributable to controlling interests. |
(8) | Economic net income excluding the non-recurring performance fee is the ENI measure which corresponds to U.S. GAAP net income from continuing operations attributable to controlling interests. |
(9) | Reflects weighted average pro forma shares outstanding for the year ended December 31, 2014. |
(10) | Annualized revenue impact of net flows represents the difference between annualized management fees expected to be earned on new accounts and net assets contributed to existing accounts, less the annualized management fees lost on terminated accounts or net assets withdrawn from existing accounts, including equity-accounted Affiliates. The annualized management fees are calculated by multiplying the annual gross fee rate for the relevant account by the net assets gained in the account in the event of a positive flow, excluding any current or future market appreciation or depreciation, or the net assets lost in the account in the event of an outflow, excluding any current or future market appreciation or depreciation. For a further discussion of the uses and limitations of the annualized revenue impact of net flows, see “Assets Under Management” herein. |
Assets Under Management
Our total assets under management as of December 31, 2016 were $240.4 billion. The following table presents our assets under management by Affiliate as of each of the dates indicated:
($ in billions) | December 31, 2016 | December 31, 2015 | December 31, 2014 | ||||||||
Acadian Asset Management | $ | 75.0 | $ | 66.8 | $ | 70.3 | |||||
Barrow, Hanley, Mewhinney & Strauss | 92.3 | 89.2 | 99.7 | ||||||||
Campbell Global | 5.2 | 6.3 | 6.8 | ||||||||
Copper Rock Capital Partners | 5.1 | 4.7 | 3.2 | ||||||||
Heitman | 31.2 | 29.1 | 26.7 | ||||||||
Investment Counselors of Maryland | 2.0 | 1.8 | 2.1 | ||||||||
Landmark Partners | 9.7 | n/a | n/a | ||||||||
Thompson, Siegel & Walmsley | 19.9 | 14.5 | 12.0 | ||||||||
Total assets under management | $ | 240.4 | $ | 212.4 | $ | 220.8 | |||||
n/a - not an Affiliate as of the date indicated
70
Our primary asset classes include:
i. | U.S. equity, which includes small cap through large cap securities and substantially value or blended investment styles; |
ii. | Global/non-U.S. equity, which includes global and international equities including emerging markets; |
iii. | Fixed income, which includes government bonds, corporate bonds and other fixed income investments in the United States; and |
iv. | Alternatives, which consist of real estate, timberland investments, secondary Funds and other alternative investments. |
The following table presents our assets under management by strategy as of each of the dates indicated:
($ in billions) | December 31, 2016 | December 31, 2015 | December 31, 2014 | ||||||||
U.S. equity, small/smid cap value | $ | 7.9 | $ | 6.9 | $ | 7.8 | |||||
U.S. equity, mid cap value | 11.3 | 9.5 | 9.5 | ||||||||
U.S. equity, large cap value | 59.2 | 57.4 | 65.4 | ||||||||
U.S. equity, core/blend | 3.6 | 3.1 | 4.6 | ||||||||
Total U.S. equity | 82.0 | 76.9 | 87.3 | ||||||||
Global equity | 32.3 | 29.4 | 30.0 | ||||||||
International equity | 42.5 | 37.0 | 31.9 | ||||||||
Emerging markets equity | 21.6 | 18.4 | 22.1 | ||||||||
Total global/non-U.S. equity | 96.4 | 84.8 | 84.0 | ||||||||
Fixed income | 13.9 | 13.8 | 15.2 | ||||||||
Alternatives | 48.1 | 36.9 | 34.3 | ||||||||
Total assets under management | $ | 240.4 | $ | 212.4 | $ | 220.8 | |||||
AUM flows and the annualized revenue impact of net flows
In the following tables, we present our asset flows and market appreciation/depreciation by asset class, client type and client location. We also present a key metric used to better understand our asset flows, the annualized revenue impact of net client cash flows. Annualized revenue impact of net flows represents the difference between annualized management fees expected to be earned on new accounts and net assets contributed to existing accounts, less the annualized management fees lost on terminated accounts or net assets withdrawn from existing accounts, including equity-accounted Affiliates. The annualized management fees are calculated by multiplying the annual gross fee rate for the relevant account by the net assets gained in the account in the event of a positive flow, excluding any current or future market appreciation or depreciation, or the net assets lost in the account in the event of an outflow, excluding any current or future market appreciation or depreciation.
The annualized revenue impact of net flows metric is designed to provide investors with a better indication of the potential financial impact of net client cash flows, however it has certain limitations. For instance, it does not include assumptions for the next twelve months’ market appreciation or depreciation or investment performance associated with the assets gained or lost. Nor does it account for factors such as future client terminations or additional contributions or withdrawals over the next twelve months. Additionally, the basis points reported are fee rates based on the asset levels at the time of the transactions and do not consider the fact that client fee rates may change over the next twelve months.
71
The following table summarizes our asset flows and market appreciation/depreciation by asset class for each of the periods indicated:
($ in billions) | Years ended December 31, | ||||||||||
2016 | 2015 | 2014 | |||||||||
U.S. equity | |||||||||||
Beginning balance | $ | 76.9 | $ | 87.3 | $ | 80.6 | |||||
Gross inflows | 7.9 | 5.6 | 8.5 | ||||||||
Gross outflows | (14.3 | ) | (14.5 | ) | (9.5 | ) | |||||
Net flows | (6.4 | ) | (8.9 | ) | (1.0 | ) | |||||
Market appreciation (depreciation) | 11.0 | (1.5 | ) | 8.1 | |||||||
Other | 0.5 | — | (0.4 | ) | |||||||
Ending balance | $ | 82.0 | $ | 76.9 | $ | 87.3 | |||||
Average AUM | $ | 78.3 | $ | 82.8 | $ | 83.8 | |||||
Global / non-U.S. equity | |||||||||||
Beginning balance | $ | 84.8 | $ | 84.0 | $ | 74.3 | |||||
Gross inflows | 14.1 | 14.2 | 15.8 | ||||||||
Gross outflows | (9.6 | ) | (10.8 | ) | (7.8 | ) | |||||
Net flows | 4.5 | 3.4 | 8.0 | ||||||||
Market appreciation (depreciation) | 6.7 | (3.2 | ) | 1.7 | |||||||
Other | 0.4 | 0.6 | — | ||||||||
Ending balance | $ | 96.4 | $ | 84.8 | $ | 84.0 | |||||
Average AUM | $ | 90.0 | $ | 87.5 | $ | 80.0 | |||||
Fixed income | |||||||||||
Beginning balance | $ | 13.8 | $ | 15.2 | $ | 13.5 | |||||
Gross inflows | 1.2 | 1.4 | 2.9 | ||||||||
Gross outflows | (2.1 | ) | (2.2 | ) | (2.4 | ) | |||||
Net flows | (0.9 | ) | (0.8 | ) | 0.5 | ||||||
Market appreciation (depreciation) | 1.0 | (0.3 | ) | 1.2 | |||||||
Other | — | (0.3 | ) | — | |||||||
Ending balance | $ | 13.9 | $ | 13.8 | $ | 15.2 | |||||
Average AUM | $ | 14.1 | $ | 14.9 | $ | 14.5 | |||||
Alternatives | |||||||||||
Beginning balance | $ | 36.9 | $ | 34.3 | $ | 30.4 | |||||
Gross inflows | 6.7 | 5.4 | 4.8 | ||||||||
Gross outflows | (1.6 | ) | (1.8 | ) | (1.1 | ) | |||||
Hard asset disposals | (3.9 | ) | (2.4 | ) | (1.7 | ) | |||||
Net flows | 1.2 | 1.2 | 2.0 | ||||||||
Market appreciation | 2.0 | 1.3 | 1.9 | ||||||||
Acquisition of Affiliates | 8.8 | — | — | ||||||||
Other | (0.8 | ) | 0.1 | — | |||||||
Ending balance | $ | 48.1 | $ | 36.9 | $ | 34.3 | |||||
Average AUM | $ | 40.7 | $ | 35.7 | $ | 32.0 | |||||
Total | |||||||||||
Beginning balance | $ | 212.4 | $ | 220.8 | $ | 198.8 | |||||
Gross inflows | 29.9 | 26.6 | 32.0 | ||||||||
Gross outflows | (27.6 | ) | (29.3 | ) | (20.8 | ) | |||||
Hard asset disposals | (3.9 | ) | (2.4 | ) | (1.7 | ) | |||||
Net flows | (1.6 | ) | (5.1 | ) | 9.5 | ||||||
Market appreciation (depreciation) | 20.7 | (3.7 | ) | 12.9 | |||||||
Acquisition of Affiliates | 8.8 | — | — | ||||||||
Other | 0.1 | 0.4 | (0.4 | ) | |||||||
Ending balance | $ | 240.4 | $ | 212.4 | $ | 220.8 | |||||
Average AUM | $ | 223.1 | $ | 220.9 | $ | 210.3 | |||||
Annualized basis points: inflows | 41.9 | 45.9 | 43.6 | ||||||||
Annualized basis points: outflows | 36.3 | 32.6 | 37.8 | ||||||||
Annualized revenue impact of net flows (in millions) | $ | 11.0 | $ | 18.9 | $ | 54.5 | |||||
72
We also analyze our asset flows by client type and client location. Our client types include:
i. | Sub-advisory, which includes assets managed for underlying mutual fund and variable insurance products which are sponsored by insurance companies and mutual fund platforms, where the end client is typically retail; |
ii. | Institutional, which includes assets managed for public / government pension funds, including U.S. state and local government funds and non-U.S. sovereign wealth, local government and national pension funds; also includes corporate and union-sponsored pension plans; and |
iii. | Retail / other, which includes assets managed for mutual funds sponsored by our Affiliates, defined contribution plans and accounts managed for high net worth clients. |
The following table summarizes our asset flows by client type for each of the periods indicated:
($ in billions) | Years ended December 31, | ||||||||||
2016 | 2015 | 2014 | |||||||||
Sub-advisory | |||||||||||
Beginning balance | $ | 69.0 | $ | 74.1 | $ | 65.1 | |||||
Gross inflows | 11.2 | 7.8 | 9.7 | ||||||||
Gross outflows | (12.3 | ) | (11.4 | ) | (6.4 | ) | |||||
Net flows | (1.1 | ) | (3.6 | ) | 3.3 | ||||||
Market appreciation (depreciation) | 7.7 | (1.5 | ) | 5.8 | |||||||
Other | 0.3 | — | (0.1 | ) | |||||||
Ending balance | $ | 75.9 | $ | 69.0 | $ | 74.1 | |||||
Institutional | |||||||||||
Beginning balance | $ | 133.8 | $ | 137.2 | $ | 124.4 | |||||
Gross inflows | 16.9 | 16.6 | 20.0 | ||||||||
Gross outflows | (12.4 | ) | (16.1 | ) | (11.7 | ) | |||||
Hard asset disposals | (3.9 | ) | (2.4 | ) | (1.7 | ) | |||||
Net flows | 0.6 | (1.9 | ) | 6.6 | |||||||
Market appreciation (depreciation) | 11.7 | (1.9 | ) | 6.5 | |||||||
Acquisition of Affiliates | 8.6 | — | — | ||||||||
Other | (0.6 | ) | 0.4 | (0.3 | ) | ||||||
Ending balance | $ | 154.1 | $ | 133.8 | $ | 137.2 | |||||
Retail / Other | |||||||||||
Beginning balance | $ | 9.6 | $ | 9.5 | $ | 9.3 | |||||
Gross inflows | 1.8 | 2.2 | 2.3 | ||||||||
Gross outflows | (2.9 | ) | (1.8 | ) | (2.7 | ) | |||||
Net flows | (1.1 | ) | 0.4 | (0.4 | ) | ||||||
Market appreciation (depreciation) | 1.3 | (0.3 | ) | 0.6 | |||||||
Acquisition of Affiliates | 0.2 | — | — | ||||||||
Other | 0.4 | — | — | ||||||||
Ending balance | $ | 10.4 | $ | 9.6 | $ | 9.5 | |||||
Total | |||||||||||
Beginning balance | $ | 212.4 | $ | 220.8 | $ | 198.8 | |||||
Gross inflows | 29.9 | 26.6 | 32.0 | ||||||||
Gross outflows | (27.6 | ) | (29.3 | ) | (20.8 | ) | |||||
Hard asset disposals | (3.9 | ) | (2.4 | ) | (1.7 | ) | |||||
Net flows | (1.6 | ) | (5.1 | ) | 9.5 | ||||||
Market appreciation (depreciation) | 20.7 | (3.7 | ) | 12.9 | |||||||
Acquisition of Affiliates | 8.8 | — | — | ||||||||
Other | 0.1 | 0.4 | (0.4 | ) | |||||||
Ending balance | $ | 240.4 | $ | 212.4 | $ | 220.8 | |||||
73
It is a strategic objective to increase our percentage of assets under management sourced from non-U.S. clients. Our categorization by client location includes:
i. | U.S.-based clients, where the contracting client is based in the United States, and |
ii. | Non-U.S.-based clients, where the contracting client is based outside the United States. |
The following table summarizes asset flows by client location for each of the periods indicated:
($ in billions) | Years ended December 31, | ||||||||||
2016 | 2015 | 2014 | |||||||||
U.S. | |||||||||||
Beginning balance | $ | 171.8 | $ | 176.6 | $ | 160.2 | |||||
Gross inflows | 21.2 | 20.6 | 23.7 | ||||||||
Gross outflows | (23.1 | ) | (20.2 | ) | (15.8 | ) | |||||
Hard asset disposals | (2.7 | ) | (2.1 | ) | (1.3 | ) | |||||
Net flows | (4.6 | ) | (1.7 | ) | 6.6 | ||||||
Market appreciation (depreciation) | 16.9 | (2.8 | ) | 10.1 | |||||||
Acquisition of Affiliates | 7.4 | — | — | ||||||||
Other | 0.1 | (0.3 | ) | (0.3 | ) | ||||||
Ending balance | $ | 191.6 | $ | 171.8 | $ | 176.6 | |||||
Non-U.S. | |||||||||||
Beginning balance | $ | 40.6 | $ | 44.2 | $ | 38.6 | |||||
Gross inflows | 8.7 | 6.0 | 8.3 | ||||||||
Gross outflows | (4.5 | ) | (9.1 | ) | (5.0 | ) | |||||
Hard asset disposals | (1.2 | ) | (0.3 | ) | (0.4 | ) | |||||
Net flows | 3.0 | (3.4 | ) | 2.9 | |||||||
Market appreciation (depreciation) | 3.8 | (0.9 | ) | 2.8 | |||||||
Acquisition of Affiliates | 1.4 | — | — | ||||||||
Other | — | 0.7 | (0.1 | ) | |||||||
Ending balance | $ | 48.8 | $ | 40.6 | $ | 44.2 | |||||
Total | |||||||||||
Beginning balance | $ | 212.4 | $ | 220.8 | $ | 198.8 | |||||
Gross inflows | 29.9 | 26.6 | 32.0 | ||||||||
Gross outflows | (27.6 | ) | (29.3 | ) | (20.8 | ) | |||||
Hard asset disposals | (3.9 | ) | (2.4 | ) | (1.7 | ) | |||||
Net flows | (1.6 | ) | (5.1 | ) | 9.5 | ||||||
Market appreciation (depreciation) | 20.7 | (3.7 | ) | 12.9 | |||||||
Acquisition of Affiliates | 8.8 | — | — | ||||||||
Other | 0.1 | 0.4 | (0.4 | ) | |||||||
Ending balance | $ | 240.4 | $ | 212.4 | $ | 220.8 | |||||
74
At December 31, 2016, our total assets under management were $240.4 billion, an increase of $28.0 billion or 13.2% compared to $212.4 billion at December 31, 2015. The assets under management at December 31, 2015 represented a decrease of $(8.4) billion or (3.8)% compared to $220.8 billion at December 31, 2014. In addition to the acquisition of Landmark, which accounted for an increase in assets under management of $8.8 billion, the change in assets under management during the year ended December 31, 2016 reflects net market appreciation of $20.7 billion, net outflows of $(1.6) billion and other movements of $0.1 billion. The change in assets under management during the year ended December 31, 2015 reflects net market depreciation of $(3.7) billion, net outflows of $(5.1) billion and other movements of $0.4 billion. Other movements in 2016 reflect the standardization of AUM definitions across Affiliates and mandates and the revaluation of certain hard assets. These changes align the definition of AUM with management fees charged to clients. Other movements in 2015 primarily represent the AUM impact of the disposal of certain fund strategies offset by the consolidation of a joint venture.
For the year ended December 31, 2016, our net outflows were $(1.6) billion compared to net outflows of $(5.1) billion for the year ended December 31, 2015 and net inflows of $9.5 billion for the year ended December 31, 2014. Hard asset disposals of $(3.9) billion, $(2.4) billion and $(1.7) billion are reflected in the net flows for the years ended December 31, 2016, 2015 and 2014, respectively. For the year ended December 31, 2016, the annualized revenue impact of the net flows was $11.0 million, as gross inflows of $29.9 billion during the year were into higher fee asset classes yielding an annualized fee rate of 41.9 bps, versus gross outflows and hard asset disposals in the same period of $(31.5) billion out of asset classes yielding an annualized fee rate of 36.3 bps. This is compared to the annualized revenue impact of net flows of $18.9 million for the year ended December 31, 2015 and $54.5 million for the year ended December 31, 2014.
75
U.S. GAAP Results of Operations
For the Years Ended December 31, 2016, 2015, and 2014
Our U.S. GAAP results of operations were as follows for the years ended December 31, 2016, 2015, and 2014. On January 1, 2015, in conjunction with the adoption of ASU 2015-02, the Company de-consolidated all Funds that had been consolidated as of December 31, 2014. Following the purchase of seed capital investments from our Parent in the third quarter of 2016, we consolidated certain Funds pursuant to ASU 2015-02 which are included in our Consolidated Balance Sheets at December 31, 2016.
Years ended December 31, | Increase (Decrease) | ||||||||||||||||||
($ in millions unless otherwise noted) | 2016 | 2015 | 2014 | 2016 vs. 2015 | 2015 vs. 2014 | ||||||||||||||
U.S. GAAP Statement of Operations(1) | |||||||||||||||||||
Management fees | $ | 659.9 | $ | 637.2 | $ | 569.7 | $ | 22.7 | $ | 67.5 | |||||||||
Performance fees | 2.6 | 61.8 | 34.3 | (59.2 | ) | 27.5 | |||||||||||||
Other revenue | 0.9 | 0.3 | 1.6 | 0.6 | (1.3 | ) | |||||||||||||
Consolidated Funds’ revenue | 0.1 | — | 450.7 | 0.1 | (450.7 | ) | |||||||||||||
Total revenue | 663.5 | 699.3 | 1,056.3 | (35.8 | ) | (357.0 | ) | ||||||||||||
Compensation and benefits | 397.4 | 412.8 | 429.4 | (15.4 | ) | (16.6 | ) | ||||||||||||
General and administrative | 98.3 | 88.2 | 83.9 | 10.1 | 4.3 | ||||||||||||||
Amortization of acquired intangibles | 2.6 | 0.2 | 0.1 | 2.4 | 0.1 | ||||||||||||||
Depreciation and amortization | 9.4 | 6.9 | 6.1 | 2.5 | 0.8 | ||||||||||||||
Consolidated Funds’ expense | 0.2 | — | 604.0 | 0.2 | (604.0 | ) | |||||||||||||
Total expenses | 507.9 | 508.1 | 1,123.5 | (0.2 | ) | (615.4 | ) | ||||||||||||
Operating income (loss) | 155.6 | 191.2 | (67.2 | ) | (35.6 | ) | 258.4 | ||||||||||||
Investment income | 17.2 | 13.0 | 12.2 | 4.2 | 0.8 | ||||||||||||||
Interest income | 0.4 | 0.2 | 0.2 | 0.2 | — | ||||||||||||||
Interest expense | (11.3 | ) | (3.1 | ) | (50.6 | ) | (8.2 | ) | 47.5 | ||||||||||
Consolidated Funds’ investment gain (loss) | (1.1 | ) | — | 73.2 | (1.1 | ) | (73.2 | ) | |||||||||||
Income (loss) from continuing operations before taxes | 160.8 | 201.3 | (32.2 | ) | (40.5 | ) | 233.5 | ||||||||||||
Income tax expense | 40.8 | 46.6 | 12.8 | (5.8 | ) | 33.8 | |||||||||||||
Income (loss) from continuing operations | 120.0 | 154.7 | (45.0 | ) | (34.7 | ) | 199.7 | ||||||||||||
(Loss) from discontinued operations, net of tax | — | — | (1.1 | ) | — | 1.1 | |||||||||||||
Gain on disposal of discontinued operations, net of tax | 6.2 | 0.8 | 2.3 | 5.4 | (1.5 | ) | |||||||||||||
Net income (loss) | 126.2 | 155.5 | (43.8 | ) | (29.3 | ) | 199.3 | ||||||||||||
Net loss attributable to non-controlling interest | (0.2 | ) | — | (95.5 | ) | (0.2 | ) | 95.5 | |||||||||||
Net income attributable to controlling interests | $ | 126.4 | $ | 155.5 | $ | 51.7 | $ | (29.1 | ) | $ | 103.8 | ||||||||
Basic earnings per share ($)(2) | $ | 1.05 | $ | 1.29 | $ | 0.43 | $ | (0.24 | ) | $ | 0.86 | ||||||||
Diluted earnings per share ($)(2) | 1.05 | 1.29 | 0.43 | (0.24 | ) | 0.86 | |||||||||||||
Weighted average basic shares outstanding (2) | 119.2 | 120.0 | 120.0 | (0.8 | ) | — | |||||||||||||
Weighted average diluted ordinary shares outstanding (2) | 119.5 | 120.5 | 120.0 | (1.0 | ) | 0.5 | |||||||||||||
U.S. GAAP operating margin (3) | 23 | % | 27 | % | (6 | )% | (389) bps | n/m | |||||||||||
(1) | In February 2015, the FASB issued Accounting Standard Update 2015-02, or ASU 2015-02, Consolidation: Amendments to the Consolidation Analysis. We elected to early adopt ASU 2015-02 as of January 1, 2015, which resulted in the de-consolidation of all Funds previously consolidated on our Statement of Operations for the year ended December 31, 2015. We elected to implement ASU 2015-02 using the modified retrospective method and an effective date of adoption of January 1, 2015, which did not require the restatement of prior period results. As of December 31, 2016, following the purchase of seed capital |
76
investments from our Parent in the third quarter of 2016, we consolidated certain Funds pursuant to ASU 2015-02.
(2) | Reflects weighted average pro forma shares outstanding for the year ended December 31, 2014. |
(3) | U.S. GAAP operating margin equals operating income (loss) from continuing operations divided by total revenue. |
The following table reconciles our net income attributable to controlling interests to our pre-tax income from continuing operations attributable to controlling interests:
Years ended December 31, | |||||||||||
($ in millions) | 2016 | 2015 | 2014 | ||||||||
U.S. GAAP Statement of Operations | |||||||||||
Net income attributable to controlling interests | $ | 126.4 | $ | 155.5 | $ | 51.7 | |||||
Exclude: Loss (profit) on discontinued operations attributable to controlling interests | (6.2 | ) | (0.8 | ) | 3.6 | ||||||
Net income from continuing operations attributable to controlling interests | 120.2 | 154.7 | 55.3 | ||||||||
Add: Income tax expense | 40.8 | 46.6 | 12.8 | ||||||||
Pre-tax income from continuing operations attributable to controlling interests | $ | 161.0 | $ | 201.3 | $ | 68.1 | |||||
U.S. GAAP Revenues
Our U.S. GAAP revenues principally consist of:
i. | management fees earned based on our overall weighted average fee rate charged to our clients and the level of assets under management; |
ii. | performance fees earned or management fee adjustments when our Affiliates’ investment performance over agreed time periods for certain clients has differed from pre-determined hurdles; |
iii. | other revenue, consisting primarily of marketing, distribution and joint venture income; and |
iv. | revenue from consolidated Funds, a portion of which is attributable to the holders of non-controlling interests in consolidated Funds. |
Management Fees
Our management fees are a function of the fee rates our Affiliates charge to their clients, which are typically expressed in basis points, and the levels of our assets under management.
Excluding assets managed by our equity-accounted Affiliates, average basis points earned on average assets under management were 34.6 bps for the year ended December 31, 2016, 33.4 bps for the year ended December 31, 2015 and 32.2 bps for the year ended December 31, 2014. The greatest driver of increases or decreases in this average fee rate is changes in the mix of our assets under management caused by net inflows or outflows in certain asset classes or disproportionate market movements. The year ended December 31, 2016 was also positively impacted by the higher yield on alternative assets acquired in the Landmark transaction.
77
Our average basis points by asset class (including both consolidated Affiliates that are included, and equity-accounted Affiliates that are not included in management fee revenue) over each of the periods indicated were:
Years ended December 31, | ||||||||||||||||||||
2016 | 2015 | 2014 | ||||||||||||||||||
($ in millions, except AUM data in billions) | Revenue | Basis Pts | Revenue | Basis Pts | Revenue | Basis Pts | ||||||||||||||
U.S. equity | $ | 198.2 | 25 | $ | 205.4 | 25 | $ | 199.8 | 24 | |||||||||||
Global / non-U.S. equity | 374.1 | 42 | 366.2 | 42 | 335.0 | 42 | ||||||||||||||
Fixed income | 29.1 | 21 | 31.3 | 21 | 31.5 | 22 | ||||||||||||||
Alternatives | 189.0 | 46 | 155.7 | 44 | 134.0 | 42 | ||||||||||||||
Gross management fee revenue & weighted average fee rate on average AUM, including equity-accounted Affiliates | $ | 790.4 | 35.4 | $ | 758.6 | 34.3 | $ | 700.3 | 33.3 | |||||||||||
Less: Revenue from equity-accounted Affiliates | (130.5 | ) | (121.4 | ) | (110.4 | ) | ||||||||||||||
Management fee revenue & weighted average fee rate on average AUM of consolidated Affiliates(1) | $ | 659.9 | 34.6 | $ | 637.2 | 33.4 | $ | 589.9 | 32.2 | |||||||||||
Management fee revenue eliminated upon Funds consolidation(2) | — | — | (20.2 | ) | ||||||||||||||||
U.S. GAAP management fee revenue | $ | 659.9 | $ | 637.2 | $ | 569.7 | ||||||||||||||
Average AUM | $ | 223.1 | $ | 220.9 | $ | 210.3 | ||||||||||||||
Average AUM excluding equity-accounted Affiliates | 190.8 | 191.0 | 183.2 | |||||||||||||||||
(1) | Amounts shown excluding equity-accounted Affiliates are equivalent to ENI management fee revenue. (See “ENI Revenues.”) |
(2) | Statement of operations data presented in accordance with U.S. GAAP include the results of consolidated Funds managed by our Affiliates, where it was determined that these entities were controlled by our Company. The effects of consolidating these entities in 2014 included a reduction in U.S. GAAP management fee revenue of $(20.2) million for the year ended December 31, 2014. There was no elimination adjustment for management fee revenue related to Funds consolidation in the year ended December 31, 2016. There were no Funds consolidated in the year ended December 31, 2015. |
Year ended December 31, 2016 compared to year ended December 31, 2015: Management fees increased $22.7 million, or 3.6%, from $637.2 million for the year ended December 31, 2015 to $659.9 million for the year ended December 31, 2016. The increase was attributable to increases in the weighted average fee rate earned on the average AUM of consolidated Affiliates as discussed below.
Overall, the increase in management fee revenue is reflective of the increases in basis point yields of our assets under management. Excluding equity-accounted Affiliates, the weighted average fee rate earned on our average assets under management was 34.6 basis points in 2016 and 33.4 basis points in 2015, with the increase driven mostly by the mix of flows and market movements in and out of assets with varying fee rates as well as the higher fee-rate assets under management added as a result of the Landmark transaction. Compared to the twelve months ended December 31, 2015, the combined share of higher fee global/non-U.S. equity and alternative assets, excluding equity-accounted Affiliates, increased by approximately 3%, to 53% of average assets, while the mix of U.S. equity and fixed income decreased approximately (3)% to 47% of average assets. Approximately 1.5% of this shift was driven by the addition of Landmark’s $8.8 billion of alternative assets under management, while the remainder of this was due to the impact of market movements and flows.
78
Year ended December 31, 2015 compared to year ended December 31, 2014: Management fees increased $67.5 million, or 11.8%, from $569.7 million for the year ended December 31, 2014 to $637.2 million for the year ended December 31, 2015. Excluding the impact of Funds consolidated prior to January 1, 2015, management fees increased $47.3 million, or 8.0%, from $589.9 million for the year ended December 31, 2014. The increase was primarily attributable to increases in average assets under management excluding equity-accounted Affiliates, which increased 4.3% from $183.2 billion in 2014 to $191.0 billion in 2015. Of the increase in average assets from 2014 to 2015, $4.7 billion was due to the impact of market and other movements from 2014 to 2015, and $3.1 billion was due to 2014 net inflows offset by 2015 net outflows.
Excluding equity-accounted Affiliates, the weighted average fee rate earned on our average assets under management was 33.4 basis points in 2015 and 32.2 basis points in 2014.
Performance Fees
Approximately $49.9 billion, or 24% of our AUM in consolidated Affiliates at December 31, 2016, are in accounts with incentive fee or carried interest features, where OMAM participates in such a fee. Included below is a breakdown of our AUM from consolidated Affiliates, broken out between AUM subject to performance fees or carried interest and that subject only to management fees. Our alternative products subject to performance fees or carried interest earn these performance fees upon exceeding high-water mark performance thresholds or outperforming a hurdle rate. Conversely, the separate accounts/other products, which primarily earn management fees, are potentially subject to performance adjustment up or down based on investment performance versus benchmark. For each of these categories and in total, we have indicated in the table below the ratio of performance fees or carried interest relative to total management fees and performance fees (together, total fees).
AUM of consolidated Affiliates at December 31, 2016 ($ in billions) | Management fees for the twelve months ended December 31, 2016 ($ in millions) | Performance fees for the twelve months ended December 31, 2016 ($ in millions) | ||||||||||||||||||||||||||||||||
Category | Total | AUM of accounts without perfor-mance fees | AUM of accounts with perfor-mance fees | Total | Accounts without perfor-mance fees | Accounts with perfor-mance fees | Total | As a % of total category fees among accounts with perfor-mance fees | As a % of total category fees (among all accounts) | |||||||||||||||||||||||||
Alternative products | $ | 16.9 | $ | 10.6 | * | $ | 6.3 | $ | 69.0 | $ | 31.8 | $ | 37.2 | $ | 4.4 | 10.6 | % | 6.0 | % | |||||||||||||||
Separate accounts/other products | 190.3 | 146.7 | 43.6 | 590.9 | 495.4 | 95.5 | (1.8 | ) | (1.9 | )% | (0.3 | )% | ||||||||||||||||||||||
Total | $ | 207.2 | $ | 157.3 | $ | 49.9 | $ | 659.9 | $ | 527.2 | $ | 132.7 | $ | 2.6 | 1.9 | % | 0.4 | % | ||||||||||||||||
* | Certain legacy Landmark Funds include a carried interest component in which we do not participate and which is not consolidated in our financial results. A majority of the $10.6 billion shown here includes such Funds managed by Landmark and any carried interest earned by these Funds is not attributable to us. |
79
Gross performance fees earned (excluding performance fees at equity-accounted Affiliates) were 0.4% of total fees in 2016, 2.1% of total fees in 2015 (8.8% including the non-recurring performance fee) and 5.5% of total fees in 2014. Performance fees are typically shared with our Affiliate key employees through various contractual compensation and profit-sharing arrangements, as illustrated in the following table:
Years ended December 31, | |||||||||||||||
2015 | |||||||||||||||
($ in millions) | 2016 | Including the non-recurring performance fee | Excluding the non-recurring performance fee | 2014 | |||||||||||
Gross performance fees | $ | 2.6 | $ | 61.8 | $ | 13.7 | $ | 34.3 | |||||||
Net performance fees(1) | $ | 1.8 | $ | 26.7 | $ | 7.6 | $ | 19.9 | |||||||
Percentage of performance fees accruing to OMAM | 69.2 | % | 43.2 | % | 55.5 | % | 58.0 | % | |||||||
Gross performance fees as a percentage of total fees(2) | 0.4 | % | 8.8 | % | 2.1 | % | 5.5 | % | |||||||
(1) | Net performance fees are shown after the effect of contractual variable compensation and distributions to key employees of the Affiliates and represent the amount of the performance fee directly attributable to our shareholders. |
(2) | Total fees, comprised of management fees and performance fees, excluding the effect of consolidated Funds were $662.5 million for the year ended December 31, 2016, $650.9 million (or $699.0 million including the non-recurring performance fee) for the year ended December 31, 2015, and $624.2 million for the year ended December 31, 2014. |
Year ended December 31, 2016 compared to year ended December 31, 2015: Performance fees decreased $(59.2) million, or (95.8)%, from $61.8 million for the year ended December 31, 2015 to $2.6 million for the year ended December 31, 2016. In the second quarter of 2015, we recorded a non-recurring gross performance fee of $48.1 million related to the sale and liquidation of a fund that resulted in a significant gain to the investor from the initial investment. The unique characteristics of this fee, including its size and the exceptional investment performance of the underlying product, is particular to this liquidated fund and it therefore is unrepresentative of our recurring economics. Excluding the non-recurring performance fee received in the second quarter of 2015, performance fees decreased $(11.1) million, or (81.0)% from $13.7 million for the year ended December 31, 2015 to $2.6 million for the year ended December 31, 2016. This decrease is a result of under-performance versus investment benchmarks and management fee adjustments, including net downward performance fee adjustments based on investment performance versus benchmark in separate accounts/other products. Performance fees are variable and are contractually triggered based on investment performance results over agreed upon time periods.
The liquidation of an alternative product may result in the recognition of a performance fee. With respect to liquidations likely to occur in the near term, we do not expect to receive any net performance fees that would be material to our operating results. These projections are based on market conditions and investment performance as of December 31, 2016.
Year ended December 31, 2015 compared to year ended December 31, 2014: Performance fees increased $27.5 million, or 80.2% from $34.3 million for the year ended December 31, 2014 to $61.8 million for the year ended December 31, 2015. Excluding the non-recurring performance fee received in the second quarter of 2015, performance fees decreased $(20.6) million, or (60.1)% from $34.3 million for the year ended December 31, 2014 to $13.7 million for the year ended December 31, 2015. Performance fees are variable and are contractually triggered based on investment performance results over agreed upon time periods.
80
Other Revenue
Year ended December 31, 2016 compared to year ended December 31, 2015: Other revenue increased $0.6 million, or 200.0%, from $0.3 million for the year ended December 31, 2015 to $0.9 million for the year ended December 31, 2016. The increase was primarily due to settlement proceeds received by an Affiliate in 2016.
Year ended December 31, 2015 compared to year ended December 31, 2014: Other revenue decreased $(1.3) million, or (81.3)%, from $1.6 million for the year ended December 31, 2014 to $0.3 million for the year ended December 31, 2015. The decrease was due to the wind-down of a Fund platform, as Global Distribution shifted priorities.
U.S. GAAP Expenses
Our U.S. GAAP expenses principally consist of:
i. | compensation paid to our investment professionals and other employees, including base salary, benefits, sales-based compensation, variable compensation, Affiliate distributions, re-valuation of key employee owned Affiliate equity and profit interests, and the amortization of acquisition-related consideration and pre-acquisition employee equity; |
ii. | general and administrative expenses; |
iii. | amortization of acquired intangible assets; |
iv. | depreciation and amortization charges; and |
v. | expenses of consolidated Funds, the net cost of which is attributable to the holders of non-controlling interests. |
Compensation and Benefits Expense
Our most significant category of expense is compensation and benefits awarded to our and our Affiliates’ employees. The following table presents the components of U.S. GAAP compensation expense for the years ended December 31, 2016, 2015 and 2014:
Years ended December 31, | |||||||||||
($ in millions) | 2016 | 2015 | 2014 | ||||||||
Fixed compensation and benefits(1) | $ | 146.4 | $ | 134.2 | $ | 120.2 | |||||
Sales-based compensation(2) | 17.2 | 19.7 | 15.8 | ||||||||
Compensation related to restructuring expenses(3) | — | 0.6 | 0.5 | ||||||||
Variable compensation(4) | 172.7 | 201.0 | 169.8 | ||||||||
Affiliate key employee distributions(5) | 41.7 | 38.8 | 40.1 | ||||||||
Non-cash Affiliate key employee equity revaluations(6) | (7.1 | ) | 18.5 | 83.0 | |||||||
Acquisition-related consideration and pre-acquisition employee equity(7) | 26.5 | — | — | ||||||||
Total U.S. GAAP compensation and benefits expense | $ | 397.4 | $ | 412.8 | $ | 429.4 | |||||
(1) | Fixed compensation and benefits include base salaries, payroll taxes and the cost of benefit programs provided. |
(2) | Sales-based compensation is paid to our and our Affiliates’ sales and distribution teams and represents compensation earned by our sales professionals, paid over a multi-year period, related to revenue earned on new sales. Its variability is based upon the structure of sales-based compensation due on inflows of assets under management in both current and prior periods. |
81
(3) | Restructuring costs incurred in continuing operations represent an exit from a distinct product or line of business. |
(4) | Variable compensation is contractually set and calculated individually at each Affiliate, plus Center bonuses. Variable compensation is usually awarded based on a contractual percentage of each Affiliate’s ENI profits before variable compensation and may be paid in the form of cash or non-cash Affiliate equity or profit interests. Center variable compensation includes cash and OMAM equity. Non-cash variable compensation awards typically vest over several years and are recognized as compensation expense over that service period. The variable compensation ratio at each Affiliate, calculated as variable compensation divided by ENI earnings before variable compensation, will typically be between 25% and 35%. |
Years ended December 31, | |||||||||||
($ in millions) | 2016 | 2015 | 2014 | ||||||||
Cash variable compensation | $ | 147.5 | $ | 177.2 | $ | 151.4 | |||||
Non-cash equity-based award amortization | 25.2 | 23.8 | 18.4 | ||||||||
Total variable compensation(a) | $ | 172.7 | $ | 201.0 | $ | 169.8 | |||||
(a) | For the year ended December 31, 2015, $174.0 million of variable compensation expense (of the $201.0 million above) is included within economic net income, which excludes the variable compensation attributable to the non-recurring performance fee. |
(5) | Affiliate key employee distributions represent the share of Affiliate profits after variable compensation that is attributable to Affiliate key employee equity and profit interests holders, according to their ownership interests. The Affiliate key employee distribution ratio at each Affiliate is calculated as Affiliate key employee distributions divided by ENI operating earnings at that Affiliate. At certain Affiliates, OMUS is entitled to an initial preference over profits after variable compensation, structured such that before a preference threshold is reached, there would be no required key employee distributions, whereas for profits above the threshold the key employee distribution amount would be calculated based on the key employee ownership percentages, which range from approximately 15% to 40% at our consolidated Affiliates. OMUS’s preference amounted to a total of $121.5 million for the year ended December 31, 2016, $126.2 million for the year ended December 31, 2015 and $128.2 million for the year ended December 31, 2014. The total preference amount changes annually in relation to changes in the relevant Affiliates’ ENI profits after variable compensation, and will be capped once it reaches $145.0 million. |
(6) | Non-cash Affiliate key employee equity revaluations represent changes in the value of Affiliate equity and profit interests held by Affiliate key employees. These ownership interests may in certain circumstances be repurchased by OMUS at a value based on a pre-determined fixed multiple of trailing earnings and as such this value is carried on our balance sheet as a liability. However, any equity or profit interests repurchased by OMUS can be used to fund a portion of future variable compensation awards, resulting in savings in cash variable compensation that offset the negative cash effect of repurchasing the equity. Our Affiliate equity and profit interest plans have been designed to ensure OMUS is not required to repurchase more equity than we can reasonably recycle through variable compensation awards in any given twelve month period. OMUS may also choose to retain repurchased Affiliate equity or profit interests, entitling us to an additional share of future Affiliate earnings that represents an unrecognized economic asset to us. |
(7) | Acquisition-related consideration and pre-acquisition employee equity represents the amortization of acquisition-related contingent consideration created as a result of the Landmark transaction. It also includes the value of employee equity owned pre-acquisition. These items have been included in U.S. GAAP compensation expense as a result of ongoing service requirements for employee recipients. |
82
Fluctuations in compensation and benefits expense for the periods presented are discussed below.
Year ended December 31, 2016 compared to year ended December 31, 2015: Compensation and benefits expense decreased $(15.4) million, or (3.7)%, from $412.8 million for the year ended December 31, 2015 to $397.4 million for the year ended December 31, 2016. Fixed compensation and benefits increased $12.2 million, or 9.1%, from $134.2 million for the year ended December 31, 2015 to $146.4 million for the year ended December 31, 2016. This increase reflects the effect of the Landmark acquisition as well as new hires and annual cost of living increases. Variable compensation decreased $(28.3) million, or (14.1)%, from $201.0 million for the year ended December 31, 2015 to $172.7 million for the year ended December 31, 2016 primarily due to the variable compensation associated with the non-recurring performance fee in 2015. Variable compensation excluding the non-recurring performance fee decreased $(1.3) million, or (0.7)%, from $174.0 million for the year ended December 31, 2015 to $172.7 million for the year ended December 31, 2016, which was attributable to lower pre-variable compensation earnings exclusive of the 2015 non-recurring performance fee, partially offset by the positive earnings impact of Landmark. Sales-based compensation decreased $(2.5) million, or (12.7)%, from $19.7 million for the year ended December 31, 2015 to $17.2 million for the year ended December 31, 2016, as a result of the timing and structure of sales-based compensation due. Affiliate key employee distributions increased $2.9 million, or 7.5%, from $38.8 million for the year ended December 31, 2015 to $41.7 million for the year ended December 31, 2016 primarily as a result of the Landmark transaction (as Landmark employees own 40% of their business), offset by lower earnings before Affiliate key employee distributions. Revaluations of Affiliate equity decreased $(25.6) million, reflecting formulaic revaluations of key employee ownership at certain Affiliates, as the value of Affiliate equity increased $18.5 million for the year ended December 31, 2015 and decreased $(7.1) million for the year ended December 31, 2016. Acquisition-related consideration and pre-acquisition equity was $26.5 million for the year ended December 31, 2016 and represents amortization of the value of contingent consideration and employee-owned equity, related to Landmark, recorded as compensation under U.S. GAAP due to certain service requirements associated with the arrangements.
Year ended December 31, 2015 compared to year ended December 31, 2014: Compensation and benefits expense decreased $(16.6) million, or (3.9)%, from $429.4 million for the year ended December 31, 2014 to $412.8 million for the year ended December 31, 2015. Fixed compensation and benefits increased $14.0 million, or 11.6%, from $120.2 million for the year ended December 31, 2014 to $134.2 million for the year ended December 31, 2015. This reflects increases in head count at certain Affiliates, as well as annual increases in base salaries, wages and benefits. The twelve months ended December 31, 2015 also include $0.9 million of fixed compensation related to being a public company. Variable compensation increased $31.2 million, or 18.4%, from $169.8 million for the year ended December 31, 2014 to $201.0 million for the year ended December 31, 2015, primarily driven by higher pre-variable compensation earnings, including the earnings from the non-recurring performance fee. Variable compensation excluding the non-recurring performance fee increased $4.2 million, or 2.5%, to $174.0 million for the year ended December 31, 2015. Public company-related variable compensation of $3.2 million for the twelve months ended December 31, 2015 reflects the impact of new hires and our 2015 – 2017 long-term incentive plan. Sales-based compensation increased $3.9 million, or 24.7%, from $15.8 million for the year ended December 31, 2014 to $19.7 million for the year ended December 31, 2015, as a result of the timing and structure of sales-based compensation due and higher management fee rates earned on asset inflows in current and prior periods. Affiliate key employee distributions decreased $(1.3) million, or (3.2)%, from $40.1 million for the year ended December 31, 2014 to $38.8 million for the year ended December 31, 2015 as a result of the mix and level of performance fee revenue and Affiliate profit as well as the repurchase of additional equity at an Affiliate in October 2014. Revaluations of Affiliate equity decreased $(64.5) million to $18.5 million, reflecting formulaic revaluations of key employee ownership at certain Affiliates along with $31.6 million of revaluation of Affiliate equity in 2014 related to the repurchase of additional equity at an Affiliate that did not recur in 2015.
83
General and Administrative Expense
Year ended December 31, 2016 compared to year ended December 31, 2015: General and administrative expense increased $10.1 million, or 11.5%, from $88.2 million for the year ended December 31, 2015 to $98.3 million for the year ended December 31, 2016, driven by systems costs, new initiatives and the impact of Landmark.
Year ended December 31, 2015 compared to year ended December 31, 2014: General and administrative expense increased $4.3 million, or 5.1%, from $83.9 million for the year ended December 31, 2014 to $88.2 million for the year ended December 31, 2015. Increases in general and administrative expenses were primarily attributable to incremental public company costs incurred following the Offering, which rose to $5.9 million for the year ended December 31, 2015 from $1.9 million for the year ended December 31, 2014, a year in which we were a public company for less than one quarter.
Amortization of Acquired Intangibles Expense
Year ended December 31, 2016 compared to year ended December 31, 2015: Amortization of acquired intangibles expense increased from $0.2 million for the year ended December 31, 2015 to $2.6 million for the year ended December 31, 2016. Upon acquiring Landmark, the Company recorded $85.0 million of definite-lived intangible assets, the amortization of which is reflected in the 2016 activity.
Year ended December 31, 2015 compared to year ended December 31, 2014: Amortization of acquired intangibles expense increased from $0.1 million for the year ended December 31, 2014 to $0.2 million for the year ended December 31, 2015 primarily due to an Affiliate’s purchase of a joint venture.
Depreciation and Amortization Expense
Year ended December 31, 2016 compared to year ended December 31, 2015: Depreciation and amortization expense increased $2.5 million, or 36.2%, from $6.9 million for the year ended December 31, 2015 to $9.4 million for the year ended December 31, 2016. The increase was primarily related to additional fixed asset and technology investments in the business in 2016, as well as an office move at an Affiliate.
Year ended December 31, 2015 compared to year ended December 31, 2014: Depreciation and amortization expense increased $0.8 million, or 13.1%, from $6.1 million for the year ended December 31, 2014 to $6.9 million for the year ended December 31, 2015. The increase was primarily related to the purchase of new fixed assets in 2014, along with higher amortization of leasehold improvements.
84
U.S. GAAP Other Non-Operating Items of Income and Expense
Other non-operating items of income and expense consist of:
i. | investment income; |
ii. | interest income; and |
iii. | interest expense. |
Investment Income
Year ended December 31, 2016 compared to year ended December 31, 2015: Investment income increased $4.2 million, or 32.3%, from $13.0 million for the year ended December 31, 2015 to $17.2 million for the year ended December 31, 2016, primarily due to higher earnings at our equity-accounted Affiliates which increased $2.4 million, or 18.9%, from $12.7 million for the year ended December 31, 2015 to $15.1 million for the year ended December 31, 2016, combined with higher returns on co-investments and seed capital investments following the purchase of approximately $40 million in seed capital from our Parent in September 2016.
Year ended December 31, 2015 compared to year ended December 31, 2014: Investment income increased $0.8 million, or 6.6%, from $12.2 million for the year ended December 31, 2014 to $13.0 million for the year ended December 31, 2015, primarily due to higher earnings on equity-accounted Affiliates which increased $3.1 million, or 32.3%, from $9.6 million for the year ended December 31, 2014 to $12.7 million for the year ended December 31, 2015, partially offset by returns on co-investments for the year ended December 31, 2014 not recurring in 2015 due to their having been wholly allocated to our Parent following the Offering.
Interest Income
Year ended December 31, 2016 compared to year ended December 31, 2015: Interest income increased $0.2 million, or 100.0%, from $0.2 million for the year ended December 31, 2015 to $0.4 million for the year ended December 31, 2016, principally due to higher average cash balances in a portion of year.
Year ended December 31, 2015 compared to year ended December 31, 2014: Interest income was unchanged at $0.2 million for the year ended December 31, 2015 and for the year ended December 31, 2014.
Interest Expense
Year ended December 31, 2016 compared to year ended December 31, 2015: Interest expense increased $8.2 million, or 264.5%, from $3.1 million for the year ended December 31, 2015 to $11.3 million for the year ended December 31, 2016, reflecting the issuance of $400 million in long-term bonds in July 2016.
Year ended December 31, 2015 compared to year ended December 31, 2014: Interest expense decreased $(47.5) million, or (93.9)%, from $50.6 million for the year ended December 31, 2014 to $3.1 million for the year ended December 31, 2015. Interest expense in 2014 was attributable to long-term debt owed to our Parent. As a part of our Reorganization prior to the Offering, our Parent made a capital contribution consisting of our entire debt to our Parent, thereby eliminating the corresponding interest expense. Interest expense for the year ended December 31, 2015 of $3.1 million primarily relates to our third party credit facility.
U.S. GAAP Income Tax Expense
Our effective tax rate has been impacted primarily by changes in reserves for uncertain tax positions, decreases in the valuation allowance for deferred tax assets, the mix of income earned in the United States versus lower-taxed foreign jurisdictions and benefits from intercompany financing arrangements. Our effective tax rate could be impacted in the future by these items as well as changes in tax laws and regulations in jurisdictions in which we operate.
85
Year ended December 31, 2016 compared to year ended December 31, 2015: Income tax expense decreased $(5.8) million, or (12.4)%, from $46.6 million for the year ended December 31, 2015 to $40.8 million for the year ended December 31, 2016. The decrease relates primarily to decreases in income from continuing operations before tax. This decrease was offset by benefits recognized in 2015 which did not recur in 2016 relating to valuation allowance adjustments and changes in state tax laws. In 2015 we released our valuation allowance for foreign tax credits resulting from amending income tax returns for 2009 through 2014.
Year ended December 31, 2015 compared to year ended December 31, 2014: Income tax expense increased $33.8 million, or 264.1%, from $12.8 million for the year ended December 31, 2014 to $46.6 million for the year ended December 31, 2015. The increase was primarily due to increases in income from continuing operations before tax, partially offset by an increase in tax benefits attributable to intercompany financing arrangements. These intercompany financing arrangements originated in connection with the Reorganization prior to the Offering, therefore we benefited from these arrangements for only a limited period in 2014 versus a full year for 2015.
U.S. GAAP Consolidated Funds
As discussed further in Note 2 of our accompanying Consolidated Financial Statements, in the first quarter of 2015 we elected to adopt the provisions of ASU 2015-02 with an effective date of January 1, 2015 using the modified retrospective method, which resulted in the de-consolidation of all Funds previously consolidated as of December 31, 2014. For the year ended December 31, 2015, there were no Funds which required consolidation pursuant to ASU 2015-02. Following the purchase of certain seed capital investments in the third quarter of 2016, we consolidated certain Funds pursuant to ASU 2015-02.
For periods prior to January 1, 2015, revenue from consolidated Funds related primarily to sales of timber in consolidated Funds, while expenses from consolidated Funds represented the cost of those sales and third-party financing costs associated with the timber assets acquired by those Funds. Timber assets were carried at cost and prior to the liquidation of the timber Fund assets, the costs of growing the timber often outweighed the periodic revenues, resulting in a net operating loss under U.S. GAAP. The entire net income or loss of all consolidated Funds, excluding any income or loss attributable to co-investments we made in the Funds, was included in non-controlling interest in our Consolidated Financial Statements and was not included in the net income (loss) attributable to controlling interests or in management fees.
Year ended December 31, 2016 compared to year ended December 31, 2015: As noted above, there were no gains or losses recorded in 2015 due to the de-consolidation of all Funds. Funds consolidation for the year ended December 31, 2016 reflected consolidated Funds revenue of $0.1 million, consolidated Funds expense of $0.2 million and consolidated Funds investment gain (loss) of $(1.1) million. There was no income or loss attributable to non-controlling interests of consolidated Funds in the year ended December 31, 2015.
Year ended December 31, 2015 compared to year ended December 31, 2014: As noted above, there were no gains or losses recorded in 2015 due to the de-consolidation of all Funds. Amounts attributable to controlling interests were gains of $20.1 million for the year ended December 31, 2014, primarily representing management fees earned.
Discontinued Operations
In the second quarter of 2014, we transferred a former Affiliate, Rogge Global Partners plc, to our Parent and have accordingly presented its results within discontinued operations. Gains on disposal in 2015 and 2016 represents additional proceeds received, net of tax, for previously disposed-of lines of business.
Year ended December 31, 2016 compared to year ended December 31, 2015: Gain (loss) on disposal, net of tax increased $5.4 million, from a gain on disposal of $0.8 million for the year ended December 31, 2015 to a gain on disposal of $6.2 million for the year ended December 31, 2016. In 2016, the management team of a previously disposed Affiliate, together with subsidiaries of ours holding interests in that Affiliate, entered into a purchase and sale agreement with a third party, which resulted in a $7.4 million payment to us, or $5.1 million, net of tax. The remaining gain on disposal in 2016 represents residual amounts received from previously discontinued operations.
86
Year ended December 31, 2015 compared to year ended December 31, 2014: The result from discontinued operations increased $1.1 million, from a loss of $(1.1) million, net of tax, for the year ended December 31, 2014 to $0.0 million for the year ended December 31, 2015. Gain (loss) on disposal decreased $(1.5) million, from a gain on disposal of $2.3 million for the year ended December 31, 2014 to a gain on disposal of $0.8 million for the year ended December 31, 2015, in each case net of tax, representing the excess of disposal proceeds received over the carrying amount of net assets disposed of, and incremental costs of disposal in each period.
Key U.S. GAAP Operating Metrics
The following table shows our key U.S. GAAP operating metrics for the years ended December 31, 2016, 2015 and 2014. As discussed further in Note 2 of our accompanying Consolidated Financial Statements, in the first quarter of 2015 we elected to adopt the provisions of ASU 2015-02 with an effective date of January 1, 2015 using the modified retrospective method, which resulted in the de-consolidation of all Funds previously consolidated as of December 31, 2014. In the third quarter of 2016, following the purchase of certain seed capital investments from our Parent, we consolidated certain Funds pursuant to ASU 2015-02. The second, third and fourth metrics below have each been adjusted to eliminate the effect of consolidated Funds to make each of the years presented comparable.
Years ended December 31, | |||||||||||
($ in millions) | 2016 | 2015 | 2014 | ||||||||
Numerator: Operating income (loss) | $ | 155.6 | $ | 191.2 | $ | (67.2 | ) | ||||
Denominator: Total revenue | $ | 663.5 | $ | 699.3 | $ | 1,056.3 | |||||
U.S. GAAP operating margin(1) | 23.5 | % | 27.3 | % | (6.4 | )% | |||||
Numerator: Total operating expenses(2) | $ | 507.7 | $ | 508.1 | $ | 519.5 | |||||
Denominator: Management fee revenue(3) | $ | 659.9 | $ | 637.2 | $ | 589.9 | |||||
U.S. GAAP operating expense / management fee revenue(4) | 76.9 | % | 79.7 | % | 88.1 | % | |||||
Numerator: Variable compensation | $ | 172.7 | $ | 201.0 | $ | 169.8 | |||||
Denominator: Operating income before variable compensation and Affiliate key employee distributions(2)(3)(5)(6) | $ | 370.1 | $ | 431.0 | $ | 316.2 | |||||
U.S. GAAP variable compensation ratio(4) | 46.7 | % | 46.6 | % | 53.7 | % | |||||
Numerator: Affiliate key employee distributions | $ | 41.7 | $ | 38.8 | $ | 40.1 | |||||
Denominator: Operating income before Affiliate key employee distributions(2)(3)(5)(6) | $ | 197.4 | $ | 230.0 | $ | 146.4 | |||||
U.S. GAAP Affiliate key employee distributions ratio(4) | 21.1 | % | 16.9 | % | 27.4 | % | |||||
(1) | Excluding the effect of Funds consolidation in the applicable periods, the U.S. GAAP operating margin would be 23.5% for the year ended December 31, 2016, 27.3% for the year ended December 31, 2015, and 17.0% for the year ended December 31, 2014. |
(2) | Excludes consolidated Funds expense of $0.2 million for the year ended December 31, 2016 and $604.0 million for the year ended December 31, 2014. |
(3) | Includes management fees eliminated as a result of Funds consolidation, amounting to $0.0 million for the year ended December 31, 2016 and $20.2 million for the year ended December 31, 2014. |
(4) | Excludes the effect of Funds consolidation for the years ended December 31, 2016 and 2014. |
(5) | Excludes consolidated Funds revenue of $0.1 million for the year ended December 31, 2016 and $450.7 million for the year ended December 31, 2014. |
87
(6) | The following table identifies the components of operating income before variable compensation and Affiliate key employee distributions, as well as operating income before Affiliate key employee distributions: |
Years ended December 31, | |||||||||||
($ in millions) | 2016 | 2015 | 2014 | ||||||||
Operating income (loss) | $ | 155.6 | $ | 191.2 | $ | (67.2 | ) | ||||
Affiliate key employee distributions | 41.7 | 38.8 | 40.1 | ||||||||
Net effect of Funds consolidation | 0.1 | — | 173.5 | ||||||||
Operating income before Affiliate key employee distributions | $ | 197.4 | $ | 230.0 | $ | 146.4 | |||||
Variable compensation | 172.7 | 201.0 | 169.8 | ||||||||
Operating income before variable compensation and Affiliate key employee distributions | $ | 370.1 | $ | 431.0 | $ | 316.2 | |||||
Effects of Inflation
For the years ended December 31, 2016, 2015, and 2014, inflation did not have a material effect on our consolidated results of operations.
Non-GAAP Supplemental Performance Measure—Economic Net Income
As supplemental information, we provide a non-GAAP performance measure that we refer to as economic net income, or ENI, which represents our management’s view of the underlying economic earnings generated by us. We define economic net income as ENI revenue less (i) ENI operating expenses, (ii) variable compensation, (iii) key employee distributions, (iv) net interest and (v) taxes, each as further discussed in this section. ENI adjustments to U.S. GAAP include both reclassifications of U.S. GAAP revenue and expense items, as well as adjustments to U.S. GAAP results, primarily to exclude non-cash, non-economic expenses, or to reflect cash benefits not recognized under U.S. GAAP.
ENI is an important measure to investors because it is used by the Company to make resource allocation decisions, determine appropriate levels of investment or dividend payout, manage balance sheet leverage, determine Affiliate variable compensation and equity distributions, and incentivize management. It is also an important measure because it assists management in evaluating our operating performance and is presented in a way that most closely reflects the key elements of our profit share operating model with our Affiliates. For a further discussion of how we use ENI and why ENI is useful to investors, see “—Overview—How We Measure Performance.” In 2016 we made the following refinements to our definition of economic net income undertaken in light of transactions which closed in the third quarter. Items (iv) and (v) reflect the breakout of line items which have always been part of our definition of ENI that have now become more meaningful in light of our purchase of seed capital from our Parent on September 15, 2016 and the acquisition of Landmark Partners as of August 18, 2016. We have also added additional explanatory language to item (ii) in light of the treatment of a portion of the purchase price and non-controlling interests from Landmark Partners as compensation for U.S. GAAP purposes.
To calculate economic net income, we re-categorize certain line items on our Statement of Operations to reflect the following:
• | We exclude the effect of Funds consolidation by removing the portion of Fund revenues, expenses and investment return which were not attributable to our shareholders. |
• | We include within management fee revenue any fees paid to Affiliates by consolidated Funds, which are viewed as investment income under U.S. GAAP. |
• | We include our share of earnings from equity-accounted Affiliates within other income in ENI revenue, rather than investment income. |
88
• | We treat sales-based compensation as a general and administrative expense, rather than part of fixed compensation and benefits. |
• | We identify separately from operating expenses variable compensation and Affiliate key employee distributions, which represent Affiliate earnings shared with Affiliate key employees. |
To reflect the Reorganization which took place at the time of the Offering, we have excluded:
• | notional corporate cost allocations which are non-cash expenses that have not recurred following the Offering; |
• | interest expense historically paid to our Parent, as the related debt was restructured in connection with the Offering and thereafter has been eliminated from our consolidated results; and |
• | historic mark-to-market co-investment gains and losses, because these investments and ongoing returns thereon have been allocated wholly to OMGUK. |
We also make the following adjustments to U.S. GAAP results to more closely reflect our economic results:
i. | We exclude non-cash expenses representing changes in the value of Affiliate equity and profit interests held by Affiliate key employees. These ownerships interests may in certain circumstances be repurchased by OMUS at a value based on a pre-determined fixed multiple of trailing earnings and as such this value is carried on our balance sheet as a liability. Non-cash movements in the value of this liability are treated as compensation expense under U.S. GAAP. However, any equity or profit interests repurchased by OMUS can be used to fund a portion of future variable compensation awards, resulting in savings in cash variable compensation that offset the negative cash effect of repurchasing the equity. Our Affiliate equity and profit interest plans have been designed to ensure OMUS is never required to repurchase more equity than we can reasonably recycle through variable compensation awards in any given twelve month period. OMUS may also choose to retain repurchased Affiliate equity or profit interests, entitling us to an additional share of future Affiliate earnings that represents an unrecognized economic asset to us. |
ii. | We exclude non-cash amortization or impairment expenses related to acquired goodwill and other intangibles as these are non-cash charges that do not result in an outflow of tangible economic benefits from the business. We also exclude the amortization of acquisition-related contingent consideration, as well as the value of employee equity owned pre-acquisition, as occurred as a result of the Landmark transaction, where such items have been included in compensation expense as a result of ongoing service requirements for certain employees. |
iii. | We exclude capital transaction costs, including the costs of raising debt or equity, gains or losses realized as a result of redeeming debt or equity and direct incremental costs associated with acquisitions of businesses or assets. |
iv. | We exclude seed capital and co-investment gains, losses and related financing costs. The net returns on these investments are considered and presented separately from ENI because ENI is primarily a measure of our earnings from managing client assets, which therefore differs from earnings generated by our investments in Affiliate products, which can be variable from period to period. |
v. | We include cash tax benefits associated with deductions allowed for acquired intangibles and goodwill that may not be recognized or have timing differences compared to U.S. GAAP. |
vi. | We exclude the results of discontinued operations attributable to controlling interests since they are not part of our ongoing business, and restructuring costs incurred in continuing operations which represent an exit from a distinct product or line of business. |
vii. | We exclude deferred tax resulting from changes in tax law and expiration of statutes, adjustments for uncertain tax positions, deferred tax attributable to intangible assets and other unusual items not related to current operating results to reflect ENI tax normalization. |
We also adjust our income tax expense to reflect any tax impact of our ENI adjustments.
89
Reconciliation of U.S. GAAP Net Income to Economic Net Income for the Years Ended December 31, 2016, 2015 and 2014
The following table reconciles net income attributable to controlling interests to economic net income for the years ended December 31, 2016, 2015 and 2014:
Years ended December 31, | |||||||||||||
($ in millions) | 2016 | 2015 | 2014 | ||||||||||
U.S. GAAP net income attributable to controlling interests | $ | 126.4 | $ | 155.5 | $ | 51.7 | |||||||
Adjustments related to restructuring and reorganization actions undertaken in connection with our initial public offering | — | — | 50.6 | ||||||||||
Adjustments to reflect the economic earnings of the Company: | |||||||||||||
i. | Non-cash key employee-owned equity and profit interest revaluations | (7.1 | ) | 18.5 | 83.0 | (1) | |||||||
ii. | Amortization of acquired intangible assets, acquisition-related consideration and pre-acquisition employee equity | 29.1 | 0.2 | 0.1 | |||||||||
iii. | Capital transaction costs | 6.4 | 2.3 | — | |||||||||
iv. | Seed/Co-investment (gains) losses and financings(2) | 1.4 | (0.3 | ) | — | ||||||||
v. | Tax benefit of goodwill and acquired intangibles deductions | 5.0 | 2.5 | 1.2 | |||||||||
vi. | Discontinued operations and restructuring | (6.2 | ) | (0.2 | ) | 5.8 | |||||||
vii. | ENI tax normalization | 2.1 | (8.8 | ) | (7.9 | ) | |||||||
Tax effect of above adjustments(3) | (12.0 | ) | (8.6 | ) | (33.2 | ) | |||||||
Economic net income (including the non-recurring performance fee) | 145.1 | 161.1 | 151.3 | ||||||||||
Non-recurring performance fee, net(4) | — | (11.4 | ) | — | |||||||||
Economic net income, excluding the non-recurring performance fee | $ | 145.1 | $ | 149.7 | $ | 151.3 | |||||||
(1) | Includes $31.6 million related to the purchase of additional ownership interests in an Affiliate. |
(2) | The net return on seed/co-investment (gains) losses and financings for the twelve months ended December 31, 2016, 2015, and 2014 is shown in the following table (in millions). |
Years ended December 31, | |||||||||||
2016 | 2015 | 2014 (b) | |||||||||
Seed/Co-investment (gains) losses | $ | (1.1 | ) | $ | (0.3 | ) | $ | — | |||
Financing costs: | |||||||||||
Seed/Co-investment average balance | 64.4 | 12.3 | — | ||||||||
Blended interest rate(a) | 3.9 | % | 1.5 | % | — | % | |||||
Financing costs | 2.5 | — | — | ||||||||
Net seed/co-investment (gains) losses and financing | $ | 1.4 | $ | (0.3 | ) | $ | — | ||||
(a) | Prior to the July 2016 bond issuances, the blended interest rate was based on the interest rate on our revolving credit facility. Subsequent to the 2016 bond issuance, and going forward, the blended rate is based on the weighted average rate of our long-term bonds, unless there is alternative funding directly allocated to the seed capital. |
(b) | All co-investments in 2014 were subject to the Co-Investment Deed in place with our Parent. Any (gains) losses on these investments in 2014 were provided to the Parent and therefore not reflected on our Statement of Operations. Refer to Note 10, Related Parties, in our accompanying Consolidated Financial Statements for additional information. |
90
(3) | Reflects the sum of line items i, ii, iii, iv and the restructuring portion of line item vi taxed at the 40.2% U.S. statutory rate (including state tax). The restructuring portion of line item vi amounted to $0.0 million for the year ended December 31, 2016, $0.5 million for the year ended December 31, 2015 and $2.3 million for the year ended December 31, 2014. |
(4) | In the second quarter of 2015, we recorded a non-recurring gross performance fee of $48.1 million. The $11.4 million represents the net amount accruing to OMAM after Affiliate contractual variable compensation, other directly related expenses, and the tax effect of the non-recurring performance fee calculated using a 40.2% tax rate. |
Limitations of Economic Net Income
Economic net income is the key measure our management uses to evaluate the financial performance of, and make operational decisions for, our business. Economic net income is not audited, and is not a substitute for net income or other performance measures that are derived in accordance with U.S. GAAP. Furthermore, our calculation of economic net income may differ from similarly titled measures provided by other companies.
Because the calculation of economic net income excludes certain ongoing expenses, including amortization expense and certain compensation costs, it has certain material limitations and should not be viewed in isolation or as a substitute for U.S. GAAP measures of earnings.
ENI Revenues
The following table reconciles U.S. GAAP Revenue to ENI Revenue for the years ended December 31, 2016, 2015 and 2014:
Years ended December 31, | |||||||||||
($ in millions) | 2016 | 2015 | 2014 | ||||||||
U.S. GAAP Revenue | $ | 663.5 | $ | 699.3 | $ | 1,056.3 | |||||
Include investment return on equity-accounted Affiliates | 15.1 | 12.7 | 9.6 | ||||||||
Exclude the non-recurring performance fee | — | (48.1 | ) | — | |||||||
Exclude revenue from consolidated Funds attributable to non-controlling interests | (0.1 | ) | — | (430.5 | ) | ||||||
ENI Revenue | $ | 678.5 | $ | 663.9 | $ | 635.4 | |||||
91
The following table identifies the components of ENI revenue:
Years ended December 31, | |||||||||||
($ in millions) | 2016 | 2015 | 2014 | ||||||||
Management fees(1) | $ | 659.9 | $ | 637.2 | $ | 589.9 | |||||
Performance fees (excluding the non-recurring performance fee)(2) | 2.6 | 13.7 | 34.3 | ||||||||
Other income, including equity-accounted Affiliates(3) | 16.0 | 13.0 | 11.2 | ||||||||
ENI Revenue | $ | 678.5 | $ | 663.9 | $ | 635.4 | |||||
(1) | ENI management fees correspond to U.S. GAAP management fees, adjusted by reversing the U.S. GAAP Funds consolidation eliminations of $0.0 million for the years ended December 31, 2015 and December 31, 2016, and $20.2 million for the year ended December 31, 2014. We reverse the effect of Funds consolidation in order to isolate the economics attributable to our shareholders. |
Years ended December 31, | |||||||||||
($ in millions) | 2016 | 2015 | 2014 | ||||||||
U.S. GAAP management fees | $ | 659.9 | $ | 637.2 | $ | 569.7 | |||||
Add back: revenue eliminated upon Funds consolidation | — | — | 20.2 | ||||||||
ENI management fees | $ | 659.9 | $ | 637.2 | $ | 589.9 | |||||
(2) | In the second quarter of 2015, we recorded a non-recurring performance fee of $48.1 million ($11.4 million, net of associated expenses and taxes). Unless explicitly noted, the ENI revenue, ENI expenses, and ENI key metrics for the year ended December 31, 2015 exclude the impact of the non-recurring performance fee. While all performance fees fall within OMAM’s definition of economic net income, we believe that the unique characteristics of this fee, including its size and the extraordinary investment performance of the underlying product, make it unrepresentative of our recurring economics and we have therefore removed it from our presentation of ENI revenue. |
Years ended December 31, | |||||||||||
($ in millions) | 2016 | 2015 | 2014 | ||||||||
U.S. GAAP performance fees | $ | 2.6 | $ | 61.8 | $ | 34.3 | |||||
Less: non-recurring performance fee | — | (48.1 | ) | — | |||||||
ENI performance fees | $ | 2.6 | $ | 13.7 | $ | 34.3 | |||||
(3) | ENI other income is comprised of other revenue under U.S. GAAP, plus our earnings from equity-accounted Affiliates of $15.1 million for the year ended December 31, 2016, $12.7 million for the year ended December 31, 2015 and $9.6 million for the year ended December 31, 2014. |
Years ended December 31, | |||||||||||
($ in millions) | 2016 | 2015 | 2014 | ||||||||
U.S. GAAP other revenue | $ | 0.9 | $ | 0.3 | $ | 1.6 | |||||
Income from equity-accounted Affiliates | 15.1 | 12.7 | 9.6 | ||||||||
ENI other income | $ | 16.0 | $ | 13.0 | $ | 11.2 | |||||
92
ENI Operating Expenses
The largest difference between U.S. GAAP operating expense and ENI operating expense (excluding the impact of Funds consolidation) relates to compensation. As shown in the following reconciliation, the Company excludes the impact of key employee equity revaluations. We also exclude the amortization of contingent purchase price and pre-acquisition equity owned by employees, both with a service requirement, associated with the Landmark acquisition. Variable compensation and Affiliate key employee distributions are also segregated out of U.S. GAAP operating expense in order to align with the manner in which these items are contractually calculated at the Affiliate level.
The following table reconciles U.S. GAAP operating expense to ENI operating expense for the years ended December 31, 2016, 2015 and 2014:
Years ended December 31, | |||||||||||
($ in millions) | 2016 | 2015 | 2014 | ||||||||
U.S. GAAP operating expense | $ | 507.9 | $ | 508.1 | $ | 1,123.5 | |||||
Less: items excluded from economic net income | |||||||||||
Acquisition-related consideration and pre-acquisition employee equity | (26.5 | ) | — | — | |||||||
Non-cash Affiliate key employee equity and profit interest revaluations | 7.1 | (18.5 | ) | (83.0 | ) | ||||||
Amortization of acquired intangible assets | (2.6 | ) | (0.2 | ) | (0.1 | ) | |||||
Pre-IPO non-cash notional Parent corporate cost allocation | — | — | (3.4 | ) | |||||||
Other items excluded from ENI(1) | (6.3 | ) | (4.4 | ) | (2.2 | ) | |||||
Funds’ operating expenses | (0.2 | ) | — | (604.0 | ) | ||||||
Less: items segregated out of U.S. GAAP operating expense | |||||||||||
Variable compensation(2) | (172.7 | ) | (201.0 | ) | (169.8 | ) | |||||
Affiliate key employee distributions | (41.7 | ) | (38.8 | ) | (40.1 | ) | |||||
ENI operating expense | $ | 265.0 | $ | 245.2 | $ | 220.9 | |||||
(1) | Other items include capital transaction costs, restructuring expenses and expenses (excluding variable compensation) associated with the non-recurring performance fee in 2015. |
(2) | For the year ended December 31, 2015, $174.0 million of variable compensation expense (of the $201.0 million above) is included within economic net income, which excludes the revenue and the variable compensation attributable to the non-recurring performance fee. |
93
The following table identifies the components of ENI operating expense:
Years ended December 31, | |||||||||||
($ in millions) | 2016 | 2015 | 2014 | ||||||||
Fixed compensation & benefits(1) | $ | 146.4 | $ | 133.2 | $ | 120.2 | |||||
General and administrative expenses(2) | 109.2 | 105.1 | 94.6 | ||||||||
Depreciation and amortization | 9.4 | 6.9 | 6.1 | ||||||||
ENI operating expense | $ | 265.0 | $ | 245.2 | $ | 220.9 | |||||
(1) | Fixed compensation and benefits include base salaries, payroll taxes and the cost of benefit programs provided. The following table reconciles U.S. GAAP compensation expense for the years ended December 31, 2016, 2015 and 2014 to ENI fixed compensation and benefits expense: |
Years ended December 31, | |||||||||||
($ in millions) | 2016 | 2015 | 2014 | ||||||||
Total U.S. GAAP compensation expense | $ | 397.4 | $ | 412.8 | $ | 429.4 | |||||
Acquisition-related consideration and pre-acquisition employee equity | (26.5 | ) | — | — | |||||||
Non-cash Affiliate key employee equity revaluations excluded from ENI | 7.1 | (18.5 | ) | (83.0 | ) | ||||||
Sales-based compensation reclassified to ENI general & administrative expenses | (17.2 | ) | (19.7 | ) | (15.8 | ) | |||||
Affiliate key employee distributions | (41.7 | ) | (38.8 | ) | (40.1 | ) | |||||
Variable compensation(a) | (172.7 | ) | (201.0 | ) | (169.8 | ) | |||||
Other adjustments(b) | — | (1.6 | ) | (0.5 | ) | ||||||
ENI fixed compensation and benefits | $ | 146.4 | $ | 133.2 | $ | 120.2 | |||||
(a) | For the year ended December 31, 2015, $174.0 million of variable compensation expense (of the $201.0 million above) is included within economic net income, which excludes the revenue and the variable compensation attributable to the non-recurring performance fee. |
(b) | Includes compensation related to restructuring expenses and fixed compensation and benefits associated with the non-recurring performance fee in 2015. |
94
(2) | The following table reconciles U.S. GAAP general and administrative expense to ENI general and administrative expense: |
Years ended December 31, | |||||||||||
($ in millions) | 2016 | 2015 | 2014 | ||||||||
U.S. GAAP general and administrative expense | $ | 98.3 | $ | 88.2 | $ | 83.9 | |||||
Sales-based compensation | 17.2 | 19.7 | 15.8 | ||||||||
Additional ENI adjustments(a) | (6.3 | ) | (2.8 | ) | (5.1 | ) | |||||
ENI general and administrative expense | $ | 109.2 | $ | 105.1 | $ | 94.6 | |||||
(a) | Additional ENI adjustments include capital transaction costs and expenses (excluding compensation) associated with the non-recurring performance fee in 2015. |
Key Non-GAAP Operating Metrics
The following table shows our key non-GAAP operating metrics for the years ended December 31, 2016, 2015 and 2014. We present these metrics because they are the measures our management uses to evaluate the profitability of our business and are useful to investors because they represent the key drivers and measures of economic performance within our business model. Please see the footnotes below for an explanation of each ratio, its usefulness in measuring the economics and operating performance of our business, and a reference to the most closely related U.S. GAAP measure:
Years ended December 31, | |||||||||||
($ in millions) | 2016 | 2015 | 2014 | ||||||||
Numerator: ENI operating earnings(1) | $ | 240.8 | $ | 244.7 | $ | 244.7 | |||||
Denominator: ENI revenue | $ | 678.5 | $ | 663.9 | $ | 635.4 | |||||
ENI operating margin(2) | 35.5 | % | 36.9 | % | 38.5 | % | |||||
Numerator: ENI operating expense | $ | 265.0 | $ | 245.2 | $ | 220.9 | |||||
Denominator: ENI management fee revenue(3) | $ | 659.9 | $ | 637.2 | $ | 589.9 | |||||
ENI operating expense / management fee revenue(4) | 40.2 | % | 38.5 | % | 37.4 | % | |||||
Numerator: ENI variable compensation(5) | $ | 172.7 | $ | 174.0 | $ | 169.8 | |||||
Denominator: ENI earnings before variable compensation(1)(6) | $ | 413.5 | $ | 418.7 | $ | 414.5 | |||||
ENI variable compensation ratio(7) | 41.8 | % | 41.6 | % | 41.0 | % | |||||
Numerator: Affiliate key employee distributions | $ | 41.7 | $ | 38.9 | $ | 40.1 | |||||
Denominator: ENI operating earnings(1) | $ | 240.8 | $ | 244.7 | $ | 244.7 | |||||
ENI Affiliate key employee distributions ratio(8) | 17.3 | % | 15.9 | % | 16.4 | % | |||||
(1) | ENI operating earnings represents ENI earnings before Affiliate key employee distributions and is calculated as ENI revenue, less ENI operating expense, less ENI variable compensation. It differs from economic net income because it does not include the effects of Affiliate key employee distributions, net interest expense or income tax expense. |
95
The following table reconciles U.S. GAAP operating income (loss) to ENI operating earnings:
Years ended December 31, | |||||||||||
($ in millions) | 2016 | 2015 | 2014 | ||||||||
U.S. GAAP operating income (loss) | $ | 155.6 | $ | 191.2 | $ | (67.2 | ) | ||||
Include investment return on equity-accounted Affiliates | 15.1 | 12.7 | 9.6 | ||||||||
Exclude the impact of: | |||||||||||
Non-recurring performance fee | — | (48.1 | ) | — | |||||||
Affiliate key employee-owned equity and profit interest revaluations | (7.1 | ) | 18.5 | 83.0 | |||||||
Amortization of acquired intangible assets, acquisition-related consideration and pre-acquisition employee equity | 29.1 | 0.2 | 0.1 | ||||||||
Pre-IPO non-cash notional Parent corporate cost allocation | — | — | 3.4 | ||||||||
Other items(a) | 6.3 | 4.4 | 2.2 | ||||||||
Affiliate key employee distributions | 41.7 | 38.8 | 40.1 | ||||||||
Variable compensation(b) | 172.7 | 201.0 | 169.8 | ||||||||
Funds’ operating (income) loss | 0.1 | — | 173.5 | ||||||||
ENI earnings before variable compensation | 413.5 | 418.7 | 414.5 | ||||||||
Less: ENI variable compensation(b) | (172.7 | ) | (174.0 | ) | (169.8 | ) | |||||
ENI operating earnings | 240.8 | 244.7 | 244.7 | ||||||||
Less: ENI Affiliate key employee distributions | (41.7 | ) | (38.9 | ) | (40.1 | ) | |||||
ENI earnings after Affiliate key employee distributions | $ | 199.1 | $ | 205.8 | $ | 204.6 | |||||
(a) | Other items include capital transaction costs, restructuring expenses and expenses (excluding variable compensation) associated with the non-recurring performance fee in 2015. |
(b) | For the year ended December 31, 2015, $174.0 million of variable compensation expense is included within economic net income which excludes the revenue and the variable compensation attributable to the non-recurring performance fee. |
(2) | The ENI operating margin, which is calculated before Affiliate key employee distributions, is used by management and is useful to investors to evaluate the overall operating margin of the business without regard to our various ownership levels at each of the Affiliates. The ENI operating margin is most comparable to our U.S. GAAP operating margin (excluding the effect of consolidated Funds) of 23.5% for the year ended December 31, 2016, 27.3% for the year ended December 31, 2015 and 17.0% for the year ended December 31, 2014. |
This ratio is important because it gives investors an understanding of the profitability of the total business relative to revenue, irrespective of the ownership position which OMAM has in each of its Affiliates. Management and investors use this ratio when comparing our profitability relative to our peer group and evaluating our ability to manage the cost structure and profitability of our business under different operating environments.
(3) | ENI Management fee revenue corresponds to U.S. GAAP management fee revenue, adjusted by reversing the U.S. GAAP Funds consolidation eliminations of $0.0 million for the year ended December 31, 2016, $0.0 million for the year ended December 31, 2015 and $20.2 million for the year ended December 31, 2014. |
96
(4) | ENI operating expense / management fee revenue is used by management and is useful to investors to evaluate the level of operating expense as measured against our recurring management fee revenue. We have provided this ratio since many operating expenses, including fixed compensation & benefits and general and administrative expense, are generally linked to the overall size of the business. We track this ratio as a key measure of scale economies at OMAM because in our profit sharing economic model, scale benefits both the Affiliate employees and OMAM shareholders. The ENI operating expense / management fee revenue metric is most comparable to the U.S. GAAP operating expense / management fee revenue ratio. |
(5) | Excludes variable compensation associated with the non-recurring performance fee. |
(6) | ENI earnings before variable compensation is calculated as ENI revenue, less ENI operating expense. |
(7) | The ENI variable compensation ratio is used by management and is useful to investors to evaluate consolidated variable compensation as measured against our ENI earnings before variable compensation. Variable compensation is contractually set and calculated individually at each Affiliate, plus Center bonuses. Variable compensation is usually awarded based on a contractual percentage of each Affiliate’s ENI earnings before variable compensation and may be paid in the form of cash or non-cash Affiliate equity or profit interests. Center variable compensation includes cash and OMAM equity. Non-cash variable compensation awards typically vest over several years and are recognized as compensation expense over that service period. The variable compensation ratio at each Affiliate, calculated as variable compensation divided by ENI earnings before variable compensation, will typically be between 25% and 35%. The ENI variable compensation ratio is most comparable to the U.S. GAAP variable compensation ratio. |
(8) | The ENI Affiliate key employee distribution ratio is used by management and is useful to investors to evaluate Affiliate key employee distributions as measured against our ENI operating earnings. Affiliate key employee distributions represent the share of Affiliate profits after variable compensation that is attributable to Affiliate key employee equity and profit interests holders, according to their ownership interests. The Affiliate key employee distribution ratio at each Affiliate is calculated as Affiliate key employee distributions divided by ENI operating earnings at that Affiliate. At certain Affiliates, OMUS is entitled to an initial preference over profits after variable compensation, structured such that before a preference threshold is reached, there would be no required key employee distributions, whereas for profits above the threshold the key employee distribution amount would be calculated based on the key employee ownership percentages, which range from approximately 15% to 40% at our consolidated Affiliates. The ENI Affiliate key employee distributions ratio is most comparable to the U.S. GAAP Affiliate key employee distributions ratio. |
97
Tax on Economic Net Income
The following table reconciles the United States statutory tax to tax on economic net income. All amounts are shown excluding the 2015 non-recurring performance fee:
Years ended December 31, | |||||||||||
($ in millions) | 2016 | 2015 | 2014 | ||||||||
Pre-tax economic net income(1) | $ | 190.7 | $ | 203.5 | $ | 204.1 | |||||
Deductible interest expense paid to Parent | — | — | (49.8 | ) | |||||||
Intercompany interest expense deductible for U.S. tax purposes | (74.0 | ) | (71.0 | ) | (19.0 | ) | |||||
Taxable economic net income | 116.7 | 132.5 | 135.3 | ||||||||
Taxes at the U.S. federal and state statutory rates(2) | (46.9 | ) | (53.3 | ) | (54.4 | ) | |||||
Other reconciling tax adjustments | 1.3 | (0.5 | ) | 1.6 | |||||||
Tax on economic net income | (45.6 | ) | (53.8 | ) | (52.8 | ) | |||||
Add back intercompany and Parent interest expense previously excluded | 74.0 | 71.0 | 68.8 | ||||||||
Economic net income, excluding the non-recurring performance fee | $ | 145.1 | $ | 149.7 | $ | 151.3 | |||||
Economic net income effective tax rate(3) | 23.9 | % | 26.4 | % | 25.9 | % | |||||
(1) | Excludes the impact of the non-recurring performance fee and includes interest income and third party ENI interest expense, as shown in the following table: |
Years ended December 31, | |||||||||||
($ in millions) | 2016 | 2015 | 2014 | ||||||||
U.S. GAAP interest income | $ | 0.4 | $ | 0.2 | $ | 0.2 | |||||
U.S. GAAP interest expense | (11.3 | ) | (3.1 | ) | (50.6 | ) | |||||
U.S. GAAP net interest expense | (10.9 | ) | (2.9 | ) | (50.4 | ) | |||||
Deductible interest expense paid to Parent | — | — | 49.8 | ||||||||
Other ENI interest expense exclusions(a) | 2.5 | 0.6 | 0.1 | ||||||||
ENI net interest income (expense) | (8.4 | ) | (2.3 | ) | (0.5 | ) | |||||
ENI earnings after Affiliate key employee distributions(b) | 199.1 | 205.8 | 204.6 | ||||||||
Pre-tax economic net income | $ | 190.7 | $ | 203.5 | $ | 204.1 | |||||
(a) | Other ENI interest expense exclusions in 2016 represent cost of financing on seed capital and co-investments and in 2015 represent a portion of the treasury rate lock hedge loss that was reclassified from shareholders’ equity to interest expense. |
(b) | ENI earnings after Affiliate key employee distributions is calculated as ENI operating income (ENI revenue, less ENI operating expense, less ENI variable compensation), less Affiliate key employee distributions. Refer to “—Key Non-GAAP Operating Metrics” for a reconciliation from U.S. GAAP operating income (loss) to ENI earnings after Affiliate key employee distributions, excluding the impact of the non-recurring performance fee. |
(2) | Taxed at U.S. Federal and State statutory rate of 40.2% |
(3) | The economic net income effective tax rate is calculated by dividing the tax on economic net income by pre-tax economic net income. |
98
Capital Resources and Liquidity
Working Capital and Long-Term Debt
The following table summarizes certain key financial data relating to our capital resources and liquid net assets. All amounts presented exclude the non-controlling interest portion of consolidated Funds:
Years ended December 31, | |||||||||||
($ in millions) | 2016 | 2015 | 2014 | ||||||||
Balance Sheet Data(1) | |||||||||||
Current assets | |||||||||||
Cash and cash equivalents | $ | 101.9 | $ | 135.9 | $ | 175.6 | |||||
Investment advisory fees receivable | 163.7 | 151.8 | 161.1 | ||||||||
Investments | 42.5 | — | — | ||||||||
Total current assets | 308.1 | 287.7 | 336.7 | ||||||||
Current liabilities | |||||||||||
Accounts payable and accrued expenses | 45.8 | 45.7 | 39.5 | ||||||||
Accrued short-term incentive compensation | 132.3 | 134.0 | 132.1 | ||||||||
Other short-term liabilities(2) | 95.0 | 1.8 | 1.3 | ||||||||
Total current liabilities | 273.1 | 181.5 | 172.9 | ||||||||
Working Capital | $ | 35.0 | $ | 106.2 | $ | 163.8 | |||||
Long-term notes payable and other debt | 392.3 | 90.0 | 214.0 | ||||||||
(1) | Excludes the non-controlling interest portion of consolidated Funds. |
(2) | Excluded from other short-term liabilities for each of the years presented is an income tax reserve relating to net operating losses that does not represent a current obligation of the Company. Puts related to Affiliate equity and profits interests are also excluded on a short-term basis because they are funded through recycling. Included within other short-term liabilities are payments due to our Parent under the Deferred Tax Asset Deed, as amended, that are due within twelve months. |
Working capital is defined as current assets less current liabilities, excluding the non-controlling interest portion of consolidated Funds. Our net working capital has been positive over the past several years and was $35.0 million at December 31, 2016. Our most significant current liabilities have been accounts payable and accrued compensation expense. Total current liabilities at December 31, 2016 also includes $93.0 million payable to our Parent within twelve months under the Deferred Tax Asset Deed, as amended. Accrued compensation expense has primarily consisted of variable compensation accruals made throughout the year based on contractual arrangements. Our cash management practices generally require that working capital be maintained at each Affiliate at a sufficient level to meet short-term operational needs. Periodic distributions of Affiliate earnings to OMUS and Affiliate key employee equity holders are made according to respective Affiliate distribution policies, with OMUS having the ability to access any surplus cash at each Affiliate as necessary during interim periods.
99
Long-Term Debt
The following table summarizes our financing arrangements, excluding consolidated Funds, as of the dates indicated:
Amounts outstanding at | |||||||||||
($ in millions) | December 31, 2016 | December 31, 2015 | Interest rate | Maturity | |||||||
Long-term debt of OMAM, net of issuance costs | |||||||||||
Third party obligations: | |||||||||||
Revolving credit facility | $ | — | $ | 90.0 | LIBOR + 1.50% plus 0.25% commitment fee | October 15, 2019 | |||||
4.80% Senior Notes Due 2026 | 271.6 | — | 4.80% | July 27, 2026 | |||||||
5.125% Senior Notes Due 2031 | 120.7 | — | 5.125% | August 1, 2031 | |||||||
Total long-term debt | $ | 392.3 | $ | 90.0 | |||||||
Revolving Credit Facility
On October 15, 2014, we entered into a revolving credit facility with Citibank, as administrative agent and issuing bank, and Citigroup Global Markets Inc. and Merrill Lynch, Pierce, Fenner & Smith Incorporated as joint lead arrangers and joint book runners (as amended, the “Credit Facility”). Pursuant to the terms of the Credit Facility, we may obtain loans on a revolving credit basis and procure the issuance of letters of credit in an aggregate amount at any time outstanding not in excess of $350 million. The Credit Facility has a maturity date of October 15, 2019. Borrowings under the facility bear interest, at our option, at either the per annum rate equal to (a) the greatest of (i) the prime rate, (ii) the federal funds effective rate plus 0.5% and (iii) the one month Adjusted LIBO Rate plus 1.0%, plus, in each case an additional amount ranging from 0.25% to 1.00%, with such additional amount based from time to time on the ratio of our total consolidated indebtedness to Adjusted EBITDA (a “Leverage Ratio”) until either Moody’s Investor Service, Inc. or Standard & Poor’s assigned an initial rating to our senior, unsecured long-term indebtedness for borrowed money that was not subject to credit enhancement, or our credit rating, at which time such additional amount became based on our credit rating or (b) the London interbank offered rate for a period, at our election, equal to one, two, three or six months plus an additional amount ranging from 1.25% to 2.00%, with such additional amount based from time to time on our Leverage Ratio until we were assigned a credit rating, at which time such additional amount became based on our credit rating. In addition, we are charged a commitment fee based on the average daily unused portion of the revolving credit facility at a per annum rate ranging from 0.20% to 0.50%, with such amount being based from time to time on our Leverage Ratio until we were assigned a credit rating, at which time such amount became based on our credit rating.
Under the Credit Facility, the ratio of third-party borrowings to trailing twelve months Adjusted EBITDA cannot exceed 3.0x, and the interest coverage ratio must not be less than 4.0x. At December 31, 2016, our ratio of third party borrowings to trailing twelve months Adjusted EBITDA was 1.9x and our interest coverage ratio was 18.5x.
In July 2016, Moody’s Investor Service, Inc. and Standard & Poor’s each assigned an initial investment-grade rating to our senior, unsecured long-term indebtedness. As a result of the assignment of the credit ratings, our interest rate on outstanding borrowings was set at LIBOR + 1.50% and the commitment fee on the unused portion of the revolving credit facility was set at 0.25%. Prior to the assignment of the credit ratings, our interest rate on outstanding borrowings was based on our Leverage Ratio and was set at LIBOR + 1.25% and the commitment fee on the unused portion of the revolving credit facility was set at 0.20%.
100
Long-term bonds
In July 2016, we issued $275.0 million of 4.80% Senior Notes due 2026, or the 2026 Notes, and $125.0 million of 5.125% Senior Notes due 2031, or the 2031 Notes. We used the net proceeds of these offerings to finance the acquisition of Landmark in August 2016, purchase seed capital from the Parent, settle a Treasury rate lock contract and pay down the balance of the Revolving Credit Facility. The Treasury rate lock contract was entered into in July 2015 in conjunction with the expected debt issuances. Upon the issuance of the Notes in July 2016, the Treasury rate lock, which had an accumulated fair value of $(34.4) million, was settled. For more information, refer to Note 21, “Derivatives and Hedging” in our Consolidated Financial Statements included in Item 8 herein.
4.80% Senior Notes Due July 2026
The $275.0 million 2026 Notes were sold at a discount of $(0.5) million and we incurred debt issuance costs of $(3.0) million, which are being amortized to interest expense over the ten-year term. The 2026 Notes can be redeemed at any time prior to the scheduled maturity in part or in aggregate, at the greater of 100% of the principal amount at that time or the sum of the remaining scheduled payments discounted at the treasury rate (as defined) plus 0.5%, together with any related accrued and unpaid interest.
5.125% Senior Notes Due August 2031
The $125.0 million 2031 Notes incurred debt issuance costs of $(4.3) million, which are being amortized to interest expense over the fifteen-year term. The 2031 Notes can be redeemed at any time, on or after August 1, 2019, at a redemption price equal to 100.0% of the principal amount together with any related accrued and unpaid interest.
Other Long-term Liabilities
Other long-term liabilities principally consist of cash-settled Affiliate equity and profit interests liabilities held by certain Affiliate key employees, and voluntary deferred compensation plans. The following table summarizes our other long-term liabilities:
Years ended December 31, | |||||||
($ in millions) | 2016 | 2015 | |||||
Share-based payments liability | $ | 53.7 | $ | 38.5 | |||
Affiliate profit interests | 159.2 | 155.2 | |||||
Employee equity | 212.9 | 193.7 | |||||
Voluntary deferral plan | 78.0 | 66.8 | |||||
Non-current compensation payable | 0.1 | 0.3 | |||||
Loan funding committed to discontinued operations | — | 2.1 | |||||
Other | — | 5.3 | |||||
Total | $ | 291.0 | $ | 268.2 | |||
Share-based payments liability represents the value of Affiliate key employee-owned equity that may under certain circumstances be repurchased by us that is considered an equity award under U.S. GAAP based on the terms and conditions attached to these interests. Profit interests represent the value of Affiliate key employee-owned equity that may under certain circumstances be repurchased by us that is not considered an equity award under U.S. GAAP, but rather a form of compensation arrangement, based on the terms and conditions attached to these interests. Our obligation in any given period in respect of funding these potential repurchases of Affiliate equity is limited to only that portion that may be put to us by Affiliate key employees, which is typically capped annually under the terms of these arrangements such that we are not required to repurchase more than we can reasonably recycle by re-granting the interests in lieu of cash variable compensation owed to Affiliate key employees.
101
Certain of our and our Affiliates’ key employees are eligible to participate in our voluntary deferral plan, or VDP, which provides our senior personnel the opportunity to voluntarily defer a portion of their compensation. There is a voluntary deferral plan investment balance included in investments on the Consolidated Balance Sheets that corresponds to this deferral liability.
For additional discussion of our compensation programs, please refer to the compensation discussions contained within our definitive proxy statement for our 2017 annual meeting of shareholders incorporated herein by reference.
Cash Flows
The following table summarizes certain key financial data relating to cash flows. All amounts presented exclude consolidated Funds:
Years ended December 31, | |||||||||||
($ in millions) | 2016 | 2015 | 2014 | ||||||||
Cash provided by (used in)(1)(2) | |||||||||||
Operating activities | $ | 123.9 | $ | 255.7 | $ | 56.9 | |||||
Investing activities | (284.3 | ) | (62.7 | ) | (5.7 | ) | |||||
Financing activities | 112.9 | (230.6 | ) | (49.8 | ) | ||||||
(1) | Excludes consolidated Funds. |
(2) | Cash flow data shown only includes cash flows from continuing operations. |
Prior to the Offering, our most significant uses of cash collected through Affiliate earnings were related to funding intercompany interest and debt arrangements with our Parent. Following the Offering, short-term uses of cash have included our acquisition of Landmark, third-party interest, payments made to our Parent under the Deferred Tax Asset Deed, seed capital purchased from our Parent, repurchases of shares, dividends and compensation and general and administrative expenses for the Center.
Comparison for the Years Ended December 31, 2016, 2015 and 2014
Net cash provided by operating activities of continuing operations excluding consolidated Funds decreased $(131.8) million, or (51.5)%, from $255.7 million for the year ended December 31, 2015 to $123.9 million for the year ended December 31, 2016. The decrease was primarily due to decreases in amounts due to related parties and decreases in current payables and accruals exclusive of amounts relating to the treasury rate lock.
Net cash provided by operating activities of continuing operations excluding consolidated Funds increased $198.8 million, or 349.4%, from $56.9 million for the year ended December 31, 2014 to $255.7 million for the year ended December 31, 2015. The increase was primarily due to the 2014 purchase of additional ownership interests in an Affiliate that did not recur in 2015, a decrease in deferred income taxes, and a decrease in receivable balances.
Net cash (used in) investing activities of continuing operations excluding consolidated Funds consist primarily of investments in a new Affiliate, seed capital purchased from our Parent, purchases and sales of investment securities as part of our co-investment program and VDP, and purchases of fixed assets for use within our premises. Cash (used in) investing activities was $(284.3) million, $(62.7) million and $(5.7) million for the years ended December 31, 2016, 2015 and 2014, respectively. Cash (used in) investing activities in 2016 primarily reflects disbursements of $(219.1) million, net of cash acquired, related to the Landmark acquisition. Net cash (used in) received from the (purchase) and sale of investments was $(51.7) million, $(49.1) million and $16.7 million for the years ended December 31, 2016, 2015 and 2014, respectively. Fluctuations are principally due to the timing of acquisitions of real estate and timber assets in which we are co-investing. Net cash (used in) the purchase of fixed assets was $(13.5) million, $(13.0) million and $(7.6) million for the years ended December 31, 2016, 2015 and
102
2014, respectively. The higher levels in 2016 and 2015 versus 2014 were primarily a result of timing of reinvestment by our Affiliates in the facilities and premises in which they operate.
Net cash provided by (used in) financing activities excluding consolidated Funds consists of share repurchases, repayments of a related party revolving credit facility, the term loans to our Parent, third-party borrowings (offset in 2014 by third party debt facilities taken in connection with the Reorganization) and dividends paid. Cash provided in 2016 reflects the issuance of $400 million in long-term debt in July 2016, as well as draws upon the revolving credit facility. In 2016 we paid $(148.0) million against third party borrowings, $(52.1) million against amounts previously owed to our Parent (including $(41.4) million for the deferred tax arrangement and $(10.7) million for the co-investment arrangement), $(98.6) million for share repurchases, and $(38.5) million in dividends.
Supplemental Liquidity Measure—Adjusted EBITDA
As supplemental information, we provide information regarding Adjusted EBITDA, which we define as economic net income before interest, income taxes, depreciation and amortization. Adjusted EBITDA is a non-GAAP liquidity measure that we provide in addition to, but not as a substitute for, cash flows from operating activities. It should be noted that our calculation of Adjusted EBITDA may not be consistent with Adjusted EBITDA as calculated by other companies. We believe Adjusted EBITDA is a useful liquidity metric because it indicates our ability to make further investments in our business, service debt and meet working capital requirements. It is also encapsulated in our line of credit as part of our liquidity covenants.
The following table reconciles our U.S. GAAP net income attributable to controlling interests to EBITDA to Adjusted EBITDA to economic net income for the years ended December 31, 2016, 2015 and 2014:
Years Ended December 31, | |||||||||||
($ in millions) | 2016 | 2015 | 2014 | ||||||||
Net income attributable to controlling interests | $ | 126.4 | $ | 155.5 | $ | 51.7 | |||||
Intercompany interest expense due to Parent | — | — | 49.8 | ||||||||
Net interest expense to third parties* | 10.8 | 2.3 | 0.5 | ||||||||
Income tax expense (including tax expenses related to the non-recurring performance fee and discontinued operations) | 44.8 | 47.2 | 11.5 | ||||||||
Depreciation and amortization (including intangible assets and discontinued operations) | 12.0 | 7.1 | 6.4 | ||||||||
EBITDA | $ | 194.0 | $ | 212.1 | $ | 119.9 | |||||
Non-cash compensation costs associated with revaluation of Affiliate key employee-owned equity and profit-sharing interests | (7.1 | ) | 18.5 | 83.0 | |||||||
Amortization of acquisition-related consideration and pre-acquisition employee equity | 26.5 | — | — | ||||||||
EBITDA of discontinued operations attributable to controlling interests | (10.2 | ) | (1.3 | ) | 4.7 | ||||||
Non-cash parent corporate cost allocation | — | — | 3.4 | ||||||||
Restructuring | — | 0.5 | 2.3 | ||||||||
(Gain) loss on seed and co-investments and investment changes attributable to controlling interests | (1.1 | ) | (0.3 | ) | (2.6 | ) | |||||
Non-recurring performance fee before tax | — | (19.1 | ) | — | |||||||
Capital transaction costs | 6.4 | 2.3 | — | ||||||||
Adjusted EBITDA, excluding non-recurring performance fee | $ | 208.5 | $ | 212.7 | $ | 210.7 | |||||
ENI net interest expense to third parties | (8.4 | ) | (2.3 | ) | (0.5 | ) | |||||
Depreciation and amortization | (9.4 | ) | (6.9 | ) | (6.1 | ) | |||||
Tax on economic net income | (45.6 | ) | (53.8 | ) | (52.8 | ) | |||||
Economic net income, excluding non-recurring performance fee | $ | 145.1 | $ | 149.7 | $ | 151.3 | |||||
103
* Interest is shown net of interest incurred in 2015 related to the interest rate hedge.
For a full discussion regarding the items excluded from Adjusted EBITDA above and the calculation of economic net income, refer to “—Non-GAAP Supplemental Performance Measure—Economic Net Income.”
Limitations of Adjusted EBITDA
As a non-GAAP, unaudited liquidity measure and derivation of EBITDA, Adjusted EBITDA has certain material limitations. It does not include cash costs associated with capital transactions and excludes certain U.S. GAAP expenses that fall outside the definition of EBITDA. Each of these categories of expense represents costs to us of doing business, and therefore any measure that excludes any or all of these categories of expense has material limitations.
Future Capital Needs
We believe that our available cash and cash equivalents to be generated from operations, supplemented by short-term and long-term financing, as necessary, will be sufficient to fund current operations and capital requirements for at least the next twelve months as well as our day-to-day operations and future investment requirements over the longer term. Our ability to secure short-term and long-term financing in the future will depend on several factors, including our future profitability, our relative levels of debt and equity and the overall condition of the credit markets.
In December 2016, we repurchased six million ordinary shares from our Parent at $14.25 per share in a private transaction. The aggregate purchase price of $85.5 million was funded with cash on hand, and occurred concurrently with our Parent's sale of 14.95 million OMAM shares to the public. Together with additional ordinary share repurchases made on the open market, we repurchased and retired approximately $98 million of ordinary shares in 2016. We have the financial capacity to purchase additional shares either in the open market or from our Parent in 2017, if such purchase is deemed to be an accretive and value-enhancing transaction.
In September 2016, we purchased approximately $39.6 million of seed investments from our Parent under the terms of the Seed Capital Management Agreement, as amended, which resulted in certain funds becoming newly consolidated and investments increasing from December 31, 2015. As of December 31, 2016, we managed approximately $83 million of seed capital provided by our Parent. We intend to purchase all remaining seed capital investments covered by the Seed Capital Management Agreement on or around June 30, 2017. Additional information on the amended Seed Capital Management Agreement can be found in our Current Report on Form 8-K, filed with the SEC on June 14, 2016.
During 2014, we entered into a Deferred Tax Asset Deed with our Parent, which was amended in June 2016. Under the terms of the Deferred Tax Asset Deed, as we realized the benefits from the associated deferred tax assets, we made offsetting payments to our Parent to transfer the economic benefit of the deferred tax assets to our Parent. Under the terms of the Deferred Tax Asset Deed, as amended, we agreed to make a payment of the net present value of the future tax benefits due to our Parent valued as of December 31, 2016. This payment equals $142.6 million and will be made over three installments on each of June 30, 2017, December 31, 2017 and June 30, 2018. Shareholders' equity at December 31, 2016 reflects an increase of approximately $20 million related to the prepayment of the Deferred Tax Asset Deed. We retain an indemnity from our Parent that protects the realized and future tax benefits covered by the Deferred Tax Asset Deed (including the $142.6 million to be paid in 2017-2018) in the event of a tax law change or challenge from the IRS. Additional information on the amended Deferred Tax Asset Deed can be found in our Current Report on Form 8-K, filed with the SEC on June 14, 2016.
104
Commitments, Contingencies and Off-Balance Sheet Obligations
Indemnifications
In the normal course of business, such as through agreements to enter into business combinations with and divestitures of Affiliates, we occasionally enter into contracts that contain a variety of representations and warranties and which provide general indemnifications. Our maximum exposure under these arrangements is unknown, as this would involve future claims that may be made against us that have not yet occurred.
Off-Balance Sheet Obligations
Off-balance sheet arrangements, as defined by the SEC, include certain contractual arrangements pursuant to which a company has an obligation, such as certain contingent obligations, certain guarantee contracts, retained or contingent interests in assets transferred to an unconsolidated entity, certain derivative instruments classified as equity or material variable interests in unconsolidated entities that provide financing, liquidity, market risk or credit risk support. Disclosure is required for any off-balance sheet arrangements that have, or are reasonably likely to have, a material current or future effect on our financial condition, results of operations, liquidity or capital resources. We generally do not enter into off-balance sheet arrangements, other than those described in “Contractual Obligations” as well as Note 6 to our Consolidated Financial Statements, “Variable Interest Entities.”
Contractual Obligations
The following table summarizes our contractual obligations as of December 31, 2016:
Payments due by period | |||||||||||||||||||
($ in millions) | Total | Less then 1 year | 1 - 3 years | 3 - 5 years | More than 5 years | ||||||||||||||
Contractual Obligations | |||||||||||||||||||
Related party notes payable(1) | $ | 155.9 | $ | 103.0 | $ | 52.9 | $ | — | $ | — | |||||||||
Third party borrowings | 392.3 | — | — | — | 392.3 | ||||||||||||||
Lease obligations(2) | 63.2 | 12.2 | 21.7 | 19.1 | 10.2 | ||||||||||||||
Co-investment obligations | 55.6 | 18.8 | 33.2 | 3.6 | — | ||||||||||||||
Other liabilities(3) | 1.6 | 0.2 | 1.4 | — | — | ||||||||||||||
Maximum Affiliate equity and profits interests repurchase obligations(4) | 212.9 | 15.2 | 58.2 | 36.3 | 103.2 | ||||||||||||||
Total contractual obligations | $ | 881.5 | $ | 149.4 | $ | 167.4 | $ | 59.0 | $ | 505.7 | |||||||||
(1) | Included in related party notes payable is $14.3 million related to co-investments and $142.6 million related to the deferred tax asset liability owed to our Parent. The Deferred Tax Asset Deed was amended on June 13, 2016 to accelerate the repayment terms, with the remaining balance to be paid in three installments through June 30, 2018. |
(2) | Amounts are shown net of income from subleases, and exclude transferred Affiliates and consolidated Funds. |
(3) | Represents the mortgage on a building owned by an Affiliate. |
(4) | Represents amortized amounts putable by Affiliate key employees. Includes amortized portion of Landmark’s contingent payment and employee equity owned pre-acquisition. |
105
Critical Accounting Policies and Estimates
Our accompanying Consolidated Financial Statements were prepared in accordance with U.S. GAAP. The preparation of financial statements in conformity with U.S. GAAP requires us to make estimates or assumptions that affect the reported amounts of assets and liabilities at the date of the financial statements and the reported amounts of revenues and expenses during the periods presented. Due to their nature, estimates involve judgment based upon available information. Actual results could differ from these estimates or assumptions and may have a material effect on our Consolidated Financial Statements.
Our significant accounting policies are enumerated in Note 2, “Significant Accounting Policies” of our accompanying Consolidated Financial Statements. Of the significant accounting policies discussed in Note 2, We believe that the policies and estimates below constitute our critical accounting policies, as they involve significant estimates or judgment due to the sensitivity of the methods and assumptions used.
Our critical accounting policies are:
• | basis of presentation |
• | consolidation |
• | derivatives and hedging |
• | use of estimates |
• | fair value measurement |
• | valuation of investments held at fair value |
• | equity method investments |
• | revenue recognition |
• | investment advisory fees receivable |
• | intangible assets |
• | goodwill |
• | earnings per share |
• | income taxes |
• | compensation arrangements |
Item 7A. Quantitative and Qualitative Disclosures About Market Risk
Market Risk
Our exposure to market risk is directly related to the role of our Affiliates as asset managers. Substantially all of our investment management revenues are derived from our Affiliates’ agreements with their clients. Under these agreements, the revenues we receive are based on the value of our assets under management or the investment performance on client accounts for which we earn performance fees. Accordingly, our revenues and net income may decline as a result of our assets under management decreasing due to depreciation of our investment portfolios. In addition, such depreciation could cause our clients to withdraw their funds in favor of investments offering higher returns or lower risk, which would cause our revenues and net income to decline further.
106
Our model for assessing the impact of market risk on our results uses December 31, 2016 ending AUM and management fee rates as the basis for management fee revenue calculations. With respect to performance fee revenue, we assume that relative investment performance remains the same as it was on December 31, 2016. Therefore, market-driven changes in performance fees, which are typically based on relative performance versus market indices, reflect changes in the underlying AUM used in the calculation rather than differences in relative performance as a result of a changed market environment. The basis for the analysis is performance fees earned for the twelve months ended December 31, 2016.
Our profit sharing economic structure, described more fully in “—The Economics of Our Business,” results in a sharing of market risk between us and our employees. Approximately 50% of our ENI cost structure is variable, representing variable compensation and Affiliate key employee distributions. These variable expenses generally are linked in a formulaic manner to the profitability of the business after covering operating expenses, which include base compensation and benefits, general and administrative expenses, and depreciation and amortization. In modeling the impact of market risk, we assume that these operating expenses remain unchanged, but the resulting impact on profit driven by increases or decreases in revenue will change variable compensation and Affiliate key employee distributions in line with their formulaic calculations. Any change in pre-tax profit is tax-effected at our statutory combined state and federal rate of 40.2% to calculate profit after tax.
The value of our assets under management was $240.4 billion as of December 31, 2016. A 10% increase or decrease in the value of our assets under management, if proportionally distributed over all of our investment strategies, asset classes and client relationships, would cause an annualized increase or decrease in our gross management fee revenues of approximately $86.8 million, including equity-accounted Affiliates, based on our current weighted average fee rate of 36 basis points. Approximately $61.0 billion, or 25%, of our AUM, including equity-accounted Affiliates,are in accounts subject to performance fees. Of these assets, approximately 75% are in accounts for which performance fees, or management fee adjustments, are calculated based on investment return that differs from the relative benchmark returns. Assuming the market change does not impact our relative performance and high-water mark status of our alternative assets, a 10% increase or decrease in AUM would have approximately a $0.3 million impact to our gross performance fees based on our trailing twelve month performance fees of $2.6 million as of December 31, 2016. The combined impact on our management fees and performance fees would have a direct impact on our earnings and result in an annual change of approximately $27.6 million in our post-tax economic net income, given our current cost structure and operating model.
Equity market risk, interest rate risk, and foreign currency risk are the market risks that could have the greatest impact on our management fees, performance fees and our business profitability. Impacts on our management and performance fees can be calculated based on the percentage of AUM constituting equity investments, fixed income investments, or foreign currency denominated investments, respectively, multiplied by the relevant weighted average management fee and performance fee attributable to that asset class.
• | Our equity markets-based AUM includes U.S. equities (including small cap through large cap securities and substantially value or blended investment styles, excluding REITS) and global/non-U.S. equities (including global, non-U.S. and emerging markets securities). A 10% increase or decrease in equity markets would cause our $178.4 billion of equity assets under management to increase or decrease by $17.8 billion, resulting in a change in annualized management fee revenue of $60.0 million and an annual change in post-tax economic net income of approximately $20.0 million, given our current cost structure, operating model, and weighted average equity fee rates of 34 basis points at the mix of strategies as of December 31, 2016. Approximately $43.5 billion, or 24%, of our equity markets-based AUM are in accounts subject to performance fees. Of these assets, approximately 99% are in accounts for which performance fees are calculated based on investment return in excess of the relative benchmark returns. Assuming the market change does not impact our relative performance, a 10% change in equity markets would not have a material impact from performance fees on our post-tax economic net income, given our current cost structure and operating model. |
107
• | Foreign currency AUM includes equity and alternative instruments denominated in foreign currencies. A 10% increase or decrease in foreign exchange rates against the U.S. dollar would cause our $83.2 billion of foreign currency denominated AUM to increase or decrease by $8.3 billion, resulting in a change in annualized management fee revenue of $36.5 million and an annual change in post-tax economic net income of $12.6 million, based on weighted average fees earned on our foreign currency denominated AUM of 44 basis points at the mix of strategies as of December 31, 2016. Approximately $12.0 billion, or 14%, of our foreign currency denominated AUM are in accounts subject to performance fees. Of these assets, approximately 65% are in accounts for which performance fees are calculated based on investment return in excess of the relative benchmark returns. Assuming the market change does not impact our relative performance, a 10% change in foreign currency exchange rates would have an approximate incremental $0.3 million impact from performance fees on our post-tax economic net income, given our current cost structure and operating model. |
• | Fixed income AUM includes instruments in government bonds, corporate bonds and other fixed income investments in the United States. A change in interest rates, resulting in a 10% increase or decrease in the value of our total fixed income AUM of $13.9 billion, would cause AUM to rise or fall by approximately $1.4 billion. Based on our fixed income weighted average fee rates of 20 basis points, annualized management fees would change by $2.8 million and post-tax economic net income would change by $0.9 million annually. There are currently no material fixed income assets earning performance fees as of the year ended December 31, 2016. |
Our investment income primarily represents investments in Affiliates accounted for under the equity method. Exposure to market risks for Affiliates accounted for under the equity method is immaterial and is included in the analysis above.
While the analysis above assumes that market changes occur in a uniform manner across the relevant portfolio, because of our declining fee rates for larger relationships and differences in our fee rates across asset classes, a change in the composition of our assets under management, in particular an increase in the proportion of our total assets under management attributable to strategies, clients or relationships with lower effective fee rates, could have a material negative impact on our overall weighted average fee rate.
As is customary in the asset management industry, clients invest in particular strategies to gain exposure to certain asset classes, which exposes their investment to the benefits and risks of such asset classes. We have not adopted a corporate-level risk management policy regarding client assets, nor have we attempted to hedge at the corporate level or within individual strategies the market risks that would affect the value of our overall assets under management and related revenues. Any reduction in the value of our assets under management would result in a reduction in our revenues.
108
Item 8. Financial Statements and Supplementary Data.
Page | ||
Index to financial statements | ||
109
Report of Independent Registered Public Accounting Firm
The Board of Directors and Shareholders
OM Asset Management plc:
We have audited the accompanying consolidated balance sheets of OM Asset Management plc and subsidiaries (the Company) as of December 31, 2016 and 2015, and the related consolidated statements of operations, comprehensive income, changes in shareholders’ equity and cash flows for each of the years in the three‑year period ended December 31, 2016. These consolidated financial statements are the responsibility of the Company’s management. Our responsibility is to express an opinion on these consolidated financial statements based on our audits.
We conducted our audits in accordance with the standards of the Public Company Accounting Oversight Board (United States). Those standards require that we plan and perform the audit to obtain reasonable assurance about whether the financial statements are free of material misstatement. An audit includes examining, on a test basis, evidence supporting the amounts and disclosures in the financial statements. An audit also includes assessing the accounting principles used and significant estimates made by management, as well as evaluating the overall financial statement presentation. We believe that our audits provide a reasonable basis for our opinion.
In our opinion, the consolidated financial statements referred to above present fairly, in all material respects, the financial position of OM Asset Management plc and subsidiaries as of December 31, 2016 and 2015, and the results of their operations and their cash flows for each of the years in the three‑year period ended December 31, 2016, in conformity with U.S. generally accepted accounting principles.
As discussed in Note 2 to the consolidated financial statements, the Company has changed its method of accounting for consolidation beginning January 1, 2015, due to the adoption of Accounting Standard Update 2015-02, Consolidation, using the modified retrospective method.
We also have audited, in accordance with the standards of the Public Company Accounting Oversight Board (United States), the Company’s internal control over financial reporting as of December 31, 2016, based on criteria established in Internal Control - Integrated Framework (2013) issued by the Committee of Sponsoring Organizations of the Treadway Commission (COSO), and our report dated February 21, 2017 expressed an unqualified opinion on the effectiveness of the Company’s internal control over financial reporting.
/s/ KPMG LLP
Boston, Massachusetts
February 21, 2017
110
Report of Independent Registered Public Accounting Firm
The Board of Directors and Shareholders
OM Asset Management plc:
We have audited OM Asset Management plc and subsidiaries (the Company) internal control over financial reporting as of December 31, 2016, based on criteria established in Internal Control - Integrated Framework (2013) issued by the Committee of Sponsoring Organizations of the Treadway Commission (COSO). The Company’s management is responsible for maintaining effective internal control over financial reporting and for its assessment of the effectiveness of internal control over financial reporting, included in the accompanying Management’s Report on Internal Control Over Financial Reporting. Our responsibility is to express an opinion on the Company’s internal control over financial reporting based on our audit.
We conducted our audit in accordance with the standards of the Public Company Accounting Oversight Board (United States). Those standards require that we plan and perform the audit to obtain reasonable assurance about whether effective internal control over financial reporting was maintained in all material respects. Our audit included obtaining an understanding of internal control over financial reporting, assessing the risk that a material weakness exists, and testing and evaluating the design and operating effectiveness of internal control based on the assessed risk. Our audit also included performing such other procedures as we considered necessary in the circumstances. We believe that our audit provides a reasonable basis for our opinion.
A company’s internal control over financial reporting is a process designed to provide reasonable assurance regarding the reliability of financial reporting and the preparation of financial statements for external purposes in accordance with generally accepted accounting principles. A company’s internal control over financial reporting includes those policies and procedures that (1) pertain to the maintenance of records that, in reasonable detail, accurately and fairly reflect the transactions and dispositions of the assets of the company; (2) provide reasonable assurance that transactions are recorded as necessary to permit preparation of financial statements in accordance with generally accepted accounting principles, and that receipts and expenditures of the company are being made only in accordance with authorizations of management and directors of the company; and (3) provide reasonable assurance regarding prevention or timely detection of unauthorized acquisition, use, or disposition of the company’s assets that could have a material effect on the financial statements.
Because of its inherent limitations, internal control over financial reporting may not prevent or detect misstatements. Also, projections of any evaluation of effectiveness to future periods are subject to the risk that controls may become inadequate because of changes in conditions, or that the degree of compliance with the policies or procedures may deteriorate.
In our opinion, the Company maintained, in all material respects, effective internal control over financial reporting as of December 31, 2016, based on criteria established in Internal Control - Integrated Framework (2013) issued by the Committee of Sponsoring Organizations of the Treadway Commission (COSO).
OM Asset Management plc acquired Landmark Partners, LLC (Landmark) during 2016, and management excluded from its assessment of the effectiveness of OM Asset Management plc’s internal control over financial reporting as of December 31, 2016, Landmark’s internal control over financial reporting associated with total assets of $253.2 million (of which, $229.8 million represents goodwill and intangible assets acquired from the acquisition of Landmark during the year that were subject to the Company’s internal control over financial reporting) and total revenues of $28.4 million included in the consolidated financial statements of OM Asset Management plc and subsidiaries as of and for the year ended December 31, 2016. Our audit of internal control over financial reporting of OM Asset Management plc also excluded an evaluation of the internal control over financial reporting of Landmark.
We also have audited, in accordance with the standards of the Public Company Accounting Oversight Board (United States), the consolidated balance sheets of OM Asset Management plc and subsidiaries as of December 31, 2016 and 2015, and the related consolidated statements of operations, comprehensive income, changes in shareholders’ equity and cash flows for each of the years in the three-year period ended December 31, 2016, and our report dated February 21, 2017 expressed an unqualified opinion on those consolidated financial statements.
/s/ KPMG LLP
Boston, Massachusetts
February 21, 2017
111
OM Asset Management plc
Consolidated Balance Sheets
(in millions)
December 31, 2016 | December 31, 2015 | ||||||
Assets | |||||||
Cash and cash equivalents | $ | 101.9 | $ | 135.9 | |||
Investment advisory fees receivable | 163.7 | 151.8 | |||||
Fixed assets, net | 39.8 | 30.7 | |||||
Investments (includes balances reported at fair value of $126.1 and $97.0) | 233.3 | 202.6 | |||||
Acquired intangibles, net | 84.9 | 1.5 | |||||
Goodwill | 272.7 | 126.5 | |||||
Other assets | 29.0 | 23.5 | |||||
Deferred tax assets | 332.7 | 341.6 | |||||
Assets of consolidated Funds: | |||||||
Cash and cash equivalents, restricted | 0.4 | — | |||||
Investments, at fair value | 35.5 | — | |||||
Other assets | 0.4 | — | |||||
Total assets | $ | 1,294.3 | $ | 1,014.1 | |||
Liabilities and shareholders’ equity | |||||||
Accounts payable and accrued expenses | $ | 45.8 | $ | 45.7 | |||
Accrued incentive compensation | 132.3 | 134.0 | |||||
Other amounts due to related parties | 156.3 | 222.9 | |||||
Other compensation liabilities | 291.0 | 260.8 | |||||
Accrued income taxes | 90.2 | 87.7 | |||||
Third party borrowings | 392.3 | 90.0 | |||||
Other liabilities | 10.1 | 7.1 | |||||
Liabilities of consolidated Funds: | |||||||
Securities sold, not yet purchased, at fair value | 5.0 | — | |||||
Other liabilities | 0.8 | — | |||||
Total liabilities | 1,123.8 | 848.2 | |||||
Commitments and contingencies | |||||||
Redeemable non-controlling interests in consolidated Funds | 5.5 | — | |||||
Equity: | |||||||
Ordinary shares (nominal value $0.001; 114,157,765 and 120,558,278 shares, respectively, issued) | 0.1 | 0.1 | |||||
Shareholders’ equity | 190.2 | 168.6 | |||||
Accumulated other comprehensive income (loss) | (26.3 | ) | (2.8 | ) | |||
Non-controlling interests | 1.0 | — | |||||
Total equity and redeemable non-controlling interests in consolidated Funds | 170.5 | 165.9 | |||||
Total liabilities and equity | $ | 1,294.3 | $ | 1,014.1 | |||
See Notes to Consolidated Financial Statements
112
OM Asset Management plc
Consolidated Statements of Operations
(in millions except for per share data)
For the Years Ended December 31, | |||||||||||
2016 | 2015 | 2014 | |||||||||
Revenue: | |||||||||||
Management fees | $ | 659.9 | $ | 637.2 | $ | 569.7 | |||||
Performance fees | 2.6 | 61.8 | 34.3 | ||||||||
Other revenue | 0.9 | 0.3 | 1.6 | ||||||||
Consolidated Funds’ revenue: | |||||||||||
Revenue from timber | — | — | 425.7 | ||||||||
Other revenue | 0.1 | — | 25.0 | ||||||||
Total revenue | 663.5 | 699.3 | 1,056.3 | ||||||||
Operating expenses: | |||||||||||
Compensation and benefits | 397.4 | 412.8 | 429.4 | ||||||||
General and administrative expense | 98.3 | 88.2 | 83.9 | ||||||||
Amortization of acquired intangibles | 2.6 | 0.2 | 0.1 | ||||||||
Depreciation and amortization | 9.4 | 6.9 | 6.1 | ||||||||
Consolidated Funds’ expense: | |||||||||||
Interest and dividend expense | — | — | 135.6 | ||||||||
Timber expense | — | — | 257.7 | ||||||||
Depletion expense | — | — | 128.4 | ||||||||
Other expense | 0.2 | — | 82.3 | ||||||||
Total operating expenses | 507.9 | 508.1 | 1,123.5 | ||||||||
Operating income (loss) | 155.6 | 191.2 | (67.2 | ) | |||||||
Non-operating income and (expense): | |||||||||||
Investment income | 17.2 | 13.0 | 12.2 | ||||||||
Interest income | 0.4 | 0.2 | 0.2 | ||||||||
Interest expense | (11.3 | ) | (3.1 | ) | (50.6 | ) | |||||
Net consolidated Funds gains (losses) | (1.1 | ) | — | 73.2 | |||||||
Total non-operating income | 5.2 | 10.1 | 35.0 | ||||||||
Income (loss) from continuing operations before taxes | 160.8 | 201.3 | (32.2 | ) | |||||||
Income tax expense | 40.8 | 46.6 | 12.8 | ||||||||
Income (loss) from continuing operations | 120.0 | 154.7 | (45.0 | ) | |||||||
Gain (loss) from discontinued operations, net of tax | — | — | (1.1 | ) | |||||||
Gain on disposal of discontinued operations, net of tax | 6.2 | 0.8 | 2.3 | ||||||||
Net income (loss) | 126.2 | 155.5 | (43.8 | ) | |||||||
Net loss attributable to non-controlling interests in consolidated Funds | (0.2 | ) | — | (95.5 | ) | ||||||
Net income attributable to controlling interests | $ | 126.4 | $ | 155.5 | $ | 51.7 | |||||
Earnings per share (basic) attributable to controlling interests | $ | 1.05 | $ | 1.29 | $ | 0.43 | |||||
Earnings per share (diluted) attributable to controlling interests | 1.05 | 1.29 | 0.43 | ||||||||
Continuing operations earnings per share (basic) attributable to controlling interests | 0.98 | 1.28 | 0.46 | ||||||||
Continuing operations earnings per share (diluted) attributable to controlling interests | 0.98 | 1.28 | 0.46 | ||||||||
Weighted average ordinary shares outstanding | 119.2 | 120.0 | 120.0 | ||||||||
Weighted average diluted ordinary shares outstanding | 119.5 | 120.5 | 120.0 | ||||||||
See Notes to Consolidated Financial Statements
113
OM Asset Management plc
Consolidated Statements of Comprehensive Income
(in millions)
For the Years Ended December 31, | |||||||||||
2016 | 2015 | 2014 | |||||||||
Net income (loss) | $ | 126.2 | $ | 155.5 | $ | (43.8 | ) | ||||
Other comprehensive income (loss): | |||||||||||
Valuation of derivative securities, net of tax | (20.3 | ) | (6.6 | ) | — | ||||||
Foreign currency translation adjustment | (3.2 | ) | (1.5 | ) | (2.5 | ) | |||||
Total comprehensive income (loss) | 102.7 | 147.4 | (46.3 | ) | |||||||
Comprehensive (loss) attributable to non-controlling interests in consolidated Funds | (0.2 | ) | — | (98.7 | ) | ||||||
Total comprehensive income attributable to controlling interests | $ | 102.9 | $ | 147.4 | $ | 52.4 | |||||
See Notes to Consolidated Financial Statements
114
OM Asset Management plc
Consolidated Statements of Changes in Shareholders’ Equity
For the Years Ended December 31, 2016, 2015, and 2014
($ in millions, except share data)
Ordinary shares (millions) | Ordinary shares, nominal value | Shareholders’ equity (deficit) | Accumulated other comprehensive income (loss) | Total shareholders’ equity (deficit) | Non-controlling interests | Non-controlling interests in consolidated Funds | Total equity | Redeemable non-controlling interests in consolidated Funds | Total equity and redeemable non-controlling interests in consolidated Funds | |||||||||||||||||||||||||||||
December 31, 2013 | — | $ | — | $ | (449.8 | ) | $ | 3.0 | $ | (446.8 | ) | $ | 0.1 | $ | 2,579.3 | $ | 2,132.6 | $ | 403.3 | $ | 2,535.9 | |||||||||||||||||
Transfer of subsidiary to Parent | — | — | (16.0 | ) | 1.6 | (14.4 | ) | — | — | (14.4 | ) | (327.4 | ) | (341.8 | ) | |||||||||||||||||||||||
Tax on gain from transfer of subsidiary to Parent | — | — | (3.2 | ) | — | (3.2 | ) | — | — | (3.2 | ) | — | (3.2 | ) | ||||||||||||||||||||||||
Issuance of ordinary shares | 120.0 | 0.1 | — | — | 0.1 | — | — | 0.1 | — | 0.1 | ||||||||||||||||||||||||||||
Capital contributions (redemptions) | — | — | 973.1 | — | 973.1 | — | (72.1 | ) | 901.0 | 5.1 | 906.1 | |||||||||||||||||||||||||||
Equity-based compensation | — | — | 8.9 | — | 8.9 | — | — | 8.9 | — | 8.9 | ||||||||||||||||||||||||||||
Deferred tax asset revaluation | — | — | 4.3 | — | 4.3 | — | — | 4.3 | — | 4.3 | ||||||||||||||||||||||||||||
Transfer of value incentive plan share award | — | — | 1.8 | — | 1.8 | — | — | 1.8 | — | 1.8 | ||||||||||||||||||||||||||||
Foreign currency translation adjustment | — | — | — | 0.7 | 0.7 | — | (3.2 | ) | (2.5 | ) | — | (2.5 | ) | |||||||||||||||||||||||||
Parent company corporate cost allocation | — | — | 3.4 | — | 3.4 | — | — | 3.4 | — | 3.4 | ||||||||||||||||||||||||||||
Assignment of deferred tax assets and coinvestments to Parent | — | — | (304.3 | ) | — | (304.3 | ) | — | — | (304.3 | ) | — | (304.3 | ) | ||||||||||||||||||||||||
IPO costs charged to Parent | — | — | (23.1 | ) | — | (23.1 | ) | — | — | (23.1 | ) | — | (23.1 | ) | ||||||||||||||||||||||||
Repurchase of Affiliate equity | — | — | (3.7 | ) | — | (3.7 | ) | (0.1 | ) | — | (3.8 | ) | — | (3.8 | ) | |||||||||||||||||||||||
Net consolidation (de-consolidation) of Funds | — | — | — | — | 60.2 | 60.2 | (28.8 | ) | 31.4 | |||||||||||||||||||||||||||||
Dividends to Parent | — | — | (212.0 | ) | — | (212.0 | ) | — | — | (212.0 | ) | — | (212.0 | ) | ||||||||||||||||||||||||
Net income (loss) | — | — | 51.7 | — | 51.7 | — | (105.2 | ) | (53.5 | ) | 9.7 | (43.8 | ) | |||||||||||||||||||||||||
December 31, 2014 | 120.0 | $ | 0.1 | $ | 31.1 | $ | 5.3 | $ | 36.5 | $ | — | $ | 2,459.0 | $ | 2,495.5 | $ | 61.9 | $ | 2,557.4 | |||||||||||||||||||
Issuance of ordinary shares | 0.5 | $ | — | — | — | — | — | — | — | — | — | |||||||||||||||||||||||||||
Capital redemptions | — | — | (1.3 | ) | — | (1.3 | ) | — | — | (1.3 | ) | — | (1.3 | ) | ||||||||||||||||||||||||
Equity-based compensation | — | — | 13.0 | — | 13.0 | — | — | 13.0 | — | 13.0 | ||||||||||||||||||||||||||||
Deferred tax asset revaluation | — | — | 9.0 | — | 9.0 | — | — | 9.0 | — | 9.0 | ||||||||||||||||||||||||||||
Foreign currency translation adjustment | — | — | — | (1.5 | ) | (1.5 | ) | — | — | (1.5 | ) | — | (1.5 | ) | ||||||||||||||||||||||||
Dividends to shareholders | — | — | (10.9 | ) | — | (10.9 | ) | — | — | (10.9 | ) | — | (10.9 | ) | ||||||||||||||||||||||||
De-consolidation of Funds | — | — | — | — | — | — | (2,459.0 | ) | (2,459.0 | ) | (61.9 | ) | (2,520.9 | ) | ||||||||||||||||||||||||
Valuation of derivative securities, net of tax | — | — | — | (6.6 | ) | (6.6 | ) | — | — | (6.6 | ) | — | (6.6 | ) | ||||||||||||||||||||||||
Dividends to Parent | — | — | (27.8 | ) | — | (27.8 | ) | — | — | (27.8 | ) | — | (27.8 | ) | ||||||||||||||||||||||||
Net income | — | — | 155.5 | — | 155.5 | — | — | 155.5 | — | 155.5 | ||||||||||||||||||||||||||||
December 31, 2015 | 120.5 | $ | 0.1 | $ | 168.6 | $ | (2.8 | ) | $ | 165.9 | $ | — | $ | — | $ | 165.9 | $ | — | $ | 165.9 | ||||||||||||||||||
Issuance of ordinary shares | 0.5 | — | — | — | — | — | — | — | — | — | ||||||||||||||||||||||||||||
Repurchase of ordinary shares | (6.9 | ) | — | (98.2 | ) | — | (98.2 | ) | — | — | (98.2 | ) | — | (98.2 | ) | |||||||||||||||||||||||
Capital redemptions | — | — | (0.4 | ) | — | (0.4 | ) | — | — | (0.4 | ) | — | (0.4 | ) | ||||||||||||||||||||||||
Equity-based compensation | — | — | 12.8 | — | 12.8 | — | — | 12.8 | — | 12.8 | ||||||||||||||||||||||||||||
Foreign currency translation adjustment | — | — | — | (3.2 | ) | (3.2 | ) | — | — | (3.2 | ) | — | (3.2 | ) | ||||||||||||||||||||||||
Valuation of derivative securities, net of tax | — | — | — | (20.3 | ) | (20.3 | ) | — | — | (20.3 | ) | — | (20.3 | ) | ||||||||||||||||||||||||
Amendment of Deferred Tax Asset Deed | — | — | 19.8 | — | 19.8 | — | — | 19.8 | — | 19.8 | ||||||||||||||||||||||||||||
Business acquisitions | — | — | — | — | — | 1.0 | — | 1.0 | — | 1.0 | ||||||||||||||||||||||||||||
Net consolidation of Funds | — | — | — | — | — | — | — | — | 5.5 | 5.5 | ||||||||||||||||||||||||||||
Dividends to shareholders | — | — | (13.4 | ) | — | (13.4 | ) | — | — | (13.4 | ) | — | (13.4 | ) | ||||||||||||||||||||||||
Dividends to related parties | — | — | (25.4 | ) | — | (25.4 | ) | — | — | (25.4 | ) | — | (25.4 | ) | ||||||||||||||||||||||||
Net income | — | — | 126.4 | — | 126.4 | — | — | 126.4 | — | 126.4 | ||||||||||||||||||||||||||||
December 31, 2016 | 114.1 | $ | 0.1 | $ | 190.2 | $ | (26.3 | ) | $ | 164.0 | $ | 1.0 | $ | — | $ | 165.0 | $ | 5.5 | $ | 170.5 | ||||||||||||||||||
See Notes to Consolidated Financial Statements
115
OM Asset Management plc
Consolidated Statements of Cash Flows
(in millions)
For the Years Ended December 31, | |||||||||||
2016 | 2015 | 2014 | |||||||||
Cash flows from operating activities: | |||||||||||
Net income (loss) | $ | 126.2 | $ | 155.5 | $ | (43.8 | ) | ||||
Less: Net loss attributable to non-controlling interests in consolidated Funds | 0.2 | — | 95.5 | ||||||||
Adjustments to reconcile net income (loss) to net cash provided by (used in) operating activities from continuing operations: | |||||||||||
Net (income) loss from discontinued operations, excluding consolidated Funds | (6.2 | ) | (0.8 | ) | 3.5 | ||||||
Amortization of acquired intangibles | 2.6 | 0.2 | 0.1 | ||||||||
Depreciation and amortization | 9.4 | 6.9 | 6.1 | ||||||||
Amortization of debt-related costs | 1.3 | — | — | ||||||||
Loss on disposal of fixed assets | 0.1 | — | 0.4 | ||||||||
Amortization and revaluation of non-cash compensation awards | 45.1 | 44.4 | 103.9 | ||||||||
Parent company corporate cost allocation | — | — | 3.4 | ||||||||
Net earnings from Affiliates accounted for using the equity method | (15.1 | ) | (12.7 | ) | (9.6 | ) | |||||
Distributions received from equity method Affiliates | 13.5 | 8.6 | 7.7 | ||||||||
Deferred income taxes | 13.3 | (11.1 | ) | (35.3 | ) | ||||||
(Gains) losses on other investments | (3.0 | ) | — | (2.6 | ) | ||||||
Changes in operating assets and liabilities (excluding discontinued operations): | |||||||||||
(Increase) decrease in investment advisory fees receivable and other amounts due from related parties | (3.1 | ) | 12.8 | (26.9 | ) | ||||||
(Increase) decrease in other receivables, prepayments, deposits and other assets | (17.6 | ) | (1.4 | ) | (28.5 | ) | |||||
Increase (decrease) in accrued incentive compensation and other liabilities and other amounts due to related parties | (14.0 | ) | 15.4 | (51.7 | ) | ||||||
Increase (decrease) in accounts payable and accruals and accrued income taxes | (28.8 | ) | 37.9 | 34.7 | |||||||
Net cash flows from operating activities of continuing operations, excluding consolidated Funds | 123.9 | 255.7 | 56.9 | ||||||||
Net loss attributable to non-controlling interests in consolidated Funds | (0.2 | ) | — | (95.5 | ) | ||||||
Adjustments to reconcile net income (loss) attributable to non-controlling interests in consolidated Funds to net cash provided by (used in) operating activities from continuing operations of consolidated Funds: | |||||||||||
Net profit (loss) from discontinued operations | — | — | 4.7 | ||||||||
Depletion | — | — | 128.4 | ||||||||
(Gains) losses on other investments | 0.1 | — | (4.6 | ) | |||||||
(Increase) decrease in receivables and other assets | (0.1 | ) | — | 24.5 | |||||||
Increase (decrease) in accounts payable and other liabilities | 0.5 | — | 64.6 | ||||||||
Net cash flows from operating activities of continuing operations of consolidated Funds | 0.3 | — | 122.1 | ||||||||
Net cash flows from operating activities of continuing operations | 124.2 | 255.7 | 179.0 | ||||||||
Net cash flows from operating activities of discontinued operations | 13.5 | (2.1 | ) | (24.9 | ) | ||||||
Total net cash flows from operating activities | 137.7 | 253.6 | 154.1 | ||||||||
116
OM Asset Management plc
Consolidated Statements of Cash Flows (Continued)
(in millions)
For the Years Ended December 31, | |||||||||||
2016 | 2015 | 2014 | |||||||||
Cash flows from investing activities: | |||||||||||
Purchase of fixed assets, excluding discontinued operations | (13.5 | ) | (13.0 | ) | (7.6 | ) | |||||
Payments for Affiliate and joint venture equity | — | (0.6 | ) | (11.0 | ) | ||||||
Dispositions of Affiliates | — | — | (3.8 | ) | |||||||
Business acquisitions, net of cash acquired | (219.1 | ) | — | — | |||||||
Purchase of investment securities | (65.0 | ) | (67.6 | ) | (8.8 | ) | |||||
Sale of investment securities | 13.3 | 18.5 | 25.5 | ||||||||
Cash flows from investing activities of consolidated Funds: | |||||||||||
Purchase of investments | (11.6 | ) | — | (105.1 | ) | ||||||
Redemption of investments | 11.2 | — | 87.5 | ||||||||
Change in restricted cash | — | — | 31.5 | ||||||||
Consolidation (de-consolidation) of Funds | 0.5 | (93.0 | ) | (14.2 | ) | ||||||
Net cash flows from investing activities of continuing operations | (284.2 | ) | (155.7 | ) | (6.0 | ) | |||||
Net cash flows from investing activities of discontinued operations | — | — | (7.1 | ) | |||||||
Total net cash flows from investing activities | (284.2 | ) | (155.7 | ) | (13.1 | ) | |||||
Cash flows from financing activities: | |||||||||||
Proceeds from third party borrowings | 450.1 | — | 174.5 | ||||||||
Repayment of third party borrowings | (148.0 | ) | (87.0 | ) | — | ||||||
Repayment of related party borrowings | — | (37.0 | ) | (37.0 | ) | ||||||
Payment to Parent for deferred tax arrangement | (41.4 | ) | (53.6 | ) | (12.3 | ) | |||||
Payment to Parent for co-investment redemptions | (10.7 | ) | (14.3 | ) | — | ||||||
Repurchase of ordinary shares | (98.6 | ) | — | — | |||||||
Dividends paid to shareholders | (13.1 | ) | (10.9 | ) | — | ||||||
Dividends paid to related parties | (25.4 | ) | (27.8 | ) | (175.0 | ) | |||||
Cash flows from financing activities of consolidated Funds: | |||||||||||
Proceeds from debt raised | — | — | 4.1 | ||||||||
Repayment of debt | — | — | (4.7 | ) | |||||||
Non-controlling interest capital redeemed | — | — | (25.1 | ) | |||||||
Redeemable non-controlling interest capital raised | — | — | 10.7 | ||||||||
Redeemable non-controlling interest capital redeemed | — | — | (6.9 | ) | |||||||
Distributions to non-controlling interests | — | — | (77.7 | ) | |||||||
Distributions to redeemable non-controlling interests | — | — | (1.9 | ) | |||||||
Net cash flows from financing activities of continuing operations | 112.9 | (230.6 | ) | (151.3 | ) | ||||||
Net cash flows from financing activities of discontinued operations | — | — | (1.2 | ) | |||||||
Total net cash flows from financing activities | 112.9 | (230.6 | ) | (152.5 | ) | ||||||
Effect of foreign exchange rate changes on cash and cash equivalents | — | — | (2.1 | ) | |||||||
Net increase (decrease) in cash and cash equivalents | (33.6 | ) | (132.7 | ) | (13.6 | ) | |||||
Cash and cash equivalents at beginning of period | 135.9 | 268.6 | 282.2 | ||||||||
Cash and cash equivalents at end of period (including cash at consolidated Funds classified as restricted) | $ | 102.3 | $ | 135.9 | $ | 268.6 | |||||
117
OM Asset Management plc
Consolidated Statements of Cash Flows (Continued)
(in millions)
For the Years Ended December 31, | |||||||||||
2016 | 2015 | 2014 | |||||||||
Supplemental disclosure of cash flow information: | |||||||||||
Interest paid (excluding consolidated Funds) | $ | 3.1 | $ | 3.7 | $ | 64.4 | |||||
Income taxes paid | $ | 23.5 | $ | 9.5 | $ | 6.1 | |||||
Net consolidation (de-consolidation) of Funds | $ | 5.5 | $ | (2,520.9 | ) | $ | 31.4 | ||||
Non-cash capital contribution to Parent | $ | — | $ | (0.1 | ) | $ | (14.4 | ) | |||
Non-cash capital contribution from Parent | $ | — | $ | — | $ | 258.6 | |||||
See Notes to Consolidated Financial Statements
118
OM Asset Management plc
Notes to Consolidated Financial Statements (Continued)
December 31, 2016 and 2015
1) Organization and Description of the Business
OM Asset Management plc (“OMAM” or the “Company”), through its subsidiaries, is a global asset management business with interests in a diverse group of boutique investment management firms (the “Affiliates”) individually headquartered in the United States. The Company provides investment management services globally to predominantly institutional investors, in asset classes that include U.S. and global equities, fixed income, alternative assets, real estate, timber and secondary Funds. Fees for services are largely asset-based and, as a result, the Company’s revenue fluctuates based on the performance of financial markets and investors’ asset flows in and out of the Company’s products.
The Company’s Affiliates are organized as limited liability companies. The Company generally utilizes a profit-sharing model in structuring its compensation and ownership arrangements with Affiliates. The Affiliates’ variable compensation is generally based on each firm’s profitability. OMAM and Affiliate key employees share in profits after variable compensation according to their respective ownership interests. The profit-sharing model results in the alignment of OMAM and Affiliate key employee economic interests, which is critical to the Company’s talent management strategy and long-term growth of the business.
The Company is a majority-owned subsidiary of Old Mutual plc (the “Parent”), an international long-term savings, protection and investment group, listed on the London Stock Exchange.
Reorganization
Prior to the initial public offering of the Company’s business (the “Offering”), the Company’s U.S. holding company, Old Mutual (US) Holdings Inc. (“OMUSH”) was a subsidiary of OM Group (UK) Limited (“OMGUK”) which was in turn wholly owned by the Parent. The board of directors of the Parent elected to undertake the Offering which was completed on October 15, 2014. The Company and the Parent determined that certain transactions (the “Reorganization”) should be undertaken in preparation for the Offering. Specifically, the pre-Offering restructuring steps described below were completed by the Company and the Parent prior to October 15, 2014:
1. | OMGUK incorporated OMAM in the United Kingdom as a direct, wholly-owned subsidiary of OMGUK. |
2. | OMAM incorporated OMAM US, Inc. in the State of Delaware (“U.S. Sub”) as a direct, wholly-owned subsidiary of OMAM. |
3. | U.S. Sub incorporated OMAM UK Limited in the United Kingdom (“U.K. Sub”) as a direct, wholly-owned subsidiary of U.S. Sub. |
4. | The Company’s existing intercompany debt, which was owed by OMUSH to OMGUK, was refinanced with new intercompany debt. |
5. | OMGUK contributed its shares in OMUSH and the new intercompany debt to OMAM in return for an issuance of shares by OMAM resulting in the elimination of existing intercompany debt of $1,003.5 million and the redemption of a $32.2 million intercompany receivable via a capital distribution back to OMGUK, for a net reduction of existing intercompany debt of $971.3 million. |
6. | The OMUSH shares were transferred to U.K. Sub via a series of share exchanges, and the new intercompany debt was contributed among OMAM, U.S. Sub and U.K. Sub. |
119
OM Asset Management plc
Notes to Consolidated Financial Statements (Continued)
December 31, 2016 and 2015
1) Organization and Description of the Business (cont.)
7. | OMAM underwent a reduction of share capital to maximize distributable reserves, re-registered in the United Kingdom as a public limited company, amended its articles of association to reflect the same and organized its share capital for purposes of the Offering. |
8. | OMAM declared a $175.0 million pre-Offering dividend to OMGUK. OMAM also issued a non-interest bearing promissory note to OMGUK in the principal amount of $37.0 million which was fully repaid by June 30, 2015. |
9. | OMAM entered into arrangements with OMGUK for the payment of future realizable benefits associated with certain deferred tax assets existing as of the date of the Offering, as well as co-investments made by the Company in real-estate and timber strategies of its Affiliates. The Deferred Tax Asset Deed was amended on June 13, 2016 to accelerate the repayment terms, with the remaining balance to be paid in three annual installments through June 30, 2018. Under the amended Deferred Tax Asset Deed, the Company will make three payments to OMGUK totaling $142.6 million, on each of June 30, 2017, December 31, 2017 and June 30, 2018. The liability associated with the co-investments have both a carrying value and fair value of $14.3 million at December 31, 2016. See Note 10 for more information. |
10. | The Company made a payment of the $175.0 million pre-Offering dividend to OMGUK, funded by a new third party credit facility entered into at the closing of the Offering; and |
11. | OMAM completed the purchase of additional ownership of an Affiliate for $60.0 million in cash, resulting in a reduction of liabilities for the same amount. |
Secondary Public Offerings
On June 22, 2015, the Company completed a secondary public offering by its Parent of 13,300,000 ordinary shares of the Company pursuant to the Securities Act of 1933, as amended. Additionally, the underwriters in the secondary public offering exercised their full overallotment option and purchased an additional 1,995,000 shares of the Company from the Parent. On December 16, 2016, the Company completed a secondary public offering by the Parent of 13,000,000 ordinary shares of the Company pursuant to the Securities Act of 1933, as amended. Additionally, the underwriters in the secondary public offering exercised their full overallotment option and purchased an additional 1,950,000 shares of the Company from the Parent. At December 31, 2016, the Parent owned 51.1% of the Company’s outstanding ordinary shares.
On March 11, 2016, the Parent announced the results of a strategic review, which included a plan to separate its underlying businesses, including OMAM. The Parent further announced on December 12, 2016 its intention to continue the reduction of its holdings in OMAM in an orderly manner which balances value, cost, time and risk.
Landmark Acquisition
In June 2016, the Company announced that it had signed a definitive agreement to acquire a 60% controlling interest in Landmark Partners, LLC, (“Landmark”) a leading global secondary private equity, real estate and real asset investment firm, for $242.4 million. On August 18, 2016 the Company closed this transaction and the results of Landmark have been included in the consolidated results of the Company from that date forward.
120
OM Asset Management plc
Notes to Consolidated Financial Statements (Continued)
December 31, 2016 and 2015
1) Organization and Description of the Business (cont.)
Share Repurchase Program
On February 3, 2016, the Company’s Board of Directors authorized a $150 million share repurchase program, which was approved by shareholders on March 15, 2016. In 2016, the Company purchased 921,740 shares on the open market at a weighted average price of $13.22/share.
On April 29, 2016, at the Company’s Annual General Meeting, shareholders (excluding the Parent) authorized a form of contract by which the Company would be permitted to repurchase shares directly from the Parent. The shareholder authorization does not contain a maximum dollar or share amount for such purchases individually or in aggregate from the Parent. On December 16, 2016 in connection with the secondary offering by the Parent, the Company repurchased 6,000,000 shares directly from the Parent at a price of $14.25/share.
All shares repurchased by the Company were retired.
Segment Information
The Company operates one business segment that provides investment management services and products to predominantly institutional clients. The primary measure used by the Chief Operating Decision Maker (“CODM”) in measuring performance and allocating resources is economic net income. As of each of December 31, 2016, and 2015, all of the Company’s material long-lived assets were domiciled in the United States. For each of the years ended December 31, 2016, 2015 and 2014, 100% of the Company’s revenue from external customers was attributed to the United States.
121
OM Asset Management plc
Notes to Consolidated Financial Statements (Continued)
December 31, 2016 and 2015
2) Basis of Presentation and Significant Accounting Policies
The Company’s significant accounting policies are as follows:
Basis of presentation
These Consolidated Financial Statements reflect the historical balance sheets; statements of operations; statements of comprehensive income; statements of changes in shareholders’ equity; and statements of cash flows of the Company. Within these Consolidated Financial Statements, entities that are part of the Parent’s consolidated results, but are not part of OMAM are referred to as “related parties.” These historical Consolidated Financial Statements prepared prior to the Offering use the Parent’s historical basis in determining the assets and liabilities and the results of the Company. The financial information included herein may not reflect the consolidated financial position, operating results, changes in the Parent’s equity investment and cash flows of the Company in the future, and does not reflect what they would have been had the Company been a separate, stand-alone entity for the entirety of the periods presented.
The Company historically utilized the services of the Parent for certain functions. These services included providing working capital, as well as certain finance, internal audit, insurance, human resources, investor relations, risk, governance and other corporate functions and projects. The cost of these services was allocated to the Company and included in the Consolidated Financial Statements. The allocations were determined on the basis which the Parent and the Company considered to be reasonable reflections of the utilization of services provided by the Parent. Subsequent to the Offering, the Company assumed responsibility for the costs of these functions.
The Consolidated Financial Statements are prepared in accordance with accounting principles generally accepted in the United States (“U.S. GAAP”). All dollar amounts, except per share data in the text and tables herein, are stated in millions unless otherwise indicated. Transactions between the Company and the Parent are included in the Consolidated Financial Statements, however material intercompany balances and transactions among the Company, its consolidated Affiliates and consolidated Funds are eliminated in consolidation.
Consolidation
Affiliates
The Company evaluates each of its Affiliate and other operating entities to determine the appropriate method of accounting. Generally, majority-owned entities or otherwise controlled investments in which the Company holds a controlling financial interest as the principal shareholder, managing member, or general partner are consolidated.
Funds
In the normal course of business, the Company’s Affiliates sponsor and manage certain investment vehicles (the “Funds”). The Company assesses consolidation requirements with respect to its Funds pursuant to Accounting Standards Codification (“ASC”) Topic 810, Consolidation, as amended by Accounting Standards Update 2015-02, Consolidation: Amendments to the Consolidation Analysis (“ASU 2015-02”) relating to the consolidation of VIEs.
The Company elected to implement ASU 2015-02 using the modified retrospective method, which resulted in an effective date of adoption of January 1, 2015 and did not require the restatement of prior period results. In adopting ASU 2015-02, the Company re-evaluated all of its Affiliates’ Funds for consolidation. All Funds consolidated prior
122
OM Asset Management plc
Notes to Consolidated Financial Statements (Continued)
December 31, 2016 and 2015
2) Basis of Presentation and Significant Accounting Policies (cont.)
to January 1, 2015 pursuant to consolidation guidance superseded by ASU 2015-02 were de-consolidated as of January 1, 2015.
In evaluating whether or not a legal entity must be consolidated, the Company determines if such entity is a variable interest entity (“VIE”) or a voting interest entity (“VOE”). A VOE is considered an entity in which (i) the total equity investment at risk is sufficient to enable the entity to finance its activities independently and (ii) the equity holders at risk have the obligation to absorb losses, the right to receive residual returns, and the right to direct the activities of the entity that most significantly impact the entity’s economic performance. A VIE is an entity that lacks one or more of the characteristics of a VOE. Assessing whether an entity is a VIE or VOE involves judgment and analysis. Factors considered in this assessment include the entity’s legal organization, the entity’s capital structure and equity ownership and any related party or de-facto agent implications of the Company’s involvement with the entity. Investments that are determined to be VIEs are consolidated if the Company or a consolidated Affiliate is the primary beneficiary of the investment. VOEs are typically consolidated if the Company holds the majority voting interest or otherwise controls the entity.
In evaluating whether the Company is the primary beneficiary, the Company evaluates its economic interests in the entity held either directly by the Company or indirectly through related parties. The primary beneficiary of the VIE is defined as the variable interest holder that has a controlling financial interest. A controlling financial interest is defined as (i) the power to direct the activities of the VIE that most significantly impacts its economic performance and (ii) the obligation to absorb losses of the entity or the right to receive benefits from the entity that could potentially be significant to the VIE. If no single party satisfies both criteria, but the Company and its related parties satisfy the criteria on a combined basis, then the primary beneficiary is the entity out of the related party group that is most closely associated to the VIE. The consolidation analysis can generally be performed qualitatively, however, if it is not readily apparent that the Company is not the primary beneficiary, a quantitative analysis may also be performed. The Company generally is not the primary beneficiary of Fund VIEs created to manage assets for clients unless the Company’s ownership interest in the fund, including interests of related parties, is substantial.
The Company consolidates VOEs when it has control over significant operating, financial and investing decisions of the entity or holds the majority voting interest. For VOEs organized as limited partnerships or as an entity with governance structures similar to a limited partnership (e.g., limited liability company with a managing member), the Company consolidates an entity when it holds the controlling general partnership interest and the limited partners do not hold substantive participating rights or rights to remove and replace the general partner or rights that could provide the limited partners with the ability to impact the ongoing governance and operating activities of the entity.
Upon the occurrence of certain events (such as contributions and redemptions, either by the Company, its Affiliates, or third parties, or amendments to the governing documents of the Company’s investees or sponsored Funds) management reviews and reconsiders its previous conclusion regarding the status of an entity as a VIE or a VOE. Additionally, management continually reconsiders whether the Company is deemed to be a VIE’s primary beneficiary who consolidates such entity. In the third quarter of 2016, following the purchase of certain seed capital investments from its Parent, the Company began consolidating certain Funds pursuant to ASU 2015-02.
Prior guidance
Prior to the adoption of ASU 2015-02 on January 1, 2015, substantially all of the Funds managed by the Company qualified for the deferral granted under ASU 2010-10, “Amendments for Certain Investment Funds.” As such, the
123
OM Asset Management plc
Notes to Consolidated Financial Statements (Continued)
December 31, 2016 and 2015
2) Basis of Presentation and Significant Accounting Policies (cont.)
Company evaluated these Funds for consolidation pursuant to former guidance in Financial Accounting Standards Board (“FASB”) Interpretation No. 46(R), Consolidation of Variable Interest Entities. These Funds have typically been owned entirely by third-party investors, however certain Funds are capitalized with seed capital investments from the Company or its related parties and may be owned partially by Affiliate key employees and/or individuals that own minority interests in an Affiliate.
Other than Funds holding investments in timber assets (the “Timber Funds”), the Company’s consolidated Funds were investment companies (the “Investment Funds”) and the Company retained their specialized investment company accounting in consolidation, pursuant to ASC 946, “Financial Services—Investment Companies.”
Timber Funds
Prior to the adoption of ASU 2015-02, the Company’s Timber Funds did not qualify for the deferral under ASU 2010-10. Following the adoption of ASU 2015-02, Timber Funds and Investment Funds are evaluated pursuant to the same revised consolidation guidance. All of the Company’s Timber Funds that were previously consolidated were de-consolidated on January 1, 2015 upon the adoption of ASU 2015-02 utilizing the modified retrospective method.
Timber assets and timber lease rights of consolidated Timber Funds are stated at historical cost less depletion for timber previously harvested and less accumulated amortization and depreciation for lease rights and roads. Timber investment values are adjusted for capital additions made to the property subsequent to the valuation date. All initial silviculture costs, including site preparation and planting costs are capitalized as stand establishment costs. Stand establishment costs are transferred to a merchantable timber classification as trees reach a certain size. Generally, costs incurred subsequent to two years after planting, such as fertilization, vegetation, insect control and pre-commercial thinning are considered to be maintenance and are expensed as incurred.
The Company estimates its timber inventory using statistical information and data obtained from physical measurements, site maps, photo-types and other information gathering techniques. These estimates are updated annually and may result in adjustments of timber volumes, including timber growth rates and depletion rates.
Depletion consists of costs attributed to harvesting timber and is recorded as an expense as timber is harvested. The depletion rate applied to the volume of timber sold is adjusted annually and is based on the relationship of incurred costs in the merchantable timber classification to estimated current merchantable volume.
Derivatives and Hedging
The Company may utilize derivative financial instruments to hedge the risk of movement of interest rates and foreign currency on financial assets and liabilities. These derivative financial instruments may or may not qualify as hedges for accounting purposes. The Company records all derivative financial instruments as either assets or liabilities on its Consolidated Balance Sheets and measures these instruments at fair value. For a derivative financial instrument that qualifies as a hedge for accounting purposes and is designated as a hedging instrument, the effective portion of the derivative’s gain or loss is initially reported as a component of other comprehensive income (loss) and subsequently reclassified into earnings over the life of the hedge. The ineffective portion of the gain or loss is reported in earnings immediately.
124
OM Asset Management plc
Notes to Consolidated Financial Statements (Continued)
December 31, 2016 and 2015
2) Basis of Presentation and Significant Accounting Policies (cont.)
Use of estimates
The preparation of these Consolidated Financial Statements requires management to make estimates and assumptions that affect the reported amounts of assets and liabilities, the disclosure of contingent assets and liabilities at the date of the financial statements and the reported amounts of revenues and expenses during the period. Actual results could differ significantly from those estimates.
Operating segment
The Company operates in one operating segment that provides investment management services and products primarily to institutional clients. The Company’s determination that it operates one business segment is based on the fact that the Chief Operating Decision Maker (“CODM”) reviews the Company’s financial performance on an aggregate level.
Cash and cash equivalents
The Company considers all highly liquid investments, including money market mutual funds, with original maturities of three months or less to be cash equivalents. Cash equivalents are stated at cost, which approximates market value due to the short-term maturity of these investments.
Cash held by consolidated Funds is not available to fund general liquidity needs of the Company and is therefore classified as restricted cash.
Fair value measurements
In accordance with the provisions of FASB ASC 820, “Fair Value Measurement” (“ASC 820”), fair value is the price that the Company expects to be paid upon the sale of an asset or expects to pay upon the transfer of a liability in an orderly transaction between market participants. Pursuant to ASC 820, there is a three-level hierarchy for fair value measurements based upon the transparency of inputs to the valuation of an asset or liability. Inputs may be observable or unobservable and refer broadly to the assumptions that market participants would use in pricing the asset or liability. Observable inputs reflect the assumptions market participants would use in pricing the asset or liability based on market data obtained from independent sources. Unobservable inputs reflect the Company’s own conclusions about the assumptions that market participants would use in pricing the asset or liability based on the best information available in the circumstances. Each investment is assigned a level based upon the observability of the inputs which are significant to the overall valuation. Assets and liabilities measured and reported at fair value are classified and disclosed in one of the following categories:
•Level I—Quoted prices are available in active markets for identical investments as of the reporting date. The type of investments included in Level I include listed equities and listed derivatives. As required by U.S. GAAP, the Company does not adjust the quoted price for these investments.
•Level II—Pricing inputs are other than quoted prices in active markets, which are either directly or indirectly observable as of the reporting date, and fair value is determined through the use of models or other valuation methodologies utilizing observable market inputs other than quoted prices. Investments which are generally included in this category include corporate bonds and loans, less liquid and restricted equity securities and certain over-the-counter derivatives.
125
OM Asset Management plc
Notes to Consolidated Financial Statements (Continued)
December 31, 2016 and 2015
2) Basis of Presentation and Significant Accounting Policies (cont.)
•Level III—Pricing inputs are unobservable for the asset or liability and include assets and liabilities where there is little, if any, market activity for the investment. The inputs into the determination of fair value require significant management judgment or estimation. Investments that are included in this category generally include general and limited partner interests in corporate private equity, real estate funds, and funds of hedge funds.
In certain cases, the inputs used to measure fair value may fall into different levels of the fair value hierarchy. In such cases, an investment’s level within the fair value hierarchy is based on the lowest level of input that is significant to the fair value measurement. The Company’s assessment of the significance of a particular input to the fair value measurement in its entirety requires judgment and considers factors specific to the investment. The Company has adopted the provisions of Accounting Standards Update 2015-07, “Fair Value Measurement” (“ASU 2015-07”) where, in cases in which the fair value of an investment is established using the net asset value (or its equivalent) as a practical expedient, the investment will no longer be categorized within the fair value hierarchy.
Investments and Investment Transactions
Valuation of investments held at fair value
Valuation of Fund investments is evaluated pursuant to the fair value methodology discussed above. Other investments are categorized as trading and held at estimated fair value. Realized and unrealized gains and losses arising from changes in fair value of discretionary investments are reported within investment income in the Consolidated Statements of Operations. See Note 5 for a summary of the fair value inputs utilized to determine the fair value of other discretionary investments held at fair value.
Security transactions
The Investment Funds generally record securities transactions on a trade-date basis. Realized gains and losses on securities transactions are generally determined on the average-cost method (net of foreign capital gain taxes) and for certain transactions determined based on the specific identification method.
Income and expense recognition
The Investment Funds record interest income on an accrual basis and include amortization of premiums and accretion of discounts. Dividend income and expense on dividends sold short are recorded on the ex-dividend date, net of applicable withholding taxes. Expenses are recorded on an accrual basis.
126
OM Asset Management plc
Notes to Consolidated Financial Statements (Continued)
December 31, 2016 and 2015
2) Basis of Presentation and Significant Accounting Policies (cont.)
Foreign currency translation
The books and records of the Company and its Affiliates are maintained in U.S. dollars. Except for one Timber Fund in Australia consolidated prior to 2015, the books and records of consolidated Funds are maintained in U.S. dollars. Investment securities and other assets and liabilities denominated in a foreign currency are translated into U.S. dollars on the date of valuation. Income and expense transactions denominated in foreign currencies are translated into U.S. dollars using the average exchange rate over the period presented. The portion of realized or unrealized gains and losses resulting from changes in foreign exchange rates and from fluctuations arising from changes in the market prices of the underlying securities are included in the net realized and unrealized gain and loss on investments on the consolidated statement of operations. Net realized and unrealized gains and losses on foreign currency transactions represent net foreign exchange gains or losses from forward foreign currency exchange contracts, disposition of foreign currencies, currency gains or losses between the trade and settlement date on security transactions, and the difference between the amount of the investment income and foreign withholding taxes recorded on the Funds’ books and the U.S. dollar equivalent amounts actually received or paid.
Short sales
Certain Investment Funds may sell a security they do not own in anticipation of a decline in the fair value of that security. When a Fund sells a security short, it must borrow the security sold short and deliver it to the broker-dealer through which it made the short sale. The short sales are secured by the long portfolio and available cash. The Fund records a gain, limited to the price at which the Fund sold the security short, or a loss, unlimited in size, upon the termination of a short sale. The amount of the gain or loss will be equal to the proceeds received in entering into the short sale less the cost of buying back the short security to close the short position. While the transaction is open, the Fund will incur an expense for any accrued dividends or interest which is paid to the lender of the securities. These short sales may involve a level of risk in excess of the liability recognized in the accompanying consolidated balance sheet. The extent of such risk cannot be quantified.
Funds’ Derivatives
Certain Funds may use derivative instruments. The Funds’ derivative instruments include foreign currency exchange contracts, credit default swaps, interest rate swaps, financial futures contracts and warrants. The fair values of derivative instruments are recorded as other assets of consolidated Funds or other liabilities of consolidated Funds on the Company’s Consolidated Balance Sheets. The Company has used foreign exchange forwards to hedge the risk of movement in exchange rates on financial assets on a limited basis.
The Company’s Funds have not designated any financial instruments for hedge accounting, as defined in the accounting literature, during the periods presented. The gains or losses on Fund’s derivative instruments not designated for hedge accounting are included as net consolidated Funds gains or losses in the Company’s Consolidated Statements of Operations.
127
OM Asset Management plc
Notes to Consolidated Financial Statements (Continued)
December 31, 2016 and 2015
2) Basis of Presentation and Significant Accounting Policies (cont.)
Equity method investments
The Company uses the equity method of accounting for investments that provide the Company with the ability to exercise significant influence over an entity, but that do not meet the requirements for consolidation. Equity method investments include two Affiliates, Heitman LLC and Investment Counselors of Maryland, LLC as well as all unconsolidated Funds over which the Company exercises significant influence. The Company’s share of earnings from equity method investments is included in investment income in the Consolidated Statements of Operations. The carrying amounts of equity method investments are reflected in Investments in the Consolidated Balance Sheets. The Company evaluates its equity method investments for impairment whenever events or changes in circumstances indicate that the carrying amounts of such investments may not be recoverable. The difference between the carrying value and its estimated fair value is recognized as impairment when the loss is deemed other than temporary. Other investments, in which OMAM or an Affiliate do not exercise significant influence are accounted for under the cost method. Under the cost method, income is recognized as dividends are declared.
Revenue recognition
The Company’s consolidated revenue primarily represents management fees billed monthly, quarterly and annually by Affiliates for managing the assets of clients. Asset-based management fees are recognized monthly as services are rendered and are primarily based upon a percentage of the market value of client assets managed. Affiliates that manage tangible property may also earn transaction fees at the time the underlying property is bought and sold. Any fees collected in advance are deferred and recognized as income over the period earned. Dividend income received by Investment Funds is recorded on the ex-dividend date. Performance fees are generally assessed as a percentage of the investment performance realized on a client’s account. Additionally, separate accounts or other products which primarily earn management fees are potentially subject to performance adjustment up or down based on investment performance versus benchmark. Performance fees, including those that are subject to clawback are recognized when they (i) become billable to customers (based on contractual terms of agreements), (ii) are not subject to contingent repayment and (iii) when collection is reasonably assured. Other income and revenues include interest income on cash and cash equivalents of Investment Funds and the Company’s share of earnings from joint venture partners.
Timber Funds’ revenue is recognized from log and fiber sales upon delivery to the customer. The Company is typically responsible for all logging and hauling costs. However, under pay-as-cut timber contracts, title and risk of loss from stumpage sales transfer to the buyer as the trees are cut. Revenue is recognized as timber is harvested. The buyer is typically responsible for all logging and hauling costs.
Investment advisory fees receivable
The Company earns management and performance fees which are billed monthly, quarterly and annually in arrears, according to the terms of the relevant investment management agreement. Management and performance fees that have been earned, but have not yet been collected are presented as Investment advisory fees receivable on the Consolidated Balance Sheets. Due to the short-term nature and liquidity of these receivables, the carrying amounts approximate their fair values. The Company typically does not record an allowance for doubtful accounts or bad debt expense, or any amounts recorded have been immaterial.
128
OM Asset Management plc
Notes to Consolidated Financial Statements (Continued)
December 31, 2016 and 2015
2) Basis of Presentation and Significant Accounting Policies (cont.)
Allocated Costs from the Parent
The Company’s Parent has historically provided the Company with various services, including governance through the board of directors and executive committees, investor relations, procurement of insurance coverage, human resources, financial reporting, internal audit, treasury, systems, risk and tax services. Many of these services have been transitioned to the Company and therefore the cost charged by the Parent has decreased. The costs associated with the services which have been (i) directly attributable to the Company, (ii) have been charged directly to the Company by the Company’s Parent, and (iii) have been paid to the Company’s Parent by the Company have been reflected in the Company’s Consolidated Financial Statements. During the years ended December 31, 2016, 2015 and 2014, the amount of expenses charged directly to the Company from the Company’s Parent were $0.9 million, $1.8 million and $2.1 million, respectively.
With respect to the above services and benefits which are not directly attributable to the Company, costs were allocated to the Company and included in the Consolidated Financial Statements, based generally on the Company’s proportion of the total Parent’s consolidated, normalized revenues. During the year ended December 31, 2014, costs allocated to the Company from Parent were $3.4 million. Subsequent to the Offering (see Note 1), these general costs are no longer allocated and if required are borne directly by the Company.
These cost allocations were determined using a method that the Parent and the Company considered reasonably reflected the costs of such services attributable to the Company provided by the Parent. The Company believes the assumptions and allocations underlying the Consolidated Financial Statements are reasonable and the allocated amounts are representative of the amounts that would have been recorded in the Consolidated Financial Statements had the Company operated independent of the Parent for the historical periods presented prior to the Offering. A more detailed discussion of the relationship with the Parent, including a description of the costs that have been allocated to the Company, as well as the allocation methods, is included in Note 10, “Related Party Transactions.”
Fixed assets
Fixed assets are recorded at historical cost and depreciated using the straight-line method over its estimated useful lives. The estimated useful lives of office equipment and furniture and fixtures range from three to five years. Leasehold improvements are amortized over the shorter of their estimated useful lives or the remaining term of the lease. Computer software developed or obtained for internal use is amortized using the straight-line method over the estimated useful life of the software, which is generally three years or less. The estimated useful life of building assets is thirty-nine years. The costs of improvements that extend the life of a fixed asset are capitalized, while the costs of repairs and maintenance are expensed as incurred.
129
OM Asset Management plc
Notes to Consolidated Financial Statements (Continued)
December 31, 2016 and 2015
2) Basis of Presentation and Significant Accounting Policies (cont.)
Intangible assets
Acquired Affiliates have identifiable intangible assets arising from contractual or other legal rights with their clients. In determining the value of acquired intangibles, the Company analyzes the net present value of each acquired Affiliate’s existing client relationships based on a number of factors. The Company analyzes the Affiliate’s historical and potential future operating performance, the Affiliate’s historical and potential future rates of attrition among existing clients, the stability and longevity of existing client relationships, the Affiliate’s recent and long-term investment performance, the characteristics of the firm’s products and investment styles, the stability and depth of the Affiliate’s management team and the Affiliate’s history and perceived franchise or brand value. The Company’s acquired intangible assets are predominately definite-life intangible assets and are generally amortized on a straight line basis over their estimated useful lives, ranging from five to sixteen years, reflecting the expected duration of such relationships. The Company also holds an indefinite-life intangible asset related to the trade name associated with the Landmark acquisition.
The Company tests for the possible impairment of acquired intangibles whenever events or changes in circumstances indicate that the carrying amount of the asset is not recoverable. If such indicators exist, the Company compares the undiscounted cash flows related to the asset to the carrying value of the asset. If the carrying value is greater than the undiscounted cash flow amount, an impairment charge is recorded in the Consolidated Statements of Operations for amounts necessary to reduce the carrying value of the asset to fair value. Intangible assets to be disposed of are reported at the lower of carrying value or fair value less cost to sell.
Goodwill
The Company records goodwill when the consideration paid in a business acquisition exceeds the fair value of the net total of tangible assets acquired, identifiable intangible assets acquired and liabilities assumed. Goodwill is not amortized, but rather is tested for impairment annually or more frequently if events or circumstances occur that indicate impairment may exist. Factors that could trigger an impairment review include significant underperformance relative to historical or projected future operating results, significant changes in the Company’s use of the acquired assets in a business combination or the strategy for the Company’s overall business, and significant negative industry or economic trends.
The Company performs its assessment for impairment of goodwill during the fourth quarter annually as of September 30, or as necessary, and the Company has determined that it has six reporting units, consisting of the six consolidated Affiliates. The Company first considers various qualitative factors to determine if it is more likely than not that the fair value of each of the reporting units is greater than its respective carrying amount, including goodwill. If the fair value of any reporting unit declines below its respective carrying amount, therefore indicating that impairment may exist, the impact would be determined at that point. For purposes of assessing potential impairment, the fair value of the reporting unit is estimated and compared to the carrying value of the reporting unit. The fair value of a reporting unit is based on discounted estimated future cash flows. The assumptions used to estimate fair value include management’s estimates of future growth rates, operating cash flows, discount rates and terminal value. These assumptions and estimates can change in future periods based on market movement and factors impacting the expected business performance. Changes in assumptions or estimates could materially affect the determination of the fair value of a reporting unit. If it is determined that the carrying value of the reporting unit exceeds its fair value, the Company determines the implied fair value of the goodwill in the same manner used to determine the amount of goodwill in a business combination. If the carrying value of goodwill exceeds the implied
130
OM Asset Management plc
Notes to Consolidated Financial Statements (Continued)
December 31, 2016 and 2015
2) Basis of Presentation and Significant Accounting Policies (cont.)
fair value of the goodwill, an impairment charge is recognized in the amount equal to that excess. Based on the Company’s most recent annual goodwill impairment test, the fair value of all its reporting units were in excess of their carrying value.
Leases
The Company and its Affiliates currently lease office space and equipment under various leasing arrangements, classified as operating leases. Some lease agreements contain renewal options, rent escalation clauses or other inducements provided by the landlord. Rent expense is accrued to recognize lease escalation provisions and inducements provided by the landlord, if any, on a straight-line basis over the lease term.
Earnings per share
The Company calculates basic and diluted earnings per share (“EPS”) by dividing net income for the years ended December 31, 2016 and 2015 by its shares outstanding as outlined below. For periods prior to the Offering (described in Note 1), the Company is calculating pro forma basic and fully diluted EPS based upon 120 million pro forma shares, the number of shares outstanding following the Reorganization described in Note 1.
Basic EPS attributable to the Company’s shareholders is calculated by dividing “Net income attributable to controlling interests” by the weighted-average number of shares outstanding. Diluted EPS is similar to basic EPS, but adjusts for the effect of potential ordinary shares unless they are antidilutive. For periods with a net loss, potential ordinary shares are considered antidilutive.
The Company considers two ways to measure dilution to earnings per share: (a) calculate the net number of shares that would be issued assuming any related proceeds are used to buy back outstanding shares (the treasury stock method), or (b) assume the gross number of shares are issued and calculate any related effects on net income available for shareholders (the if-converted or two-class method). As appropriate, the Company’s policy is to apply the more dilutive methodology upon issuance of such instruments.
Compensation arrangements
The Company operates short term variable compensation arrangements where generally, a percentage of each Affiliate’s annual pre-variable compensation earnings, as defined in each arrangement, is allocated to a “pool” of each respective Affiliate’s key employees, and subsequently distributed to individuals subject to recommendation and approval of a Remuneration Committee comprised of both the Company’s and each respective Affiliate’s management. Variable compensation expense is accrued and recognized in the Consolidated Statements of Operations as services are provided by individual employees.
131
OM Asset Management plc
Notes to Consolidated Financial Statements (Continued)
December 31, 2016 and 2015
2) Basis of Presentation and Significant Accounting Policies (cont.)
The Company operates longer term profit-interest plans whereby certain Affiliate key employees are granted (or have a right to purchase) awards representing a profits interest in their respective Affiliate, as distinct from an equity interest due to the lack of pari passu voting rights. Under these plans, the Company may award a portion of the aforementioned variable compensation arrangement through issuance of a profits interest in the Affiliate. The awards generally have a three to five year vesting period from the grant date, and the service period begins at the commencement of the financial period to which the variable compensation relates. Under these plans, Affiliate key employees are eligible to share in the profits of their respective Affiliates based on their respective percentage interest held.
In addition, under certain circumstances, Affiliate key employees are eligible to receive a series of repurchase payments upon exiting the plans based on a multiple of the last twelve months profits of their respective Affiliate, as defined. Profits allocated and movements in the potential repurchase value, determined based on a fixed multiple times trailing twelve month profits, as defined, are recognized as compensation expense. Profit interests compensation liabilities are re-measured at each reporting date at the current trailing twelve month earnings multiple, with movements treated as compensation expense in the Company’s Consolidated Statements of Operations.
Share-based compensation plans
The Company recognizes the cost of all share-based payments to directors, senior management and employees, including grants of restricted stock and stock options of its Parent and its Affiliates, as compensation expense in the Consolidated Statements of Operations over the respective vesting periods. Awards made previously under the Parent’s restricted stock and stock options plans are accounted for as equity settled, and the grant date fair value is recognized as compensation expense over the requisite service period, with a corresponding contribution to capital recorded.
In connection with the Offering, certain unvested restricted shares of the Parent were exchanged for unvested restricted shares of the Company. Awards made under the Company’s equity plans are accounted for as equity settled, and the grant date fair value is recognized as compensation expense over the requisite service period, with a corresponding contribution to capital recorded. Valuation of restricted stock awards (“RSAs”) and restricted stock units (“RSUs”) is determined based on the Company’s closing share price as quoted on the New York Stock Exchange on the measurement date. For performance-based RSUs, a Monte-Carlo simulation model is used to determine the fair value. Key inputs for the model include: assumed reinvestment of dividends, risk-free interest rate and expected volatility.
Awards of equity made to Affiliate key employees are accounted for as cash settled, with the fair value recognized as compensation expense over the requisite service period, with a corresponding liability carried within other compensation liabilities on the Consolidated Balance Sheet until the award is settled by the Company. The fair value of the liability is based on the expected cash to be paid, as determined according to earnings multiples prescribed by each arrangement. The liability is revalued at each reporting period, with any movements recorded within compensation expense.
132
OM Asset Management plc
Notes to Consolidated Financial Statements (Continued)
December 31, 2016 and 2015
2) Basis of Presentation and Significant Accounting Policies (cont.)
Deferred financing costs
The Company capitalizes certain legal, accounting and other third-party fees that are directly associated with in-process equity financings as other assets until such financings are consummated. After consummation of the equity financing, these costs are recorded in total equity as a reduction of Shareholders’ equity generated as a result of the offering. At the time in which the equity financing is no longer considered probable of being consummated, the deferred financing costs are expensed immediately as a charge to operating expenses in the Consolidated Statement of Operations.
Pursuant to ASU 2015-03, “Simplifying the Presentation of Debt Issuance Costs,” the Company records debt issuance costs of term loans as a direct deduction from the carrying amount of the associated debt liability. For debt issuance costs of revolving credit loans, the Company follows the guidance of ASU 2015-15, “Presentation and Subsequent Measurement of Debt Issuance Costs Associated with Line-of-Credit Arrangements,” which permits presenting debt issuance costs as an asset and subsequently amortizing the deferred costs ratably over the term of the agreement.
Income taxes
The Company uses the asset and liability method of accounting for income taxes on a “separate return” basis. Under this method, a subsidiary is assumed to file a separate return with the taxing authority, thereby reporting its taxable income or loss and paying the applicable tax to or receiving the appropriate refund from the parent. The rules followed by the subsidiary in computing its tax or refund should be the same as those followed by a taxpayer filing directly with the taxing authority.
The Company files tax returns directly with the U.K., U.S. and state tax authorities and therefore, the computations under the separate return method follow the Company’s filings.
Deferred income taxes are recognized for the effects of temporary differences between the tax basis of an asset or liability and its reported amount in the Consolidated Financial Statements. Deferred tax assets and liabilities are measured using enacted tax rates expected to apply to taxable income in the years in which those temporary differences are expected to be recovered or settled. The effect of a change in tax rates on deferred tax assets and liabilities is recognized in income in the period that includes the enactment date. The Company’s deferred tax assets have been attributable to federal and state loss carry forwards, interest deductions, and accrued liabilities.
Deferred income tax assets are subject to a valuation allowance if, in management’s opinion, it is not more-likely-than-not that these benefits will be realized. In evaluating the Company’s ability to recover its deferred tax assets, the Company considers all available positive and negative evidence including its past operating results, the existence of cumulative earnings or losses in the most recent years and its forecast of future taxable income. In estimating future taxable income, the Company develops assumptions including the amount of future pre-tax operating income and the reversal of temporary differences. These assumptions require significant judgment about the forecasts of future taxable income and are consistent with the plans and estimates the Company is using to manage the underlying businesses.
133
OM Asset Management plc
Notes to Consolidated Financial Statements (Continued)
December 31, 2016 and 2015
2) Basis of Presentation and Significant Accounting Policies (cont.)
A tax benefit should only be recognized if it is more-likely-than-not that the position will be sustained based on its technical merits. The Company recognizes the financial statement benefit of a tax position only after considering the probability that a tax authority would uphold the position in an examination. For tax positions meeting a “more-likely-than-not” threshold, the amount recognized in the financial statements is the largest amount of benefit greater than 50% likely of being sustained. The more-likely-than-not threshold must continue to be met in each reporting period to support continued recognition of the benefit. Unrecognized tax benefits and related interest and penalties, are adjusted periodically to reflect changing facts and circumstances. The Company’s accounting policy is to classify interest and related charges as a component of income tax expense.
Non-controlling interests
For certain entities that are consolidated, but not 100% owned, the Company reports non-controlling interests as equity on its Consolidated Balance Sheets. The Company's consolidated net income on the Consolidated Statements of Operations includes the income (loss) attributable to non-controlling interest holders of the Company's consolidated Affiliates and Funds. Ownership interests held by Affiliate key employees are categorized as liabilities on the Consolidated Balance Sheets and are revalued each reporting date, with movements treated as compensation expense in the Consolidated Statements of Operations.
Non-controlling interests in consolidated Funds on the Consolidated Balance Sheets include undistributed income owned by the investors in the respective Funds. The Company’s consolidated net income on the Consolidated Statements of Operations includes the income (loss) attributable to non-controlling interest holders of these consolidated entities.
Redeemable non-controlling interests
The Company includes redeemable non-controlling interests related to certain consolidated Funds as temporary equity on the Consolidated Balance Sheets. Non-controlling interests in certain consolidated Funds are subject to monthly or quarterly redemption by the investors. When redeemable amounts become legally payable to investors, they are classified as a liability and included in total liabilities of consolidated Funds on the Consolidated Balance Sheets.
Other comprehensive income (loss)
Other comprehensive income (loss) is defined as the change in equity of a business enterprise during a period from transactions and other events and circumstances, excluding those resulting from investments by and distributions to owners. For the Company’s purposes, comprehensive income (loss) represents net income (loss), as presented in the accompanying Consolidated Statements of Operations, adjusted for net foreign currency translation adjustments and adjustments to the valuation of certain derivative securities, net of tax.
134
OM Asset Management plc
Notes to Consolidated Financial Statements (Continued)
December 31, 2016 and 2015
2) Basis of Presentation and Significant Accounting Policies (cont.)
Restructuring costs
A liability for restructuring is recognized only after management has developed a formal plan, approved by the Board of Directors, to which it has committed. The costs included in a restructuring liability are those costs that are either incremental or incurred as a direct result of the plan, or are the result of a continuing contractual obligation with no continuing economic benefit to the Company, or a penalty incurred to cancel the contractual obligation. Refer to Note 22 for details of the Company’s restructuring activities.
Recent accounting developments
Revenue from contracts with customers
In May 2014, the FASB issued ASU 2014-9, Revenue from Contracts with Customers. ASU 2014-9 modifies existing U.S. GAAP revenue recognition standards to more closely align with international accounting standards. Additionally, the guidance requires improved disclosures around the nature, amount, timing and uncertainty of revenue recognized. Under the standard, a company is required to (a) identify the contract(s) with a customer, (b) identify the performance obligations in the contract, (c) determine the transaction price, (d) allocate the transaction price to the performance obligations in the contract, and (e) recognize revenue when (or as) the entity satisfies a performance obligation. Since issuing the standard, the FASB has issued several amendments, including clarifying certain components of the standard as well as delaying the mandatory adoption date of ASU 2014-9 for public entities to annual reporting periods beginning after December 15, 2017. ASU 2014-9, as amended, will be effective for the Company on January 1, 2018.
The guidance permits two methods of adoption; a full retrospective adoption will apply the standard to each prior reporting period presented and a modified retrospective adoption, where the cumulative effect of initially applying the guidance recognized at the date of initial application. The Company currently anticipates adopting the standard using the modified retrospective method.
While the Company does not currently anticipate that the adoption of ASU 2014-09 will result in a material change to the timing of when revenue is recognized, the Company is continuing to evaluate other possible impacts of the standard, including potential changes to the accounting for customer acquisition costs and how to record certain fund expenses passed through to an investor in the fund. The Company is also continuing to evaluate and incorporate applicable industry guidance, including Asset Management Revenue Recognition Task Force papers published by the American Institute of Certified Public Accountants.
Leases
In January 2016, the FASB issued ASU 2016-02, Leases. ASU 2016-02 changes existing GAAP by requiring the recognition of lease assets and lease liabilities by lessees for those leases previously classified as operating leases under previous GAAP. The lease asset would reflect a right-to-use asset and the lease liability would reflect the present value of the future lease payments. ASU 2016-02 is effective for public companies for fiscal years beginning after December 15, 2018 and a modified retrospective transition approach is required where companies will have to recognize and measure leases at the beginning of the earliest period presented.
135
OM Asset Management plc
Notes to Consolidated Financial Statements (Continued)
December 31, 2016 and 2015
2) Basis of Presentation and Significant Accounting Policies (cont.)
The Company has performed a preliminary assessment of ASU 2016-02 and has begun formulating an implementation plan. The Company is generally able to categorize its leases as either real estate leases (for office space) or as “all other” leases. Recording real estate leases under ASU 2016-02 is expected to create a category of “right-to-use” assets on the balance sheet of the Company to record the value of the leased office space in an amount equal to the net present value of future lease payments due (see Note 8), offset by a liability representing the total amounts due for the current value of future lease obligations. For all other leases, a roster must be assembled and evaluations must be performed, but the Company does not expect there to be a material impact to its Consolidated Financial Statements.
3) Acquisitions
On August 18, 2016, the Company acquired a majority of the equity interests in Landmark Partners, LLC, a leading global secondary private equity, real estate and real asset investment firm. The Company acquired a 60% interest in Landmark in exchange for $242.4 million. There is also the potential for an additional payment of up to $225.0 million on or around December 31, 2018, subject to service and other conditions. The equity interests of Landmark purchased by the Company entitle the Company to participate in the earnings of Landmark. Certain key members of the management team of Landmark retained the remaining 40% interest in Landmark, subject to certain vesting conditions. The Company financed the acquisition through proceeds from multiple note offerings, including $275.0 million of 4.80% senior notes due July 27, 2026 and $125.0 million of 5.125% senior notes due August 1, 2031. (see Note 13)
OMAM accounted for the acquisition of Landmark as a business combination under ASC 805, “Business Combinations,” which requires assets and liabilities assumed to be recorded at fair value. The following table presents a summary of the acquisition-date fair values of the assets acquired and liabilities assumed for OMAM’s acquisition of Landmark:
Landmark | ||||
Purchase price | ||||
Cash | $ | 238.9 | ||
Seller’s expenses | 3.5 | |||
Total consideration | 242.4 | |||
Identifiable assets and liabilities | ||||
Cash | 23.4 | |||
Receivables | 8.5 | |||
Indefinite-life trade name | 1.0 | |||
Amortizable intangible asset management contracts | 85.0 | |||
Fixed assets | 5.1 | |||
Other current assets (liabilities), net | (25.1 | ) | ||
Assets (liabilities), net | (1.7 | ) | ||
Total identifiable assets and liabilities | 96.2 | |||
Goodwill | $ | 146.2 | ||
136
OM Asset Management plc
Notes to Consolidated Financial Statements (Continued)
December 31, 2016 and 2015
3) Acquisitions (cont.)
The primary aspects of the purchase price allocation relate to amortizable intangible asset management contracts, the indefinite-life trade name and goodwill, which is the amount by which the purchase price exceeds the fair value of the net assets acquired. The amounts recorded for certain assets and liabilities are subject to adjustment as additional information is obtained about the facts and circumstances that existed as of the acquisition date. The final determination of the fair values of certain assets and liabilities will be completed within the measurement period of up to one year from the applicable acquisition date, as permitted under U.S. GAAP. The final values may also result in changes to the amortization expense related to intangible assets and will be recognized in the period of adjustment. Any potential adjustments made could be material in relation to the values presented in the table above.
The fair value of the amortizable intangible asset management contracts was determined using the excess earnings method, a form of the income approach. The principle behind the excess earnings method is that the value of the intangible asset is equal to the present value of the after-tax cash flows attributable to the intangible asset only. Excess earnings represent the earnings remaining after applying post-tax contributory asset charges to reflect the return required on other assets that contribute to the generation of the forecast cash flows of the intangible asset.
The fair value of the trade name intangible asset was determined utilizing a relief-from-royalty method. The principle behind this method is that the value of the intangible asset is equal to the present value of the after-tax royalty savings attributable to owning the intangible asset.
The fair value estimate for all identifiable intangible assets is preliminary and is based on assumptions that market participants would use in pricing an asset, based on the most advantageous market for the asset (i.e., its highest and best use). This preliminary fair value estimate could include assets that are not intended to be used, may be sold or are intended to be used in a manner other than their best use.
The fair value of the acquired amortizable intangible asset management contracts had a preliminary useful life estimate of approximately 13.4 years at acquisition. Purchase price allocated to intangible assets and goodwill is expected to be deductible for U.S. tax purposes over a period of 15 years. Goodwill is calculated as the excess of the fair value of the consideration paid and the values assigned to the identifiable tangible and intangible assets acquired and liabilities assumed.
During the year ended December 31, 2016, there were $6.1 million of costs incurred in connection with the acquisition of Landmark. These costs are recorded within general and administrative expense in the Consolidated Statements of Operations.
In conjunction with the acquisition, OMAM entered into compensation arrangements with employees of Landmark where pre-acquisition equity units held by Landmark employees became subject to a service condition. These units are accounted for as stock-based compensation, were fair valued as of the closing date of the acquisition and vest over varying increments from December 31, 2018 through December 31, 2024. These units contain put rights that provide liquidity to the employees upon vesting. The aforementioned additional payment of up to $225.0 million could be paid based on the growth of Landmark’s business. This arrangement is also accounted for as stock-based compensation, fair valued as of the closing date of the acquisition, and vests on December 31, 2018. Both the pre-acquisition equity units and the potential future payment will be subsequently remeasured at the end of each reporting period.
137
OM Asset Management plc
Notes to Consolidated Financial Statements (Continued)
December 31, 2016 and 2015
3) Acquisitions (cont.)
The financial results of Landmark included in OMAM’s consolidated financial results for the year ended December 31, 2016 include revenues of $28.4 million, with $(13.5) million of net loss included in net income attributable to OMAM, which includes amortization of intangible assets recorded in purchase accounting and compensation expense for the arrangements with employees of Landmark noted above.
Unaudited Pro Forma Financial Information
The following unaudited pro forma financial information presents the combined financial results of OMAM and Landmark, as though the acquisition had occurred as of January 1, 2015. The unaudited pro forma financial information reflects certain adjustments for amortization expense related to the fair value of acquired intangible assets, interest expense related to debt incurred to finance the acquisition, amortization related to stock-based compensation arrangements entered into in conjunction with the acquisition, and the income tax impact of the pro forma adjustments. The unaudited pro forma financial information is for informational purposes only and is not necessarily indicative of the financial results that would have been achieved had the acquisition actually occurred at the beginning of the first period presented. Further, adjustments relating to asset management contract assets are preliminary, and subject to revision, as described above. (in millions, except for per-share data)
For the year ended December 31, | |||||||
2016 | 2015* | ||||||
Revenues | $ | 713.5 | $ | 780.1 | |||
Total operating expenses | 594.7 | 651.9 | |||||
Income from continuing operations before taxes | 109.2 | 114.8 | |||||
Net income attributable to OMAM shareholders | 91.7 | 97.6 | |||||
Net income per share attributable to OMAM shareholders: | |||||||
Basic | $0.77 | $0.81 | |||||
Diluted | $0.77 | $0.81 | |||||
* The preliminary pro forma financial information originally provided via Form 8-K/A filed with the U.S. Securities and Exchange Commission (“SEC”) on November 2, 2016 has been revised to include additional expense estimates that more accurately reflect the combined financial results of OMAM and Landmark. Thus, the pro forma information included in this Note 3 supersedes the pro forma information previously filed with the SEC.
138
OM Asset Management plc
Notes to Consolidated Financial Statements (Continued)
December 31, 2016 and 2015
4) Investments
Investments are comprised of the following at December 31 (in millions):
2016 | 2015 | ||||||
Investments of consolidated Funds held at fair value | 35.5 | — | |||||
Other investments held at fair value | 17.5 | — | |||||
Investments related to long-term incentive compensation plans held at fair value | 78.1 | 66.9 | |||||
Equity-accounted investments in unconsolidated Funds (Note 7) | 30.5 | 30.1 | |||||
Total investments held at fair value | 161.6 | 97.0 | |||||
Equity-accounted investments in Affiliates (Note 7) | 55.2 | 54.0 | |||||
Other investments* | 52.0 | 51.6 | |||||
Total investments per Consolidated Balance Sheets | $ | 268.8 | $ | 202.6 | |||
Investment income is comprised of the following for the years ended December 31 (in millions):
2016 | 2015 | 2014 | |||||||||
Investment return of equity-accounted investments in unconsolidated Funds (Note 7) | $ | 1.2 | $ | 0.3 | $ | 1.9 | |||||
Realized and unrealized gains (losses) on other investments held at fair value | 0.8 | — | 0.7 | ||||||||
Investment return of held for sale investments | 0.1 | — | — | ||||||||
Total return on OMAM investments | 2.1 | 0.3 | 2.6 | ||||||||
Investment return of equity-accounted investments in Affiliates (Note 7) | 15.1 | 12.7 | 9.6 | ||||||||
Total investment income per Consolidated Statement of Operations | $ | 17.2 | $ | 13.0 | $ | 12.2 | |||||
* Other investments represent cost-basis investments made by one of our Affiliates, including investments in timber and timberlands. At December 31, 2016, $50.1 million of these investments were recorded at the lower of cost or fair value less costs to sell, and subsequently sold in January 2017 for a net gain of approximately $1.7 million.
139
OM Asset Management plc
Notes to Consolidated Financial Statements (Continued)
December 31, 2016 and 2015
5) Fair Value Measurements
The following table summarizes the Company’s assets and liabilities that are measured at fair value on a recurring basis at December 31, 2016 (in millions):
Quoted prices in active markets (Level I) | Significant other observable inputs (Level II) | Significant unobservable inputs (Level III) | Uncategorized | Total value, December 31, 2016 | |||||||||||||||
Assets of OMAM and consolidated Funds(1) | |||||||||||||||||||
Common and preferred stock | $ | 35.1 | $ | — | $ | — | $ | — | $ | 35.1 | |||||||||
Short-term investment funds | 0.4 | — | — | — | 0.4 | ||||||||||||||
Consolidated Funds total | 35.5 | — | — | — | 35.5 | ||||||||||||||
Investments in separate accounts(2) | 7.5 | — | — | — | 7.5 | ||||||||||||||
Investments related to long-term incentive compensation plans(3) | 78.1 | — | — | — | 78.1 | ||||||||||||||
Investments in unconsolidated Funds(4) | — | — | — | 40.5 | 40.5 | ||||||||||||||
OMAM total | 85.6 | — | — | 40.5 | 126.1 | ||||||||||||||
Total fair value assets | $ | 121.1 | $ | — | $ | — | $ | 40.5 | $ | 161.6 | |||||||||
Liabilities of OMAM and consolidated Funds(1) | |||||||||||||||||||
Common stock | $ | (5.0 | ) | $ | — | $ | — | $ | — | $ | (5.0 | ) | |||||||
Consolidated Funds total | (5.0 | ) | — | — | — | (5.0 | ) | ||||||||||||
Derivative securities | — | (0.1 | ) | — | — | (0.1 | ) | ||||||||||||
OMAM total | — | (0.1 | ) | — | — | (0.1 | ) | ||||||||||||
Total fair value liabilities | $ | (5.0 | ) | $ | (0.1 | ) | $ | — | $ | — | $ | (5.1 | ) | ||||||
140
OM Asset Management plc
Notes to Consolidated Financial Statements (Continued)
December 31, 2016 and 2015
5) Fair Value Measurements (cont.)
The following table summarizes the Company’s assets and liabilities that are measured at fair value on a recurring basis at December 31, 2015 (in millions):
Quoted prices in active markets (Level I) | Significant other observable inputs (Level II) | Significant unobservable inputs (Level III) | Uncategorized | Total value, December 31, 2015 | |||||||||||||||
Assets of OMAM(1) | |||||||||||||||||||
Investments related to long-term incentive compensation plans(3) | $ | 66.9 | $ | — | $ | — | $ | — | $ | 66.9 | |||||||||
Investments in unconsolidated Funds(4) | — | — | — | 30.1 | 30.1 | ||||||||||||||
Total fair value assets | $ | 66.9 | $ | — | $ | — | $ | 30.1 | $ | 97.0 | |||||||||
Liabilities of OMAM(1) | |||||||||||||||||||
Derivative securities | $ | — | $ | (8.8 | ) | $ | — | $ | — | $ | (8.8 | ) | |||||||
Total fair value liabilities | $ | — | $ | (8.8 | ) | $ | — | $ | — | $ | (8.8 | ) | |||||||
(1) | Assets and liabilities measured at fair value are comprised of financial investments managed by the Company’s Affiliates. $35.5 million in assets and $5.0 million in liabilities at December 31, 2016 and $0.0 million in assets and $0.0 million in liabilities at December 31, 2015 are the result of the consolidation of Funds sponsored by the Company’s Affiliates. Pursuant to ASU 2015-07, collective investment funds are multi-strategy products, uncategorized because they are redeemable monthly and valued at net asset value per share of the fund without adjustment which the Company believes represents the fair value of the investments. |
The fair value of other investments is estimated based on quoted market prices, dealer quotations or alternative pricing sources supported by observable inputs and therefore classified within Level II. The Company obtains prices from independent pricing services that may utilize broker quotes, but generally the independent pricing services will use various other pricing techniques which take into account appropriate factors such as yield, quality, coupon rate, maturity, type of issue, trading characteristics and other data. The Company has not made adjustments to the prices provided. If the pricing services are only able to (a) obtain a single broker quote or (b) utilize a pricing model, such securities are classified as Level III. If the pricing services are unable to provide prices, the Company attempts to obtain one or more broker quotes directly from a dealer or values such securities at the last bid price obtained. In either case, such securities are classified as Level III. The Company performs due diligence procedures over third party pricing vendors to understand their methodology and controls to support their use in the valuation process to ensure compliance with required accounting disclosures.
Equity, short-term investment funds and derivatives which are traded on a national securities exchange are stated at the last reported sales price on the day of valuation. To the extent these securities are actively traded and valuation adjustments are not applied, they are classified as Level I. These securities that trade in markets that are not considered to be active but are valued based on quoted market prices, dealer quotations or alternative pricing sources supported by observable inputs obtained by the Company from independent pricing services are classified as Level II.
141
OM Asset Management plc
Notes to Consolidated Financial Statements (Continued)
December 31, 2016 and 2015
5) Fair Value Measurements (cont.)
(2) | Investments in separate accounts of $7.5 million at December 31, 2016 consist of approximately 28% of cash equivalents and 72% of equity securities. The Company has valued these using the published price as of the measurement date. Accordingly, the Company has classified these investments as Level I. |
(3) | Investments related to long-term compensation plans of $78.1 million and $66.9 million at December 31, 2016 and 2015, respectively, are investments in publicly registered daily redeemable funds (some managed by Affiliates), which the Company has classified as trading securities and valued using the published price as of the measurement dates. Accordingly, the Company has classified these investments as Level I. |
(4) | The $40.5 million and $30.1 million at December 31, 2016 and December 31, 2015, respectively, relate to investments in unconsolidated Funds which consist primarily of investments in Funds advised by Affiliates and are valued using NAV which the Company relies on to determine their fair value as a practical expedient. The Company has not classified these investments in the fair value hierarchy in accordance with ASU 2015-07. The fair value amounts presented in this table are intended to permit reconciliation of the fair value hierarchy to amounts presented in the Consolidated Balance Sheets. These unconsolidated Funds consist primarily of real estate investments Funds and UCITS. The NAVs that have been provided by investees have been derived from the fair values of the underlying investments as of the measurement dates. |
The Company’s investments in real estate Funds are subject to longer than monthly or quarterly redemption restrictions, and due to their nature, distributions are received only as cash flows are generated from underlying assets over the life of the Funds. The range of time over which the underlying assets are expected to be liquidated by the investees is approximately one to eight years from December 31, 2016. The valuation process for the underlying real estate investments held by the real estate investments Funds begins with each property or loan being valued by the investment teams. The valuations are then reviewed and approved by the valuation committee, which consists of senior members of the portfolio management, acquisitions, and research teams. For certain properties and loans, the valuation process may also include a valuation by independent appraisers. In connection with this process, changes in fair-value measurements from period to period are evaluated for reasonableness, considering items such as market rents, capitalization and discount rates, and general economic and market conditions.
Not included in the above are $52.0 million and $51.6 million at December 31, 2016 and December 31, 2015, respectively, of various investments carried at cost, including investments in timber and timberlands. In January 2017, $50.1 million of these investments were sold for a net gain of approximately $1.7 million.
There were no significant transfers of financial assets or liabilities among Levels I, II or III during the years ended December 31, 2016 and 2015.
142
OM Asset Management plc
Notes to Consolidated Financial Statements (Continued)
December 31, 2016 and 2015
6) Variable Interest Entities
The Company, through its Affiliates, sponsors the formation of various entities considered to be VIEs. The Company consolidates these entities pursuant to ASC Topic 810 relating to the consolidation of VIEs. These VIEs are primarily Funds managed by Affiliates that are typically owned entirely by third-party investors, however, certain Funds are capitalized with seed capital investments from the Company and its related parties and may be owned partially by Affiliate key employees and/or individuals that own minority interests in an Affiliate.
The Company’s determination of whether it is the primary beneficiary of a Fund that is a VIE is based in part on an assessment of whether or not the Company and its related parties are exposed to the majority of the risks and rewards of the entity. Typically the Fund’s investors are entitled to substantially all of the economics of these VIEs with the exception of the management fees and performance fees, if any, earned by the Company or any investment the Company has made into the Funds. The Company generally is not the primary beneficiary of Fund VIEs created to manage assets for clients unless the Company’s ownership interest, including interests of related parties, is substantial.
The following table presents the assets and liabilities of Funds that are VIEs and consolidated by the Company at December 31 (in millions):
2016 | 2015 | ||||||
Assets | |||||||
Investments at fair value | $ | 14.9 | $ | — | |||
Other assets of consolidated Funds | 0.6 | — | |||||
Total Assets | $ | 15.5 | $ | — | |||
Liabilities | |||||||
Other liabilities of consolidated Funds | $ | 0.7 | $ | — | |||
Total Liabilities | $ | 0.7 | $ | — | |||
“Investments at fair value” consist of investments in securities and investments in related parties. The Company has also consolidated Funds that are not VIEs, and therefore the assets and liabilities of those Funds are not included in the table above.
The assets of consolidated VIEs presented in the table above belong to the investors in those Funds, are available for use only by the Fund to which they belong, and are not available for use by the Company to the extent they are held by non-controlling interests. Any debt or liabilities held by consolidated Funds have no recourse to the Company's general credit.
At December 31, 2015, there were no Funds that were VIEs requiring consolidation by the Company.
The Company’s involvement with Funds that are VIEs and not consolidated by the Company is generally limited to that of an investment manager and its investment in the unconsolidated VIE, if any. The Company’s investment in any unconsolidated VIE generally represents an insignificant interest of the Fund’s net assets and assets under management, such that the majority of the VIE’s results are attributable to third parties. The Company’s exposure to risk in these entities is generally limited to any capital contribution it has made or is required to make and any
143
OM Asset Management plc
Notes to Consolidated Financial Statements (Continued)
December 31, 2016 and 2015
6) Variable Interest Entities (cont.)
earned but uncollected management fees. The Company has not issued any investment performance guarantees to these VIEs or their investors.
The following information pertains to unconsolidated VIEs for which the Company holds a variable interest at December 31 (in millions):
2016 | 2015 | ||||||
Unconsolidated VIE assets | $ | 6,006.3 | $ | 7,302.4 | |||
Unconsolidated VIE liabilities | $ | 3,740.2 | $ | 4,189.1 | |||
Equity interests on the Consolidated Balance Sheet | $ | 54.2 | $ | 53.2 | |||
Maximum risk of loss(1) | $ | 58.5 | $ | 59.0 | |||
(1) | Includes equity investments the Company has made or is required to make and any earned but uncollected management/incentive fees. The Company does not record performance/incentive allocations until the respective measurement period has ended. |
In addition to the multiple unconsolidated VIE Funds, the Company determined that Heitman LLC, one of the Company’s Affiliates, is a VIE. The Company concluded that it is not the primary beneficiary of Heitman LLC because it does not hold the power to direct its most economically significant activities. The Company aggregated Heitman LLC with the Company’s other unconsolidated VIE Funds due to their similar risk profiles given that the risks and rewards are driven by changes in investment values and the Affiliates’ ability to manage those assets.
144
OM Asset Management plc
Notes to Consolidated Financial Statements (Continued)
December 31, 2016 and 2015
7) Equity Accounted Investees
The following tables present summarized financial information for Affiliates and Funds accounted for under the equity method (in millions):
For the year ended December 31, | ||||||||||||
Statements of Income | 2016 | 2015 | 2014 | |||||||||
Net revenues(1) | $ | 340.9 | $ | 342.6 | $ | 316.5 | ||||||
Operating income | 98.4 | 114.8 | 68.2 | |||||||||
Other income (expense), net | 161.9 | 97.8 | (76.0 | ) | ||||||||
Income (loss) before income taxes | 260.3 | 212.6 | (7.8 | ) | ||||||||
Less income tax expense | 8.2 | 5.9 | 4.9 | |||||||||
Exclude: noncontrolling interests income (loss) | 213.7 | 177.6 | (31.2 | ) | ||||||||
Net income attributable to controlling interests | $ | 38.4 | $ | 29.1 | $ | 18.5 | ||||||
OMAM equity in net income of equity method investees | $ | 16.3 | $ | 13.0 | $ | 11.5 | ||||||
As of December 31, | |||||||
Balance Sheets | 2016 | 2015 | |||||
Total assets | $ | 2,661.5 | $ | 2,747.2 | |||
Total liabilities | 1,105.9 | 1,065.2 | |||||
Non-controlling interests in subsidiaries | 1,477.9 | 1,612.7 | |||||
Members’ equity | $ | 77.7 | $ | 69.3 | |||
OMAM equity investment and undistributed earnings of affiliated companies, before consolidating and reconciling adjustments | $ | 55.9 | $ | 54.4 | |||
Consolidating and reconciling adjustments: | |||||||
Goodwill attributable to equity method investment | 29.8 | 29.7 | |||||
OMAM investment in equity method investees | $ | 85.7 | $ | 84.1 | |||
(1) | Net revenue includes advisory fees for asset management services and investment income, including interest and dividends from consolidated investment partnerships. |
During the period, certain Affiliates held investments in joint ventures. These investments were accounted for using the equity method of accounting. Acadian Asset Management, LLC (“Acadian”) had a joint venture investment in Acadian Asset Management (Australia) Limited, which was acquired in full by Acadian in 2015. Net income (loss) in the Consolidated Statement of Operations includes $0.0 million, $0.3 million, and $1.4 million of income from the joint venture for the years ended December 31, 2016, 2015 and 2014, respectively.
145
OM Asset Management plc
Notes to Consolidated Financial Statements (Continued)
December 31, 2016 and 2015
8) Fixed Assets and Lease Commitments
Fixed assets consisted of the following at December 31 (in millions):
2016 | 2015 | ||||||
Leasehold improvements | $ | 31.7 | $ | 28.5 | |||
Office equipment | 25.6 | 21.3 | |||||
Furniture and fixtures | 7.0 | 6.8 | |||||
Building | 2.9 | — | |||||
Software and web development | 28.6 | 21.4 | |||||
Fixed assets, at cost | 95.8 | 78.0 | |||||
Accumulated depreciation and amortization | (56.0 | ) | (47.3 | ) | |||
Fixed assets, net | $ | 39.8 | $ | 30.7 | |||
Depreciation and amortization expense for continuing operations was $9.4 million, $6.9 million and $6.1 million for the years ended December 31, 2016, 2015 and 2014, respectively.
The Company and its Affiliates lease office space for their operations. At December 31, 2016, the Company’s aggregate future minimum payments for operating leases having initial or non-cancelable lease terms greater than one year are (in millions):
Future minimum rentals | |||
2017 | $ | 12.2 | |
2018 | 11.4 | ||
2019 | 10.3 | ||
2020 | 9.7 | ||
2021 | 9.4 | ||
Thereafter | 10.2 | ||
Total | $ | 63.2 | |
The Company is responsible for other expenses under these leases as well. Such expenses include operating costs, insurance, taxes and broker fees. Consolidated rent & occupancy expenses for 2016, 2015 and 2014 were $11.6 million, $10.9 million and $10.6 million respectively.
146
OM Asset Management plc
Notes to Consolidated Financial Statements (Continued)
December 31, 2016 and 2015
9) Goodwill and Intangible Assets
The following table presents the changes in goodwill in 2016, and 2015 (in millions):
Gross Book Value | Accumulated Impairment | Net Book Value | |||||||||
December 31, 2014 | $ | 160.4 | $ | (33.9 | ) | $ | 126.5 | ||||
Additions | — | — | — | ||||||||
Impairments | — | — | — | ||||||||
Disposals | — | — | — | ||||||||
December 31, 2015 | $ | 160.4 | $ | (33.9 | ) | $ | 126.5 | ||||
Additions | 146.2 | — | 146.2 | ||||||||
Impairments | — | — | — | ||||||||
Disposals | — | — | — | ||||||||
December 31, 2016 | $ | 306.6 | $ | (33.9 | ) | $ | 272.7 | ||||
The additional goodwill recorded in 2016 relates to the acquisition of Landmark, which closed in August 2016. Refer to Note 3 for additional information.
The following table presents the change in definite-lived acquired intangible assets in 2016 and, 2015, comprised of client relationships (in millions):
Gross Book Value | Accumulated Amortization & Impairment | Net Book Value | |||||||||
December 31, 2014 | $ | 22.7 | $ | (21.7 | ) | $ | 1.0 | ||||
Additions | 0.6 | — | 0.6 | ||||||||
Amortization | — | (0.1 | ) | (0.1 | ) | ||||||
Disposals | — | — | — | ||||||||
December 31, 2015 | $ | 23.3 | $ | (21.8 | ) | $ | 1.5 | ||||
Additions | 85.0 | — | 85.0 | ||||||||
Amortization | — | (2.6 | ) | (2.6 | ) | ||||||
Disposals | — | — | — | ||||||||
December 31, 2016 | $ | 108.3 | $ | (24.4 | ) | $ | 83.9 | ||||
The Company’s definite-lived acquired intangibles are amortized over their expected useful lives. As of December 31, 2016, these assets were being amortized over remaining useful lives of six to thirteen years. The Company recorded amortization expense of $2.6 million, $0.1 million and $0.1 million, respectively, for the years ended December 31, 2016, 2015 and 2014.
The Company also acquired a $1.0 million indefinite-lived intangible trade name in the acquisition of Landmark, included in acquired intangibles, net on the Company’s Consolidated Balance Sheet at December 31, 2016.
147
OM Asset Management plc
Notes to Consolidated Financial Statements (Continued)
December 31, 2016 and 2015
9) Goodwill and Intangible Assets (cont.)
The Company estimates that its consolidated annual amortization expense, assuming no useful life changes or additional investments in new or existing Affiliates, for each of the next five fiscal years is as follows (in millions):
2017 | $ | 6.6 | |
2018 | 6.6 | ||
2019 | 6.6 | ||
2020 | 6.6 | ||
2021 | 6.6 | ||
Thereafter | 50.9 | ||
Total | $ | 83.9 | |
10) Related Party Transactions
Amounts due from related parties were comprised of the following at December 31 (in millions):
2016 | 2015 | ||||||
Fees receivable from unconsolidated Funds | $ | 40.8 | $ | 31.5 | |||
Fees receivable from commonly controlled Old Mutual plc business units | 2.0 | 2.0 | |||||
Other amounts due from related parties | 2.8 | 5.2 | |||||
Other amounts due from the Parent | — | 0.2 | |||||
Total amounts due from related parties | $ | 45.6 | $ | 38.9 | |||
Amounts due to related parties were comprised of the following at December 31 (in millions):
2016 | 2015 | ||||||
Other amounts due to related parties | $ | 0.4 | $ | 0.2 | |||
Other amounts due to the Parent(2) | 97.0 | 4.5 | |||||
Total current payables to related parties | 97.4 | 4.7 | |||||
Other amounts due to the Parent(2) | 58.9 | 218.2 | |||||
Total long-term payables to related parties | 58.9 | 218.2 | |||||
Total amounts due to related parties | $ | 156.3 | $ | 222.9 | |||
Investments in related parties consisted of the following at December 31 (in millions):
2016 | 2015 | ||||||
Investments in equity-accounted investees (Note 7) | 85.7 | 84.1 | |||||
Total related party investments | $ | 85.7 | $ | 84.1 | |||
148
OM Asset Management plc
Notes to Consolidated Financial Statements (Continued)
December 31, 2016 and 2015
10) Related Party Transactions (cont.)
Related party transactions included in the Company’s Consolidated Statement of Operations for the years ended December 31 consisted of (in millions):
2016 | 2015 | 2014 | |||||||||
Revenues: | |||||||||||
Management fees collected from commonly controlled Old Mutual business units | $ | 7.8 | $ | 9.3 | $ | 10.6 | |||||
Management fees collected from unconsolidated Funds(1) | 131.0 | 107.0 | 47.5 | ||||||||
Performance fees collected from unconsolidated Funds(1) | 4.2 | 1.9 | 5.9 | ||||||||
Management fees collected from joint venture partners | — | — | 6.4 | ||||||||
Total related party revenues (including discontinued operations) | $ | 143.0 | $ | 118.2 | $ | 70.4 | |||||
Expenses: | |||||||||||
Interest expense owed to the Parent | $ | — | $ | — | $ | 49.8 | |||||
Rent and administrative costs recharged by commonly controlled Old Mutual business units(3) | 1.0 | 1.7 | 1.2 | ||||||||
Restricted stock grants of parent equity to OMAM employees (Note 18) | 0.1 | 0.5 | 4.5 | ||||||||
Recharged Parent operational costs(4) | 0.9 | 1.8 | 5.5 | ||||||||
Total related party expenses (including discontinued operations) | $ | 2.0 | $ | 4.0 | $ | 61.0 | |||||
(1) | Transactions with unconsolidated Affiliate-sponsored Funds are considered related party items on the basis of the Company’s significant influence over the activities of such entities in its capacity as investment advisor thereto. These transactions are comprised of fees for advisory services and investments in unconsolidated “master” Funds held by consolidated “feeder” Funds. |
(2) | During 2014, the Company entered into a Deferred Tax Asset Deed with the Parent for the payment of realized benefits associated with certain deferred tax assets, as well as a Co-Investment Deed for the payment of realized benefits associated with co-investments made by the Company in real-estate and timber strategies of its Affiliates. During 2016, the Company and the Parent agreed to amend the Deferred Tax Asset Deed. Under the terms of the Deferred Tax Asset Deed, as amended, the Company agreed to make a payment of the net present value of the future tax benefits due to the Parent valued as of December 31, 2016. This payment of $142.6 million will be made over three installments on each June 30, 2017, December 31, 2017 and June 30, 2018. Shareholders’ equity at December 31, 2016 reflects an increase of approximately $20.0 million related to the pre-payment of the Deferred Tax Asset Deed. The Company retains an indemnity from the Parent that protects the realized and future tax benefits covered by the Deferred Tax Asset Deed (including the $142.6 million to be paid in 2017-2018) in the event of a tax law change or challenge from the IRS. Amounts owed to the Parent associated with the co-investment deed were $11.8 million at December 31, 2016, net of tax. As of December 31, 2016, the Company recorded a payable of $4.0 million for redemptions and estimated taxes due under the co-investment deed. Amounts withheld in excess of the future tax liability will be payable to the Parent upon settlement. |
149
OM Asset Management plc
Notes to Consolidated Financial Statements (Continued)
December 31, 2016 and 2015
10) Related Party Transactions (cont.)
(3) | The Company conducts a portion of its distribution activities out of Asia and the United Kingdom, and has entered into contractual arrangements with Related Business Units domiciled there to share their premises and leverage certain of their administrative functions. With respect to premises in Asia, such arrangements ended in the first half of 2016. |
(4) | The Company’s Parent has historically provided the Company with various oversight services, including governance, which includes compensation for board and executive committees, investor relations, procurement of insurance coverage, human resources, financial reporting, internal audit, treasury, systems, risk and tax services. Many of these services have been transitioned to the Company and therefore the cost charged by the Parent has decreased. That portion of the above costs which (i) have been directly attributable to the Company, (ii) have been charged to the Company by the Company’s Parent and (iii) have been paid to the Parent by the Company, have been recorded in the Company’s Consolidated Financial Statements and were $0.9 million, $1.8 million, and $2.1 million for the years ended December 31, 2016, 2015, and 2014, respectively. With respect to the above services which were not directly attributable to the Company, costs associated with these services were generally allocated based on the Company’s proportion of the Parent’s total consolidated, normalized revenues. In the years ended December 31, 2016, 2015, and 2014, $0.0 million, $0.0 million, and $3.4 million, respectively, of these costs incurred have been allocated to the Company through a non-cash contribution to Parent equity, with the balance of the charges settled in cash. Subsequent to the Offering, these general costs are no longer allocated and if required, are borne directly by the Company. |
Other related party arrangements
In certain instances the Company pays the compensation for employees of Related Business Units who are based at its location. Conversely, employees of the Company operating at locations of Related Business Units are paid by those entities. In both cases these costs are recharged back to the business to which the employee is providing services.
During the year ended December 31, 2016, the Company made a loan to an equity-method Affiliate for $2.7 million that was used to make co-investments in Affiliate Funds. This balance was included in other assets on the Company’s Consolidated Balance Sheet at December 31, 2016.
The Company uses the equity-method to account for its interests in Affiliates where it exercises significant influence over their operations, but does not hold a controlling interest, as well as its joint venture partners. During 2016, 2015 and 2014, the Company recorded earnings in respect of these investees of $15.1 million, $12.5 million and $9.8 million respectively. During 2016, 2015 and 2014 respectively, the Company received dividends from joint ventures of $0.0 million, $0.0 million and $1.2 million, and the Company recharged expenses of $0.0 million, $0.0 million and $0.3 million to joint venture partners during the same respective periods. The Company also exercises significant influence over unconsolidated Funds; however in order to report in a manner consistent with consolidated Funds, it has elected to apply the fair value option for its investments therein. Additional information with respect to equity-accounted investees is disclosed in Note 7.
During 2014, the Company entered into a seed capital management agreement and shareholder agreement with the Parent and the Parent’s subsidiaries. The seed capital management agreement was amended in 2016. In September 2016, the Company purchased approximately $39.6 million of seed investments from the Parent under the terms of
150
OM Asset Management plc
Notes to Consolidated Financial Statements (Continued)
December 31, 2016 and 2015
10) Related Party Transactions (cont.)
the seed capital management agreement, as amended. As of December 31, 2016, the Company managed approximately $87.8 million of seed and co-investment capital provided by the Parent. The Company intends to purchase the remaining seed and co-investment assets covered by the seed capital management agreement on or around June 30, 2017.
As the Company is a member of a group of related businesses, it is possible that the terms of certain related party transactions are not the same as those that would result from transactions with wholly unrelated parties.
11) Accounts Payable and Accrued Expenses
Accounts payable and accrued expenses consisted of the following at December 31 (in millions):
2016 | 2015 | ||||||
Accounts payable | $ | 5.1 | $ | 8.4 | |||
Accrued expenses | 29.8 | 25.5 | |||||
Accrued interest payable | 8.4 | 0.2 | |||||
Treasury rate lock hedge liability (Note 21) | — | 8.8 | |||||
Other | 2.5 | 2.8 | |||||
Total accounts payable and accrued expenses | $ | 45.8 | $ | 45.7 | |||
12) Other Compensation Liabilities
Other compensation liabilities consisted of the following at December 31 (in millions):
2016 | 2015 | ||||||
Share-based payments liability (Note 18) | $ | 53.7 | $ | 38.5 | |||
Non-current compensation payable | 0.1 | 0.3 | |||||
Profit interests compensation liability (Note 2) | 159.2 | 155.2 | |||||
Voluntary deferral plan liability (Note 17) | 78.0 | 66.8 | |||||
Total other compensation liabilities | $ | 291.0 | $ | 260.8 | |||
Profit interests compensation expense (including discontinued operations in 2014) amounted to $16.2 million in 2016, $31.4 million in 2015, and $51.0 million in 2014. Issuances of additional profit sharing interests to key employees for cash amounted to $0.4 million in 2016, $0.2 million in 2015, and $0.6 million in 2014. Redemption of profit sharing interests by OMAM from key employees for cash were $12.7 million in 2016, $2.9 million in 2015, and $6.8 million in 2014.
151
OM Asset Management plc
Notes to Consolidated Financial Statements (Continued)
December 31, 2016 and 2015
13) Borrowings and Debt
The Company’s long-term debt at December 31, 2016 was comprised of a revolving credit facility and long-term bonds.
Revolving credit facility
On October 15, 2014, the Company entered into a revolving credit facility with Citibank, as administrative agent and issuing bank, and Citigroup Global Markets Inc. and Merrill Lynch, Pierce, Fenner & Smith Incorporated as joint lead arrangers and joint book runners (as amended, the “Credit Facility”). Pursuant to the terms of the Credit Facility, the Company may obtain loans on a revolving credit basis and procure the issuance of letters of credit in an aggregate amount at any time outstanding not in excess of $350 million. The Credit Facility has a maturity date of October 15, 2019. Borrowings under the credit facility bear interest, at OMAM’s option, at either the per annum rate equal to (a) the greatest of (i) the prime rate, (ii) the federal funds effective rate plus 0.5% and (iii) the one month Adjusted LIBO Rate plus 1.0%, plus, in each case an additional amount ranging from 0.25% to 1.00%, with such additional amount based from time to time on the ratio of the Company’s total consolidated indebtedness to Adjusted EBITDA (a “Leverage Ratio”) until either Moody’s Investor Service, Inc. or Standard & Poor’s assigned an initial rating to the Company’s senior, unsecured long-term indebtedness for borrowed money that was not subject to credit enhancement, or its credit rating, at which time such additional amount became based on its credit rating or (b) the London interbank offered rate for a period, at the Company’s election, equal to one, two, three or six months plus an additional amount ranging from 1.25% to 2.00%, with such additional amount based from time to time on the Company’s Leverage Ratio until it was assigned a credit rating, at which time such additional amount became based on its credit rating. In addition, the Company is charged a commitment fee based on the average daily unused portion of the revolving credit facility at a per annum rate ranging from 0.20% to 0.50%, with such amount based from time to time on its Leverage Ratio until it was assigned a credit rating, at which time such amount became based on the Company’s credit rating.
In July 2016, Moody’s Investor Service, Inc. and Standard & Poor’s each assigned an initial investment-grade rating to the Company’s senior, unsecured long-term indebtedness. As a result of the assignment of the credit ratings, the Company’s interest rate on outstanding borrowings was set at LIBOR + 1.50% and the commitment fee on the unused portion of the revolving credit facility was set at 0.25%. Prior to the assignment of the credit ratings, the Company’s interest rate on outstanding borrowings was based on the Company’s Leverage Ratio and was set at LIBOR + 1.25% and the commitment fee on the unused portion of the revolving credit facility was set at 0.20%.
Under the Credit Facility, the ratio of third-party borrowings to trailing twelve months Adjusted EBITDA cannot exceed 3.0x, and the interest coverage ratio must not be less than 4.0x. At December 31, 2016, the outstanding balance of the facility was $0.0 million ($350.0 million of undrawn revolving credit facility capacity). The Company’s ratio of third-party borrowings to trailing twelve months Adjusted EBITDA was 1.9x, and interest coverage ratio was 18.5x. At December 31, 2015 the outstanding balance of the facility was $90.0 million ($260.0 million of undrawn revolving credit facility capacity). At December 31, 2015, the Company’s ratio of third-party borrowings to trailing twelve months Adjusted EBITDA was 0.4x and interest coverage ratio was 85.1x.
The fair value of borrowings on the revolving credit facility approximated net cost basis as of December 31, 2015.
152
OM Asset Management plc
Notes to Consolidated Financial Statements (Continued)
December 31, 2016 and 2015
13) Borrowings and Debt (cont.)
Long-term bonds
The Company’s long-term bonds were comprised of the following as of the dates indicated (in millions):
December 31, 2016 | December 31, 2015 | ||||||||||||||||||
(in millions) | Maturity amount | Discount and debt issuance costs | Carrying value | Fair Value | Carrying value | ||||||||||||||
Long-term bonds: | |||||||||||||||||||
4.80% Senior Notes Due 2026 | 275.0 | (3.4 | ) | 271.6 | 271.0 | — | |||||||||||||
5.125% Senior Notes Due 2031 | 125.0 | (4.3 | ) | 120.7 | 107.9 | — | |||||||||||||
Total long-term bonds | $ | 400.0 | $ | (7.7 | ) | $ | 392.3 | $ | 378.9 | $ | — | ||||||||
In July 2016, the Company issued $275.0 million of 4.80% Senior Notes due 2026 (the “2026 Notes”) and $125.0 million of 5.125% Senior Notes due 2031 (the “2031 Notes”). The Company used the net proceeds of these offerings to finance the acquisition of Landmark in August 2016, settle an outstanding interest rate lock, purchase seed capital from the Parent and pay down the balance of the Revolving Credit Facility.
4.80% Senior Notes Due July 2026
The $275.0 million 2026 Notes were sold at a discount of $(0.5) million and the Company incurred debt issuance costs of $(3.0) million, which are being amortized to interest expense over the ten-year term. The 2026 Notes can be redeemed at any time prior to the scheduled maturity in part or in aggregate, at the greater of the related 100% principal amount at that time or the sum of the remaining scheduled payments discounted at the treasury rate (as defined) plus 0.5%, together with any related accrued and unpaid interest.
5.125% Senior Notes Due August 2031
The $125.0 million 2031 Notes incurred debt issuance costs of $(4.3) million, which are being amortized to interest expense over the fifteen-year term. The 2031 Notes can be redeemed at any time, on or after August 1, 2019 at a redemption price equal to 100.0% of the principal amount together with any related accrued and unpaid interest.
The fair value of the long-term bonds was determined using broker quotes and any recent trading activity for each of the notes listed above, which are considered Level II inputs.
Pursuant to ASU 2015-03, “Simplifying the Presentation of Debt Issuance Costs,” the Company records debt issuance costs of term loans as a direct deduction from the carrying amount of the associated debt liability. For debt issuance costs of revolving credit loans, the Company follows the guidance of ASU 2015-15, “Presentation and Subsequent Measurement of Debt Issuance Costs Associated with Line-of-Credit Arrangements,” which permits presenting debt issuance costs as an asset and subsequently amortizing the deferred costs ratably over the term of the agreement.
153
OM Asset Management plc
Notes to Consolidated Financial Statements (Continued)
December 31, 2016 and 2015
13) Borrowings and Debt (cont.)
Interest expense
Interest expense incurred amounted to $11.3 million, $3.1 million and $50.6 million for the years ended December 31, 2016, 2015 and 2014 respectively. The weighted average interest rate on all debt obligations, excluding consolidated Funds, was 5.16%, 1.40% and 1.43% in each of 2016, 2015 and 2014, respectively.
As of December 31, 2016, the aggregate maturities of debt commitments, based on their contractual terms, are as follows:
Future minimum debt commitments | ||||
2017 | $ | — | ||
2018 | — | |||
2019 | — | |||
2020 | — | |||
2021 | — | |||
Thereafter | 400.0 | |||
Total | $ | 400.0 | ||
The Company was in compliance with the required covenants related to borrowings and debt facilities as of December 31, 2016.
154
OM Asset Management plc
Notes to Consolidated Financial Statements (Continued)
December 31, 2016 and 2015
14) Income Taxes
The components of income tax expense from continuing operations for the years ended December 31 are as follows (in millions):
2016 | 2015 | 2014 | |||||||||
Current: | |||||||||||
Federal | $ | 17.3 | $ | 40.8 | $ | 41.6 | |||||
State | 2.6 | 7.4 | 5.1 | ||||||||
Foreign | 1.4 | 1.3 | 1.3 | ||||||||
Total current | 21.3 | 49.5 | 48.0 | ||||||||
Deferred: | |||||||||||
Federal | 19.6 | (4.5 | ) | (37.4 | ) | ||||||
State | (0.2 | ) | (4.5 | ) | 0.5 | ||||||
Foreign | 0.1 | 6.1 | 1.7 | ||||||||
Total deferred | 19.5 | (2.9 | ) | (35.2 | ) | ||||||
Total tax expense | $ | 40.8 | $ | 46.6 | $ | 12.8 | |||||
Included in discontinued operations is income tax expense of $0.0 million, $0.0 million and $1.1 million in the years ended December 31, 2016, 2015 and 2014, respectively. Included in gain (loss) on disposal of discontinued operations is income tax expense of $4.0 million, $0.5 million and $1.5 million in the years ended December 31, 2016, 2015 and 2014, respectively.
The provision for income taxes in 2016, 2015 and 2014 included benefits of $4.7 million, $4.0 million and $1.6 million, respectively, related to the utilization of net operating loss carryforwards.
155
OM Asset Management plc
Notes to Consolidated Financial Statements (Continued)
December 31, 2016 and 2015
14) Income Taxes (cont.)
The reconciliation of the difference between the Company’s U.S. Federal statutory income tax rate and the effective income tax rate for continuing operations for the years ended December 31 is as follows:
2016 | 2015 | 2014 | ||||||
Tax at U.S. federal statutory income tax rate | 35.0 | % | 35.0 | % | 35.0 | % | ||
State income taxes, net of federal benefit | 3.0 | % | 3.0 | % | (7.3 | )% | ||
Non-deductible expenses | — | % | — | % | 1.6 | % | ||
Interest expense | (12.1 | )% | (9.3 | )% | 14.7 | % | ||
Dividends from foreign subsidiaries | — | % | 0.3 | % | (6.6 | )% | ||
Parent company expense carve-out adjustment | — | % | — | % | (3.6 | )% | ||
Adjustment to liabilities for uncertain tax positions | 0.9 | % | (0.4 | )% | 2.2 | % | ||
Change in valuation allowance | (0.6 | )% | (3.4 | )% | 34.9 | % | ||
Effect of foreign operations | (0.7 | )% | (1.0 | )% | 2.5 | % | ||
Effect of changes in tax law, rates | — | % | (0.5 | )% | (10.8 | )% | ||
Effect of income from non-controlling interest | — | % | — | % | (108.4 | )% | ||
Other | (0.2 | )% | (0.5 | )% | 6.1 | % | ||
Effective income tax rate for continuing operations | 25.3 | % | 23.2 | % | (39.7 | )% | ||
During 2016, the Company released $0.9 million of its valuation allowance relating to state net operating loss carryforwards as management has concluded that the tax benefits will be realized due to increases of income apportioned to the applicable states.
During 2015, the Company released $4.5 million of its valuation allowance relating to foreign tax credit carryforwards, as management has concluded that the tax benefits will be realized primarily due to forecasted taxable income resulting from the utilization of substantially all the Company’s remaining federal net operating loss carryforwards. Additionally, the company released $2.0 million of its valuation allowance relating to state net operating loss carryforwards as management has concluded the tax benefits will be realized due to increases of income apportioned to the applicable states.
During 2014, the Company released $11.3 million of its valuation allowance relating to the federal net operating loss carryforwards of Skandia America Corporation, as management has concluded that the tax benefits will be fully realized following a restructuring which occurred in 2014.
In general, it is the practice and intention of the Company to reinvest earnings of its non-U.S. subsidiaries in those operations. Management has no intention of repatriating earnings of its non-U.S. subsidiaries in the foreseeable future. As such, at December 31, 2016, the Company has not recorded any deferred tax liabilities relating to additional tax on unremitted earnings of its non-U.S. subsidiaries. The Company’s foreign unremitted earnings that are indefinitely reinvested are estimated to be $11.7 million at December 31, 2016. It is not practicable to estimate the amount of deferred tax liability related to investments in these foreign subsidiaries.
156
OM Asset Management plc
Notes to Consolidated Financial Statements (Continued)
December 31, 2016 and 2015
14) Income Taxes (cont.)
Deferred tax assets and liabilities reflect the expected future tax consequences of temporary differences between the book carrying amounts and tax bases of the Company’s assets and liabilities.
The significant components of deferred tax assets and deferred tax liabilities for the years ended December 31 are as follows (in millions):
2016 | 2015 | ||||||
Deferred tax assets: | |||||||
Interest expense | $ | 150.5 | $ | 164.3 | |||
Federal net operating loss | 3.7 | 8.1 | |||||
State net operating loss carry forwards | 7.6 | 8.4 | |||||
Investment partnerships | 140.1 | 132.4 | |||||
Foreign tax credit carry forwards | 9.1 | 15.4 | |||||
Intangible assets | 1.4 | 1.8 | |||||
Employee compensation | 16.5 | 14.8 | |||||
Other | 5.6 | 5.6 | |||||
Cash flow hedge | 5.9 | 1.6 | |||||
Total deferred tax assets | 340.4 | 352.4 | |||||
Valuation allowance | (5.5 | ) | (6.4 | ) | |||
Deferred tax assets, net of valuation allowance | 334.9 | 346.0 | |||||
Deferred tax liabilities: | |||||||
Investments | 2.2 | 4.4 | |||||
Net deferred tax asset | $ | 332.7 | $ | 341.6 | |||
At December 31, 2016, the Company has tax attributes that carry forward for varying periods. The Company’s federal net operating loss carryforward of $10.5 million originated during 2004 and 2006 and will expire over an eight to ten-year period. State net operating losses of $177.5 million expire over a five to fifteen-year period. The Company has recorded a partial valuation allowance in connection with state net operating loss carryforwards for which the Company believes it is more-likely-than-not that the tax benefits will not be recognized. The Company’s foreign tax credit carryforwards of $9.1 million expire over a three to ten year period. In evaluating the Company’s ability to recover its deferred tax assets, the Company considers all available positive and negative evidence including the existence of cumulative income in the most recent fiscal years, changes in the business in which the Company operates, and the Company’s ability to forecast future taxable income. The weight given to the evidence is commensurate with the extent to which it can be objectively verified. The more negative evidence that exists, the more positive evidence that is necessary and the more difficult it is to support a conclusion that a valuation allowance is not needed. The Company has three years of cumulative earnings as of December 31, 2016, 2015 and 2014. As of December 31, 2016, management believes it is more likely than not that the balance of the deferred tax asset will be realized based on forecasted taxable income.
157
OM Asset Management plc
Notes to Consolidated Financial Statements (Continued)
December 31, 2016 and 2015
14) Income Taxes (cont.)
The Company recorded $3.9 million and $10.9 million in additional foreign tax credit carryforwards during 2016 and 2015 in connection with filing amended tax returns for the tax years 2009-2014 in order to claim credits for previously deducted foreign taxes. The realized benefits associated with these foreign tax credits are subject to the arrangements with the Parent (see Note 10) relating to the benefits associated with certain deferred tax assets.
A reconciliation of the change in gross unrecognized tax benefits for the years ended December 31 is as follows (in millions):
2016 | 2015 | 2014 | |||||||||
Balance as of January 1 | $ | 93.5 | $ | 93.9 | $ | 97.2 | |||||
Additions based on tax positions of prior years | — | — | — | ||||||||
Reductions for tax provisions of prior years | — | — | (1.5 | ) | |||||||
Reductions related to lapses of statutes of limitations | (2.2 | ) | (0.4 | ) | (1.8 | ) | |||||
Balance as of December 31 | $ | 91.3 | $ | 93.5 | $ | 93.9 | |||||
The Company’s liability for uncertain tax positions includes unrecognized benefits of $96.4 million and $94.3 million at December 31, 2016 and 2015, respectively, that if recognized would affect the effective tax rate on income from continuing operations.
The Company recognized $3.6 million, $1.4 million, and $0.0 million in interest and penalties in its income tax provision for the years ended December 31, 2016, 2015, and 2014, respectively. The Company recognizes accrued interest and penalties relating to unrecognized tax benefits as income tax expense. The Company’s liability for uncertain tax benefits at December 31, 2016, 2015, and 2014 includes accrued interest and penalties of $6.1 million, $2.8 million and $1.4 million, respectively.
The Company believes that it is reasonably possible that a decrease of up to $4.1 million in unrecognized tax benefits may be necessary within the next twelve months, as the result of a lapse of statute of limitations.
The Company is periodically under examination by various taxing authorities. Examinations are inherently uncertain, may result in payment of additional taxes or the recognition of tax benefits and may be in process for extended periods of time. During 2016, the Company received examination notifications from state income tax authorities. There have been no significant issues identified and the examinations continue in process at December 31, 2016.
The Company and its subsidiaries file tax returns in U.K, U.S. federal, state, local and other foreign jurisdictions. As of December 31, 2016, the Company is generally no longer subject to income tax examinations by U.S. federal, state, local, or foreign tax authorities for calendar years prior to 2008.
158
OM Asset Management plc
Notes to Consolidated Financial Statements (Continued)
December 31, 2016 and 2015
15) Commitments and Contingencies
Operational commitments
The Company had unfunded commitments to invest up to approximately $55 million in co-investments with its Affiliates as of December 31, 2016. These commitments will be funded as required through the end of the respective investment periods ranging through fiscal 2022.
Certain Affiliates operate under regulatory authorities that require that they maintain minimum financial or capital requirements. Management is not aware of any violations of such financial requirements occurring during the period.
Litigation
The Company and its Affiliates are subject to claims, legal proceedings and other contingencies in the ordinary course of their business activities. Each of these matters is subject to various uncertainties, and it is possible that some of these matters may be resolved in a manner unfavorable to the Company or its Affiliates. The Company and its Affiliates establish accruals for matters for which the outcome is probable and can be reasonably estimated. If an insurance claim or other indemnification for a litigation accrual is available to the Company, the associated gain will not be recognized until all contingencies related to the gain have been resolved. As of December 31, 2016, there were no material accruals for claims, legal proceedings or other contingencies.
Indemnifications
In the normal course of business, such as through agreements to enter into business combinations and divestitures of Affiliates, the Company enters into contracts that contain a variety of representations and warranties and which provide general indemnifications. The Company’s maximum exposure under these arrangements is unknown, as this would involve future claims that may be made against the Company that have not yet occurred.
Foreign tax contingency
The Company has clients in non-U.S. jurisdictions which require entities that are conducting certain business activities in such jurisdictions to collect and remit tax assessed on certain fees paid for goods and services provided. The Company does not believe this requirement is applicable based on its limited business activities in these jurisdictions. However, given the fact that uncertainty exists around the requirement, the Company has chosen to evaluate its potential exposure related to non-collection and remittance of these taxes. At December 31, 2016, management of the Company has estimated the potential maximum exposure and concluded that it is not material. No accrual for the potential exposure has been recorded as the probability of incurring any potential liability relating to this exposure is not probable at December 31, 2016.
Considerations of credit risk
Financial instruments that potentially subject the Company to significant concentrations of credit risk consist principally of cash investments. The Company maintains cash and cash equivalents and short term investments with various financial institutions. These financial institutions are typically located in cities in which the Company and its Affiliates operate. For the Company and certain Affiliates, cash deposits at a financial institution may exceed Federal Deposit Insurance Corporation insurance limits.
159
OM Asset Management plc
Notes to Consolidated Financial Statements (Continued)
December 31, 2016 and 2015
16) Earnings per Share
The calculation of basic and diluted earnings per ordinary share for the years ended December 31, 2016, 2015 and 2014 is as follows. Amounts shown reflect pro forma shares outstanding prior to the Offering on October 8, 2014. (dollars in millions, except per share data):
2016 | 2015 | 2014 | |||||||||
Numerator: | |||||||||||
Net income attributable to controlling interests | $ | 126.4 | $ | 155.5 | $ | 51.7 | |||||
Less: Total income available to participating unvested securities(1) | (0.9 | ) | (0.6 | ) | — | ||||||
Total net income attributable to ordinary shares | $ | 125.5 | $ | 154.9 | $ | 51.7 | |||||
Denominator: | |||||||||||
Weighted-average ordinary shares outstanding—basic | 119,236,370 | 120,000,000 | 120,000,000 | ||||||||
Potential ordinary shares | |||||||||||
Restricted stock units | 283,743 | 497,997 | — | ||||||||
Weighted-average ordinary shares outstanding—diluted | 119,520,113 | 120,497,997 | 120,000,000 | ||||||||
Earnings per ordinary share attributable to controlling interests: | |||||||||||
Basic | $ | 1.05 | $ | 1.29 | $ | 0.43 | |||||
Diluted | $ | 1.05 | $ | 1.29 | $ | 0.43 | |||||
(1) | Income available to participating unvested securities includes dividends paid on unvested restricted shares and their proportionate share of undistributed earnings. |
160
OM Asset Management plc
Notes to Consolidated Financial Statements (Continued)
December 31, 2016 and 2015
17) Employee Benefits
The Company has various defined contribution plans covering substantially all of its full-time employees and several of its Affiliates. In addition to pre-tax contributions made by employees, the Company also makes contributions to the qualified plans annually.
The Company also has non-qualified defined contribution plans covering certain senior employees. The Company has established a Deferred Compensation Plan under which the Board of Directors makes awards that may be invested by the recipient in investments deemed available under the plan. Vesting of awards under the Deferred Compensation Plan is based on the number of years of service already provided by the employee at the date of the grant. In addition, the Company has established a Voluntary Deferral Plan that provides officers of the Company the opportunity to voluntarily defer a portion of their compensation. The compensation deferred is deemed to be invested in one or more investment options available under the plan. These non-qualified plans are unfunded, although the Company does make contributions to a Rabbi Trust to hedge its risks in terms of providing returns to employees on their deemed investments held in the plan.
As of December 31, 2016 and 2015, a total of $78.0 million and $66.8 million, respectively, had been recorded as long-term compensation liabilities and a total of $78.1 million and $66.9 million, respectively, had been invested under the Deferred Compensation and Voluntary Deferral plans. The Company recorded total expenses in relation to its qualified and non-qualified plans within compensation and benefits in its Consolidated Statements of Operations for the years ended December 31, 2016, 2015 and 2014 of $12.3 million, $12.5 million and $10.8 million, respectively.
18) Equity-based Compensation
Cash-settled Affiliate awards
The Company has entered into compensation arrangements with certain of its Affiliates whereby in exchange for continued service, Affiliate equity is either purchased by or granted to Affiliate key employees subject to a limit imposed by the Company, and may be repurchased either by Affiliate key employees or by the Company at a future date at the then applicable fair value, subject to service requirements having been met. Compensation expense is recognized over the requisite service period equal to the cumulative vested fair value of the award at the end of each period up to vesting date.
The Company accounts for these arrangements as “cash settled” share based payments, and accordingly a corresponding share-based payments liability is recorded. Vested share-based payments liabilities are revalued at each period end until settlement date, with changes in the liabilities included within compensation expense.
As described within Note 3, in conjunction with the Landmark acquisition, OMAM entered into compensation arrangements with employees of Landmark where pre-acquisition equity units held by Landmark employees became subject to a service condition. These units are accounted for as stock-based compensation, were fair valued as of the closing date of the acquisition and vest over varying increments from December 31, 2018 through December 31, 2024. These units contain put rights that provide liquidity to the employees upon vesting. An additional payment of up to $225.0 million could be paid based on the growth of Landmark’s business. This arrangement is also accounted for as stock-based compensation, fair valued as of the closing date of the acquisition, and vests on December 31, 2018. Both the pre-acquisition equity units and the potential future payment will be subsequently remeasured at the end of each reporting period.
161
OM Asset Management plc
Notes to Consolidated Financial Statements (Continued)
December 31, 2016 and 2015
18) Equity-based Compensation (cont.)
The following table presents the changes in the share-based payments liability for the years ended December 31 (in millions):
2016 | 2015 | 2014 | |||||||||
Balance, beginning of period | $ | 38.5 | $ | 42.3 | $ | 86.0 | |||||
Amortization and revaluation of granted awards | 15.6 | 0.2 | 43.4 | ||||||||
Reclassification to profit interests award | — | (2.8 | ) | (1.7 | ) | ||||||
Affiliate disposals | — | — | (18.0 | ) | |||||||
Repurchases (cash settled) | (0.4 | ) | (1.2 | ) | (67.4 | ) | |||||
Balance, end of period | $ | 53.7 | $ | 38.5 | $ | 42.3 | |||||
The amount of unrecognized compensation expense in relation to non-vested cash-settled equity interests as of December 31, 2016 is $181.2 million, and will be expensed as follows (in millions):
2017 | $ | 71.9 | |
2018 | 71.2 | ||
2019 | 6.4 | ||
2020 | 6.4 | ||
2021 | 6.4 | ||
2022 and thereafter | 18.9 | ||
Total | $ | 181.2 | |
Equity-settled corporate awards
Old Mutual plc equity compensation plans
Old Mutual plc, the Company’s Parent, maintains various equity-based compensation arrangements, including stock options and restricted stock awards, in which the Company’s employees participated in the periods presented. The cost of these equity-based programs has been included in the Company’s financial results where applicable. Compensation expense recognized by the Company in respect of these arrangements was $0.1 million for the year ended December 31, 2016, $0.5 million for the year ended December 31, 2015, and $4.5 million for the year ended December 31, 2014. A corresponding capital contribution was recognized in each period. The related income tax benefit recognized for the years ended December 31, 2016, 2015, and 2014 was $0.0 million, $0.2 million, and $1.7 million, respectively.
The following disclosures represent the Company’s portion of the various equity compensation arrangements maintained by the Parent in which the Company’s employees participated.
162
OM Asset Management plc
Notes to Consolidated Financial Statements (Continued)
December 31, 2016 and 2015
18) Equity-based Compensation (cont.)
Grants of restricted shares in Old Mutual plc traded on the London Stock Exchange
The following summarizes the grant date fair value of restricted shares granted by the Company in the years ended December 31:
2016 | 2015 | 2014 | |||||||||
Shares granted during the year | — | — | 3,576,379 | ||||||||
Weighted average grant date fair value per share GBP | £ | — | £ | — | £ | 2.03 | |||||
Weighted average grant date fair value per share USD | $ | — | $ | — | $ | 3.35 | |||||
The grant date fair value per share, calculated based on the closing share price as quoted on the London Stock Exchange on the measurement date, was used to determine the fair value of restricted shares granted to employees. There is a mechanism at Old Mutual plc to ensure sufficient shares are available under the plan each year for grants issued. Restricted shares under the plan generally have a vesting period of three years. Expected dividends were not incorporated into the measurement of fair value where the holder of the restricted share is entitled to dividends throughout the vesting period.
The following table summarizes the activity related to restricted shares.
2016 | 2015 | 2014 | ||||||||||||||||||||||||||||||
Number of shares | Weighted average grant date fair value per share GBP | Weighted average grant date fair value per share USD | Number of shares | Weighted average grant date fair value per share GBP | Weighted average grant date fair value per share USD | Number of shares | Weighted average grant date fair value per share GBP | Weighted average grant date fair value per share USD | ||||||||||||||||||||||||
Outstanding at the beginning of the year | 209,801 | £ | 2.00 | $ | 3.00 | 682,346 | £ | 1.77 | $ | 2.92 | 3,954,534 | £ | 1.73 | $ | 2.85 | |||||||||||||||||
Granted during the year | — | — | — | — | — | — | 3,576,379 | 2.03 | 3.35 | |||||||||||||||||||||||
Forfeited during the year | (8,885 | ) | 2.03 | 2.53 | — | — | — | (10,711 | ) | 2.03 | 3.35 | |||||||||||||||||||||
Exercised during the year | (113,559 | ) | 1.98 | 2.47 | (472,545 | ) | 1.67 | 2.50 | (878,217 | ) | 1.45 | 2.39 | ||||||||||||||||||||
Other transfers | 67,775 | n/a | n/a | — | — | — | (5,959,639 | ) | n/a | n/a | ||||||||||||||||||||||
Outstanding at the end of the year | 155,132 | £ | 2.03 | $ | 2.53 | 209,801 | £ | 2.00 | $ | 3.00 | 682,346 | £ | 1.77 | $ | 2.92 | |||||||||||||||||
The grant date for the annual awards is deemed to be January 1 in the year prior to the date of issue. There are no planned future awards of Old Mutual Plc restricted shares. The fair value of awards granted in 2014 with a grant date of January 1, 2013 was $8.1 million, consisting of 2,416,327 shares. Other transfers in 2016 relates to an employee transfer and in 2014 primarily relates to the exchange of Old Mutual plc shares for OMAM ordinary shares.
163
OM Asset Management plc
Notes to Consolidated Financial Statements (Continued)
December 31, 2016 and 2015
18) Equity-based Compensation (cont.)
Value incentive plan
During 2011, an equity-based compensation plan was implemented for certain key employees of OMAM in connection with the stated intention of exploring a potential initial public offering (“IPO”) of the business. The plan was designed to reward participants for achievement of strategic objectives and metrics and value creation over the period leading up to an initial public offering. The awards consisted of a mix of cash, payable at completion of an IPO, and restricted shares in the newly-listed U.S. entity, which would be granted upon completion of an IPO and vest ratably over three years from that date. As a result of the IPO not occurring before the plan termination date of December 31, 2013, the awards under this plan were paid out in cash and grants of restricted shares in Old Mutual plc during 2014. The value and quantity of the cash and share portions of the awards were based on the achievement of performance objectives and financial targets. The share-based payment liability previously recorded for the share portion of this plan was reclassified to share-based payment reserve upon the granting of the awards in Old Mutual Plc restricted shares. The expense recognized during the years ended December 31, 2016, 2015, and 2014 in relation to this plan was $0.3 million $0.6 million, and $1.0 million respectively. The total income tax benefit recognized in relation to this plan for the years ended December 31, 2016, 2015, and 2014 was $0.1 million, $0.2 million, and $0.4 million, respectively.
OM Asset Management equity incentive plan
In connection with the IPO, certain employees who held unvested Old Mutual plc restricted shares were given the opportunity to exchange their Old Mutual plc restricted shares for restricted shares of OMAM held by OM Group (UK) Limited with vesting conditions similar to those to which they were currently subject. These restricted shares were awarded to employees as part of the annual incentive process and the one-time Value Incentive Plan. This exchange program was intended to provide employees who elected to participate with restricted share awards of OMAM ordinary shares of equivalent value to the Old Mutual plc restricted shares they currently held. The exchange valued OMAM ordinary shares at the price sold to investors in the IPO. The exchange valued Old Mutual plc’s ordinary shares using the weighted-average sale price over the three consecutive trading days on the London Stock Exchange up to and including the date of the exchange. The exchange occurred following the effectiveness of the OMAM registration statement on October 8, 2014. OM Group (UK) Limited transferred 1,212,766 unvested restricted OM Asset Management ordinary shares (Equivalent to 5,914,981 Old Mutual plc restricted shares) to employees as part of this exchange program.
In connection with the Reorganization, two equity plans were implemented at OMAM; one for the employees and one for non-executive directors. The plans are maintained to provide equity based compensation arrangements, including restricted stock awards (“RSAs”), restricted stock units (“RSUs”) and performance based restricted stock units (“Performance RSUs”). Equity ownership encourages employees and directors to act in the best long-term interests of the Company.
Compensation expense recognized by the Company for the year ended December 31, 2016, 2015, and 2014 in relation to these plans was $13.1 million, $11.8 million, and $3.2 million respectively. The related income tax benefit recognized for years ended December 31, 2016, 2015 and 2014 was $5.1 million, $4.6 million and $1.2 million respectively. The grant date for awards granted in 2016 is deemed to be January 1, 2015. It is anticipated that the annual awards for 2016 with a fair value of $7.0 million will be granted during 2017.
164
OM Asset Management plc
Notes to Consolidated Financial Statements (Continued)
December 31, 2016 and 2015
18) Equity-based Compensation (cont.)
The following summarizes the grant date fair value of the instruments granted by the Company during the year ended December 31:
2016 | 2015 | 2014 | |||||||||||||||||||
OM Asset Management plc awards | Shares granted | Weighted average fair value | Shares granted | Weighted average fair value | Shares granted | Weighted average fair value | |||||||||||||||
RSAs | 506,640 | $ | 10.89 | 559,709 | $ | 17.60 | 1,212,766 | $ | 14.00 | ||||||||||||
RSUs | 54,556 | $ | 11.25 | 47,055 | $ | 17.65 | — | $ | — | ||||||||||||
Performance-Based RSUs | 189,335 | $ | 10.92 | 451,657 | $ | 24.65 | — | $ | — | ||||||||||||
Grants of restricted shares in OM Asset Management plc
The following table summarizes the activity related to restricted share awards:
2016 | 2015 | 2014 | |||||||||||||||||||
OM Asset Management plc RSA Awards | Number of shares | Weighted average grant date fair value per share | Number of shares | Weighted average grant date fair value per share | Number of shares | Weighted average grant date fair value per share | |||||||||||||||
Outstanding at beginning of the year | 1,566,647 | $ | 15.28 | 1,212,766 | $ | 14.00 | — | $ | — | ||||||||||||
Converted during the year | — | — | — | — | 1,212,766 | 14.00 | |||||||||||||||
Granted during the year | 506,640 | 10.89 | 559,709 | 17.60 | — | — | |||||||||||||||
Forfeited during the year | (7,288 | ) | 13.65 | (2,128 | ) | 17.65 | (10,225 | ) | 15.46 | ||||||||||||
Exercised during the year | (680,573 | ) | 15.10 | (203,700 | ) | 14.00 | — | — | |||||||||||||
Other transfers | (10,225 | ) | 14.00 | — | — | 10,225 | 15.46 | ||||||||||||||
Outstanding at end of the year | 1,375,201 | $ | 13.77 | 1,566,647 | $ | 15.28 | 1,212,766 | $ | 14.00 | ||||||||||||
The grant date fair value per share, calculated based on the closing price as quoted on the New York Stock Exchange on the measurement date, is used to determine the fair value of restricted shares granted to employees. Restricted shares under the plan generally have a vesting period of one to three years.
165
OM Asset Management plc
Notes to Consolidated Financial Statements (Continued)
December 31, 2016 and 2015
18) Equity-based Compensation (cont.)
Grants of restricted stock units in OM Asset Management plc
The following table summarizes the activity related to restricted stock units:
2016 | 2015 | 2014 | |||||||||||||||||||
OM Asset Management plc RSU Awards | Number of shares | Weighted average grant date fair value per share | Number of shares | Weighted average grant date fair value per share | Number of shares | Weighted average grant date fair value per share | |||||||||||||||
Outstanding at beginning of the year | 47,055 | $ | 17.65 | — | $ | — | — | $ | — | ||||||||||||
Granted during the year | 54,556 | 11.25 | 47,055 | 17.65 | — | — | |||||||||||||||
Forfeited during the year | — | — | — | — | — | — | |||||||||||||||
Exercised during the year | (15,688 | ) | 17.65 | — | — | — | — | ||||||||||||||
Other transfers | — | — | — | — | — | — | |||||||||||||||
Outstanding at end of the year | 85,923 | $ | 13.59 | 47,055 | $ | 17.65 | — | $ | — | ||||||||||||
The grant date fair value per share, calculated based on the closing price as quoted on the New York Stock Exchange on the measurement date, is used to determine the fair value of restricted shares granted to employees. Restricted stock units under the plan generally have a vesting period of one to three years.
Grants of Performance-based restricted stock units in OM Asset Management plc
The following table summarizes the activity related to performance-based restricted stock units:
2016 | 2015 | 2014 | |||||||||||||||||||
OM Asset Management plc performance-based RSU Awards | Number of shares | Weighted average grant date fair value per share | Number of shares | Weighted average grant date fair value per share | Number of shares | Weighted average grant date fair value per share | |||||||||||||||
Outstanding at beginning of the year | 451,657 | $ | 24.65 | — | $ | — | — | — | |||||||||||||
Granted during the year | 189,335 | 10.92 | 451,657 | 24.65 | — | — | |||||||||||||||
Forfeited during the year | — | — | — | — | — | — | |||||||||||||||
Exercised during the year | — | — | — | — | — | — | |||||||||||||||
Other transfers | — | — | — | — | — | — | |||||||||||||||
Outstanding at end of the year | 640,992 | $ | 20.59 | 451,657 | $ | 24.65 | — | $ | — | ||||||||||||
The performance-based RSU awards granted by the Company have a market vesting condition; therefore a Monte-Carlo simulation model was used to determine the fair value of the restricted units granted to employees. Significant assumptions utilized in the Monte-Carlo simulation model include assumed reinvestment of dividends, a risk-free interest rate of 0.85%, and an expected volatility of 27.27%. Restricted units under the plan have a vesting period of three years.
166
OM Asset Management plc
Notes to Consolidated Financial Statements (Continued)
December 31, 2016 and 2015
19) Accumulated Other Comprehensive Income
The following tables show the tax effects allocated to each component of other comprehensive income (in millions):
For the year ended December 31, 2016 | |||||||||||
Pre-Tax | Tax Benefit (Expense) | Net of Tax | |||||||||
Foreign currency translation adjustment including portion attributable to non-controlling interests | $ | (3.2 | ) | $ | — | $ | (3.2 | ) | |||
Change in net realized and unrealized gain (loss) on derivative securities | (24.6 | ) | 4.3 | (20.3 | ) | ||||||
Other comprehensive (loss) | $ | (27.8 | ) | $ | 4.3 | $ | (23.5 | ) | |||
For the year ended December 31, 2015 | |||||||||||
Pre-Tax | Tax Benefit (Expense) | Net of Tax | |||||||||
Foreign currency translation adjustment including portion attributable to non-controlling interests | $ | (1.5 | ) | $ | — | $ | (1.5 | ) | |||
Change in net realized and unrealized gain (loss) on derivative securities | (8.2 | ) | 1.6 | (6.6 | ) | ||||||
Other comprehensive (loss) | $ | (9.7 | ) | $ | 1.6 | $ | (8.1 | ) | |||
For the year ended December 31, 2014 | |||||||||||
Pre-Tax | Tax Benefit (Expense) | Net of Tax | |||||||||
Foreign currency translation adjustment including portion attributable to non-controlling interests | $ | (2.5 | ) | $ | — | $ | (2.5 | ) | |||
Other comprehensive (loss) | $ | (2.5 | ) | $ | — | $ | (2.5 | ) | |||
The components of accumulated other comprehensive income (loss) for the years ended December 31, 2016, 2015 and 2014 were as follows (in millions) including proportions attributable to non-controlling interests:
Foreign currency translation adjustment | Valuation of derivative securities | Total | ||||||||||
Balance, as of December 31, 2014 | $ | (20.4 | ) | — | $ | (20.4 | ) | |||||
Other comprehensive income (loss) | (1.5 | ) | (6.6 | ) | (8.1 | ) | ||||||
De-consolidation of Funds | 23.9 | — | 23.9 | |||||||||
Balance, as of December 31, 2015 | $ | 2.0 | (6.6 | ) | $ | (4.6 | ) | |||||
Other comprehensive income (loss) | (3.2 | ) | (20.3 | ) | (23.5 | ) | ||||||
Balance, as of December 31, 2016 | $ | (1.2 | ) | $ | (26.9 | ) | $ | (28.1 | ) | |||
In the year ended December 31, 2016, the Company recorded an unrealized loss of $(20.3) million, net of tax of $4.3 million, on the derivative contract as further described in Note 21. The Company reclassified $1.1 million and $0.6
167
OM Asset Management plc
Notes to Consolidated Financial Statements (Continued)
December 31, 2016 and 2015
19) Accumulated Other Comprehensive Income (cont.)
million from accumulated other comprehensive income (loss) to interest expense on the Consolidated Statements of Income for the twelve months ended December 31, 2016 and 2015, respectively. There were no significant amounts reclassified from accumulated other comprehensive income (loss) to the Consolidated Statements of Income for the twelve months ended December 31, 2014.
On January 1, 2015, in conjunction with the adoption of ASU 2015-02, the Company de-consolidated all Funds that had been consolidated as of December 31, 2014, resulting in the reversal of $23.9 million related to accumulated foreign currency translation of previously consolidated Funds.
20) Non-controlling interests
Non-controlling interests on the Consolidated Balance Sheets include capital and undistributed profits of certain entities that are consolidated, but not 100% owned, which amounted to $1.0 million at December 31, 2016, and $0.0 million at December 31, 2015.
Non-controlling interests in consolidated Funds
On January 1, 2015, in conjunction with the adoption of ASU 2015-02, the Company deconsolidated all Funds that had been consolidated as of December 31, 2014. As a result of this deconsolidation, all non-controlling interests in consolidated Funds were reduced to $0.0 million. In the third quarter of 2016, following the purchase of certain seed capital investments from our Parent, we consolidated certain Funds pursuant to ASU 2015-02.
Net loss attributable to non-controlling interests in consolidated Funds in the Consolidated Statements of Operations is comprised of the net income or loss and net gains and losses allocated to equity-holders, other than OMAM, of consolidated Funds. For the years ended December 31, 2016, 2015, and 2014 this net loss was $(0.2) million, $0.0 million, and $(95.5) million, respectively.
Redeemable non-controlling interests in consolidated Funds on the Consolidated Balance Sheets represents the share of net assets of the Funds attributable to those equity holders who are not restricted in their ability to redeem their interests, which amounted to $5.5 million at December 31, 2016, and $0.0 million at December 31, 2015.
21) Derivatives and Hedging
Cash flow hedge
In late July 2015, the Company entered into a $300.0 million notional Treasury rate lock contract which was designated and qualified as a cash flow hedge under Accounting Standard Codification 815, "Derivatives and Hedging," (“ASC 815”). The Company documented its hedging strategy and risk management objective for this contract in anticipation of a future debt issuance. The Treasury rate lock contract eliminated the impact of fluctuations in the underlying benchmark interest rate for future forecasted debt issuances. The Company assessed the effectiveness of the hedging contract at inception and on a quarterly basis thereafter. In November 2015, at the Treasury rate lock termination date, the Company de-designated the Treasury rate lock and entered into an extension for the same $300.0 million notional through early July 2016. In July 2016 the Company entered into a second extension to the Treasury rate lock in conjunction with the issuances of the previously forecasted debt. The forecasted debt issuances occurred in July 2016 and the Treasury rate lock, which had an accumulated fair value of
168
OM Asset Management plc
Notes to Consolidated Financial Statements (Continued)
December 31, 2016 and 2015
21) Derivatives and Hedging (cont.)
$(34.4) million, was settled. Refer to Note 13, Borrowings and Debt, for additional information on the debt issuances.
Consistent with the original Treasury rate lock, the extended Treasury rate locks were designated and qualified as cash flow hedges under ASC 815. The Company documented its hedging strategy and risk management objective for these contracts in anticipation of the July 2016 debt issuance. The extended Treasury rate locks effectively eliminated the impact of fluctuations in the underlying benchmark interest rate for the debt issuances. The Company assessed the effectiveness of the hedging contracts at each of the extended Treasury rate locks’ inception dates and on a quarterly basis thereafter, where applicable. At the rate lock settlement the hedging contracts were evaluated to be highly effective in offsetting changes in cash flows associated with the hedged items. The Company did not record any hedge ineffectiveness during 2016.
Amounts recorded in accumulated other comprehensive income in connection with the settled Treasury rate lock were $(20.3) million, net of tax of $4.3 million for the year ended December 31, 2016. As of December 31, 2016, the balance in accumulated other comprehensive income in connection with the Treasury rate lock contract amounted to $(26.9) million, net of tax. This balance will be reclassified to earnings through interest expense over the life of the issued debt. An amount of $1.1 million has been reclassified for the year ended December 31, 2016. During the next twelve months the Company expects to reclassify approximately $2.6 million to interest expense.
Derivatives of consolidated Funds
The Company’s consolidated Funds entered into the following types of derivatives:
Forward foreign currency exchange contracts: The Funds are subject to foreign currency exchange rate risk in the normal course of pursuing their investment objectives. A forward foreign currency exchange contract is an agreement between two parties to purchase or sell a specific currency for an agreed-upon price at a future date. The Funds enter into forward foreign currency exchange contracts to facilitate transactions in foreign-denominated securities and to attempt to minimize the risk to the Funds from adverse changes in the relationship between currencies. Forward foreign currency exchange contracts are recorded at the forward rate and marked-to-market daily. When the contracts are closed, realized gains and losses arising from such transactions are recorded as realized gains or losses on foreign currency transactions. The Funds could be exposed to risks if the counterparties to the contracts are unable to meet the terms of their contracts or if the value of the foreign currency changes unfavorably. The Funds’ maximum risk of loss from counterparty credit risk is the unrealized gains or losses on the contracts. This risk is mitigated by having a master netting arrangement between the Funds and the counterparty.
169
OM Asset Management plc
Notes to Consolidated Financial Statements (Continued)
December 31, 2016 and 2015
21) Derivatives and Hedging (cont.)
Credit default swaps: The Funds are subject to credit risk in the normal course of pursuing their investment objectives. The Funds entered into credit default swaps to manage their exposure to the market or certain sectors of the market, to reduce their risk exposure to defaults of corporate and sovereign issuers, or to create exposure to corporate or sovereign issuers to which they are not otherwise exposed. Credit default swaps involve the exchange of a fixed rate premium for protection against the loss in value of an underlying security in the event of a defined credit event, such as payment default or bankruptcy. Under a credit default swap one party acts as a guarantor by receiving the fixed periodic payment in exchange for the commitment to purchase the underlying security at par if the defined credit event occurs. Upon the occurrence of a defined credit event, the difference between the value of the reference obligation and the swaps notional amount is recorded as realized gain (for protection written) or loss (for protection sold) on swap transactions in the consolidated statement of operations. The Funds maximum risk of loss from counterparty risk, either as the protection seller or as the protection buyer, is the fair value of the contract. This risk is mitigated by having a master netting arrangement between the Funds and the counterparty and by the posting of collateral by the counterparty to the Funds to cover the Funds’ exposure to the counterparty.
Interest rate swaps: The Funds are subject to interest rate risk exposure in the normal course of pursuing their investment objectives. Because the Funds hold fixed rate bonds, the value of these bonds may decrease if interest rates rise. To help hedge against this risk and to maintain their ability to generate income at prevailing market rates, the Funds entered into interest rate swap contracts. Interest rate swaps are agreements between two parties to exchange cash flows based on a notional principal amount. The Funds may elect to pay a fixed rate and receive a floating rate, or receive a fixed rate and pay a floating rate on a notional principal amount. The net interest received or paid on interest rate swap agreements is recorded as realized gains or losses. Interest rate swaps are marked to market daily based upon quotations from the market makers and the change, if any, is recorded as an unrealized gain or loss in the consolidated statement of operations. When the swap contract is terminated earlier, the Funds record a realized gain or loss equal to the difference between the current realized value and the expected cash flows. The risk of interest rate swaps include changes in market conditions that will affect the value of the contract or the cash flows and the possible inability of the counterparty to fulfill its obligations under the agreement. The Funds’ maximum risk of loss from counterparty credit risk is the discounted net value of the cash flows to be received from the counterparty over the contract’s remaining life, to the extent that that amount is positive. The risk is mitigated by having a master netting arrangement between the Funds and the counterparty and by the posting of collateral by the counterparty to the Funds to cover the Funds’ exposure to the counterparty.
170
OM Asset Management plc
Notes to Consolidated Financial Statements (Continued)
December 31, 2016 and 2015
21) Derivatives and Hedging (cont.)
The effect of Funds’ derivative instruments on the Company’s Consolidated Statements of Operations for the year ended December 31, 2014 were as follows (in millions). There were no derivative instruments of consolidated Funds in the years ended December 31, 2015 or 2016:
2014 | |||||||||
Income statement classification | Gains | Losses | |||||||
Realized gains (losses): | |||||||||
Forward foreign currency exchange contracts | Net consolidated Funds gains (losses) | $ | 0.1 | — | |||||
Total return swap contracts | Net consolidated Funds gains (losses) | — | (0.3 | ) | |||||
Unrealized gains (losses): | |||||||||
Interest rate contracts | Net consolidated Funds gains (losses) | — | (0.4 | ) | |||||
Net change in unrealized appreciation: | |||||||||
Forward foreign currency exchange contracts | Net consolidated Funds gains (losses) | 0.1 | — | ||||||
Interest rate contracts | Net consolidated Funds gains (losses) | 0.4 | — | ||||||
Total | $ | 0.6 | $ | (0.7 | ) | ||||
22) Discontinued Operations and Restructuring
The Company’s gain (loss) from discontinued operations was comprised of the following at December 31 (in millions, except for per share data):
2016 | 2015 | 2014 | |||||||||
Revenues | $ | — | $ | — | $ | 38.0 | |||||
Compensation expense | — | — | 30.9 | ||||||||
Depreciation | — | — | 0.2 | ||||||||
Other operating expenses | — | — | 9.8 | ||||||||
Operating loss | — | — | (2.9 | ) | |||||||
Investment gain of consolidated Funds | — | — | 2.8 | ||||||||
Net interest income | — | — | 0.1 | ||||||||
Income before taxes | — | — | — | ||||||||
Income taxes | — | — | 1.1 | ||||||||
Discontinued net income (loss) | — | — | (1.1 | ) | |||||||
Gain on disposal, net of tax of $4.0, $0.5, and $(1.5) | 6.2 | 0.8 | 2.3 | ||||||||
Total discontinued operations | 6.2 | 0.8 | 1.2 | ||||||||
Attributable to non-controlling interests | — | — | 4.7 | ||||||||
Attributable to controlling interests | $ | 6.2 | $ | 0.8 | $ | (3.5 | ) | ||||
Pro forma earnings (loss) per share (basic) attributable to controlling interests | $ | 0.07 | $ | 0.01 | $ | (0.03 | ) | ||||
Pro forma earnings (loss) per share (diluted) attributable to controlling interests | $ | 0.07 | $ | 0.01 | $ | (0.03 | ) | ||||
171
OM Asset Management plc
Notes to Consolidated Financial Statements (Continued)
December 31, 2016 and 2015
22) Discontinued Operations and Restructuring (cont.)
In the second quarter of 2014, the Company transferred the operations of Rogge Global Partners plc to the Company’s Parent and has accordingly presented its results within discontinued operations for historical periods.
During 2013, the Company committed to a plan to wind up the operations of Echo Point Investment Management, and has accordingly presented its results within discontinued operations for historical periods. The Company recorded a liability for incremental costs expected to be incurred, and recognized a loss in relation to the excess of carrying amount over recoverable amount of the net assets of the business. The shutdown process was completed during the first quarter of 2014.
In August 2016, the management team of a previously disposed Affiliate of OMAM, together with subsidiaries of OMAM holding interests in that Affiliate, entered into a purchase and sale agreement with a third party, which resulted in a $7.4 million payment to OMAM, or $5.1 million, net of tax. The remaining gain on disposal in 2016, as well as gains on disposal in 2015 and 2014 represent residual amounts received from previously discontinued operations.
Liabilities associated with discontinued operations and restructuring included in other liabilities on the Company’s Consolidated Balance Sheets are summarized as follows as of December 31 (in millions):
2016 | 2015 | ||||||
Beginning balance at January 1 | $ | 4.1 | $ | 5.6 | |||
Abandoned lease liability principal payments | (1.1 | ) | (1.6 | ) | |||
Accrual of wind-up costs in relation to discontinued operation | — | (0.3 | ) | ||||
Adjustment to sub-lease arrangement on abandoned lease | 0.2 | 0.4 | |||||
Drawdowns on committed funding | (2.1 | ) | — | ||||
Ending balance at December 31 | $ | 1.1 | $ | 4.1 | |||
No additional costs are expected to be incurred in connection with discontinued operations for the events described above.
172
OM Asset Management plc
Notes to Consolidated Financial Statements (Continued)
December 31, 2016 and 2015
23) Selected Quarterly Financial Data (unaudited)
The following is a summary of the quarterly results of operations of the Company for the years ended December 31, 2016 and 2015 ($ in millions, unless otherwise noted):
2016 | |||||||||||||||
First Quarter | Second Quarter | Third Quarter | Fourth Quarter | ||||||||||||
Revenue | $ | 149.6 | $ | 156.5 | $ | 170.8 | $ | 186.6 | |||||||
Operating income | 41.0 | 44.0 | 40.2 | 30.4 | |||||||||||
Income from continuing operations before income taxes | 44.0 | 48.0 | 41.7 | 27.1 | |||||||||||
Net income | 30.8 | 36.3 | 34.0 | 25.1 | |||||||||||
Net income attributable to controlling interests | 30.8 | 36.3 | 34.0 | 25.3 | |||||||||||
Basic earnings per share ($) | $ | 0.26 | $ | 0.30 | $ | 0.28 | $ | 0.21 | |||||||
Diluted earnings per share ($) | $ | 0.26 | $ | 0.30 | $ | 0.28 | $ | 0.21 | |||||||
Basic shares outstanding (in millions) | 120.0 | 119.4 | 119.3 | 118.2 | |||||||||||
Diluted shares outstanding (in millions) | 120.0 | 119.6 | 119.7 | 118.8 | |||||||||||
2015 | |||||||||||||||
First Quarter | Second Quarter | Third Quarter | Fourth Quarter | ||||||||||||
Revenue | $ | 160.6 | $ | 213.5 | $ | 161.8 | $ | 163.4 | |||||||
Operating income | 44.4 | 62.9 | 43.0 | 40.9 | |||||||||||
Income from continuing operations before income taxes | 46.2 | 64.7 | 46.7 | 43.7 | |||||||||||
Net income | 34.2 | 49.4 | 35.0 | 36.9 | |||||||||||
Net income attributable to controlling interests | 34.2 | 49.4 | 35.0 | 36.9 | |||||||||||
Basic earnings per share ($) | $ | 0.28 | $ | 0.41 | $ | 0.29 | $ | 0.31 | |||||||
Diluted earnings per share ($) | $ | 0.28 | $ | 0.41 | $ | 0.29 | $ | 0.30 | |||||||
Basic shares outstanding (in millions) | 120.0 | 120.0 | 120.0 | 120.0 | |||||||||||
Diluted shares outstanding (in millions) | 120.4 | 120.5 | 120.5 | 120.6 | |||||||||||
173
Item 9. Changes in and Disagreements With Accountants on Accounting and Financial Disclosure.
None.
Item 9A. Controls and Procedures.
Evaluation of Disclosure Controls and Procedures
Our management, including our Chief Executive Officer, or CEO,and Chief Financial Officer, or CFO, evaluated the effectiveness of our disclosure controls and procedures (as such term is defined in Rules 13a-15(e) and 15d-15(e) under the Exchange Act) at December 31, 2016. Disclosure controls and procedures are designed to ensure that the information we are required to disclose in the reports that we file or submit under the Exchange Act is recorded, processed, summarized and reported within the time period specified in the SEC’s rule and forms. Disclosure controls and procedures include, without limitation, controls and procedures designed to ensure that information we are required to disclose in the reports that we file or submit under the Exchange Act is accumulated and communicated to our management, including our CEO and CFO, to allow timely decisions regarding required disclosure. Our CEO and CFO participated in this evaluation and concluded that, as of December 31, 2016, our disclosure controls and procedures were effective.
Report of Management on Internal Control Over Financial Reporting
Management is responsible for establishing and maintaining adequate internal control over financial reporting.
Management has evaluated the effectiveness of internal control over financial reporting as of December 31, 2016 based on the criteria established in Internal Control - Integrated Framework (2013) issued by the Committee of Sponsoring Organizations of the Treadway Commission. Based on management’s assessment, management concluded that the Company’s internal control over financial reporting was effective as of December 31, 2016.
Management has excluded Landmark from its assessment of internal control over financial reporting as of December 31, 2016 because Landmark was acquired in a 2016 business combination. Landmark represents total assets of $253.2 million (of which, $229.8 million represents goodwill and intangible assets acquired from the acquisition of Landmark during the year that were subject to the Company’s internal control over financial reporting) and total revenues of $28.4 million on the Company’s Consolidated Financial Statements as of and for the year ended December 31, 2016.
KPMG LLP, an independent registered public accounting firm, has audited the financial statements that are included in this Annual Report on Form 10-K and expressed an opinion thereon. KPMG LLP has also expressed an opinion on the effectiveness of internal control over financial reporting as of December 31, 2016, which is included herein.
Changes in Internal Control Over Financial Reporting
There have been no changes in our internal control over financial reporting that occurred during the fourth quarter of our fiscal year ended December 31, 2016 that materially affected, or are reasonably likely to materially affect, our internal control over financial reporting.
Item 9B. Other Information.
None.
174
PART III
Item 10. Directors, Executive Officers and Corporate Governance.
The information required by this Item is set forth in our definitive proxy statement required to be filed pursuant to Regulation 14A for the 2017 annual meeting of shareholders.
Item 11. Executive Compensation.
The information required by this Item is set forth in our definitive proxy statement required to be filed pursuant to Regulation 14A for the 2017 annual meeting of shareholders.
Item 12. Security Ownership of Certain Beneficial Owners and Management and Related Stockholder Matters.
The information required by this Item is set forth in our definitive proxy statement required to be filed pursuant to Regulation 14A for the 2017 annual meeting of shareholders.
Item 13. Certain Relationships and Related Transactions, and Director Independence.
The information required by this Item is set forth in our definitive proxy statement required to be filed pursuant to Regulation 14A for the 2017 annual meeting of shareholders.
Item 14. Principal Accountant Fees and Services.
The information required by this Item is set forth in our definitive proxy statement required to be filed pursuant to Regulation 14A for the 2017 annual meeting of shareholders.
175
PART IV
Item 15. Exhibits, Financial Statements Schedules.
(1) | Financial Statements: The information required by this Item is contained in Item 8 of Part II of this report. |
(2) | Financial Statement Schedules: None |
(3) | Exhibits: |
Exhibit No. | Description | ||
2.1 | Purchase Agreement, dated June 13, 2016, by and among OMAM Inc.; OMAM (2016 Newco) LLC; Landmark Partners; LLC, LMRK Intermediary, Inc. and the sellers named therein, incorporated herein by reference to Exhibit 10.1 to Current Report on Form 8-K filed on July 20, 2016. | ||
3.1 | Memorandum of Association, incorporated herein by reference to Exhibit 3.1 to Registration Statement No. 333-197106 on Form S-1 filed on September 8, 2014. | ||
3.2 | Articles of Association, incorporated herein by reference to Exhibit 3.1 to the Current Report on Form 8-K filed on May 5, 2015. | ||
4.1 | Specimen Ordinary Share Certificate, incorporated herein by reference to Exhibit 4.1 to Registration Statement No. 333-197106 on Form S-1 filed on September 18, 2014. | ||
4.2 | Form of Senior or Subordinated Indenture, incorporated herein by reference to Exhibit 4.2 to the Registration Statement No. 333-207781 on Form S-3 filed on November 4, 2015. | ||
4.3 | Base Indenture, dated as of July 25, 2016, among OM Asset Management plc, as Issuer, Wilmington Trust, National Association, as Trustee, and Citibank, N.A., as Securities Administrator, incorporated herein by reference to Exhibit 4.1 to Current Report on Form 8-K filed on July 25, 2016. | ||
4.4 | Supplemental Indenture, dated as of July 25, 2016, among OM Asset Management plc, as Issuer, Wilmington Trust, National Association, as Trustee, and Citibank, N.A., as Securities Administrator, incorporated herein by reference to Exhibit 4.2 to Current Report on Form 8-K filed on July 25, 2016. | ||
4.5 | Form of 4.800% Note due 2026 incorporated herein by reference and included in the Supplemental Indenture filed as Exhibit 4.2 to Current Report on Form 8-K filed on July 25, 2016. | ||
4.6 | Second Supplemental Indenture, dated as of August 1, 2016, among OM Asset Management plc, as Issuer, Wilmington Trust, National Association, as Trustee, and Citibank, N.A. as Securities Administrator, incorporated herein by reference to Exhibit 4.2 to Current Report on Form 8-K filed on August 1, 2016. | ||
4.7 | Form of 5.125% Note due 2031 incorporated herein by reference and included in the Supplemental Indenture filed as Exhibit 4.2 to Current Report on Form 8-K filed on August 1, 2016. | ||
176
Exhibit No. | Description | ||
10.1 | Revolving Credit Agreement, dated October 15, 2014, by and among OM Asset Management plc, certain lenders, and Citibank N.A., as administrative agent, with Citigroup Global Markets Inc. and Merrill Lynch, Pierce, Fenner & Smith Incorporated, as joint book runners and joint lead arrangers, incorporated herein by reference to Exhibit 10.7 to Current Report on Form 8-K filed on October 20, 2014. | ||
10.2 | Employment Agreement with Peter L. Bain, incorporated herein by reference to Exhibit 10.2 to Registration Statement No. 333-197106 on Form S-1 filed on September 8, 2014. | ||
10.3 | Employment Agreement with Linda T. Gibson, incorporated herein by reference to Exhibit 10.3 to Registration Statement No. 333-197106 on Form S-1 filed on September 8, 2014. | ||
10.4 | OM Asset Management plc Equity Incentive Plan, incorporated herein by reference to Exhibit 10.4 to Registration Statement No. 333-197106 on Form S-1 filed on September 8, 2014. | ||
10.5 | Seed Capital Management Agreement, dated October 8, 2014, by and among Old Mutual (US) Holdings Inc., Old Mutual plc and certain of its affiliates, Millpencil Limited, Millpencil (US) LP, and MPL (UK) Limited, incorporated herein by reference to Exhibit 10.1 to Current Report on Form 8-K filed on October 20, 2014. | ||
10.6 | Co-Investment Deed, dated October 8, 2014, by and between OM Asset Management plc and OM Group (UK) Limited, incorporated herein by reference to Exhibit 10.2 to Current Report on Form 8-K filed on October 20, 2014. | ||
10.7 | Intellectual Property License Agreement, dated October 8, 2014, by and among OM Asset Management plc, Old Mutual plc, and Old Mutual Life Assurance Company (South Africa) Ltd., incorporated herein by reference to Exhibit 10.3 to Current Report on Form 8-K filed on October 20, 2014. | ||
10.8 | Deferred Tax Asset Deed, dated October 8, 2014, by and between OM Asset Management plc and OM Group (UK) Limited, incorporated herein by reference to Exhibit 10.4 to Current Report on Form 8-K filed on October 20, 2014. | ||
10.9 | Registration Rights Agreement, dated October 8, 2014, by and among OM Asset Management plc, Old Mutual plc, and OM Group (UK) Limited, incorporated herein by reference to Exhibit 10.5 to Current Report on Form 8-K filed on October 20, 2014. | ||
10.10 | Shareholder Agreement, dated October 8, 2014, by and between OM Asset Management plc and Old Mutual plc, incorporated herein by reference to Exhibit 10.6 to Current Report on Form 8-K filed on October 20, 2014. | ||
10.11 | Form of Deed of Indemnity for Directors, incorporated herein by reference to Exhibit 10.11 to Registration Statement No. 333-197106 on Form S-1 filed on September 8, 2014. | ||
10.12 | Limited Liability Company Agreement of Barrow, Hanley, Mewhinney & Strauss, LLC, effective January 12, 2010, incorporated herein by reference to Exhibit 10.12 to Registration Statement No. 333-197106 on Form S-1 filed on September 8, 2014. | ||
177
Exhibit No. | Description | ||
10.13 | Sixth Amended and Restated Limited Liability Company Agreement of Acadian Asset Management LLC, effective March 14, 2016, incorporated herein by reference to Exhibit 10.13 to Annual Report on Form 10-K filed on March 15, 2016. | ||
10.14 | OM Asset Management plc Non-Employee Directors’ Equity Incentive Plan, incorporated herein by reference to Exhibit 10.14 to Registration Statement No. 333-197106 on Form S-1 filed on September 8, 2014. | ||
10.15 | Form of Management Registration Rights Agreement, incorporated herein by reference to Exhibit 10.15 to Registration Statement No. 333-197106 on Form S-1 filed on September 10, 2014. | ||
10.16 | Form of Restricted Stock Unit Award Agreement for Employees, incorporated herein by reference to Exhibit 10.17 to Registration Statement No. 333-197106 on Form S-1 filed on September 8, 2014. | ||
10.17 | Form of Restricted Stock Award Agreement for Employees, incorporated herein by reference to Exhibit 10.16 to Registration Statement No. 333-197106 on Form S-1 filed on September 8, 2014. | ||
10.18 | Form of Restricted Stock Unit Award Agreement for Non-Employee Directors, incorporated herein by reference to Exhibit 10.18 to Registration Statement No. 333-197106 on Form S-1 filed on September 18, 2014. | ||
10.19 | Form of Restricted Stock Unit Award Agreement for Canadian Employees, incorporated herein by reference to Exhibit 10.19 to Registration Statement No. 333-197106 on Form S-1 filed on September 18, 2014. | ||
10.20 | Form of Restricted Stock Unit Award Agreement for Hong Kong Employees, incorporated herein by reference to Exhibit 10.20 to Registration Statement No. 333-197106 on Form S-1 filed on September 18, 2014. | ||
10.21 | Form of Restricted Stock Unit Award Agreement for U.K. Employees, incorporated herein by reference to Exhibit 10.21 to Registration Statement No. 333-197106 on Form S-1 filed on September 18, 2014. | ||
10.22 | Form of Deed poll Instrument, incorporated herein by reference to Exhibit 10.22 to Registration Statement No. 333-197106 on Form S-1 filed on October 6, 2014. | ||
10.23 | First Amendment to the Seed Capital Management Agreement, dated December 31, 2014, by and among Old Mutual (US) Holdings Inc., together with its successors; Old Mutual plc and certain of its affiliates, Millpencil Limited, Millpencil (US) LP, and MLP (UK) Limited, incorporated herein by reference to Exhibit 10.23 to Form 10-K filed on March 30, 2015. | ||
10.24 | Heads of Agreement, dated as of June 13, 2016, among OM Asset Management plc and Old Mutual plc, incorporated herein by reference to Exhibit 10.1 to Current Report on Form 8-K filed on June 14, 2016. | ||
178
Exhibit No. | Description | ||
10.25 | Heads of Agreement, dated as of June 13, 2016, among OM Asset Management plc and OM Group (UK) Limited, incorporated herein by reference to Exhibit 10.1 to Current Report on Form 8-K filed on June 14, 2016. | ||
10.26 | First Amendment dated September 1, 2015 to the Revolving Credit Agreement dated as of October 15, 2014 by and among OM Asset Management plc and Citibank, N.A., incorporated herein by reference to Exhibit 10.26 to Quarterly Report on Form 10-Q filed on August 9, 2016. | ||
10.27 | Second Amendment dated March 1, 2016 to the Revolving Credit Agreement, as amended, dated as of October 15, 2014 by and among OM Asset Management plc and Citibank, N.A., incorporated herein by reference to Quarterly Report on Exhibit 10.27 to Form 10-Q filed on August 9, 2016. | ||
10.28 | Third Amendment dated August 3, 2016 to the Revolving Credit Agreement, as amended, dated as of October 15, 2014 by and among OM Asset Management plc and Citibank, N.A., incorporated herein by reference to Exhibit 10.28 to Quarterly Report on Form 10-Q filed on August 9, 2016. | ||
21.1 | * | Subsidiaries of OM Asset Management plc | |
23.1 | * | Consent of KPMG LLP | |
31.1 | * | Certification of the Company’s Chief Executive Officer pursuant to Exchange Act Rules 13a-14(a)/15d-14(a), as adopted pursuant to Section 302 of the Sarbanes-Oxley Act of 2002. | |
31.2 | * | Certification of the Company’s Chief Financial Officer pursuant to Exchange Act Rules 13a-14(a)/15d-14(a), as adopted pursuant to Section 302 of the Sarbanes-Oxley Act of 2002. | |
32.1 | * | Certification of the Company’s Chief Executive Officer pursuant to 18 U.S.C. Section 1350, as adopted pursuant to Section 906 of the Sarbanes-Oxley Act of 2002. | |
32.2 | * | Certification of the Company’s Chief Financial Officer pursuant to 18 U.S.C. Section 1350, as adopted pursuant to Section 906 of the Sarbanes-Oxley Act of 2002. | |
101 | * | Interactive data files pursuant to Rule 405 of Regulation S-T: (i) the Consolidated Balance Sheets as of December 31, 2016 and December 31, 2015; (ii) the Consolidated Statement of Operations for the years ended December 31, 2016, 2015 and 2014; (iii) the Consolidated Statement of Comprehensive Income (Loss) for the years ended December 31, 2016, 2015 and 2014; (iv) the Consolidated Statement of Changes in Shareholders’ Equity for the years ended December 31, 2016, 2015 and 2014; (v) the Consolidated Statement of Cash Flows for the years ended December 31, 2016, 2015 and 2014; and (vi) the Notes to Consolidated Financial Statements. | |
_______________________________________________________________________________
* Filed herewith
179
SIGNATURES
Pursuant to the requirements of Section 13 or 15(d) of the Securities Exchange Act of 1934, the registrant has duly caused this report to be signed on its behalf by the undersigned, thereunto duly authorized.
OM Asset Management plc | |||
Dated: | February 21, 2017 | ||
By: | /s/ Peter L. Bain | ||
Peter L. Bain President and Chief Executive Officer (principal executive officer) | |||
/s/ Stephen H. Belgrad | |||
Stephen H. Belgrad Executive Vice President and Chief Financial Officer (principal financial officer and principal accounting officer) | |||
Pursuant to the requirements of the Securities Exchange Act of 1934, this report has been signed below by the following persons on behalf of the registrant and in the capacities and on the dates indicated.
180
Signature | Title | Date | |
/s/ JAMES J. RITCHIE | |||
James J. Ritchie | Chairman of the Board | February 21, 2017 | |
/s/ PETER L. BAIN | |||
Peter L. Bain | President, Chief Executive Officer, and Director | February 21, 2017 | |
/s/ STUART H. BOHART | |||
Stuart H. Bohart | Director | February 21, 2017 | |
/s/ ROBERT J. CHERSI | |||
Robert J. Chersi | Director | February 21, 2017 | |
/s/ RUSSELL CARMEDY | |||
Russell Carmedy | Director | February 21, 2017 | |
/s/ INGRID G. JOHNSON | |||
Ingrid G. Johnson | Director | February 21, 2017 | |
/s/ KYLE PRECHTL LEGG | |||
Kyle Prechtl Legg | Director | February 21, 2017 | |
/s/ JOHN D. ROGERS | |||
John D. Rogers | Director | February 21, 2017 | |
/s/ DONALD J. SCHNEIDER | |||
Donald J. Schneider | Director | February 21, 2017 | |
181
QuickLinks