Attached files
| file | filename |
|---|---|
| EXCEL - IDEA: XBRL DOCUMENT - PROSPER MARKETPLACE, INC | Financial_Report.xls |
| EX-10.2 - EXHIBIT 10.2 - PROSPER MARKETPLACE, INC | ex10_2.htm |
| EX-31.1 - EXHIBIT 31.1 - PROSPER MARKETPLACE, INC | ex31_1.htm |
| EX-32.2 - EXHIBIT 32.2 - PROSPER MARKETPLACE, INC | ex32_2.htm |
| EX-31.3 - EXHIBIT 31.3 - PROSPER MARKETPLACE, INC | ex31_3.htm |
| EX-32.1 - EXHIBIT 32.1 - PROSPER MARKETPLACE, INC | ex32_1.htm |
| EX-31.2 - EXHIBIT 31.2 - PROSPER MARKETPLACE, INC | ex31_2.htm |
| EX-31.4 - EXHIBIT 31.4 - PROSPER MARKETPLACE, INC | ex31_4.htm |
UNITED STATES
SECURITIES AND EXCHANGE COMMISSION
Washington, D.C. 20549
FORM 10-Q
QUARTERLY REPORT PURSUANT TO SECTION 13 OR 15(d) OF THE SECURITIES EXCHANGE ACT OF 1934
For the quarterly period ended June 30, 2014
|
Commission
File Number
|
|
Exact Name of Registrant as Specified in its Charter,
State or Other Jurisdiction of Incorporation,
Address of Principal Executive Offices, Zip Code
and Telephone Number (Including Area Code)
|
|
I.R.S. Employer
Identification Number
|
|
|
|
|
|
|
|
333-147019,
333-182599, and
333-179941-01
|
|
PROSPER MARKETPLACE, INC.
a Delaware corporation
101 Second Street, 15th Floor
San Francisco, CA 94105
Telephone: (415)593-5400
|
|
73-1733867
|
|
|
|
|
|
|
|
333-179941
|
|
PROSPER FUNDING LLC
a Delaware limited liability company
101 Second Street, 15th Floor
San Francisco, CA 94105
Telephone: (415)593-5479
|
|
45-4526070
|
Indicate by check mark whether each registrant (1) has filed all reports required to be filed by Section 13 or 15(d) of the Securities Exchange Act of 1934 during the preceding 12 months and (2) has been subject to such filing requirements for the past 90 days.
| Prosper Marketplace, Inc. | Yesx No ¨ |
| Prosper Funding LLC | Yesx No ¨ |
Indicate by check mark whether the registrant has submitted electronically and posted on its corporate Web site, if any, every Interactive Data File required to be submitted and posted pursuant to Rule 405 of Regulation S-T during the preceding 12 months (or for such shorter period that the registrant was required to submit and post such files).
| Prosper Marketplace, Inc. | Yesx No ¨ |
| Prosper Funding LLC | Yesx No ¨ |
Indicate by check mark whether the registrant is a large accelerated filer, an accelerated filer, a non-accelerated filer, or a smaller reporting company. See the definitions of “large accelerated filer,” “accelerated filer” and “smaller reporting company” in Rule 12b-2 of the Exchange Act.
|
|
Large
Accelerated
Filer
|
|
Accelerated
Filer
|
|
Non-
Accelerated
Filer
|
|
Smaller
Reporting
Company
|
|
|
|
|
|
|
|
|
|
|
Prosper Marketplace, Inc.
|
o
|
|
o
|
|
o
|
|
x
|
|
|
|
|
|
|
|
|
|
|
Prosper Funding LLC
|
o
|
|
o
|
|
o
|
|
x
|
Indicate by check mark whether the registrant is a shell company (as defined in Rule 12b-2 of the Exchange Act).
|
Prosper Marketplace, Inc.
|
Yes¨ No x
|
|
Prosper Funding LLC
|
Yes¨ No x
|
2
Prosper Funding LLC meets the conditions set forth in General Instruction H(1)(a) and (b) of Form 10-Q and is therefore filing this Form 10-Q with the reduced disclosure format specified in General Instruction H(2) of Form 10-Q.
|
Registrant
|
|
Number of Shares of Common
Stock of the Registrant
Outstanding at August 8, 2014
|
|
Prosper Marketplace, Inc.
|
|
14,464,398
($.01 par value)
|
|
Prosper Funding LLC
|
|
None
|
THIS COMBINED FORM 10-Q IS SEPARATELY FILED BY PROSPER MARKETPLACE, INC. AND PROSPER FUNDING LLC. INFORMATION CONTAINED HEREIN RELATING TO ANY INDIVIDUAL REGISTRANT IS FILED BY SUCH REGISTRANT ON ITS OWN BEHALF. EACH REGISTRANT MAKES NO REPRESENTATION AS TO INFORMATION RELATING TO THE OTHER REGISTRANT.
3
|
|
Page No.
|
|
|
|
||
|
PART I. FINANCIAL INFORMATION
|
1
|
|
|
Item 1.
|
7
|
|
|
7
|
||
|
8
|
||
|
9
|
||
|
10
|
||
|
11
|
||
|
Schedule 1
|
|
|
|
32
|
||
|
33
|
||
|
34
|
||
|
35
|
||
|
Item 2.
|
46
|
|
|
Item 3.
|
69
|
|
|
Item 4.
|
70
|
|
|
PART II.
|
OTHER INFORMATION
|
|
|
Item 1.
|
71
|
|
|
Item 1A.
|
71
|
|
|
Item 2.
|
71
|
|
|
Item 3.
|
71
|
|
|
Item 4.
|
71
|
|
|
Item 5.
|
71
|
|
|
Item 6.
|
71
|
|
|
72
|
||
|
73
|
||
This Quarterly Report on Form 10-Q includes forward-looking statements within the meaning of Section 27A of the Securities Act of 1933 (the “Securities Act”) and Section 21E of the Securities Exchange Act of 1934 (the “Exchange Act”). Forward-looking statements include all statements that do not relate solely to historical or current facts, and can generally be identified by the use of words such as “may,” “believe,” “will,” “expect,” “project,” “estimate,” “intend,” “anticipate,” “plan,” “continue” or similar expressions. In particular, information appearing under “Prosper Marketplace, Inc. Notes to Condensed Consolidated Financial Statements,” “Prosper Funding LLC Notes to Condensed Financial Statements” and “Management’s Discussion and Analysis of Financial Condition and Results of Operations” includes forward-looking statements. Forward-looking statements inherently involve many risks and uncertainties that could cause actual results to differ materially from those projected in these statements. Where, in any forward-looking statement, Prosper Funding LLC (“Prosper Funding”) or Prosper Marketplace, Inc. (“PMI” and, collectively with Prosper Funding, the “Registrants”) expresses an expectation or belief as to future results or events, such expectation or belief is based on the current plans and expectations of Prosper Funding and PMI’s respective managements, expressed in good faith and is believed to have a reasonable basis. Nevertheless, there can be no assurance that the expectation or belief will result or be achieved or accomplished. In this Quarterly Report, the unsecured, consumer loans originated through the platform are referred to as “Borrower Loans,” and the borrower payment dependent notes issued through the platform, whether issued by PMI or Prosper Funding, are referred to as “Notes.” The following include some but not all of the factors that could cause actual results or events to differ materially from those anticipated:
| • | the performance of the Notes, which, in addition to being speculative investments, are special, limited obligations that are not guaranteed or insured; |
| • | Prosper Funding’s ability to make payments on the Notes, including in the event that borrowers fail to make payments on the corresponding Borrower Loans; |
| • | the reliability of the information about borrowers that is supplied by borrowers; |
| • | Prosper Funding and PMI’s ability to service the Borrower Loans, and their ability or the ability of a third party debt collector to pursue collection against any borrower, including in the event of fraud or identity theft; |
| • | credit risks posed by the credit worthiness of borrowers and the effectiveness of the Registrants’ credit rating systems; |
| • | actions by some borrowers to defraud investor members and risks associated with identity theft; |
| • | Prosper Funding and PMI’s limited operational history and lack of significant historical performance data about borrower performance; |
| • | the impact of current economic conditions on the performance of the Notes and loss rates of the Notes; |
| • | payments by borrowers on the loans in light of the facts that the loans do not impose restrictions on borrowers and do not include cross-default provisions; |
| • | Prosper Funding and PMI’s compliance with applicable local, state and federal law, including the Investment Advisers Act of 1940, the Investment Company Act of 1940 and other laws; |
| • | potential efforts by state regulators or litigants to characterize Prosper Funding or PMI, rather than WebBank, as the lender of the loans originated through the platform; |
| • | the application of federal and state bankruptcy and insolvency laws to borrowers and to Prosper Funding and PMI; |
| • | the impact of borrower delinquencies, defaults and prepayments on the returns on the Notes; |
| • | the lack of a public trading market for the Notes and any inability to resell the Notes on the Note Trader platform; |
| • | the federal income tax treatment of an investment in the Notes and the PMI Management Rights; |
| • | Prosper Funding and PMI’s ability to prevent security breaches, disruptions in service, and comparable events that could compromise the personal and confidential information held on their data systems, reduce the attractiveness of the platform or adversely impact their ability to service loans; and |
| • | Prosper Funding’s ability to compete successfully in the peer-to-peer and consumer lending industry. |
There may be other factors that may cause actual results to differ materially from the forward-looking statements in this Quarterly Report on Form 10-Q. Prosper Funding and PMI can give no assurances that any of the events anticipated by the forward-looking statements will occur or, if any of them does, what impact they will have on Prosper Funding or PMI’s results of operations and financial condition. You should carefully read the factors described in the “Risk Factors” section of the Registrants’ Annual Report on Form 10-K, filed with the Securities and Exchange Commission (“SEC”) on March 31, 2014, as well as any subsequent quarterly reports on Form 10-Q, for a description of certain risks that could, among other things, cause Prosper Funding and PMI’s actual results to differ from these forward-looking statements.
All forward-looking statements speak only as of the date of this Quarterly Report on Form 10-Q and are expressly qualified in their entirety by the cautionary statements included in this Quarterly Report on Form 10-Q. Prosper Funding and PMI undertake no obligation to update or revise forward-looking statements that may be made to reflect events or circumstances that arise after the date made or to reflect the occurrence of unanticipated events, other than as required by law.
WHERE YOU CAN FIND MORE INFORMATION
The Registrants file annual, quarterly and current reports and other information with the SEC. You can inspect, read and copy these reports and other information at the SEC’s Public Reference Room at 100 F Street, N.E., Washington, D.C. 20549. You can obtain information regarding the operation of the SEC’s Public Reference Room by calling the SEC at 1-800-SEC-0330. The SEC also maintains a website at www.sec.gov that makes available reports, proxy statements and other information regarding issuers that file electronically.
Prosper Marketplace, Inc.
(Unaudited)
(in thousands, except for share and per share amounts)
|
|
June 30,
2014
|
December 31,
2013 *
|
||||||
|
Assets
|
||||||||
|
Cash and cash equivalents
|
$
|
76,802
|
$
|
18,339
|
||||
|
Restricted cash
|
17,946
|
15,473
|
||||||
|
Accounts receivable
|
229
|
218
|
||||||
|
Loans held for investment
|
9,543
|
3,917
|
||||||
|
Borrower loans receivable at fair value
|
246,861
|
226,238
|
||||||
|
Property and equipment, net
|
4,200
|
3,396
|
||||||
|
Prepaid and other assets
|
2,870
|
708
|
||||||
|
Total Assets
|
$
|
358,451
|
$
|
268,289
|
||||
|
|
||||||||
|
Liabilities and Stockholders' Equity
|
||||||||
|
Accounts payable and accrued liabilities
|
$
|
10,399
|
$
|
6,737
|
||||
|
Class action settlement liability
|
8,000
|
10,000
|
||||||
|
Notes at fair value
|
246,511
|
226,794
|
||||||
|
Repurchase liability for unvested restricted stock awards
|
721
|
609
|
||||||
|
Repurchase and indemnification obligation
|
146
|
32
|
||||||
|
Total Liabilities
|
265,777
|
244,172
|
||||||
|
|
||||||||
|
Commitments and contingencies (see Note 10)
|
||||||||
|
|
||||||||
|
Stockholders' Equity
|
||||||||
|
Convertible preferred stock – Series A '13, A-1 '13, B '13 and C’14 ($0.01 par value; 32,155,022 and 27,274,068 shares authorized, issued and outstanding as of June 30, 2014 and December 31, 2013, respectively). (Aggregate liquidation preference of $166,247 and $96,172 as of June 30, 2014 and December 31, 2013, respectively).
|
322
|
273
|
||||||
|
Common stock ($0.01 par value; 47,928,883 shares authorized; 14,236,119 issued and outstanding as of June 30, 2014; and 41,487,465 shares authorized; 13,720,214 issued and outstanding as of December 31, 2013).
|
115
|
75
|
||||||
|
Additional paid-in capital
|
198,777
|
128,140
|
||||||
|
Less: treasury stock
|
(291
|
)
|
(291
|
)
|
||||
|
Accumulated deficit
|
(106,249
|
)
|
(104,080
|
)
|
||||
|
Total Stockholders' Equity
|
92,674
|
24,117
|
||||||
|
Total Liabilities and Stockholders' Equity
|
$
|
358,451
|
$
|
268,289
|
||||
The number of shares issued and outstanding reflects a 10-for-1 reverse stock split effected by the Company on October 29, 2013.
The accompanying notes are an integral part of these condensed consolidated financial statements.
* Derived from the Company’s audited consolidated financial statements.
Prosper Marketplace, Inc.
(Unaudited)
(in thousands, except for share and per share amounts)
|
|
Three Months Ended
|
Six Months Ended
|
||||||||||||||
|
|
June 30,
|
June 30,
|
||||||||||||||
|
|
2014
|
2013
|
2014
|
2013
|
||||||||||||
|
Revenues
|
||||||||||||||||
|
Origination Fees
|
$
|
16,448
|
$
|
3,342
|
$
|
25,149
|
$
|
4,914
|
||||||||
|
Interest Income on Borrower Loans
|
10,701
|
8,563
|
20,810
|
16,292
|
||||||||||||
|
Interest Expense on Notes
|
(9,494
|
)
|
(8,127
|
)
|
(18,763
|
)
|
(15,453
|
)
|
||||||||
|
Rebates & Promotions
|
(639
|
)
|
(387
|
)
|
(999
|
)
|
(662
|
)
|
||||||||
|
Other Revenues
|
269
|
285
|
965
|
432
|
||||||||||||
|
Total Revenues
|
17,285
|
3,676
|
27,162
|
5,523
|
||||||||||||
|
Cost of Revenues
|
||||||||||||||||
|
Cost of Services
|
(767
|
)
|
(500
|
)
|
(1,293
|
)
|
(982
|
)
|
||||||||
|
Provision for repurchase and indemnification obligation
|
(54
|
)
|
(50
|
)
|
(116
|
)
|
(177
|
)
|
||||||||
|
Net Revenues
|
16,464
|
3,126
|
25,753
|
4,364
|
||||||||||||
|
|
||||||||||||||||
|
Operating Expenses
|
||||||||||||||||
|
Compensation and Benefits
|
5,277
|
3,303
|
9,219
|
5,841
|
||||||||||||
|
Marketing and Advertising
|
9,040
|
3,878
|
15,026
|
5,451
|
||||||||||||
|
Depreciation and Amortization
|
380
|
208
|
743
|
413
|
||||||||||||
|
General and Administrative
|
||||||||||||||||
|
Professional Services
|
364
|
694
|
541
|
1,382
|
||||||||||||
|
Facilities and Maintenance
|
621
|
481
|
1,066
|
794
|
||||||||||||
|
Class Action Settlement
|
-
|
10,000
|
-
|
10,000
|
||||||||||||
|
Loss on impairment of Fixed Assets
|
-
|
61
|
215
|
62
|
||||||||||||
|
Other
|
877
|
466
|
1,503
|
760
|
||||||||||||
|
Total Operating Expenses
|
16,559
|
19,091
|
28,313
|
24,703
|
||||||||||||
|
Loss Before Other Income and Expenses
|
(95
|
)
|
(15,965
|
)
|
(2,560
|
)
|
(20,339
|
)
|
||||||||
|
|
||||||||||||||||
|
Other Income and Expenses
|
||||||||||||||||
|
Interest Income
|
1
|
-
|
2
|
-
|
||||||||||||
|
Change in Fair Value of Borrower Loans, Loans Held for Investment and Notes, net
|
91
|
312
|
389
|
487
|
||||||||||||
|
Total Other Income and Expenses
|
92
|
312
|
391
|
487
|
||||||||||||
|
Loss Before Income Taxes
|
(3
|
)
|
(15,653
|
)
|
(2,169
|
)
|
(19,852
|
)
|
||||||||
|
Provision For Income Taxes
|
-
|
-
|
-
|
-
|
||||||||||||
|
Net Loss
|
$
|
(3
|
)
|
$
|
(15,653
|
)
|
$
|
(2,169
|
)
|
$
|
(19,852
|
)
|
||||
|
|
||||||||||||||||
|
Net loss per share – basic and diluted
|
$
|
(0.00
|
)
|
$
|
(2.39
|
)
|
$
|
(0.25
|
)
|
$
|
(3.30
|
)
|
||||
|
Weighted- average shares - basic and diluted net loss per share
|
9,155,199
|
6,553,785
|
8,794,337
|
6,020,281
|
||||||||||||
The weighted average number of shares and the net loss per share reflect a 10-for-1 reverse stock split effected by the Company on October 29, 2013.
The accompanying notes are an integral part of these condensed consolidated financial statements.
Prosper Marketplace, Inc.
(Unaudited)
(in thousands, except for share and per share amounts)
|
|
Preferred Stock
|
Common Stock
|
Treasury Stock
|
Additional
|
||||||||||||||||||||||||||||||||
|
|
Paid-In
|
Accumulated
|
||||||||||||||||||||||||||||||||||
|
|
Shares
|
Amount
|
Shares
|
Amount
|
Shares
|
Amount
|
Capital
|
Deficit
|
Total
|
|||||||||||||||||||||||||||
|
|
||||||||||||||||||||||||||||||||||||
|
Balance as of January 1, 2014
|
27,274,068
|
$
|
273
|
13,902,478
|
$
|
75
|
(182,264
|
)
|
$
|
(291
|
)
|
$
|
128,140
|
$
|
(104,080
|
)
|
$
|
24,117
|
||||||||||||||||||
|
Issuance of convertible preferred stock, Series C'14
|
4,880,954
|
49
|
-
|
-
|
-
|
-
|
69,909
|
-
|
69,958
|
|||||||||||||||||||||||||||
|
Exercise of vested stock options
|
-
|
-
|
157,312
|
1
|
-
|
-
|
30
|
-
|
31
|
|||||||||||||||||||||||||||
|
Exercise of nonvested stock options
|
-
|
-
|
351,750
|
-
|
-
|
-
|
-
|
-
|
||||||||||||||||||||||||||||
|
Repurchase of restricted stock
|
-
|
-
|
(101,980
|
)
|
-
|
-
|
-
|
-
|
-
|
|||||||||||||||||||||||||||
|
Restricted stock vested
|
-
|
-
|
38,451
|
38
|
114
|
152
|
||||||||||||||||||||||||||||||
|
Exercise of warrants
|
70,372
|
1
|
84
|
85
|
||||||||||||||||||||||||||||||||
|
Stock-based compensation expense
|
-
|
-
|
-
|
-
|
-
|
-
|
500
|
-
|
500
|
|||||||||||||||||||||||||||
|
Net loss
|
-
|
-
|
-
|
-
|
-
|
-
|
-
|
(2,169
|
)
|
(2,169
|
)
|
|||||||||||||||||||||||||
|
Balance as of June 30, 2014
|
32,155,022
|
$
|
322
|
14,418,383
|
$
|
115
|
(182,264
|
)
|
$
|
(291
|
)
|
$
|
198,777
|
$
|
(106,249
|
)
|
$
|
92,674
|
||||||||||||||||||
The number of shares reflects a 10-for-1 reverse stock split effected by the Company on October 29, 2013
The accompanying notes are an integral part of these condensed consolidated financial statements.
Prosper Marketplace, Inc.
(Unaudited)
(in thousands, except for share and per share amounts)
|
|
For the Six Months Ended
June 30,
|
|||||||
|
|
2014
|
2013
|
||||||
|
Cash flows from operating activities:
|
||||||||
|
Net loss
|
$
|
(2,169
|
)
|
$
|
(19,852
|
)
|
||
|
Adjustments to reconcile net loss to net cash used in operating activities:
|
||||||||
|
Change in fair value of borrower loans
|
958
|
4,082
|
||||||
|
Change in fair value of loans held for investment
|
3
|
3
|
||||||
|
Change in fair value of notes
|
(1,350
|
)
|
(4,573
|
)
|
||||
|
Depreciation and amortization
|
743
|
413
|
||||||
|
Provision for repurchase and indemnification obligation
|
114
|
124
|
||||||
|
Stock-based compensation expense
|
500
|
92
|
||||||
|
Loss on impairment of fixed assets
|
215
|
62
|
||||||
|
Changes in operating assets and liabilities:
|
||||||||
|
Restricted cash
|
(2,473
|
)
|
(1,339
|
)
|
||||
|
Accounts receivable
|
(11
|
)
|
(40
|
)
|
||||
|
Prepaid and other assets
|
(2,162
|
)
|
(851
|
)
|
||||
|
Accounts payable and accrued liabilities
|
3,662
|
(95
|
)
|
|||||
|
Class action settlement liability payment
|
(2,000
|
)
|
10,000
|
|||||
|
Net cash used in operating activities
|
(3,970
|
)
|
(11,974
|
)
|
||||
|
|
||||||||
|
Cash flows from investing activities:
|
||||||||
|
Origination of borrower loans held at fair value
|
(330,464
|
)
|
(74,875
|
)
|
||||
|
Repayment of borrower loans held at fair value
|
65,648
|
50,568
|
||||||
|
Proceeds from sale of borrower loans held at fair value
|
243,235
|
–
|
||||||
|
Purchases of property and equipment
|
(1,762
|
)
|
(1,123
|
)
|
||||
|
Maturities of short term investments
|
–
|
1,000
|
||||||
|
Repayments of loans held for investment at fair value and credit losses
|
312
|
64
|
||||||
|
Origination of loans held for investment at fair value
|
(111,927
|
)
|
(44
|
)
|
||||
|
Proceeds from sale of loans held for investment at fair value
|
105,986
|
-
|
||||||
|
Net cash used in investing activities
|
(28,972
|
)
|
(24,410
|
)
|
||||
|
Cash flows from financing activities:
|
||||||||
|
Proceeds from issuance of notes held at fair value
|
86,713
|
74,875
|
||||||
|
Payment of notes held at fair value
|
(65,646
|
)
|
(50,291
|
)
|
||||
|
Proceeds from issuance of convertible preferred stock
|
70,075
|
20,000
|
||||||
|
Principal repayment of notes payable
|
-
|
116
|
||||||
|
Proceeds from early exercise of stock options
|
276
|
–
|
||||||
|
Proceeds from exercise of vested stock options
|
31
|
|||||||
|
Issuance costs of convertible preferred stock
|
(117
|
)
|
(101
|
)
|
||||
|
Repurchase of restricted stock
|
(12
|
)
|
-
|
|||||
|
Proceeds from exercise of warrants
|
85
|
-
|
||||||
|
Net cash provided by financing activities
|
91,405
|
44,599
|
||||||
|
Net increase in cash and cash equivalents
|
58,463
|
8,215
|
||||||
|
Cash and cash equivalents at beginning of the period
|
18,339
|
2,300
|
||||||
|
Cash and cash equivalents at end of the period
|
$
|
76,802
|
$
|
10,515
|
||||
The accompanying notes are an integral part of these condensed consolidated financial statements.
Prosper Marketplace, Inc.
(Unaudited)
| 1. | Organization and Business |
Prosper Marketplace, Inc. (“PMI” or “the Company”) was incorporated in the state of Delaware on March 22, 2005. PMI developed a peer-to-peer online credit platform (the “platform”) and prior to February 1, 2013, owned the proprietary technology that made operation of the platform possible. Prior to February 1, 2013, PMI also operated the platform, facilitated the origination of unsecured, consumer loans by WebBank, an FDIC-insured, Utah-chartered industrial bank, through the platform and issued and sold borrower payment dependent notes corresponding to those loans.
The platform is designed to allow investor members to invest money in borrower members in an open transparent marketplace, with the aim of allowing both investor members and borrower members to profit financially as well as socially. The Company believes peer-to-peer lending represents a new model of consumer lending, where individuals and institutions can earn the interest spread of a traditional consumer lender but must also assume the credit risk of a traditional lender. The platform was launched to the public in 2006 and had attracted over two million members and facilitated approximately $1.4 billion in Borrower Loans as of June 30, 2014.
A borrower member who wishes to obtain a loan through the platform must post a loan listing, or listing, on the platform. Listings are allocated to one of two investor member funding channels: (i) the first channel allows investor members to commit to purchase Notes, the payments of which are dependent on the payments made on the corresponding Borrower Loan (the “Note Channel”); and (ii) the second channel allows investor members to commit to purchase 100% of a Borrower Loan directly from the Company (the “Whole Loan Channel”).
On February 1, 2013, PMI transferred ownership of the platform, including all of the rights related to the operation of the platform, as well as all then-outstanding Borrower Loans, to its wholly-owned subsidiary, Prosper Funding LLC (“Prosper Funding” and, collectively with PMI, the “Company” or the “Registrants”). At that same time, Prosper Funding assumed all of PMI’s obligations with respect to all then-outstanding Notes. Since February 1, 2013, all Notes issued and sold through the platform are issued and sold by Prosper Funding. Pursuant to a Loan Account Program Agreement between PMI and WebBank, PMI manages the operation of the platform, as agent of WebBank, in connection with the submission of loan applications by potential borrowers, the making of related loans by WebBank and the funding of such loans by WebBank. On February 1, 2013, Prosper Funding entered into an Administration Agreement with PMI in its capacity as licensee, corporate administrator, loan platform administrator and loan and note servicer, pursuant to which PMI provides certain back office support, loan platform administration and loan and note servicing to Prosper Funding.
Prosper Funding formed Prosper Asset Holdings LLC (“PAH”) in November 2013 as a limited liability company with the sole equity member being Prosper Funding. PAH was formed to purchase Borrower Loans from Prosper Funding and sell the Borrower Loans to third parties.
As reflected in the accompanying condensed consolidated financial statements, the Company has incurred net losses and negative cash flows from operations since inception. An accumulated deficit of $106.2 million was incurred as of June 30, 2014. At June 30, 2014, the Company had $76.8 million in cash and cash equivalents. Since its inception, the Company has financed its operations primarily through equity financing from various sources. The Company believes that its current cash position, including the additional $51.4 million ($69.9 million raised in May 2014 net of $18.5 million spent in July 2014 on preferred share repurchases) through a new equity financing, is sufficient to meet its current liquidity needs. On May 1, 2014, the Company entered into a Series C Preferred Stock Purchase Agreement with certain new investors (collectively, the “Series C Share Purchasers”), pursuant to which the Company issued and sold to such Series C Share Purchasers 4,880,954 shares of the Company’s Series C Preferred Stock for an aggregate purchase price of $69.9 million, net of issuance costs. Refer to Note 13, Subsequent Events for additional information on the preferred share repurchases.
| 2. | Summary of Significant Accounting Policies |
Basis of Presentation
The unaudited interim condensed consolidated financial statements have been prepared in accordance with U.S. generally accepted accounting principles (“US GAAP”) and disclosure requirements for interim financial information and the requirements of Rule 8-03 of Regulation S-X. Accordingly, they do not include all of the information and footnotes required by US GAAP for complete financial statements. The unaudited interim condensed consolidated financial statements should be read in conjunction with the audited financial statements and notes thereto for the year ended December 31, 2013. The balance sheet at December 31, 2013 has been derived from the audited financial statements at that date. Management believes these unaudited interim condensed consolidated financial statements reflect all adjustments, including those of a normal recurring nature, which are necessary for a fair presentation of the results for the interim periods presented. The results of operations for the interim periods are not necessarily indicative of the results that may be expected for the full year of any other interim period.
The accompanying interim condensed consolidated financial statements include the accounts of PMI and its wholly-owned subsidiary, Prosper Funding. All intercompany balances and transactions between Prosper Funding and PMI have been eliminated in consolidation.
Use of Estimates
The preparation of the interim condensed consolidated financial statements in conformity with accounting principles generally accepted in the United States requires management to make certain estimates, judgments and assumptions that affect the reported amounts of assets and liabilities and the related disclosures at the date of the financial statements and the reported amounts of revenues and expenses during the reporting periods. These estimates, judgments and assumptions include but are not limited to the following: valuation of Borrower Loans and associated Notes, valuation of servicing rights, valuation allowance on deferred tax assets, repurchase and indemnification obligation, stock-based compensation expense, and contingent liabilities. The Company bases its estimates on historical experience from all Borrower Loans, and on various other assumptions that it believes to be reasonable under the circumstances. Actual results could differ from those estimates.
Certain Risks and Concentrations
In the normal course of its business, the Company encounters two significant types of risk: credit and regulatory. Financial instruments that potentially subject the Company to significant concentrations of credit risk consist primarily of cash, cash equivalents, and restricted cash. The Company places cash, cash equivalents, and restricted cash with high-quality financial institutions and is exposed to credit risk in the event of default by these institutions to the extent the amount recorded on the balance sheet exceeds federally insured amounts. The Company performs periodic evaluations of the relative credit standing of these financial institutions and has not sustained any credit losses from instruments held at these financial institutions.
To the extent that Borrower Loan payments are not made, servicing income will be reduced. A group of Notes corresponding to a particular Borrower Loan is wholly dependent on the repayment of such Borrower Loan. As a result, the Company does not bear the risk on such Borrower Loan.
The Company is subject to various regulatory requirements. The failure to appropriately identify and address these regulatory requirements could result in certain discretionary actions by regulators that could have a material effect on the Company's consolidated financial position and results of operations (See Note 10—Commitments and Contingencies—Securities Law Compliance).
Cash and Cash Equivalents
All highly liquid investments with stated maturities of three months or less from date of purchase are classified as cash equivalents. Cash equivalents are recorded at cost, which approximates fair value. Cash and cash equivalents include various unrestricted deposits with highly rated financial institutions in checking, money market and short-term certificate of deposit accounts.
Restricted Cash
Restricted cash consists primarily of cash deposits held as collateral as required for loan funding and servicing activities.
Borrower Loans and Notes
Through the Note Channel, the Company issues Notes and purchases Borrower Loans from WebBank, and holds the Borrower Loans until maturity. The obligation to repay a series of Notes funded through the Note Channel is conditioned upon the repayment of the associated Borrower Loan. Borrower Loans and Notes funded through the Note Channel are carried on the Company’s condensed consolidated balance sheets as assets and liabilities, respectively. The Company has adopted the provisions of ASC Topic 825, Financial Instruments. ASC Topic 825 permits companies to choose to measure certain financial instruments and certain other items at fair value on an instrument-by-instrument basis with unrealized gains and losses on items for which the fair value option has been elected reported in earnings. The fair value election, with respect to an item, may not be revoked once an election is made. In applying the provisions of ASC Topic 825, the recorded assets and liabilities are measured using the fair value option in a way that separates these reported fair values from the carrying values of similar assets and liabilities measured with a different measurement attribute. A specific allowance account is not recorded relating to the Borrower Loans and Notes in which the Company has elected the fair value option, but rather the Company estimates the fair value of such Borrower Loans and Notes using discounted cash flow methodologies adjusted for the historical payment, loss and recovery rates. An account is considered to be a loss, or charged-off, when it reaches more than 120 days past due. The aggregate fair value of the Borrower Loans and Notes funded through the Note Channel are reported as separate line items in the assets and liabilities sections of the accompanying balance sheets using the methods described in ASC Topic 820, Fair Value Measurements and Disclosures—See Fair Value Measurement.
Borrower Loans Sold Directly to Third Party Purchasers
For Borrower Loans sold to unrelated third party purchasers on a servicing retained basis through the Whole Loan Channel, a gain or loss is recorded on the sale date. In order to calculate the gain or loss, the Company first determines whether the terms of the servicing arrangement with the purchaser results in a net servicing asset (i.e., when contractual/expected servicing revenues adequately compensate the Company) or a net servicing liability (i.e., when contractual/expected servicing revenues do not adequately compensate the Company). When contractual/expected servicing revenues do not adequately compensate the Company, a portion of the gross proceeds of the Borrower Loans sold on a servicing retained basis through the Whole Loan Channel are allocated to the recording of a net servicing liability. Conversely, when contractual/expected servicing revenues provide more than adequate compensation to the Company, the excess servicing compensation is allocated to the gross proceeds of the Borrower Loans sold and results in the recording of a net servicing asset. The Company estimates the fair value of the loan servicing asset or liability considering the contractual servicing fee revenue, adequate compensation for the Company's servicing obligation, the current principal balances of the Borrower Loans and projected servicing revenues given projected defaults and prepayments (if significant) over the remaining lives of the Borrower Loans. The Company recorded a gain/(loss) on sale of whole loans of $(0.2) million and $0 for the three months ended June 30, 2014 and 2013, respectively, which was included in Other revenues on the condensed consolidated statements of operations. The Company recorded a gain/(loss) on sale of whole loans of $0.2 million and $0 for the six months ended June 30, 2014 and 2013, respectively, which was included in Other revenues on the condensed consolidated statements of operations. At June 30, 2014 and December 31, 2013, the Company recorded $0.7 million and $0.1 million as a servicing asset related to these loans, which is included in Borrower loans receivable at fair value on the condensed consolidated balance sheets.
Loans Held for Investment
Loans held for investment are primarily comprised of Borrower Loans held for short durations and are recorded at cost which approximates fair value. For Borrower Loans held long term, the fair value is estimated using discounted cash flow methodologies based upon a set of valuation assumptions similar to those of other Borrower Loans, which are set forth in Note 2— Fair Value Measurement.
Fair Value Measurement
The Company adopted ASC Topic 820, Fair Value Measurements and Disclosures, on January 1, 2008, which provides a framework for measuring the fair value of assets and liabilities. ASC Topic 820 also provides guidance regarding a fair value hierarchy, which prioritizes information used to measure fair value and the effect of fair value measurements on earnings and provides for enhanced disclosures determined by the level within the hierarchy of information used in the valuation. ASC Topic 820 applies whenever other standards require (or permit) assets or liabilities to be measured at fair value but does not expand the use of fair value in any new circumstances.
ASC Topic 820 defines fair value in terms of the price that would be received upon the sale of an asset or paid to transfer a liability in an orderly transaction between market participants at the measurement date.
The price used to measure the fair value is not adjusted for transaction costs while the cost basis of certain financial instruments may include initial transaction costs. Under ASC Topic 820, the fair value measurement also assumes that the transaction to sell an asset occurs in the principal market for the asset or, in the absence of a principal market, the most advantageous market for the asset. The principal market is the market in which the reporting entity would sell or transfer the asset with the greatest volume and level of activity for the asset. In determining the principal market for an asset or liability under ASC Topic 820, it is assumed that the reporting entity has access to the market as of the measurement date. If no market for the asset exists or if the reporting entity does not have access to the principal market, the reporting entity should use a hypothetical market.
Under ASC Topic 820, assets and liabilities carried at fair value on the balance sheets are classified among three levels based on the observability of the inputs used to determine fair value:
Level 1 — The valuation is based on quoted prices in active markets for identical instruments.
Level 2 — The valuation is based on observable inputs such as quoted prices for similar instruments in active markets, quoted prices for identical or similar instruments in markets that are not active, and model-based valuation techniques for which all significant assumptions are observable in the market.
Level 3 — The valuation is based on unobservable inputs that are supported by little or no market activity and that are significant to the fair value of the instrument. Level 3 valuations are typically performed using pricing models, discounted cash flow methodologies, or similar techniques, which incorporate management’s own estimates of assumptions that market participants would use in pricing the instrument or valuations that require significant management judgment or estimation.
Fair value of financial instruments are determined based on the fair value hierarchy established in ASC Topic 820, which requires an entity to maximize the use of quoted prices and observable inputs and to minimize the use of unobservable inputs when measuring fair value. Various valuation techniques are utilized, depending on the nature of the financial instrument, including the use of market prices for identical or similar instruments, or discounted cash flow models. When possible, active and observable market data for identical or similar financial instruments are utilized. Alternatively, fair value is determined using assumptions that management believes a market participant would use in pricing the asset or liability.
Financial instruments consist principally of Cash and cash equivalents, Restricted cash, Borrower loans receivable, Loans held for investment, Accounts payable and accrued liabilities, and Notes. The estimated fair values of Cash and cash equivalents, Restricted cash, Accounts payable and accrued liabilities approximate their carrying values because of their short term nature.
The following tables present the assets and liabilities measured at fair value on a recurring basis at June 30, 2014 and December 31, 2013 (in thousands):
|
June 30, 2014
|
Level 1
|
Level 2
|
Level 3
|
Fair
Value
|
||||||||||||
|
Assets
|
||||||||||||||||
|
Borrower loans receivable
|
$
|
-
|
$
|
-
|
$
|
246,861
|
$
|
246,861
|
||||||||
|
Restricted cash
|
16,573
|
1,373
|
-
|
17,946
|
||||||||||||
|
Loans held for investment
|
-
|
-
|
9,543
|
9,543
|
||||||||||||
|
Liabilities
|
||||||||||||||||
|
Notes
|
$
|
-
|
$
|
-
|
$
|
246,511
|
$
|
246,511
|
||||||||
|
December 31, 2013
|
Level 1
|
Level 2
|
Level 3
|
Fair
Value
|
||||||||||||
|
Assets
|
||||||||||||||||
|
Borrower loans receivable
|
$
|
-
|
$
|
-
|
$
|
226,238
|
$
|
226,238
|
||||||||
|
Restricted cash
|
14,032
|
1,441
|
-
|
15,473
|
||||||||||||
|
Loans held for investment
|
-
|
-
|
3,917
|
3,917
|
||||||||||||
|
Liabilities
|
||||||||||||||||
|
Notes
|
$
|
-
|
$
|
-
|
$
|
226,794
|
$
|
226,794
|
||||||||
Property and Equipment
Property and equipment consists of computer equipment, office furniture and equipment, and software purchased or developed for internal use. Property and equipment are stated at cost, less accumulated depreciation and amortization, and are computed using the straight-line method based upon estimated useful lives of the assets, which range from three to seven years, commencing once the asset is placed in service. Expenditures are capitalized for replacements and betterments and recognized as expense amounts for maintenance and repairs as incurred.
Earned Vacations
The Company has a flexible vacation plan for its employees under which employees are entitled to take vacations for such periods of time that do not interfere with the orderly performance of their job responsibilities. Accordingly, no accrual for unpaid vacation pay has been included in the condensed consolidated financial statements.
Internal Use Software and Website Development
Internal use software costs and website development costs are accounted for, in accordance with ASC Topic 350-40, Internal Use Software, and ASC Topic 350-50, Website Development Costs. In accordance with ASC Topic 350-40 and 350-50, the costs to develop software for the website and other internal uses are capitalized when management has authorized and committed project funding, preliminary development efforts are successfully completed, and it is probable that the project will be completed and the software will be used as intended. Capitalized software development costs primarily include software licenses acquired, fees paid to outside consultants, and salaries and payroll related costs for employees directly involved in the development efforts.
Costs incurred prior to meeting these criteria, together with costs incurred for training and maintenance, are expensed. Costs incurred for upgrades and enhancements that are considered to be probable to result in additional functionality are capitalized. Capitalized costs are included in property and equipment and amortized to expense using the straight-line method over their expected lives. Software assets are evaluated for impairment whenever events or changes in circumstances indicate that the carrying amount of such assets may not be recoverable. Recoverability of software assets to be held and used is measured by a comparison of the carrying amount of the asset to the future net undiscounted cash flows expected to be generated by the asset. If such software assets are considered to be impaired, the impairment to be recognized is the excess of the carrying amount over the fair value of the software asset.
Repurchase and Indemnification Obligation
Under the terms of the Notes, the Lender Registration Agreements between the Company and investor members who participate in the Note Channel, and the loan purchase agreements between the Company and investor members that participate in the Whole Loan Channel, the Company may, in certain circumstances, become obligated to repurchase a Note or Borrower Loan from a investor member or indemnify a investor member against loss on a Note. Generally, these circumstances include the occurrence of verifiable identity theft, the failure to properly follow loan listing or bidding protocols, or a violation of the applicable federal, state, or local lending laws. The indemnification and repurchase obligation is estimated based on historical experience. The Company accrues a provision for the repurchase and indemnification obligation when the Notes or Borrower Loans are issued. Indemnified or repurchased Notes and repurchased Borrower Loans associated with violations of federal, state, or local lending laws or verifiable identity theft are written off at the time of repurchase or at the time an indemnification payment is made.
Revenue Recognition
Revenue is recognized in accordance with ASC Topic 605, Revenue Recognition. Under ASC Topic 605, revenue is recognized when persuasive evidence of an arrangement exists, services have been rendered, the price of the services is fixed and determinable, and collectability is reasonably assured.
Origination Fees
The Company earns an origination fee upon the successful closing of all Borrower Loans issued through the platform. WebBank charges the origination fee and the Company receives payments from WebBank equal to the origination fee as compensation for its loan origination activities on behalf of WebBank. The borrower receives an amount equal to the loan amount net of the loan origination fee. The loan origination fee is determined by the term and credit grade of the loan, and ranges from 1.00% to 5.00% of the original principal amount. Since the Company accounts for Borrower Loans, Loans held for investment and Notes at fair value, origination fees are not deferred but are recognized at origination of the Borrower Loan, and direct costs to originate Borrower Loans are recorded as expenses as incurred.
Interest Income on Borrower Loans Receivable and Interest Expense on Notes
The Company recognizes interest income on Borrower Loans funded through the Note Channel and interest expense on the corresponding Notes using the accrual method based on the stated interest rate to the extent the Company believes it to be collectable. The following table summarizes the gross interest income and expense for the three and six months ended June 30, 2014 and 2013 (in thousands):
|
|
Three months ended June 30,
|
Six months ended June 30,
|
||||||||||||||
|
|
2014
|
2013
|
2014
|
2013
|
||||||||||||
|
|
||||||||||||||||
|
Interest income on borrower loans
|
$
|
10,701
|
$
|
8,563
|
$
|
20,810
|
$
|
16,292
|
||||||||
|
Interest expense on notes
|
(9,494
|
)
|
(8,127
|
)
|
(18,763
|
)
|
(15,453
|
)
|
||||||||
|
Net interest income
|
$
|
1,207
|
$
|
436
|
$
|
2,047
|
$
|
839
|
||||||||
Marketing and Advertising Expense
Under the provisions of ASC Topic 720, Other Expenses, the costs of advertising are expensed as incurred. Marketing and advertising costs were $15.0 million and $5.5 million for the six months ended June 30, 2014 and 2013, respectively.
Rebate and Promotional Expenses
Rebates and promotions are accounted for in accordance with ASC Topic 605, Revenue Recognition. From time to time, rebates and promotions are offered to borrower and investor members. These rebates and promotions are recorded as an offset to revenue if a particular rebate or promotion is earned upon the origination of the Borrower Loan. Rebates and promotions have in the past been in the form of cash back and other incentives paid to borrower and investor members.
Stock-Based Compensation
Stock-based compensation for employees is accounted for using fair-value-based accounting in accordance with ASC Topic 718, Stock Compensation. ASC Topic 718 requires companies to estimate the fair value of stock-based awards on the date of grant using an option-pricing model. The stock-based compensation related to awards that are expected to vest is amortized using the straight line method over the vesting term of the stock-based award, which is generally four years. Expected forfeitures of unvested options are estimated at the time of grant such that expense is recorded only for those stock-based awards that are expected to vest.
Options have been granted to purchase shares of common stock to nonemployees in exchange for services performed, which the Company accounts for in accordance with the provisions of ASC Topic 505-50, Equity-Based Payments to Non-Employees. Because ASC Topic 505 requires that nonemployee equity awards be recorded at their fair value, the Black-Scholes model is used to estimate the fair value of options granted to nonemployees at each vesting date until performance is complete to determine the appropriate charge for the services provided. The volatility of the Company’s common stock was based on comparative company volatility.
Net Loss Per Share
Net loss per share is computed in accordance with ASC Topic 260, Earnings Per Share. Under ASC Topic 260, basic net loss per share is computed by dividing net loss per share available to common shareholders by the weighted average number of common shares outstanding for the period and excludes the effects of any potentially dilutive securities. Diluted earnings per share, if presented, would include the dilution that would occur upon the exercise or conversion of all potentially dilutive securities into common stock using the “treasury stock” and/or “if converted” methods as applicable. At June 30, 2014, there were outstanding convertible preferred stock, warrants and options convertible into 32,155,022, 148,438 and 4,338,461 common shares, respectively, which may dilute future earnings per share. At June 30, 2013, there were outstanding convertible preferred stock, warrants and options convertible into 138,681,720, 2,187,969 and 7,212,610 common shares, respectively, which may dilute future earnings per share. The weighted average number of shares and the loss per share reflect a 10-for-1 reverse stock split effected by the Company on October 29, 2013. By reporting a net loss for the three and six months ended June 30, 2014 and 2013, potentially dilutive securities are excluded from the computation of net loss per share, as their effect would be antidilutive.
Income Taxes
The asset and liability method is used to account for income taxes as codified in ASC Topic 740, Income Taxes. Under this method, deferred income tax assets and liabilities are based on the differences between the financial statements and tax bases of assets and liabilities that will result in taxable or deductible amounts in the future based on enacted tax laws and rates applicable to the periods in which the differences are expected to affect taxable income. Valuation allowances are established when necessary to reduce deferred tax assets to the amount expected to be realized.
Under ASC Topic 740, the Company’s policy to include interest and penalties related to gross unrecognized tax benefits within its provision for income taxes did not change. U.S. Federal, California and other state income tax returns are filed. The Company is currently not undergoing any income tax examinations. Due to the net operating loss, generally all tax years remain open.
Comprehensive Income
There is no comprehensive income (loss) other than the net income (loss) disclosed in the condensed consolidated statements of operations.
Recent Accounting Pronouncements
In May 2014, as part of its ongoing efforts to assist in the convergence of U.S. GAAP and International Financial Reporting Standards (“IFRS”), FASB issued ASU 2014-09, “Revenue from Contracts with Customers.” The new guidance sets forth a new five-step revenue recognition model which replaces the prior revenue recognition guidance in its entirety and is intended to eliminate numerous industry-specific pieces of revenue recognition guidance that have historically existed in U.S. GAAP. The underlying principle of the new standard is that a business or other organization will recognize revenue to depict the transfer of promised goods or services to customers in an amount that reflects what it expects in exchange for the goods or services. The standard also requires more detailed disclosures and provides additional guidance for transactions that were not addressed completely in the prior accounting guidance. The standard will be effective for the Company in the first quarter of fiscal 2017. Early adoption is not permitted. The Company is currently assessing the potential impact on its financial statements from adopting this new guidance.
| 3. | Borrower Loans and Notes Held at Fair Value |
As observable market prices are not available for the Borrower Loans and Notes funded through the Note Channel, or for similar assets and liabilities, the Company believes such Borrower Loans and Notes should be considered Level 3 financial instruments under ASC Topic 820. In a hypothetical transaction as of the measurement date, the Company believes that differences in the principal marketplace in which such Borrower Loans are originated and the principal marketplace in which it might offer such Borrower Loans for sale may result in differences between the originated amount of the Borrower Loans and their fair value as of the transaction date. For Borrower Loans funded through the Note Channel, the fair value is estimated using discounted cash flow methodologies based upon valuation assumptions including prepayment speeds, roll rates, recovery rates and discount rates based on the perceived credit risk within each credit grade.
The obligation to pay principal and interest on any series of Notes is equal to the loan payments, if any, that are received on the corresponding Borrower Loan, net of its servicing fee. The fair value election for Notes and Borrower Loans funded through the Note Channel allows both the assets and the related liabilities to receive similar accounting treatment for expected losses which is consistent with the subsequent cash flows to investor members that are dependent upon borrower payments. As such, the fair value of the Notes is approximately equal to the fair value of the Borrower Loans funded through the Note Channel, adjusted for the servicing fee and the timing of borrower payments subsequently disbursed to Note holders. Any unrealized gains or losses on such Borrower Loans and Notes for which the fair value option has been elected is recorded as a separate line item in the statement of operations. The effective interest rate associated with a series of Notes is less than the interest rate earned on the corresponding Borrower Loan due to the servicing fee. See further discussion in this note for a roll-forward and further discussion of the significant assumptions used to value Borrower Loans and Notes funded through the Note Channel.
The fair value of the Borrower Loans and Notes funded through the Note Channel is estimated using discounted cash flow methodologies based upon a set of valuation assumptions. The primary cash flow assumptions used to value such Borrower Loans and Notes include default rates derived from historical performance and discount rates applied to each credit grade based on the perceived credit risk of each credit grade. The obligation to pay principal and interest on any series of Notes is equal to the loan payments, if any, received on the corresponding Borrower Loan, net of the servicing fee. As such, the fair value of the Notes is approximately equal to the fair value of the Borrower Loans funded through the Note Channel, adjusted for the servicing fee and the timing of borrower payments subsequently disbursed to the Note holders. The effective interest rate associated with a series of Notes will be less than the interest rate earned on the corresponding Borrower Loan due to the servicing fee.
Key economic assumptions and the sensitivity of the current fair value to immediate adverse changes in those assumptions at June 30, 2014 for Borrower Loans and Notes funded through the Note Channel are presented in the following table (in thousands):
|
|
Borrower Loans
|
Notes
|
||||||
|
Discount rate assumption:
|
9.43
|
%*
|
9.43
|
%*
|
||||
|
Resulting fair value from:
|
||||||||
|
100 basis point increase
|
$
|
239,501
|
$
|
236,585
|
||||
|
200 basis point increase
|
236,564
|
233,668
|
||||||
|
Resulting fair value from:
|
||||||||
|
100 basis point decrease
|
$
|
245,558
|
$
|
242,591
|
||||
|
200 basis point decrease
|
248,688
|
245,689
|
||||||
|
|
||||||||
|
|
||||||||
|
Default rate assumption:
|
7.00
|
%*
|
7.00
|
%*
|
||||
|
Resulting fair value from:
|
||||||||
|
10% higher default rates
|
$
|
239,687
|
$
|
236,768
|
||||
|
20% higher default rates
|
236,761
|
233,869
|
||||||
|
Resulting fair value from:
|
||||||||
|
10% lower default rates
|
$
|
245,132
|
$
|
242,152
|
||||
|
20% lower default rates
|
247,726
|
244,721
|
||||||
* Represents weighted average assumptions considering all credit grades.
The changes in Level 3 assets measured at fair value on a recurring basis are as follows (in thousands):
|
Fair Value Measurements Using Significant Unobservable Inputs (Level 3)
|
||||||||||||||||
|
|
Borrower
Loans
|
Notes
|
Loans Held
for
Investment
|
Total
|
||||||||||||
|
Balance at January 1, 2013
|
$
|
166,900
|
$
|
(167,478
|
)
|
$
|
175
|
$
|
(403
|
)
|
||||||
|
Originations
|
74,875
|
(74,875
|
)
|
44
|
44
|
|||||||||||
|
Principal repayments and credit losses
|
(50,568
|
)
|
50,291
|
(64
|
)
|
(341
|
)
|
|||||||||
|
Change in fair value on borrower loans and notes
|
(4,082
|
)
|
4,573
|
-
|
491
|
|||||||||||
|
Change in fair value of loans held for investment
|
-
|
-
|
(3
|
)
|
(3
|
)
|
||||||||||
|
Balance at June 30, 2013
|
$
|
187,125
|
$
|
(187,489
|
)
|
$
|
152
|
$
|
(212
|
)
|
||||||
|
Fair Value Measurements Using Significant Unobservable Inputs (Level 3)
|
||||||||||||||||
|
|
Borrower
Loans
|
Notes
|
Loans Held
for
Investment
|
Total
|
||||||||||||
|
Balance at January 1, 2014
|
$
|
226,238
|
$
|
(226,794
|
)
|
$
|
3,917
|
$
|
3,361
|
|||||||
|
Originations
|
330,464
|
(86,713
|
)
|
111,927
|
355,678
|
|||||||||||
|
Principal repayments and credit losses
|
(65,648
|
)
|
65,646
|
(312
|
)
|
(314
|
)
|
|||||||||
|
Borrower loans sold to third parties
|
(243,235
|
)
|
-
|
(105,986
|
)
|
(349,221
|
)
|
|||||||||
|
Change in fair value on borrower loans and notes
|
(958
|
)
|
1,350
|
-
|
392
|
|||||||||||
|
Change in fair value of loans held for investment
|
-
|
-
|
(3
|
)
|
(3
|
)
|
||||||||||
|
Balance at June 30, 2014
|
$
|
246,861
|
$
|
(246,511
|
)
|
$
|
9,543
|
$
|
9,893
|
|||||||
The changes in fair value would directly impact the change in fair value on Borrower Loans, Loans held for investment and Notes in the condensed consolidated statements of operations.
Due to the recent origination of the Borrower Loans and Notes funded through the Note Channel, the change in fair value attributable to instrument-specific credit risk is immaterial. Of the 92,110 Borrower Loans originated from July 13, 2009 to June 30, 2014, 254 Borrower Loans were 90 days or more delinquent, which related to an aggregate principal amount of $1.6 million and a fair value of $0.16 million as of June 30, 2014.
|
4.
|
Loans Held for Investment
|
Loans held for investment on the condensed consolidated balance sheets as of June 30, 2014 and December 31, 2013, was $9.5 million and $3.9 million, respectively. For the six months ended June 30, 2014 and 2013, a total of $111.9 million and $0.04 million of Borrower Loans originated through the platform as Loans held for investment. For the six months ended June 30, 2014 and 2013, $106.0 million and $0 of these Borrower Loans were sold to an unrelated third party through the Whole Loan Channel. When a Borrower Loan has been funded by the Company in whole, or in part, the portion of the borrower’s monthly loan payment that corresponds to the percentage of the Borrower Loan that is funded is retained. In these cases, interest income is recorded on these Borrower Loans. Origination fees earned from Borrower Loans funded are initially deferred and subsequently amortized ratably over the holding period of the Borrower Loan and are reported in the statements of operations as Origination fees.
The changes in Loans held for investment measured at fair value on a recurring basis are as follows (in thousands):
|
Fair Value Measurements Using Significant Unobservable Inputs (Level 3)
|
||||
|
Loans Held
for
Investment
|
||||
|
Balance at January 1, 2013
|
$
|
175
|
||
|
Originations
|
44
|
|||
|
Principal repayments and credit losses
|
(64
|
)
|
||
|
Change in fair value of loans held for investment
|
(3
|
)
|
||
|
Balance at June 30, 2013
|
$
|
152
|
||
|
Balance at January 1, 2014
|
$
|
3,917
|
||
|
Originations
|
111,927
|
|||
|
Principal repayments and credit losses
|
(312
|
)
|
||
|
Borrower loans sold to third parties
|
(105,986
|
)
|
||
|
Change in fair value of loans held for investment
|
(3
|
)
|
||
|
Balance at June 30, 2014
|
$
|
9,543
|
| 5. | Repurchase and Indemnification Obligation |
For the three months ended June 30, 2014 and 2013, the provision for repurchase and indemnification obligation was $0.05 million and $0.05 million, respectively. For the six months ended June 30, 2014 and 2013, the provision for repurchase and indemnification obligation was $0.1 million and $0.2 million, respectively. The balance of the Repurchase and indemnification obligation as of June 30, 2014 and December 31, 2013, was $0.15 million and $0.03 million, respectively.
| 6. | Net Loss Per Share |
The Company computes net loss per share in accordance with ASC Topic 260. Under ASC Topic 260, basic net loss per share is computed by dividing net loss per share available to common stockholders by the weighted average number of common shares outstanding for the period and excludes the effects of any potentially dilutive securities. Diluted earnings per share, if presented, would include the dilution that would occur upon the exercise or conversion of all potentially dilutive securities into common stock using the “treasury stock” and/or “if converted” methods as applicable. The weighted average number of shares and the loss per share reflect a 10-for-1 reverse stock split effected by the Company on October 29, 2013.
The Company uses the two-class method to compute net loss per share because the Company has issued securities, other than common stock, that contractually entitle the holders to participate in dividends and earnings of the Company. The two-class method requires earnings for the period to be allocated between common stock and participating securities based upon their respective rights to receive distributed and undistributed earnings. Prior to their conversion to common shares, each series of the Company’s convertible preferred stock was entitled to participate on an as-if-converted basis in distributions, when and if declared by the board of directors (“Board of Directors”), that were made to common stockholders and as a result these shares were considered participating securities. During the three months ended June 30, 2014, certain shares issued as a result of the early exercise of stock options, which are subject to a repurchase right by the Company, were entitled to receive non-forfeitable dividends during the vesting period and as a result were considered participating securities.
Under the two-class method, for periods with net income, basic net income per common share is computed by dividing the net income attributable to common stockholders by the weighted average number of shares of common stock outstanding during the period. Net income attributable to common stockholders is computed by subtracting from net income the portion of current year earnings that the participating securities would have been entitled to receive pursuant to their dividend rights had all of the year’s earnings been distributed. No such adjustment to earnings is made during periods with a net loss, as the holders of the participating securities have no obligation to fund losses. Diluted net loss per common share is computed under the two-class method by using the weighted average number of shares of common stock outstanding, plus, for periods with net income attributable to common stockholders, the potential dilutive effects of stock options and warrants. In addition, the Company analyzes the potential dilutive effect of the outstanding participating securities under the “if-converted” method when calculating diluted earnings per share, in which it is assumed that the outstanding participating securities convert into common stock at the beginning of the period. The Company reports the more dilutive of the approaches (two class or “if-converted”) as its diluted net income per share during the period. Due to net losses for the three months ended June 30, 2014 and 2013, basic and diluted loss per share were the same, as the effect of potentially dilutive securities would have been anti-dilutive.
Basic and diluted net loss per share was calculated as follows (in thousands, except for share and per share amounts):
|
|
Three months ended
June 30,
|
Six months ended
June 30,
|
||||||||||||||
|
|
2014
|
2013
|
2014
|
2013
|
||||||||||||
|
Numerator:
|
||||||||||||||||
|
Net loss applicable to common stockholders for basic and diluted EPS
|
$
|
(3
|
)
|
$
|
(15,653
|
)
|
$
|
(2,169
|
)
|
$
|
(19,852
|
)
|
||||
|
Denominator:
|
||||||||||||||||
|
Weighted average shares used in computing basic and diluted net loss per share
|
9,155,199
|
6,553,785
|
8,794,337
|
6,020,281
|
||||||||||||
|
Basic and diluted net loss per share
|
$
|
(0.00
|
)
|
$
|
(2.39
|
)
|
$
|
(0.25
|
)
|
$
|
(3.30
|
)
|
||||
The number of shares reflect a 10-for-1 reverse stock split effected by the Company on October 29, 2013
Due to losses attributable to the Company’s common shareholders for each of the periods below, the following potentially dilutive shares are excluded from the diluted net loss per share calculation because they were anti-dilutive under the treasury stock method, in accordance with ASC Topic 260:
|
|
Three and Six months ended June 30
|
|||||||
|
|
2014
|
2013
|
||||||
|
Excluded Securities:
|
(shares)
|
(shares)
|
||||||
|
Convertible preferred stock issued and outstanding
|
32,155,022
|
13,868,172
|
||||||
|
Stock options issued and outstanding
|
4,338,461
|
721,261
|
||||||
|
Unvested stock options exercised
|
4,825,667
|
-
|
||||||
|
Warrants issued and outstanding
|
148,438
|
218,797
|
||||||
|
Total common stock equivalents excluded from diluted net loss per common share computation
|
41,467,588
|
14,808,230
|
||||||
The number of shares issued and outstanding reflect a 10-for-1 reverse stock split effected by the Company on October 29, 2013.
| 7. | Stockholders’ Equity |
Preferred Stock
Under the Company's certificate of incorporation, preferred stock is issuable in series, and the Company’s Board of Directors is authorized to determine the rights, preferences, and terms of each series.
In January 2013, the Company issued and sold 13,868,152 shares of new Series A (“Series A”) preferred stock in a private placement at a purchase price of $1.44 per share for $19.8 million, net of issuance costs. In connection with that sale, the Company issued 5,117,182 shares at par value $0.01 per share of Series A-1 (“Series A-1”) convertible preferred stock to the holders of shares of the Company’s preferred stock that was outstanding immediately prior to the sale (“Old Preferred Shares”) in consideration for such stockholders participating in the sale. In connection with the new Series A sale, Old Preferred Shares were converted into shares of common stock at a ratio of 1:1 if the holder of the Old Preferred Shares participated in the new Series A sale or at a 10:1 ratio if the holder of the Old Preferred Shares did not so participate. In addition, each such participating holder received a share of new Series A-1 preferred stock for every dollar of liquidation preference associated with an Old Preferred Share held by such holder. Each share of Series A-1 preferred stock has a liquidation preference of $10.00 and converts into common stock at a ratio of 1,000,000:1. These securities were sold in reliance on the exemption from the registration requirements of the Securities Act set forth in Section 4(2) of the Securities Act and Regulation D promulgated thereunder regarding sales by an issuer not involving a public offering.
In September 2013, the Company issued and sold 8,288,734 shares of new Series B (“Series B”) preferred stock in a private placement at a purchase price of $3.02 per share for approximately $24.9 million, net of issuance costs.
In May 2014, the Company issued and sold 4,880,954 shares of new Series C (“Series C”) preferred stock in a private placement at a purchase price of $14.36 per share for approximately $69.9 million, net of issuance costs. The purpose of this share issuance was to raise funds for the below tender offer and general operating needs.
On June 18, 2014, the Company issued a Tender Offer Statement to purchase up to 1,392,757 shares, in the aggregate, of its Series A Preferred Stock and Series B Preferred Stock, or such lesser number of shares as were properly tendered and not properly withdrawn, at a price equal to $14.36 per share, net to seller in cash. The offer, expired on July 16, 2014. Refer to Note 13, Subsequent Events, below for more details.
|
Convertible
Preferred Stock
|
Par
Value
|
Authorized, Issued and
Outstanding shares as of June 30, 2014
|
Liquidation Preference
($,000s)
|
|||||||||
|
New Series A
|
$
|
0.01
|
13,868,152
|
$
|
20,000
|
|||||||
|
Series A-1
|
0.01
|
5,117,182
|
51,172
|
|||||||||
|
New Series B
|
0.01
|
8,288,734
|
25,000
|
|||||||||
|
New Series C
|
0.01
|
4,880,954
|
70,075
|
|||||||||
|
|
32,155,022
|
$
|
166,247
|
|||||||||
The number of shares issued and outstanding reflect a 10-for-1 reverse stock split effected by the Company on October 29, 2013.
Dividends
Dividends on shares of the new Series A, new Series B and new Series C preferred stock are payable only when, as, and if declared by the Board of Directors. No dividends will be paid with respect to the common stock until any declared dividends on the new Series A preferred stock, new Series B preferred stock and new Series C preferred stock have been paid or set aside for payment to the new Series A preferred stockholders, new Series B preferred stockholders and new Series C preferred stockholders. After payment of any such dividends, any additional dividends or distributions will be distributed among all holders of common stock and preferred stock in proportion to the number of shares of common stock that would be held by each such holder if all shares of preferred stock were converted to common stock at the then effective conversion rate. To date, no dividends have been declared on any of the Company’s preferred stock or common stock, and there are no dividends in arrears at June 30, 2014.
Conversion
Under the terms of the Company’s amended and restated certificate of incorporation, the holders of preferred stock have the right to convert such preferred stock into common stock at any time. In addition, all preferred stock automatically converts into common stock (i) immediately prior to the closing of an IPO that values the Company at least at $750 million and that results in aggregate proceeds to the Company of at least $100 million or (ii) upon a written request from the holders of at least 60% of the voting power of the outstanding preferred stock (on an as-converted basis) including at least 14% of the voting power of the outstanding Series A-1 preferred stock. In addition, if a holder of the new Series A preferred stock has converted any of the new Series A preferred stock, then all of such holder’s shares of Series A-1 preferred stock also will be converted upon a liquidation event. In lieu of any fractional shares of common stock to which a holder would otherwise be entitled, the Company shall pay such holder cash in an amount equal to the fair market value of such fractional shares, as determined by the Board of Directors. At present, the new Series A preferred stock, new Series B preferred stock and the new Series C preferred stock converts into the Company common stock at a 1:1 ratio while the Series A-1 preferred stock converts into the Company common stock at a 1,000,000:1 ratio.
Liquidation Rights
Each holder of new Series A preferred stock, new Series B preferred stock and new Series C preferred stock is entitled to receive, on a pari passu basis, prior and in preference to any distribution of proceeds from a liquidation event to the holders of Series A-1 preferred stock or common stock, an amount per share for each share of new Series A preferred stock, new Series B preferred stock and new Series C preferred stock equal to the sum of the liquidation preference specified for such share and all declared but unpaid dividends, if any, on such share. After the payment or setting aside for payment to the holders of new Series A preferred stock, new Series B preferred stock and new Series C preferred stock, the holders of Series A-1 preferred stock are entitled to receive, prior and in preference to any distribution of proceeds to the holders of common stock an amount per share for each such share of Series A-1 preferred stock equal to the sum of the liquidation preference specified for such share and all declared but unpaid dividends, if any, on such share. After the payment or setting aside for payment to the holders of new Series A preferred stock, new Series B preferred stock, new Series C preferred stock and Series A-1 preferred stock, the entire remaining proceeds legally available for distribution will be distributed pro rata to the holders of new Series A preferred stock and common stock in proportion to the number of shares of common stock held by them assuming the new Series A preferred stock has been converted into shares of common stock at the then effective conversion rate, provided that the maximum aggregate amount per share of new Series A preferred stock which the holders of new Series A preferred stock shall be entitled to receive is three times the original issue price for the new Series A preferred stock. At present, the liquidation preferences are equal to $1.44215155 per share for the new Series A preferred stock, $10.00 per share for the Series A-1 preferred stock, $3.01613647 per share for the new Series B preferred stock and $14.356821052 per share for the new Series C preferred stock.
Voting
Each holder of shares of preferred stock is entitled to the number of votes equal to the number of shares of common stock into which such shares of preferred stock could be converted and has voting rights and powers equal to the voting rights and powers of the common stock. The holders of preferred stock and the holders of common stock vote together as a single class (except with respect to certain matters that require separate votes or as required by law), and are entitled to notice of any stockholders’ meeting in accordance with the bylaws of the Company.
Authorized and Outstanding Shares:
The Company, through its amended and restated certificate of incorporation, is the sole issuer of common stock and related options and warrants. On October 29, 2013, the Company amended and restated its certificate of incorporation to effect a 10-for-1 reverse stock split. On May 15, 2014, the Company amended and restated its certificate of incorporation to effect an increase in authorized shares of stock. The total number of shares of stock which the Company has the authority to issue is 80,083,905, consisting of 47,928,883 shares of common stock, $0.01 par value per share, and 32,155,022 shares of preferred stock, $0.01 par value per share, 13,868,152 of which are designated as new Series A preferred stock, 5,117,182 of which are designated as Series A-1 preferred stock and 8,288,734 of which are designated new Series B preferred stock and 4,880,954 of which are designated as Series C preferred stock. As of June 30, 2014, 14,236,119 shares of common stock were issued and outstanding. As of December 31, 2013, 13,720,214 shares of common stock were issued and outstanding. Each holder of common stock is entitled to one vote for each share of common stock held.
Common Stock Issued for Services
Nonemployees
The Company did not grant any immediately vested common shares to nonemployees for services during the six months ended June 30, 2014. During the year ended December 31, 2013, the Company granted an immediately vested option to purchase 47,601 common shares to a nonemployee for services.
Common Stock Issued upon Exercise of Stock Options
During the six months ended June 30, 2014 and the year ended December 31, 2013, the Company issued 509,062 and 7,327,959 shares of common stock, respectively, upon the exercise of options for cash proceeds of $0.31 million and $0.86 million, respectively, of which 418,875 and 6,499,463 were unvested, respectively. Certain options are eligible for exercise prior to vesting. These unvested options may be exercised for restricted shares of common stock that have the same vesting schedule as the options. The Company records a liability for the exercise of unvested shares, which is reclassified to common stock and additional paid-in capital as the shares vest. Should the holder’s employment be terminated, the unvested restricted shares are subject to repurchase by the Company at the purchase price paid for such shares. At June 30, 2014 and December 31, 2013, there were 4,825,667 and 5,594,134 shares respectively of restricted stock outstanding that remain unvested and subject to the Company’s right of repurchase.
For the six months ended June 30, 2014, the Company repurchased 101,980 shares of restricted stock for $0.01 million, upon termination of employment of various employees.
The number of shares reflects a 10-for-1 reverse stock split effected by the Company on October 29, 2013.
Common Stock Issued upon Exercise of Stock Warrants
For the six months ended June 30, 2014 the Company issued 70,372 shares of common stock, upon the exercise of warrants for $1.20.
The number of shares reflects a 10-for-1 reverse stock split effected by the Company on October 29, 2013.
| 8. | Stock Option Plan and Compensation |
Incentive stock options are granted to employees at an exercise price not less than 100% of the fair value of the Company’s common stock on the date of grant. Non-statutory stock options are granted to consultants, directors and employees who have more the $100,000 of incentive stock options that are first exercisable during the year in which the non-statutory stock options are granted. Non-statutory stock options are granted at an exercise price not less than 100% of the fair value of the Company’s common stock on the date of grant. If options are granted to stockholders who hold 10% or more of the Company’s common stock on the option grant date, then the exercise price shall not be less than 110% of the fair value of the Company’s common stock on the date of grant. The fair value is based on a good faith estimate by the Board of Directors’ compensation committee at the time of each grant. As there is no active trading market for these options, such estimate may ultimately differ from valuations completed by an independent party. The options generally vest over four years, which is the same as the performance period. In no event are options exercisable more than ten years after the date of grant.
In 2005, the Company’s stockholders approved the adoption of the 2005 Plan. On December 1, 2010, the Company’s stockholders approved the adoption of the Amended and Restated 2005 Stock Plan (as amended and restated, the “Plan”). Under the Plan, options to purchase up to 187,946 shares of common stock were reserved and may be granted to employees, directors, and consultants by the Board of Directors and stockholders to promote the success of the Company’s business. During 2011, the Board of Directors and stockholders of the Company increased the total number of options under the Plan by an additional 455,087 for a total of 1,353,966 available for grant. During 2012, the Board of Directors, either directly or through the compensation committee, and stockholders of the Company increased the total number of options under the Plan by an additional 170,000 for a total of 1,523,966, available for grant. During 2013, the Board of Directors, either directly or through the compensation committee, and stockholders of the Company increased the total number of options under the Plan by an additional 11,110,825 for a total of 12,634,791 available for grant. During the first six months of 2014, the Board of Directors, either directly or through the compensation committee, and stockholders of the Company increased the total number of options under the Plan by an additional 1,560,464 for a total of 14,195,255.
Option activity under the Plan is summarized as follows for the periods below:
|
|
Weighted-
|
|||||||
|
|
Options Issued
|
Average Exercise
|
||||||
|
|
and Outstanding
|
Price
|
||||||
|
|
||||||||
|
Balance as of January 1, 2014
|
938,585
|
$
|
1.39
|
|||||
|
Options granted (weighted average fair value of $0.30)
|
4,048,879
|
0.57
|
||||||
|
Options exercised - vested
|
(157,312
|
)
|
0.68
|
|||||
|
Options exercised - nonvested
|
(351,750
|
)
|
0.52
|
|||||
|
Options canceled
|
(139,941
|
)
|
2.36
|
|||||
|
Balance as of June 30, 2014
|
4,338,461
|
$
|
1.08
|
|||||
|
|
||||||||
|
Options outstanding and exercisable at June 30, 2014
|
1,447,292
|
$
|
0.80
|
|||||
The share amounts and share prices reflect a 10-for-1 reverse stock split effected by the Company on October 29, 2013.
Other Information Regarding Stock Options
Additional information regarding the Company’s common stock options outstanding as of June 30, 2014 is as follows:
|
Options Outstanding
|
Options Exercisable
|
|||||||||||||||||||||
|
Range of
Exercise
Prices
|
Number
Outstanding
|
Weighted –
Avg.
Remaining
Life
|
Weighted –
Avg.
Exercise
Price
|
Number
Vested
|
Weighted -
Avg.
Exercise
Price
|
|||||||||||||||||
|
$
|
0.10 - $0.10
|
201,088
|
9.12
|
$
|
0.10
|
45,234
|
$
|
0.10
|
||||||||||||||
|
0.57 - 0.57
|
3,545,879
|
9.64
|
0.57
|
883,385
|
0.57
|
|||||||||||||||||
|
1.20 - 1.20
|
139,204
|
7.21
|
1.20
|
118,866
|
1.20
|
|||||||||||||||||
|
1.70 - 1.70
|
124,450
|
7.88
|
1.70
|
73,135
|
1.70
|
|||||||||||||||||
|
2.00 - 2.00
|
299,990
|
6.06
|
2.00
|
298,822
|
2.00
|
|||||||||||||||||
|
5.00 - 5.00
|
7,000
|
2.25
|
5.00
|
7,000
|
5.00
|
|||||||||||||||||
|
5.60 - 5.60
|
18,250
|
5.21
|
5.60
|
18,250
|
5.60
|
|||||||||||||||||
|
19.40 - 19.40
|
2,600
|
4.53
|
19.40
|
2,600
|
19.40
|
|||||||||||||||||
|
$
|
0.10 - $19.40
|
4,338,461
|
9.21
|
$
|
0.74
|
1,447,292
|
$
|
0.80
|
||||||||||||||
The number of options reflects a 10-for-1 reverse stock split effected by the Company on October 29, 2013.
The number of options outstanding, vested and expected to vest as of June 30, 2014 was 3,813,281 and the weighted-average remaining contractual life was 9.21 years.
No compensation expense is recognized for unvested shares that are forfeited upon termination of service, and the stock-based compensation expense for the six months ended June 30, 2014 and 2013 reflect the expenses that the Company expects to recognize after the consideration of estimated forfeitures.
The Company estimates its forfeiture rate based on an analysis of its actual forfeitures and will continue to evaluate the adequacy of the forfeiture rate based on actual forfeiture experience, analysis of employee turnover behavior, and other factors. The impact from a forfeiture rate adjustment will be recognized in full in the period of adjustment, and if the actual number of future forfeitures differs from that estimate, the Company may be required to record adjustments to stock-based compensation expense in future periods.
The fair value of the Company’s stock option awards for the three and six months ended June 30, 2014 and 2013 was estimated at the date of grant using the Black-Scholes model with the following average assumptions:
|
|
Three Months ended
|
Six Months ended
|
|||||||||||||
|
|
June 30,
|
June 30,
|
|||||||||||||
|
|
2014
|
2013
|
2014
|
2013
|
|||||||||||
|
Volatility of common stock
|
73.31
|
%
|
** |
|
73.31
|
%
|
73.43
|
%
|
|||||||
|
Risk-free interest rate
|
1.92
|
%
|
** |
1.97
|
%
|
0.82
|
%
|
||||||||
|
Expected life*
|
6.1 years
|
** |
6.08 years
|
8.7 years
|
|||||||||||
|
Dividend yield
|
0
|
%
|
** |
0
|
%
|
0
|
%
|
||||||||
|
Weighted-average fair value of grants
|
$
|
0.07
|
** |
$
|
0.05
|
$
|
0.01
|
||||||||
*For nonemployee stock option awards, the expected life is the contractual term of the award, which is generally ten years.
** No stock options were granted during the three months ended June 30, 2013.
The Black-Scholes model requires the input of highly subjective assumptions, including the expected stock price volatility. Because the Company's equity awards have characteristics significantly different from those of traded options, the changes in the subjective input assumptions can materially affect the fair value estimate.
Total stock-based compensation expense reflected in the statements of operations for the six months ended June 30, 2014 and 2013 is $0.50 million and $0.08 million, respectively, and $0.24 million and $0.03 million for the three months ended June 30, 2014 and 2013. As of June 30, 2014, the unamortized stock-based compensation expense related to PMI employees’ unvested stock-based awards was approximately $1.0 million, which will be recognized over the remaining weighted-average vesting period of approximately 2.5 years.
| 9. | Income Taxes |
As part of the process of preparing the condensed consolidated financial statements, the Company is required to estimate its income taxes in each of the jurisdictions in which it operates. This process involves determining the income tax expense (benefit) together with calculating the deferred income tax expense (benefit) related to temporary differences resulting from differing treatment of items, such as fair value of loans or deductibility of certain intangible assets, for tax and accounting purposes. These differences result in deferred tax assets and liabilities, which are included within the accompanying condensed consolidated balance sheets. The Company must then assess the likelihood that the deferred tax assets will be recovered through the generation of future taxable income.
Due to the book and tax net losses incurred during the three and six months ended June 30, 2014 and 2013, zero income tax expense has been incurred during those periods. In addition, substantial historical losses have been incurred and the Company has maintained a full valuation allowance against its net deferred tax assets because the realization of those deferred tax assets is dependent upon future earnings, and the amount and timing of those earnings, if any is uncertain.
| 10. | Commitments and Contingencies |
Future Minimum Lease Payments
The corporate office and co-location facility are under non-cancelable operating leases that expire in December 2014 and August 2014, respectively.
Future minimum rental payments under these leases as of June 30, 2014 are as follows (in thousands):
|
2014
|
$
|
234
|
||
|
2015
|
|
187
|
||
|
2016
|
|
416
|
||
|
2017
|
|
425
|
||
|
2018
|
|
433
|
||
|
2019
|
|
442
|
||
|
2020
|
|
450
|
||
|
2021
|
|
225
|
||
|
Total future operating lease obligations
|
$
|
2,812
|
Rental expense under premises-operating lease arrangements was $0.2 million and $0.2 million for the three months ended June 30, 2014 and 2013, respectively. Rental expense under premises-operating lease arrangements was $0.3 million and $0.3 million for the six months ended June 30, 2014 and 2013, respectively.
The Company amended and restated an agreement with WebBank, an FDIC-insured Utah-chartered industrial bank, under which all Borrower Loans originated through the platform are made by WebBank under its bank charter. The arrangement allows for Borrower Loans to be offered to borrowers at uniform nationwide terms. The Company is required to pay the greater of a monthly minimum fee or a fee calculated based on a certain percentage of monthly Borrower Loan origination volume.
The Company has an agreement with a third party broker-dealer in which the third party agreed to operate and maintain the Note Trader Platform for the secondary trading of Notes. The Company is required to pay the third party broker-dealer an agreed upon monthly fee which equals the difference between the minimum monthly fee and the transaction fees collected by the third party provider during that month.
Securities Law Compliance
From inception through October 16, 2008, the Company sold approximately $178.0 million of Borrower Loans to investor members through the old platform structure, whereby the Company assigned promissory notes directly to investor members. The Company did not register the offer and sale of the promissory notes corresponding to these Borrower Loans under the Securities Act or under the registration or qualification provisions of any state securities laws. The Company believes that the question of whether or not the operation of the platform during this period constituted an offer or sale of “securities” involved a complicated factual and legal analysis and was uncertain. If the sales of promissory notes offered through the platform during this period were viewed as a securities offering, the Company would have failed to comply with the registration and qualification requirements of federal and state laws.
The Company’s decision to restructure the platform and cease sales of promissory notes offered through the platform effective October 16, 2008 limited this contingent liability to the period covering its activities prior to October 16, 2008.
On April 21, 2009, the Company and the North American Securities Administrators Association (“NASAA”) reached agreement on the terms of a model consent order between the Company and the states in which the Company offered promissory notes for sale prior to November 2008. The consent order involves payment by the Company of up to an aggregate of $1million in penalties, which have been allocated among the states based on the Company’s promissory note sale transaction volume in each state prior to November 2008. A state that enters into a consent order receives its portion of the $1 million in exchange for its agreement to terminate, or refrain from initiating, any investigation of the Company’s promissory note sale activities prior to November 2008. Penalties are paid promptly after a state enters into a consent order. NASAA has recommended that each state enter into a consent order. However, no state is obliged to do so, and there is no deadline by which a state must make its decision. The Company is not required to pay any portion of the penalty to those states that do not elect to enter into a consent order. If a state does not enter into a consent order, it is free to pursue its own remedies against the Company, subject to any applicable statute of limitations. As of June 30, 2014, the Company has entered into consent orders with 34 states and has paid an aggregate of $0.47 million in penalties to those states.
As of June 30, 2014 and December 31, 2013, the Company had accrued approximately $0.25 million and $0.25 million, respectively, in connection with the contingent liability associated with the states that have not entered into consent orders, in accordance with ASC Topic 450, Contingencies. The methodology applied to estimate the accrual was to divide the $1 million maximum fee pro-rata by state, using the Company’s promissory note sales from inception through November 2008. A weighting was then applied by state to each state that has not entered into a consent order, assigning a likelihood that the penalty will be claimed. In estimating the probability of a claim being made by a state, the Company considered factors such as the standard terms of the consent orders; whether the state ever gave any indication of concern regarding the sale of promissory notes through the platform; the probability of a state electing not to enter into a consent order in order to pursue its own litigation against the Company; whether the penalty is sufficient to compensate a state for the cost of processing the settlement consent order; and finally the impact that current economic conditions have had on state governments. The Company will continue to evaluate this accrual and related assumptions as new information becomes known.
In 2008, plaintiffs filed a class action lawsuit against the Company and certain of its executive officers and directors in the Superior Court of California, County of San Francisco, California. The suit was brought on behalf of all promissory note purchasers on the platform from January 1, 2006 through October 14, 2008. The lawsuit alleged that the Company offered and sold unqualified and unregistered securities in violation of the California and federal securities laws. On July 19, 2013 solely to avoid the costs, risks and uncertainties inherent in litigation, and without admitting any liability or wrongdoing, the parties to the class action litigation agreed to enter into a settlement to resolve all claims related thereto (the “Settlement”). In connection with the Settlement, the Company agreed to pay an aggregate amount of $10 million into a settlement fund, split into four annual installments of $2 million in 2014, $2 million in 2015, $3 million in 2016 and $3 million in 2017. The Settlement received final approval in a final order and judgment entered by the Superior Court on April 16, 2014. Pursuant to the final order and judgment, the claims in the class action were dismissed, and at the effective time of the Settlement (June 16, 2014), the defendants will have been released by the plaintiffs from all claims that were or could have been asserted concerning the issues alleged in the class action lawsuit. The reserve for the class action settlement liability is $8 million in the condensed consolidated balance sheet as of June 30, 2014.
On July 1, 2011, the Company and Greenwich entered into a Stipulated Order of Judgment pursuant to which the Company agreed to dismiss its remaining claims against Greenwich. On August 12, 2011, Greenwich filed a notice of appeal of the court's decision regarding Greenwich’s duty to defend up to $2 million.
| 11. | Related Parties |
Since the Company’s inception, it has engaged in various transactions with its directors, executive officers and holders of more than 5% of its voting securities, and immediate family members and other affiliates of its directors, executive officers and 5% stockholders.
Certain of the Company’s executive officers, directors who are not executive officers, and affiliates participate on the Company’s lending platform by placing bids and purchasing Notes and Borrower Loans. The aggregate amount of Notes and Borrower Loans purchased and the income earned by parties deemed to be affiliates and related parties of the Company as of June 30, 2014 and 2013 are summarized below (amounts in thousands):
|
Related Party
|
Aggregate Amount of Notes
and Borrower Loans
Purchased June 30, |
Income Earned on Notes
and Borrower Loans
six months ended June 30, |
||||||||||||||
|
2014
|
2013
|
2014
|
2013
|
|||||||||||||
|
Executive officers and management
|
$
|
1,853
|
$
|
722
|
$
|
154
|
$
|
142
|
||||||||
|
Directors
|
5,038
|
4,323
|
928
|
25
|
||||||||||||
|
|
$
|
6,891
|
$
|
5,045
|
$
|
1,082
|
$
|
167
|
||||||||
The Notes and Borrower Loans of parties deemed to be affiliates and related parties of the Company, were obtained on terms and conditions that were not more favorable than those obtained by other Note and Borrower Loan purchasers. Of the total aggregate amount of Notes and Borrower Loans purchased since inception approximately $0.40 million or 6% of principal and $0.31 million or 6% of principal has been charged off through June 30, 2014 and 2013, respectively. The Company has earned approximately $0.01 million in servicing fee revenue related to these Notes and Borrower Loans for the three months ended June 30, 2014 and 2013, respectively.
| 12. | Post-retirement Benefit Plans |
The Company has a 401(k) plan that covers all employees meeting certain eligibility requirements. The 401(k) plan is designed to provide tax-deferred retirement benefits in accordance with the provisions of Section 401(k) of the Internal Revenue Code. Eligible employees may defer up to 90% of eligible compensation up to the annual maximum as determined by the Internal Revenue Service. The Company’s contributions to the plan are discretionary. During the six months ended June 30, 2014, the Company has contributed $0.19 million to the plan.
| 13. | Subsequent Events |
On June 18, 2014, the Company issued a Tender Offer Statement to purchase 1,392,757 shares, in the aggregate, of its Series A Preferred Stock and Series B Preferred Stock, or such lesser number of Shares as were properly tendered and not properly withdrawn, at a price equal to $14.36 per share, to the seller in cash. Upon closure of the tender offer on July 16, 2014, 156,508 shares of Series A Preferred Stock and 1,133,558 share of Series B Preferred Stock were purchased for a total price of $18.5 million.
On August 1, 2014, the Company executed an office lease for 47,905 square feet of office space located in San Francisco, California. The lease term is eight years three months with an anticipated commencement date on or about December 1, 2014.
Prosper Funding LLC
(Unaudited)
(amounts in thousands)
|
|
June 30,
2014
|
December 31,
2013 *
|
||||||
|
Assets
|
||||||||
|
Cash and cash equivalents
|
$
|
2,014
|
$
|
5,789
|
||||
|
Restricted cash
|
14,270
|
12,299
|
||||||
|
Loans held for investment at fair value
|
9,543
|
3,917
|
||||||
|
Borrower loans receivable at fair value
|
246,861
|
226,238
|
||||||
|
Property and equipment, net
|
2,046
|
1,980
|
||||||
|
Other assets
|
19
|
14
|
||||||
|
Total Assets
|
$
|
274,753
|
$
|
250,237
|
||||
|
|
||||||||
|
Liabilities and Member’s Equity
|
||||||||
|
Accounts payable and accrued liabilities
|
$
|
3,756
|
$
|
3,712
|
||||
|
Notes at fair value
|
246,511
|
226,794
|
||||||
|
Repurchase and indemnification obligation
|
146
|
32
|
||||||
|
Related party payable
|
174
|
205
|
||||||
|
Total Liabilities
|
250,587
|
230,743
|
||||||
|
|
||||||||
|
Member's Equity
|
||||||||
|
Member's equity
|
16,076
|
16,076
|
||||||
|
Retained earnings
|
8,090
|
3,418
|
||||||
|
Total Member's Equity
|
24,166
|
19,494
|
||||||
|
Total Liabilities and Member's Equity
|
$
|
274,753
|
$
|
250,237
|
||||
The accompanying notes are an integral part of these condensed consolidated financial statements.
* Derived from the Company’s audited consolidated financial statements.
Prosper Funding LLC
(Unaudited)
(amounts in thousands)
|
|
Three months ended June 30,
|
Six months ended June 30,
|
||||||||||||||
|
|
2014
|
2013
|
2014
|
2013
|
||||||||||||
|
Administration Fee Revenue - related party
|
$
|
6,898
|
$
|
1,528
|
$
|
10,951
|
$
|
2,135
|
||||||||
|
Interest Income on Borrower Loans
|
10,517
|
8,563
|
20,567
|
13,636
|
||||||||||||
|
Interest Expense on Notes
|
(9,494
|
)
|
(8,127
|
)
|
(18,763
|
)
|
(12,946
|
)
|
||||||||
|
Other revenues (expenses)
|
(155
|
)
|
-
|
201
|
-
|
|||||||||||
|
Total Revenues
|
7,766
|
1,964
|
12,956
|
2,825
|
||||||||||||
|
|
||||||||||||||||
|
Cost of Revenues
|
||||||||||||||||
|
Cost of Services
|
(654
|
)
|
(338
|
)
|
(1,051
|
)
|
(563
|
)
|
||||||||
|
Provision for repurchase and indemnification obligation
|
(56
|
)
|
(50
|
)
|
(118
|
)
|
(149
|
)
|
||||||||
|
Net revenues
|
7,056
|
1,576
|
11,787
|
2,113
|
||||||||||||
|
|
||||||||||||||||
|
Operating Expenses
|
||||||||||||||||
|
Administration Fee Expense - related party
|
4,234
|
631
|
6,840
|
1,012
|
||||||||||||
|
Depreciation and Amortization
|
253
|
124
|
487
|
207
|
||||||||||||
|
Professional Services
|
-
|
5
|
12
|
20
|
||||||||||||
|
Other Operating Expenses
|
77
|
50
|
166
|
94
|
||||||||||||
|
Total Operating Expenses
|
4,564
|
810
|
7,505
|
1,333
|
||||||||||||
|
Income Before Other Income and Expenses
|
2,492
|
766
|
4,282
|
780
|
||||||||||||
|
|
||||||||||||||||
|
Other Income and Expenses
|
||||||||||||||||
|
Interest Income
|
1
|
-
|
1
|
-
|
||||||||||||
|
Change in FV on Borrower Loans, Loans Held for Investment and Notes, net
|
91
|
312
|
389
|
487
|
||||||||||||
|
Total Other Income and Expenses, net
|
92
|
312
|
390
|
487
|
||||||||||||
|
|
||||||||||||||||
|
Income Before Income Taxes
|
2,584
|
1,078
|
4,672
|
1,267
|
||||||||||||
|
Provision For Income Taxes
|
-
|
-
|
-
|
-
|
||||||||||||
|
Total Net Income
|
$
|
2,584
|
$
|
1,078
|
$
|
4,672
|
$
|
1,267
|
||||||||
The accompanying notes are an integral part of these condensed consolidated financial statements.
Prosper Funding LLC
(Unaudited)
(amounts in thousands)
|
|
Six Months
Ended
June 30,
2014
|
Six Months
Ended
June 30,
2013
|
||||||
|
|
||||||||
|
Cash flows from operating activities:
|
||||||||
|
Net income
|
$
|
4,672
|
$
|
1,267
|
||||
|
Adjustments to reconcile net income to net cash provided by operating activities:
|
||||||||
|
Change in fair value of borrower loans
|
958
|
4,082
|
||||||
|
Change in fair value of loans held for investment
|
3
|
3
|
||||||
|
Change in fair value of notes
|
(1,350
|
)
|
(4,573
|
)
|
||||
|
Depreciation and amortization
|
487
|
207
|
||||||
|
Provision for repurchase and indemnification obligation
|
114
|
124
|
||||||
|
Changes in operating assets and liabilities:
|
||||||||
|
Restricted cash
|
(1,971
|
)
|
25
|
|||||
|
Other assets
|
(5
|
)
|
- | |||||
|
Accounts payable and accrued liabilities
|
44
|
430
|
||||||
|
Related party payable
|
(31
|
)
|
(71
|
)
|
||||
|
Net cash provided by operating activities
|
2,921
|
1,494
|
||||||
|
|
||||||||
|
Cash flows from investing activities:
|
||||||||
|
Origination of borrower loans held at fair value
|
(330,464
|
)
|
(65,053
|
)
|
||||
|
Repayments of borrower loans held at fair value
|
65,648
|
44,190
|
||||||
|
Proceeds from sale of borrower loans held at fair value
|
243,235
|
- | ||||||
|
Purchases of property and equipment
|
(553
|
)
|
(509
|
)
|
||||
|
Repayment of loans held for investment at fair value
|
312
|
49
|
||||||
|
Origination of loans held for investment at fair value
|
(111,927
|
)
|
(29
|
)
|
||||
|
Proceeds from sale of loans held for investment at fair value
|
105,986
|
- | ||||||
|
Net cash used in investing activities
|
(27,763
|
)
|
(21,352
|
)
|
||||
|
|
||||||||
|
Cash flows from financing activities:
|
||||||||
|
Proceeds from issuance of notes held at fair value
|
86,713
|
65,053
|
||||||
|
Payment of notes held at fair value
|
(65,646
|
)
|
(43,565
|
)
|
||||
|
Net cash included in transfer of assets from PMI
|
–
|
1,875
|
||||||
|
Net cash provided by financing activities
|
21,067
|
23,363
|
||||||
|
|
||||||||
|
Net (decrease) increase in cash and cash equivalents
|
(3,775
|
)
|
3,505
|
|||||
|
Cash and cash equivalents at beginning of the period
|
5,789
|
5
|
||||||
|
Cash and cash equivalents at end of the period
|
$
|
2,014
|
$
|
3,510
|
||||
The accompanying notes are an integral part of these condensed consolidated financial statements.
Prosper Funding LLC
(Unaudited)
| 1. | Organization and Business |
Prosper Funding LLC (“Prosper Funding”) was formed in the state of Delaware in February 2012 as a limited liability company with the sole equity member being Prosper Marketplace, Inc. (“PMI”).
Prosper Funding was formed by PMI to hold Borrower Loans and issue Notes through the platform. Although Prosper Funding is consolidated with PMI for accounting and tax purposes, Prosper Funding has been organized and is operated in a manner that is intended to minimize the likelihood that it would be substantively consolidated with PMI in a bankruptcy proceeding. Prosper Funding’s intention is to minimize the likelihood that its assets would be subject to claims by PMI’s creditors if PMI were to file for bankruptcy, as well as to minimize the likelihood that Prosper Funding will become subject to bankruptcy proceedings directly. Prosper Funding seeks to achieve this by placing certain restrictions on its activities and implementing certain formal procedures designed to expressly reinforce its status as a distinct corporate entity from PMI.
On January 22, 2013, PMI entered into an Asset Transfer Agreement with Prosper Funding pursuant to which PMI transferred substantially all of its remaining assets to Prosper Funding, including (i) all outstanding Notes issued by PMI under the Indenture dated June 15, 2009 between PMI and Wells Fargo Bank, as trustee, (ii) all Borrower Loans held by PMI, (iii) all lender/borrower/group leader registration agreements related to such Notes or Borrower Loans, and (iv) all documents and information related to the foregoing, effective February 1, 2013.
Prosper Funding commenced operations as of February 1, 2013 when PMI transferred ownership of the platform, including all of the rights related to the operation of the platform, to Prosper Funding. Since February 1, 2013, all Notes issued and sold through the platform are issued, sold and serviced by Prosper Funding. Pursuant to a Loan Account Program Agreement between PMI and WebBank, PMI manages the operation of the platform, as agent of WebBank, in connection with the submission of loan applications by potential borrowers, the making of related loans by WebBank and the funding of such loans by WebBank. Pursuant to an Administration Agreement between Prosper Funding and PMI, PMI manages all other aspects of the platform on behalf of Prosper Funding.
A borrower member who wishes to obtain a loan through the platform must post a loan listing, or listing, on the platform. Prosper Funding allocates listings to one of two investor member funding channels: (i) the first channel allows investor members to commit to purchase Notes, the payments of which are dependent on the payments made on the corresponding Borrower Loan (the “Note Channel”); and (ii) the second channel allows investor members to commit to purchase 100% of a Borrower Loan directly from the Company (the “Whole Loan Channel”).
All loans requested and obtained through the platform are unsecured obligations of individual borrower members with a fixed interest rate and loan terms set at three or five years as of June 30, 2014. All loans made through the platform are funded by WebBank, an FDIC-insured, Utah chartered industrial bank. After funding a loan, WebBank sells the loan to Prosper Funding, without recourse to WebBank, in exchange for the principal amount of the loan. WebBank does not have any obligation to purchasers of the Notes.
Prosper Funding formed Prosper Asset Holdings LLC (“PAH”) in November 2013 as a limited liability company with the sole equity member being Prosper Funding. PAH was formed to purchase Borrower Loans from Prosper Funding and sell the Borrower Loans to third parties.
| 2. | Summary of Significant Accounting Policies |
Basis of Presentation
Prosper Funding’s unaudited interim condensed consolidated financial statements have been prepared in accordance with U.S. generally accepted accounting principles (“US GAAP”) and disclosure requirements for interim financial information and the requirements of Rule 8-03 of Regulation S-X. Accordingly, they do not include all of the information and footnotes required by US GAAP for complete financial statements. The unaudited interim condensed consolidated financial statements should be read in conjunction with the audited financial statements and notes thereto for the year ended December 31, 2013. The balance sheet at December 31, 2013 has been derived from the audited financial statements at that date. Management believes these unaudited interim condensed consolidated financial statements reflect all adjustments, including those of a normal recurring nature, which are necessary for a fair presentation of the results for the interim periods presented. The results of operations for the interim periods are not necessarily indicative of the results that may be expected for the full year of any other interim period.
The accompanying interim condensed consolidated financial statements include the accounts of Prosper Funding and its wholly-owned subsidiary PAH. All intercompany balances and transactions between Prosper Funding and PAH have been eliminated in consolidation.
Use of Estimates
The preparation of Prosper Funding’s interim condensed consolidated financial statements in conformity with accounting principles generally accepted in the United States requires management to make certain estimates, judgments and assumptions that affect the reported amounts of assets and liabilities and the related disclosures at the date of the condensed consolidated financial statements and the reported amounts of revenues and expenses during the reporting periods. These estimates, judgments and assumptions include but are not limited to the following: valuation of Borrower Loans and associated Notes, valuation of servicing rights, repurchase and indemnification obligation, valuation allowance on deferred tax assets, and contingent liabilities. Prosper Funding bases its estimates on historical experience from all Borrower Loans, and on various other assumptions that it believes to be reasonable under the circumstances. Actual results could differ from those estimates.
Certain Risks and Concentrations
In the normal course of its business, Prosper Funding encounters two significant types of risk: credit and regulatory. Financial instruments that potentially subject Prosper Funding to significant concentrations of credit risk consist primarily of cash, cash equivalents, and restricted cash. Prosper Funding places cash, cash equivalents, and restricted cash with high-quality financial institutions and is exposed to credit risk in the event of default by these institutions to the extent the amount recorded on the balance sheet exceeds federally insured amounts. Prosper Funding performs periodic evaluations of the relative credit standing of these financial institutions and has not sustained any credit losses from instruments held at these financial institutions.
To the extent that Borrower Loan payments are not made, servicing income will be reduced. A series of Notes corresponding to a particular Borrower Loan is wholly dependent on the repayment of such Borrower Loan. As a result, Prosper Funding does not bear the risk on such Borrower Loan.
Prosper Funding is subject to various regulatory requirements. The failure to appropriately identify and address these regulatory requirements could result in certain discretionary actions by regulators that could have a material effect on Prosper Funding's consolidated financial position and results of operations.
Cash and Cash Equivalents
Cash equivalents are recorded at cost, which approximates fair value. Such deposits periodically exceed amounts insured by the FDIC.
Restricted Cash
Restricted cash consists primarily of cash deposits held as collateral as required for loan funding and servicing activities.
Borrower Loans and Notes
Prosper Funding has adopted the provisions of ASC Topic 825, Financial Instrument. ASC Topic 825 permits companies to choose to measure certain financial instruments and certain other items at fair value on an instrument-by-instrument basis with unrealized gains and losses on items for which the fair value option has been elected reported in earnings. The fair value election, with respect to an item, may not be revoked once an election is made. In applying the provisions of ASC Topic 825, Prosper Funding records assets and liabilities measured using the fair value option in a way that separates these reported fair values from the carrying values of similar assets and liabilities measured with a different measurement attribute. Prosper Funding does not record a specific allowance account related to the Borrower Loans and Notes funded through the Note Channel in which it has elected the fair value option, but rather estimates the fair value of such Borrower Loans and Notes using discounted cash flow methodologies adjusted for Prosper Funding’s historical payment, loss and recovery rates. An account is considered to be a loss, or charged-off, when it reaches more than 120 days past due. Prosper Funding has reported the aggregate fair value of the Borrower Loans and Notes funded through the Note Channel as separate line items in the assets and liabilities sections of the accompanying balance sheets using the methods described in ASC Topic 820, Fair Value Measurements and Disclosures—See Fair Value Measurement.
Borrower Loans Sold Directly to Third Party Purchasers
For Borrower Loans sold to unrelated third party purchasers on a servicing retained basis through the Whole Loan Channel, a gain or loss is recorded on the sale date. In order to calculate the gain or loss, Prosper Funding first determines whether the terms of the servicing arrangement with the purchaser results in a net servicing asset (i.e., when contractual/expected servicing revenues adequately compensate Prosper Funding) or a net servicing liability (i.e., when contractual/expected servicing revenues do not adequately compensate Prosper Funding). When contractual/expected servicing revenues do not adequately compensate Prosper Funding, a portion of the gross proceeds of the Borrower Loans sold on a servicing retained basis are allocated to the recording of a net servicing liability. Conversely, when contractual/expected servicing revenues provide more than adequate compensation to Prosper Funding, the excess servicing compensation is allocated to the gross proceeds of the Borrower Loans sold and results in the recording of a net servicing asset. Prosper Funding estimates the fair value of the loan servicing asset or liability considering the contractual servicing fee revenue, adequate compensation for Prosper Funding's servicing obligation, the current principal balances of the Borrower Loans sold through the Whole Loan Channel and projected servicing revenues given projected defaults and prepayments (if significant) over the remaining lives of such Borrower Loans. Prosper Funding recorded a gain on sale of whole loans of $(0.2) million and $0 for the three months ended June 30, 2014 and 2013, respectively, which was included in other revenues on the condensed consolidated statements of operations. Prosper Funding recorded a gain/(loss) on sale of whole loans of $0.2 million and $0 for the six months ended June 30, 2014 and 2013, respectively, which was included in Other revenues on the condensed consolidated statements of operations. At June 30, 2014 and December 31, 2013, Prosper Funding recorded $0.7 million and $0.1 million as a servicing asset related to these Borrower Loans, which is included in Borrower loans receivable at fair value on the condensed consolidated balance sheets.
Loans Held for Investment
Loans held for investment are primarily comprised of Borrower Loans held for short durations and are recorded at cost which approximates fair value. For Borrower Loans held long term, the fair value is estimated using discounted cash flow methodologies based upon a set of valuation assumptions similar to those of other Borrower Loans, which are set forth in Note 2— Fair Value Measurement.
Fair Value Measurement
Prosper Funding follows ASC Topic 820, Fair Value Measurements and Disclosures, which provides guidance regarding a fair value hierarchy, which prioritizes information used to measure fair value and the effect of fair value measurements on earnings and provides for enhanced disclosures determined by the level within the hierarchy of information used in the valuation. ASC Topic 820 applies whenever other standards require (or permit) assets or liabilities to be measured at fair value but does not expand the use of fair value in any new circumstances.
ASC Topic 820 defines fair value in terms of the price that would be received upon the sale of an asset or paid to transfer a liability in an orderly transaction between market participants at the measurement date.
The price used to measure the fair value is not adjusted for transaction costs while the cost basis of certain financial instruments may include initial transaction costs. Under ASC Topic 820, the fair value measurement also assumes that the transaction to sell an asset occurs in the principal market for the asset or, in the absence of a principal market, the most advantageous market for the asset. The principal market is the market in which the reporting entity would sell or transfer the asset with the greatest volume and level of activity for the asset. In determining the principal market for an asset or liability under ASC Topic 820, it is assumed that the reporting entity has access to the market as of the measurement date. If no market for the asset exists or if the reporting entity does not have access to the principal market, the reporting entity should use a hypothetical market.
Under ASC Topic 820, assets and liabilities carried at fair value in the balance sheets are classified among three levels based on the observability of the inputs used to determine fair value:
Level 1 — The valuation is based on quoted prices in active markets for identical instruments.
Level 2 — The valuation is based on observable inputs such as quoted prices for similar instruments in active markets, quoted prices for identical or similar instruments in markets that are not active, and model-based valuation techniques for which all significant assumptions are observable in the market.
Level 3 — The valuation is based on unobservable inputs that are supported by little or no market activity and that are significant to the fair value of the instrument. Level 3 valuations are typically performed using pricing models, discounted cash flow methodologies, or similar techniques, which incorporate management’s own estimates of assumptions that market participants would use in pricing the instrument or valuations that require significant management judgment or estimation.
Fair value of financial instruments are determined based on the fair value hierarchy established in ASC Topic 820, which requires an entity to maximize the use of quoted prices and observable inputs and to minimize the use of unobservable inputs when measuring fair value. Various valuation techniques are utilized, depending on the nature of the financial instrument, including the use of market prices for identical or similar instruments, or discounted cash flow models. When possible, active and observable market data for identical or similar financial instruments are utilized. Alternatively, fair value is determined using assumptions that management believes a market participant would use in pricing the asset or liability.
Financial instruments consist principally of Cash and cash equivalents, Restricted cash, Borrower loans receivable, Loans held for investment, Accounts payable and accrued liabilities, and Notes. The estimated fair values of cash and cash equivalents, restricted cash, accounts payable and accrued liabilities approximate their carrying values because of their short term nature.
The following tables present the assets and liabilities measured at fair value on a recurring basis at June 30, 2014 and December 31, 2013 (in thousands):
|
June 30, 2014
|
Level 1
|
Level 2
|
Level 3
|
Fair
Value
|
||||||||||||
|
Assets
|
||||||||||||||||
|
Borrower loans receivable
|
$
|
-
|
$
|
-
|
$
|
246,861
|
$
|
246,861
|
||||||||
|
Certificates of deposit & restricted cash
|
12,998
|
1,272
|
-
|
14,270
|
||||||||||||
|
Loans held for investment
|
-
|
-
|
9,543
|
9,543
|
||||||||||||
|
Liabilities
|
||||||||||||||||
|
Notes
|
$
|
-
|
$
|
-
|
$
|
246,511
|
$
|
246,511
|
||||||||
|
December 31, 2013
|
Level 1
|
Level 2
|
Level 3
|
Fair
Value
|
||||||||||||
|
Assets
|
||||||||||||||||
|
Borrower loans receivable
|
$
|
-
|
$
|
-
|
$
|
226,238
|
$
|
226,238
|
||||||||
|
Certificates of deposit & restricted cash
|
11,028
|
1,271
|
-
|
12,299
|
||||||||||||
|
Loans held for investment
|
-
|
-
|
3,917
|
3,917
|
||||||||||||
|
Liabilities
|
||||||||||||||||
|
Notes
|
$
|
-
|
$
|
-
|
$
|
226,794
|
$
|
226,794
|
||||||||
Internal Use Software and Website Development
Prosper Funding accounts for internal use software costs, including website development costs, in accordance with ASC Topic 350-40, Internal Use Software and ASC Topic 350-50, Website Development Costs. In accordance with ASC Topic 350-40 and 350-50, the costs to develop software for the website and other internal uses are capitalized when management has authorized and committed project funding, preliminary development efforts are successfully completed, and it is probable that the project will be completed and the software will be used as intended. Capitalized software development costs primarily include software licenses acquired, fees paid to outside consultants, and salaries and payroll related costs for employees directly involved in the development efforts.
Costs incurred prior to meeting these criteria, together with costs incurred for training and maintenance, are expensed. Costs incurred for upgrades and enhancements that are considered to be probable to result in additional functionality are capitalized. Capitalized costs are included in property and equipment and amortized to expense using the straight-line method over their expected lives. Prosper Funding evaluates its software assets for impairment whenever events or changes in circumstances indicate that the carrying amount of such assets may not be recoverable. Recoverability of software assets to be held and used is measured by a comparison of the carrying amount of the asset to the future net undiscounted cash flows expected to be generated by the asset. If such software assets are considered to be impaired, the impairment to be recognized is the excess of the carrying amount over the fair value of the software asset.
Repurchase and Indemnification Obligation
Under the terms of the Notes, the Lender Registration Agreements between Prosper Funding and investor members who participate in the Note Channel, and the loan purchase agreements between Prosper Funding and investor members that participate in the Whole Loan Channel, Prosper Funding may, in certain circumstances, become obligated to repurchase a Note or Borrower Loan from a investor member or indemnify a investor member against loss on a Note. Generally, these circumstances include the occurrence of verifiable identity theft, the failure to properly follow loan listing or bidding protocols, or a violation of the applicable federal, state, or local lending laws. The indemnification and repurchase obligation is estimated based on historical experience. Prosper Funding accrues a provision for the repurchase and indemnification obligation when the Notes or Borrower Loans are issued. Indemnified or repurchased Notes and repurchased Borrower Loans associated with violations of federal, state, or local lending laws or verifiable identity theft are written off at the time of repurchase or at the time an indemnification payment is made.
Revenue Recognition
Revenue is recognized in accordance with ASC Topic 605, Revenue Recognition. Under ASC Topic 605, revenue is recognized when persuasive evidence of an arrangement exists, services have been rendered, the price of the services is fixed and determinable, and collectability is reasonably assured.
Administration Agreement License Fees
Prosper Funding primarily generates revenues through license fees it earns through an Administration Agreement with PMI. The Administration Agreement contains a license granted by Prosper Funding to PMI that entitles PMI to use the platform for and in relation to: (i) PMI’s performance of its duties and obligations under the Administration Agreement relating to corporate administration, loan platform services, loan and note servicing and marketing, and (ii) PMI’s performance of its duties and obligations to WebBank in relation to loan origination and funding. The license fees are based on the number of listings that are posted to the platform.
Interest Income on Borrower Loans Receivable and Interest Expense on Notes
Prosper Funding recognizes interest income on Borrower Loans funded through the Note Channel and interest expense on the corresponding Notes using the accrual method based on the stated interest rate to the extent Prosper Funding believes it to be collectable. Below is a table which summarizes the gross interest income and expense for the three months ended June 30, 2014 and 2013 (in thousands).
|
|
Three months ended June 30,
|
Six months ended June 30,
|
||||||||||||||
|
|
2014
|
2013
|
2014
|
2013
|
||||||||||||
|
|
||||||||||||||||
|
Interest income on borrower loans
|
$
|
10,517
|
$
|
8,563
|
$
|
20,567
|
$
|
13,636
|
||||||||
|
Interest expense on motes
|
(9,494
|
)
|
(8,127
|
)
|
(18,763
|
)
|
(12,946
|
)
|
||||||||
|
Net interest income
|
$
|
1,023
|
$
|
436
|
$
|
1,804
|
$
|
690
|
||||||||
Comprehensive Income
There is no comprehensive income (loss) other than the net income (loss) disclosed in the condensed consolidated statements of operations.
Recent Accounting Pronouncements
In May 2014, as part of its ongoing efforts to assist in the convergence of U.S. GAAP and International Financial Reporting Standards (“IFRS”), FASB issued ASU 2014-09, “Revenue from Contracts with Customers.” The new guidance sets forth a new five-step revenue recognition model which replaces the prior revenue recognition guidance in its entirety and is intended to eliminate numerous industry-specific pieces of revenue recognition guidance that have historically existed in U.S. GAAP. The underlying principle of the new standard is that a business or other organization will recognize revenue to depict the transfer of promised goods or services to customers in an amount that reflects what it expects in exchange for the goods or services. The standard also requires more detailed disclosures and provides additional guidance for transactions that were not addressed completely in the prior accounting guidance. The standard will be effective for the Company in the first quarter of fiscal 2017. Early adoption is not permitted. The Company is currently assessing the potential impact on its financial statements from adopting this new guidance.
| 3. | Borrower Loans and Notes Held at Fair Value |
As observable market prices are not available for the Borrower Loans and Notes funded through the Note Channel that Prosper Funding holds, or for similar assets and liabilities, Prosper Funding believes such Borrower Loans and Notes should be considered Level 3 financial instruments under ASC Topic 820. In a hypothetical transaction as of the measurement date, Prosper Funding believes that differences in the principal marketplace in which such Borrower Loans are originated and the principal marketplace in which it might offer such Borrower Loans for sale may result in differences between the originated amount of the Borrower Loans and their fair value as of the transaction date. For Borrower Loans funded through the Note Channel, the fair value is estimated using discounted cash flow methodologies based upon valuation assumptions including prepayment speeds, roll rates, recovery rates and discount rates based on the perceived credit risk within each credit grade.
The obligation to pay principal and interest on any series of Notes is equal to the loan payments, if any, that are received on the corresponding Borrower Loan, net of its servicing fee. The fair value election for Notes and Borrower Loans funded through the Note Channel allows both the assets and the related liabilities to receive similar accounting treatment for expected losses, which is consistent with the subsequent cash flows to investor members that are dependent upon borrower payments. As such, the fair value of the Notes is approximately equal to the fair value of the Borrower Loans funded through the Note Channel, adjusted for the servicing fee and the timing of borrower payments subsequently disbursed to Note holders. Any unrealized gains or losses on such Borrower Loans and Notes for which the fair value option has been elected is recorded as a separate line item in the statement of operations. The effective interest rate associated with a series of Notes is less than the interest rate earned on the corresponding Borrower Loan due to the servicing fee. See further discussion in this note for a roll-forward and further discussion of the significant assumptions used to value Borrower Loans and Notes funded through the Note Channel.
The fair value of the Borrower Loans and Notes funded through the Note Channel is estimated using discounted cash flow methodologies based upon a set of valuation assumptions. The main assumptions used to value such Borrower Loans and Notes include prepayment rates derived from historical prepayment rates for each credit grade, default rates derived from historical performance, recovery rates and discount rates applied to each credit grade based on the perceived credit risk of each credit grade. The obligation to pay principal and interest on any series of Notes is equal to the loan payments, if any, received on the corresponding Borrower Loan, net of the servicing fee. As such, the fair value of the Notes is approximately equal to the fair value of the Borrower Loans funded through the Note Channel, adjusted for the servicing fee and the timing of borrower payments subsequently disbursed to the Note holders. The effective interest rate associated with a series of Notes will be less than the interest rate earned on the corresponding Borrower Loan due to the 1.0% servicing fee.
Key economic assumptions and the sensitivity of the current fair value to immediate adverse changes in those assumptions at June 30, 2014 for Borrower Loans and Notes funded through the Note Channel are presented in the following table (in thousands):
|
|
Borrower Loans
|
Notes
|
||||||
|
Discount rate assumption:
|
9.43
|
%*
|
9.43
|
%*
|
||||
|
Resulting fair value from:
|
||||||||
|
100 basis point increase
|
$
|
239,501
|
$
|
236,585
|
||||
|
200 basis point increase
|
236,564
|
233,668
|
||||||
|
Resulting fair value from:
|
||||||||
|
100 basis point decrease
|
$
|
245,558
|
$
|
242,591
|
||||
|
200 basis point decrease
|
248,688
|
245,689
|
||||||
|
|
||||||||
|
Default rate assumption:
|
7.00
|
%*
|
7.00
|
%*
|
||||
|
Resulting fair value from:
|
||||||||
|
10% higher default rates
|
$
|
239,687
|
$
|
236,768
|
||||
|
20% higher default rates
|
236,761
|
233,869
|
||||||
|
Resulting fair value from:
|
||||||||
|
10% lower default rates
|
$
|
245,132
|
$
|
242,152
|
||||
|
20% lower default rates
|
247,726
|
244,721
|
||||||
* Represents weighted average assumptions considering all credit grades.
The changes in Level 3 assets measured at fair value on a recurring basis are as follows (in thousands):
|
Fair Value Measurements Using Significant Unobservable Inputs (Level 3)
|
||||||||||||||||
|
|
Borrower Loans
|
Notes
|
Loans
Held for
Investment
|
Total
|
||||||||||||
|
Balance at January 1, 2013
|
$
|
-
|
$
|
-
|
$
|
-
|
$
|
-
|
||||||||
|
Assets transferred on February 1, 2013
|
170,344
|
(170,574
|
)
|
175
|
(55
|
)
|
||||||||||
|
Originations
|
65,053
|
(65,053
|
)
|
29
|
29
|
|||||||||||
|
Principal repayments and credit losses
|
(44,190
|
)
|
43,565
|
(49
|
)
|
(674
|
)
|
|||||||||
|
Change in fair value on borrower loans and notes
|
(4,082
|
)
|
4,573
|
-
|
491
|
|||||||||||
|
Change in fair value of loans held for investment
|
-
|
-
|
(3
|
)
|
(3
|
)
|
||||||||||
|
Balance at June 30, 2013
|
$
|
187,125
|
$
|
(187,489
|
)
|
$
|
152
|
$
|
(212
|
)
|
||||||
|
Fair Value Measurements Using Significant Unobservable Inputs (Level 3)
|
||||||||||||||||
|
|
Borrower Loans
|
Notes
|
Loans
Held for
Investment
|
Total
|
||||||||||||
|
Balance at January 1, 2014
|
$
|
226,238
|
$
|
(226,794
|
)
|
$
|
3,917
|
$
|
3,361
|
|||||||
|
Originations
|
330,464
|
(86,713
|
)
|
111,927
|
355,678
|
|||||||||||
|
Principal repayments and credit losses
|
(65,648
|
)
|
65,646
|
(312
|
)
|
(314
|
)
|
|||||||||
|
Borrower loans sold to third parties
|
(243,235
|
)
|
-
|
(105,986
|
)
|
(349,221
|
) | |||||||||
|
Change in fair value on borrower loans and notes
|
(958
|
)
|
1,350
|
-
|
392
|
|||||||||||
|
Change in fair value of loans held for investment
|
-
|
-
|
(3
|
)
|
(3
|
)
|
||||||||||
|
Balance at June 30, 2014
|
$
|
246,861
|
$
|
(246,511
|
)
|
$
|
9,543
|
$
|
9,893
|
|||||||
The changes in fair value would directly impact the change in fair value on Borrower Loans, Loans held for investment, and Notes in the condensed consolidated statements of operations.
Due to the recent origination of the Borrower Loans and Notes funded through the Note Channel, the change in fair value attributable to instrument-specific credit risk is immaterial. Of all Borrower Loans originated from July 13, 2009 to June 30, 2014, 254 Borrower Loans were 90 days or more delinquent, which related to an aggregate principal amount of $1.6 million and a fair value of $0.16 million as of June 30, 2014.
| 4. | Loans Held for Investment |
Loans held for investment on the condensed consolidated balance sheets as of June 30, 2014 and December 31, 2013, was $9.5 million and $3.9 million, respectively. For the six months ended June 30, 2014 and 2013, a total of $111.9 million and $0.03 million of Borrower Loans originated through the platform as Loans held for investment. For the six months ended June 30, 2014 and 2013, $106.0 million and $0 of these Borrower Loans were sold to an unrelated third party through the Whole Loan Channel. When a Borrower Loan has been funded by Prosper Funding in whole, or in part, the portion of the borrower’s monthly loan payment that corresponds to the percentage of the Borrower Loan that is funded is retained. In these cases, interest income is recorded on these Borrower Loans.
The changes in Loans held for investment measured at fair value on a recurring basis are as follows (in thousands):
| Fair Value Measurements Using Significant Unobservable Inputs (Level 3) | ||||
|
Loans Held
for
Investment
|
||||
|
Balance at January 1, 2013
|
$
|
-
|
||
|
Assets transferred on February 1, 2013
|
175
|
|||
|
Originations
|
29
|
|||
|
Principal repayments and credit losses
|
(49
|
)
|
||
|
Change in fair value of loans held for investment
|
(3
|
)
|
||
|
Balance at June 30, 2013
|
$
|
152
|
||
|
Balance at January 1, 2014
|
$
|
3,917
|
||
|
Originations
|
111,927
|
|||
|
Principal repayments and credit losses
|
(312
|
)
|
||
|
Borrower loans sold to third parties
|
(105,986
|
)
|
||
|
Change in fair value of loans held for investment
|
(3
|
)
|
||
|
Balance at June 30, 2014
|
$
|
9,543
|
| 5. | Repurchase and Indemnification Obligation |
For the three months ended June 30, 2014 and 2013, the provision for repurchase and indemnification obligation was $0.06 million and $0.05 million, respectively. For the six months ended June 30, 2014 and 2013, the provision for repurchase and indemnification obligation was $0.1 million and $0.1 million, respectively. The balance of the repurchase and indemnification obligation as of June 30, 2014 and December 31, 2013, was $0.1 million and $0.03 million, respectively.
| 6. | Income Taxes |
Prosper Funding incurred no income tax provision for the three months ended June 30, 2014 and 2013. Prosper Funding is a US disregarded entity and the income and loss is included in the return of its parent, PMI. Since PMI is in a loss position, not currently subject to income taxes, and has fully reserved its deferred tax asset, the net effective tax rate for Prosper Funding is 0%.
| 7. | Subsequent Events |
Prosper Funding has evaluated subsequent events for disclosure and recognition and noted no matters that require disclosure herein.
MANAGEMENT’S DISCUSSION AND ANALYSIS OF
FINANCIAL CONDITION AND RESULTS OF OPERATION
This management’s discussion and analysis of consolidated financial condition and results of operations, or MD&A, contains forward-looking statements that involve risks and uncertainties. Please see “Forward-Looking Statements” in this Quarterly Report on Form 10-Q for a discussion of the uncertainties, risks and assumptions associated with these statements. This discussion should be read in conjunction with the Company’s historical condensed consolidated financial statements and related notes thereto, Prosper Funding’s condensed financial statements and related notes thereto and the other disclosures contained elsewhere in this Quarterly Report on Form 10-Q. The results of operations for the periods reflected herein are not necessarily indicative of results that may be expected for future periods, and the Company’s consolidated actual results may differ materially from those discussed in the forward-looking statements as a result of various factors, including but not limited to those included elsewhere in this Quarterly Report on Form 10-Q and those included in the “Risk Factors” section and elsewhere in the Registrants’ Annual Report on Form 10-K.
PROSPER MARKETPLACE, INC.
Overview
Prosper Marketplace, Inc. (“PMI”) developed and began operating a peer-to-peer online credit platform (the “platform”) in 2006. Beginning in July 2009 this platform permitted borrower members to apply for Borrower Loans and investor members to purchase Notes issued by PMI, the proceeds of which facilitated the funding of Borrower Loans. In February 2012, PMI formed Prosper Funding LLC (“Prosper Funding” and, collectively with PMI, the “Company” or the “Registrants”) to hold Borrower Loans and issue Notes. Prosper Funding has been organized to operate in a manner that is intended to minimize the likelihood that Prosper Funding would be substantively consolidated with PMI in a bankruptcy proceeding. PMI is the sole equity member of Prosper Funding. Prosper Funding commenced operations on February 1, 2013.
On February 1, 2013, PMI transferred ownership of the platform, including all of the rights related to the operation of the platform, to Prosper Funding. Beginning February 1, 2013, all Notes issued and sold through the platform are issued, sold and serviced by Prosper Funding. At that same time, Prosper Funding assumed all of PMI’s obligations with respect to all then-outstanding Notes. Pursuant to an Administration Agreement between PMI and Prosper Funding, PMI manages all aspects of the platform on behalf of Prosper Funding. Pursuant to a Loan Account Program Agreement between PMI and WebBank, PMI manages the operation of the platform, as agent of WebBank, in connection with the submission of loan applications by potential borrowers, the making of related Borrower Loans by WebBank and the funding of such Borrower Loans by WebBank.
Prosper Funding formed Prosper Asset Holdings LLC (“PAH”) in November 2013 as a limited liability company with the sole equity member being Prosper Funding. PAH was formed to purchase Borrower Loans from Prosper Funding and sell the purchased Borrower Loans to third parties.
The platform enables borrower members to request and obtain Borrower Loans by posting listings on the platform indicating the principal amount of the desired loan. The Company assigns a Prosper Rating consisting of letter grades, based in part on the borrower’s credit score, to each member who requests a Borrower Loan. Borrower members’ Prosper Rating, credit score range, debt-to-income ratios and other credit data are displayed with their listings once the member meets the minimum eligibility criteria and are available for viewing by investor members on an anonymous basis.
Listings are allocated to one of two investor member funding channels: (i) the first channel allows investor members to commit to purchase Notes from the Company, the payments of which are dependent on the payments made on the corresponding Borrower Loan (the “Note Channel”); and (ii) the second channel allows investor members to commit to purchase 100% of a Borrower Loan directly from the Company (the “Whole Loan Channel”). Each time the Company posts a group of listings on the platform, it determines the relative proportions of such listings that will be allocated to the Note Channel and the Whole Loan Channel, respectively, based on the Company’s estimate of the relative overall purchase demand in each channel. The Company then uses a random allocation methodology to allocate individual listings between the two channels based on those proportions. The Company currently posts listings on the platform twice per day on weekdays and once per day on weekends, although the frequency with which the Company posts listings may change in the future. If a listing is not funded through the Whole Loan Channel within the first hour after its posting, the listing will be removed from the Whole Loan Channel and posted to the Note Channel for the remainder of its listing period. Such listing will include a designation indicating that the listing came from the Whole Loan Channel. The Whole Loan Channel was launched in April 2013 and is only available to certain institutional investor investor members approved by the Company that meet the definition of an accredited investor under Regulation D under the Securities Act of 1933, as amended. The Whole Loan Channel is an important and growing part of the Company’s business. Investor members who participate in the Whole Loan Channel are required to enter into loan purchase and loan servicing agreements with the Company that specify the parties’ rights and obligations with regard to the sale of Borrower Loans through the Whole Loan Channel and which name the Company as the servicer of such Borrower Loans.
All Borrower Loans are made by WebBank, an FDIC-insured, Utah-chartered industrial bank, and sold to the Company. WebBank sells the loan to the Company, without recourse to WebBank, in exchange for the principal amount of the Borrower Loan. WebBank does not have any obligation to the purchasers of the Notes or Borrower Loans. The Company verifies the identity of 100% of borrowers using a variety of methods including credit bureau data, other electronic data sources and offline documentary procedures. The Company verifies income and/or employment on a subset of borrowers based on a proprietary algorithm. The intention of the algorithm is to verify income or employment in cases where the self-reported income of the borrower is highly determinative of the borrower’s risk rating.
The Company derives operating revenue from fees paid by WebBank. Upon funding a Borrower Loan, WebBank charges the borrower an origination fee equal to a specified percentage of the principal amount of such Borrower Loan. WebBank, in turn, pays the Company amounts equal to the origination fees as compensation for the Company’s loan origination activities on WebBank’s behalf.
Operating History
The platform was launched on February 13, 2006 and enables borrower members to request and obtain personal, unsecured loans between $2,000 and $35,000 by posting anonymous “listings” indicating the principal amount of the desired loan. Borrower Loan terms are subject to minimum and maximum loan amounts determined by the borrower’s Prosper Rating which is created using proprietary models that include numerous factors, at interest rates set by the Company. Interest rates are set for Borrower Loans based on the borrower member’s Prosper Rating, as well as additional factors, such as estimated loss rate, loan terms, general economic environment, previous Borrower Loans obtained through the platform and competitive conditions. As of June 30, 2014, the platform had facilitated 146,509 Borrower Loans since its launch totaling an aggregate principal amount of approximately $1.4 billion. The platform has a limited operating history and the Company has incurred net losses since its inception. The Company’s net loss was $0.003 million and $15.7 million for the three months ended June 30, 2014 and 2013, respectively. The Company’s net loss was $2.2 million and $19.9 million for the six months ended June 30, 2014 and 2013, respectively.
The Company funds its operations primarily with proceeds from equity financings, which are described below under “Liquidity and Capital Resources.” The operating plan calls for a continuation of the current strategy of increasing borrower and lender member transaction volume and improving the efficiency of the platform to increase revenue until profitability is reached.
Trends and Uncertainties
The peer-to-peer lending industry remains a very innovative and unique industry, and the application of federal and state laws in areas such as securities and consumer finance to the industry is still evolving. The Company will continue to monitor this evolution actively in order to identify and respond quickly to any legislative or regulatory developments that may affect the platform.
During the first half of 2014, the platform’s origination volume increased consistently in terms of both units and total dollar amounts. The Company hopes to continue this trend of growth as the platform’s borrower and investor member bases continue to strengthen and become more familiar with the platform. Over time, the Company expects the platform’s investor member base to grow as the platform gains more exposure to potential investor members and the Notes and Borrower Loans are established as viable investment alternatives.
Critical Accounting Policies and Estimates
Management’s discussion and analysis of the consolidated financial condition and results of operations is based on the condensed consolidated financial statements, which the Company has prepared in accordance with U.S. generally accepted accounting principles. The preparation of condensed consolidated financial statements requires management to make estimates, judgments and assumptions that affect the reported amounts of assets and liabilities, revenues and expenses and the related disclosures. Estimates are based on historical experience and on various other assumptions that the Company believes to be reasonable under the circumstances. Actual results could differ from those estimates. Significant accounting policies which include revenue recognition, stock-based compensation, repurchase and indemnification obligation, and income taxes are more fully described in Note 2 to Prosper Marketplace, Inc.’s condensed consolidated financial statements included elsewhere in this Quarterly Report.
Critical accounting policies are those policies that the Company believes present the most complex or subjective measurements and have the most potential to impact its financial position and operating results. While all decisions regarding accounting policies are important, the Company believes that the following policies could be considered critical.
Fair Value Measurement
The Company determines the fair values of its financial instruments based on the fair value hierarchy established in Accounting Standards Codification (“ASC”) Topic 820, Fair Value Measurements and Disclosures, which requires an entity to maximize the use of quoted prices and observable inputs and to minimize the use of unobservable inputs when measuring fair value. The Company uses various valuation techniques depending on the nature of the financial instrument, including the use of market prices for identical or similar instruments, or discounted cash flow models. When possible, active and observable market data for identical or similar financial instruments are utilized. Alternatively, the Company determines fair value using assumptions that it believes a market participant would use in pricing the asset or liability.
The estimated fair values of cash and cash equivalents, restricted cash, accounts payable and accrued liabilities approximate their carrying values because of their short-term nature. Loans held for investment, Borrower Loans, and Notes are accounted for on a fair value basis. For additional information and discussion regarding significant accounting policies surrounding fair value measurement, see Note 2, Note 3 and Note 4 to Prosper Marketplace, Inc.’s condensed consolidated financial statements included elsewhere in this Quarterly Report.
Borrower Loans and Notes
Overall, if the fair value of the Borrower Loans held by the Company that were funded through the Note Channel decrease or increase due to any changes in the Company’s assumptions, there will also be a corresponding decrease or increase in the fair value of the linked Notes. As a result, the effect on the Company’s earnings of adverse changes in key assumptions would be mitigated.
As the Company receives scheduled payments of principal and interest on the Borrower Loans it holds that were funded through the Note Channel, the Company in turn makes principal and interest payments on the corresponding Notes. These principal payments reduce the carrying value of those Borrower Loans and Notes. If the Company does not receive payments on any such Borrower Loan, the Company is not obligated to and does not make payments on the corresponding Notes. The aggregate fair value of a series of Notes corresponding to a particular Borrower Loan is approximately equal to the fair value of that Borrower Loan, less the servicing fee. If the fair value of the Borrower Loan decreases due to changes in the Company’s expectations regarding the likelihood of default or the amount of loss in the event of default, there will also be a corresponding decrease in the aggregate fair value of the related Notes (an unrealized aggregate gain related to the Notes and an unrealized loss related to the Borrower Loan).
Results of Operations
Revenues
Origination Fees
WebBank charges borrowers an origination fee equal to a specified percentage of the aggregate principal balance of each Borrower Loan based on Prosper Rating and loan term. WebBank, in turn, pays the Company amounts equal to those fees as compensation for its marketing and underwriting activities.
In May 2013, the origination fee schedule was updated as follows:
|
|
|
May 2013 - February 2014
|
||
|
Prosper Rating
|
|
3 Year Loan
|
|
5 Year Loan
|
|
AA
|
|
1.00% - 1.95%
|
|
1.95% - 4.95%
|
|
A
|
|
3.95%
|
|
4.95%
|
|
B - HR
|
|
4.95%
|
|
4.95%
|
In February 2014, the origination fee schedule was updated as follows:
|
|
|
February 2014 - June 2014
|
||
|
Prosper Rating
|
|
3 Year Loan
|
|
5 Year Loan
|
|
AA
|
|
1.00% - 2.00%
|
|
3.00%
|
|
A
|
|
4.00%
|
|
5.00%
|
|
B - HR
|
|
5.00%
|
|
5.00%
|
Origination fees for the three months ended June 30, 2014 and 2013 were $16.4 million and $3.3 million respectively, representing an increase of $13.1 million or 396%, which was primarily due to higher origination volume through the platform during 2014. Origination fees for the six months ended June 30, 2014 and 2013 were $25.1 million and $4.9 million respectively, representing an increase of $20.2 million or 412%, which was primarily due to higher origination volume through the platform during 2014.
Origination Volume
From inception through June 30, 2014, a total of 146,509 Borrower Loans, totaling $1.4 billion were originated through the platform.
A total of 28,826 Borrower Loans totaling $369.9 million were originated through the platform during the three months ended June 30, 2014, compared to 7,099 Borrower Loans totaling $72.8 million originated during the three months ended June 30, 2013. This represented a “unit”, or loan, increase of 306% and a dollar increase of 408%.
The graph below shows aggregate dollar Borrower Loan originations through the platform dating back to July 2009:
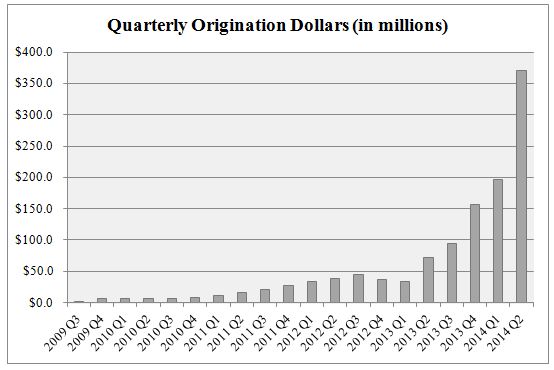
In January 2013, the Company undertook an equity financing that recapitalized the Company and brought in a new senior management team. In February 2013, the Company implemented a new public offering of Notes and PMI Management Rights designed to provide the platform’s investor members with protection in the event of the Company’s bankruptcy. In addition, commencing in the second quarter of 2013, the Company introduced the Whole Loan Channel and also increased marketing campaigns to attract new borrowers. Investor members, liquidity and Borrower Loan originations have all increased as a result of these changes. The decrease in Borrower Loan originations that occurred between Q4 2012 and Q1 2013 was due to lack of liquidity.
Interest Income on Borrower Loans and Interest Expense on Notes
The Company recognizes interest income on Borrower Loans funded through the Note Channel using the accrual method based on the stated interest rate to the extent the Company believes it to be collectable. The Company records interest expense on the corresponding Notes based on the contractual interest rates to the extent the Company believes they will be collectable.
The following table summarizes interest income on such Borrower Loans and interest expense on Notes for the three and six months ended June 30, 2014 and 2013 (in thousands):
|
|
Three months ended June 30,
|
Six months ended June 30,
|
||||||||||||||
|
|
2014
|
2013
|
2014
|
2013
|
||||||||||||
|
|
||||||||||||||||
|
Interest income on borrower loans
|
$
|
10,701
|
$
|
8,563
|
$
|
20,810
|
$
|
16,292
|
||||||||
|
Interest expense on notes
|
(9,494
|
)
|
(8,127
|
)
|
(18,763
|
)
|
(15,453
|
)
|
||||||||
|
Net interest income
|
$
|
1,207
|
$
|
436
|
$
|
2,047
|
$
|
839
|
||||||||
Overall, the increase in net interest income for the periods above was driven by the rise in the number of Borrower Loans originated through the platform and serviced by the Company.
Rebates and Promotions
Rebates and promotions are accounted for in accordance with ASC Topic 605, Revenue Recognition. From time to time, the Company offers rebates and promotions to its borrower and investor members. The Company records rebates and promotions as an offset to revenue if they are earned directly upon the origination of the Borrower Loan. The Company’s rebates and promotions are generally in the form of cash back and other incentives paid to lender and borrower members.
For the three months ended June 30, 2014 and 2013, the Company incurred expenses related to rebates and promotions extended to borrower and investor members of $0.6 million and $0.4 million, respectively, which represented an increase of $0.2 million or 50%. For the six months ended June 30, 2014 and 2013, the Company incurred expenses related to rebates and promotions extended to borrowers and lenders of $1.0 million and $0.7 million, respectively, which represented an increase of $0.3 million or 43%. The increase in rebates and promotions is related to increased volume within pre-existing programs.
Other Revenues
Other revenues consists primarily of credit referral fees, where partner companies pay the Company an agreed upon amount for referrals of customers from the website, and gains on whole loan sales. Other revenues were $0.3 million for the three months ended June 30, 2014 and 2013, respectively. Other revenues were $1.0 million and $0.4 million for the six months ended June 30, 2014 and 2013, respectively, which represented an increase of $0.6 million or 150%. The increase in other revenues was due to the gain on whole loan sales and the addition of new credit referral partners, as well as increased traffic to existing partners.
Cost of Revenues
Cost of Services
Cost of services consists primarily of credit bureau fees, payments which are due to strategic partners, collection expenses, and other expenses directly related to Borrower Loan funding and servicing. Cost of services expenses were $0.8 million and $0.5 million for the three months ended June 30, 2014 and 2013, respectively, representing an increase of $0.3 million or 60%. Cost of services expenses were $1.3 million and $1.0 million for the six months ended June 30, 2014 and 2013, respectively, representing an increase of $0.3 million or 30%. The primary driver for the increase was higher listing volume and an increase in strategic partnership fees under the Company’s contracts with WebBank.
Repurchase and Indemnification Obligation
Under the terms of the Notes, the Lender Registration Agreements between the Company and investor members who participate in the Note Channel, and the loan purchase agreements between the Company and investor members that participate in the Whole Loan Channel, the Company may, in certain circumstances, become obligated to repurchase a Note or Borrower Loan from a investor member or indemnify a investor member against loss on a Note. Generally, these circumstances include the occurrence of verifiable identity theft, the failure to properly follow loan listing or bidding protocols, or a violation of the applicable federal/state/local lending laws. These repurchase and indemnification obligations are evaluated at least once a quarter and represent an estimate based on the rate of historical loan losses as a percentage of originations (which generally occur within six to nine months of origination). The provision for the repurchase and indemnification obligations may include a judgmental management adjustment due to the Company’s limited operating history, changes in current economic conditions, the risk of new and as of yet undetected fraud schemes, changes in origination unit and dollar volumes and the lack of industry comparables. Based on the analysis of the historical provision, the provision for repurchase and indemnification obligation was $0.05 million for the three months ended June 30, 2014 and 2013, respectively. The repurchase and indemnification obligation was $0.1 million and $0.2 million for the six months ended June 30, 2014 and 2013, respectively. The provision for repurchase and indemnification obligation was $0.1 million and $0.03 million as of June 30, 2014 and December 31, 2013, respectively.
Other Income and Expenses
Change in Fair Value of Borrower Loans, Loans Held for Investment and Notes, net
The fair value of Borrower Loans and Notes are estimated using discounted cash flow methodologies based upon a set of valuation assumptions. The main assumptions used to value such Borrower Loans and Notes include prepayment rates derived from historical prepayment rates for each credit grade, default rates derived from historical performance, recovery rates and discount rates applied to each credit grade based on the perceived credit risk of each credit grade. Loans held for investment are primarily comprised of Borrower Loans held for short durations and are recorded at cost which approximates fair value. For Borrower Loans held long term, the fair value is estimated using discounted cash flow methodologies based upon a set of valuation assumptions similar to those of other Borrower Loans.
The following table summarizes the fair value adjustments for the three and six months ended June 30, 2014 and 2013, respectively (in thousands):
|
|
Three months ended June 30,
|
Six months ended June 30,
|
||||||||||||||
|
|
2014
|
2013
|
2014
|
2013
|
||||||||||||
|
Borrower loans
|
$
|
(1,290
|
)
|
$
|
(4,543
|
)
|
$
|
(958
|
)
|
$
|
(4,083
|
)
|
||||
|
Loans held for investment
|
(1
|
)
|
(5
|
)
|
(3
|
) |
(3
|
) | ||||||||
|
Notes
|
1,382
|
4,860
|
1,350
|
4,573
|
||||||||||||
|
Total
|
$
|
91
|
$
|
312
|
$
|
389
|
$
|
487
|
||||||||
The total fair value adjustment for the three months ended June 30, 2014 and 2013 was a net unrealized gain of $0.09 million and $0.31 million, respectively. The total fair value adjustment for the six months ended June 30, 2014 and 2013 was a net unrealized gain of $0.39 million and $0.49 million, respectively. These amounts are included as a component of other income and expenses in the Company’s condensed consolidated statements of operations.
Operating Expenses
Compensation and Benefits
All employees of the Company are employed by PMI. Compensation and benefits expenses were $5.3 million and $3.3 million for the three months ended June 30, 2014 and 2013, respectively, an increase of $2.0 million or 60%. Compensation and benefits expenses were $9.2 million and $5.8 million for the six months ended June 30, 2014 and 2013, respectively, and increase of $3.4 million or 58%. This increase is largely due to the Company’s steadily increasing its employee headcount, which in turn resulted in increased payroll costs such as salary and wages, payroll taxes, and healthcare. The Company increased its headcount across its marketing and operations teams during this period in response to increased volume demands. The Company intends to continue to increase headcount as the platform’s lender and borrower member bases grow and the Company carries out its business plan; however, the Company expects its ongoing investment in the platform and website to improve operating expense efficiency going forward. In addition, spending increased related to the use of contract labor, bonus expense, variable pay expense and overtime during 2014 over the corresponding period in 2013.
As of June 30, 2014, the Company had 148 full-time employees compared to 75 full-time employees as of June 30, 2013.
|
|
June 30, 2014
|
June 30, 2013
|
||||||
|
Sales, marketing and operations
|
83
|
39
|
||||||
|
Engineering
|
45
|
23
|
||||||
|
Administration
|
20
|
13
|
||||||
|
Total headcount
|
148
|
75
|
||||||
Marketing and Advertising
Marketing and advertising costs consist primarily of affiliate marketing, search engine marketing, online and offline campaigns, email marketing, public relations, gift/promotional expenses, and direct mail marketing. Marketing and advertising costs were $9.0 million and $3.9 million for the three months ended June 30, 2014 and 2013, respectively, an increase of $5.1 million or 131%. Marketing and advertising costs were $15.0 million and $5.5 million for the six months ended June 30, 2014 and 2013, respectively, and increase of $9.5 million or 173%. The increase in marketing and advertising costs was largely due to increased costs related to the continuing growth in originations on the platform.
Depreciation and Amortization
Depreciation and amortization expense was $0.4 million and $0.2 million for the three months ended June 30, 2014 and 2013, respectively, representing an increase of $0.2 million or 100%. Depreciation and amortization expense was $0.7 million and $0.4 million for the six months ended June 30, 2014 and 2013, respectively, and increase of $0.3 million or 75%. The increase in overall depreciation and amortization expense was primarily due to the capitalization of various internally developed software projects placed in service in 2014, which in turn increased depreciation expense taken on those assets during the three and six month periods ended June 30, 2014.
Professional Services
Professional service expenses are comprised of legal expenses, audit and accounting fees, consulting services and other outside costs. Professional service expenses were $0.4 million and $0.7 million for the three months ended June 30, 2014 and 2013, respectively, a decrease of $0.3 million or 43%. Professional services expenses were $0.5 million and $1.4 million for the six months ended June 30, 2014 and 2013, respectively, a decrease of $0.9 million or 64%. This decrease was primarily due to a large decrease in legal fees related to the settlement of the class action lawsuit and legal fees related to the formation of Prosper Funding and registration of the Company’s offering. The Company also saw a decrease in accounting, tax and consulting fees partially offset by an increase in other outside costs.
Facilities and Maintenance
Facilities and maintenance expenses consist primarily of rent paid for the Company’s corporate office lease and data co-location facility, network and power usage costs, software licenses and subscriptions, and hardware and software maintenance and support. Facilities and maintenance expenses were $0.6 million and $0.5 million for the three months ended June 30, 2014 and 2013, respectively, an increase of $0.1 million or 20%. Facilities and maintenance expenses were $1.1 million and $0.8 million for the six months ended June 30, 2014 and 2013, respectively, an increase of $0.3 million or 38%. This increase was primarily due to increases in software licenses and subscriptions, and an increase in rent.
Other
Other expenses consist of bank service charges, travel and entertainment expenses, insurance expenses, taxes, licenses, communications costs, recruiting costs and other miscellaneous expenses. Other expenses were $0.9 million and $0.5 million for the three months ended June 30, 2014 and 2013, respectively, an increase of $0.4 million or 80%. Other expenses were $1.5 million and $0.8 million for the six months ended June 30, 2014 and 2013, respectively, an increase of $0.7 million or 88%. This increase was attributable to an increase in bank service charges, recruiting, and insurance due to the increase in business volume as well as increased business travel.
Liquidity and Capital Resources
The following table summarizes the cash flow for the six months ended June 30, 2014 and 2013, respectively (in thousands):
|
|
For the six
months
ended
June 30,
|
For the six
months
ended
June 30,
|
||||||
|
|
2014
|
2013
|
||||||
|
Net Loss
|
$
|
(2,169
|
)
|
$
|
(19,852
|
)
|
||
|
|
||||||||
|
Net cash used in operating activities
|
(3,971
|
)
|
(11,974
|
)
|
||||
|
Net cash used in investing activities
|
(28,971
|
)
|
(24,410
|
)
|
||||
|
Net cash provided by financing activities
|
91,405
|
44,599
|
||||||
|
|
||||||||
|
Net increase in cash and cash equivalents
|
58,463
|
8,215
|
||||||
|
Cash and cash equivalents at the beginning of the period
|
18,339
|
2,300
|
||||||
|
Cash and cash equivalents at the end of the period
|
$
|
76,802
|
$
|
10,515
|
||||
The Company has incurred operating losses since its inception. The negative cash flows from operations were $4.0 million and $12.0 million for the six months ended June 30, 2014 and 2013, respectively. As reflected in the accompanying condensed consolidated financial statements, the accumulated deficit is $106.2 million as of June 30, 2014.
At June 30, 2014, the Company had approximately $76.8 million in available cash and cash equivalents. Since its inception, the Company has financed its operations primarily through equity financing from various sources. The Company believes that its current cash position, including the additional $51.4 million ($69.9 million raised net of $18.5 million spent on share repurchases) through a new equity financing, is sufficient to meet its current liquidity needs.
Net cash used in operating activities was $4.0 million and $12.0 million for the six months ended June 30, 2014 and 2013, respectively. The decrease in cash used in operating activities was primarily attributable to the decrease in net loss due to increased origination fees and interest income compared to the prior period.
Net cash used in investing activities was $29.0 million and $24.4 million for the six months ended June 30, 2014 and 2013, respectively. The primary driver for the change was an increase in Borrower Loan purchases, offset by increased proceeds from the sale of such Borrower Loans. Net cash used in investing activities for the six months ended June 30, 2014, included $330.5 million in purchases of Borrower Loans, $112.0 million in purchases of Loans held for investment, $1.8 million of purchases of property and equipment, offset by $243.2 million in proceeds from sale of Borrower Loans, $65.6 million in repayment of Borrower Loans, $0.3 million in repayment of Loans held for investment, and $106.0 million in proceeds from sale of Loans held for investment.
Net cash provided by financing activities was $91.4 million and $45.0 million for the six months ended June 30, 2014 and 2013, respectively. The primary driver for the increase compared to the prior period was the issuance of convertible preferred stock during the three months ended June 30, 2014, which provided net cash of $69.9 million. Net cash provided from financing activities for the three months ended June 30, 2014 consisted of $86.7 million in proceeds from issuance of Notes, $70.1 million in proceeds from issuance of convertible preferred stock, $0.3 million in proceeds from early exercise of stock options, $0.09 million in proceeds from exercise of warrants, and $0.03 million in proceeds from exercise of vested stock options, offset by $65.6 million in repayment of Notes, $0.1 million in preferred stock issuance costs, and $0.01 million in repurchase of restricted stock.
Income Taxes
The Company incurred no income tax provision for the three and six months ended June 30, 2014 and 2013. Given the Company’s history of operating losses and inability to achieve profitable operations, it is difficult to accurately forecast how future results will be affected by the realization and use of net operating loss carry forwards.
Off-Balance Sheet Arrangements
In February 2012, PMI formed Prosper Funding. PMI is the sole equity member of Prosper Funding and Prosper Funding’s accounts are included in PMI’s consolidated financial statements included in this Quarterly Report. Prosper Funding has been organized and is operated in a manner that is intended to minimize the likelihood that it will (i) become subject to bankruptcy proceedings or (ii) be substantively consolidated with PMI, and thus have its assets subject to claims by PMI’s creditors, in the event PMI becomes subject to a bankruptcy proceeding. PMI restructured the platform so that Borrower Loans are held by Prosper Funding and Prosper Funding issues and sells the Notes.
Additional Information about the Platform
Comparing Estimated Loss Rates to Actual Losses
The Company reviews the performance of Borrower Loans on a monthly basis to determine how loss rate estimates compare to actual performance. As part of this monthly review, the processes for calculating and assigning loss rates are reassessed to ensure continued accuracy. The graphs below show the estimated versus actual cumulative dollar loss rates by Prosper Rating for Borrower Loans, collectively, booked from July 13, 2009 through December 31, 2013. Performance is as of June 30, 2014. The loss performance is tracked by vintage, meaning each line represents all loans originated in a given period. The graphs only include Borrower Loans that have been outstanding at least 6 months. In addition, data for a point along the x axis is only included if the entire vintage is at least that mature. So although loans originated in April 2013 (part of the 2013 Q2 vintage) have 14 months of performance, only 12 months of performance are reflected in the graphs below because the June 2013 loans, which are also a part of the 2013 Q2 vintage, have only completed 12 months of performance.
Vintages generally contain enough loan volume for their performance curves to be meaningful. For presentation purposes, some of the older vintages have been grouped by origination periods spanning more than 3 months.
The graph below shows cumulative net charge-offs as a percentage of originations across all Prosper Ratings by vintage for Borrower Loans originated from July 13, 2009 through December 31, 2013.
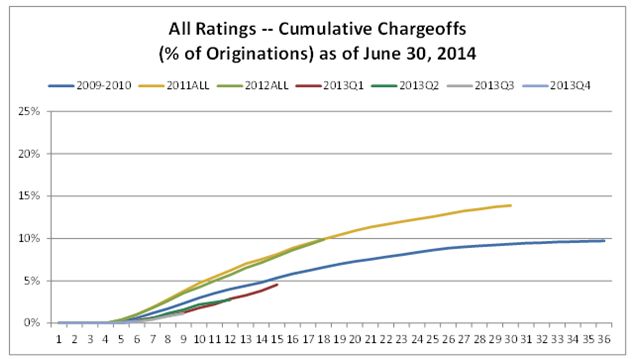
Overall, vintages originated in 2013 are demonstrating lower cumulative losses than those originated in 2011 and 2012. Changes in the risk management process at the end of 2012 and early 2013 are anticipated to be a meaningful driver of this trend.
The graphs below show cumulative net charge-offs for Borrower Loans, collectively, as a percentage of originations for each Prosper Rating presented by vintage from July 13, 2009. Performance is as of June 30, 2014.
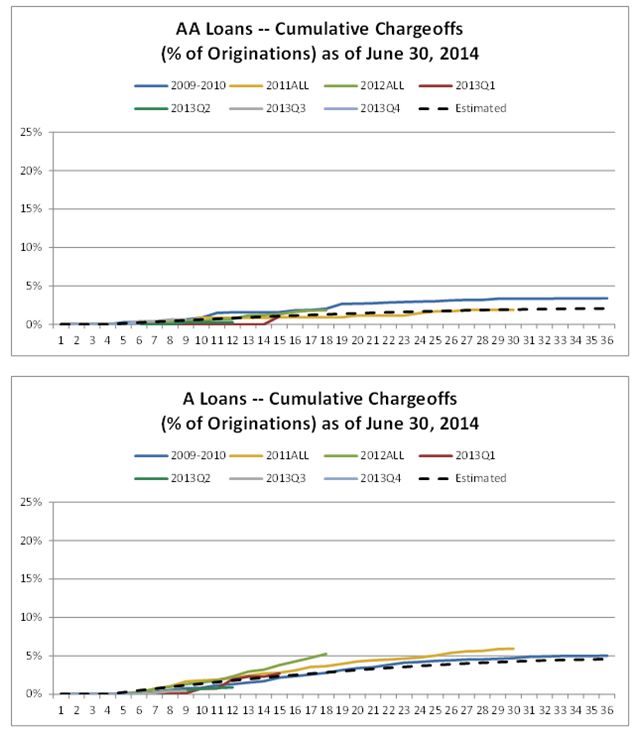
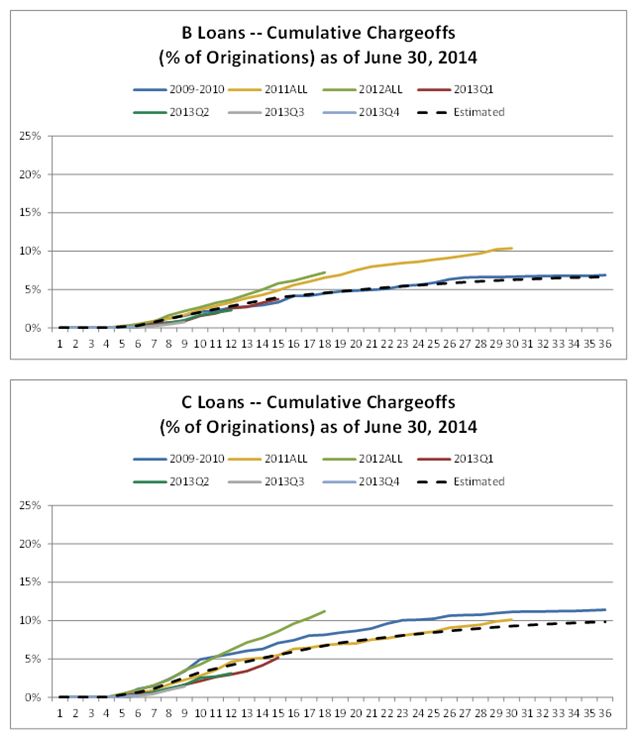
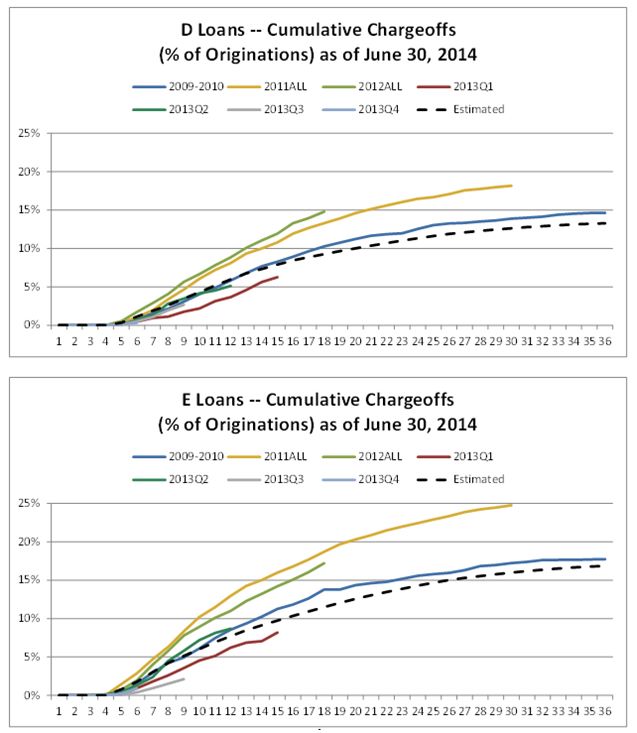
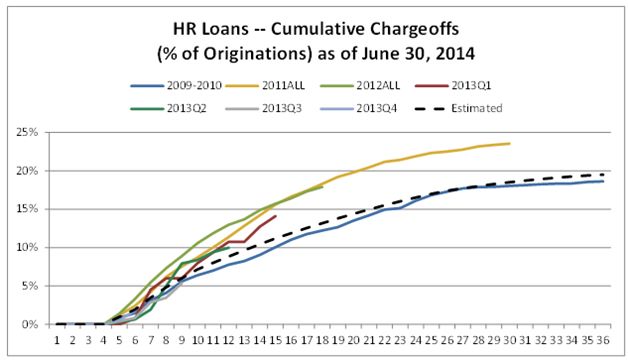
Note: Expectation lines represent the high end of the estimated loss rate range for each Prosper Rating, except for HR, where the high end of the range is 100% and the expectation curve was set at 19.50% cumulative principal loss.
In many rating grades, risk is trending above expectations in 2011 and 2012. To date, the majority of the 2013 vintage rating groups have cumulative losses below their respective expectation lines. These changes are believed to be a direct result of changes made to the risk management practice at the end of 2012 and beginning of 2013.
Please note that the historical performance of PMI Borrower Loans may not be indicative of the future performance of Prosper Funding’s borrower loans. See “Item 1A. Risk Factors—Risks Related to Prosper Funding and PMI, the Platform and Prosper Funding and PMI’s Ability to Service the Notes” in the Registrants’ Annual Report on Form 10-K filed with the SEC on March 31, 2014 for more information.
Loan Originations
The following table presents aggregated information about borrowers for Borrower Loans originated over the period from July 13, 2009 to June 30, 2014, grouped by Prosper Rating (the “Amount” and “Average Loan Size” columns are in thousands).
|
Prosper
Rating
|
Number
|
Amount
|
Average
Loan Size
|
Weighted-
Average
Lender
Yield
|
Weighted-
Average
Borrower
Rate
|
Weighted-
Average
Borrower
APR
|
|||||||||||||||||||
|
AA
|
8,314
|
$
|
101,141
|
$
|
12.2
|
6.77
|
%
|
7.77
|
%
|
8.99
|
%
|
||||||||||||||
|
A
|
22,374
|
271,312
|
12.1
|
10.13
|
%
|
11.13
|
%
|
13.76
|
%
|
||||||||||||||||
|
B
|
23,343
|
296,541
|
12.7
|
13.69
|
%
|
14.69
|
%
|
17.58
|
%
|
||||||||||||||||
|
C
|
26,420
|
295,811
|
11.2
|
17.57
|
%
|
18.57
|
%
|
21.57
|
%
|
||||||||||||||||
|
D
|
17,708
|
138,551
|
7.8
|
22.66
|
%
|
23.66
|
%
|
26.90
|
%
|
||||||||||||||||
|
E
|
12,141
|
59,098
|
4.9
|
27.48
|
%
|
28.48
|
%
|
32.09
|
%
|
||||||||||||||||
|
HR
|
7,196
|
24,970
|
3.5
|
30.64
|
%
|
31.64
|
%
|
35.49
|
%
|
||||||||||||||||
|
Total
|
117,496
|
$
|
1,187,425
|
$
|
10.1
|
15.34
|
%
|
16.34
|
%
|
19.15
|
%
|
||||||||||||||
The following table presents aggregated information about borrowers for Borrower Loans originated over the period from July 13, 2009 to September 5, 2013, grouped by Prosper Rating. The information for each borrower was obtained from a credit reporting agency at the time the borrower’s application was submitted. The Company has not independently verified this information:
|
Prosper
Rating
|
Average Experian
ScorexPlus Score
|
Average
Number of
Current
Delinquencies
|
Average
Number of
Current
Credit Lines
|
Average
Number of
Total Credit
Lines
|
|||||||||||||
|
AA
|
796
|
0.06
|
9.46
|
27.49
|
|||||||||||||
|
A
|
752
|
0.17
|
9.61
|
27.77
|
|||||||||||||
|
B
|
724
|
0.27
|
9.29
|
27.15
|
|||||||||||||
|
C
|
705
|
0.35
|
9.25
|
27.67
|
|||||||||||||
|
D
|
692
|
0.45
|
8.48
|
26.21
|
|||||||||||||
|
E
|
673
|
0.67
|
8.66
|
27.45
|
|||||||||||||
|
HR
|
688
|
0.60
|
8.25
|
26.95
|
|||||||||||||
|
Total
|
713
|
0.38
|
8.98
|
27.19
|
|||||||||||||
On September 6, 2013, the Company ceased using Experian’s ScorexPlus credit score to determine Prosper Ratings and began using Experian’s FICO08 credit score instead. All listings begun after this date use Experian’s FICO08 credit score.
The following table presents aggregated information about borrowers for Borrower Loans originated over the period from September 6, 2013 to June 30, 2014, grouped by Prosper Rating. The information for each borrower was obtained from a credit reporting agency at the time the borrower’s application was submitted. The Company has not independently verified this information:
|
Prosper
Rating
|
Average Experian
FICO Score
|
Average
Number of
Current
Delinquencies
|
Average
Number of
Current
Credit Lines
|
Average
Number of
Total Credit
Lines
|
|||||||||||||
|
AA
|
755
|
0.06
|
11.02
|
28.41
|
|||||||||||||
|
A
|
715
|
0.16
|
10.68
|
28.26
|
|||||||||||||
|
B
|
702
|
0.20
|
10.60
|
28.64
|
|||||||||||||
|
C
|
690
|
0.25
|
10.78
|
29.05
|
|||||||||||||
|
D
|
679
|
0.32
|
10.27
|
28.34
|
|||||||||||||
|
E
|
667
|
0.41
|
9.92
|
28.02
|
|||||||||||||
|
HR
|
663
|
0.49
|
10.87
|
30.19
|
|||||||||||||
|
Total
|
700
|
0.23
|
10.61
|
28.58
|
|||||||||||||
The following tables presents aggregated information about borrowers for Borrower Loans originating over the last three months ending June 30, 2014, grouped by Prosper Rating (the “Amount” and “Average Loan Size” columns are in thousands).
|
Prosper
Rating
|
Number
|
Amount
|
Average
Loan Size
|
Weighted-
Average
Lender
Yield
|
Weighted-
Average
Borrower
Rate
|
Weighted-
Average
Borrower
APR
|
|||||||||||||||||||
|
AA
|
2,586
|
$
|
34,367
|
$
|
13.3
|
6.23
|
%
|
7.23
|
%
|
8.52
|
%
|
||||||||||||||
|
A
|
6,939
|
$
|
92,869
|
|
13.4
|
9.57
|
%
|
10.57
|
%
|
13.29
|
%
|
||||||||||||||
|
B
|
6,892
|
$
|
102,626
|
|
14.9
|
12.58
|
%
|
13.58
|
%
|
16.51
|
%
|
||||||||||||||
|
C
|
7,018
|
$
|
92,424
|
|
13.2
|
16.14
|
%
|
17.14
|
%
|
20.02
|
%
|
||||||||||||||
|
D
|
3,091
|
$
|
34,473
|
|
11.2
|
20.17
|
%
|
21.17
|
%
|
24.27
|
%
|
||||||||||||||
|
E
|
2,072
|
$
|
12,291
|
|
5.9
|
25.09
|
%
|
26.09
|
%
|
29.55
|
%
|
||||||||||||||
|
HR
|
228
|
$
|
844
|
|
3.7
|
28.62
|
%
|
29.62
|
%
|
33.64
|
%
|
||||||||||||||
|
Total
|
28,826
|
$
|
369,894
|
$
|
12.8
|
13.28
|
%
|
14.28
|
%
|
17.03
|
%
|
||||||||||||||
The following table presents aggregated information about borrowers for Borrower Loans originated over the last three months ending June 30, 2014, grouped by Prosper Rating. The information for each borrower was obtained from a credit reporting agency at the time the borrower’s application was submitted. The Company has not independently verified this information:
|
Prosper
Rating
|
Average
Experian
FICO Score
|
Average
Number of
Current
Delinquencies
|
Average
Number of
Current Credit
Lines
|
Average
Number of
Total Credit
Lines
|
|||||||||||||
|
AA
|
750
|
0.07
|
11.11
|
28.22
|
|||||||||||||
|
A
|
711
|
0.19
|
10.56
|
28.12
|
|||||||||||||
|
B
|
700
|
0.23
|
10.48
|
28.51
|
|||||||||||||
|
C
|
690
|
0.30
|
10.89
|
29.29
|
|||||||||||||
|
D
|
679
|
0.34
|
10.54
|
28.85
|
|||||||||||||
|
E
|
667
|
0.43
|
10.33
|
28.57
|
|||||||||||||
|
HR
|
659
|
0.60
|
11.99
|
32.57
|
|||||||||||||
|
Total
|
700
|
0.25
|
10.66
|
28.65
|
|||||||||||||
PROSPER FUNDING LLC
Overview
Prosper Funding LLC (“Prosper Funding”) was formed in the state of Delaware in February 2012 as a limited liability company with its sole equity member being Prosper Marketplace, Inc. (“PMI”). Prosper Funding was formed by PMI to hold Borrower Loans and issue Notes through the platform. Although Prosper Funding is consolidated with PMI for accounting and tax purposes, Prosper Funding has been organized and is operated in a manner that is intended to minimize the likelihood that it would be substantively consolidated with PMI in a bankruptcy proceeding. Prosper Funding’s intention is to minimize the likelihood that its assets would be subject to claims by PMI’s creditors if PMI were to file for bankruptcy, as well as to minimize the likelihood that Prosper Funding will become subject to bankruptcy proceedings directly. Prosper Funding seeks to achieve this by placing certain restrictions on its activities and implementing certain formal procedures designed to expressly reinforce its status as a distinct corporate entity from PMI.
PMI developed the platform and owned the proprietary technology that makes operation of the platform possible. On February 1, 2013, PMI transferred the platform to Prosper Funding, giving Prosper Funding the right to operate the platform to originate and service Borrower Loans and Notes. Prosper Funding entered into an Administration Agreement with PMI pursuant to which PMI has agreed to provide certain administrative services relating to the platform. The Administration Agreement contains a license granted by Prosper Funding to PMI that entitles PMI to use the platform for and in relation to: (i) PMI’s performance of its duties and obligations under the Administration Agreement relating to corporate administration, loan platform services, loan and note servicing and marketing, and (ii) PMI’s performance of its duties and obligations to WebBank under the Loan Account Program Agreement between PMI and WebBank in relation to loan origination and funding. The license is terminable in whole or in part in relation to failure by PMI to pay the licensing fee or the termination of PMI as the provider of some or all of the aforementioned services.
Prosper Funding commenced operations as of February 1, 2013 when PMI transferred ownership of the platform, including all of the rights related to the operation of the platform, to Prosper Funding. Since February 1, 2013, all Notes issued and sold through the platform are issued, sold and serviced by Prosper Funding. All Borrower Loans are unsecured obligations of individual borrower members with a fixed interest rate and loan terms set at three or five years. All Borrower Loans are funded by WebBank. After funding a Borrower Loan, WebBank sells the Borrower Loan to Prosper Funding, without recourse to WebBank, in exchange for the principal amount of the Borrower Loan. WebBank does not have any obligation to purchasers of any of the Notes.
Prosper Funding formed Prosper Asset Holdings LLC (“PAH”) in November 2013 as a limited liability company with the sole equity member being Prosper Funding. PAH was formed to purchase certain Borrower Loans from Prosper Funding and, sell them to certain participants in the Whole Loan Channel.
Trends and Uncertainties
The performance of Borrower Loans may not be consistent with the historical trends demonstrated by prior Borrower Loans. During 2013 and 2014, the volume of loans originated through the platform increased consistently in terms of both units and total dollar amounts and Prosper Funding hopes to continue that trend of growth into the future. Over time, Prosper Funding expects its lender base to grow as it gains more exposure to potential borrowers and lenders and establishes its Notes as a viable investment alternative. Prosper Funding expects the growth of its lender base will contribute to increased origination volume on the platform.
Prosper Funding’s operating plan calls for a strategy of increasing transaction volume, borrower focused marketing and improving the efficiency of the platform to increase revenue. Prosper Funding will generate revenue through license fees earned under the Administration Agreement and servicing fees from investor members which are described more fully in the Prosper Funding LLC notes to condensed consolidated financial statements included elsewhere in this Quarterly Report.
The peer-to-peer lending industry remains a very innovative and unique industry. The application of federal and state laws in areas such as securities and consumer finance to Prosper Funding’s business is still evolving. Prosper Funding will continue to monitor this evolution actively in order to identify and respond quickly to any legislative or regulatory developments that may impact the platform.
Critical Accounting Policies and Estimates
Management’s discussion and analysis of Prosper Funding’s consolidated financial condition and results of operations is based on Prosper Funding’s condensed consolidated financial statements, which Prosper Funding has prepared in accordance with U.S. generally accepted accounting principles. The preparation of condensed consolidated financial statements requires management to make estimates, judgments and assumptions that affect the reported amounts of assets and liabilities, revenues and expenses and the related disclosures. Prosper Funding bases its estimates on the historical experience of PMI and on various other assumptions that Prosper Funding believes to be reasonable under the circumstances. Actual results could differ from those estimates. Prosper Funding’s significant accounting policies are more fully described in Note 2 to its condensed consolidated financial statements included elsewhere in this Quarterly Report.
Critical accounting policies are those policies that Prosper Funding believes present the most complex or subjective measurements and have the most potential to impact its financial position and operating results. While all decisions regarding accounting policies are important, Prosper Funding believes that the following policies could be considered critical.
Fair Value Measurement
Upon commencement of operations on February 1, 2013, Prosper Funding began to purchase Borrower Loans originated through the platform and issue Notes, which are accounted for on a fair value basis.
Prosper Funding determines the fair values of its financial instruments based on the fair value hierarchy established in Financial Accounting Standards Board (“FASB”) Accounting Standards Codification (“ASC”) Topic 820, Fair Value Measurements and Disclosures, which requires an entity to maximize the use of quoted prices and observable inputs and to minimize the use of unobservable inputs when measuring fair value. Prosper Funding uses various valuation techniques depending on the nature of the financial instrument, including the use of market prices for identical or similar instruments, or discounted cash flow models. When possible, active and observable market data for identical or similar financial instruments are utilized. Alternatively, Prosper Funding may determine fair value using assumptions that it believes a market participant would use in pricing the asset or liability.
The estimated fair values of cash and cash equivalents, restricted cash, accounts payable and accrued liabilities approximate their carrying values because of their short-term nature. Loans held for investment, Borrower Loans, and Notes are accounted for on a fair value basis. For additional information and discussion regarding significant accounting policies surrounding fair value measurement, see Note 2, Note 3 and Note 4 to Prosper Funding’s condensed consolidated financial statements included elsewhere in this Quarterly Report.
Borrower Loans and Notes
Overall, if the fair value of the Borrower Loans held by Prosper Funding that were funded through the Note Channel decrease or increase due to any changes in Prosper Funding’s assumptions, there will also be a corresponding decrease or increase in the fair value of the linked Notes. As a result, the effect on Prosper Funding’s earnings of adverse changes in key assumptions would be mitigated.
As Prosper Funding receives scheduled payments of principal and interest on the Borrower Loans it holds that were funded through the Note Channel, Prosper Funding in turn makes principal and interest payments on the corresponding Notes. These principal payments reduce the carrying value of those Borrower Loans and Notes. If Prosper Funding does not receive payments on any such Borrower Loan, Prosper Funding is not obligated to and does not make payments on the corresponding Notes. The aggregate fair value of a group of Notes corresponding to a particular Borrower Loan is approximately equal to the fair value of that Borrower Loan, less the servicing fee. If the fair value of the Borrower Loan decreases due to changes in Prosper Funding’s expectations regarding the likelihood of default or the amount of loss in the event of default, there will also be a corresponding decrease in the aggregate fair value of the related Notes (an unrealized aggregate gain related to the Notes and an unrealized loss related to the Borrower Loan).
Results of Operations
Revenues
Revenue Recognition
Prosper Funding’s revenue recognition policy is in accordance with ASC Topic 605, Revenue Recognition. Under ASC Topic 605, revenue is recognized when persuasive evidence of an arrangement exists, delivery has occurred or services have been rendered, the price of the services is fixed and determinable and collectability is reasonably assured.
Administration Fee Revenue - Related Party
Prosper Funding primarily generates revenues through license fees it earns under its Administration Agreement with PMI. The Administration Agreement contains a license granted by Prosper Funding to PMI that entitles PMI to use the platform for and in relation to: (i) PMI’s performance of its duties and obligations under the Administration Agreement, and (ii) PMI’s performance of its duties and obligations to WebBank under the Loan Account Program Agreement. For the three months ended June 30, 2014 and 2013, Prosper Funding received $6.9 million and $1.5 million in administration fee revenue from PMI, respectively. For the six months ended June 30, 2014 and 2013, Prosper Funding received $11.0 million and $2.1 million in administration fee revenue from PMI, respectively. The increases were the result of higher loan volume during 2014.
Interest Income on Borrower Loans and Interest Expense on Notes
Prosper Funding recognizes interest income on Borrower Loans funded through the Note Channel using the accrual method based on the stated interest rate to the extent Prosper Funding believes it to be collectable. Prosper Funding records interest expense on the corresponding Notes based on the contractual interest rates to the extent Prosper Funding believes they will be collectable.
The following table summarizes interest income on such Borrower Loans and interest expense on Notes for the three and six months ended June 30, 2014 and 2013 (in thousands):
|
|
Three months ended June 30,
|
Six months ended June 30,
|
||||||||||||||
|
|
2014
|
2013
|
2014
|
2013
|
||||||||||||
|
|
||||||||||||||||
|
Interest income on borrower loans
|
$
|
10,517
|
$
|
8,563
|
$
|
20,567
|
$
|
13,636
|
||||||||
|
Interest expense on notes
|
(9,494
|
)
|
(8,127
|
)
|
(18,763
|
)
|
(12,946
|
)
|
||||||||
|
Net interest income
|
$
|
1,023
|
$
|
436
|
$
|
1,804
|
$
|
690
|
||||||||
The overall increase in net interest income for the three and six months ended June 30, 2014 was driven by the increase in the volume of Borrower Loans that Prosper Funding owned.
Other Revenues (Expenses)
Other revenues (expenses) consists primarily of gains (losses) on whole loan sales. Other revenues (expenses) was $0.2 million loss and $0 for the three months ended June 30, 2014 and 2013, respectively, which represented a decrease of $0.2 million. The decrease was due to the loss on whole loan sales.
Cost of Revenues
Cost of Services
Prosper Funding also incurs certain recurring expenses relating to fees under the Administration Agreement with PMI, as well as its agreements with WebBank, Wells Fargo, FOLIOfn Investments, Inc. and First Associates Loan Servicing, LLC. In addition, Prosper Funding incurs certain ongoing expenses related to collateral requirements under its agreements with WebBank and Wells Fargo Bank. For the three months ended June 30, 2014 and 2013, Prosper Funding incurred $0.7 million and $0.3 million in cost of services, respectively, an increase of $0.4 million or 133%. For the six months ended June 30, 2014 and 2013, Prosper Funding incurred $1.1 million and $0.6 million in cost of services, respectively, an increase of $0.5 million or 86%. This increase was largely due to higher loan listing volume and an increase in strategic partnership fees.
During the year ended December 31, 2013, CSC Logic, Inc. served as the Company’s backup servicer. In January 2014, the Company replaced CSC Logic, Inc. with First Associates Loan Servicing, LLC as its backup servicer.
Repurchase and Indemnification Obligation
Under the terms of the Notes, the Lender Registration Agreements between Prosper Funding and investor members who participate in the Note Channel, and the loan purchase agreements between Prosper Funding and investor members that participate in the Whole Loan Channel, Prosper Funding may, in certain circumstances, become obligated to repurchase a Note or Borrower Loan from a investor member or indemnify a investor member against loss on a Note. Generally, these circumstances include the occurrence of verifiable identity theft, the failure to properly follow loan listing or bidding protocols, or a violation of the applicable federal/state/local lending laws. These repurchase and indemnification obligations are evaluated at least once a quarter and represent an estimate based on the rate of historical loan losses as a percentage of originations (which generally occur within six to nine months of origination). The provision for the repurchase and indemnification obligations may include a judgmental management adjustment due to Prosper Funding’s limited operating history, changes in current economic conditions, the risk of new and as of yet undetected fraud schemes, changes in origination unit and dollar volumes and the lack of industry comparables. Based on the analysis of the historical provision, the provision for repurchase and indemnification obligation was $0.06 million and $0.05 million for the three months ended June 30, 2014 and 2013, respectively. The provision for repurchase and indemnification obligation was $0.12 million and $0.15 million for the six months ended June 30, 2014 and 2013, respectively.
Other Income and Expenses
Change in Fair Value of Borrower Loans, Loans Held for Investment and Notes, net
The fair value of Borrower Loans and Notes are estimated using discounted cash flow methodologies based upon a set of valuation assumptions. The main assumptions used to value such Borrower Loans and Notes include prepayment rates derived from historical prepayment rates for each credit grade, default rates derived from historical performance, recovery rates and discount rates applied to each credit grade based on the perceived credit risk of each credit grade. Loans held for investment are primarily comprised of Borrower Loans held for short durations and are recorded at cost which approximates fair value. For Borrower Loans held long term, the fair value is estimated using discounted cash flow methodologies based upon a set of valuation assumptions similar to those of other Borrower Loans.
The following table summarizes the fair value adjustments for the three and six months ended June 30, 2014 and 2013, respectively (in thousands):
|
|
Three months ended June 30,
|
Six months ended June 30,
|
||||||||||||||
|
|
2014
|
2013
|
2014
|
2013
|
||||||||||||
|
Borrower loans
|
$
|
(1,290
|
)
|
$
|
(4,543
|
)
|
$
|
(958
|
)
|
$
|
(4,083
|
)
|
||||
|
Loans held for investment
|
(1
|
)
|
(5
|
)
|
(3
|
)
|
(3
|
)
|
||||||||
|
Notes
|
1,382
|
4,860
|
1,350
|
4,573
|
||||||||||||
|
Total
|
$
|
91
|
$
|
312
|
$
|
389
|
$
|
487
|
||||||||
The total fair value adjustment for the three months ended June 30, 2014 and 2013 was a net unrealized gain of $0.09 million and $0.31 million, respectively. The total fair value adjustment for the six months ended June 30, 2014 and 2013 was a net unrealized gain of $0.39 million and $0.49 million, respectively. These amounts are included as a component of other income and expenses in Prosper Funding’s condensed consolidated statements of operations.
Operating Expenses
Administration Fee Expense - Related Party
Pursuant to an Administration Agreement between Prosper Funding and PMI, PMI manages the platform on behalf of Prosper Funding. Accordingly, each month, Prosper Funding is required to pay PMI (a) an amount equal to one-twelfth (1/12) of the specified annual Corporate Administration Fees of $1.2 million, (b) a fee for each Borrower Loan originated through the platform, (c) 90% of all servicing fees collected by or on behalf of Prosper Funding, and (d) all nonsufficient funds fees collected by or on behalf of Prosper Funding. In addition, under a second Administration Agreement between PMI and PAH, PAH is required to pay PMI an annual fee of $0.2 million, payable on a monthly basis, for PMI being the administrator of PAH’s operations. Administration fee expenses were $4.2 million and $0.6 million for the three months ended June 30, 2014 and 2013, respectively, representing an increase of $3.6 million or 600%. Administration fee expenses were $6.8 million and $1.0 million for the six months ended June 30, 2014 and 2013, respectively, an increase of $5.8 million or 580%. The increase was primarily due to the growth of the platform, resulting in increased fees owed PMI by Prosper Funding.
Depreciation and Amortization
Depreciation and amortization expense was $0.2 million and $0.1 million for the three months ended June 30, 2014 and 2013, respectively, an increase of $0.1 million or 100%. Depreciation and amortization expense was $0.5 million and $0.2 million for the six months ended June 30, 2014 and 2013, respectively, an increase of $0.3 million or 150%. The increase in depreciation is primarily due to the capitalization of various internally developed software projects placed in service in late 2013 and 2014, which in turn increased depreciation expense taken on those assets during the period ended June 30, 2014.
Professional Services
Professional service expenses are comprised of legal expenses, audit and accounting fees, consulting services and other outside costs. Professional service expenses were $0 million and $0.005 million for the three months ended June 30, 2014 and 2013, respectively, a decrease of $0.005 million or 100%. Professional service expenses were $0.01 million and $0.02 million for the six months ended June 30, 2014 and 2013, respectively, a decrease of $0.01 million or 50%. This decrease is primarily due to a decrease in other outside costs.
Other Operating Expenses
Other operating expenses consist primarily of bank service charges. Other operating expenses were $0.08 million and $0.05 million for the three months ended June 30, 2014 and 2013, respectively, representing an increase of $0.03 or 60%. Other expenses were $0.2 million and $0.1 million for the six months ended June 30, 2014 and 2013, respectively, and increase of $0.1 million or 100%. This increase is primarily due to bank service charges.
Income Taxes
Prosper Funding incurred no income tax provision for the three and six months ended June 30, 2014 and 2013. Prosper Funding is a US disregarded entity and the income and loss is included in the return of its parent, PMI. Given PMI’s history of operating losses and inability to achieve profitable operations, it is difficult to accurately forecast how PMI’s and Prosper Funding’s results will be affected by the realization and use of net operating loss carry forwards.
Liquidity and Capital Resources
The following table summarizes the cash flow for the six months ended June 30, 2014 and 2013, respectively (in thousands):
|
|
For the six months ended
|
|||||||
|
|
June 30, 2014
|
June 30, 2013
|
||||||
|
Net income
|
$
|
4,672
|
$
|
1,267
|
||||
|
|
||||||||
|
Net cash provided by operating activities
|
2,921
|
1,494
|
||||||
|
Net cash used in investing activities
|
(27,763
|
)
|
(21,352
|
)
|
||||
|
Net cash provided by financing activities
|
21,067
|
23,363
|
||||||
|
|
||||||||
|
Net (decrease) increase in cash and cash equivalents
|
(3,775
|
)
|
3,505
|
|||||
|
Cash and cash equivalents at the beginning of the period
|
5,789
|
5
|
||||||
|
Cash and cash equivalents at the end of the period
|
$
|
2,014
|
$
|
3,510
|
||||
Prosper Funding has positive cash flows since commencement of operations and anticipates that it will continue to be cash flow positive through the end of 2014. Prosper Funding has positive cash flows from operations of $2.9 million for the six months ended June 30, 2014. At June 30, 2014, Prosper Funding had $2.0 million in available cash and cash equivalents. Since its inception, Prosper Funding has financed its operations primarily through capital infusions from its parent, PMI. Prosper Funding believes that its current cash position is sufficient to meet its current liquidity needs.
Net cash provided by operating activities was $2.9 million and $1.5 million for the six months ended June 30, 2014 and 2013, respectively. The increase in cash provided by operating activities was primarily attributable to an increase in net income due to an increase in the volume of Borrower Loans serviced by Prosper Funding and an increase in revenues through license fees it earns under its Administration Agreement with PMI.
Net cash used in investing activities was $27.8 million and $21.4 million for the six months ended June 30, 2014 and 2013, respectively. The primary driver for the change was an increase in Borrower Loan purchases, offset by increased proceeds from the sale of such Borrower Loans. Net cash used in investing activities for the six months ended June 30, 2014, included $330 million in purchases of Borrower Loans, $112 million in purchases of Loans held for investment, $0.6 million of purchases of property and equipment, offset by $243 million in proceeds from sale of Borrower Loans, $66 million in repayment of Borrower Loans, $0.3 million in repayment of Loans held for investment, and $106 million in proceeds from sale of Loans held for investment.
Net cash provided by financing activities was $21.1 million and $23.4 million for the six months ended June 30, 2014 and 2013, respectively. Net cash provided by financing activities for the six months ended June 30, 2014, included $87 million in proceeds from issuance of Notes, which was partially offset by $66 million in repayment of Notes.
|
Item 3.
|
Quantitative and Qualitative Disclosures about Market Risk
|
Not applicable for smaller reporting companies.
Conclusion Regarding the Effectiveness of Disclosure Controls and Procedures
Each Registrant maintains disclosure controls and procedures that are designed to ensure that information required to be disclosed in such Registrant’s Exchange Act Reports is recorded, processed, summarized and reported within the time periods specified in the SEC’s rules and forms and that such information is accumulated and communicated to the management of such Registrant, including such Registrant’s principal executive officer (“PEO”) and principal financial officer (“PFO”), as appropriate, to allow for timely decisions regarding required disclosure. Disclosure controls and procedures, no matter how well designed and operated, can provide only reasonable assurance that the objectives of the control system are met. Each Registrant’s disclosure controls and procedures were designed to provide reasonable assurance of achieving their stated objectives. Under the supervision, and with the participation, of management, including the PEO and the PFO, each Registrant has evaluated the effectiveness of the design and operation of its disclosure controls and procedures (as such term is defined in Rules 13a-15(e) and 15d-15(e) under the Exchange Act) as of June 30, 2014, following the criteria set forth by the Committee of Sponsoring Organizations of the Treadway Commission in Internal Control—Integrated Framework, and with further guidance for internal controls for small business provided by the SEC’s Interpretive Guidance in Release No. 34-55929. Based upon this evaluation, the PEO and the PFO of each Registrant have concluded that these disclosure controls and procedures are effective to provide reasonable assurance that material information relating to such Registrant and its subsidiaries that is required to be disclosed in reports filed with, or submitted to, the SEC under the Exchange Act (i) is recorded, processed, summarized and reported within the time periods specified by the SEC rules and forms, and (ii) is accumulated and communicated to management, including its PEO and PFO, as appropriate to allow timely decisions regarding required disclosure.
Under the supervision and with the participation of management, including the PEO and PFO of each Registrant, each Registrant has evaluated changes in internal control over financial reporting (as such term is defined in Rules 13a-15(f) and 15d-15(f) under the Exchange Act) that occurred during each Registrant’s most recent fiscal quarter, and has concluded there was no change in such Registrant’s internal control over financial reporting that has materially affected, or is reasonably likely to materially affect, such Registrant’s internal control over financial reporting.
The Dodd-Frank Wall Street Reform and Consumer Protection Act exempts any company that is not a “large accelerated filer” or an “accelerated filer” (as defined by SEC rules) from the requirement that such company obtain an external audit of the effectiveness of its internal control over financial reporting pursuant to Section 404(b) of the Sarbanes-Oxley Act. As a result, each of the Registrants is exempt from the requirement that it include in its Annual Report on Form 10-K an attestation report on internal control over financial reporting by an independent registered public accounting firm; however, management’s annual report on internal control over financial reporting, pursuant to Section 404(a) of the Sarbanes-Oxley Act, is still required with respect to each Registrant.
PART II. OTHER INFORMATION
See Note 10: “Commitments and Contingencies” of Prosper Marketplace, Inc.’s Notes to Condensed Consolidated Financial Statements contained in Part I, Item 1 of this Quarterly Report for information regarding
| • | Prosper Marketplace, Inc.’s (“PMI”) NASAA settlement agreement |
| • | Class action litigation involving PMI |
This information is incorporated into this Item by reference.
Because of the nature and inherent uncertainties of litigation, should the outcome of any legal actions be unfavorable, the Company may be required to pay damages and other expenses, which could have a material adverse effect on the Company’s consolidated financial position and results of operations. The Company is not currently subject to any material legal proceedings. Except for those matters, the Company is not aware of any litigation matters that have had, or are expected to have, a material adverse effect on the Company.
This Item should be read in conjunction with the Legal Proceedings disclosures in the Registrants’ Annual Report on Form 10-K for the year ended December 31, 2013 (Part I, Item 3).
Not applicable for smaller reporting companies.
On May 1, 2014, PMI entered into a Series C Preferred Stock Purchase Agreement with several new investors (collectively, the “Series C Share Purchasers”), pursuant to which the Company issued and sold to such Series C Share Purchasers 4,880,954 shares of PMI’s Series C preferred stock for an aggregate purchase price of $70,075.
iNFORMATION FOR THIS ITEM IS NOT REQUIRED FOR PROSPER FUNDING BECAUSE IT MEETS THE CONDITIONS SET FORTH IN GENERAL INSTRUCTION H(1)(a) AND (b) OF FORM 10-Q AND THEREFORE IS FILING THIS FORM WITH A REDUCED FILING FORMAT.
Not applicable.
Not applicable.
Not applicable.
The exhibits listed on the accompanying Exhibit Index are filed or incorporated by reference as a part of this report and such Exhibit Index is incorporated herein by reference.
Pursuant to the requirements of the Securities Exchange Act of 1934, the registrant has duly caused this report to be signed on its behalf by the undersigned thereunto duly authorized.
|
|
PROSPER MARKETPLACE, INC.
|
|
|
PROSPER FUNDING LLC
|
|
|
|
|
Date: August 13, 2014
|
/s/ Aaron Vermut
|
|
|
Aaron Vermut
|
|
|
Chief Executive Officer of Prosper Marketplace, Inc.
|
|
|
Chief Executive Officer of Prosper Funding LLC
|
|
|
(Principal Executive Officer)
|
|
|
|
|
Date: August 13, 2014
|
/s/ Xiaopei Lee
|
|
|
Xiaopei Lee
|
|
|
Chief Financial Officer of Prosper Marketplace, Inc.
|
|
|
Treasurer of Prosper Funding LLC
(Principal Financial Officer and Principal Accounting Officer)
|
|
Exhibit
Number
|
Exhibit Description
|
|
|
|
|
3.1
|
Fifth Amended and Restated Limited Liability Company Agreement of Prosper Funding, dated October 21, 2013 (incorporated by reference to Exhibit 3.1 of the Post-Effective Amendment No. 3 to the Registration Statement on Form S-1, filed October 23, 2013 by Prosper Funding and PMI)
|
|
|
|
|
3.2
|
Amended and Restated Certificate of Incorporation of PMI (incorporated by reference to Exhibit 3.2 of the Annual Report on Form 10-K, filed June 30, 2014 by Prosper Funding and PMI)
|
|
|
|
|
3.3
|
Prosper Funding Certificate of Formation (incorporated by reference to Exhibit 3.2 of the Registration Statement on Form S-1/A, filed April 23, 2012 by Prosper Funding and PMI)
|
|
|
|
|
3.4
|
Bylaws of PMI, dated March 22, 2005 (incorporated by reference to Exhibit 3.2 of the Registration Statement on Form S-1, filed October 30, 2007 by PMI)
|
|
|
|
|
4.1
|
Amended and Restated Investors’ Rights Agreement, dated May 15, 2014 (incorporated by reference to Exhibit (d)(7) on Form SC TO-I/A, filed July 16, 2014)
|
|
|
|
|
4.2
|
Amended and Restated Voting Agreement, dated May 15, 2014 (incorporated by reference to Exhibit (d)(8) on Form SC TO-I/A, filed July 10, 2014)
|
|
|
|
|
4.3
|
Amended and Restated Right of First Refusal and Co-Sale Agreement, dated May 15, 2014 (incorporated by reference to Exhibit (d)(9) on Form SC TO-I/A, filed July 16, 2014)
|
|
|
|
|
10.1
|
Stock Purchase Agreement, dated May 1, 2014, with FS Venture Capital LLC, Francisco Partners and/or its affiliates (incorporated by reference to Exhibit (d)(10) on Form SC TO-I/A, filed July 16, 2014).
|
|
|
|
|
Indemnification Agreement, dated April 22, 2014, between PMI and Macy Lee.
|
|
|
|
|
|
Certification of Principal Executive Officer pursuant to Section 302 of the Sarbanes-Oxley Act of 2002, with respect to PMI’s Quarterly Report on Form 10-Q for the quarter ended June 30, 2014.
|
|
|
|
|
|
Certification of Principal Financial Officer pursuant to Section 302 of the Sarbanes-Oxley Act of 2002, with respect to PMI’s Quarterly Report on Form 10-Q for the quarter ended June 30, 2014.
|
|
|
|
|
|
Certification of Principal Executive Officer pursuant to Section 302 of the Sarbanes-Oxley Act of 2002, with respect to Prosper Funding’s Quarterly Report on Form 10-Q for the quarter ended June 30, 2014.
|
|
|
|
|
|
Certification of Principal Financial Officer pursuant to Section 302 of the Sarbanes-Oxley Act of 2002, with respect to Prosper Funding’s Quarterly Report on Form 10-Q for the quarter ended June 30, 2014.
|
|
|
|
|
|
Certification of Principal Executive Officer and Principal Financial Officer pursuant to Section 906 of the Sarbanes-Oxley Act of 2002, with respect to PMI’s Quarterly Report on Form 10-Q for the quarter ended June 30, 2014.
|
|
|
|
|
|
Certification of Principal Executive Officer and Principal Financial Officer pursuant to Section 906 of the Sarbanes-Oxley Act of 2002, with respect to Prosper Funding’s Quarterly Report on Form 10-Q for the quarter ended June 30, 2014.
|
|
|
|
|
|
101.INS
|
XBRL Instance Documents
|
|
|
|
|
101.SCH
|
XBRL Taxonomy Extension Schema Document
|
|
|
|
|
101.CAL
|
Taxonomy Extension Calculation Linkbase Document
|
|
|
|
|
101.LAB
|
Taxonomy Extension Label Linkbase Document
|
|
|
|
|
101.PRE
|
Taxonomy Extension Presentation Linkbase Document
|
|
|
|
|
101.DEF
|
Taxonomy Extension Definition Linkbase Document
|
73