Attached files
| file | filename |
|---|---|
| 8-K - 8-K - CMS ENERGY CORP | a14-18900_18k.htm |
Exhibit 99.1
|
|
Investor Meetings August 13-15, 2014 Content How it Works Investment Upsides Partners Passion to Improve |
|
|
This presentation is made as of the date hereof and contains “forward-looking statements” as defined in Rule 3b-6 of the Securities Exchange Act of 1934, Rule 175 of the Securities Act of 1933, and relevant legal decisions. The forward-looking statements are subject to risks and uncertainties. All forward-looking statements should be considered in the context of the risk and other factors detailed from time to time in CMS Energy’s and Consumers Energy’s Securities and Exchange Commission filings. Forward-looking statements should be read in conjunction with “FORWARD-LOOKING STATEMENTS AND INFORMATION” and “RISK FACTORS” sections of CMS Energy’s and Consumers Energy’s Form 10-K for the year ended December 31, 2013 and as updated in subsequent 10-Qs. CMS Energy’s and Consumers Energy’s “FORWARD-LOOKING STATEMENTS AND INFORMATION” and “RISK FACTORS” sections are incorporated herein by reference and discuss important factors that could cause CMS Energy’s and Consumers Energy’s results to differ materially from those anticipated in such statements. CMS Energy and Consumers Energy undertake no obligation to update any of the information presented herein to reflect facts, events or circumstances after the date hereof. The presentation also includes non-GAAP measures when describing CMS Energy’s results of operations and financial performance. A reconciliation of each of these measures to the most directly comparable GAAP measure is included in the appendix and posted on our website at www.cmsenergy.com. CMS Energy provides historical financial results on both a reported (Generally Accepted Accounting Principles) and adjusted (non-GAAP) basis and provides forward-looking guidance on an adjusted basis. Management views adjusted earnings as a key measure of the company’s present operating financial performance, unaffected by discontinued operations, asset sales, impairments, regulatory items from prior years, or other items. These items have the potential to impact, favorably or unfavorably, the company's reported earnings in future periods. Investors and others should note that CMS Energy and Consumers Energy post important financial information using the investor relations section of the CMS Energy website, www.cmsenergy.com and Securities and Exchange Commission filings. 1 |
|
|
Near Term . . . . 2 . . . . steps ahead. Investment & EPS Growth Ten-year Conservative Plan Big Upsides, not in plan Competitive Rates Elections A B C D Energy Law Update A C D B |
|
|
HOW IT WORKS -- Mindset . . . . . . . . drives consistent “no excuse” growth, without resets. $0.81 _ _ _ _ _ Adjusted EPS (non-GAAP) excluding MTM in 2004-2006 b $1.25 excluding discontinued Exeter operations and accounting changes related to convertible debt and restricted stock Int’l Sale b 10-Year Actual 7% CAGR $1.08 Dividend Payout 0% 25% 30% 40% 49% 58% 62% 62% 60%-70% 32% 27% 14% 39% 80% 6% Peers 4% 6% 5% - 7% 3 Dividend EPS $1.78 $1.76 $1.66 5% - 7% |
|
|
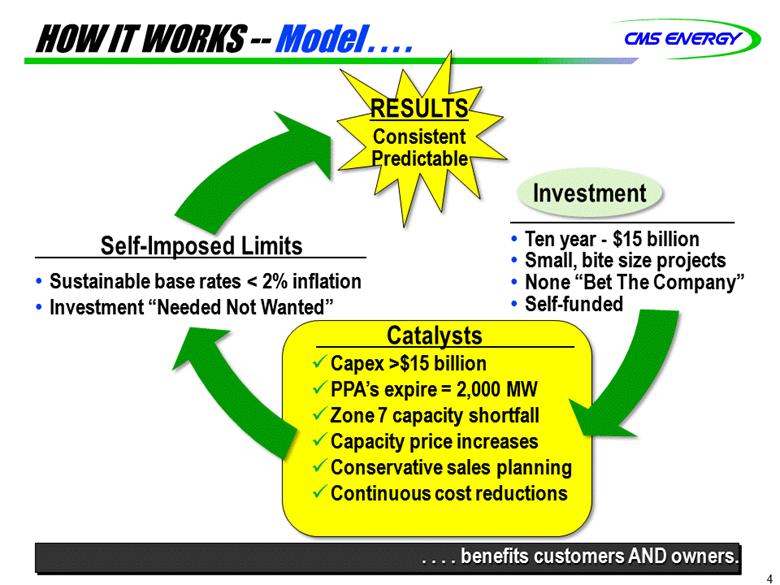
HOW IT WORKS -- Model . . . . Investment Ten year - $15 billion Small, bite size projects None “Bet The Company” Self-funded Catalysts Capex >$15 billion PPA’s expire = 2,000 MW Zone 7 capacity shortfall Capacity price increases Conservative sales planning Continuous cost reductions Self-Imposed Limits Sustainable base rates < 2% inflation Investment “Needed Not Wanted” RESULTS Consistent Predictable . . . . benefits customers AND owners. 4 |
|
|
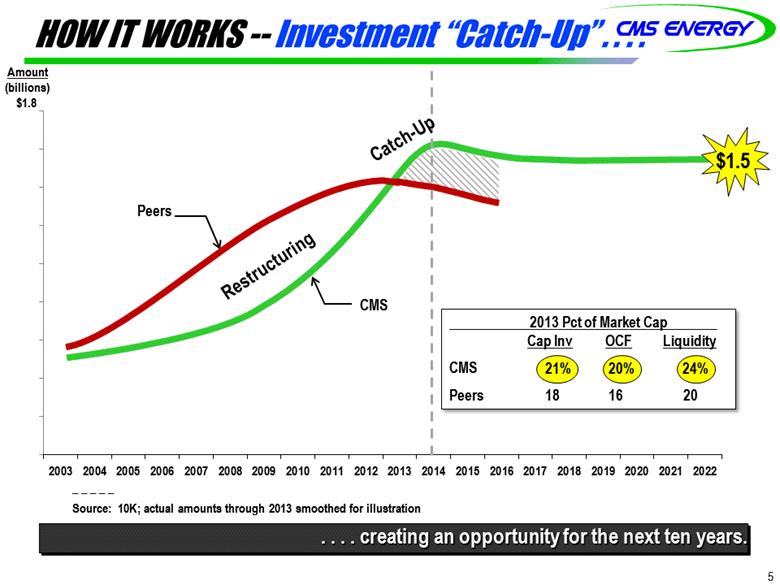
HOW IT WORKS -- Investment “Catch-Up” . . . . 5 2013 Pct of Market Cap Cap Inv OCF Liquidity CMS 21% 20% 24% Peers 18 16 20 21% 20% 24% . . . . creating an opportunity for the next ten years. Amount (billions) $1.8 CMS Peers _ _ _ _ _ Source: 10K; actual amounts through 2013 smoothed for illustration Restructuring Catch-Up $1.5 |
|
|
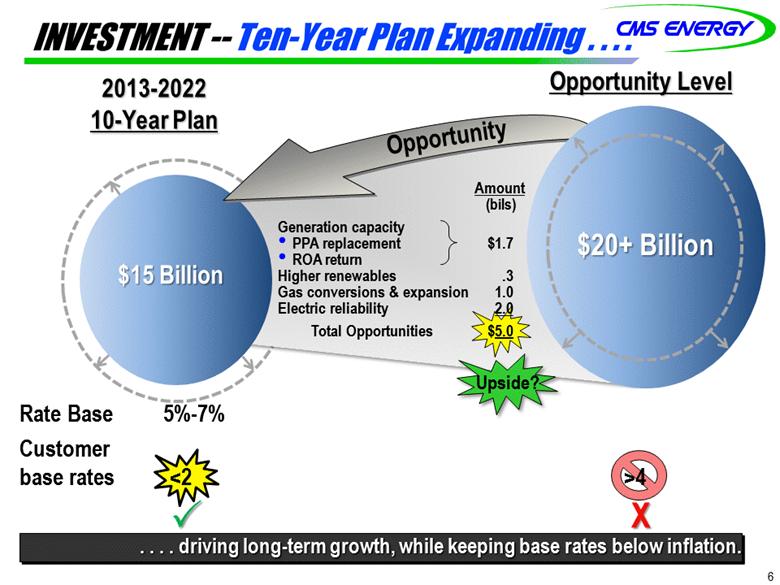
INVESTMENT -- Ten-Year Plan Expanding . . . . 6 . . . . driving long-term growth, while keeping base rates below inflation. 2013-2022 10-Year Plan Opportunity Level $15 Billion $15 Billion $20+ Billion Opportunity Amount (bils) Generation capacity PPA replacement $1.7 ROA return Higher renewables .3 Gas conversions & expansion 1.0 Electric reliability 2.0 Total Opportunities $5.0 X Rate Base 5%-7% Customer base rates <2 >4 Upside? |
|
|
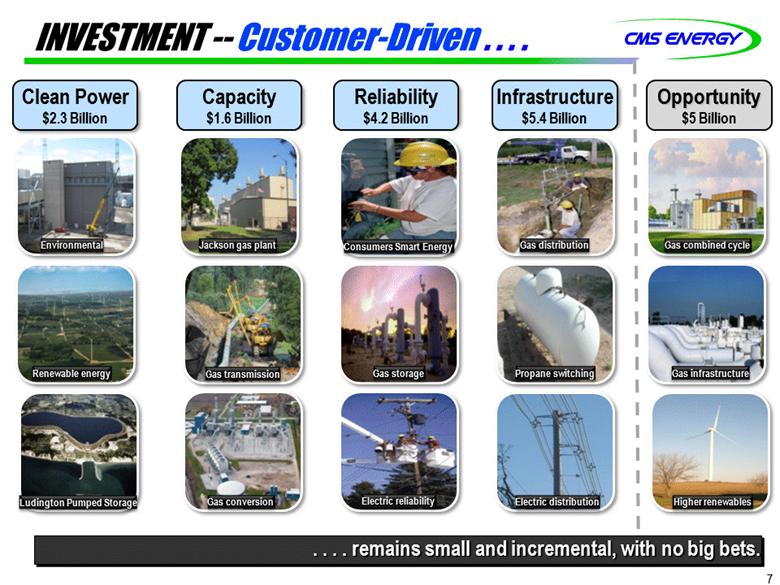
INVESTMENT -- Customer-Driven . . . . Clean Power $2.3 Billion Reliability $4.2 Billion . . . . remains small and incremental, with no big bets. Renewable energy Jackson gas plant Gas storage Propane switching Gas transmission Gas distribution Electric reliability Consumers Smart Energy Electric distribution Capacity $1.6 Billion Infrastructure $5.4 Billion Environmental Gas conversion Ludington Pumped Storage 7 Opportunity $5 Billion Gas combined cycle Gas infrastructure Higher renewables |
|
|
8 . . . . emerging with replacements not yet in plan! Ten-year Capacity Growth ~800 MW 1,240 MW MW PPA 2,600 capacity ~30% ~8,600 MW 540 MW 410 MW Shortfall Owned (6,000) 780 MW 900 MW Potential for ~3,000 MW of owned capacity 2,000 MW 11,000 Further Upside INVESTMENT -- Capacity Opportunities . . . . PPA’s Expire Owned (8,820) PPA 580 |

|
|
INVESTMENT -- MISO Zone 7 Capacity . . . . . . . . shortfall expected to be 2.0 GW in 2016. As of June 2, 2014 (in GW) 22.8 3.2 21.6 24.8 Reserves Demand 2.0 _ _ _ _ _ Source: MISO MISO Zones 7 9 |
|
|
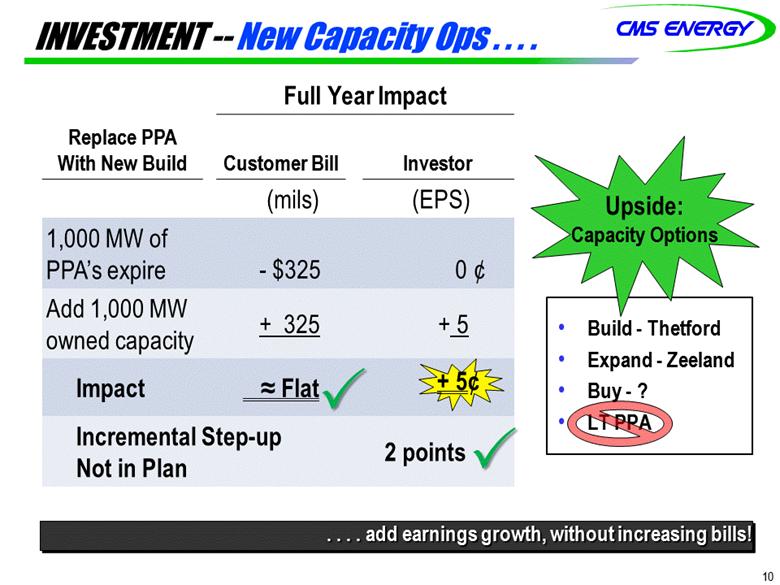
INVESTMENT -- New Capacity Ops . . . . Replace PPA With New Build Full Year Impact Customer Bill Investor (mils) (EPS) 1,000 MW of PPA’s expire - $325 0 ¢ Add 1,000 MW owned capacity + 325 + 5 Impact Flat Incremental Step-up Not in Plan 2 points Build - Thetford Expand - Zeeland Buy - ? LT PPA 10 . . . . add earnings growth, without increasing bills! + 5¢ Upside: Capacity Options |
|
|
Consumers Appears . . . . 11 . . . . to be in a good carbon position. Carbon Tonnage Reduction (Preliminary) Million Tons of CO2 Consumers Energy 2014 2030 2020 2025 2029 Clean Power Plan Projected emission level “Implied” EPA Target |
|
|
12 . . . . could add value to the 700 MW “DIG” plant. Capacity price ($ kW per month) Today (mils) Future Scenarios (mils) $55 $35 +$50 Opportunity Recent Contracts DIG “energy” contract 9 years 250 MW @ $4.06 kW per month < +$30 $5 Upside: Capacity and energy contracts layered in over time UPSIDES -- Capacity Price Increases . . . . |
|
|
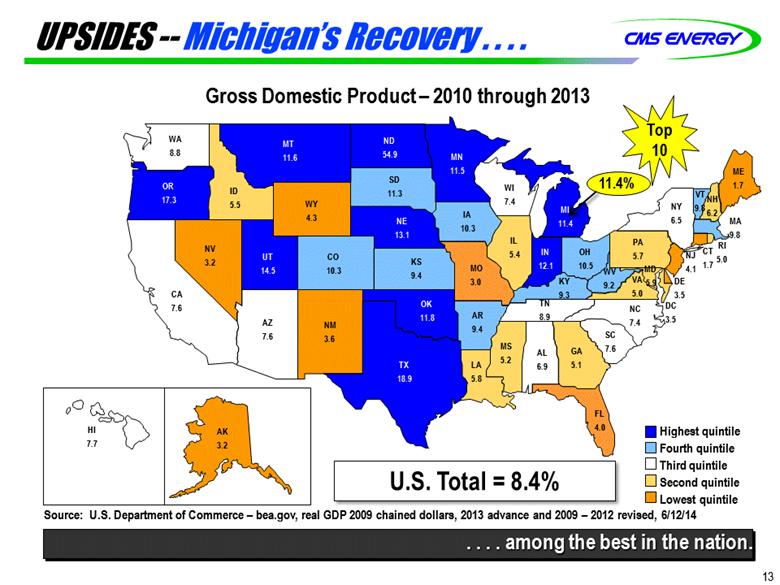
UPSIDES -- Michigan’s Recovery . . . . . . . . among the best in the nation. Gross Domestic Product – 2010 through 2013 Source: U.S. Department of Commerce – bea.gov, real GDP 2009 chained dollars, 2013 advance and 2009 – 2012 revised, 6/12/14 Highest quintile Fourth quintile Third quintile Second quintile Lowest quintile 11.4% WA 8.8 OR 17.3 CA 7.6 NV 3.2 MT 11.6 ID 5.5 WY 4.3 UT 14.5 AZ 7.6 NM 3.6 CO 10.3 ND 54.9 SD 11.3 NE 13.1 KS 9.4 OK 11.8 TX 18.9 MN 11.5 IA 10.3 MO 3.0 AR 9.4 LA 5.8 WI 7.4 IL 5.4 MS 5.2 AL 6.9 TN 8.9 MI 11.4 IN 12.1 OH 10.5 KY 9.3 VA 5.0 WV 9.2 PA 5.7 MD 5.9 DE 3.5 NJ 4.1 NY 6.5 CT 1.7 RI 5.0 NH 6.2 MA 9.8 ME 1.7 DC 3.5 HI 7.7 AK 3.2 FL 4.0 GA 5.1 SC 7.6 NC 7.4 VT 9.8 U.S. Total = 8.4% 13 Top 10 |
|
|
UPSIDES -- Grand Rapids Economic Results . . . . . . . . nationally recognized and ranked as a top city. Economy Performance Manpower Employment Survey _ _ _ _ _ Sources: Forbes, Manpower, and CareerBuilder 29% 22% (Third Quarter Outlook) % Increase staffing 3rd best state! 32% #1 City to raise a family #2 Metro job growth since 2010 #3 Best midsize city for jobs in 2014 #4 Best city in U.S. to find a job 14 Best labor market in nation |
|
|
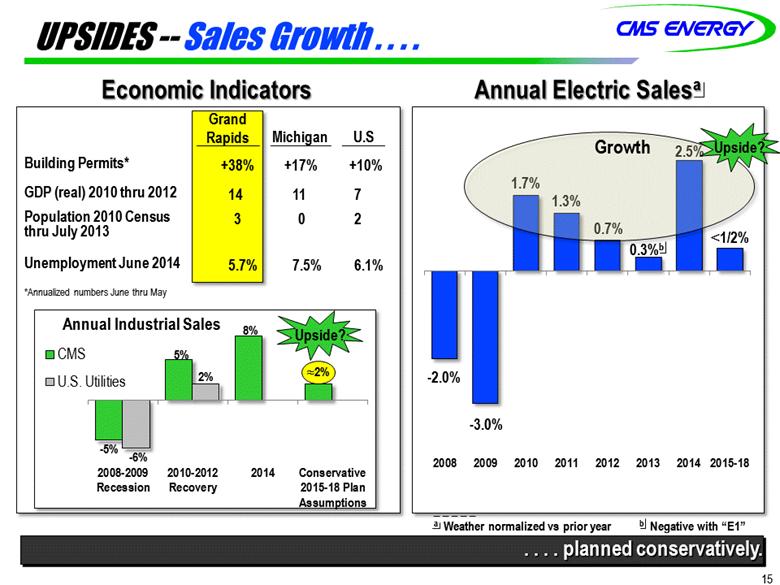
. . . . planned conservatively. Annual Electric Salesa Economic Indicators Annual Industrial Sales Grand Rapids Michigan U.S Building Permits* +38% +17% +10% GDP (real) 2010 thru 2012 14 11 7 Population 2010 Census thru July 2013 3 0 2 Unemployment June 2014 5.7% 7.5% 6.1% *Annualized numbers June thru May _ _ _ _ _ a Weather normalized vs prior year b Negative with “E1” 15 Growth Upside? Upside? UPSIDES -- Sales Growth . . . . 8% |
|
|
UPSIDES -- O&M Cost Control . . . . 16 . . . . allows us to make customer-focused investments. Average Annual O&M Change +6% -2% -2% _ _ _ _ _ a -8% Before reinvestment +2% CMS CMS CMS CMS CMS -1% Upside? _ _ _ _ _ a O&M change excluding 2013 major storms Amount (mils) 2012 2013 2014 Cost reduction Reinvest Cost reduction Reinvest $1,050 Continuous Cost Reductions +5% Plan Conservatively |
|
|
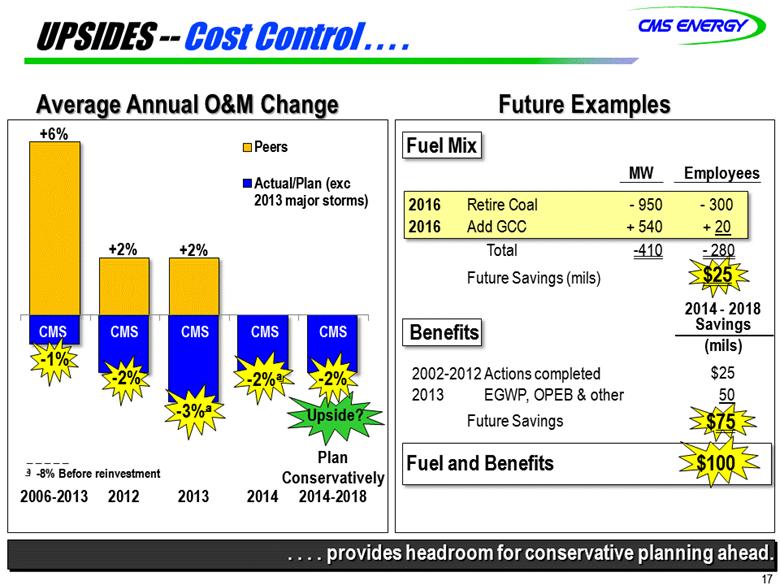
UPSIDES -- Cost Control . . . . 17 Average Annual O&M Change +6% -2% -2% Plan Conservatively Upside? _ _ _ _ _ a -8% Before reinvestment +2% CMS CMS CMS CMS CMS Future Examples Fuel Mix Benefits MW Employees 2016 Retire Coal - 950 - 300 2016 Add GCC + 540 + 20 Total -410 - 280 Future Savings (mils) $25 2002-2012 Actions completed $25 2013 EGWP, OPEB & other 50 $75 Fuel and Benefits $100 Savings (mils) . . . . provides headroom for conservative planning ahead. CMS -1% Future Savings 2014 - 2018 |
|
|
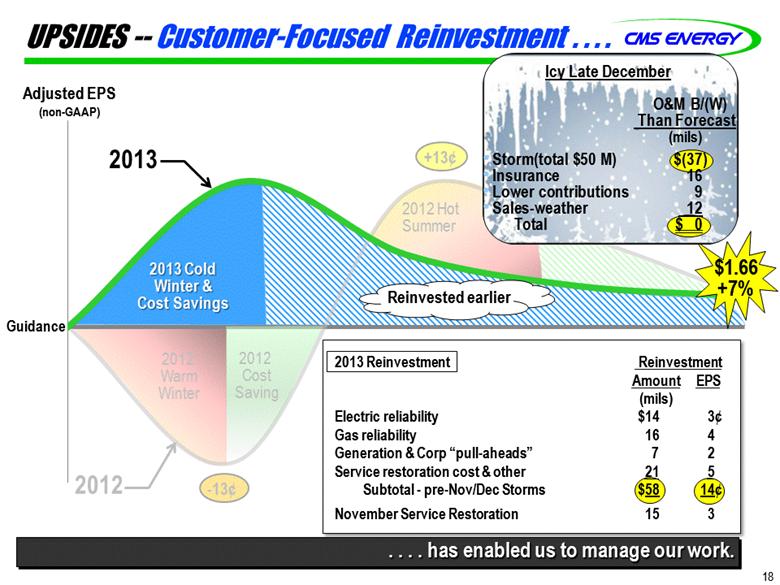
Adjusted EPS (non-GAAP) . . . . has enabled us to manage our work. UPSIDES -- Customer-Focused Reinvestment . . . . 2013 2013 Cold Winter & Cost Savings $1.66 +7% 18 Guidance 2012 Warm Winter 2012 Cost Saving +13¢ 2012 Hot Summer Reinvested earlier -13¢ 2012 Icy Late December O&M B/(W) Than Forecast (mils) Storm(total $50 M) $(37) Insurance 16 Lower contributions 9 Sales-weather 12 Total $ 0 2013 Reinvestment Reinvestment Amount EPS (mils) Electric reliability $14 3¢ Gas reliability 16 4 Generation & Corp “pull-aheads” 7 2 Service restoration cost & other 21 5 Subtotal - pre-Nov/Dec Storms $58 14¢ November Service Restoration 15 3 |
|
|
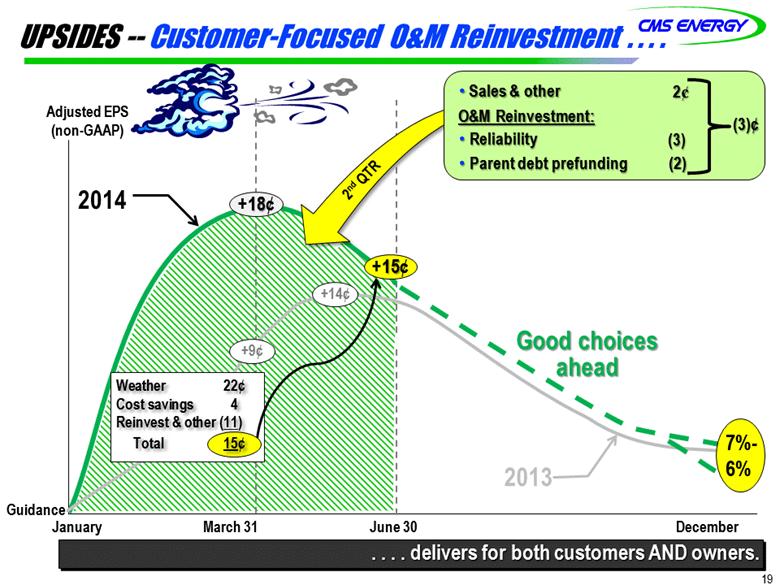
UPSIDES -- Customer-Focused O&M Reinvestment . . . . 19 . . . . delivers for both customers AND owners. 2014 2013 Adjusted EPS (non-GAAP) Guidance January March 31 June 30 December +9¢ +14¢ +18¢ +9¢ +15¢ 2nd QTR 7%- 6% Good choices ahead (3)¢ O&M Reinvestment: Reliability (2) Parent debt prefunding (3) Weather 22¢ Cost savings 4 Reinvest & other (11) Total 15¢ Sales & other 2¢ |
|
|
PARTNERS -- Michigan Energy Law . . . . Historical test year 12-18 months regulatory lag No cap on ROA 20 10% renewables by 2015 Energy efficiency standards File-and-implement 10% ROA cap Adaptability Reliability Affordability Environmental protection Before 2008 TODAY 2015 Improvements . . . . builds on 2008 Law! Gov. signed new rate design bill Senate workgroup formed to study 2015 Energy Law improvements Update |
|
|
PARTNERS -- Michigan Governor’s Race . . . . 21 . . . . focus on non-energy issues. Mark Schauer Democrat, Challenger Rick Snyder Republican, Incumbent Campaign Issues Education Jobs Roads Detroit On Energy On ROA As Senate Democratic Leader, Mark played a key role in the successful passage of the 2008 Energy Law. “Choice creates a lot of challenges and problems, essentially trying to arbitrage markets.” -Governor Rick Snyder |
|
|
PARTNERS -- Constructive Regulation . . . . 22 . . . . is supported by a quality Commission and a strong Law. Tier 1 State Ranking Barclays Research Michigan John Quackenbush (R), Chairman Term Ends: July 2, 2017 Greg White (I) Term Ends: July 2, 2015 Sally Talberg (I) Term Ends: July 2, 2019 Commission |
|
|
PASSION TO IMPROVE -- Regulation & Self-Initiated Steps . . . . 23 Self-initiated Rate design, regulatory ROA Policy, legislation Consumers higher than Midwest peer avg Below Midwest peers . . . . being taken to maintain competitive bills & improve industrial rates. House Bill 5476 Industrial Electric Rate (vs Midwest Average) Signed into law on June 17th, 2014 Directs MPSC to develop cost of service allocation and rate design methods Company to include new rate design in next electric rate case MPSC to approve rate design within 270 days |
|
|
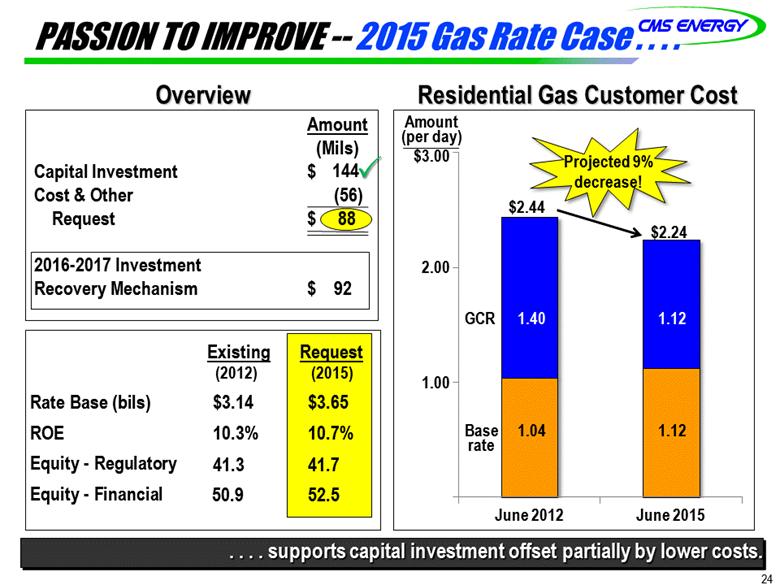
PASSION TO IMPROVE -- 2015 Gas Rate Case . . . . 24 Overview Rate Base (bils) XX ROE XX Equity - Regulatory XX Equity - Financial XX Residential Gas Customer Cost . . . . supports capital investment offset partially by lower costs. Amount (Mils) Capital Investment $ Cost & Other (56) Request $ 88 2016-2017 Investment Recovery Mechanism $ 92 Existing $3.14 10.3% 41.3 50.9 144 Request $3.65 10.7% 41.7 52.5 Amount $3.00 2.00 1.00 June 2012 June 2015 1.04 1.40 $2.44 1.12 1.12 $2.24 Projected 9% decrease! (per day) GCR Base rate (2012) (2015) |
|
|
25 PASSION TO IMPROVE -- Includes . . . . . . . . disciplined cost control with improved customer metrics and employee engagement. Customer Satisfaction Employee Engagement Electric 1st Quartile 2nd Quartile 4th Quartile 2011 2014 2016 Cost Control Utility O&M 2011 2014 2019 2nd Quartile 3rd Quartile 4th Quartile 1st Quartile Down 8% since 2011 2011 2012 2013 1st Quartile 1st Quartile Residential Industrial 3rd Quartile |
|
|
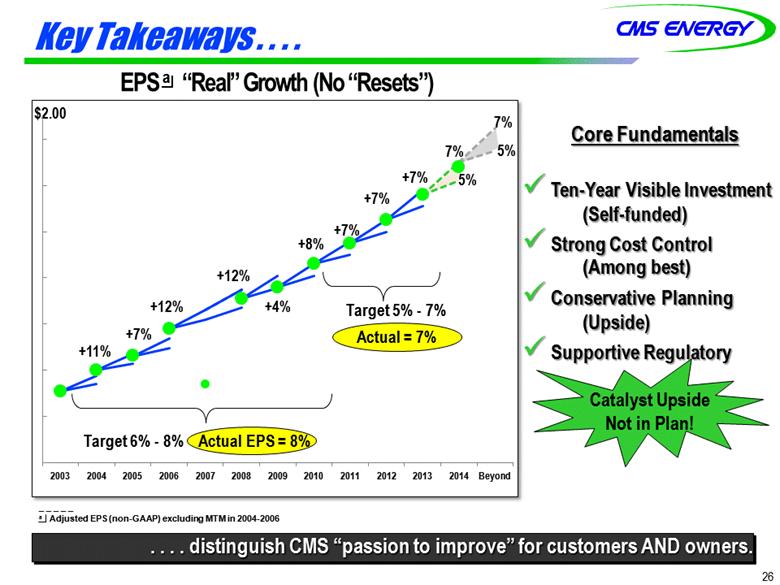
Key Takeaways . . . . 26 . . . . distinguish CMS “passion to improve” for customers AND owners. _ _ _ _ _ a Adjusted EPS (non-GAAP) excluding MTM in 2004-2006 EPS a “Real” Growth (No “Resets”) $2.00 Core Fundamentals Ten-Year Visible Investment Strong Cost Control Conservative Planning Supportive Regulatory Target 5% - 7% Actual = 7% +11% Target 6% - 8% Actual EPS = 8% +7% +12% +12% +4% +7% +7% +7% +8% 7% 5% 7% 5% (Self-funded) (Among best) (Upside) Catalyst Upside Not in Plan! |
|
|
Appendix |
|
|
Capital Expenditures 28 (mils) |
|
|
Capacity Diversity . . . . 29 . . . . evolving to cleaner generation while becoming more cost competitive. 2005 2017 2014 |
|
|
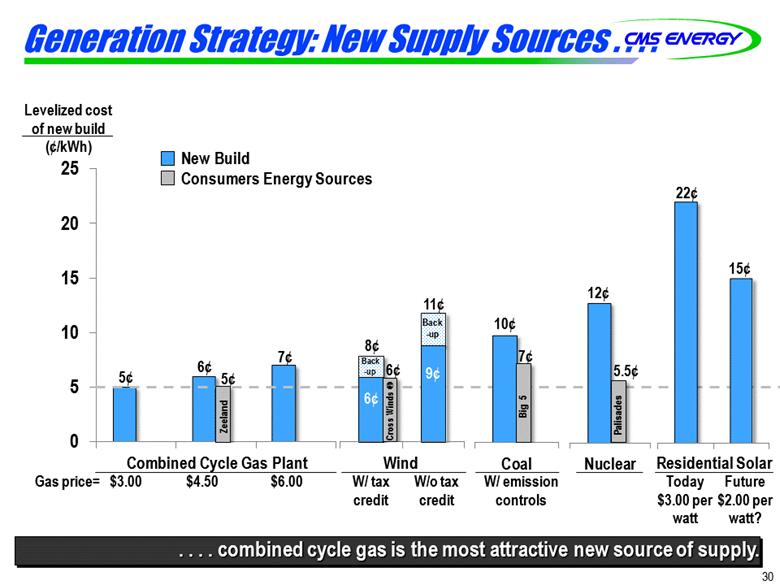
30 Generation Strategy: New Supply Sources . . . . . . . . combined cycle gas is the most attractive new source of supply. Levelized cost of new build (¢/kWh) Gas price= $3.00 $4.50 $6.00 W/ tax credit W/o tax credit W/ emission controls Today $3.00 per watt 5¢ 6¢ 7¢ 6¢ 9¢ 10¢ 12¢ 22¢ 8¢ Back -up 11¢ Back -up 6¢ Wind Combined Cycle Gas Plant Residential Solar 15¢ Future $2.00 per watt? Consumers Energy Sources 5¢ 7¢ 5.5¢ New Build Zeeland Cross Winds 6¢ Big 5 Palisades |
|
|
GAAP Reconciliation |
|
|
32 2003 2004 2005 2006 2007 2008 2009 2010 2011 2012 2013 Reported earnings (loss) per share - GAAP ($0.30) $0.64 ($0.44) ($0.41) ($1.02) $1.20 $0.91 $1.28 $1.58 $1.42 $1.66 After-tax items: Electric and gas utility 0.21 (0.39) - - (0.07) 0.05 0.33 0.03 - 0.17 - Enterprises 0.74 0.62 0.04 (0.02) 1.25 (0.02) 0.09 (0.03) (0.11) (0.01) * Corporate interest and other 0.16 (0.03) 0.04 0.27 (0.32) (0.02) 0.01 * (0.01) * * Discontinued operations (income) loss (0.16) 0.02 (0.07) (0.03) 0.40 (*) (0.08) 0.08 (0.01) (0.03) * Asset impairment charges, net - - 1.82 0.76 0.60 - - - - - - Cumulative accounting changes 0.16 0.01 - - - - - - - - - Adjusted earnings per share, including MTM - non-GAAP $0.81 $0.87 $1.39 $0.57 $0.84 $1.21 (a) $1.26 $1.36 $1.45 $1.55 $1.66 Mark-to-market impacts 0.03 (0.43) 0.51 Adjusted earnings per share, excluding MTM - non-GAAP NA $0.90 $0.96 $1.08 NA NA NA NA NA NA NA * Less than $500 thousand or $0.01 per share. (a) $1.25 excluding discontinued Exeter operations and accounting changes related to convertible debt and restricted stock. Earnings Per Share By Year GAAP Reconciliation (Unaudited) |