Attached files
| file | filename |
|---|---|
| 8-K - BLACK RIDGE OIL & GAS - Sow Good Inc. | brog_8k-081214.htm |
| EX-99.1 - PRESS RELEASE - Sow Good Inc. | brog_8k-ex9901.htm |
Exhibit 99.2

2Q 2014 Financial and Operational Update OTCQB: ANFC Focused Growth in the Williston Basin August 12, 2014

Forward Looking Statements www.blackridgeoil.com 2 Statements made by representatives of Black Ridge Oil & Gas, Inc . (“Black Ridge” or the “Company”) during the course of this presentation that are not historical facts are “forward-looking statements” within the meaning of federal securities laws . These statements are based on certain assumptions and expectations made by the Company which reflect management’s experience, estimates and perception of historical trends, current conditions, anticipated future developments and other factors believed to be appropriate . No assurances can be given that such assumptions and expectations will occur as anticipated and actual results may differ materially from those implied or anticipated in the forward looking statements . Such statements are subject to a number of risks and uncertainties, many of which are beyond the control of the Company, and which include risks relating to the global financial crisis, our ability to obtain additional capital needed to implement our business plan, declines in prices and demand for gas, oil and natural gas liquids, loss of key personnel, lack of business diversification, reliance on strategic third-party relationships, ability to obtain rights to explore and develop oil and gas reserves, the rate of in - fill drilling on our leased acreage, financial performance and results, our indebtedness under our line of credit, our ability to replace reserves and efficiently develop our current reserves, our ability to make acquisitions on economically acceptable terms, our ability to become listed on a national exchange, and other important factors . Black Ridge undertakes no obligation to publicly update any forward-looking statements, whether as a result of new information or future events .

Black Ridge Overview www.blackridgeoil.com 3 (1) Oil & Gas Sales exclude the effect of derivatives (2) “ Drilling” includes wells that are preparing to drill, drilling, awaiting completion, and completing; as of July 31, 2014 (3) Based on 10,000 net acres, 1280 - acre drilling units, and 8 wells per drilling unit . Well Positioned to Take Advantage of Current Phase of Development in t he Williston Basin Pure Play Bakken / Three Forks Non - Operator Production is 90% oil Approximately 10,000 net leasehold acres Non - operator platform – consolidation potential 2Q 2014 Operational and Financial Highlights Rapid Growth 6.4 net wells in production , 1.8 net wells “drilling” (2) Stockyard Creek driving growth, Mandaree next Over 50 net wells of remaining inventory (3) 2Q 14 1Q 14 2Q 13 Annual Change Sequential Change Average Production, BOE/d 715 525 283 +153% +36% Oil & Gas Sales, $MM (1) 5.6 4.0 2.2 +158% +38% Adjusted EBITDA, $MM 3.6 2.4 1.2 +194% +52% Black Ridge Focus Acreage North Dakota Montana Williston Basin Corral Creek Stockyard Creek Mandaree

www.blackridgeoil.com 4 64 64 Typical Spacing Unit: 1,280 Net Acres Well Drilling Process & Timing* Well Permitted Non - Operator Receives “AFE” Non - Operator Elects to Participate Well Drilled Well Completed Well Producing Oil & Gas Well (Operators) • Majority interest owners (operators ) may permit a well on a standard spacing unit . Minority Interest (Non - Operators) • Example: Totals 128 net acres, or 10% of the 1,280 spacing unit. • Minority interest owners have the right to elect to be pooled into a pro - rata share of costs and revenue Day 0 Day 30 Day 60 Day 90 Day 120 Day 180 * Timeline can be shorter or longer depending primarily on factors affecting successful drilling and completion of a well tha t a re both within and beyond the operator’s control. Non - Operator Business Model
Why The Non - Operator Business Model? www.blackridgeoil.com 5 Ability to selectively invest in the highest return projects, without the need to control a drilling unit Knowledge and data from over 300 gross wells to make capital allocation decisions Low cost structure Fragmented nature of non - operator leaseholds will continue to provide growth opportunity as the play matures
Evolution of The Williston Basin www.blackridgeoil.com 6 Phase 1: Land Grab, 2007 - 2009 Leases in heart of play acquired for < $500/acre, 3 - 5 year terms, 81.25% NRI Prolific Estimated Ultimate Recoveries (EUR’s) in Parshall and Sanish fields resulted in high returns that overshadowed mediocre performance outside of core areas Phase 2: HBP (Held By Production) Drilling, 2010 - 2013 Scramble to get first well drilled to avoid lease expiration Drilling / Completion capex and lease costs increase Result: basin - wide IRR% reduction Phase 3: Infill Drilling, Present Day Majority of leases are now Held By Production Operators begin to develop remaining inventory and test spacing between adjacent wells Pad drilling and supply / demand reducing capex costs Improved completion designs are increasing EUR’s IRR% increasing across the basin Non operators need capital to participate in drilling

Why The Bakken and Three Forks? www.blackridgeoil.com 7 World Scale, Oil Weighted Resource Estimates of recoverable oil range from 9 Billion BOE to 24 Billion BOE Stacked pay zones with both Bakken and Three Forks throughout the heart of the development fairway Operating partners transitioning to down spacing, testing 12 to 16 wells per 1,280 acre spacing unit Middle Bakken – 4 wells per 1,280 acre spacing unit Three Forks 1 – 4 wells per 1,280 acre spacing unit Three Forks 2 – Future Potential Upside Three Forks 3 – Future Potential Upside
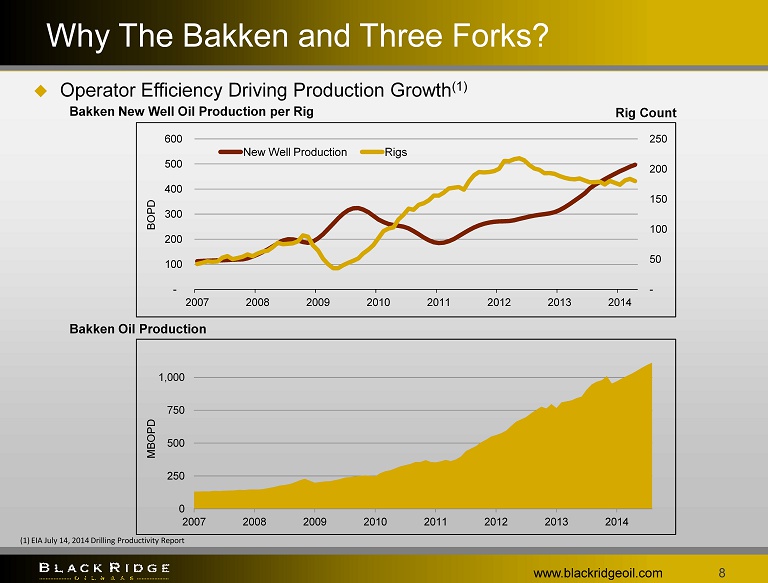
Why The Bakken and Three Forks? www.blackridgeoil.com 8 Operator Efficiency D riving P roduction G rowth (1) (1) EIA July 14, 2014 Drilling Productivity Report 0 250 500 750 1,000 2007 2008 2009 2010 2011 2012 2013 2014 Bakken Oil Production - 50 100 150 200 250 - 100 200 300 400 500 600 2007 2008 2009 2010 2011 2012 2013 2014 New Well Production Rigs Bakken New Well Oil Production per Rig Rig Count BOPD MBOPD

Why The Bakken and Three Forks? www.blackridgeoil.com 9 20% 30% 40% $80 $90 $100 Rate of Return (2) Oil Price, Wellhead $9.7 $8.8 $8 $9 $10 2012 2013 $MM Improving Well Costs (1) (1) Based on average AFE submitted to Black Ridge (2) Assumes $8.5MM drilling & completion capital expenditure, 550Mboe EUR Operator Efficiencies Driving Higher Returns Majority of Bakken acreage is held by production Down - spacing decisions based on returns Pad drilling efficiencies being realized Enhanced Completion Designs Leading to Higher Estimated Ultimate Recoveries (EUR) Cemented liners, plug and perf Economically optimum levels of proppant New completion designs are improving EUR’s by 50% or more
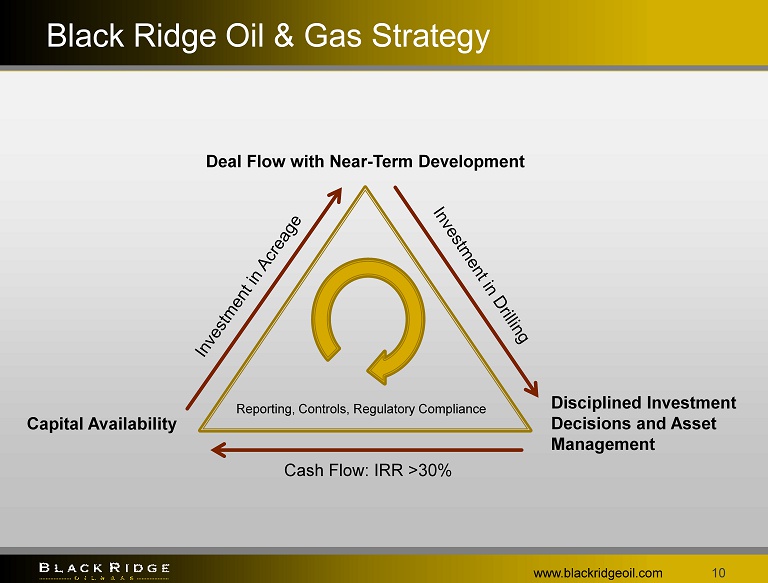
Black Ridge Oil & Gas Strategy www.blackridgeoil.com 10 Deal Flow with Near - Term Development Disciplined Investment D ecisions and Asset Management Capital Availability Reporting, Controls, Regulatory C ompliance Cash Flow: IRR >30%

- 200,000 400,000 600,000 800,000 1,000,000 1,200,000 1,400,000 1 3 5 7 9 11 13 15 17 19 21 23 25 27 29 31 33 35 37 39 41 43 45 47 49 51 53 55 57 59 61 63 65 Fragmented Leaseholders Largest leaseholders are operators, who typically look for leases that give them control of a drilling unit Non - op leaseholders include small, private entities that are typically capital constrained Corral Creek acquisition closed in December 2013, $20.6 MM price $24.6 MM of acquisitions in 2013 Fragmented Leases – Consolidation Opportunity www.blackridgeoil.com 11 Opportunity: More than 1,000,000 Net Acres in the Existing Fairway (1) (1) Data based on publicly available information and internal estimates Opportunity Acres Controlled by Leaseholders
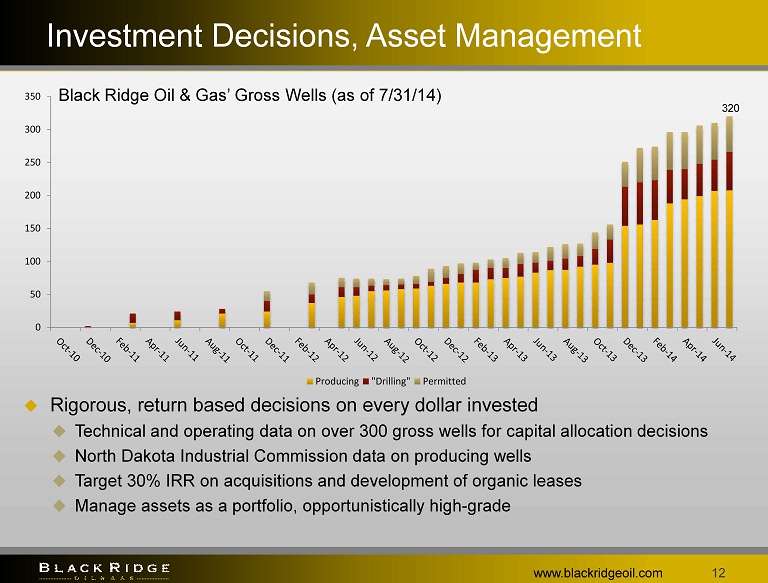
0 50 100 150 200 250 300 350 Producing "Drilling" Permitted Investment Decisions, Asset Management www.blackridgeoil.com 12 320 Black Ridge Oil & Gas’ Gross Wells (as of 7/31/14) Rigorous, return based decisions on every dollar invested Technical and operating data on over 300 gross wells for capital allocation decisions North Dakota Industrial Commission data on producing wells Target 30% IRR on acquisitions and development of organic leases Manage assets as a portfolio, opportunistically high - grade

Liquidity www.blackridgeoil.com 13 Senior Secured Revolving Credit Facility $ 50 MM $20 MM Current Borrowing Base LIBOR + 300 bps to LIBOR + 350 bps depending upon facility usage Subordinated Term Loan $ 75 MM $35 MM Current Availability LIBOR + 900 bps cash, 400 bps PIK Key Highlights: $55 MM total current availability, $44 MM drawn as of June 30, 2014 Sufficient runway to execute aggressive growth strategy

14 29 118 86 88 192 304 222 242 283 308 358 525 715 - 100 200 300 400 500 600 700 800 0 1 2 3 4 5 6 7 8 9 10 Producing "Drilling" Permitted www.blackridgeoil.com 14 Executing Our Growth Strategy 6.4 Black Ridge Oil & Gas’ Net Production BOE/d 1.8 Black Ridge Oil & Gas’ Net Wells (as of 7/31/14) Ratio of net wells drilling to net wells producing leading indicator for strong production growth in 2014 6.4 net wells producing 1.8 net wells “drilling” Near term development Low risk use of capital Visibility on near term development

Production Growth Driving Cash Flow Growth www.blackridgeoil.com 15 1.0 1.2 1.7 2.0 2.4 3.6 0.0 0.5 1.0 1.5 2.0 2.5 3.0 3.5 4.0 $ MM Black Ridge Oil & Gas’ Adjusted EBITDA (1) (1) Adjusted EBITDA is a non - GAAP financial measure. Please see the appendix for a reconciliation of adjusted EBITDA.

Strong Asset Base Driving Growth www.blackridgeoil.com 16 Reserve Category Oil (MBbls) Gas ( Mmcf ) Total (MBOE) SEC PV - 10 ($MM) PDP 895 615 998 $ 32.38 PDNP 32 38 38 $ 1.61 PUD 3,147 2,126 3,502 $ 40.39 Total Proved Reserves 4,074 2,779 4,538 $ 74.38 Year End 2013 Reserve Summary MBOE PV - 10 $MM 7.6 27.9 74.4 0 10 20 30 40 50 60 70 80 0 500 1,000 1,500 2,000 2,500 3,000 3,500 4,000 4,500 5,000 Proved Developed Reserves Proved Undeveloped Reserves PV10 of Proved Reserves 2011 2012 2013 4,538 2,384 480

Corral Creek – Dunn County, ND www.blackridgeoil.com 17 ~30,884 Gross Acres 0.77% Working Interest (WI) 3 Rig Drilling Program, 81 Well Inventory (1) Development Status: • 62 Wells Producing (0.48 Net Wells) • 26 Wells “Drilling” (0.20 Net Wells) • 7 Wells Permitted (0.05Net Wells) ~2748 Gross Acres 6.43% WI 1 Well Producing Lincoln USA 16 - 1H: 283k bbls in 462 days Remaining Inventory (1) : 9+ Wells ~1280 Gross Acres 19.34% WI 2 Wells Producing Gorhman 24 - 31MBH Gorhman 14 - 31TFH Remaining Inventory (1) : 5+ Wells ~1280 Gross Acres 3.10% WI 4 Wells Producing Remaining Inventory (1) : 3+ Wells ~1280 Gross Acres 3.10% WI 3 Wells Producing Remaining Inventory (1) : 4+ Wells Corral Creek Unit Hansen Halliday Lincoln Gorhman Montana North Dakota T147N R93W T147N R95W T147N R94W (1) Remaining Inventory is based upon publicly available NDIC data and internal estimates.

Stockyard Creek - Williams County, ND Eight Gross (0.67 Net) Wells Producing Sail & Anchor 4 - 13 - 14HBK Coopers 2 - 15 - 14HBK Tooheys 4 - 15 - 14HBK Little Creature 1 - 15 - 14HBK Blackdog 3 - 13 - 14H E Rennerfeldt 1 - 13H E Rennerfeldt 2 - 13H Matilda Bay 2 - 15H Eight Gross (0.77 Net) Wells “Drilling” (2) Matilda Bay 1 - 15H Bootleg 4 - 14 - 15TFH Bootleg 5 - 14 - 15TFH Bootleg 6 - 14 - 15TFH Bootleg 7 - 14 - 15TFH Bootleg 8 - 14 - 15TF2H Ironbank 4 - 14 - 13TFH Ironbank 5 - 14 - 13TFH Strong Economics Operated by Slawson Exploration Advanced Completion Design Additional drilling inventory in lower TF benches www.blackridgeoil.com 18 Bakken Three Forks 1 st Bench Montana North Dakota (1) Black Ridge interest excludes three wellbores drilled by previous operator. (2) “ Drilling” includes wells that are preparing to drill, drilling, awaiting completion, and completing; numbers as of July 31, 2014 14 T154N - R99W 15 13 Producing Bakken Wells (1) Bakken Wells To Drill Three Forks Wells To Drill Three Forks 2 nd Bench To Drill

Mandaree – McKenzie County, ND Operator: EOG Resources – Antelope Prospect Five Gross (0.62 net) Wells Drilling, Expected Production Q4 ‘14 Mandaree 17 - 05H Mandaree 135 - 05H Mandaree 110 - 05H Mandaree 134 - 05H Mandaree 28 - 05H Potential Full Development (1) : 28 Gross (3.25 net) Wells on 640 - acre (short lateral) spacing 12 Middle Bakken Wells, 16 Three Forks Wells www.blackridgeoil.com 19 (1) Based on publicly available data, NDIC Case File #22520 1 st Bench 2 nd Bench 3 rd Bench Middle Bakken Three Forks 0 50,000 100,000 150,000 200,000 250,000 1 3 5 7 9 11 13 15 600 MBoe EUR Curve Months of Production Cumulative BOE Recent EOG Antelope Short Lateral Results (2) (2) B ear Den wells, NDIC Well #23267 - 23270 Middle Bakken Lateral Three Forks Lateral Montana North Dakota Black Ridge interest excludes two previously drilled wells (shown in gray).
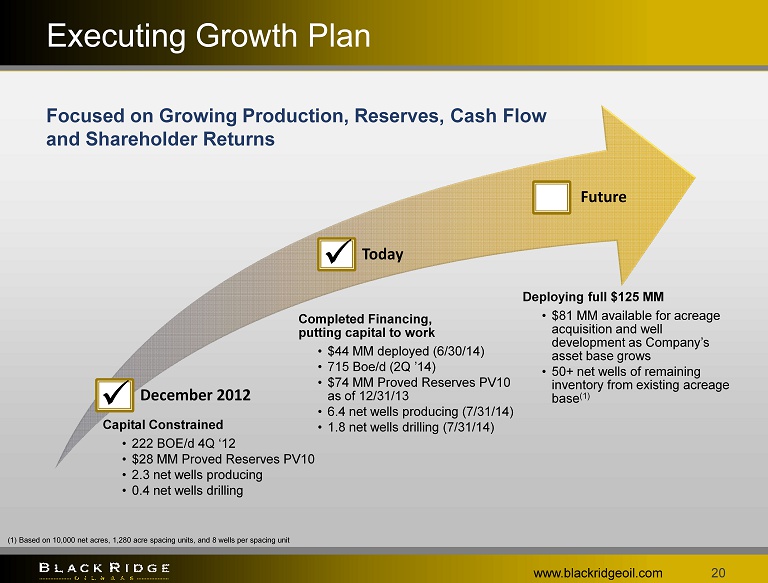
Executing Growth Plan www.blackridgeoil.com 20 Capital Constrained • 222 BOE/d 4Q ‘12 • $28 MM Proved Reserves PV10 • 2.3 net wells producing • 0.4 net wells drilling Completed Financing, putting capital to work • $44 MM deployed (6/30/14) • 715 Boe /d (2Q ’14) • $74 MM Proved Reserves PV10 as of 12/31/13 • 6.4 net wells producing (7/31/14) • 1.8 net wells drilling (7/31/14) Deploying full $125 MM • $81 MM available for acreage acquisition and well development as Company’s asset base grows • 50+ net wells of remaining inventory from existing acreage base (1) x December 2012 Today Future x Focused on Growing Production, Reserves, Cash Flow and Shareholder Returns (1) Based on 10,000 net acres, 1,280 acre spacing units, and 8 wells per spacing unit

Why Invest? www.blackridgeoil.com 21 Positioned for rapid growth in 2014 and beyond Pure play Bakken / Three Forks non - operator with 90% oil - weighted production Liquidity to fund existing development and acquisition plans Strong inventory of high return projects
For More Information www.blackridgeoil.com 22 Ken DeCubellis Chief Executive Officer ken.decubellis@blackridgeoil.com 952 - 426 - 1241 Stay Up to Date on Black Ridge Oil & Gas www.blackridgeoil.com

www.blackridgeoil.com 23 Appendix

Reconciliation of Net Income to Adjusted EBITDA www.blackridgeoil.com 24 Black Ridge Oil & Gas, Inc. Adjusted EBITDA by Quarter March 31, June 30, September 30, December 31, March 31, June 30, 2013 2013 2013 2013 2014 2014 Net income (loss) 313,813$ (297,300)$ (223,664)$ (195,508)$ (381,560)$ (543,360)$ Add Back: Interest expense, net, excluding amortization of warrant based financing costs 222,772 520,284 622,842 706,231 929,378 1,136,603 Income tax provision (433,788) (92,913) (88,708) (83,442) (284,023) (305,715) Depreciation, depletion and amortization 705,536 874,474 1,070,753 1,078,394 1,594,857 2,139,733 Accretion of abandonment liability 1,152 1,811 1,811 4,245 4,505 5,148 Share based compensation 172,453 223,145 263,379 292,662 297,762 301,241 Unrealized loss (gain) on derivatives - - 46,225 167,451 214,035 881,124 Adjusted EBITDA 981,938$ 1,229,501$ 1,692,638$ 1,970,033$ 2,374,954$ 3,614,774$ Three Months Ended