Attached files
| file | filename |
|---|---|
| 8-K - FORM 8-K - EL PASO ELECTRIC CO /TX/ | form8-k06x30x14.htm |
| EX-99.01 - EARNINGS PRESS RELEASE - EL PASO ELECTRIC CO /TX/ | exh990106-30x2014.htm |

Safe Harbor Statement 2 This presentation includes statements that may constitute forward-looking statements made pursuant to the safe harbor provisions of the Private Securities Litigation Reform Act of 1995. This information may involve risks and uncertainties that could cause actual results to differ materially from such forward-looking statements. Factors that could cause or contribute to such differences include, but are not limited to: Increased prices for fuel and purchased power and the possibility that regulators may not permit EE to pass through all such increased costs to customers or to recover previously incurred fuel costs in rates Recovery of capital investments and operating costs through rates in Texas and New Mexico Uncertainties and instability in the general economy and the resulting impact on EE’s sales and profitability Changes in customers’ demand for electricity as a result of energy efficiency initiatives and emerging competing services and technologies Unanticipated increased costs associated with scheduled and unscheduled outages of generating plant The size of our construction program and our ability to complete construction on budget Potential delays in our construction schedule due to legal challenges or other reasons Costs at Palo Verde Deregulation and competition in the electric utility industry Possible increased costs of compliance with environmental or other laws, regulations and policies Possible income tax and interest payments as a result of audit adjustments proposed by the IRS or state taxing authorities Uncertainties and instability in the financial markets and the resulting impact on EE’s ability to access the capital and credit markets Other factors detailed by EE in its public filings with the Securities and Exchange Commission. EE’s filings are available from the Securities and Exchange Commission or may be obtained through EE’s website, http://www.epelectric.com August 6, 2014
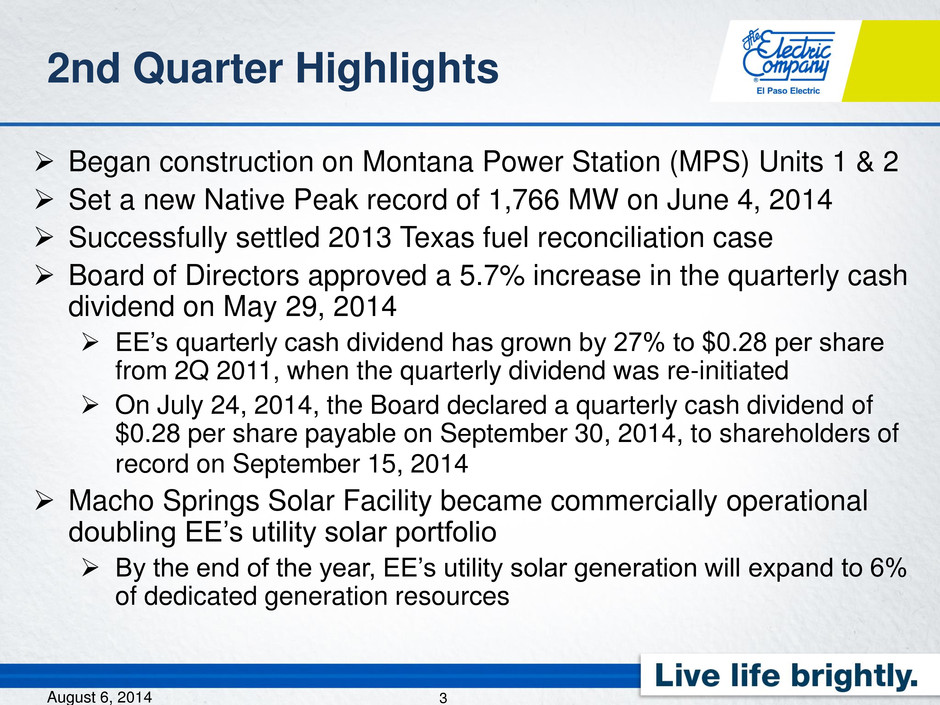
Vision Mission Began construction on Montana Power Station (MPS) Units 1 & 2 Set a new Native Peak record of 1,766 MW on June 4, 2014 Successfully settled 2013 Texas fuel reconciliation case Board of Directors approved a 5.7% increase in the quarterly cash dividend on May 29, 2014 EE’s quarterly cash dividend has grown by 27% to $0.28 per share from 2Q 2011, when the quarterly dividend was re-initiated On July 24, 2014, the Board declared a quarterly cash dividend of $0.28 per share payable on September 30, 2014, to shareholders of record on September 15, 2014 Macho Springs Solar Facility became commercially operational doubling EE’s utility solar portfolio By the end of the year, EE’s utility solar generation will expand to 6% of dedicated generation resources 2nd Quarter Highlights 3 August 6, 2014

Montana Power Station Update 4 Construction began on MPS Units 1 & 2 in late May 2014; commercial operation anticipated by the summer peak of 2015 Received final order in New Mexico approving the CCN’s for MPS Units 3 & 4 on June 11, 2014 and final approval in Texas on July 11, 2014 Once complete, the four state of the art LMS-100 units at MPS will add 352 MW of efficient, clean burning natural gas power August 6, 2014

MPS Transmission Lines and Distribution Operation Center Update 5 EE filed three CCN applications with the PUCT for transmission lines required for the MPS The PUCT issued a final order approving the MPS to Caliente line (Docket No. 41360) on March 10, 2014 The MPS In & Out and MPS to Montwood applications were recommended for approval and a final order is expected on August 7, 2014 (Docket No.’s 41359 & 41809) August 6, 2014 The Eastside Distribution Operation Center is under construction and is expected to be completed by early 2015

Five Year Cash Capital Expenditures 6 $0 $50,000 $100,000 $150,000 $200,000 $250,000 $300,000 $350,000 2014E 2015E 2016E 2017E 2018E EE Estimated Costs Generation Transmission Distribution General $316mm $256mm $249mm $209mm $233mm ($000’s) August 6, 2014
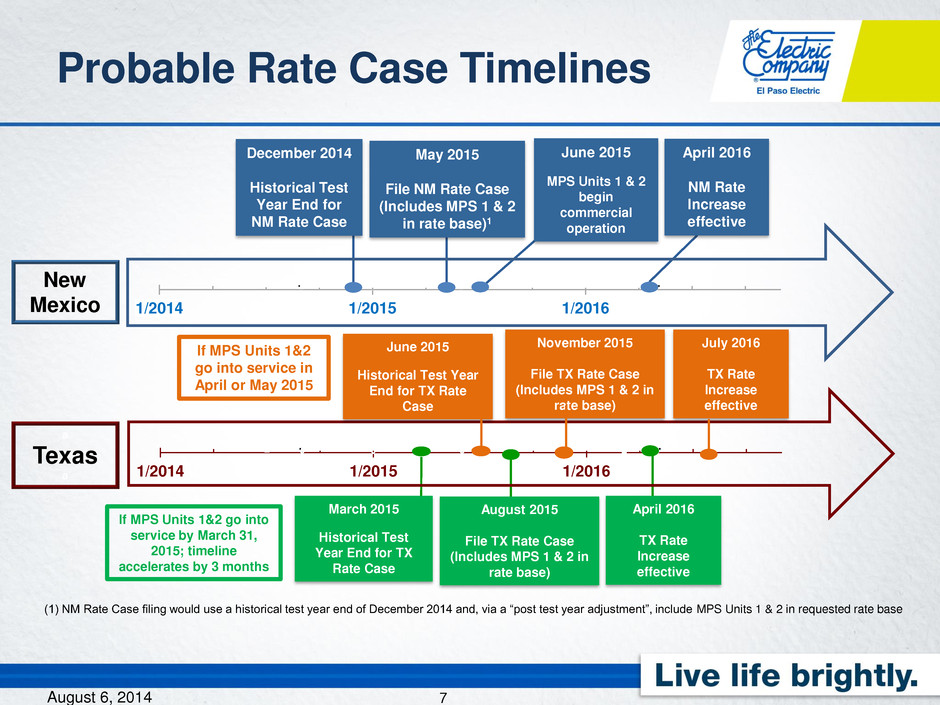
1/2014 1/2015 1/2016 1/2014 1/2015 1/2016 Probable Rate Case Timelines 7 New Mexico December 2014 Historical Test Year End for NM Rate Case May 2015 File NM Rate Case (Includes MPS 1 & 2 in rate base)1 April 2016 NM Rate Increase effective June 2015 MPS Units 1 & 2 begin commercial operation a Texas a June 2015 Historical Test Year End for TX Rate Case November 2015 File TX Rate Case (Includes MPS 1 & 2 in rate base) July 2016 TX Rate Increase effective (1) NM Rate Case filing would use a historical test year end of December 2014 and, via a “post test year adjustment”, include MPS Units 1 & 2 in requested rate base August 6, 2014 March 2015 Historical Test Year End for TX Rate Case August 2015 File TX Rate Case (Includes MPS 1 & 2 in rate base) April 2016 TX Rate Increase effective If MPS Units 1&2 go into service in April or May 2015 If MPS Units 1&2 go into service by March 31, 2015; timeline accelerates by 3 months
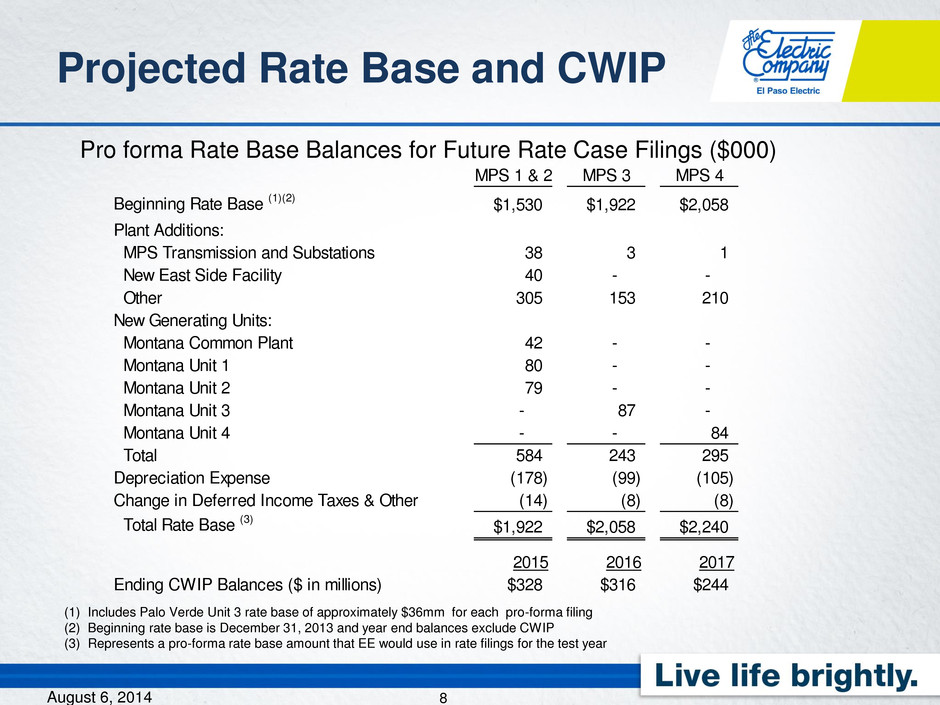
Projected Rate Base and CWIP 8 Pro forma Rate Base Balances for Future Rate Case Filings ($000) (1) Includes Palo Verde Unit 3 rate base of approximately $36mm for each pro-forma filing (2) Beginning rate base is December 31, 2013 and year end balances exclude CWIP (3) Represents a pro-forma rate base amount that EE would use in rate filings for the test year MPS 1 & 2 MPS 3 MPS 4 Beginning Rate Base (1)(2) $1,530 $1,922 $2,058 Plant Additions: MPS Transmission and Substations 38 3 1 New East Side Facility 40 - - Other 305 153 210 New Generating Units: Montana Common Plant 42 - - Montana Unit 1 80 - - Montana Unit 2 79 - - Montana Unit 3 - 87 - Montana Unit 4 - - 84 Total 584 243 295 Depreciation Expense (178) (99) (105) Chang in Deferred Income Taxes & Other (14) (8) (8) Total Rate Base (3) $1,922 $2,058 $2,240 2015 2016 2017 Ending CWIP Balances ($ in millions) $328 $316 $244 August 6, 2014

Vision Mission 2nd Quarter 2014 net income of $30.1 million or $0.75 per share, compared to 2nd Quarter 2013 net income of $29.2 million or $0.73 per basic share YTD 2014 net income of $34.7 million or $0.86 per share, compared to YTD 2013 net income of $36.8 million or $0.92 per share 2014 Financial Results 9 August 6, 2014
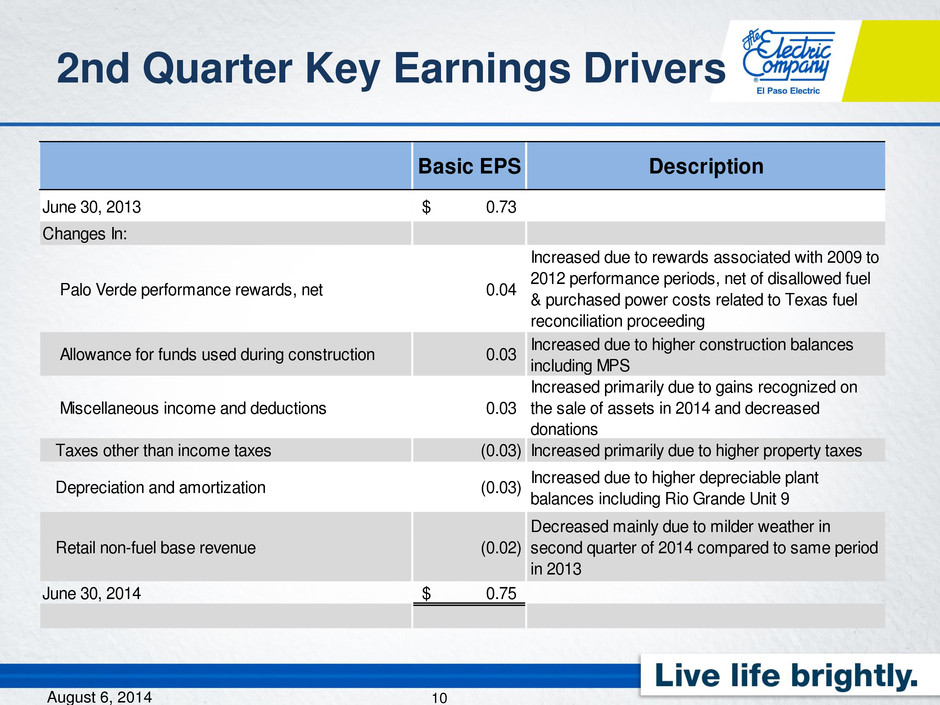
Vision Mission 2nd Quarter Key Earnings Drivers 10 Basic EPS Description June 30, 2013 0.73$ Changes In: Palo Verde performance rewards, net 0.04 Increased due to rewards associated with 2009 to 2012 performance periods, net of disallowed fuel & purchased power costs related to Texas fuel reconciliation proceeding Allowance for funds used during construction 0.03 Increased due to higher construction balances including MPS Miscellaneous income and deductions 0.03 Increased primarily due to gains recognized on the sale of assets in 2014 and decreased donations Taxes other than income taxes (0.03) Increased primarily due to higher property taxes Depreciation and amortization (0.03) Increased due to higher depreciable plant balances including Rio Grande Unit 9 Retail no -fuel base revenue (0.02) Decreased mainly due to milder weather in second quarter of 2014 compared to same period in 2013 June 30, 2014 0.75$ August 6, 2014

Vision Mission Changes in Retail Revenues and Sales 11 Non-Fuel Base Revenue (000's) Percent Change MWH Percent Change Residential 105,422$ (4.4%) 1,193,033 (5.2%) C&I Small 85,796 (0.8%) 1,114,549 (1.6%) C&I Large 18,291 (1.5%) 518,665 (3.4%) Public Authorities 44,571 0.3% 777,958 (2.3%) Total Retail 254,080$ (2.2%) 3,604,205 (3.2%) Heating Degree Days 1,042 (26.6%) Cooling Degree Days 1,120 (4.4%) Average Retail Customers 395,661 1.4% June YTD 2014 Compared to June YTD 2013 August 6, 2014

Vision Mission Changes in Retail Revenues and Sales 12 Non-Fuel Base Revenue (000's) Percent Change MWH Percent Change Residential 59,828$ (1.3%) 650,003 (1.5%) C&I Small 53,675 (0.1%) 620,630 (1.7%) C&I Large 9,963 (0.6%) 292,113 (0.1%) Public Authorities 26,915 0.1% 434,930 (0.5%) Total Retail 150,381$ (0.6%) 1,997,676 (1.1%) Heating Degree Days 84 3.7% Cooling Degree Days 1,095 (3.8%) Average Retail Customers 396,674 1.4% Q2 2014 Compared to Q2 2013 August 6, 2014

Historical Weather Analysis August 6, 2014 13 1,178 1,138 1,095 900 1,000 1,100 1,200 2012 2013 2014 Q2 CDDs CDD's 10-Year Average Mild weather has had a significant impact on 2014 YTD revenues 1Q 2014 HDD’s were 958 compared to 1,338 HDD’s observed in 1Q 2013, which represents a 28.4% reduction 2Q 2014 CDD’s were 1,095 compared to 1,138 CDD’s observed in 2Q 2013, which represents a 3.8% reduction 1,159 1,338 958 900 1,100 1,300 1,500 2012 2013 2014 Q1 HDDs HDD's 10-Year Average 10-Year HDD Average 1,186 10-Year CDD Average 1,051

Historical Weather Analysis 1,291 1,040 1,375 1,274 1,112 1,478 1,305 1,209 1,419 1,042 944 1,162 857 1,032 1,050 1,004 1,210 1,215 1,171 1,120 750 1,250 2005 2006 2007 2008 2009 2010 2011 2012 2013 2014 June YTD Degree Days HDD CDD 10 Year HDD Avg 10 Year CDD Avg 10-Yr HDD Average – 1,255 10-Yr CDD Average – 1,077 August 6, 2014 14

Native System Peak Load Growth 15 1,000 1,100 1,200 1,300 1,400 1,500 1,600 1,700 1,800 2003 2004 2005 2006 2007 2008 2009 2010 2011 2012 2013 2014 1,308 1,332 1,376 1,428 1,508 1,524 1,571 1,616 1,714 1,688 1,750 1,766 Native System Peak, MW Set new Native System Peak on June 4, 2014 (at the time of peak the contribution from solar was approximately 89 MW) August 6, 2014

Vision Mission Customer & Population Growth 16 August 6, 2014 100,000 300,000 500,000 700,000 900,000 1,100,000 2004 2005 2006 2007 2008 2009 2010 2011 2012 2013 EP & Dona Ana Pop 902,591 917,294 938,496 953,431 970,785 992,160 1,009,880 1,031,203 1,042,552 1,041,178 EE Res Customers 296,435 304,031 311,923 317,091 322,618 328,553 334,729 339,860 345,567 349,629 El Paso & Dona Ana County Population & EE Residential Customer Growth EP & Dona Ana Pop EE Res Customers CAGR 1.6% CAGR 1.9% Source: U.S. Bureau of Census and Real Estate Center at Texas A&M University

Vision Mission We are narrowing our earnings guidance range for 2014 to $2.15 - $2.40 per share from $2.10 - $2.50 2014 Earnings Guidance 17 August 6, 2014

Vision Mission Expect to issue long-term debt in late 2014 or early 2015 EE has expended $106mm for additions to utility plant for the six months ended June 30, 2014 Capital expenditures for utility plant in 2014 are anticipated to be approximately $316mm EE made $22mm in dividend payments for the six months ended June 30, 2014 At June 30, 2014, EE had liquidity of $215mm including a cash balance of $13mm and unused capacity under the revolving credit facility Capital Requirements and Liquidity 18 August 6, 2014

Q & A 19 August 6, 2014
