Attached files
| file | filename |
|---|---|
| 8-K - FORM 8-K - TRICO BANCSHARES / | d766200d8k.htm |
Exhibit 99.1
| Richard P. Smith, President & CEO Keefe Bruyette and Woods Banking Conference New York, NY July 29, 2014 |
| SAFE HARBOR STATEMENT Certain comments included in this presentation may involve forward- looking statements, for which TriCo claims the protection of the "safe harbor" provisions created by Federal securities laws. Such forward- looking statements are subject to risks and uncertainties which may cause TriCo's actual results to differ materially from those contemplated by such statements. Additional information concerning certain of these risks and uncertainties are described in TriCo's Annual Report on Form 10-K for the fiscal year ended December 31, 2013 and TriCo's Quarterly Reports on Form 10-Q as filed with the SEC in fiscal 2014. 2 |
| AGENDA Company Overview Recent Activities & Focus Merger announcement Key Revenue Drivers Challenges & Opportunities Financials Questions 3 |
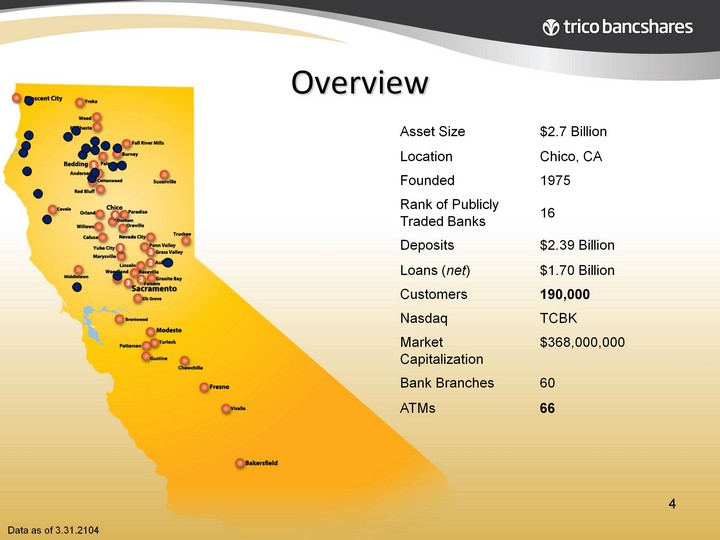
| Overview Data as of 3.31.2104 Asset Size $2.7 Billion Location Chico, CA Founded 1975 Rank of Publicly Traded Banks 16 Deposits $2.39 Billion Loans (net) $1.70 Billion Customers 190,000 Nasdaq TCBK Market Capitalization $368,000,000 Bank Branches 60 ATMs 66 4 |
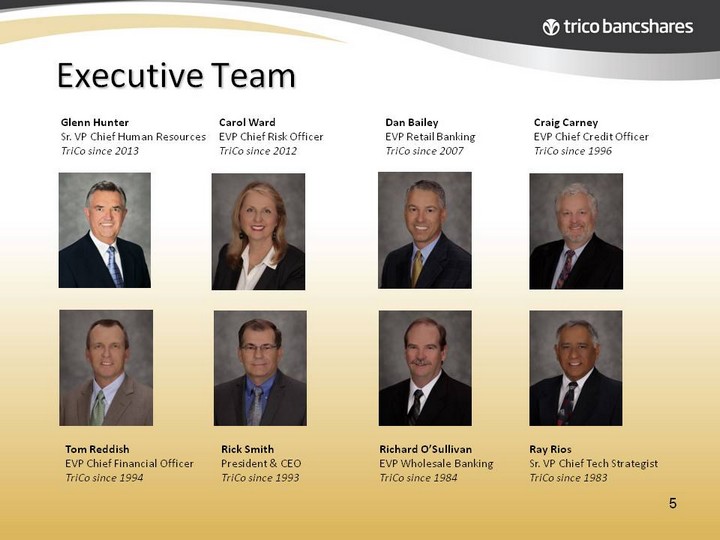
| Executive Team Rick Smith President & CEO TriCo since 1993 Tom Reddish EVP Chief Financial Officer TriCo since 1994 Richard O'Sullivan EVP Wholesale Banking TriCo since 1984 Craig Carney EVP Chief Credit Officer TriCo since 1996 Glenn Hunter Sr. VP Chief Human Resources TriCo since 2013 Ray Rios Sr. VP Chief Tech Strategist TriCo since 1983 Dan Bailey EVP Retail Banking TriCo since 2007 Carol Ward EVP Chief Risk Officer TriCo since 2012 5 |
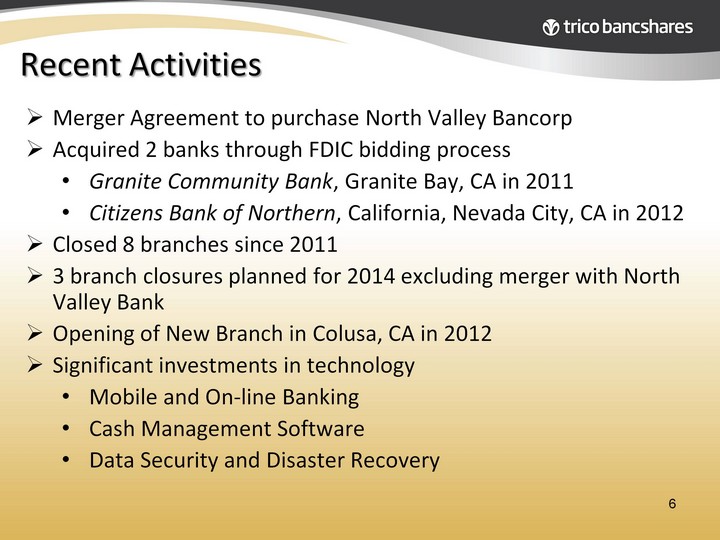
| Recent Activities Merger Agreement to purchase North Valley Bancorp Acquired 2 banks through FDIC bidding process Granite Community Bank, Granite Bay, CA in 2011 Citizens Bank of Northern, California, Nevada City, CA in 2012 Closed 8 branches since 2011 3 branch closures planned for 2014 excluding merger with North Valley Bank Opening of New Branch in Colusa, CA in 2012 Significant investments in technology Mobile and On-line Banking Cash Management Software Data Security and Disaster Recovery 6 |
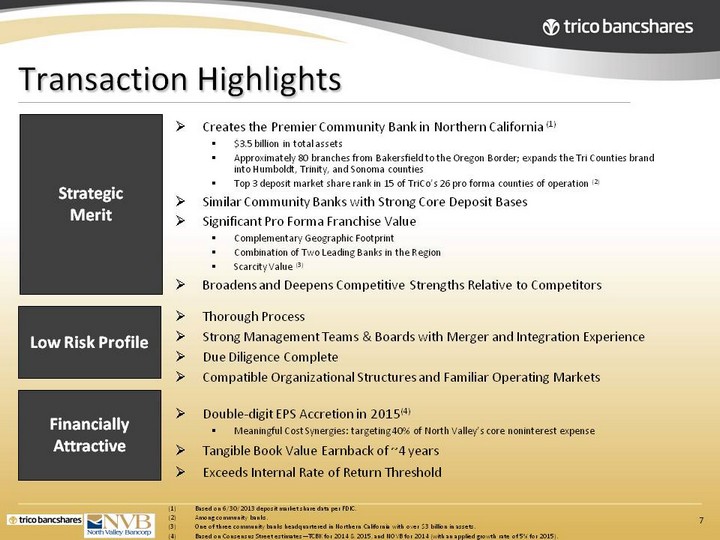
| Transaction Highlights Creates the Premier Community Bank in Northern California (1) $3.5 billion in total assets Approximately 80 branches from Bakersfield to the Oregon Border; expands the Tri Counties brand into Humboldt, Trinity, and Sonoma counties Top 3 deposit market share rank in 15 of TriCo's 26 pro forma counties of operation (2) Similar Community Banks with Strong Core Deposit Bases Significant Pro Forma Franchise Value Complementary Geographic Footprint Combination of Two Leading Banks in the Region Scarcity Value (3) Broadens and Deepens Competitive Strengths Relative to Competitors Strategic Merit Financially Attractive Based on 6/30/2013 deposit market share data per FDIC. Among community banks. One of three community banks headquartered in Northern California with over $3 billion in assets. Based on Consensus Street estimates-TCBK for 2014 & 2015, and NOVB for 2014 (with an applied growth rate of 5% for 2015). Double-digit EPS Accretion in 2015(4) Meaningful Cost Synergies: targeting 40% of North Valley's core noninterest expense Tangible Book Value Earnback of ~4 years Exceeds Internal Rate of Return Threshold Low Risk Profile Thorough Process Strong Management Teams & Boards with Merger and Integration Experience Due Diligence Complete Compatible Organizational Structures and Familiar Operating Markets 7 |
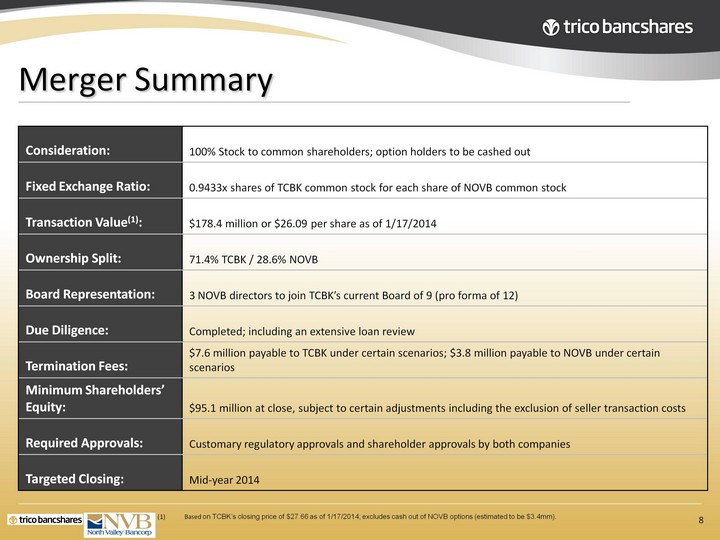
| Merger Summary Based on TCBK's closing price of $27.66 as of 1/17/2014; excludes cash out of NOVB options (estimated to be $3.4mm). Consideration: 100% Stock to common shareholders; option holders to be cashed out Fixed Exchange Ratio: 0.9433x shares of TCBK common stock for each share of NOVB common stock Transaction Value(1): $178.4 million or $26.09 per share as of 1/17/2014 Ownership Split: 71.4% TCBK / 28.6% NOVB Board Representation: 3 NOVB directors to join TCBK's current Board of 9 (pro forma of 12) Due Diligence: Completed; including an extensive loan review Termination Fees: $7.6 million payable to TCBK under certain scenarios; $3.8 million payable to NOVB under certain scenarios Minimum Shareholders' Equity: $95.1 million at close, subject to certain adjustments including the exclusion of seller transaction costs Required Approvals: Customary regulatory approvals and shareholder approvals by both companies Targeted Closing: Mid-year 2014 8 |
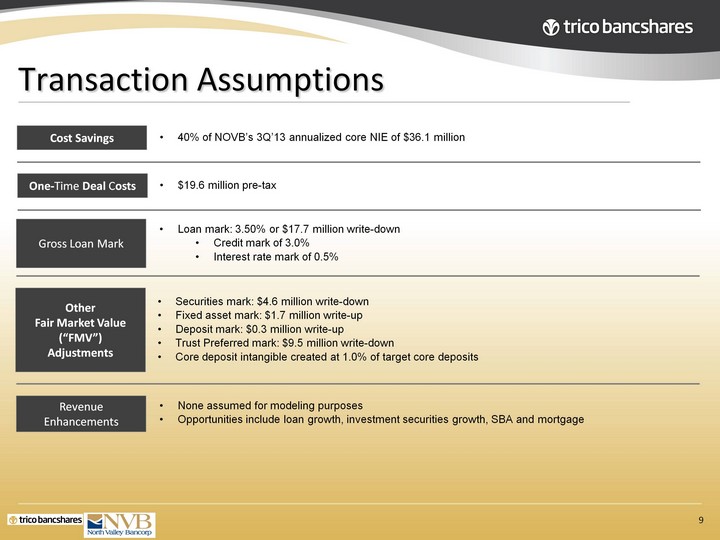
| Transaction Assumptions 40% of NOVB's 3Q'13 annualized core NIE of $36.1 million $19.6 million pre-tax Cost Savings Other Fair Market Value ("FMV") Adjustments One-Time Deal Costs Securities mark: $4.6 million write-down Fixed asset mark: $1.7 million write-up Deposit mark: $0.3 million write-up Trust Preferred mark: $9.5 million write-down Core deposit intangible created at 1.0% of target core deposits Gross Loan Mark Loan mark: 3.50% or $17.7 million write-down Credit mark of 3.0% Interest rate mark of 0.5% Revenue Enhancements None assumed for modeling purposes Opportunities include loan growth, investment securities growth, SBA and mortgage 9 |
| Positioned for today, prepared for the future. Strong and growing bank capital Competitive product set to compete with banks both large and small Superior reputation versus large bank competitors Continue to see organic growth in current environment Strong focus on risk management and new regulatory realities Experienced project teams well prepared for continued growth through acquisition 10 |
| What is long term success? A winning culture with a motivated and talented work force Significant and growing market share Low cost core deposit base Diversified revenues sources Efficient operations Strong risk management practices Rewarding our shareholders 11 |
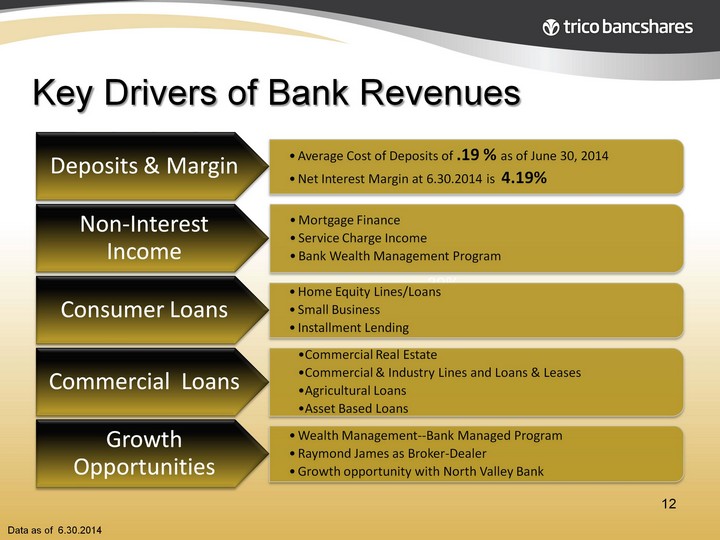
| Data as of 6.30.2014 39% Key Drivers of Bank Revenues 12 |
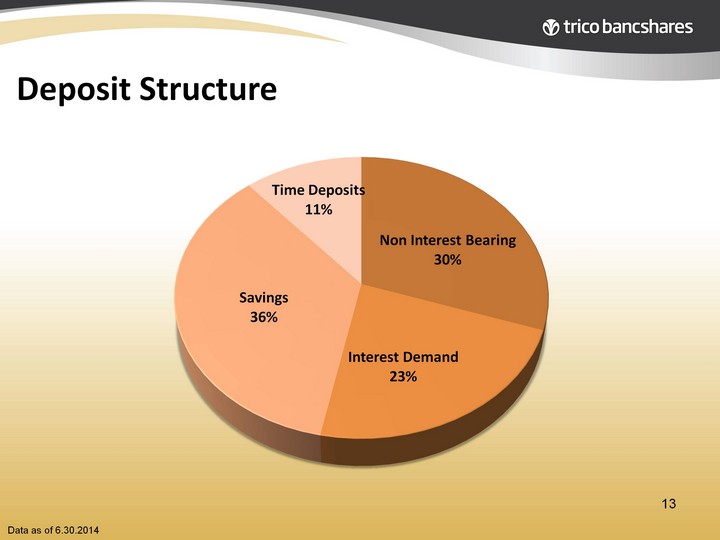
| Data as of 6.30.2014 13 (CHART) |
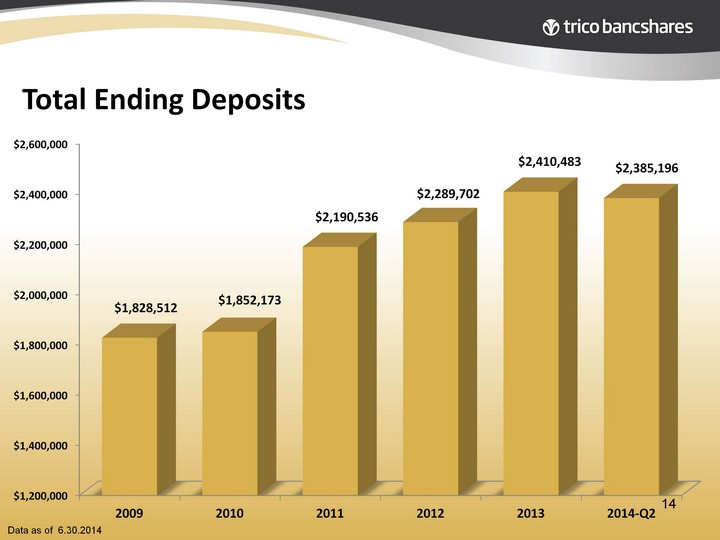
| Data as of 6.30.2014 14 (CHART) |
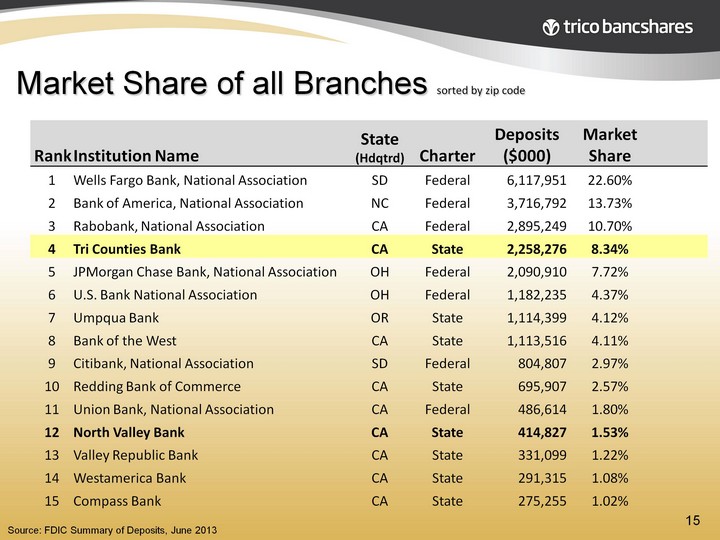
| Market Share of all Branches sorted by zip code Source: FDIC Summary of Deposits, June 2013 Rank Institution Name State (Hdqtrd) Charter Deposits ($000) Market Share 1 Wells Fargo Bank, National Association SD Federal 6,117,951 22.60% 2 Bank of America, National Association NC Federal 3,716,792 13.73% 3 Rabobank, National Association CA Federal 2,895,249 10.70% 4 Tri Counties Bank CA State 2,258,276 8.34% 5 JPMorgan Chase Bank, National Association OH Federal 2,090,910 7.72% 6 U.S. Bank National Association OH Federal 1,182,235 4.37% 7 Umpqua Bank OR State 1,114,399 4.12% 8 Bank of the West CA State 1,113,516 4.11% 9 Citibank, National Association SD Federal 804,807 2.97% 10 Redding Bank of Commerce CA State 695,907 2.57% 11 Union Bank, National Association CA Federal 486,614 1.80% 12 North Valley Bank CA State 414,827 1.53% 13 Valley Republic Bank CA State 331,099 1.22% 14 Westamerica Bank CA State 291,315 1.08% 15 Compass Bank CA State 275,255 1.02% 15 |
| Consistently Represents Approximately 25+% of Total Bank Revenues Residential Home Mortgage Lending Refinances have slowed to low levels Increasing numbers of purchase transactions but overall slow activity Wealth Management Revenues New opportunities with North Valley Bank Lower revenues from service charges but increased interchange income and vendor contracts Non-Interest Income Non-Interest Income 16 |
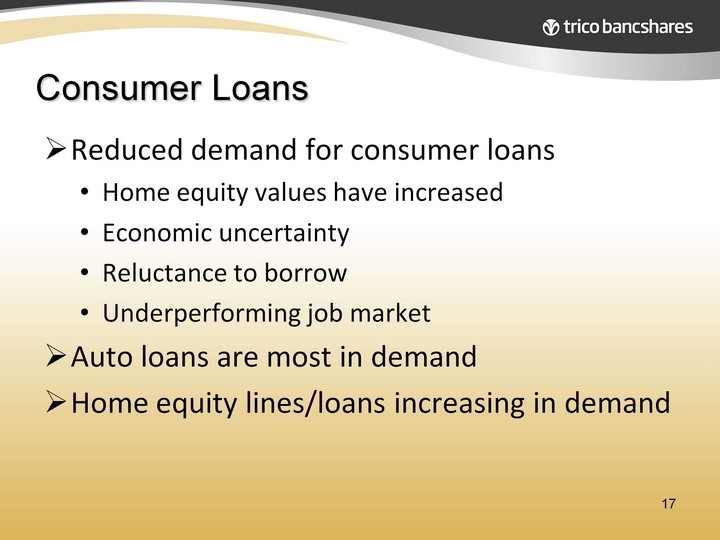
| Reduced demand for consumer loans Home equity values have increased Economic uncertainty Reluctance to borrow Underperforming job market Auto loans are most in demand Home equity lines/loans increasing in demand Consumer Loans 17 |
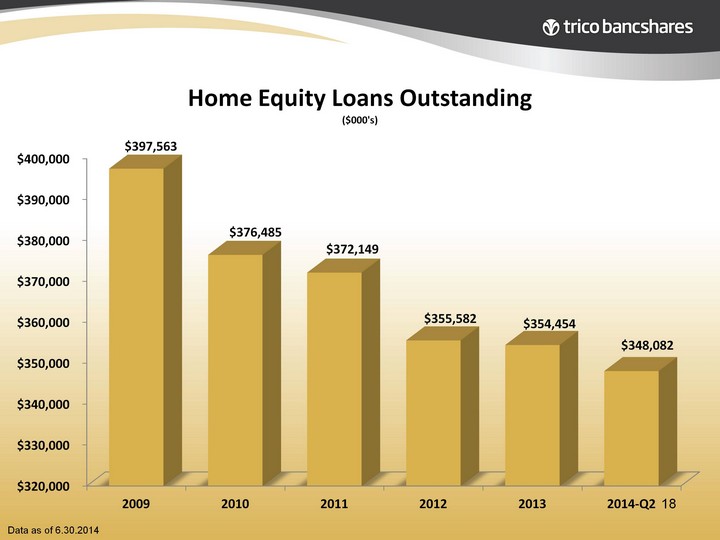
| Data as of 6.30.2014 18 (CHART) |
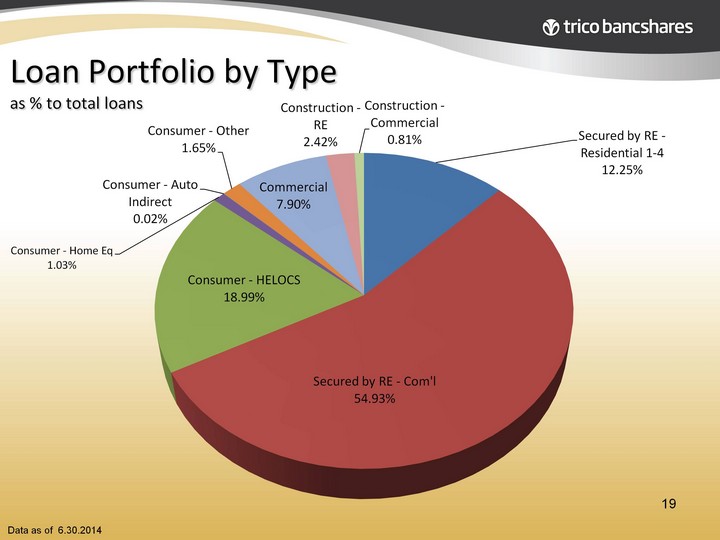
| Loan Portfolio by Type as % to total loans Data as of 6.30.2014 19 (CHART) |
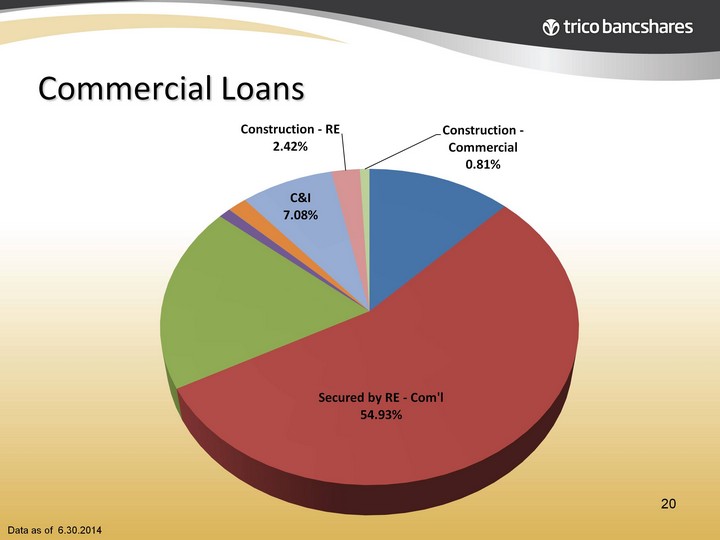
| 20 Commercial Loans Data as of 6.30.2014 (CHART) |
| Commercial Banking Target loans of $500,000 to $3,000,000 Borrowing relationships up to $15,000,000 Personalized banking Assigned Relationship Managers Assigned Cash Management Officers In-market lending Agricultural lending Loans <$1,000,000 served through alternate channel Business Relationship Bankers Credit scoring combined with traditional underwriting 21 |
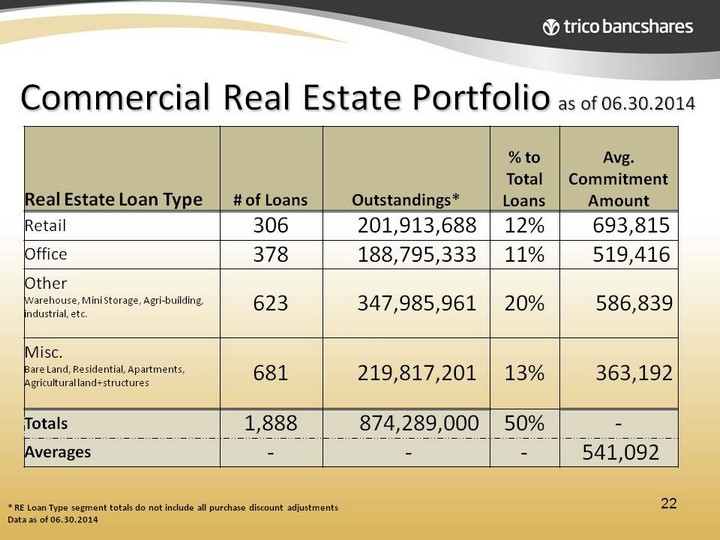
| Commercial Real Estate Portfolio as of 06.30.2014 * RE Loan Type segment totals do not include all purchase discount adjustments Data as of 06.30.2014 Real Estate Loan Type # of Loans Outstandings* % to Total Loans Avg. Commitment Amount Retail 306 201,913,688 12% 693,815 Office 378 188,795,333 11% 519,416 Other 623 347,985,961 20% 586,839 Warehouse, Mini Storage, Agri-building, industrial, etc. 623 347,985,961 20% 586,839 Misc. 681 219,817,201 13% 363,192 Bare Land, Residential, Apartments, Agricultural land+structures 681 219,817,201 13% 363,192 Totals 1,888 874,289,000 50% - Averages - - - 541,092 22 |
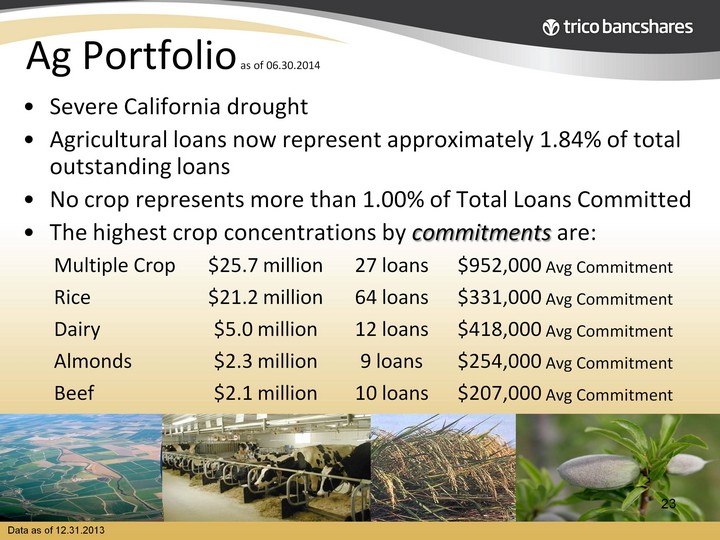
| Ag Portfolio as of 06.30.2014 Severe California drought Agricultural loans now represent approximately 1.84% of total outstanding loans No crop represents more than 1.00% of Total Loans Committed The highest crop concentrations by commitments are: Data as of 12.31.2013 Multiple Crop $25.7 million 27 loans $952,000 Avg Commitment Rice $21.2 million 64 loans $331,000 Avg Commitment Dairy $5.0 million 12 loans $418,000 Avg Commitment Almonds $2.3 million 9 loans $254,000 Avg Commitment Beef $2.1 million 10 loans $207,000 Avg Commitment 23 |
| Residential Construction and A&D Outstanding Totals A&D total approx. $56,246,000 Residential construction approx. $42,097,000 Commercial construction approx. $14,149,000 Total cnstruction, land development and land acquisition loans represent 3.2% of total loans outstanding Data as of 6.30.2014 24 |
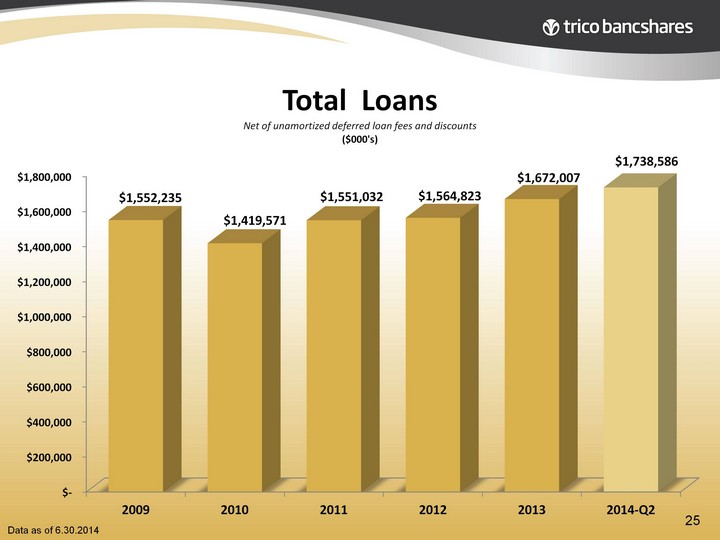
| Data as of 6.30.2014 (CHART) 25 |
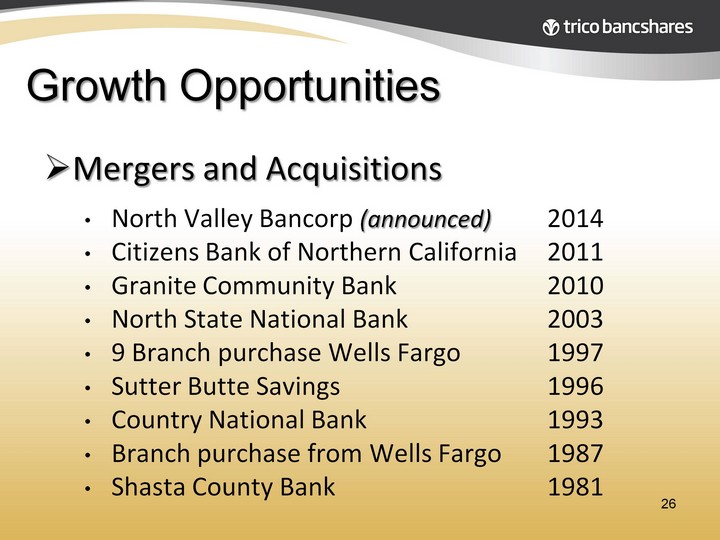
| Mergers and Acquisitions North Valley Bancorp (announced) 2014 Citizens Bank of Northern California 2011 Granite Community Bank 2010 North State National Bank 2003 9 Branch purchase Wells Fargo 1997 Sutter Butte Savings 1996 Country National Bank 1993 Branch purchase from Wells Fargo 1987 Shasta County Bank 1981 Growth Opportunities 26 |
| What keeps us up at night? Aggressive Competitors Bank Regulation The Cost of Compliance with New Regulations Economic Malaise Near Zero Interest Interest Rate Risk Slow residential Real Estate Market Conditions Dysfunction in Washington 27 |
| Challenges Within Bank Strategies Big Banks Aggressive banking in community bank space Bad reputations Technology and Banking New competitors like Google and Apple Bank Operations and Efficiency Managing multiple delivery channels Enterprise Risk Management Many threats, so little time 28 |
| Financials |
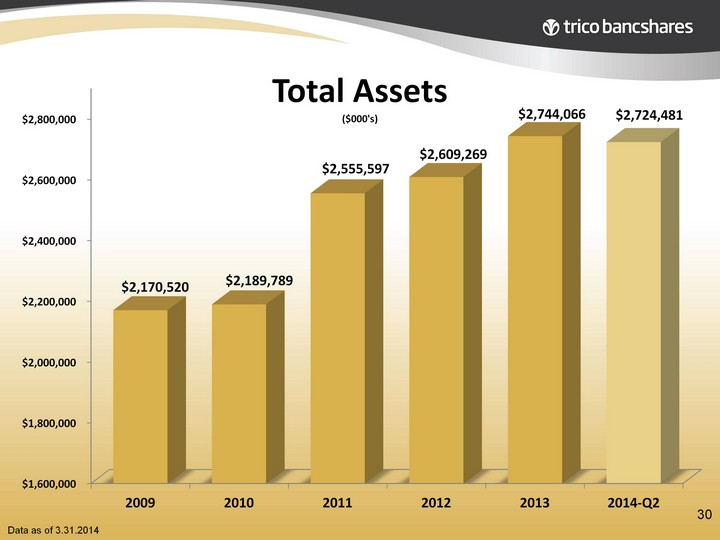
| Data as of 3.31.2014 (CHART) 30 |
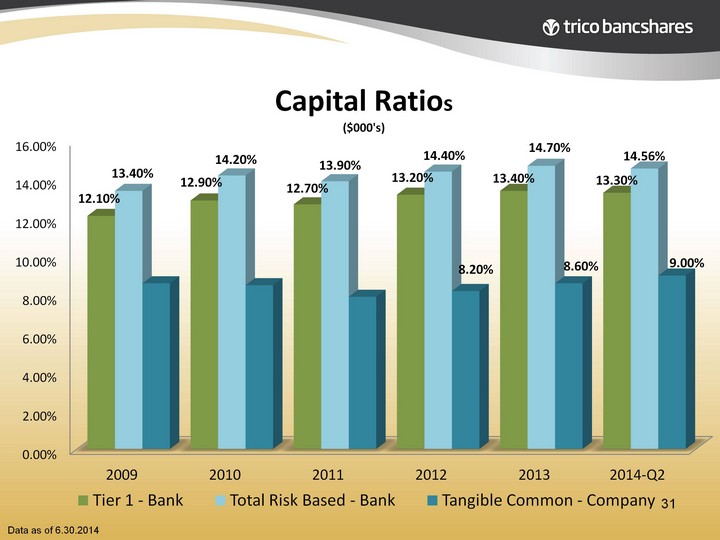
| Data as of 6.30.2014 31 (CHART) |
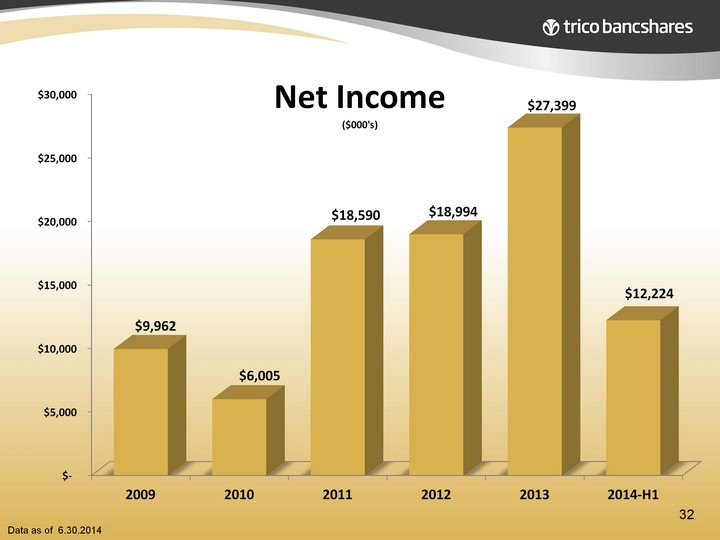
| Data as of 6.30.2014 (CHART) 32 |
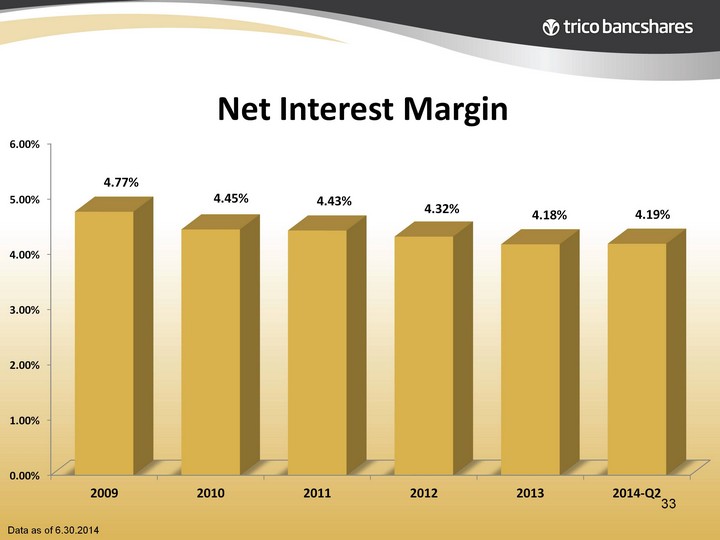
| Data as of 6.30.2014 33 (CHART) |
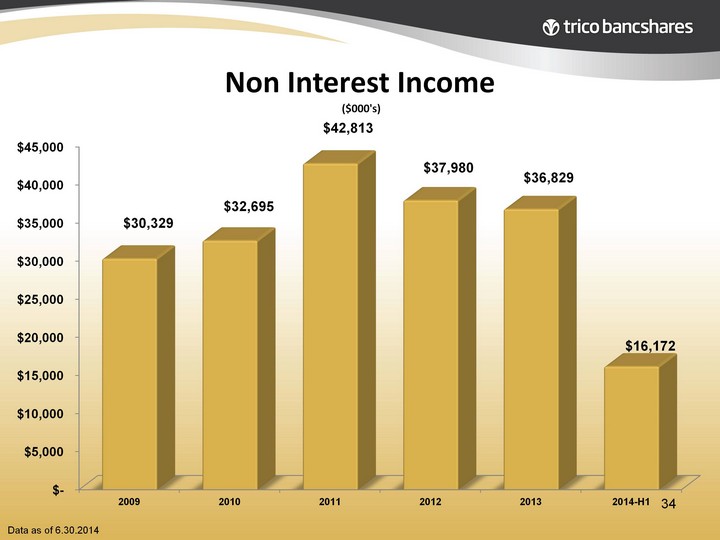
| Data as of 6.30.2014 34 (CHART) |
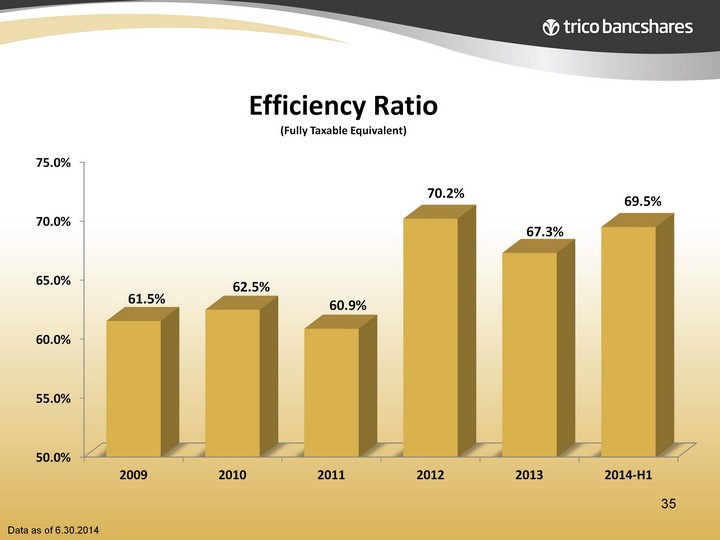
| Data as of 6.30.2014 35 (CHART) |
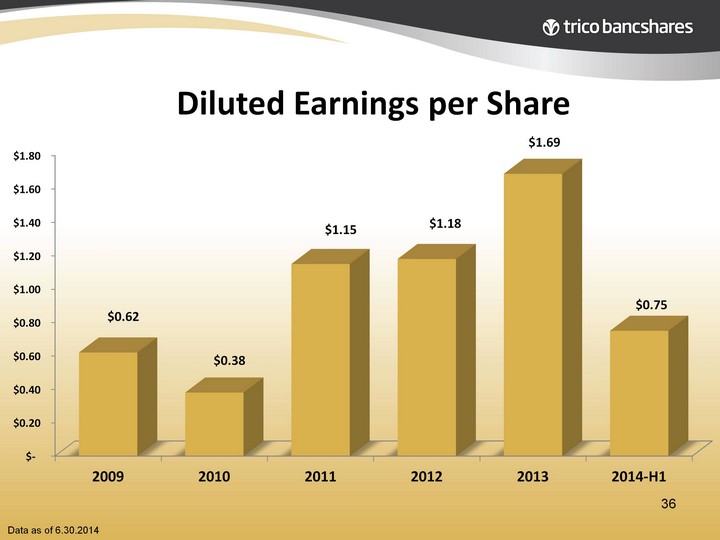
| Data as of 6.30.2014 36 (CHART) |
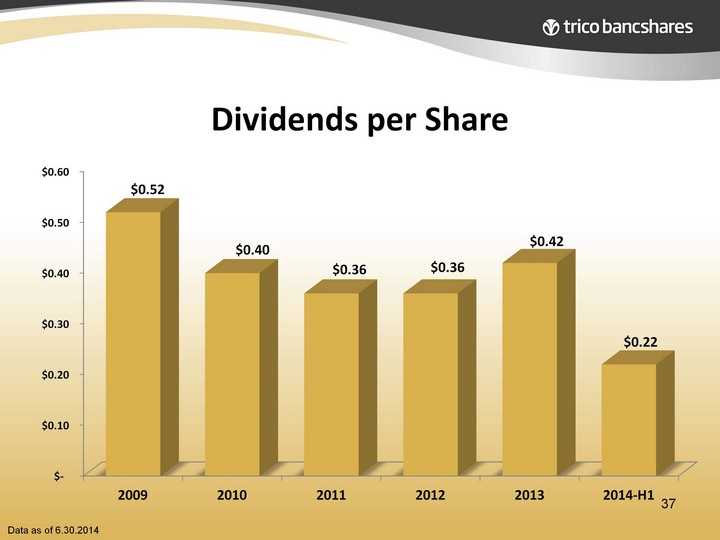
| Data as of 6.30.2014 37 (CHART) |
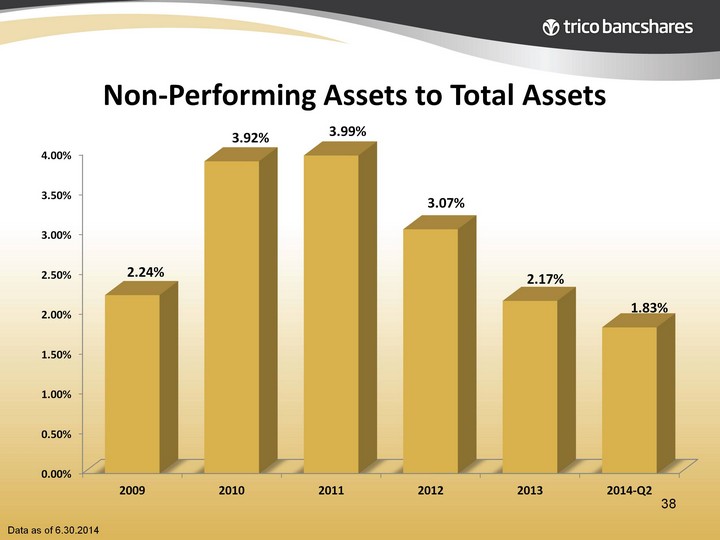
| Data as of 6.30.2014 38 (CHART) |
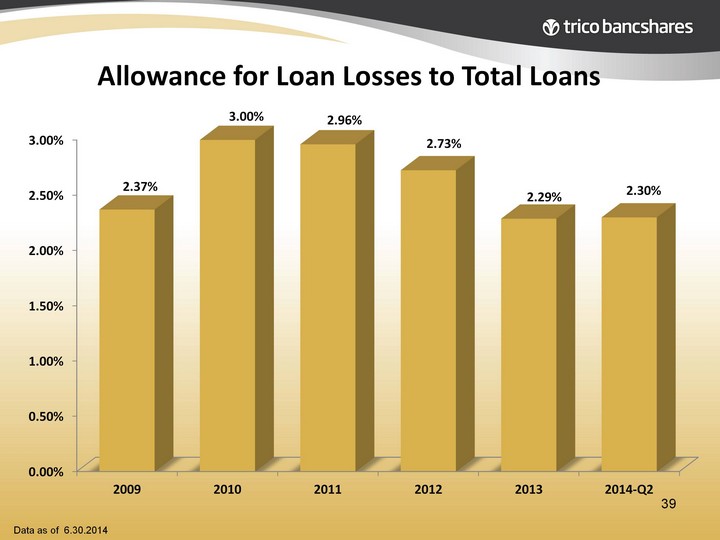
| Data as of 6.30.2014 39 (CHART) |
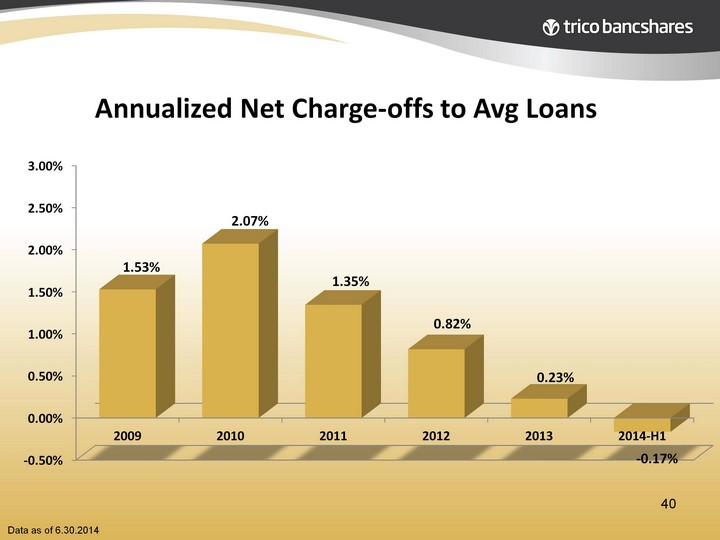
| Data as of 6.30.2014 40 (CHART) |
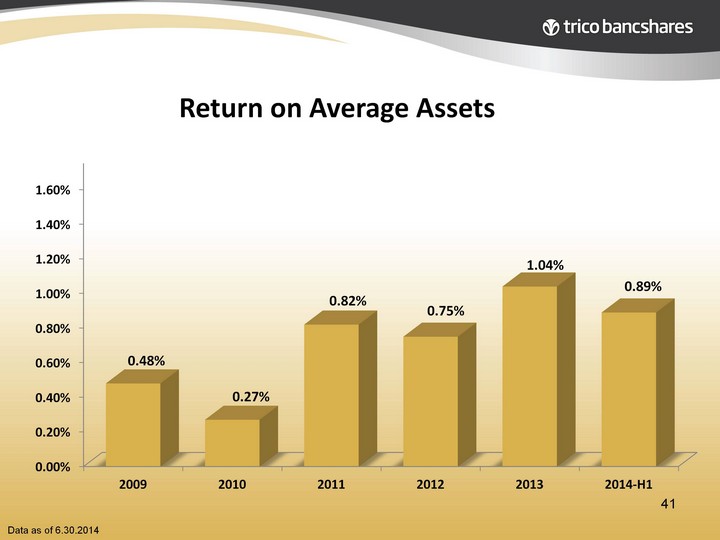
| Data as of 6.30.2014 41 (CHART) |
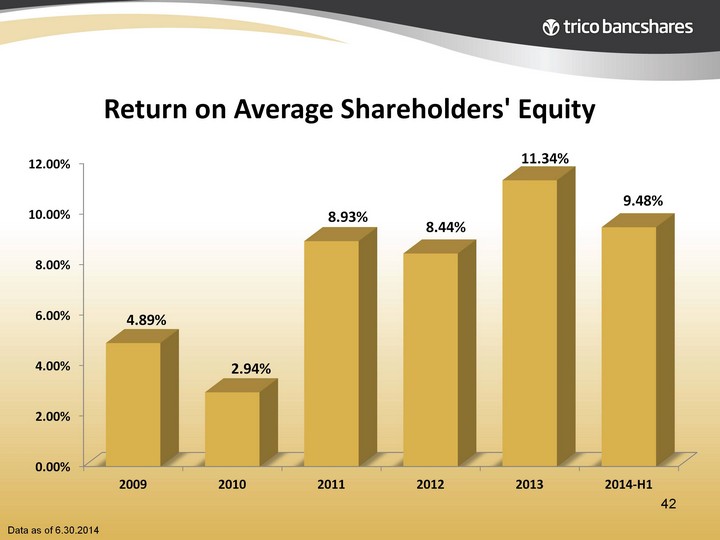
| Data as of 6.30.2014 42 (CHART) |
| TriCo Bancshares is committed to: Improving the financial success and well-being of our shareholders, customers, communities and employees. |