Attached files
| file | filename |
|---|---|
| EX-32.2 - EX-32.2 - TRICO BANCSHARES / | d292524dex322.htm |
| EX-32.1 - EX-32.1 - TRICO BANCSHARES / | d292524dex321.htm |
| EX-31.2 - EX-31.2 - TRICO BANCSHARES / | d292524dex312.htm |
| EX-31.1 - EX-31.1 - TRICO BANCSHARES / | d292524dex311.htm |
| EX-23.1 - EX-23.1 - TRICO BANCSHARES / | d292524dex231.htm |
| EX-21.1 - EX-21.1 - TRICO BANCSHARES / | d292524dex211.htm |
Table of Contents
UNITED STATES
SECURITIES AND EXCHANGE COMMISSION
Washington D.C. 20549
FORM 10-K
Annual Report Pursuant to Section 13 or 15(d) of the Securities Exchange Act of 1934
For the fiscal year ended December 31, 2016
Commission File Number 0-10661
TriCo Bancshares
(Exact name of Registrant as specified in its charter)
| California | 94-2792841 | |
| (State or other jurisdiction of incorporation or organization) |
(I.R.S. Employer Identification No.) | |
| 63 Constitution Drive, Chico, California | 95973 | |
| (Address of principal executive offices) | (Zip Code) | |
Registrant’s telephone number, including area code:(530) 898-0300
Securities registered pursuant to Section 12(b) of the Act:
| Common Stock, without par value |
Nasdaq Global Select Market | |
| (Title of Class) | (Name of each exchange on which registered) |
Securities registered pursuant to Section 12(g) of the Act: None.
Indicate by check mark whether the Registrant is a well-known seasoned issuer, as defined in Rule 405 of the Securities Act. YES ☐ NO ☒
Indicate by check mark whether the Registrant is not required to file reports pursuant to Section 13 or Section 15(d) of the Act. YES ☐ NO ☒
Indicate by check mark whether the Registrant (1) has filed all reports required to be filed by Section 13 or 15(d) of the Securities Exchange Act of 1934 during the preceding 12 months (or for such shorter periods that the Registrant was required to file such reports), and (2) has been subject to such filing requirements for the past 90 days. YES ☒ NO ☐
Indicate by check mark whether the registrant has submitted electronically and posted on its corporate Web site, if any, every Interactive Data File required to be submitted and posted pursuant to Rule 405 of Regulation S-T (§ 232.405 of this chapter) during the preceding 12 months (or for such shorter period that the registrant was required to submit and post such files). YES ☒ NO ☐
Indicate by check mark if disclosure of delinquent filers pursuant to Item 405 of Regulation S-K is not contained herein, and will not be contained, to the best of the Registrant’s knowledge, in definitive proxy or information statements incorporated by
reference in Part III of the Form 10-K or any amendment to this Form 10-K. YES ☒ NO ☐
Indicate by check mark whether the Registrant is a large accelerated filer, an accelerated filer, a non-accelerated filer or a smaller reporting company. See the definitions of “large accelerated filer,” “accelerated filer” and “smaller reporting company” in Rule 12b-2 of the Act (check one).
| Large accelerated filer | ☐ | Accelerated filer | ☒ | |||
| Non-accelerated filer | ☐ (Do not check if a smaller reporting company) | Smaller reporting company | ☐ | |||
Indicate by check mark whether the Registrant is a shell company (as defined in Rule 12b-2 of the Exchange Act). YES ☐ NO ☒
The aggregate market value of the voting common stock held by non-affiliates of the Registrant, as of June 30, 2016, was approximately $580,894,777 (based on the closing sales price of the Registrant’s common stock on the date). This computation excludes a total of 3,587,007 shares that are beneficially owned by the officers and directors of Registrant who may be deemed to be the affiliates of Registrant under applicable rules of the Securities and Exchange Commission.
The number of shares outstanding of Registrant’s common stock, as of February 24, 2017, was 22,871,154.
DOCUMENTS INCORPORATED BY REFERENCE
The information required to be disclosed pursuant to Part III of this report either shall be (i) deemed to be incorporated by reference from selected portions of the Registrant’s definitive proxy statement for the 2017 annual meeting of shareholders, if such proxy statement is filed with the Securities and Exchange Commission pursuant to Regulation 14A not later than 120 days after the end of the Registrants’s most recently completed fiscal year, or (ii) included in an amendment to this report filed with the Commission on Form 10-K/A not later than the end of such 120 day period.
Table of Contents
FORWARD-LOOKING STATEMENTS
In addition to historical information, this Annual Report on Form 10-K contains forward-looking statements about TriCo Bancshares (the “Company,” “TriCo” or “we”) and its subsidiaries for which it claims the protection of the safe harbor provisions contained in the Private Securities Litigation Reform Act of 1995. These forward-looking statements are based on Management’s current knowledge and belief and include information concerning the Company’s possible or assumed future financial condition and results of operations. When you see any of the words “believes”, “expects”, “anticipates”, “estimates”, or similar expressions, these generally indicate that we are making forward-looking statements. A number of factors, some of which are beyond the Company’s ability to predict or control, could cause future results to differ materially from those contemplated. These factors include those listed at Item 1A Risk Factors, in this report.
Forward-looking statements speak only as of the date they are made, and the Company does not undertake to update forward-looking statements to reflect circumstances or events that occur after the date the forward-looking statements are made, whether as a result of new information, future developments or otherwise.
Table of Contents
Information about TriCo Bancshares’ Business
TriCo Bancshares is a bank holding company incorporated in California in 1981 and registered under the Bank Holding Company Act of 1956, as amended (the “BHC Act”). The Company’s principal subsidiary is Tri Counties Bank, a California-chartered commercial bank (the “Bank”). The Bank offers banking services to retail customers and small to medium-sized businesses through 68 branch offices in Northern and Central California and had total assets of approximately $4.5 billion at December 31, 2016. The Bank’s deposits are insured by the Federal Deposit Insurance Corporation (the “FDIC”) up to applicable limits. See “Business of Tri Counties Bank”. The Company and the Bank are headquartered in Chico, California.
As a bank holding company, TriCo is subject to the supervision of the Board of Governors of the Federal Reserve System (the “FRB”) under the BHC Act. The Bank is subject to the supervision of the California Department of Business Oversight (the “DBO”) and the FDIC. See “Regulation and Supervision.”
TriCo has five capital trusts, which are all wholly-owned trust subsidiaries formed for the purpose of issuing trust preferred securities (“Trust Preferred Securities”) and lending the proceeds to TriCo. For more information regarding the trust preferred securities please refer to Note 17, “Junior Subordinated Debt” to the financial statements at Item 8 of this report.
Additional information concerning the Company can be found on our website at www.tcbk.com. Copies of our annual reports on Form 10-K, quarterly reports on Form 10-Q, current reports on Form 8-K and amendments to these reports are available free of charge through the investors relations page of our website, www.tcbk.com, as soon as reasonably practicable after the Company files these reports with the U.S. Securities and Exchange Commission (“SEC”). The information on our website is not part of this annual report.
Business of Tri Counties Bank
The Bank was incorporated as a California banking corporation on June 26, 1974, and received its certificate of authority to conduct banking operations on March 11, 1975. The Bank engages in the general commercial banking business in 26 counties in Northern and Central California. The Bank currently operates from 58 traditional branches and 10 in-store branches.
The Bank conducts a commercial banking business including accepting demand, savings and time deposits and making commercial, real estate, and consumer loans. It also offers installment note collection, issues cashier’s checks, sells travelers checks and provides safe deposit boxes and other customary banking services. Brokerage services are provided at the Bank’s offices by the Bank’s arrangement with Raymond James Financial Services, Inc., an independent financial services provider and broker-dealer. The Bank does not offer trust services or international banking services.
The Bank has emphasized retail banking since it opened. Most of the Bank’s customers are retail customers and small to medium-sized businesses. The Bank emphasizes serving the needs of local businesses, farmers and ranchers, retired individuals and wage earners. The majority of the Bank’s loans are direct loans made to individuals and businesses in Northern and Central California where its branches are located. At December 31, 2016, the total of the Bank’s consumer loans net of deferred fees outstanding was $362,303,000 (13.1%), the total of commercial loans outstanding was $217,047,000 (7.9%), and the total of real estate loans including construction loans of $122,419,000 was $2,180,243,000 (79.0%). The Bank takes real estate, listed and unlisted securities, savings and time deposits, automobiles, machinery, equipment, inventory, accounts receivable and notes receivable secured by property as collateral for loans.
Most of the Bank’s deposits are attracted from individuals and business-related sources. No single person or group of persons provides a material portion of the Bank’s deposits, the loss of any one or more of which would have a materially adverse effect on the business of the Bank, nor is a material portion of the Bank’s loans concentrated within a single industry or group of related industries.
Acquisition of Three Branch Offices and Deposits from Bank of America
On March 18, 2016, the Bank completed its acquisition of three branch banking offices from Bank of America originally announced October 28, 2015. The acquired branches are located in Arcata, Eureka and Fortuna in Humboldt County on the North Coast of California, and have significant overlap compared to the Company’s then-existing Northern California customer base and branch locations. As a result, these branch acquisitions create potential cost savings and future growth potential. With the levels of capital at the time, the acquisitions fit well into the Company’s growth strategy. Also on March 18, 2016, the electronic customer service and other data processing systems of the acquired branches were converted into the Bank’s systems, and the effect of revenue and expenses from the operations of the acquired branches are included in the results of the Company. The Bank paid a premium of $3,204,000 for deposit relationships with balances of $161,231,000 and loans with balances of $289,000, and received cash of $159,520,000 from Bank of America.
2
Table of Contents
The assets acquired and liabilities assumed in the acquisition of these branches were accounted for in accordance with ASC 805 “Business Combinations,” using the acquisition method of accounting and were recorded at their estimated fair values on the March 18, 2016 acquisition date, and the results of operations of the acquired branches are included in the Company’s consolidated statements of income since that date. The excess of the fair value of consideration transferred over total identifiable net assets was recorded as goodwill. The goodwill arising from the acquisition consists largely of the synergies and economies of scale expected from combining the operations of the Company and the acquired branches. $849,000 of the goodwill is deductible for income tax purposes because the acquisition was accounted for as a purchase of assets and assumption of liabilities for tax purposes.
See Note 2 in the financial statements at Item 8 of this report for a discussion about this transaction.
Acquisition of North Valley Bancorp
On October 3, 2014, TriCo completed the acquisition of North Valley Bancorp following receipt of shareholder approval for both institutions and all required regulatory approvals. As part of the acquisition, North Valley Bank, a wholly-owned subsidiary of North Valley Bancorp, merged with and into Tri Counties Bank. In the acquisition, the outstanding shares of North Valley common stock were converted into an aggregate of approximately 6.58 million shares of TriCo common stock to North Valley Bancorp shareholders, which was valued at a total of approximately $151 million based on the closing trading price of TriCo common stock on October 3, 2014 of $23.01. In addition, the outstanding options to purchase shares of North Valley Bancorp common stock were cancelled and the holders of the options received a total of $1,061,000 in cash. In connection with the merger, TriCo assumed North Valley Bancorp’s obligations with respect to its outstanding trust preferred securities.
North Valley Bank was a full-service commercial bank headquartered in Redding, California. North Valley conducted a commercial and retail banking services which included accepting demand, savings, and money market rate deposit accounts and time deposits, and making commercial, real estate and consumer loans. North Valley Bank had $935 million in assets and 22 commercial banking offices in Shasta, Humboldt, Del Norte, Mendocino, Yolo, Sonoma, Placer and Trinity Counties in Northern California at June 30, 2014.
Other Activities
The Bank may in the future engage in other businesses either directly or indirectly through subsidiaries acquired or formed by the Bank subject to regulatory constraints. See “Regulation and Supervision.”
Employees
At December 31, 2016, the Company employed 1,063 persons, including six executive officers. Full time equivalent employees were 1,013. No employees of the Company are presently represented by a union or covered under a collective bargaining agreement. Management believes that its employee relations are good.
Competition
The banking business in California generally, and in the Bank’s primary service area of Northern and Central California specifically, is highly competitive with respect to both loans and deposits. It is dominated by a relatively small number of national and regional banks with many offices operating over a wide geographic area. Among the advantages such major banks have over the Bank is their ability to finance wide ranging advertising campaigns and to allocate their investment assets to regions of high yield and demand. By virtue of their greater total capitalization such institutions have substantially higher lending limits than does the Bank.
In addition to competing with other banks, the Bank competes with savings institutions, credit unions and the financial markets for funds. Yields on corporate and government debt securities and other commercial paper may be higher than on deposits, and therefore affect the ability of commercial banks to attract and hold deposits. Commercial banks also compete for available funds with money market instruments and mutual funds. During past periods of high interest rates, money market funds have provided substantial competition to banks for deposits and they may continue to do so in the future. Mutual funds are also a major source of competition for savings dollars.
The Bank relies substantially on local promotional activity, personal contacts by its officers, directors, employees and shareholders, extended hours, personalized service and its reputation in the communities it services to compete effectively.
3
Table of Contents
Regulation and Supervision
General
The Company and the Bank are subject to extensive regulation under both federal and state law. This regulation is intended primarily for the protection of depositors, the FDIC deposit insurance fund and the banking system as a whole, and not for the protection of shareholders of the Company. Set forth below is a summary description of the significant laws and regulations applicable to the Company and the Bank. The description is qualified in its entirety by reference to the applicable laws and regulations.
Regulatory Agencies
The Company is a legal entity separate and distinct from the Bank and its other subsidiaries. As a bank holding company, the Company is regulated under the BHC Act, and is subject to supervision, regulation and examination by the FRB. The Company is also subject to the disclosure and regulatory requirements of the Securities Act of 1933 and the Securities Exchange Act of 1934, each administered by the SEC. The Company’s common stock is listed on the Nasdaq Global Select market (“Nasdaq”) under the trading symbol “TCBK” and the Company is, therefore, subject to the rules of Nasdaq for listed companies.
The Bank, as a state chartered bank, is subject to broad federal regulation and oversight extending to all its operations by the FDIC and to state regulation by the DBO.
The Dodd-Frank Wall Street Reform and Consumer Protection Act (the “Dodd-Frank Act”) created the Consumer Financial Protection Bureau (the “CFPB”) as an independent entity with broad rulemaking, supervisory and enforcement authority over consumer financial products and services. The CFPB’s functions include investigating consumer complaints, rulemaking, supervising and examining bank consumer transactions, and enforcing rules related to consumer financial products and services. CFPB regulations and guidance apply to all financial institutions, including the Bank. Banks with $10 billion or more in assets are subject to examination by the CFPB. Banks with less than $10 billion in assets, including the Bank, are subject to the CFPB’s rules but continue to be examined for compliance with federal consumer laws by their primary federal banking agency.
The Bank Holding Company Act
The Company is registered as a bank holding company under the BHC Act. In general, the BHC Act limits the business of bank holding companies to banking, managing or controlling banks and other activities that the FRB has determined to be so closely related to banking as to be a proper incident thereto. As a bank holding company, TriCo is required to file reports with the FRB and the FRB periodically examines the Company. Under the Dodd-Frank Act, a bank holding company is required to serve as a source of financial and managerial strength to its subsidiary bank and, under appropriate circumstances, to commit resources to support the subsidiary bank. Qualified bank holding companies that elect to be financial holding companies may engage in any activity, or acquire and retain the shares of a company engaged in any activity, that is either (i) financial in nature or incidental to such financial activity or (ii) complementary to a financial activity, and that does not pose a substantial risk to the safety and soundness of depository institutions or the financial system generally (as determined solely by the FRB). Activities that are financial in nature include securities underwriting and dealing, insurance underwriting and agency, and making merchant banking investments. The Company has not elected to become a financial holding company.
The BHC Act, the Bank Merger Act, and other federal and state statutes regulate acquisitions of commercial banks. The BHC Act requires the prior approval of the FRB for the direct or indirect acquisition of more than 5 percent of the voting shares of a commercial bank or its parent holding company. Under the Bank Merger Act, the prior approval of an acquiring bank’s primary federal regulator is required before it may merge with another bank or purchase the assets or assume the deposits of another bank. In reviewing applications seeking approval of merger and acquisition transactions, the bank regulatory authorities will consider, among other things, the competitive effect and public benefits of the transactions, the capital position of the combined organization, the applicant’s performance record under the Community Reinvestment Act, consumer compliance, fair housing laws and the effectiveness of the subject organizations in combating money laundering activities.
Safety and Soundness Standards
The Federal Deposit Insurance Corporation Improvement Act of 1991 (“FDICIA”) implemented certain specific restrictions on transactions and required the regulators to adopt overall safety and soundness standards for depository institutions related to internal control, loan underwriting and documentation, and asset growth. Among other things, FDICIA limits the interest rates paid on deposits by undercapitalized institutions, the use of brokered deposits and the aggregate extension of credit by a depository institution to an executive officer, director, principal stockholder or related interest, and reduces deposit insurance coverage for deposits offered by undercapitalized institutions for deposits by certain employee benefits accounts.
4
Table of Contents
Section 39 to the Federal Deposit Insurance Act requires the agencies to establish safety and soundness standards for insured financial institutions covering:
| • | internal controls, information systems and internal audit systems; |
| • | loan documentation; |
| • | credit underwriting; |
| • | interest rate exposure; |
| • | asset growth; |
| • | compensation, fees and benefits; |
| • | asset quality, earnings and stock valuation; and |
| • | excessive compensation for executive officers, directors or principal shareholders which could lead to material financial loss. |
If an agency determines that an institution fails to meet any standard established by the guidelines, the agency may require the financial institution to submit to the agency an acceptable plan to achieve compliance with the standard. If the agency requires submission of a compliance plan and the institution fails to timely submit an acceptable plan or to implement an accepted plan, the agency must require the institution to correct the deficiency. An institution must file a compliance plan within 30 days of a request to do so from the institution’s primary federal regulatory agency. The agencies may elect to initiate enforcement action in certain cases rather than rely on an existing plan particularly where failure to meet one or more of the standards could threaten the safe and sound operation of the institution.
Restrictions on Dividends and Distributions
A California corporation such as TriCo may make a distribution to its shareholders to the extent that either the corporation’s retained earnings meet or exceed the amount of the proposed distribution or the value of the corporation’s assets exceed the amount of its liabilities plus the amount of shareholders preferences, if any, and certain other conditions are met. It is the FRB’s policy that bank holding companies should generally pay dividends on common stock only out of income available over the past year, and only if prospective earnings retention is consistent with the organization’s expected future needs and financial condition. In addition, TriCo’s ability to pay dividends may be restricted if it does not maintain an adequate capital conservation buffer under the FRB’s capital rules. See “—Regulatory Capital Requirements.”
The primary source of funds for payment of dividends by TriCo to its shareholders has been and will continue to be the receipt of dividends and management fees from the Bank. TriCo’s ability to receive dividends from the Bank is limited by applicable state and federal law. Under the California Financial Code, funds available for cash dividend payments by a bank are restricted to the lesser of: (i) retained earnings or (ii) the bank’s net income for its last three fiscal years (less any distributions to shareholders made during such period). However, with the prior approval of the Commissioner of the DBO, a bank may pay cash dividends in an amount not to exceed the greatest of the: (1) retained earnings of the bank; (2) net income of the bank for its last fiscal year; or (3) net income of the bank for its current fiscal year. However, if the DBO finds that the shareholders’ equity of the bank is not adequate or that the payment of a dividend would be unsafe or unsound, the Commissioner may order the bank not to pay a dividend to shareholders.
Additionally, under FDICIA, a bank may not make any capital distribution, including the payment of dividends, if after making such distribution the bank would be in any of the “undercapitalized” categories under the FDIC’s Prompt Corrective Action regulations. A bank is undercapitalized for this purpose if its leverage ratios, Tier 1 risk-based capital level and total risk-based capital ratio are not at least four percent, four percent and eight percent, respectively. In addition, the Bank’s ability to pay dividends to TriCo may be restricted if the Bank does not maintain an adequate capital conservation buffer under the FDIC’s capital rules. See “—Regulatory Capital Requirements.”
The FRB, FDIC and the DBO have authority to prohibit a bank holding company or a bank from engaging in practices which are considered to be unsafe and unsound. Depending on the financial condition of TriCo and the Bank and other factors, the FRB, FDIC or the DBO could determine that payment of dividends or other payments by TriCo or the Bank might constitute an unsafe or unsound practice.
The Community Reinvestment Act
The Community Reinvestment Act of 1977 (the “CRA”) requires the federal banking regulatory agencies to periodically assess a bank’s record of helping meet the credit needs of its entire community, including low- and moderate-income neighborhoods. The CRA also requires the agencies to consider a financial institution’s record of meeting its community credit when evaluating applications for, among other things, domestic branches and mergers or acquisitions. The federal banking agencies rate depository institutions’ compliance with the CRA. The ratings range from a high of “outstanding” to a low of “substantial noncompliance.” A less than “satisfactory” rating could result in the suspension of any growth of the Bank through acquisitions or opening de novo branches until the rating is improved. As of its most recent CRA examination, the Bank’s CRA rating was “Satisfactory.”
5
Table of Contents
Consumer Protection Laws
The Bank is subject to many federal consumer protection statues and regulations, some of which are discussed below.
| • | The Equal Credit Opportunity Act generally prohibits discrimination in any credit transaction, whether for consumer or business purposes, on the basis of race, color, religion, national origin, sex, marital status, age (except in limited circumstances), receipt of income from public assistance programs, or good faith exercise of any rights under the Consumer Credit Protection Act. |
| • | The Truth-in-Lending Act is designed to ensure that credit terms are disclosed in a meaningful way so that consumers may compare credit terms more readily and knowledgeably. |
| • | The Fair Housing Act regulates many practices, including making it unlawful for any lender to discriminate in its housing-related lending activities against any person because of race, color, religion, national origin, sex, handicap or familial status. |
| • | The Home Mortgage Disclosure Act, which includes a “fair lending” aspect, requires the collection and disclosure of data about applicant and borrower characteristics as a way of identifying possible discriminatory lending patterns and enforcing anti-discrimination statutes. |
| • | The Real Estate Settlement Procedures Act requires lenders to provide borrowers with disclosures regarding the nature and cost of real estate settlements and prohibits certain abusive practices, such as kickbacks, and places limitations on the amount of escrow accounts. |
In addition, the CFPB has taken a number of actions that may affect the Bank’s operations and compliance costs, including the following:
| • | The issuance of final rules for residential mortgage lending, which became effective January 10, 2013, including definitions for “qualified mortgages” and detailed standards by which lenders must satisfy themselves of the borrower’s ability to repay the loan and revised forms of disclosure under the Truth in Lending Act and the Real Estate Settlement Procedures Act |
| • | The issuance of a policy report on arbitration clauses which could result in the restriction or prohibition of lenders including arbitration clauses in consumer financial services contracts. |
| • | Actions taken to regulate and supervise credit bureaus and debt collections. |
| • | Positions taken by CFPB on fair lending, including applying the disparate impact theory in auto financing, which could make it harder for lenders, such as the Bank, to charge different rates or apply different terms to loans to different customers. |
Penalties for violations of the above laws may include fines, reimbursements, injunctive relief and other penalties.
Regulatory Capital Requirements
The Company and the Bank are subject to the minimum capital requirements of the FDIC and the FRB, respectively. These capital requirements may restrict the Company’s and the Bank’s profitability and ability to pay dividends. If the Company or the Bank lacks adequate capital to increase its assets without violating the minimum capital requirements or if it is forced to reduce the level of its assets in order to satisfy regulatory capital requirements, its ability to generate earnings would be reduced.
The Company’s and the Bank’s primary federal regulators, the FRB and the FDIC, have adopted guidelines utilizing a risk-based capital structure. Under the risk-based capital rules applicable through December 31, 2014, banking organizations were required to maintain minimum ratios of Tier 1 capital and total capital to total risk-weighted assets (including certain off-balance sheet items, such as letters of credit). Qualifying capital is divided into two tiers. Tier 1 capital consists generally of common stockholders’ equity, retained earnings, qualifying noncumulative perpetual preferred stock, a limited amount of qualifying cumulative perpetual preferred stock (at the holding company level) and minority interests in the equity accounts of consolidated subsidiaries, less goodwill and certain other intangible assets. Tier 2 capital consists of, among other things, allowance for loan and lease losses up to 1.25% of weighted risk assets, other perpetual preferred stock, hybrid capital instruments, perpetual debt, mandatory convertible debt, subordinated debt and intermediate-term preferred stock, subject to limitations. Tier 2 capital qualifies as part of total capital up to a maximum of 100% of Tier 1 capital. Under these risk-based capital guidelines, the Company is required to maintain total capital equal to at least 8% of its assets, of which at least 4% must be in the form of Tier 1 capital. In addition, the Bank is subject to minimum capital ratios under the regulatory framework for prompt corrective action discussed below under “— Prompt Corrective Action.”
The Company and the Bank are also required to maintain a minimum leverage ratio of 4% of Tier 1 capital to total assets (the “leverage ratio”). The leverage ratio is determined by dividing an institution’s Tier 1 capital by its quarterly average total assets, less goodwill and certain other intangible assets. The minimum leverage ratio constitutes a minimum requirement for the most well-run banking organizations. See Note 29 in the financial statements at Item 8 of this report for a discussion about the Company’s risk-based capital and leverage ratios.
6
Table of Contents
In July, 2013, the federal banking agencies approved new capital rules implementing the “Basel III” regulatory capital reforms and other changes required by the Dodd-Frank Act. “Basel III” refers to capital guidelines adopted by the Basel Committee on Banking Supervision, which is a committee of central banks and bank supervisors/regulators from the major industrialized countries. The new capital rules include new risk-based capital and leverage ratios, which are being phased in from 2015 to 2019, and which refine the definition of what constitutes “capital” for purposes of calculating those ratios. The new minimum capital level requirements applicable to the Company and the Bank as of January 1, 2015 under the new capital rules include: (i) a new common equity Tier 1 capital ratio of 4.5%; (ii) a Tier 1 capital ratio of 6% (increased from 4%); (iii) a total capital ratio of 8% (unchanged from previous rules); and (iv) a Tier 1 leverage ratio of 4% for all institutions. The new capital rules also establish a “capital conservation buffer” above the new regulatory minimum capital requirements, which must consist entirely of common equity Tier 1 capital. The capital conservation buffer will be phased-in over four years beginning on January 1, 2016, as follows: The buffer will be 0.625% of risk-weighted assets for 2016, 1.25% for 2017, 1.875% for 2018, and 2.5% for 2019 and thereafter. This will result in the following minimum ratios beginning in 2019: (i) a common equity Tier 1 capital ratio of 7.0%, (ii) a Tier 1 capital ratio of 8.5%, and (iii) a total capital ratio of 10.5%. Under the new capital rules, institutions are subject to limitations on paying dividends, engaging in share repurchases, and paying discretionary bonuses if its common equity capital level falls below the buffer amount. These limitations establish a maximum percentage of eligible retained income that could be utilized for such actions.
The new capital rules provide regulators discretion to impose an additional capital buffer, the “countercyclical buffer,” of up to 2.5% of common equity Tier 1 capital to take into account the macro-financial environment and periods of excessive credit growth. However, the countercyclical buffer only applies to larger banks with $250 billion or more in total assets or $10 billion or more in total foreign exposures and is not expected to have an impact on the Company or the Bank.
The new capital rules also implement revisions and clarifications consistent with Basel III regarding the various components of Tier 1 capital, including common equity, unrealized gains and losses, as well as certain instruments including trust preferred securities that will no longer qualify as Tier 1 capital, some of which will be phased out over time. However, the new capital rules provide that depository institution holding companies with less than $15 billion in total assets as of December 31, 2009, such as the Company, will be able to continue to include non-qualifying instruments that were issued and included in Tier 1 capital prior to May 19, 2010, such as the Company’s Trust Preferred Securities, as Tier 1. This treatment is grandfathered and will apply even if the Company exceeds $15 billion assets due to organic growth. However, if the Company exceeds $15 billion in assets as the result of a merger or acquisition, then the Tier 1 treatment of its outstanding trust preferred securities will be phased out but may still be treated as Tier 2 capital.
The new capital rules also include changes for the calculation of risk-weighted assets, which are being phased in beginning January 1, 2015. The new capital rules utilizes an increased number of credit risk exposure categories and risk weights, and also addresses: (i) an alternative standard of creditworthiness consistent with Section 939A of the Dodd-Frank Act; (ii) revisions to recognition of credit risk mitigation; (iii) rules for risk weighting of equity exposures and past due loans; (iv) revised capital treatment for derivatives and repo-style transactions; and (v) disclosure requirements for top-tier banking organizations with $50 billion or more in total assets that are not subject to the “advance approach rules” that apply to banks with greater than $250 billion in consolidated assets.
We believe that we were in compliance with the requirements applicable to us as set forth in the new capital rules as of January 1, 2016.
Prompt Corrective Action
Prompt Corrective Action regulations of the federal bank regulatory agencies establish five capital categories in descending order (well capitalized, adequately capitalized, undercapitalized, significantly undercapitalized and critically undercapitalized), assignment to which depends upon the institution’s total risk-based capital ratio, Tier 1 risk-based capital ratio, and leverage ratio. The new capital rules revised the prompt corrective action framework. Under the new prompt corrective action framework, which is designed to complement the capital conservation buffer included in the new capital rules, insured depository institutions will be required to meet the following increased capital level requirements in order to qualify as “well capitalized:” (i) a new common equity Tier 1 capital ratio of 6.5%; (ii) a Tier 1 capital ratio of 8% (increased from 6%); (iii) a total capital ratio of 10% (unchanged from current rules); and (iv) a Tier 1 leverage ratio of 5% (increased from 4%). Institutions classified in one of the three undercapitalized categories are subject to certain mandatory and discretionary supervisory actions, which include increased monitoring and review, implementation of capital restoration plans, asset growth restrictions, limitations upon expansion and new business activities, requirements to augment capital, restrictions upon deposit gathering and interest rates, replacement of senior executive officers and directors, and requiring divestiture or sale of the institution. The Bank has been classified as well-capitalized since adoption of these regulations.
7
Table of Contents
Deposit Insurance
Deposit accounts in the Bank are insured by the FDIC, generally up to a maximum of $250,000 per separately insured depositor. The Bank pays deposit insurance assessments based on its consolidated total assets less tangible equity capital. The assessment rate is based on the risk category of the institution. To determine the total base assessment rate, the FDIC first establishes an institution’s initial base assessment rate and then adjusts the initial base assessment based upon an institution’s levels of unsecured debt, secured liabilities, and brokered deposits. The total base assessment rate ranges from 2.5 to 45 basis points of the institution’s average consolidated total assets less tangible equity capital.
The Bank is generally unable to control the amount of premiums that it is required to pay for FDIC insurance. If there are additional bank or financial institution failures or if the FDIC otherwise determines, the Bank may be required to pay even higher FDIC premiums than the recently increased levels. Increases in FDIC insurance premiums may have a material and adverse affect on the Company’s earnings and could have a material adverse effect on the value of, or market for, the Company’s common stock.
The FDIC may terminate a depository institution’s deposit insurance upon a finding that the institution’s financial condition is unsafe or unsound or that the institution has engaged in unsafe or unsound practices that pose a risk to the DIF or that may prejudice the interest of the bank’s depositors. The termination of deposit insurance for the Bank would also result in the revocation of the Bank’s charter by the DBO.
Interstate Branching
The Dodd-Frank Act authorized national and state banks to establish branches in other states to the same extent as a bank chartered by that state would be permitted to branch. Previously, banks could only establish branches in other states if the host state expressly permitted out-of-state banks to establish branches in that state. Accordingly, banks will be able to enter new markets more freely.
Anti-Money Laundering Laws
A series of banking laws and regulations beginning with the bank Secrecy Act in 1970 requires banks to prevent, detect, and report illicit or illegal financial activities to the federal government to prevent money laundering, international drug trafficking, and terrorism. Under the USA Patriot Act of 2001, financial institutions are subject to prohibitions against specified financial transactions and account relationships, requirements regarding the Customer Identification Program, as well as enhanced due diligence and “know your customer” standards in their dealings with high risk customers, foreign financial institutions, and foreign individuals and entities.
Transactions with Affiliates
Banks are also subject to certain restrictions imposed by the Federal Reserve Act on extensions of credit to executive officers, directors, principal shareholders (including the Company) or any related interest of such persons. Extensions of credit must be made on substantially the same terms, including interest rates and collateral as, and follow credit underwriting procedures that are not less stringent than, those prevailing at the time for comparable transactions with persons not affiliated with the bank, and must not involve more than the normal risk of repayment or present other unfavorable features. Banks are also subject to certain lending limits and restrictions on overdrafts to such persons. Regulation W requires that certain transactions between the Bank and its affiliates, including its holding company, be on terms substantially the same, or at least as favorable to the Bank, as those prevailing at the time for comparable transactions with or involving nonaffiliated companies or, in the absence of comparable transactions, on terms and under circumstances, including credit standards, that in good faith would be offered to or would apply to nonaffiliated companies.
Impact of Monetary Policies
Banking is a business that depends on interest rate differentials. In general, the difference between the interest paid by a bank on its deposits and other borrowings, and the interest rate earned by banks on loans, securities and other interest-earning assets comprises the major source of banks’ earnings. Thus, the earnings and growth of banks are subject to the influence of economic conditions generally, both domestic and foreign, and also to the monetary and fiscal policies of the United States and its agencies, particularly the FRB. The FRB implements national monetary policy, such as seeking to curb inflation and combat recession, by its open-market dealings in United States government securities, by adjusting the required level of reserves for financial institutions subject to reserve requirements and through adjustments to the discount rate applicable to borrowings by banks which are members of the FRB. The actions of the FRB in these areas influence the growth of bank loans, investments and deposits and also affect interest rates. The nature and timing of any future changes in such policies and their impact on the Company cannot be predicted. In addition, adverse economic conditions could make a higher provision for loan losses a prudent course and could cause higher loan loss charge-offs, thus adversely affecting the Company’s net earnings.
8
Table of Contents
In analyzing whether to make or continue holding an investment in the Company, investors should consider, among other factors, the following:
Risks Related to the Nature and Geographic Area of Our Business
We are exposed to risks in connection with the loans we make.
As a lender, we face a significant risk that we will sustain losses because borrowers, guarantors and related parties may fail to perform in accordance with the terms of their loans. Our earnings are significantly affected by our ability to properly originate, underwrite and service loans. We have underwriting and credit monitoring procedures and credit policies, including the establishment and review of the allowance for loan losses, that we believe appropriately address this risk by assessing the likelihood of nonperformance, tracking loan performance and diversifying our respective loan portfolios. Such policies and procedures, however, may not prevent unexpected losses that could adversely affect our results of operations. We could sustain losses if we incorrectly assess the creditworthiness of our borrowers or fail to detect or respond to deterioration in asset quality in a timely manner.
Our allowance for loan losses may not be adequate to cover actual losses.
Like other financial institutions, we maintain an allowance for loan losses to provide for loan defaults and non-performance. Our allowance for loan losses may not be adequate to cover actual loan losses, and future provisions for loan losses would reduce our earnings could materially and adversely affect our business, financial condition, results of operations and cash flows. The allowance for loan losses reflects our estimate of the probable losses in our loan portfolio at the relevant balance sheet date. Our allowance for loan losses is based on prior experience, as well as an evaluation of the known risks in the current portfolio, composition and growth of the loan portfolio and economic factors. Determining an appropriate level of loan loss allowance is an inherently difficult process and is based on numerous assumptions. The amount of future losses is susceptible to changes in economic, operating and other conditions, including changes in interest rates, that may be beyond our control and these losses may exceed current estimates. Federal and state regulatory agencies, as an integral part of their examination process, review our loans and allowance for loan losses. While we believe that our allowance for loan losses is adequate to cover current losses, we cannot assure you that we will not increase the allowance for loan losses further or that the allowance will be adequate to absorb loan losses we actually incur. Either of these occurrences could have a material adverse affect on our business, financial condition and results of operations.
Our business may be adversely affected by business conditions in Northern and Central California.
We conduct most of our business in Northern and Central California. As a result of this geographic concentration, our financial results may be impacted by economic conditions in California. Deterioration in the economic conditions in California could result in the following consequences, any of which could have a material adverse effect on our business, financial condition, results of operations and cash flows:
| • | problem assets and foreclosures may increase, |
| • | demand for our products and services may decline, |
| • | low cost or non-interest bearing deposits may decrease, and |
| • | collateral for loans made by us, especially real estate, may decline in value, in turn reducing customers’ borrowing power, and reducing the value of assets and collateral associated with our existing loans. |
In view of the concentration of our operations and the collateral securing our loan portfolio in both Northern and Central California, we may be particularly susceptible to the adverse effects of any of these consequences, any of which could have a material adverse effect on our business, financial condition, results of operations and cash flows.
A significant majority of the loans in our portfolio are secured by real estate and a downturn in our real estate markets could hurt our business.
A downturn in our real estate markets in which we conduct our business in California could hurt our business because most of our loans are secured by real estate. Real estate values and real estate markets are generally affected by changes in national, regional or local economic conditions, fluctuations in interest rates and the availability of loans to potential purchasers, changes in tax laws and other governmental statutes, regulations and policies and acts of nature. As real estate prices decline, the value of real estate collateral securing our loans is reduced. As a result, our ability to recover on defaulted loans by foreclosing and selling the real estate collateral could then be diminished and we would be more likely to suffer losses on defaulted loans. As of December 31, 2016, approximately 91.0% of the book value of our loan portfolio consisted of loans collateralized by various types of real estate. Substantially all of our real estate collateral is located in California. So if there is a significant adversely decline in real estate values in California, the collateral for our loans will provide less security. Real estate values could also be affected by, among other things, earthquakes, drought and national disasters in our markets. Any such downturn could have a material adverse effect on our business, financial condition, results of operations and cash flows.
9
Table of Contents
We depend on key personnel and the loss of one or more of those key personnel may materially and adversely affect our prospects.
Competition for qualified employees and personnel in the banking industry is intense and there are a limited number of qualified persons with knowledge of, and experience in, the California community banking industry. The process of recruiting personnel with the combination of skills and attributes required to carry out our strategies is often lengthy. Our success depends to a significant degree upon our ability to attract and retain qualified management, loan origination, finance, administrative, marketing and technical personnel and upon the continued contributions of our management and personnel. In particular, our success has been and continues to be highly dependent upon the abilities of our senior management team of Messrs. Smith, Bailey, Carney, Fleshood, O’Sullivan and Reddish, who have expertise in banking and collective experience in the California markets we serve and have targeted for future expansion. We also depend upon a number of other key executives who are California natives or are long-time residents and who are integral to implementing our business plan. The loss of the services of any one of our senior executive management team or other key executives could have a material adverse effect on our business, financial condition, results of operations and cash flows.
We are exposed to the risk of environmental liabilities with respect to properties to which we take title.
In the course of our business, we may foreclose and take title to real estate and could be subject to environmental liabilities with respect to these properties. We may be held liable to a governmental entity or to third parties for property damage, personal injury, investigation and clean-up costs incurred by these parties in connection with environmental contamination, or may be required to investigate or clean-up hazardous or toxic substances, or chemical releases at a property. The costs associated with investigation or remediation activities could be substantial. In addition, if we are the owner or former owner of a contaminated site, we may be subject to common law claims by third parties based on damages and costs resulting from environmental contamination emanating from the property. If we become subject to significant environmental liabilities, our business, financial condition, results of operations and cash flows could be materially adversely affected.
Strong competition in California could hurt our profits.
Competition in the banking and financial services industry is intense. Our profitability depends upon our continued ability to successfully compete. We compete exclusively in Northern and Central California for loans, deposits and customers with commercial banks, savings and loan associations, credit unions, finance companies, mutual funds, insurance companies, brokerage firms and Internet-based marketplace lending platforms. In particular, our competitors include major financial companies whose greater resources may afford them a marketplace advantage by enabling them to maintain numerous locations and mount extensive promotional and advertising campaigns. Additionally, banks and other financial institutions with larger capitalization and financial intermediaries not subject to bank regulatory restrictions may have larger lending limits which would allow them to serve the credit needs of larger customers. Areas of competition include interest rates for loans and deposits, efforts to obtain loan and deposit customers and a range in quality of products and services provided, including new technology-driven products and services. Technological innovation continues to contribute to greater competition in domestic and international financial services markets as technological advances enable more companies, such as Internet-based marketplace lenders, to provide financial services, often without many of regulatory and capital restrictions that we face.. We also face competition from out-of-state financial intermediaries that have opened loan production offices or that solicit deposits in our market areas. If we are unable to attract and retain banking customers, we may be unable to continue our loan growth and level of deposits and our business, financial condition, results of operations and cash flows may be adversely affected.
Our previous results may not be indicative of our future results.
We may not be able to sustain our historical rate of growth and level of profitability or may not even be able to grow our business or continue to be profitable at all. Various factors, such as economic conditions, regulatory and legislative considerations and competition, may also impede or prohibit our ability to expand our market presence and financial performance. If we experience a significant decrease in our historical rate of growth, our results of operations and financial condition may be adversely affected due to a high percentage of our operating costs being fixed expenses.
We may be adversely affected by the soundness of other financial institutions.
Financial services institutions are interrelated as a result of clearing, counterparty, or other relationships. We have exposure to many different industries and counterparties, and routinely execute transactions with counterparties in the financial services industry, including commercial banks, brokers and dealers, and other institutional clients. Many of these transactions expose us to credit risk in the event of a default by a counterparty or client. In addition, our credit risk may be exacerbated when the collateral that we hold cannot be realized upon or is liquidated at prices not sufficient to recover the full amount of the credit or derivative exposure due to us. Any such losses could have a material adverse affect on our financial condition and results of operations.
10
Table of Contents
Severe weather, natural disasters and other external events could adversely affect our business.
Severe weather, drought, fires, natural disasters such as earthquakes, or acts of war or terrorism and other adverse external events could have a significant impact on our ability to conduct business. Such events could also affect the stability of the Bank’s deposit base; impair the ability of borrowers to repay outstanding loans, impair the value of collateral securing loans and cause significant property damage, result in losses of revenue and/or cause us to incur additional expenses. Although we have established disaster recovery policies and procedures, the occurrence of any such event could have a material adverse effect on our business, financial condition and results of operations.
Market and Interest Rate Risk
Low interest rates could hurt our profits.
Our ability to earn a profit, like that of most financial institutions, depends on our net interest income, which is the difference between the interest income we earn on our interest-earning assets, such as mortgage loans and investments, and the interest expense we pay on our interest-bearing liabilities, such as deposits. Our profitability depends on our ability to manage our assets and liabilities during periods of changing market interest rates. Recently, the FRB has maintained the targeted federal funds rate at record low levels. A sustained decrease in market interest rates could adversely affect our earnings. When interest rates decline, borrowers tend to refinance higher-rate, fixed-rate loans at lower rates. Under those circumstances, we would not be able to reinvest those prepayments in assets earning interest rates as high as the rates on the prepaid loans on investment securities. In addition, our commercial real estate and commercial loans, which carry interest rates that adjust in accordance with changes in the prime rate, will adjust to lower rates.
Our business is subject to interest rate risk and variations in interest rates may negatively affect our financial performance.
Because of the differences in the maturities and repricing characteristics of our interest-earning assets and interest-bearing liabilities, changes in interest rates do not produce equivalent changes in interest income earned on interest-earning assets and interest paid on interest-bearing liabilities. Accordingly, fluctuations in interest rates could adversely affect our interest rate spread and, in turn, our profitability. In addition, loan origination volumes are affected by market interest rates. Rising interest rates, generally, are associated with a lower volume of loan originations while lower interest rates are usually associated with higher loan originations. Conversely, in rising interest rate environments, loan repayment rates may decline and in falling interest rate environments, loan repayment rates may increase. Although we have been successful in generating new loans during 2016, the continuation of historically low long-term interest rate levels may cause additional refinancing of commercial real estate and 1-4 family residence loans, which may depress our loan volumes or cause rates on loans to decline. In addition, an increase in the general level of short-term interest rates on variable rate loans may adversely affect the ability of certain borrowers to pay the interest on and principal of their obligations or reduce the amount they wish to borrow. Additionally, if short-term market rates rise, in order to retain existing deposit customers and attract new deposit customers we may need to increase rates we pay on deposit accounts. Accordingly, changes in levels of market interest rates could materially and adversely affect our net interest spread, asset quality, loan origination volume, business, financial condition, results of operations and cash flows.
Regulatory Risks
Recently enacted financial reform legislation has, among other things, created a new Consumer Financial Protection Bureau, tightened capital standards and resulted in new laws and regulations that are expected to increase our costs of operations.
The Dodd-Frank Act, which was enacted in 2010, significantly changed the current bank regulatory structure and affects the lending, deposit, investment, trading and operating activities of financial institutions and their holding companies. Among other things, the Dodd-Frank Act created a new Consumer Financial Protection Bureau with broad powers to supervise and enforce consumer protection laws. The CFPB has broad rule-making authority for a wide range of consumer protection laws that apply to all banks and savings institutions, including the authority to prohibit “unfair, deceptive or abusive” acts and practices. The CFPB has examination and enforcement authority over all banks and savings institutions with more than $10 billion in assets. Banks with $10 billion or less in assets, such as the Bank, are subject to the CFPB’s rules but continue to be examined for compliance with the consumer laws by their primary bank regulators. In addition, the Dodd-Frank Act required the FDIC and FRB to adopt new, more stringent capital rules that apply to us. The Dodd-Frank Act also weakens the federal preemption rules that have been applicable for national banks and federal savings associations, and gives state attorneys general the ability to enforce federal consumer protection laws.
11
Table of Contents
It is difficult to predict the continuing impact that the Dodd-Frank Act and the yet to be written implementing rules and regulations will have on community banks. However, it is expected that at a minimum they will increase our operating and compliance costs and could increase our interest expense.
We operate in a highly regulated environment and we may be adversely affected by new laws and regulations or changes in existing laws and regulations. Regulations may prevent or impair our ability to pay dividends, engage in acquisitions or operate in other ways.
We are subject to extensive regulation, supervision and examination by the DBO, FDIC, and the FRB. See Item 1—Regulation and Supervision of this report for information on the regulation and supervision which governs our activities. Regulatory authorities have extensive discretion in their supervisory and enforcement activities, including the imposition of restrictions on our operations, the classification of our assets and determination of the level of our allowance for loan losses. Banking regulations, designed primarily for the protection of depositors, may limit our growth and the return to our shareholders by restricting certain of our activities, such as:
| • | the payment of dividends to our shareholders, |
| • | possible mergers with or acquisitions of or by other institutions, |
| • | desired investments, |
| • | loans and interest rates on loans, |
| • | interest rates paid on deposits, |
| • | service charges on deposit account transactions, |
| • | service charges on deposit account transactions |
| • | the possible expansion of branch offices, and |
| • | the ability to provide securities or trust services. |
We also are subject to regulatory capital requirements and could be subject to enforcement actions to the extent that we don’t meet these requirements. Federal and state governments and regulators could pass legislation and adopt policies responsive to current credit conditions that would have an adverse effect on the Company and its financial performance. We cannot predict what changes, if any, will be made to existing federal and state legislation and regulations or the effect that such changes may have on our future business and earnings prospects. Any change in such regulation and oversight, whether in the form of regulatory policy, regulations, legislation or supervisory action, may have a material adverse impact on our operations.
Compliance with changing regulation of corporate governance and public disclosure may result in additional risks and expenses.
Changing laws, regulations and standards relating to corporate governance and public disclosure, including the Dodd-Frank Act, the Sarbanes-Oxley Act of 2002 and new SEC regulations, are creating additional expense for publicly-traded companies such as TriCo. The application of these laws, regulations and standard may evolve over time as new guidance is provided by regulatory and governing bodies, which could result in continuing uncertainty regarding compliance matters and higher costs necessitated by ongoing revisions to disclosure and governance practices. We are committed to maintaining high standards of corporate governance and public disclosure. As a result, our efforts to comply with evolving laws, regulations and standards have resulted in, and are likely to continue to result in, increased expenses and a diversion of management time and attention. In particular, our efforts to comply with Section 404 of the Sarbanes-Oxley Act of 2002 and the related regulations regarding management’s required assessment of its internal control over financial reporting and its external auditors’ audit of that assessment requires, and will continue to require, the commitment of significant financial and managerial resources. Further, the members of our board of directors, members of our audit or compensation and management succession committees, our chief executive officer, our chief financial officer and certain other executive officers could face an increased risk of personal liability in connection with the performance of their duties. It may also become more difficult and more expensive to obtain director and officer liability insurance. As a result, our ability to attract and retain executive officers and qualified board and committee members could be more difficult.
Risks Related to Growth and Expansion
Goodwill resulting from the acquisition of North Valley Bancorp may adversely affect our results of operations.
Goodwill and other intangible assets have increased substantially as a result of the acquisition of North Valley Bancorp. Potential impairment of goodwill and amortization of other intangible assets could adversely affect our financial condition and results of operations. We assess our goodwill and other intangible assets and long-lived assets for impairment annually and more frequently when required by U.S. GAAP. We are required to record an impairment charge if circumstances indicate that the asset carrying values exceed their fair values. Our assessment of goodwill, other intangible assets, or long-lived assets could indicate that an impairment of the carrying value of such assets may have occurred that could result in a material, non-cash write-down of such assets, which could have a material adverse effect on our results of operations and future earnings.
12
Table of Contents
If we cannot attract deposits, our growth may be inhibited.
We plan to increase the level of our assets, including our loan portfolio. Our ability to increase our assets depends in large part on our ability to attract additional deposits at favorable rates. We intend to seek additional deposits by offering deposit products that are competitive with those offered by other financial institutions in our markets and by establishing personal relationships with our customers. We cannot assure that these efforts will be successful. Our inability to attract additional deposits at competitive rates could have a material adverse effect on our business, financial condition, results of operations and cash flows.
There are potential risks associated with future acquisitions and expansions.
We intend to continue to explore expanding our branch system through opening new bank branches and in-store branches in existing or new markets in Northern and Central California. In the ordinary course of business, we evaluate potential branch locations that would bolster our ability to cater to the small business, individual and residential lending markets in California. Any given new branch, if and when opened, will have expenses in excess of revenues for varying periods after opening that may adversely affect our results of operations or overall financial condition.
In addition, to the extent that we acquire other banks in the future, our business may be negatively impacted by certain risks inherent with such acquisitions. These risks include:
| • | incurring substantial expenses in pursuing potential acquisitions without completing such acquisitions, |
| • | losing key clients as a result of the change of ownership, |
| • | the acquired business not performing in accordance with our expectations, |
| • | difficulties arising in connection with the integration of the operations of the acquired business with our operations, |
| • | needing to make significant investments and infrastructure, controls, staff, emergency backup facilities or other critical business functions that become strained by our growth, |
| • | management needing to divert attention from other aspects of our business, |
| • | potentially losing key employees of the acquired business, |
| • | incurring unanticipated costs which could reduce our earnings per share, |
| • | assuming potential liabilities of the acquired company as a result of the acquisition, and |
| • | an acquisition may dilute our earnings per share, in both the short and long term, or it may reduce our tangible capital ratios. |
As result of these risks, any given acquisition, if and when consummated, may adversely affect our results of operations or financial condition. In addition, because the consideration for an acquisition may involve cash, debt or the issuance of shares of our stock and may involve the payment of a premium over book and market values, existing shareholders may experience dilution in connection with any acquisition.
Our growth and expansion may strain our ability to manage our operations and our financial resources.
Our financial performance and profitability depend on our ability to execute our corporate growth strategy. In addition to seeking deposit and loan and lease growth in our existing markets, we may pursue expansion opportunities in new markets. Continued growth, however, may present operating and other problems that could adversely affect our business, financial condition, results of operations and cash flows. Accordingly, there can be no assurance that we will be able to execute our growth strategy or maintain the level of profitability that we have recently experienced.
Our growth may place a strain on our administrative, operational and financial resources and increase demands on our systems and controls. This business growth may require continued enhancements to and expansion of our operating and financial systems and controls and may strain or significantly challenge them. In addition, our existing operating and financial control systems and infrastructure may not be adequate to maintain and effectively monitor future growth. Our continued growth may also increase our need for qualified personnel. We cannot assure you that we will be successful in attracting, integrating and retaining such personnel.
Our decisions regarding the fair value of assets acquired from North Valley Bancorp, Citizens Bank of Northern California and Granite Community Bank, including the FDIC loss sharing assets or liabilities associated with Granite, could be inaccurate which could materially and adversely affect our business, financial condition, results of operations, and future prospects.
Management makes various assumptions and judgments about the collectability of acquired loans, including the creditworthiness of borrowers and the value of the real estate and other assets serving as collateral for the repayment of secured loans. In FDIC-assisted acquisitions that include loss sharing agreements, such as our acquisition of Granite
13
Table of Contents
Community Bank, we may record a loss sharing asset or liability that we consider adequate to absorb future losses or recoveries which may occur in the acquired loan portfolio. In determining the size of the loss sharing asset or liability, we analyze the loan portfolio based on historical loss experience, volume and classification of loans, volume and trends in delinquencies and nonaccruals, local economic conditions, and other pertinent information.
If our assumptions are incorrect, the balance of the FDIC indemnification asset or liability may at any time be insufficient to cover future loan losses or recoveries, and credit loss provisions may be needed to respond to different economic conditions or adverse developments in the acquired loan portfolio. Any increase in future loan losses could have a negative effect on our operating results.
Our ability to obtain reimbursement under the loss sharing agreement on covered assets purchased from the FDIC depends on our compliance with the terms of the loss sharing agreement.
We must certify to the FDIC on a quarterly basis our compliance with the terms of the FDIC loss sharing agreement as a prerequisite to obtaining reimbursement from the FDIC for realized losses on covered assets. The required terms of the agreements are extensive and failure to comply with any of the guidelines could result in a specific asset or group of assets permanently losing their loss sharing coverage. Additionally, Management may decide to forgo loss share coverage on certain assets to allow greater flexibility over the management of certain assets. As of December 31, 2016, $3,399,000, or 0.08%, of the Company’s assets were covered by these FDIC loss sharing agreements.
Risks Relating to Dividends and Our Common Stock
Our future ability to pay dividends is subject to restrictions.
As a holding company with no significant assets other than the Bank, we depend on dividends from the Bank to fund our operations and for a substantial portion of our revenues. Our ability to continue to pay dividends depends in large part upon our receipt of dividends or other capital distributions from the Bank. The ability of the Bank to pay dividends or make other capital distributions to us is subject to the restrictions in the California Financial Code. As of December 31, 2016, the Bank could have paid approximately $82,615,000 in dividends to TriCo without the prior approval of the DBO. The amount that the Bank may pay in dividends is further restricted due to the fact that the Bank must maintain a certain minimum amount of capital to be considered a “well capitalized” institution as well as a separate capital conservation buffer, as further described under “Item 1 – Supervision and Regulation — Regulatory Capital Requirements” in this report.
From time to time, we may become a party to financing agreements or other contractual arrangements that have the effect of limiting or prohibiting us or the Bank from declaring or paying dividends. Our holding company expenses and obligations with respect to our trust preferred securities and corresponding junior subordinated deferrable interest debentures issued by us may limit or impair our ability to declare or pay dividends. Finally, our ability to pay dividends is also subject to the restrictions of the California Corporations Code. See “Regulation and Supervision – Restrictions on Dividends and Distributions.”
Anti-takeover provisions and federal law may limit the ability of another party to acquire us, which could cause our stock price to decline.
Various provisions of our articles of incorporation and bylaws could delay or prevent a third party from acquiring us, even if doing so might be beneficial to our shareholders. These provisions provide for, among other things, specified actions that the Board of Directors shall or may take when an offer to merge, an offer to acquire all assets or a tender offer is received and the authority to issue preferred stock by action of the board of directors acting alone, without obtaining shareholder approval.
The BHC Act and the Change in Bank Control Act of 1978, as amended, together with federal regulations, require that, depending on the particular circumstances, either FRB approval must be obtained or notice must be furnished to the FRB and not disapproved prior to any person or entity acquiring “control” of a bank holding company such as TriCo. These provisions may prevent a merger or acquisition that would be attractive to shareholders and could limit the price investors would be willing to pay in the future for our common stock.
The amount of common stock owned by, and other compensation arrangements with, our officers and directors may make it more difficult to obtain shareholder approval of potential takeovers that they oppose.
As of December 31, 2016, directors and executive officers beneficially owned approximately 8.9% of our common stock and our Employee Stock Ownership Plan owned approximately 5.5%. Agreements with our senior management also provide for significant payments under certain circumstances following a change in control. These compensation arrangements, together with the common stock and option ownership of our board of directors and management, could make it difficult or expensive to obtain majority support for shareholder proposals or potential acquisition proposals of us that our directors and officers oppose.
14
Table of Contents
We may issue additional common stock or other equity securities in the future which could dilute the ownership interest of existing shareholders.
In order to maintain our capital at desired or regulatorily-required levels, or to fund future growth, our board of directors may decide from time to time to issue additional shares of common stock, or securities convertible into, exchangeable for or representing rights to acquire shares of our common stock. The sale of these shares may significantly dilute your ownership interest as a shareholder. New investors in the future may also have rights, preferences and privileges senior to our current shareholders which may adversely impact our current shareholders.
Holders of our junior subordinated debentures have rights that are senior to those of our common stockholders.
We have supported our continued growth through the issuance of trust preferred securities from special purpose trusts and accompanying junior subordinated debentures. At December 31, 2016, we had outstanding trust preferred securities and accompanying junior subordinated debentures with face value of $62,889,000. Payments of the principal and interest on the trust preferred securities are conditionally guaranteed by us. Further, the accompanying junior subordinated debentures we issued to the trusts are senior to our shares of common stock. As a result, we must make payments on the junior subordinated debentures before any dividends can be paid on our common stock and, in the event of our bankruptcy, dissolution or liquidation, the holders of the junior subordinated debentures must be satisfied before any distributions can be made on our common stock.
Risks Relating to Systems, Accounting and Internal Controls
If we fail to maintain an effective system of internal and disclosure controls, we may not be able to accurately report our financial results or prevent fraud. As a result, current and potential shareholders could lose confidence in our financial reporting, which would harm our business and the trading price of our securities.
Effective internal control over financial reporting and disclosure controls and procedures are necessary for us to provide reliable financial reports and effectively prevent fraud and to operate successfully as a public company. If we cannot provide reliable financial reports or prevent fraud, our reputation and operating results would be harmed. We continually review and analyze our internal control over financial reporting for Sarbanes-Oxley Section 404 compliance. As part of that process we may discover material weaknesses or significant deficiencies in our internal control as defined under standards adopted by the Public Company Accounting Oversight Board that require remediation. Material weakness is a deficiency, or combination of deficiencies, in internal control over financial reporting, such that there is a reasonable possibility that a material misstatement of the company’s annual or interim financial statements will not be prevented or detected in a timely basis. Significant deficiency is a deficiency or combination of deficiencies, in internal control over financial reporting that is less severe than material weakness, yet important enough to merit attention by those responsible for the oversight of the Company’s financial reporting.
As a result of weaknesses that may be identified in our internal control, we may also identify certain deficiencies in some of our disclosure controls and procedures that we believe require remediation. If we discover weaknesses, we will make efforts to improve our internal and disclosure control. However, there is no assurance that we will be successful. Any failure to maintain effective controls or timely effect any necessary improvement of our internal and disclosure controls could harm operating results or cause us to fail to meet our reporting obligations, which could affect our ability to remain listed with Nasdaq. Ineffective internal and disclosure controls could also cause investors to lose confidence in our reported financial information, which would likely have a negative effect on the trading price of our securities.
We rely on communications, information, operating and financial control systems technology and we may suffer an interruption in or breach of the security of those systems.
We rely heavily on our communications, information, operating and financial control systems technology to conduct our business. We rely on third party services providers to provide many of these systems. Any failure, interruption or breach in security of these systems could result in failures or interruptions in our customer relationship management, general ledger, deposit, servicing and loan origination systems. We cannot assure you that such failures, interruptions or security breaches will not occur or, if they do occur, that they will be adequately addressed by us or the third parties service providers on which we rely. The occurrence of any failures, interruptions or security breaches could damage our reputation, result in a loss of customers, expose us to possible financial liability, lead to additional regulatory scrutiny or require that we make expenditures for remediation or prevention. Any of these circumstances could have a material adverse effect on our business, financial condition, results of operations and cash flows.
15
Table of Contents
A failure to implement technological advances could negatively impact our business.
The banking industry is undergoing technological changes with frequent introductions of new technology-driven products and services. In addition to improving customer services, the effective use of technology increases efficiency and enables financial institutions to reduce costs. Our future success will depend, in part, on our ability to address the needs of our customers by using technology to provide products and services that will satisfy customer demands for convenience as well as to create additional efficiencies in our operations. Many of our competitors have substantially greater resources than we do to invest in technological improvements. We may not be able to effectively implement new technology-driven products and services or successfully market such products and services to our customers.
ITEM 1B. UNRESOLVED STAFF COMMENTS
None.
The Company is engaged in the banking business through 68 offices in 26 counties in Northern and Central California including twelve offices in Shasta County, eight in Butte County, six in Humboldt and Nevada Counties, four in Placer and Sacramento Counties, three in Siskiyou and Stanislaus Counties, two each in Glenn, Mendocino, Sutter and Trinity Counties, and one each in Colusa, Contra Costa, Del Norte, Fresno, Kern, Lake, Lassen, Madera, Merced, Sonoma, Tehama, Tulare, Yolo and Yuba Counties. All offices are constructed and equipped to meet prescribed security requirements.
The Company owns twenty-nine branch office locations, five administrative buildings, and two other buildings that it leases out. The Company leases thirty-nine branch office locations, two loan production offices, and three administrative locations. Most of the leases contain multiple renewal options and provisions for rental increases, principally for changes in the cost of living index, property taxes and maintenance.
On September 15, 2014, a former Personal Banker at one of the Bank’s in-store branches filed a Class Action Complaint against the Bank in Butte County Superior Court, alleging causes of action related to the observance of meal and rest periods and seeking to represent a class of current and former hourly-paid or non-exempt personal bankers, or employees with the same or similar job duties, employed by the Bank within the State of California during the preceding four years. On or about June 25, 2015, Plaintiff filed an Amended Complaint expanding the class definition to all current and formerly hourly-paid or non-exempt branch employees employed by the Bank within the State of California at any time during the period from September 15, 2010 to final judgment. The Bank responded to the First Amended Complaint, denying the charges, and the parties engaged in written discovery. The parties engaged in non-binding mediation of this action during the third quarter of 2016.
On January 20, 2015, a then-current Personal Banker at one of the Bank’s in-store branches filed a First Amended Complaint against Tri Counties Bank and TriCo Bancshares, dba Tri Counties Bank, in Sacramento County Superior Court, alleging causes of action related to wage statement violations. Plaintiff seeks to represent a class of current and former exempt and non-exempt employees who worked for the defendants during the time period beginning October 18, 2013 through the date of the filing of this action. The Company and the Bank responded to the First Amended Complaint, denying the charges, and engaged in written discovery with Plaintiff. The parties engaged in non-binding mediation of this action during the third quarter of 2016.
During the third quarter of 2016, the Bank agreed to settle the two foregoing matters. In connection with the settlement and in consideration for the full settlement and release of all claims, the Bank would pay up to $1.9 million. The actual cost of the settlement will depend on the number of claims submitted by purported class members and the Bank estimates that the actual cost of settlement will be approximately $1,450,000. In the event that the parties enter into a stipulation of settlement, hearings will be scheduled at which the court will consider the settlement. The settlement is subject to customary conditions, including court approval following notice to members of the purported classes. There can be no assurance that the parties will ultimately enter into a stipulation of settlement or that the court will approve the settlement even if the parties were to enter into such stipulation.
ITEM 4. MINE SAFETY DISCLOSURES
Inapplicable.
16
Table of Contents
ITEM 5. MARKET FOR REGISTRANT’S COMMON EQUITY, RELATED STOCKHOLDER MATTERS AND ISSUER PURCHASES OF EQUITY SECURITIES
Common Stock Market Prices and Dividends
The Company’s common stock is traded on the Nasdaq under the symbol “TCBK.” The following table shows the high and the low closing sale prices for the common stock for each quarter in the past two years, as reported by Nasdaq:
| High | Low | |||||||
| 2016: |
||||||||
| Fourth quarter |
$ | 34.46 | $ | 25.49 | ||||
| Third quarter |
$ | 28.40 | $ | 25.40 | ||||
| Second quarter |
$ | 28.90 | $ | 24.60 | ||||
| First quarter |
$ | 27.44 | $ | 23.80 | ||||
| 2015: |
||||||||
| Fourth quarter |
$ | 29.39 | $ | 24.25 | ||||
| Third quarter |
$ | 25.55 | $ | 23.08 | ||||
| Second quarter |
$ | 24.75 | $ | 23.18 | ||||
| First quarter |
$ | 24.77 | $ | 22.82 | ||||
As of February 24, 2017 there were approximately 1,616 shareholders of record of the Company’s common stock. On February 24, 2017, the closing sales price was $37.18.
The Company has paid cash dividends on its common stock in every quarter since March 1990, and it is currently the intention of the Board of Directors of the Company to continue payment of cash dividends on a quarterly basis. There is no assurance, however, that any dividends will be paid since they are dependent upon earnings, financial condition and capital requirements of the Company and the Bank. As of December 31, 2016 $82,615,000 was available for payment of dividends by the Bank to the Company, under applicable laws and regulations. The Company paid cash dividends of $0.15 per common share in each of the quarters ended December 31, 2016, September 30, 2016, June 30, 2016, March 31, 2016, and December 31, 2015, and $0.13 per common share in each of the quarters ended September 30, 2015, June 30, 2015, and $0.11 per common share in the quarter ended March 31, 2015.
Issuer Repurchases of Common Stock
The Company adopted a stock repurchase plan on August 21, 2007 for the repurchase of up to 500,000 shares of the Company’s common stock from time to time as market conditions allow. The 500,000 shares authorized for repurchase under this plan represented approximately 3.2% of the Company’s approximately 15,815,000 common shares outstanding as of August 21, 2007. This plan has no stated expiration date for the repurchases. As of December 31, 2016, the Company had purchased 166,600 shares under this plan.
The following table shows the repurchases made by the Company or any affiliated purchaser (as defined in Rule 10b-18(a)(3) under the Exchange Act) during the fourth quarter of 2016:
| Period |
(a) Total number of shares purchased(1) |
(b) Average price paid per share |
(c) Total number of shares purchased as of part of publicly announced plans or programs |
(d) Maximum number shares that may yet be purchased under the plans or programs(2) |
||||||||||||
| Oct. 1-31, 2016 |
— | — | — | 333,400 | ||||||||||||
| Nov. 1-30, 2016 |
176,779 | $ | 30.72 | — | 333,400 | |||||||||||
| Dec. 1-31, 2016 |
1,407 | $ | 34.18 | — | 333,400 | |||||||||||
|
|
|
|
|
|
|
|
|
|||||||||
| Total |
178,186 | $ | 30.74 | — | 333,400 | |||||||||||
| (1) | Includes shares purchased by the Company’s Employee Stock Ownership Plan and pursuant to various other equity incentive plans. See Note 19 to the consolidated financial statements at Item 8 of Part II of this report, for a discussion of the Company’s stock repurchased under equity compensation plans. |
| (2) | Does not include shares that may be purchased by the Company’s Employee Stock Ownership Plan and pursuant to various other equity incentive plans. |
17
Table of Contents
The following graph presents the cumulative total yearly shareholder return from investing $100 on December 31, 2011, in each of TriCo common stock, the Russell 3000 Index, and the SNL Western Bank Index. The SNL Western Bank Index compiled by SNL Financial includes banks located in California, Oregon, Washington, Montana, Hawaii and Alaska with market capitalization similar to that of TriCo’s. The amounts shown assume that any dividends were reinvested.
TriCo Bancshares
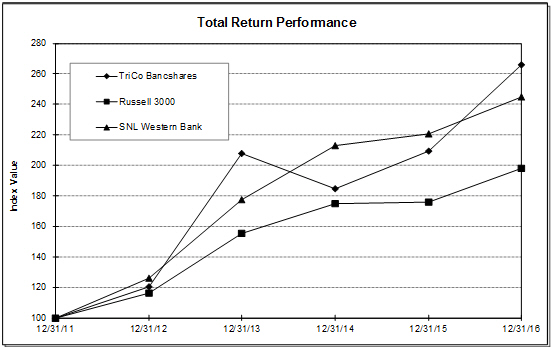
| Period Ending | ||||||||||||||||||||||||
| Index |
12/31/11 | 12/31/12 | 12/31/13 | 12/31/14 | 12/31/15 | 12/31/16 | ||||||||||||||||||
| TriCo Bancshares |
100.00 | 120.43 | 207.94 | 184.41 | 209.08 | 266.01 | ||||||||||||||||||
| Russell 3000 |
100.00 | 116.42 | 155.47 | 175.00 | 175.84 | 198.23 | ||||||||||||||||||
| SNL Western Bank |
100.00 | 126.20 | 177.56 | 213.09 | 220.79 | 244.77 | ||||||||||||||||||
Equity Compensation Plans
The following table shows shares reserved for issuance for outstanding options, stock appreciation rights and warrants granted under our equity compensation plans as of December 31, 2016. All of our equity compensation plans have been approved by shareholders.
| Plan category |
(a) Number of securities to be issued upon exercise of outstanding options, warrants and rights |
(b) Weighted average exercise price of outstanding options, warrants and rights |
(c) Number of securities remaining available for issuance under equity compensation plans (excluding securities reflected in column (a)) |
|||||||||
| Equity compensation plans not approved by shareholders |
— | — | — | |||||||||
| Equity compensation plans approved by shareholders |
708,126 | $ | 17.12 | 637,262 | ||||||||
|
|
|
|
|
|
|
|||||||
| Total |
708,126 | $ | 17.12 | 637,262 | ||||||||
18
Table of Contents
ITEM 6. SELECTED FINANCIAL DATA
The following selected consolidated financial data are derived from our consolidated financial statements. This data should be read in connection with our consolidated financial statements and the related notes located at Item 8 of this report.
TRICO BANCSHARES
Financial Summary
(in thousands, except per share amounts)
| Year ended December 31, |
2016 | 2015 | 2014 | 2013 | 2012 | |||||||||||||||
| Interest income |
$ | 173,708 | $ | 161,414 | $ | 121,115 | $ | 106,560 | $ | 108,716 | ||||||||||
| Interest expense |
5,721 | 5,416 | 4,681 | 4,696 | 7,344 | |||||||||||||||
| Net interest income |
167,987 | 155,998 | 116,434 | 101,864 | 101,372 | |||||||||||||||
| (Benefit from) provision for loan losses |
(5,970 | ) | (2,210 | ) | (4,045 | ) | (715 | ) | 9,423 | |||||||||||
| Noninterest income |
44,563 | 45,347 | 34,516 | 36,829 | 37,980 | |||||||||||||||
| Noninterest expense |
145,997 | 130,841 | 110,379 | 93,604 | 97,998 | |||||||||||||||
|
|
|
|
|
|
|
|
|
|
|
|||||||||||
| Income before income taxes |
72,523 | 72,714 | 44,616 | 45,804 | 31,931 | |||||||||||||||
| Provision for income taxes |
27,712 | 28,896 | 18,508 | 18,405 | 12,937 | |||||||||||||||
|
|
|
|
|
|
|
|
|
|
|
|||||||||||
| Net income |
$ | 44,811 | $ | 43,818 | $ | 26,108 | $ | 27,399 | $ | 18,994 | ||||||||||
|
|
|
|
|
|
|
|
|
|
|
|||||||||||
| Earnings per share: |
||||||||||||||||||||
| Basic |
$ | 1.96 | $ | 1.93 | $ | 1.47 | $ | 1.71 | $ | 1.19 | ||||||||||
| Diluted |
$ | 1.94 | $ | 1.91 | $ | 1.46 | $ | 1.69 | $ | 1.18 | ||||||||||
| Per share: |
||||||||||||||||||||
| Dividends paid |
$ | 0.60 | $ | 0.52 | $ | 0.44 | $ | 0.42 | $ | 0.36 | ||||||||||
| Book value at December 31 |
$ | 20.87 | $ | 19.85 | $ | 18.41 | $ | 15.61 | $ | 14.33 | ||||||||||
| Tangible book value at December 31 |
$ | 17.77 | $ | 16.81 | $ | 15.31 | $ | 14.59 | $ | 13.30 | ||||||||||
| Average common shares outstanding |
22,814 | 22,750 | 17,716 | 16,045 | 15,988 | |||||||||||||||
| Average diluted common shares outstanding |
23,087 | 22,998 | 17,923 | 16,197 | 16,052 | |||||||||||||||
| Shares outstanding at December 31 |
22,868 | 22,775 | 22,715 | 16,077 | 16,001 | |||||||||||||||
| At December 31: |
||||||||||||||||||||
| Loans, net of allowance |
$ | 2,727,090 | $ | 2,486,926 | $ | 2,245,939 | $ | 1,633,762 | $ | 1,522,175 | ||||||||||
| Total assets |
4,517,968 | 4,220,722 | 3,916,458 | 2,744,066 | 2,609,269 | |||||||||||||||
| Total deposits |
3,895,560 | 3,631,266 | 3,380,423 | 2,410,483 | 2,289,702 | |||||||||||||||
| Other borrowings |
17,493 | 12,328 | 9,276 | 6,335 | 9,197 | |||||||||||||||
| Junior subordinated debt |
56,667 | 56,470 | 56,272 | 41,238 | 41,238 | |||||||||||||||
| Shareholders’ equity |
477,347 | 452,116 | 418,172 | 250,946 | 229,359 | |||||||||||||||
| Financial Ratios: |
||||||||||||||||||||
| For the year: |
||||||||||||||||||||
| Return on average assets |
1.02 | % | 1.11 | % | 0.87 | % | 1.04 | % | 0.75 | % | ||||||||||
| Return on average equity |
9.46 | % | 10.04 | % | 8.67 | % | 11.34 | % | 8.44 | % | ||||||||||
| Net interest margin1 |
4.23 | % | 4.32 | % | 4.17 | % | 4.18 | % | 4.32 | % | ||||||||||
| Net loan (recoveries) losses to average loans |
(0.09 | )% | (0.07 | )% | (0.13 | )% | 0.23 | % | 0.82 | % | ||||||||||
| Efficiency ratio2 |
67.9 | % | 64.7 | % | 72.9 | % | 67.3 | % | 70.2 | % | ||||||||||
| Average equity to average assets |
10.84 | % | 11.01 | % | 10.00 | % | 9.21 | % | 8.91 | % | ||||||||||
| Dividend payout ratio |
30.6 | % | 27.2 | % | 30.1 | % | 24.9 | % | 30.5 | % | ||||||||||
| At December 31: |
||||||||||||||||||||
| Equity to assets |
10.57 | % | 10.71 | % | 10.68 | % | 9.15 | % | 8.79 | % | ||||||||||
| Total capital to risk-adjusted assets |
14.65 | % | 15.09 | % | 15.63 | % | 14.77 | % | 14.53 | % | ||||||||||
| 1 | Fully taxable equivalent. |
| 2 | The sum of fully taxable equivalent net interest income and noninterest income divided by noninterest expense. |
19
Table of Contents
ITEM 7. MANAGEMENT’S DISCUSSION AND ANALYSIS OF FINANCIAL CONDITION AND RESULTS OF OPERATIONS
General
As TriCo Bancshares has not commenced any business operations independent of the Bank, the following discussion pertains primarily to the Bank. Average balances, including such balances used in calculating certain financial ratios, are generally comprised of average daily balances for the Company. Within Management’s Discussion and Analysis of Financial Condition and Results of Operations, interest income and net interest income are generally presented on a fully tax-equivalent (FTE) basis. The presentation of interest income and net interest income on a FTE basis is a common practice within the banking industry. Interest income and net interest income are shown on a non-FTE basis in this Item 7 this report, and a reconciliation of the FTE and non-FTE presentations is provided below in the discussion of net interest income.
Critical Accounting Policies and Estimates
The Company’s discussion and analysis of its financial condition and results of operations are based upon its consolidated financial statements, which have been prepared in accordance with generally accepted accounting principles in the United States of America. The preparation of these financial statements requires the Company to make estimates and judgments that affect the reported amounts of assets, liabilities, revenues and expenses, and related disclosure of contingent assets and liabilities. On an on-going basis, the Company evaluates its estimates, including those that materially affect the financial statements and are related to the adequacy of the allowance for loan losses, investments, mortgage servicing rights, fair value measurements, retirement plans, intangible assets and the fair value of acquired assets and liabilities. The Company bases its estimates on historical experience and on various other assumptions that are believed to be reasonable under the circumstances, the results of which form the basis for making judgments about the carrying values of assets and liabilities that are not readily apparent from other sources. Actual results may differ from these estimates under different assumptions or conditions. The Company’s policies related to estimates on the allowance for loan losses, other than temporary impairment of investments and impairment of intangible assets, can be found in Note 1 in the financial statements at Item 8 of this report.
Average balances, including balances used in calculating certain financial ratios, are generally comprised of average daily balances for the Company. Within Management’s Discussion and Analysis of Financial Condition and Results of Operations, certain performance measures including interest income, net interest income, net interest yield, and efficiency ratio are generally presented on a fully tax-equivalent (FTE) basis. The Company believes the use of these non-generally accepted accounting principles (non-GAAP) measures provides additional clarity in assessing its results.
On March 18, 2016, the Bank completed its acquisition of three branch banking offices from Bank of America originally announced October 28, 2015. The acquired branches are located in Arcata, Eureka and Fortuna in Humboldt County on the North Coast of California, and have significant overlap compared to the Company’s then-existing Northern California customer base and branch locations. As a result, these branch acquisitions create potential cost savings and future growth potential. With the levels of capital at the time, the acquisitions fit well into the Company’s growth strategy. Also on March 18, 2016, the electronic customer service and other data processing systems of the acquired branches were converted into the Bank’s systems, and the effect of revenue and expenses from the operations of the acquired branches are included in the results of the Company. The Bank paid a premium of $3,204,000 for deposit relationships with balances of $161,231,000 and loans with balances of $289,000, and received cash of $159,520,000 from Bank of America.
On October 3, 2014, TriCo completed the acquisition of North Valley Bancorp. As part of the acquisition, North Valley Bank, a wholly-owned subsidiary of North Valley Bancorp, merged with and into Tri Counties Bank. In the acquisition, each share of North Valley common stock was converted into the right to receive 0.9433 shares of TriCo common stock. TriCo issued an aggregate of approximately 6.58 million shares of TriCo common stock to North Valley Bancorp shareholders, which was valued at a total of approximately $151 million based on the closing trading price of TriCo common stock on October 3, 2014 of $21.73. TriCo also assumed North Valley Bancorp’s obligations with respect to its outstanding trust preferred securities. Beginning on October 4, 2014, the effect of revenue and expenses from the operations of North Valley Bancorp, and the TriCo Bancshares common shares issued in consideration of the merger are included in the results of the Company.
North Valley Bank was a full-service commercial bank headquartered in Redding, California. North Valley conducted a commercial and retail banking services which included accepting demand, savings, and money market rate deposit accounts and time deposits, and making commercial, real estate and consumer loans. North Valley Bank had approximately $935 million in assets and 22 commercial banking offices in Shasta, Humboldt, Del Norte, Mendocino, Yolo, Sonoma, Placer and Trinity Counties in Northern California at June 30, 2014. See Note 2 in the financial statements at Item 8 of Part II of this report for a discussion about this transaction.
On September 23, 2011, the California DBO closed Citizens Bank of Northern California (“Citizens”), Nevada City, California and appointed the FDIC as receiver. That same date, the Bank assumed the banking operations of Citizens from the FDIC under a whole bank purchase and assumption agreement without loss sharing. With this agreement, the Bank added seven traditional bank branches including two in Grass Valley, and one in each of Nevada City, Penn Valley, Lake of the Pines, Truckee, and Auburn, California. This acquisition is consistent with the Bank’s community banking expansion strategy and provides further opportunity to fill in the Bank’s market presence in the Northern California market.
20
Table of Contents
On May 28, 2010, the Office of the Comptroller of the Currency closed Granite Community Bank (“Granite”), Granite Bay, California and appointed the FDIC as receiver. That same date, the Bank assumed the banking operations of Granite from the FDIC under a whole bank purchase and assumption agreement with loss sharing. Under the terms of the loss sharing agreement, the FDIC will cover a substantial portion of any future losses on loans, related unfunded loan commitments, other real estate owned (OREO)/foreclosed assets and accrued interest on loans for up to 90 days. The FDIC will absorb 80% of losses and share in 80% of loss recoveries on the covered assets acquired from Granite. The loss sharing arrangements for non-single family residential and single family residential loans are in effect for 5 years and 10 years, respectively, and the loss recovery provisions are in effect for 8 years and 10 years, respectively, from the acquisition date. With this agreement, the Bank added one traditional bank branch in each of Granite Bay and Auburn, California. This acquisition is consistent with the Bank’s community banking expansion strategy and provides further opportunity to fill in the Bank’s market presence in the greater Sacramento, California market.
The Company refers to loans and foreclosed assets that are covered by loss sharing agreements as “covered loans” and “covered foreclosed assets”, respectively. In addition, the Company refers to loans purchased or obtained in a business combination as “purchased credit impaired” (PCI) loans, or “purchased not credit impaired” (PNCI) loans. The Company refers to loans that it originates as “originated” loans. Additional information regarding the North Valley Bancorp acquisition can be found in Note 2 in the financial statements at Item 8 of this report. Additional information regarding the definitions and accounting for originated, PNCI and PCI loans can be found in Notes 1, 2, 4 and 5 in the financial statements at Item 8 of this report, and under the heading Asset Quality and Non-Performing Assets below.
Geographical Descriptions
For the purpose of describing the geographical location of the Company’s loans, the Company has defined northern California as that area of California north of, and including, Stockton; central California as that area of the State south of Stockton, to and including, Bakersfield; and southern California as that area of the State south of Bakersfield.
Results of Operations
Overview
The following discussion and analysis is designed to provide a better understanding of the significant changes and trends related to the Company and the Bank’s financial condition, operating results, asset and liability management, liquidity and capital resources and should be read in conjunction with the consolidated financial statements of the Company and the related notes at Item 8 of this report.
Following is a summary of the components of net income for the periods indicated (dollars in thousands):
| Year ended December 31, | ||||||||||||
| 2016 | 2015 | 2014 | ||||||||||
| Components of Net Income |
||||||||||||
| Net interest income |
$ | 167,987 | $ | 155,998 | $ | 116,434 | ||||||
| Benefit from (provision for) loan losses |
5,970 | 2,210 | 4,045 | |||||||||
| Noninterest income |
44,563 | 45,347 | 34,516 | |||||||||
| Noninterest expense |
(145,997 | ) | (130,841 | ) | (110,379 | ) | ||||||
| Taxes |
(27,712 | ) | (28,896 | ) | (18,508 | ) | ||||||
|
|
|
|
|
|
|
|||||||
| Net income |
$ | 44,811 | $ | 43,818 | $ | 26,108 | ||||||
|
|
|
|
|
|
|
|||||||
| Net income per average fully-diluted share |
$ | 1.94 | $ | 1.91 | $ | 1.46 | ||||||
| Net income as a percentage of average shareholders’ equity |
9.46 | % | 10.04 | % | 8.67 | % | ||||||
| Net income as a percentage of average total assets |
1.02 | % | 1.11 | % | 0.87 | % | ||||||
|
|
|
|
|
|
|
|||||||
Included in the Company’s results of operations for the year ended December 31, 2016 is the ongoing impact of the Company’s acquisition, on March 18, 2016, of three branch offices from Bank of America that included the acquisition of deposit relationships with balances totaling $161,231,000. Interest expense associated with the acquired deposit relationships was $5,000 from March 18, 2016 to March 31, 2016, and interest income from the net cash received in the transaction was estimated to be $27,000, assuming it was invested in Fed funds at an annualized earnings rate of 0.50%. Direct noninterest income and expense related to these branches from March 18, 2016 to March 31, 2016 were $14,000 and $659,000, respectively. Included in the $659,000 of noninterest expense related to these branches for the three months ended March 31, 2016 was $10,000 of core deposit intangible amortization, and $622,000 of nonrecurring acquisition expenses such as system conversion and customer communication related expenses. Other (indirect) noninterest income and expenses related to these branches and associated deposits, such as, increased data processing expense, are not readily distinguishable on a branch by branch basis. On June 8, 2016, the Company consolidated a preexisting branch into one of the branches acquired from Bank of America.
21
Table of Contents
Also included in the Company’s results of operations for the year ended December 31, 2016 is the impact of the sale on December 28, 2016, of twenty performing loans with recorded book value of $1,975,000, and 49 nonperforming loans with recorded book value, including pre-sale write downs and purchase discounts, of approximately $2,709,000. The loans sold on December 28, 2016 had contractual amounts outstanding of $7,100,000. Net sale proceeds of $5,851,000 resulted in the recovery of loan balances previously charged off of $692,000, additional loan charge offs of $316,000, interest income of $586,000 from the recovery of interest payments previously applied to principal balances, and gain on sale of $205,000. In addition, associated with the loans sold on December 28, 2016 were specific allowances for loan loss of $503,000 on September 30, 2016 that were no longer necessary at December 31, 2016; and had these loans not been sold, it is expected that the allowance for loan losses would have been approximately $503,000 higher than reported at December 31, 2016, and the reversal of provision for loan losses for the year ended December 31, 2016 would have been approximately $503,000 less than reported.
Also included in the Company’s results of operations for the year ended December 31, 2016 is the impact of the sale on August 22, 2016, of two performing loans with recorded book value of $166,000, and 48 nonperforming loans with recorded book value, including pre-sale write downs and purchase discounts, of approximately $2,757,000. The loans sold on August 22, 2016 had contractual amounts outstanding of $6,558,000. Net sale proceeds of $4,980,000 resulted in the recovery of loan balances previously charged off of $1,727,000, additional loan charge offs of $159,000, and interest income of $488,000 from the recovery of interest payments previously applied to principal balances.
Also included in the Company’s results of operations for the year ended December 31, 2016 is the impact of the purchase, on May 19, 2016 of seven performing multi-family commercial real estate loans valued at $22,503,000.
Also included in the Company’s results of operations for the year ended December 31, 2016 is the impact of the sale, on March 31, 2016, of twenty-seven nonperforming loans, nine substandard performing loans, and three purchased credit impaired loans with total contractual principal balances outstanding of $31,487,000, and recorded book value, including pre-sale write downs and purchase discounts, of approximately $24,810,000. Net proceeds from the sale of these loans were $27,049,000, and resulted in additional net loan write downs of $21,000, the recovery of $1,237,000 of interest income that was previously applied to the principal balance of loans in nonaccrual status, and a gain on sale of loans of $103,000. The twenty-seven nonperforming loans that were sold had a total recorded value of $13,058,000, and were sold for net proceeds of $14,973,000, resulting in the recovery of $575,000 of previously charged off principal balances, the recognition of $1,237,000 of interest income from interest payments previously applied to principal balances on nonaccrual loans, and a gain on sale of $103,000. The $13,058,000 recorded value of these nonperforming loans was the result of contractual principal balances outstanding of $17,169,000, less $1,578,000 of principal balances previously charged off, less $2,684,000 of interest payments previously applied to principal balances on nonaccrual loans, and the addition of $151,000 of unamortized loan purchase premiums net of unearned deferred loan fees. The nine substandard performing loans that were sold had a total recorded value of $9,508,000, and were sold for net proceeds of $8,912,000, resulting in a net loan principal write down and charge off of $596,000. The $9,508,000 recorded value of these performing loans was the result of contractual principal balances outstanding of $10,438,000, less $930,000 of unamortized loan purchase discounts and unearned deferred loan fees. Prior to their sale, the three loans with deteriorated credit quality acquired in a business combination were accounted for under Accounting Standards Codification Topic 310-30 using the “pooled method” of accounting for loans acquired with deteriorated credit quality. The Company classifies these types of loans in a category of loan it refers to as Purchased Credit Impaired-other (PCI-other) loans. The combined contractual principal balance of the three PCI-other loans sold on March 31, 2016 was $3,880,000, and they were sold for net proceeds of $3,164,000. The net sale proceeds of $3,164,000, along with other cash flows received on these loans during the three months ended March 31, 2016, represented a $446,000 decrease in estimated cash flows over their estimated remaining lives when compared to their previous estimated cash flows as of December 31, 2015. Previously, these three PCI-other loans were expected to be resolved by September 30, 2017. As a result of the magnitude and timing of the decrease in estimated cash flows for these three PCI-other loans, the loan pools associated with these PCI-other loans experienced an increase in interest income of $23,000 during the three months ended March 31, 2016, but are expected to realize a decrease in interest income of $469,000 over the remaining lives of the associated loan pools when compared to projected interest income under the previous (December 31, 2015) estimated cash flows for these three PCI-other loans.
Also included in the Company’s results of operations for the year ended December 31, 2016 is a $1,450,000 litigation contingent liability expense accrual recorded during the three months ended June 30, 2016, and representing the Company’s estimate of probable incurred losses associated with the legal proceedings originally brought against the Company on September 15, 2014 and January 20, 2015, and described further under the heading “Legal Proceedings” at Note 18 in Item 1 of Part I of this report.
Also included in the Company’s results of operations for the year ended December 31, 2016 was a $716,000 valuation allowance expense (recorded in miscellaneous other noninterest expense) related to a closed branch building held for sale, the value of which was written down to current market value, and subsequently sold during the three months ended September 30, 2016. Net proceeds from the sale of this building were $1,218,000, and resulted in no gain or additional loss being recorded upon the sale of this building.
22
Table of Contents
Net Interest Income
The Company’s primary source of revenue is net interest income, which is the difference between interest income on earning assets and interest expense on interest-bearing liabilities.
Following is a summary of the Company’s net interest income for the periods indicated (dollars in thousands):
| Year ended December 31, | ||||||||||||
| 2016 | 2015 | 2014 | ||||||||||
| Components of Net Interest Income |
||||||||||||
| Interest income |
$ | 173,708 | $ | 161,414 | $ | 121,115 | ||||||
| Interest expense |
(5,721 | ) | (5,416 | ) | (4,681 | ) | ||||||
|
|
|
|
|
|
|
|||||||
| Net interest income |
167,987 | 155,998 | 116,434 | |||||||||
| FTE adjustment |
2,329 | 905 | 303 | |||||||||
|
|
|
|
|
|
|
|||||||
| Net interest income (FTE) |
$ | 170,316 | $ | 156,903 | $ | 116,737 | ||||||
|
|
|
|
|
|
|
|||||||
| Net interest margin (FTE) |
4.23 | % | 4.32 | % | 4.17 | % | ||||||
|
|
|
|
|
|
|
|||||||
Net interest income (FTE) for the year ended December 31, 2016 increased $13,413,000 (8.6%) to $170,316,000 from $156,903,000 during the year ended December 31, 2015. The increase in net interest income (FTE) was due primarily to a $240,292,000 (10.1%) increase in the average balance of loans to $2,629,729,000, a $140,526,000 (13.4%) increase in the average balance of investments to $1,190,509,000, and a seven basis point increase in the average yield of nontaxable investments from 4.85% during the year ended December 31, 2015 to 4.92% during the year ended December 31, 2016 , that were partially offset by a 15 basis point decrease in the average yield on loans from 5.52% during the year ended December 31, 2015 to 5.37% during the year ended December 31, 2016, and a 15 basis point decrease in the average yield on investments taxable from 2.74% during the year ended December 31, 2015 to 2.59% during the year ended December 31, 2016. The $240,292,000 increase in average loan balances during 2016 compared to 2015 was due primarily to organic loan growth. The $140,526,000 increase in average investment balances during 2016 compared to 2015 was due primarily to investment purchases in excess of investment maturities. The increases in average loan and investment balances during 2016 were funded primarily by a $350,461,000 increase in the average balance of deposits, and a $37,528,000 increase in the average balance of shareholders’ equity during 2016. The $350,461,000 increase in the average balance of deposits during 2016 compared to 2015 included the effect of the purchase of three branches and $161,231,000 of deposits from Bank of America on March 18, 2016. The seven basis point increase in the average yield of investments nontaxable was due to purchases of investments nontaxable with higher average tax-equivalent yields during 2016 compared to the yields on investments nontaxable that the Company owned during 2015. The 15 basis point decrease in average loan yields was due primarily to declines in market yields on new and renewed loans compared to yields on repricing, maturing, and paid off loans. The 15 basis point decrease in the average yield of investments taxable was due to purchases of investments taxable with lower average tax-equivalent yields during 2016 compared to the yields on investments taxable that the Company owned during 2015, and increased amortization of purchase premiums on mortgage backed securities during 2016 compared to 2015. The increased amortization of purchase premiums on mortgage backed securities during 2016 was due primarily to faster prepayment of existing mortgages caused by higher mortgage refinance activity that was caused by reduced mortgage rates during most of 2016 compared to 2015. The increases in average loan and investment balances added $9,948,000 and $4,096,000, respectively, to net interest income (FTE) while the decreases in average loan and investments taxable yields reduced net interest income (FTE) during 2016 by $698,000 and $1,162,000, respectively, compared to 2015. The increase in average investments nontaxable yield increased net interest income (FTE) during 2016 by $1,019,000 compared to 2015. Included in investment interest income during the years ended December 31, 2016 and 2015 were special cash dividend of $578,000 and $626,000, respectively, from the Company’s investment in Federal Home Loan Bank of San Francisco stock. Included in loan interest income during the year ended December 31, 2016 was discount accretion from purchased loans of $7,399,000 compared to $10,056,000 during the year ended December 31, 2015. Also included in loan interest income during the year ended December 31, 2016 was interest income of $2,311,000 from the recovery of interest payments previously applied to principal balances of nonperforming loans sold during 2016. Included in loan interest income during the year ended December 31, 2015 was the recovery of $728,000 of loan interest income from the payoff of a single originated loan that was in interest nonaccrual status; and while recoveries of loan interest income from paid off nonaccrual loans occur from time to time, a single recovery of this magnitude is unusual.
Net interest income (FTE) for the year ended December 31, 2015 increased $40,166,000 (34.4%) to $156,903,000 from $116,737,000 during. The increase in net interest income (FTE) was due primarily to a $541,688,000 (29.3%) increase in the average balance of loans to $2,389,437,000, and a $505,217,000 (93%) increase in the average balance of investments to $1,049,983,000 that were partially offset by a 10 basis point decrease in the average yield on loans from 5.62% during the year ended December 31, 2014 to 5.52% during the year ended December 31, 2015, and a 17 basis point decrease in the average yield on investments from 3.01% during the year ended December 31, 2014 to 2.84% during the year ended December 31, 2015. The $541,688,000 increase in average loan balances compared to the prior year was due primarily to the addition of $499,327,000 of loans through the acquisition of North Valley Bancorp on October 4, 2014, and net loan growth
23
Table of Contents
of $240,414,000 (10.5%) during the year ended December 31, 2015. The $505,217,000 increase in average investment balances from the prior year was due primarily to the addition of $212,616,000 of investments through the acquisition of North Valley Bancorp on October 4, 2014, and $371,784,000 of investment purchases in excess of investment maturities and paydowns during 2015. The 10 basis point decrease in average loan yields was due primarily to declines in market yields on new and renewed loans compared to yields on repricing, maturing, and paid off loans. The decrease in average investment yields was due primarily to declines in market yields on new investments compared to yields on existing investments. The increases in average loan and investment balances added $30,443,000 and $15,493,000, respectively, to net interest income (FTE) while the decreases in average loan and investment yields reduced net interest income (FTE) during 2015 by $2,494,000 and $2,056,000, respectively, when compared to 2014. Included in investment interest income during the year ended December 31, 2015 was a special cash dividend of $626,000 from the Company’s investment in Federal Home Loan Bank of San Francisco stock. Included in loan interest income during the year ended December 31, 2015 was discount accretion from purchased loans of $10,056,000 compared to $6,437,000 of discount accretion from purchased loans during the year ended December 31, 2014. Also included in loan interest income during the year ended December 31, 2015 was the recovery of $728,000 of loan interest income from the payoff of a single originated loan that was in interest nonaccrual status; and while recoveries of loan interest income from paid off nonaccrual loans occur from time to time, a single recovery of this magnitude is unusual.
For more information related to loan interest income, including loan purchase discount accretion, see the Summary of Average Balances, Yields/Rates and Interest Differential and Note 30 to the consolidated financial statements at Part II, Item 8 of this report. The “Yield” and “Volume/Rate” tables shown below are useful in illustrating and quantifying the developments that affected net interest income during 2016 and 2015.
Summary of Average Balances, Yields/Rates and Interest Differential – Yield Tables
The following tables present, for the periods indicated, information regarding the Company’s consolidated average assets, liabilities and shareholders’ equity, the amounts of interest income from average earning assets and resulting yields, and the amount of interest expense paid on interest-bearing liabilities. Average loan balances include nonperforming loans. Interest income includes proceeds from loans on nonaccrual loans only to the extent cash payments have been received and applied to interest income. Yields on securities and certain loans have been adjusted upward to reflect the effect of income thereon exempt from federal income taxation at the current statutory tax rate (dollars in thousands):
| Year ended December 31, 2016 | ||||||||||||
| Average balance |
Interest income/expense |
Rates earned/paid |
||||||||||
| Assets |
||||||||||||
| Loans |
$ | 2,629,729 | $ | 141,086 | 5.37 | % | ||||||
| Investment securities—taxable |
1,064,410 | 27,578 | 2.59 | % | ||||||||
| Investment securities—nontaxable |
126,099 | 6,210 | 4.92 | % | ||||||||
| Cash at Federal Reserve and other banks |
205,263 | 1,163 | 0.57 | % | ||||||||
|
|
|
|
|
|||||||||
| Total earning assets |
4,025,501 | 176,037 | 4.37 | % | ||||||||
|
|
|
|||||||||||
| Other assets |
347,521 | |||||||||||
|
|
|
|||||||||||
| Total assets |
$ | 4,373,022 | ||||||||||
|
|
|
|||||||||||
| Liabilities and shareholders’ equity |
||||||||||||
| Interest-bearing demand deposits |
$ | 878,436 | 441 | 0.05 | % | |||||||
| Savings deposits |
1,344,304 | 1,685 | 0.13 | % | ||||||||
| Time deposits |
342,511 | 1,357 | 0.40 | % | ||||||||
| Other borrowings |
18,873 | 9 | 0.05 | % | ||||||||
| Junior subordinated debt |
56,566 | 2,229 | 3.94 | % | ||||||||
|
|
|
|
|
|||||||||
| Total interest-bearing liabilities |
2,640,690 | 5,721 | 0.22 | % | ||||||||
|
|
|
|||||||||||
| Noninterest-bearing demand |
1,193,297 | |||||||||||
| Other liabilities |
65,206 | |||||||||||
| Shareholders’ equity |
473,829 | |||||||||||
|
|
|
|||||||||||
| Total liabilities and shareholders’ equity |
$ | 4,373,022 | ||||||||||
|
|
|
|||||||||||
| Net interest spread (1) |
4.15 | % | ||||||||||
| Net interest income and interest margin (2) |
$ | 170,316 | 4.23 | % | ||||||||
|
|
|
|
|
|||||||||
| (1) | Net interest spread represents the average yield earned on interest-earning assets less the average rate paid on interest-bearing liabilities. |
| (2) | Net interest margin is computed by dividing net interest income by total average earning assets. |
24
Table of Contents
Summary of Average Balances, Yields/Rates and Interest Differential – Yield Tables (continued)
| Year ended December 31, 2015 | ||||||||||||
| Average balance |
Interest income/expense |
Rates earned/paid |
||||||||||
| Assets |
||||||||||||
| Loans |
$ | 2,389,437 | $ | 131,836 | 5.52 | % | ||||||
| Investment securities—taxable |
1,000,221 | 27,421 | 2.74 | % | ||||||||
| Investment securities—nontaxable |
49,762 | 2,414 | 4.85 | % | ||||||||
| Cash at Federal Reserve and other banks |
189,506 | 648 | 0.34 | % | ||||||||
|
|
|
|
|
|||||||||
| Total earning assets |
3,628,926 | 162,319 | 4.47 | % | ||||||||
|
|
|
|||||||||||
| Other assets |
335,072 | |||||||||||
|
|
|
|||||||||||
| Total assets |
$ | 3,963,998 | ||||||||||
|
|
|
|||||||||||
| Liabilities and shareholders’ equity |
||||||||||||
| Interest-bearing demand deposits |
$ | 808,281 | 476 | 0.06 | % | |||||||
| Savings deposits |
1,183,201 | 1,475 | 0.12 | % | ||||||||
| Time deposits |
340,443 | 1,482 | 0.44 | % | ||||||||
| Other borrowings |
8,668 | 4 | 0.05 | % | ||||||||
| Junior subordinated debt |
56,345 | 1,979 | 3.51 | % | ||||||||
|
|
|
|
|
|||||||||
| Total interest-bearing liabilities |
2,396,938 | 5,416 | 0.23 | % | ||||||||
|
|
|
|||||||||||
| Noninterest-bearing demand |
1,076,162 | |||||||||||
| Other liabilities |
54,597 | |||||||||||
| Shareholders’ equity |
436,301 | |||||||||||
|
|
|
|||||||||||
| Total liabilities and shareholders’ equity |
$ | 3,963,998 | ||||||||||
|
|
|
|||||||||||
| Net interest spread (1) |
4.24 | % | ||||||||||
| Net interest income and interest margin (2) |
$ | 156,903 | 4.32 | % | ||||||||
|
|
|
|
|
|||||||||
| Year ended December 31, 2014 | ||||||||||||
| Average balance |
Interest income/expense |
Rates earned/paid |
||||||||||
| Assets |
||||||||||||
| Loans |
$ | 1,847,749 | $ | 103,887 | 5.62 | % | ||||||
| Investment securities—taxable |
527,742 | 15,590 | 2.95 | % | ||||||||
| Investment securities—nontaxable |
17,024 | 808 | 4.75 | % | ||||||||
| Cash at Federal Reserve and other banks |
404,056 | 1,133 | 0.28 | % | ||||||||
|
|
|
|
|
|||||||||
| Total earning assets |
2,796,571 | 121,418 | 4.34 | % | ||||||||
|
|
|
|||||||||||
| Other assets |
216,878 | |||||||||||
|
|
|
|||||||||||
| Total assets |
$ | 3,013,449 | ||||||||||
|
|
|
|||||||||||
| Liabilities and shareholders’ equity |
||||||||||||
| Interest-bearing demand deposits |
$ | 605,241 | 484 | 0.08 | % | |||||||
| Savings deposits |
926,389 | 1,153 | 0.12 | % | ||||||||
| Time deposits |
291,515 | 1,637 | 0.56 | % | ||||||||
| Other borrowings |
7,512 | 4 | 0.05 | % | ||||||||
| Junior subordinated debt |
44,366 | 1,403 | 3.16 | % | ||||||||
|
|
|
|
|
|||||||||
| Total interest-bearing liabilities |
1,875,023 | 4,681 | 0.25 | % | ||||||||
|
|
|
|||||||||||
| Noninterest-bearing demand |
801,056 | |||||||||||
| Other liabilities |
36,085 | |||||||||||
| Shareholders’ equity |
301,285 | |||||||||||
|
|
|
|||||||||||
| Total liabilities and shareholders’ equity |
$ | 3,013,449 | ||||||||||
|
|
|
|||||||||||
| Net interest spread (1) |
4.09 | % | ||||||||||
| Net interest income and interest margin (2) |
$ | 116,737 | 4.17 | % | ||||||||
|
|
|
|
|
|||||||||
| (1) | Net interest spread represents the average yield earned on interest-earning assets less the average rate paid on interest-bearing liabilities. |
| (2) | Net interest margin is computed by dividing net interest income by total average earning assets. |
25
Table of Contents
Summary of Changes in Interest Income and Expense due to Changes in Average Asset and Liability Balances and Yields Earned and Rates Paid – Volume/Rate Tables
The following table sets forth a summary of the changes in the Company’s interest income and interest expense from changes in average asset and liability balances (volume) and changes in average interest rates for the periods indicated. The rate/volume variance has been included in the rate variance. Amounts are calculated on a fully taxable equivalent basis:
| 2016 over 2015 | 2015 over 2014 | |||||||||||||||||||||||
| Yield/ | Yield/ | |||||||||||||||||||||||
| Volume | Rate | Total | Volume | Rate | Total | |||||||||||||||||||
| (dollars in thousands) | ||||||||||||||||||||||||
| Increase (decrease) in |
||||||||||||||||||||||||
| interest income: |
||||||||||||||||||||||||
| Loans |
$ | 9,948 | $ | (698 | ) | $ | 9,250 | $ | 30,443 | $ | (2,494 | ) | $ | 27,949 | ||||||||||
| Investments—taxable |
1,319 | (1,162 | ) | 157 | 13,938 | (2,107 | ) | 11,831 | ||||||||||||||||
| Investments—nontaxable |
2,777 | 1,019 | 3,796 | 1,555 | 51 | 1,606 | ||||||||||||||||||
| Cash at Federal Reserve and other banks |
40 | 475 | 515 | (601 | ) | 116 | (485 | ) | ||||||||||||||||
|
|
|
|
|
|
|
|
|
|
|
|
|
|||||||||||||
| Total |
14,084 | (366 | ) | 13,718 | 45,335 | (4,434 | ) | 40,901 | ||||||||||||||||
|
|
|
|
|
|
|
|
|
|
|
|
|
|||||||||||||
| Increase (decrease) in interest expense: |
||||||||||||||||||||||||
| Demand deposits (interest-bearing) |
32 | (67 | ) | (35 | ) | 162 | (170 | ) | (8 | ) | ||||||||||||||
| Savings deposits |
145 | 65 | 210 | 308 | 14 | 322 | ||||||||||||||||||
| Time deposits |
7 | (133 | ) | (126 | ) | 274 | (428 | ) | (154 | ) | ||||||||||||||
| Other borrowings |
4 | 1 | 5 | 1 | (1 | ) | — | |||||||||||||||||
| Junior subordinated debt |
6 | 245 | 251 | 379 | 196 | 575 | ||||||||||||||||||
|
|
|
|
|
|
|
|
|
|
|
|
|
|||||||||||||
| Total |
194 | 111 | 305 | 1,124 | (389 | ) | 735 | |||||||||||||||||
|
|
|
|
|
|
|
|
|
|
|
|
|
|||||||||||||
| Increase (decrease) in net interest income |
$ | 13,890 | $ | (477 | ) | $ | 13,413 | $ | 44,211 | $ | (4,045 | ) | $ | 40,166 | ||||||||||
|
|
|
|
|
|
|
|
|
|
|
|
|
|||||||||||||
Provision for Loan Losses
The provision for loan losses during any period is the sum of the allowance for loan losses required at the end of the period and any loan charge offs during the period, less the allowance for loan losses required at the beginning of the period, and less any loan recoveries during the period. See the Tables labeled “Allowance for loan losses – year ended December 31, 2016 and 2015” at Note 5 in Item 8 of Part II of this report for the components that make up the provision for loan losses for the years ended December 31, 2016 and 2015.
The Company benefited from a $5,970,000 reversal of provision for loan losses during the year ended December 31, 2016 versus a $2,210,000 reversal of provision for loan losses during the year ended December 31, 2015. The increase in the reversal of provision for loan losses for the year ended December 31, 2016 compared to the year ended December 31, 2015 was primarily the result of an increase in net loan recoveries from 0.07% of average loans during 2015 to 0.09% of average loans during 2016, a decrease in nonperforming loans from $37,119,000 at December 31, 2015 to $20,128,000 at December 31, 2016, continued improvement in loan portfolio loss history, and improvements in collateral values and estimated cash flows related to nonperforming loans and purchased credit impaired loans. As shown in the Table labeled “Allowance for Loan Losses—year ended December 31, 2016” at Note 5 in Item 8 of Part II of this report, residential real estate loans, home equity lines of credit, home equity loans, and commercial construction loans experienced a reversal of provision for loan losses during the year ended December 31, 2016. The level of provision, or reversal of provision, for loan losses of each loan category during the year ended December 31, 2016 was due primarily to a decrease in the required allowance for loan losses as of December 31, 2016 when compared to the required allowance for loan losses as of December 31, 2015 less net charge-offs during the year ended December 31, 2016. All categories of loans except commercial real estate mortgage loans, C & I loans, and residential construction loans experienced a decrease in the required allowance for loan losses during the year ended December 31, 2016. These decreases in required allowance for loan losses were due primarily to reduced impaired loans, improvements in estimated cash flows and collateral values for the remaining and newly impaired loans, and reductions in historical loss factors that, in part, determine the required loan loss allowance for performing loans in accordance with the Company’s allowance for loan losses methodology as described under the heading “Loans and Allowance for Loan Losses” at Note 1 in Item 8 of Part II of this report. These same factors were also present, to some extent, for commercial real estate mortgage loans, C & I loans, and residential construction loans, but were more than offset by the effect of increased loan balances in these loan categories resulting in net provisions for loan losses in these categories during the year ended December 31, 2016. For details of the change in nonperforming loans during the year ended December 31, 2016 see the Tables, and associated narratives, labeled “Changes in nonperforming assets during the year ended December 31, 2016” and “Changes in nonperforming assets during the three months ended December 31, September 30, June 30, and March 31, 2016” under the heading “Asset Quality and Non-Performing Assets” below.
26
Table of Contents
The Company benefited from a $2,210,000 reversal of provision for loan losses during the year ended December 31, 2015 versus a $4,045,000 reversal of provision for loan losses during the year ended December 31, 2014. The decrease in the reversal of provision for loan losses for the year ended December 31, 2015 as compared to the year ended December 31, 2014 was primarily the result of increased loan originations during 2015 compared to 2014, and a decrease in net loan recoveries from 0.13% of average loans during 2014 to 0.07% of average loans during 2015. During 2015, improvements in collateral values and estimated cash flows related to nonperforming loans and purchased credit impaired loans, and reductions in nonperforming loans contributed to the reversal of provision for loan losses. As shown in the Table labeled “Allowance for Loan Losses—year ended December 31, 2015” at Note 5 in Item 8 of Part II of this report, residential real estate loans, home equity lines of credit, auto indirect loans, and residential construction loans experienced a reversal of provision for loan losses during the year ended December 31, 2015. The level of provision, or reversal of provision, for loan losses of each loan category during the year ended December 31, 2015 was due primarily to a decrease in the required allowance for loan losses as of December 31, 2015 when compared to the required allowance for loan losses as of December 31, 2014 less net charge-offs during the year ended December 31, 2015, and the effect of the changes in the allowance methodology during the year ended December 31, 2015 as described under the heading “Loans and Allowance for Loan Losses” at Note 1 in Item 8 of Part II of this report. All categories of loans except commercial real estate mortgage loans, C & I loans, and commercial construction loans experienced a decrease in the required allowance for loan losses during the year ended December 31, 2015. These decreases in required allowance for loan losses were due primarily to reduced impaired loans, improvements in estimated cash flows and collateral values for the remaining and newly impaired loans, and reductions in historical loss factors that, in part, determine the required loan loss allowance for performing loans in accordance with the Company’s allowance for loan losses methodology as described under the heading “Loans and Allowance for Loan Losses” at Note 1 in Item 8 of Part II of this report. These same factors were also present, to some extent, for commercial real estate mortgage loans, C & I loans, and commercial construction loans, but were more than offset by the effect of increased loan balances in these loan categories resulting in net provisions for loan losses in these categories during the year ended December 31, 2015. For details of the change in nonperforming loans during the year ended December 31, 2015 see the Tables, and associated narratives, labeled “Changes in nonperforming assets during the year ended December 31, 2015” and “Changes in nonperforming assets during the three months ended December 31, September 30, June 30, and March 31, 2015” under the heading “Asset Quality and Non-Performing Assets” below. During the year ended December 31, 2015, the Company made one change to its allowance for loan loss methodology. The change in methodology is described under the heading “Allowance for loan losses” in the section below labeled “Financial Condition”. Excluding the effect of the change in allowance methodology during the year ended December 31, 2015, the reversal of provision for loan losses during the year ended December 31, 2015 would have been approximately $3,528,000, or $1,318,000 more than the $2,210,000 that was actually recorded, and the allowance for loan losses at December 31, 2015 would have been approximately $34,693,000, or $1,318,000 less than the $36,011,000 that was actually recorded.
The provision for loan losses related to Originated and PNCI loans is based on management’s evaluation of inherent risks in these loan portfolios and a corresponding analysis of the allowance for loan losses. The provision for loan losses related to PCI loan portfolio is based on changes in estimated cash flows expected to be collected on PCI loans. Additional discussion on loan quality, our procedures to measure loan impairment, and the allowance for loan losses is provided under the heading “Asset Quality and Non-Performing Assets” below.
Management re-evaluates the loss ratios and other assumptions used in its calculation of the allowance for loan losses for its Originated and PNCI loan portfolios on a quarterly basis and makes changes as appropriate based upon, among other things, changes in loss rates experienced, collateral support for underlying loans, changes and trends in the economy, and changes in the loan mix. Management also re-evaluates expected cash flows used in its accounting for its PCI loan portfolio, including any required allowance for loan losses, on a quarterly basis and makes changes as appropriate based upon, among other things, changes in loan repayment experience, changes in loss rates experienced, and collateral support for underlying loans.
27
Table of Contents
Noninterest Income
The following table summarizes the Company’s noninterest income for the periods indicated (dollars in thousands):
| Year ended December 31, | ||||||||||||
| 2016 | 2015 | 2014 | ||||||||||
| Components of Noninterest Income: |
||||||||||||
| Service charges on deposit accounts |
$ | 14,365 | $ | 14,276 | $ | 11,811 | ||||||
| ATM fees and interchange |
15,859 | 13,364 | 9,651 | |||||||||
| Other service fees |
3,121 | 2,977 | 2,206 | |||||||||
| Mortgage banking service fees |
2,065 | 2,164 | 1,869 | |||||||||
| Change in value of mortgage servicing rights |
(2,184 | ) | (701 | ) | (1,301 | ) | ||||||
|
|
|
|
|
|
|
|||||||
| Total service charges and fees |
33,226 | 32,080 | 24,236 | |||||||||
| Gain on sale of loans |
4,037 | 3,064 | 2,032 | |||||||||
| Commissions on sale of nondeposit investment products |
2,329 | 3,349 | 2,995 | |||||||||
| Increase in cash value of life insurance |
2,717 | 2,786 | 1,953 | |||||||||
| Change in indemnification asset |
(493 | ) | (207 | ) | (856 | ) | ||||||
| Gain on disposition of foreclosed assets |
262 | 991 | 2,153 | |||||||||
| Gain on life insurance death benefit |
238 | 155 | — | |||||||||
| Lease brokerage income |
711 | 712 | 504 | |||||||||
| Other noninterest income |
1,536 | 2,417 | 1,499 | |||||||||
|
|
|
|
|
|
|
|||||||
| Total noninterest income |
$ | 44,563 | $ | 45,347 | $ | 34,516 | ||||||
|
|
|
|
|
|
|
|||||||
Noninterest income decreased $784,000 (1.7%) to $44,563,000 in 2016 compared to 2015. The decrease in noninterest income was due primarily to $870,000 of recoveries of loans from acquired institutions that were charged off prior to acquisition of those institutions by the Company that were recorded in other noninterest income during the year ended December 31, 2015, a $1,483,000 decrease in change in value of mortgage servicing rights, a $1,020,000 decrease in commissions on sale of nondeposit investment products, and a $729,000 decrease in gain on sale of foreclosed assets that were partially offset by a $2,495,000 increase in ATM fees and interchange income and a $973,000 increase in gain on sale of loans. The decrease in change in value of mortgage servicing rights (MSRs) is primarily due to a change in the required rate of return on MSRs by market participants and a decrease in estimated future MSR cash flows as a result of reduced mortgage rates and higher rates of early mortgage payoffs from mortgage refinancing, both of which reduced the value of such MSRs during the year ended December 31, 2016 compared to a smaller decrease in the value of MSRs during the year ended December 31, 2015 that was primarily due to a decrease in estimated future MSR cash flows as a result of reduced mortgage rates and higher rates of early mortgage payoffs from mortgage refinancing. The decrease in gain on sale of foreclosed assets was due to decreased foreclosed asset sales during the year ended December 31, 2016, and the uniqueness of individual foreclosed asset sales when compared to the year-ago period. The $2,495,000 increase in ATM fees and interchange revenue was primarily due to the Company’s increased focus in this area, including the introduction of new services in this area during the quarter ended March 31, 2016. The $973,000 increase in gain on sale of loans was due to continued high levels of refinance and home purchase activity, and increased focus in this area by the Company. The $4,037,000 of gain on sale of loans during 2016 included $3,729,000 of gain on sale of residential real estate loans originated for sale, and $308,000 of gain on sale of loans not originated for sale. The changes in noninterest income include the effects from the operation of three branches, including $161,231,000 of deposits, acquired from Bank of America on March 18, 2016.
Noninterest income increased $10,831,000 (31.4%) to $45,347,000 in 2015 compared to 2014. The increase in noninterest income was due primarily to an increase in service charges on deposit accounts of $2,465,000 (20.9%) to $14,276,000, an increase in ATM fees and interchange revenue of $3,454,000 (35.8%) to $13,105,000, and an increase of $1,032,000 (50.8%) in gain on sale of loans to $3,064,000 compared to the year-ago period. These increases and the increases in other categories of noninterest income noted in the table above are primarily the result of the acquisition of North Valley Bancorp on October 4, 2014, and $870,000 of recoveries of loans from acquired institutions that were charged off prior to acquisition of those institutions by the Company that were recorded in other noninterest income during the year ended December 31, 2015. Partially offsetting these increases was a decrease of $1,162,000 in gain on sale of foreclosed assets to $991,000 during the year ended December 31, 2015. The decrease in gain on sale of foreclosed assets is due to decreased foreclosed asset sales during the year ended December 31, 2015, and the uniqueness of individual foreclosed asset sales when compared to the year-ago period.
28
Table of Contents
Noninterest Expense
The following table summarizes the Company’s other noninterest expense for the periods indicated (dollars in thousands):
| Year ended December 31, | ||||||||||||
| 2016 | 2015 | 2014 | ||||||||||
| Components of Noninterest Expense |
||||||||||||
| Salaries and related benefits: |
||||||||||||
| Base salaries, net of deferred loan origination costs |
$ | 53,169 | $ | 46,822 | $ | 39,342 | ||||||
| Incentive compensation |
8,872 | 6,964 | 5,068 | |||||||||
| Benefits and other compensation costs |
18,683 | 17,619 | 13,134 | |||||||||
|
|
|
|
|
|
|
|||||||
| Total salaries and related benefits |
80,724 | 71,405 | 57,544 | |||||||||
|
|
|
|
|
|
|
|||||||
| Other noninterest expense: |
||||||||||||
| Occupancy |
10,139 | 10,126 | 8,203 | |||||||||
| Equipment |
6,597 | 5,997 | 4,514 | |||||||||
| Data processing and software |
8,846 | 7,670 | 6,512 | |||||||||
| Assessments |
2,105 | 2,572 | 2,107 | |||||||||
| ATM & POS network charges |
4,999 | 4,190 | 2,996 | |||||||||
| Advertising & marketing |
3,829 | 3,992 | 2,413 | |||||||||
| Professional fees |
5,409 | 4,545 | 3,888 | |||||||||
| Telecommunications |
2,749 | 3,007 | 2,870 | |||||||||
| Postage |
1,603 | 1,296 | 949 | |||||||||
| Courier service |
998 | 1,154 | 1,055 | |||||||||
| Foreclosed asset expense |
266 | 490 | 528 | |||||||||
| Intangible amortization |
1,377 | 1,157 | 446 | |||||||||
| Operational losses |
1,564 | 737 | 764 | |||||||||
| Provision for foreclosed asset losses |
140 | 502 | 208 | |||||||||
| Change in reserve for unfunded commitments |
244 | 330 | (395 | ) | ||||||||
| Legal settlement |
1,450 | — | — | |||||||||
| Merger & acquisition expense |
784 | 586 | 4,858 | |||||||||
| Miscellaneous other |
12,174 | 11,085 | 10,919 | |||||||||
|
|
|
|
|
|
|
|||||||
| Total other noninterest expenses |
65,273 | 59,436 | 52,835 | |||||||||
|
|
|
|
|
|
|
|||||||
| Total noninterest expense |
$ | 145,997 | $ | 130,841 | $ | 110,379 | ||||||
|
|
|
|
|
|
|
|||||||
| Merger & acquisition expense: |
||||||||||||
| Base salaries, net of loan origination costs |
$ | 187 | — | — | ||||||||
| Incentive compensation |
— | — | $ | 1,174 | ||||||||
| Benefits and other compensation costs |
— | — | 94 | |||||||||
| Data processing and software |
— | $ | 108 | 475 | ||||||||
| Professional fees |
342 | 120 | 2,390 | |||||||||
| Miscellaneous other |
255 | 358 | 725 | |||||||||
|
|
|
|
|
|
|
|||||||
| Total merger expense |
$ | 784 | $ | 586 | $ | 4,858 | ||||||
|
|
|
|
|
|
|
|||||||
| Average full time equivalent staff |
999 | 949 | 783 | |||||||||
| Noninterest expense to revenue (FTE) |
67.9 | % | 64.7 | % | 72.9 | % | ||||||
Salary and benefit expenses increased $9,319,000 (13.1%) to $80,724,000 during the year ended December 31, 2016 compared to the year ended December 31, 2015. Base salaries, incentive compensation and benefits & other compensation expense increased $6,347,000 (13.6%), 1,908,000 (27.4%), and 1,064,000 (6.0%), respectively, to $53,169,000, $8,872,000 and $18,683,000, respectively, during the year ended December 31, 2016. The average number of full-time equivalent staff increased 50 (5.3%) from 949 during the year ended December 31, 2015 to 999 for the year ended December 31, 2016. The increase in base salaries was due primarily to annual pay raises, an increase in average full-time equivalent staff, and a $1,409,000 increase in temporary help expense from $63,000 during 2015 to $1,472,000 during 2016. The increase in temporary help expense was due primarily to an expansion of the Bank’s customer call center capacity during 2016. All categories of incentive compensation expense increased during 2016 compared to 2015 due to related production and profitability measures, and the general increase in staff, except for commissions on sale of nondeposit investment products for which production was down compared to 2015. The increase in benefits and other compensation expense was due primarily to the increase in full-time equivalent staff during 2016.
Salary and benefit expenses increased $13,861,000 (24.1%) to $71,405,000 during the year ended December 31, 2015 compared to the year ended December 31, 2014. Base salaries, incentive compensation and benefits & other compensation expense increased $7,480,000 (19.0%), 1,896,000 (37.4%), and 4,485,000 (34.1%), respectively, to $46,822,000, $6,964,000 and $17,619,000, respectively, during the year ended December 31, 2015. The increases in these categories of salary and benefits expense are primarily due to the Company’s acquisition of North Valley Bancorp on October 4, 2014. The average number of full-time equivalent staff increased 166 (21.2%) from 783 during the year ended December 31, 2014 to 949 for the year ended December 31, 2015.
29
Table of Contents
Other noninterest expense increased $5,837,000 (9.8%) to $65,273,000 during the year ended December 31, 2016 compared to the year ended December 31, 2015. The increase in other noninterest expense was primarily due to system conversion and capacity expansion expenses during 2016. Expense categories including equipment, data processing and software, ATM & POS network charges and professional (consulting) experienced significant increases due primarily to system conversion and capacity expansion during 2016. The Company recorded a litigation contingency expense of $1,450,000 during 2016. The details of this contingency can be found at Note 18 in Item 8 of Part II of this report. Assessments expense decrease $467,000 (18.2%) to $2,105,000 during 2016 compared to $2,572,000 during 2015 due to a decrease in FDIC insurance premiums during the three months ended September 30, 2016. Nonrecurring expenses related to the acquisition of three branches from Bank of America in March 2016 totaling $784,000 and the acquisition of North Valley Bancorp in October 2014 are included in other noninterest expense for the years ended December 31, 2016 and 2015, respectively. Included in miscellaneous other noninterest expense during 2016 were $782,000 valuation allowance expenses on fixed assets transferred to held for sale including a $716,000 valuation allowance expense related to a closed branch building held for sale, the value of which was written down to current market value, and subsequently sold during the three months ended September 30, 2016. Net proceeds from the sale of this building were $1,218,000, and resulted in no gain or additional loss being recorded upon the sale of this building.
Other noninterest expense increased $6,601,000 (12.5%) to $59,436,000 during the year ended December 31, 2015 compared to the year ended December 31, 2014. The increase in other noninterest expense was primarily due to the Company’s acquisition of North Valley Bancorp on October 4, 2014. Nonrecurring merger expenses related to the North Valley Bancorp acquisition totaling $586,000 and $4,858,000 are included in other noninterest expense for the years ended December 31, 2015 and 2014, respectively, of which $0 and $1,269,000 were not deductible for income tax purposes, respectively.
Income Taxes
The effective tax rate on income was 38.2%, 39.7%, and 41.5% in 2016, 2015, and 2014, respectively. The effective tax rate was greater than the federal statutory tax rate due to state tax expense of $7,576,000, $7,412,000, and $4,817,000,respectively, in these years, and $1,310,000 of nondeductible merger expenses in 2014. Federal tax-exempt income of $3,881,000, $1,509,000, and $505,000, respectively, from investment securities, Federal and State tax-exempt income of $2,955,000, $2,786,000, and $1,953,000, respectively, from increase in cash value and gain on death benefit of life insurance, and tax credits of $197,000, $0, and $0 in these years helped to reduce the effective tax rate.
Financial Condition
Investment Securities
The following table presents the available for sale investment securities portfolio by major type as of the dates indicated:
| Year ended December 31, | ||||||||||||||||||||
| (In thousands) | 2016 | 2015 | 2014 | 2013 | 2012 | |||||||||||||||
| Investment securities available for sale (at fair value): |
||||||||||||||||||||
| Obligations of US government corporations and agencies |
$ | 429,678 | $ | 313,682 | $ | 75,120 | $ | 97,143 | $ | 151,701 | ||||||||||
| Obligations of states and political subdivisions |
117,617 | 88,218 | 3,175 | 5,589 | 9,421 | |||||||||||||||
| Corporate bonds |
— | — | 1,908 | 1,915 | 1,905 | |||||||||||||||
| Marketable equity securities |
2,938 | 2,985 | 3,002 | — | — | |||||||||||||||
|
|
|
|
|
|
|
|
|
|
|
|||||||||||
| Total investment securities available for sale |
$ | 550,233 | $ | 404,885 | $ | 83,205 | $ | 104,647 | $ | 163,027 | ||||||||||
|
|
|
|
|
|
|
|
|
|
|
|||||||||||
Investment securities available for sale increased $145,348,000 to $550,233,000 as of December 31, 2016, compared to December 31, 2015. This increase is attributable to purchases of $247,717,000, maturities and principal repayments of $71,684,000, a decrease in fair value of investments securities available for sale of $11,015,000, and amortization of net purchase price premiums of $2,598,000.
The following table presents the held to maturity investment securities portfolio by major type as of the dates indicated:
| Year ended December 31, | ||||||||||||||||||||
| (In thousands) | 2016 | 2015 | 2014 | 2013 | 2012 | |||||||||||||||
| Investment securities held to maturity (at cost): |
||||||||||||||||||||
| Obligations of US government corporations and agencies |
$ | 597,982 | $ | 711,994 | $ | 660,836 | $ | 227,864 | — | |||||||||||
| Obligations of states and political subdivisions |
14,554 | 14,536 | 15,590 | 12,640 | — | |||||||||||||||
|
|
|
|
|
|
|
|
|
|
|
|||||||||||
| Total investment securities held to maturity |
$ | 602,536 | $ | 726,530 | $ | 676,426 | $ | 240,504 | — | |||||||||||
|
|
|
|
|
|
|
|
|
|
|
|||||||||||
30
Table of Contents
Investment securities held to maturity decreased $123,994,000 to $602,536,000 as of December 31, 2016, compared to December 31, 2015. This decrease is attributable to principal repayments of $121,666,000 and amortization of net purchase price discounts/premiums of $2,328,000.
Additional information about the investment portfolio is provided in Note 3 in the financial statements at Item 8 of Part II of this report.
Restricted Equity Securities
Restricted equity securities were $16,956,000 at December 31, 2016 and December 31, 2015. The entire balance of restricted equity securities at December 31, 2016 and December 31, 2015 represents the Bank’s investment in the Federal Home Loan Bank of San Francisco (“FHLB”).
FHLB stock is carried at par and does not have a readily determinable fair value. While technically these are considered equity securities, there is no market for the FHLB stock. Therefore, the shares are considered as restricted investment securities. Management periodically evaluates FHLB stock for other-than-temporary impairment. Management’s determination of whether these investments are impaired is based on its assessment of the ultimate recoverability of cost rather than by recognizing temporary declines in value. The determination of whether a decline affects the ultimate recoverability of cost is influenced by criteria such as (1) the significance of any decline in net assets of the FHLB as compared to the capital stock amount for the FHLB and the length of time this situation has persisted, (2) commitments by the FHLB to make payments required by law or regulation and the level of such payments in relation to the operating performance of the FHLB, (3) the impact of legislative and regulatory changes on institutions and, accordingly, the customer base of the FHLB, and (4) the liquidity position of the FHLB.
As a member of the FHLB system, the Bank is required to maintain a minimum level of investment in FHLB stock based on specific percentages of its outstanding mortgages, total assets, or FHLB advances. The Bank may request redemption at par value of any stock in excess of the minimum required investment. Stock redemptions are at the discretion of the FHLB.
Loans
The Bank concentrates its lending activities in four principal areas: real estate mortgage loans (residential and commercial loans), consumer loans, commercial loans (including agricultural loans), and real estate construction loans. The interest rates charged for the loans made by the Bank vary with the degree of risk, the size and maturity of the loans, the borrower’s relationship with the Bank and prevailing money market rates indicative of the Bank’s cost of funds.
The majority of the Bank’s loans are direct loans made to individuals, farmers and local businesses. The Bank relies substantially on local promotional activity and personal contacts by bank officers, directors and employees to compete with other financial institutions. The Bank makes loans to borrowers whose applications include a sound purpose, a viable repayment source and a plan of repayment established at inception and generally backed by a secondary source of repayment.
Loan Portfolio Composite
The following table shows the Company’s loan balances, including net deferred loan costs, at the dates indicated:
| Year ended December 31, | ||||||||||||||||||||
| (dollars in thousands) | 2016 | 2015 | 2014 | 2013 | 2012 | |||||||||||||||
| Real estate mortgage |
$ | 2,057,824 | $ | 1,811,832 | $ | 1,615,359 | $ | 1,107,863 | $ | 1,010,130 | ||||||||||
| Consumer |
362,303 | 395,283 | 417,084 | 383,163 | 386,111 | |||||||||||||||
| Commercial |
217,047 | 194,913 | 174,945 | 131,878 | 135,528 | |||||||||||||||
| Real estate construction |
122,419 | 120,909 | 75,136 | 49,103 | 33,054 | |||||||||||||||
|
|
|
|
|
|
|
|
|
|
|
|||||||||||
| Total loans |
$ | 2,759,593 | $ | 2,522,937 | $ | 2,282,524 | $ | 1,672,007 | $ | 1,564,823 | ||||||||||
|
|
|
|
|
|
|
|
|
|
|
|||||||||||
The following table shows the Company’s loan balances, including net deferred loan costs, as a percentage of total loans at the dates indicated:
| Year ended December 31, | ||||||||||||||||||||
| 2016 | 2015 | 2014 | 2013 | 2012 | ||||||||||||||||
| Real estate mortgage |
74.6 | % | 71.8 | % | 70.7 | % | 66.3 | % | 64.5 | % | ||||||||||
| Consumer |
13.1 | % | 15.7 | % | 18.3 | % | 22.9 | % | 24.7 | % | ||||||||||
| Commercial |
7.9 | % | 7.7 | % | 7.7 | % | 7.9 | % | 8.7 | % | ||||||||||
| Real estate construction |
4.4 | % | 4.8 | % | 3.3 | % | 2.9 | % | 2.1 | % | ||||||||||
|
|
|
|
|
|
|
|
|
|
|
|||||||||||
| Total loans |
100.0 | % | 100.0 | % | 100.0 | % | 100.0 | % | 100.0 | % | ||||||||||
|
|
|
|
|
|
|
|
|
|
|
|||||||||||
31
Table of Contents
At December 31, 2016 loans, including net deferred loan costs, totaled $2,759,593,000 which was a 9.4% ($236,656,000) increase over the balances at the end of 2015. Demand for commercial real estate (real estate mortgage) loans was strong during 2016. Demand for residential mortgage loans was strong during 2016. Demand for home equity loans and lines of credit was moderate during 2016.
At December 31, 2015 loans, including net deferred loan costs, totaled $2,522,937,000 which was a 10.5% ($240,413,000) increase over the balances at the end of 2014. Demand for commercial real estate (real estate mortgage) loans was strong during 2015. Demand for home equity loans and lines of credit was weak during 2015.
At December 31, 2014 loans, including net deferred loan costs, totaled $2,282,524,000 which was a 36.5% ($610,517,000) increase over the balances at the end of 2013. This increase in loans during 2014 included $499,327,000 of loans acquired in the North Valley Bancorp acquisition on October 3, 2014, and $32,017,000 of purchased single family residential real estate loans. Demand for commercial real estate (real estate mortgage) loans was moderate during 2014. Demand for home equity loans and lines of credit was weak during 2014.
Asset Quality and Nonperforming Assets
Nonperforming Assets
Loans originated by the Company, i.e., not purchased or acquired in a business combination, are referred to as originated loans. Originated loans are reported at the principal amount outstanding, net of deferred loan fees and costs. Loan origination and commitment fees and certain direct loan origination costs are deferred, and the net amount is amortized as an adjustment of the related loan’s yield over the actual life of the loan. Originated loans on which the accrual of interest has been discontinued are designated as nonaccrual loans.
Originated loans are placed in nonaccrual status when reasonable doubt exists as to the full, timely collection of interest or principal, or a loan becomes contractually past due by 90 days or more with respect to interest or principal and is not well secured and in the process of collection. When an originated loan is placed on nonaccrual status, all interest previously accrued but not collected is reversed. Income on such loans is then recognized only to the extent that cash is received and where the future collection of principal is probable. Interest accruals are resumed on such loans only when they are brought fully current with respect to interest and principal and when, in the judgment of management, the loan is estimated to be fully collectible as to both principal and interest.
An allowance for loan losses for originated loans is established through a provision for loan losses charged to expense. Originated loans and deposit related overdrafts are charged against the allowance for loan losses when management believes that the collectability of the principal is unlikely or, with respect to consumer installment loans, according to an established delinquency schedule. The allowance is an amount that management believes will be adequate to absorb probable losses inherent in existing loans and leases, based on evaluations of the collectability, impairment and prior loss experience of loans and leases. The evaluations take into consideration such factors as changes in the nature and size of the portfolio, overall portfolio quality, loan concentrations, specific problem loans, and current economic conditions that may affect the borrower’s ability to pay. The Company defines an originated loan as impaired when it is probable the Company will be unable to collect all amounts due according to the contractual terms of the loan agreement. Impaired originated loans are measured based on the present value of expected future cash flows discounted at the loan’s original effective interest rate. As a practical expedient, impairment may be measured based on the loan’s observable market price or the fair value of the collateral if the loan is collateral dependent. When the measure of the impaired loan is less than the recorded investment in the loan, the impairment is recorded through a valuation allowance.
In situations related to originated loans where, for economic or legal reasons related to a borrower’s financial difficulties, the Company grants a concession for other than an insignificant period of time to the borrower that the Company would not otherwise consider, the related loan is classified as a troubled debt restructuring (TDR). The Company strives to identify borrowers in financial difficulty early and work with them to modify to more affordable terms before their loan reaches nonaccrual status. These modified terms may include rate reductions, principal forgiveness, payment forbearance and other actions intended to minimize the economic loss and to avoid foreclosure or repossession of the collateral. In cases where the Company grants the borrower new terms that result in the loan being classified as a TDR, the Company measures any impairment on the restructuring as noted above for impaired loans. TDR loans are classified as impaired until they are fully paid off or charged off. Loans that are in nonaccrual status at the time they become TDR loans, remain in nonaccrual status until the borrower demonstrates a sustained period of performance which the Company generally believes to be six consecutive months of payments, or equivalent. Otherwise, TDR loans are subject to the same nonaccrual and charge-off policies as noted above with respect to their restructured principal balance.
Credit risk is inherent in the business of lending. As a result, the Company maintains an allowance for loan losses to absorb losses inherent in the Company’s originated loan portfolio. This is maintained through periodic charges to earnings. These charges are included in the Consolidated Statements of Income as provision for loan losses. All specifically identifiable and quantifiable losses are immediately charged off against the allowance. However, for a variety of reasons, not all losses are immediately known to the Company and, of those that are known, the full extent of the loss may not be quantifiable at that point in time. The balance of the Company’s allowance for originated loan losses is meant to be an estimate of these unknown but probable losses inherent in the portfolio.
32
Table of Contents
The Company formally assesses the adequacy of the allowance for originated loan losses on a quarterly basis. Determination of the adequacy is based on ongoing assessments of the probable risk in the outstanding originated loan portfolio, and to a lesser extent the Company’s originated loan commitments. These assessments include the periodic re-grading of credits based on changes in their individual credit characteristics including delinquency, seasoning, recent financial performance of the borrower, economic factors, changes in the interest rate environment, growth of the portfolio as a whole or by segment, and other factors as warranted. Loans are initially graded when originated. They are re-graded as they are renewed, when there is a new loan to the same borrower, when identified facts demonstrate heightened risk of nonpayment, or if they become delinquent. Re-grading of larger problem loans occurs at least quarterly. Confirmation of the quality of the grading process is obtained by independent credit reviews conducted by consultants specifically hired for this purpose and by various bank regulatory agencies.
The Company’s method for assessing the appropriateness of the allowance for originated loan losses includes specific allowances for impaired originated loans and leases, formula allowance factors for pools of credits, and allowances for changing environmental factors (e.g., interest rates, growth, economic conditions, etc.). Allowance factors for loan pools were based on historical loss experience by product type and prior risk rating.
Loans purchased or acquired in a business combination are referred to as acquired loans. Acquired loans are valued as of acquisition date in accordance with Financial Accounting Standards Board Accounting Standards Codification (“FASB ASC”) Topic 805, Business Combinations. Loans acquired with evidence of credit deterioration since origination for which it is probable that all contractually required payments will not be collected are referred to as purchased credit impaired (PCI) loans. PCI loans are accounted for under FASB ASC Topic 310-30, Loans and Debt Securities Acquired with Deteriorated Credit Quality. Under FASB ASC Topic 805 and FASB ASC Topic 310-30, PCI loans are recorded at fair value at acquisition date, factoring in credit losses expected to be incurred over the life of the loan. Accordingly, an allowance for loan losses is not carried over or recorded as of the acquisition date. Fair value is defined as the present value of the future estimated principal and interest payments of the loan, with the discount rate used in the present value calculation representing the estimated effective yield of the loan. Default rates, loss severity, and prepayment speed assumptions are periodically reassessed and our estimate of future payments is adjusted accordingly. The difference between contractual future payments and estimated future payments is referred to as the nonaccretable difference. The difference between estimated future payments and the present value of the estimated future payments is referred to as the accretable yield. The accretable yield represents the amount that is expected to be recorded as interest income over the remaining life of the loan. If after acquisition, the Company determines that the estimated future cash flows of a PCI loan are expected to be more than the originally estimated, an increase in the discount rate (effective yield) would be made such that the newly increased accretable yield would be recognized, on a level yield basis, over the remaining estimated life of the loan. If, after acquisition, the Company determines that the estimated future cash flows of a PCI loan are expected to be less than the previously estimated, the discount rate would first be reduced until the present value of the reduced cash flow estimate equals the previous present value however, the discount rate may not be lowered below its original level at acquisition. If the discount rate has been lowered to its original level and the present value has not been sufficiently lowered, an allowance for loan loss would be established through a provision for loan losses charged to expense to decrease the present value to the required level. If the estimated cash flows improve after an allowance has been established for a loan, the allowance may be partially or fully reversed depending on the improvement in the estimated cash flows. Only after the allowance has been fully reversed may the discount rate be increased. PCI loans are put on nonaccrual status when cash flows cannot be reasonably estimated. PCI loans on nonaccrual status are accounted for using the cost recovery method or cash basis method of income recognition. PCI loans are charged off when evidence suggests cash flows are not recoverable. Foreclosed assets from PCI loans are recorded in foreclosed assets at fair value with the fair value at time of foreclosure representing cash flow from the loan. ASC 310-30 allows PCI loans with similar risk characteristics and acquisition time frame to be “pooled” and have their cash flows aggregated as if they were one loan. The Company elected to use the “pooled” method of ASC 310-30 for PCI – other loans in the acquisition of certain assets and liabilities of Granite and Citizens.
Acquired loans that are not PCI loans are referred to as purchased not credit impaired (PNCI) loans. PNCI loans are accounted for under FASB ASC Topic 310-20, Receivables – Nonrefundable Fees and Other Costs, in which interest income is accrued on a level-yield basis for performing loans. For income recognition purposes, this method assumes that all contractual cash flows will be collected, and no allowance for loan losses is established at the time of acquistion. Post-acquisition date, an allowance for loan losses may need to be established for acquired loans through a provision charged to earnings for credit losses incurred subsequent to acquisition. Under ASC 310-20, the loss would be measured based on the probable shortfall in relation to the contractual note requirements, consistent with our allowance for loan loss policy for similar loans.
33
Table of Contents
When referring to PNCI and PCI loans we use the terms “nonaccretable difference”, “accretable yield”, or “purchase discount”. Nonaccretable difference is the difference between undiscounted contractual cash flows due and undiscounted cash flows we expect to collect, or put another way, it is the undiscounted contractual cash flows we do not expect to collect. Accretable yield is the difference between undiscounted cash flows we expect to collect and the value at which we have recorded the loan on our financial statements. On the date of acquisition, all purchased loans are recorded on our consolidated financial statements at estimated fair value. Purchase discount is the difference between the estimated fair value of loans on the date of acquisition and the principal amount owed by the borrower, net of charge offs, on the date of acquisition. We may also refer to “discounts to principal balance of loans owed, net of charge-offs”. Discounts to principal balance of loans owed, net of charge-offs is the difference between principal balance of loans owed, net of charge-offs, and loans as recorded on our financial statements. Discounts to principal balance of loans owed, net of charge-offs arise from purchase discounts, and equal the purchase discount on the acquisition date.
Loans are also categorized as “covered” or “noncovered”. Covered loans refer to loans covered by a FDIC loss sharing agreement. Noncovered loans refer to loans not covered by a FDIC loss sharing agreement.
Originated loans and PNCI loans are reviewed on an individual basis for reclassification to nonaccrual status when any one of the following occurs: the loan becomes 90 days past due as to interest or principal, the full and timely collection of additional interest or principal becomes uncertain, the loan is classified as doubtful by internal credit review or bank regulatory agencies, a portion of the principal balance has been charged off, or the Company takes possession of the collateral. Loans that are placed on nonaccrual even though the borrowers continue to repay the loans as scheduled are classified as “performing nonaccrual” and are included in total nonperforming loans. The reclassification of loans as nonaccrual does not necessarily reflect management’s judgment as to whether they are collectible.
Interest income on originated nonaccrual loans that would have been recognized during the years ended December 31, 2016, 2015 and 2014, if all such loans had been current in accordance with their original terms, totaled $783,000, $1,840,000, and $2,734,000, respectively. Interest income actually recognized on these originated loans during the years ended December 31, 2016, 2015 and 2014 was $377,000, $170,000, and $81,000, respectively. Interest income on PNCI nonaccrual loans that would have been recognized during the years ended December 31, 2016, 2015 and 2014, if all such loans had been current in accordance with their original terms, totaled $178,000, $386,000, and $254,000. Interest income actually recognized on these PNCI loans during the years ended December 31, 2016, 2015 and 2014 was $11,000, $205,000, and $4,000.
The Company’s policy is to place originated loans and PNCI loans 90 days or more past due on nonaccrual status. In some instances when an originated loan is 90 days past due Management does not place it on nonaccrual status because the loan is well secured and in the process of collection. A loan is considered to be in the process of collection if, based on a probable specific event, it is expected that the loan will be repaid or brought current. Generally, this collection period would not exceed 30 days. Loans where the collateral has been repossessed are classified as foreclosed assets. Management considers both the adequacy of the collateral and the other resources of the borrower in determining the steps to be taken to collect nonaccrual loans. Alternatives that are considered are foreclosure, collecting on guarantees, restructuring the loan or collection lawsuits.
34
Table of Contents
The following table sets forth the amount of the Bank’s nonperforming assets as of the dates indicated. For purposes of the following table, “PCI – other” loans that are 90 days past due and still accruing are not considered nonperforming loans. “Performing nonaccrual loans” are loans that may be current for both principal and interest payments, or are less than 90 days past due, but for which payment in full of both principal and interest is not expected, and are not well secured and in the process of collection:
| December 31, | ||||||||||||||||||||
| (dollars in thousands) | 2016 | 2015 | 2014 | 2013 | 2012 | |||||||||||||||
| Performing nonaccrual loans |
$ | 17,677 | $ | 31,033 | $ | 45,072 | $ | 48,112 | $ | 49,045 | ||||||||||
| Nonperforming nonaccrual loans |
2,451 | 6,086 | 2,517 | 5,104 | 23,471 | |||||||||||||||
| Total nonaccrual loans |
20,128 | 37,119 | 47,589 | 53,216 | 72,516 | |||||||||||||||
| Originated and PNCI loans 90 days past due and still accruing |
— | — | — | — | — | |||||||||||||||
|
|
|
|
|
|
|
|
|
|
|
|||||||||||
| Total nonperforming loans |
20,128 | 37,119 | 47,589 | 53,216 | 72,516 | |||||||||||||||
| Noncovered foreclosed assets |
3,763 | 5,369 | 4,449 | 5,588 | 5,957 | |||||||||||||||
| Covered foreclosed assets |
223 | — | 445 | 674 | 1,541 | |||||||||||||||
|
|
|
|
|
|
|
|
|
|
|
|||||||||||
| Total nonperforming assets |
$ | 24,114 | $ | 42,488 | $ | 52,483 | $ | 59,478 | $ | 80,014 | ||||||||||
|
|
|
|
|
|
|
|
|
|
|
|||||||||||
| U.S. government, including its agencies and its government-sponsored agencies, guaranteed portion of nonperforming loans |
$ | 911 | $ | 28 | $ | 123 | $ | 101 | $ | 131 | ||||||||||
| Indemnified portion of covered foreclosed assets |
$ | 218 | — | $ | 356 | $ | 539 | $ | 1,233 | |||||||||||
| Nonperforming assets to total assets |
0.53 | % | 1.01 | % | 1.88 | % | 2.30 | % | 3.07 | % | ||||||||||
| Nonperforming loans to total loans |
0.73 | % | 1.47 | % | 2.08 | % | 3.18 | % | 4.63 | % | ||||||||||
| Allowance for loan losses to nonperforming loans |
161 | % | 97 | % | 77 | % | 72 | % | 59 | % | ||||||||||
| Allowance for loan losses, unamortized loan fees, and discounts to loan principal balances owed |
2.09 | % | 2.69 | % | 3.31 | % | 4.09 | % | 5.30 | % | ||||||||||
The following tables set forth the amount of the Bank’s nonperforming assets as of the dates indicated. For purposes of the following tables, “PCI – other” loans that are 90 days past due and still accruing are not considered nonperforming loans. “Performing nonaccrual loans” are loans that may be current for both principal and interest payments, or are less than 90 days past due, but for which payment in full of both principal and interest is not expected, and are not well secured and in the process of collection:
| December 31, 2016 | ||||||||||||||||||||
| (dollars in thousands) | Originated | PNCI | PCI – cash basis | PCI - other | Total | |||||||||||||||
| Performing nonaccrual loans |
$ | 11,146 | $ | 2,131 | $ | 2,983 | $ | 1,417 | $ | 17,677 | ||||||||||
| Nonperforming nonaccrual loans |
1,748 | 703 | — | — | 2,451 | |||||||||||||||
|
|
|
|
|
|
|
|
|
|
|
|||||||||||
| Total nonaccrual loans |
12,894 | 2,834 | $ | 2,983 | $ | 1,417 | 20,128 | |||||||||||||
| Originated loans 90 days past due and still accruing |
— | — | — | — | — | |||||||||||||||
|
|
|
|
|
|
|
|
|
|
|
|||||||||||
| Total nonperforming loans |
12,894 | 2,834 | $ | 2,983 | $ | 1,417 | 20,128 | |||||||||||||
| Noncovered foreclosed assets |
2,277 | — | — | 1,486 | 3,763 | |||||||||||||||
| Covered foreclosed assets |
— | — | — | 223 | 223 | |||||||||||||||
|
|
|
|
|
|
|
|
|
|
|
|||||||||||
| Total nonperforming assets |
$ | 15,171 | $ | 2,834 | $ | 2,983 | $ | 3,126 | $ | 24,114 | ||||||||||
|
|
|
|
|
|
|
|
|
|
|
|||||||||||
| U.S. government, including its agencies and its government-sponsored agencies, guaranteed portion of nonperforming loans |
$ | 911 | — | — | — | $ | 911 | |||||||||||||
| Indemnified portion of covered foreclosed assets |
— | — | — | $ | 218 | $ | 218 | |||||||||||||
| Nonperforming assets to total assets |
0.34 | % | 0.06 | % | 0.07 | % | 0.07 | % | 0.53 | % | ||||||||||
| Nonperforming loans to total loans |
0.55 | % | 0.75 | % | 100.00 | % | 6.42 | % | 0.73 | % | ||||||||||
| Allowance for loan losses to nonperforming loans |
218 | % | 59 | % | 1 | % | 189 | % | 161 | % | ||||||||||
| Allowance for loan losses, unamortized loan fees, and discounts to loan principal balances owed |
1.48 | % | 2.98 | % | 64.18 | % | 24.44 | % | 2.09 | % | ||||||||||
35
Table of Contents
The following tables set forth the amount of the Bank’s nonperforming assets as of the dates indicated. For purposes of the following tables, “PCI – other” loans that are 90 days past due and still accruing are not considered nonperforming loans. “Performing nonaccrual loans” are loans that may be current for both principal and interest payments, or are less than 90 days past due, but for which payment in full of both principal and interest is not expected, and are not well secured and in the process of collection:
| December 31, 2015 | ||||||||||||||||||||
| (dollars in thousands) | Originated | PNCI | PCI - cash basis | PCI - other | Total | |||||||||||||||
| Performing nonaccrual loans |
$ | 18,483 | $ | 3,747 | $ | 5,055 | $ | 3,748 | $ | 31,033 | ||||||||||
| Nonperforming nonaccrual loans |
4,341 | 1,651 | 24 | 70 | 6,086 | |||||||||||||||
|
|
|
|
|
|
|
|
|
|
|
|||||||||||
| Total nonaccrual loans |
22,824 | 5,398 | 5,079 | 3,818 | 37,119 | |||||||||||||||
| Originated loans 90 days past due and still accruing |
— | — | — | — | — | |||||||||||||||
|
|
|
|
|
|
|
|
|
|
|
|||||||||||
| Total nonperforming loans |
22,824 | 5,398 | 5,079 | 3,818 | 37,119 | |||||||||||||||
| Noncovered foreclosed assets |
4,195 | — | — | 1,174 | 5,369 | |||||||||||||||
| Covered foreclosed assets |
— | — | — | — | — | |||||||||||||||
|
|
|
|
|
|
|
|
|
|
|
|||||||||||
| Total nonperforming assets |
$ | 27,019 | $ | 5,398 | $ | 5,079 | $ | 4,992 | $ | 42,488 | ||||||||||
|
|
|
|
|
|
|
|
|
|
|
|||||||||||
| U.S. government, including its agencies and its government-sponsored agencies, guaranteed portion of nonperforming loans |
$ | 28 | — | — | — | $ | 28 | |||||||||||||
| Indemnified portion of covered foreclosed assets |
— | — | — | — | — | |||||||||||||||
| Nonperforming assets to total assets |
0.64 | % | 0.13 | % | 0.12 | % | 0.12 | % | 1.01 | % | ||||||||||
| Nonperforming loans to total loans |
1.15 | % | 1.09 | % | 100.00 | % | 10.87 | % | 1.47 | % | ||||||||||
| Allowance for loan losses to nonperforming loans |
137 | % | 34 | % | 2 | % | 73 | % | 97 | % | ||||||||||
| Allowance for loan losses, unamortized loan fees, and discounts to loan principal balances owed |
1.90 | % | 3.11 | % | 60.92 | % | 18.49 | % | 2.69 | % | ||||||||||
The following table shows the activity in the balance of nonperforming assets for the year ended December 31, 2016:
| Balance at December 31, |
New | Advances/ Capitalized |
Pay-downs /Sales |
Charge-offs/ | Transfers to Foreclosed |
Category | Balance at December 31, |
|||||||||||||||||||||||||
| (dollars in thousands): | 2016 | NPA | Costs | /Upgrades | Write-downs | Assets | Changes | 2015 | ||||||||||||||||||||||||
| Real estate mortgage: |
||||||||||||||||||||||||||||||||
| Residential |
$ | 449 | $ | 795 | $ | 3 | $ | (3,512 | ) | $ | (320 | ) | $ | (219 | ) | — | $ | 3,702 | ||||||||||||||
| Commercial |
10,978 | 8,862 | 272 | (18,041 | ) | (827 | ) | (539 | ) | — | 21,251 | |||||||||||||||||||||
| Consumer |
||||||||||||||||||||||||||||||||
| Home equity lines |
4,937 | 2,326 | 558 | (5,048 | ) | (585 | ) | (1,177 | ) | $ | (353 | ) | 9,216 | |||||||||||||||||||
| Home equity loans |
785 | 863 | 392 | (1,447 | ) | (220 | ) | (570 | ) | $ | 353 | 1,414 | ||||||||||||||||||||
| Auto indirect |
— | — | — | — | — | — | — | — | ||||||||||||||||||||||||
| Other consumer |
38 | 321 | 1 | (41 | ) | (298 | ) | — | — | 55 | ||||||||||||||||||||||
| Commercial |
2,930 | 4,120 | 345 | (2,059 | ) | (455 | ) | — | — | 979 | ||||||||||||||||||||||
| Construction: |
||||||||||||||||||||||||||||||||
| Residential |
11 | — | — | (1 | ) | — | — | — | 12 | |||||||||||||||||||||||
| Commercial |
— | — | — | (490 | ) | — | — | — | 490 | |||||||||||||||||||||||
|
|
|
|
|
|
|
|
|
|
|
|
|
|
|
|
|
|||||||||||||||||
| Total nonperforming loans |
20,128 | 17,287 | 1,571 | (30,639 | ) | (2,705 | ) | (2,505 | ) | — | 37,119 | |||||||||||||||||||||
| Noncovered foreclosed assets |
3,763 | — | — | (3,748 | ) | (140 | ) | 2,282 | — | 5,369 | ||||||||||||||||||||||
| Covered foreclosed assets |
223 | — | — | — | — | $ | 223 | — | — | |||||||||||||||||||||||
|
|
|
|
|
|
|
|
|
|
|
|
|
|
|
|
|
|||||||||||||||||
| Total nonperforming assets |
$ | 24,114 | $ | 17,287 | $ | 1,571 | $ | (34,387 | ) | $ | (2,845 | ) | — | — | $ | 42,488 | ||||||||||||||||
|
|
|
|
|
|
|
|
|
|
|
|
|
|
|
|
|
|||||||||||||||||
The table above does not include deposit overdraft charge-offs.
36
Table of Contents
The following tables and narratives describe the activity in the balance of nonperforming assets during each of the three-month periods ending March 31, June 30, September 30, and December 31, 2016. These tables and narratives are presented in chronological order:
Changes in nonperforming assets during the three months ended December 31, 2016
| Balance at |
New | Advances/ Capitalized |
Pay-downs /Sales |
Charge-offs/ | Transfers to Foreclosed |
Category | Balance at September 30, |
|||||||||||||||||||||||||
| (In thousands): | 2016 | NPA | Costs | /Upgrades | Write-downs | Assets | Changes | 2016 | ||||||||||||||||||||||||
| Real estate mortgage: |
||||||||||||||||||||||||||||||||
| Residential |
$ | 449 | $ | 72 | — | $ | (1,097 | ) | $ | (108 | ) | — | — | $ | 1,582 | |||||||||||||||||
| Commercial |
10,978 | 1,639 | $ | 1 | (778 | ) | (34 | ) | $ | (346 | ) | — | 10,496 | |||||||||||||||||||
| Consumer |
||||||||||||||||||||||||||||||||
| Home equity lines |
4,937 | 867 | — | (1,681 | ) | (134 | ) | — | — | 5,885 | ||||||||||||||||||||||
| Home equity loans |
785 | 127 | 165 | (1,050 | ) | (101 | ) | (207 | ) | — | 1,851 | |||||||||||||||||||||
| Other consumer |
38 | 141 | — | (5 | ) | (119 | ) | — | — | 21 | ||||||||||||||||||||||
| Commercial (C&I) |
2,930 | 1,719 | 345 | (206 | ) | (34 | ) | — | — | 1,106 | ||||||||||||||||||||||
| Construction: |
||||||||||||||||||||||||||||||||
| Residential |
11 | — | — | — | — | — | — | 11 | ||||||||||||||||||||||||
| Commercial |
— | — | — | — | — | — | — | — | ||||||||||||||||||||||||
|
|
|
|
|
|
|
|
|
|
|
|
|
|
|
|
|
|||||||||||||||||
| Total nonperforming loans |
20,128 | 4,565 | 511 | (4,817 | ) | (530 | ) | (553 | ) | — | 20,952 | |||||||||||||||||||||
| Foreclosed assets |
3,986 | — | — | (591 | ) | (100 | ) | $ | 553 | — | 4,124 | |||||||||||||||||||||
|
|
|
|
|
|
|
|
|
|
|
|
|
|
|
|
|
|||||||||||||||||
| Total nonperforming assets |
$ | 24,114 | $ | 4,565 | $ | 511 | $ | (5,408 | ) | $ | (630 | ) | — | — | $ | 25,076 | ||||||||||||||||
|
|
|
|
|
|
|
|
|
|
|
|
|
|
|
|
|
|||||||||||||||||
Nonperforming assets decreased during the fourth quarter of 2016 by $962,000 (3.8%) to $24,114,000 at December 31, 2016 compared to $25,076,000 at September 30, 2016. The decrease in nonperforming assets during the fourth quarter of 2016 was primarily the result of new nonperforming loans of $4,565,000, advances on existing nonperforming loans and capitalized costs on foreclosed assets of $511,000, less pay-downs, sales or upgrades of nonperforming loans to performing status totaling $4,817,000, less dispositions of foreclosed assets totaling $591,000, less loan charge-offs of $530,000, and less write-downs of foreclosed assets of $100,000.
The $4,565,000 in new nonperforming loans during the fourth quarter of 2016 was comprised of increases of $72,000 on three residential real estate loans, $1,639,000 on four commercial real estate loans, $994,000 on 15 home equity lines and loans, $141,000 on 15 other consumer loans, and $1,719,000 on 21 C&I loans.
The $1,639,000 in new nonperforming commercial real estate loans was primarily made up of one loan in the amount of $346,000 secured by a commercial office property in northern California and two loans totaling $1,259,000 secured by agricultural production land in northern California. Related charge-offs are discussed below.
The $1,719,000 in new C&I loans was primarily comprised of three loans totaling $1,191,000 secured by rice crop proceeds in northern California. Related charge-offs are discussed below.
The $4,817,000 in pay-downs, sales or upgrades of loans in the fourth quarter of 2016 was comprised of decreases of $1,097,000 on 15 residential real estate loans, $778,000 on 17 commercial real estate loans, $2,731,000 on 124 home equity lines and loans, $5,000 on four consumer loans, and 206,000 on five C&I loans.
Loan charge-offs during the three months ended December 31, 2016
In the fourth quarter of 2016, the Company recorded $530,000 in loan charge-offs and $104,000 in deposit overdraft charge-offs less $1,021,000 in loan recoveries and $67,000 in deposit overdraft recoveries resulting in $452,000 of net recoveries. Primary causes of the loan charges taken in the fourth quarter of 2016 were gross charge-offs of $108,000 on six residential real estate loans, $34,000 on one commercial real estate loan, $235,000 on 20 home equity lines and loans, $119,000 on 12 other consumer loans, and $34,000 on six C&I loans. During the fourth quarter of 2016, there were no individual charges greater than $250,000.
37
Table of Contents
Changes in nonperforming assets during the three months ended September 30, 2016
| Balance at September 30, |
New | Advances/ Capitalized |
Pay-downs /Sales |
Charge-offs/ |
Transfers to Foreclosed |
Category | Balance at June 30, |
|||||||||||||||||||||||||
| (In thousands): | 2016 | NPA | Costs | /Upgrades | Write-downs | Assets | Changes | 2016 | ||||||||||||||||||||||||
| Real estate mortgage: |
||||||||||||||||||||||||||||||||
| Residential |
$ | 1,582 | $ | 37 | $ | 1 | $ | (1,350 | ) | $ | (51 | ) | $ | (219 | ) | — | $ | 3,164 | ||||||||||||||
| Commercial |
10,496 | 5,456 | 232 | (2,136 | ) | — | (193 | ) | — | 7,137 | ||||||||||||||||||||||
| Consumer |
||||||||||||||||||||||||||||||||
| Home equity lines |
5,885 | 806 | 185 | (1,907 | ) | (122 | ) | (455 | ) | $ | (258 | ) | 7,636 | |||||||||||||||||||
| Home equity loans |
1,851 | 247 | 164 | (126 | ) | (26 | ) | (234 | ) | $ | 258 | 1,568 | ||||||||||||||||||||
| Other consumer |
21 | 43 | — | (4 | ) | (35 | ) | — | — | 17 | ||||||||||||||||||||||
| Commercial (C&I) |
1,106 | 996 | — | (27 | ) | (307 | ) | — | — | 444 | ||||||||||||||||||||||
| Construction: |
||||||||||||||||||||||||||||||||
| Residential |
11 | — | — | — | — | — | — | 11 | ||||||||||||||||||||||||
| Commercial |
— | — | — | — | — | — | — | — | ||||||||||||||||||||||||
|
|
|
|
|
|
|
|
|
|
|
|
|
|
|
|
|
|||||||||||||||||
| Total nonperforming loans |
20,952 | 7,585 | 582 | (5,550 | ) | (541 | ) | (1,101 | ) | — | 19,977 | |||||||||||||||||||||
| Foreclosed assets |
4,124 | — | — | (810 | ) | (9 | ) | $ | 1,101 | — | 3,842 | |||||||||||||||||||||
|
|
|
|
|
|
|
|
|
|
|
|
|
|
|
|
|
|||||||||||||||||
| Total nonperforming assets |
$ | 25,076 | $ | 7,585 | $ | 582 | $ | 6,360 | $ | (550 | ) | — | — | $ | 23,819 | |||||||||||||||||
|
|
|
|
|
|
|
|
|
|
|
|
|
|
|
|
|
|||||||||||||||||
Nonperforming assets increased during the third quarter of 2016 by $1,257,000 (5.3%) to $25,076,000 at September 30, 2016 compared to $23,819,000 at June 30, 2016. The increase in nonperforming assets during the third quarter of 2016 was primarily the result of new nonperforming loans of $7,585,000, advances on existing nonperforming loans and capitalized costs on foreclosed assets of $582,000, less pay-downs, sales or upgrades of nonperforming loans to performing status totaling $5,550,000, less dispositions of foreclosed assets totaling $810,000, less loan charge-offs of $541,000, and less write-downs of foreclosed assets of $9,000.
The $7,585,000 in new nonperforming loans during the third quarter of 2016 was comprised of increases of $37,000 on one residential real estate loan, $5,456,000 on two commercial real estate loans, $1,053,000 on 15 home equity lines and loans, $43,000 on 10 other consumer loans, and $996,000 on 12 C&I loans.
The $5,456,000 in new nonperforming commercial real estate loans was primarily made up of one loan in the amount of $5,209,000 secured by a commercial warehouse property in central California. Related charge-offs are discussed below.
The $996,000 in new C&I loans was primarily comprised of one loan in the amount of $347,000 secured by crop proceeds in northern California. Related charge-offs are discussed below.
The $5,550,000 in pay-downs, sales or upgrades of loans in the third quarter of 2016 was comprised of decreases of $1,350,000 on 22 residential real estate loans, $2,136,000 on 17 commercial real estate loans, $2,033,000 on 124 home equity lines and loans, $4,000 on four consumer loans, and 27,000 on six C&I loans.
The $2,136,000 reduction in nonperforming commercial real estate loans was primarily made up of one payoff in the amount of $744,000 on one loan secured by a commercial multifamily residential property in central California, a payoff on two loans secured by agricultural production land in central California totaling $816,000, and a payoff on one loan secured by a commercial retail property in northern California in the amount of $375,000.
Loan charge-offs during the three months ended September 30, 2016
In the third quarter of 2016, the Company recorded $541,000 in loan charge-offs and $123,000 in deposit overdraft charge-offs less $2,541,000 in loan recoveries and $71,000 in deposit overdraft recoveries resulting in $1,948,000 of net recoveries. Primary causes of the loan charges taken in the third quarter of 2016 were gross charge-offs of $51,000 on three residential real estate loans, $148,000 on nine home equity lines and loans, $35,000 on nine other consumer loans, and $307,000 on eight C&I loans. During the third quarter of 2016, there were no individual charges greater than $250,000.
38
Table of Contents
Changes in nonperforming assets during the three months ended June 30, 2016
| Balance at June 30, |
New | Advances/ Capitalized |
Pay-downs /Sales |
Charge-offs/ | Transfers to Foreclosed |
Category | Balance at March 31, |
|||||||||||||||||||||||||
| (In thousands): | 2016 | NPA | Costs | /Upgrades | Write-downs | Assets | Changes | 2016 | ||||||||||||||||||||||||
| Real estate mortgage: |
||||||||||||||||||||||||||||||||
| Residential |
$ | 3,164 | $ | 306 | $ | 1 | $ | (925 | ) | $ | (124 | ) | — | — | $ | 3,906 | ||||||||||||||||
| Commercial |
7,137 | 729 | — | (1,153 | ) | — | — | — | 7,561 | |||||||||||||||||||||||
| Consumer |
||||||||||||||||||||||||||||||||
| Home equity lines |
7,636 | 193 | 120 | (1,036 | ) | (115 | ) | $ | (307 | ) | $ | (21 | ) | 8,802 | ||||||||||||||||||
| Home equity loans |
1,568 | 429 | 63 | (228 | ) | (93 | ) | (130 | ) | $ | 21 | 1,506 | ||||||||||||||||||||
| Other consumer |
17 | 58 | — | (26 | ) | (58 | ) | — | — | 43 | ||||||||||||||||||||||
| Commercial (C&I) |
444 | 95 | — | (1,779 | ) | (76 | ) | — | — | 2,204 | ||||||||||||||||||||||
| Construction: |
||||||||||||||||||||||||||||||||
| Residential |
11 | — | — | (1 | ) | — | — | — | 12 | |||||||||||||||||||||||
| Commercial |
— | — | — | — | — | — | — | — | ||||||||||||||||||||||||
|
|
|
|
|
|
|
|
|
|
|
|
|
|
|
|
|
|||||||||||||||||
| Total nonperforming loans |
19,977 | 1,810 | 184 | (5,148 | ) | (466 | ) | (437 | ) | — | 24,034 | |||||||||||||||||||||
| Foreclosed assets |
3,842 | — | — | (1,023 | ) | (43 | ) | $ | 437 | — | 4,471 | |||||||||||||||||||||
|
|
|
|
|
|
|
|
|
|
|
|
|
|
|
|
|
|||||||||||||||||
| Total nonperforming assets |
$ | 23,819 | $ | 1,810 | $ | 184 | $ | (6,171 | ) | $ | (509 | ) | — | — | $ | 28,505 | ||||||||||||||||
|
|
|
|
|
|
|
|
|
|
|
|
|
|
|
|
|
|||||||||||||||||
Nonperforming assets decreased during the second quarter of 2016 by $4,686,000 (16.4%) to $23,819,000 at June 30, 2016 compared to $28,505,000 at March 31, 2016. The decrease in nonperforming assets during the second quarter of 2016 was primarily the result of new nonperforming loans of $1,810,000, advances on existing nonperforming loans and capitalized costs on foreclosed assets of $184,000, less pay-downs, sales or upgrades of nonperforming loans to performing status totaling $5,148,000, less dispositions of foreclosed assets totaling $1,023,000, less loan charge-offs of $466,000, and less write-downs of foreclosed assets of $43,000.
The $1,810,000 in new nonperforming loans during the second quarter of 2016 was comprised of increases of $306,000 on two residential real estate loans, $729,000 on three commercial real estate loans, 622,000 on 10 home equity lines and loans, 58,000 on 12 other consumer loans, and $95,000 on three C&I loans.
The $306,000 in new nonperforming residential real estate loans was primarily comprised of one loan in the amount of $258,000 secured by a single family residence in northern California. Related charge-offs are discussed below.
The $729,000 in new nonperforming commercial real estate loans was primarily made up of one loan in the amount of $286,000 secured by a commercial restaurant property in central California. Related charge-offs are discussed below.
The $5,148,000 in pay-downs, sales or upgrades of loans in the second quarter of 2016 was comprised of decreases of $925,000 on 35 residential real estate loans, $1,153,000 on 18 commercial real estate loans, $1,264,000 on 128 home equity lines and loans, $26,000 on eight consumer loans, $1,779,000 on seven C&I loans, and $1,000 on a single residential construction loan.
The $1,153,000 reduction in nonperforming commercial real estate loans was primarily made up of one payoff in the amount of $491,000 on one loan secured by a commercial manufacturing property in northern California, and a payoff on one loan secured by a commercial retail property in northern California in the amount of $478,000.
The $1,779,000 in reduction in nonperforming C&I loans was primarily made up of the payoff of one loan in northern
California in the amount of $1,273,000 secured by crop proceeds and a pay-down in the amount of $498,000 on a single loan in northern California secured by general business assets.
Loan charge-offs during the three months ended June 30, 2016
In the second quarter of 2016, the Company recorded $466,000 in loan charge-offs and $176,000 in deposit overdraft charge-offs less $456,000 in loan recoveries and $80,000 in deposit overdraft recoveries resulting in $106,000 of net charge-offs. Primary causes of the loan charges taken in the second quarter of 2016 were gross charge-offs of $124,000 on one residential real estate loan, $208,000 on seven home equity lines and loans, $58,000 on 12 other consumer loans, and $95,000 on two C&I loans. During the second quarter of 2016, there were no individual charges greater than $250,000.
39
Table of Contents
Changes in nonperforming assets during the three months ended March 31, 2016
| Balance at March 31, |
New | Advances/ Capitalized |
Pay-downs /Sales |
Charge-offs/ | Transfers to Foreclosed |
Category | Balance at December 31, |
|||||||||||||||||||||||||
| (In thousands): | 2016 | NPA | Costs | /Upgrades | Write-downs | Assets | Changes | 2015 | ||||||||||||||||||||||||
| Real estate mortgage: |
||||||||||||||||||||||||||||||||
| Residential |
$ | 3,906 | $ | 380 | $ | 1 | $ | (140 | ) | $ | (37 | ) | — | — | $ | 3,702 | ||||||||||||||||
| Commercial |
7,561 | 1,038 | 39 | (13,974 | ) | (793 | ) | — | — | 21,251 | ||||||||||||||||||||||
| Consumer |
||||||||||||||||||||||||||||||||
| Home equity lines |
8,802 | 460 | 253 | (423 | ) | (214 | ) | $ | (416 | ) | $ | (74 | ) | 9,216 | ||||||||||||||||||
| Home equity loans |
1,506 | 60 | — | (42 | ) | — | — | $ | 74 | 1,414 | ||||||||||||||||||||||
| Other consumer |
43 | 79 | 1 | (6 | ) | (86 | ) | — | — | 55 | ||||||||||||||||||||||
| Commercial (C&I) |
2,204 | 1,310 | — | (47 | ) | (38 | ) | — | — | 979 | ||||||||||||||||||||||
| Construction: |
||||||||||||||||||||||||||||||||
| Residential |
12 | — | — | — | — | — | — | 12 | ||||||||||||||||||||||||
| Commercial |
— | — | — | (490 | ) | — | — | — | 490 | |||||||||||||||||||||||
|
|
|
|
|
|
|
|
|
|
|
|
|
|
|
|
|
|||||||||||||||||
| Total nonperforming loans |
24,034 | 3,327 | 294 | (15,122 | ) | (1,168 | ) | (416 | ) | — | 37,119 | |||||||||||||||||||||
| Foreclosed assets |
4,471 | — | — | (1,325 | ) | 11 | $ | 416 | — | 5,369 | ||||||||||||||||||||||
|
|
|
|
|
|
|
|
|
|
|
|
|
|
|
|
|
|||||||||||||||||
| Total nonperforming assets |
$ | 28,505 | $ | 3,327 | $ | 294 | $ | (16,447 | ) | $ | (1,157 | ) | — | — | $ | 42,488 | ||||||||||||||||
|
|
|
|
|
|
|
|
|
|
|
|
|
|
|
|
|
|||||||||||||||||
Nonperforming assets decreased during the first quarter of 2016 by $13,983,000 (32.9%) to $28,505,000 at March 31, 2016 compared to $42,488,000 at December 31, 2015. The decrease in nonperforming assets during the first quarter of 2016 was primarily the result of sales or upgrades of nonperforming loans to performing status totaling $15,122,000, dispositions of foreclosed assets totaling $1,325,000, and loan charge-offs of $1,168,000, that were partially offset by new nonperforming loans of $3,327,000, advances on existing nonperforming loans and capitalized costs on foreclosed assets of $294,000, and an increase in foreclosed asset valuation of $11,000, the net result of $60,000 of write-downs and $71,000 of positive adjustments to foreclosed asset valuations.
On March 31, 2016, the Company sold 27 nonperforming loans with total recorded value of $13,058,000 for net proceeds of $14,973,000, resulting in the recovery of $575,000 of previously charged off principal balances, the recognition of $1,237,000 of interest income from interest payments previously applied to principal balances on nonaccrual loans, and a gain on sale of $103,000. The $13,058,000 recorded value of these nonperforming loans was the result of contractual principal balances outstanding of $17,169,000, less $1,578,000 of principal balances previously charged off, less $2,684,000 of interest payments previously applied to principal balances on nonaccrual loans, and the addition of $151,000 of unamortized loan purchase premiums net of unearned deferred loan fees.
Of the 27 nonperforming loans sold during the quarter, one was a commercial real estate loan with a recorded value of $94,000 secured by unimproved real estate in northern California, one was a commercial real estate loan with a recorded value of $630,000 secured by multifamily real estate in northern California, one was a commercial real estate loan with a recorded value of $78,000 secured by a commercial office building in central California, six were commercial real estate loans with a total recorded value of $5,897,000 secured by commercial retail buildings in northern California, seven were commercial real estate loans with a total recorded value of $4,393,000 secured by commercial warehouse buildings in central California, three were commercial real estate loans with a total recorded value of $478,000 secured by commercial manufacturing buildings in central California, one was a commercial real estate loan with a recorded value of $162,000 secured by a commercial manufacturing building in northern California, one was a commercial real estate loan with a recorded value of $516,000 secured by a fitness center in northern California, two were commercial real estate loans with a total recorded value of $659,000 secured by hospitality real estate in northern California, two were commercial real estate loans with a total recorded value of $144,000 secured by multi-use properties in northern California, one was a home equity line of credit with a recorded value of $1,000 secured by a single family residence in central California, and one was a commercial and industrial loan with a recorded value of $6,000 secured by miscellaneous non real estate business assets in central California.
The $3,327,000 in new nonperforming loans during the first quarter of 2016 was comprised of increases of $380,000 on three residential real estate loans, $1,038,000 on seven commercial real estate loans, $520,000 on seven home equity lines and loans, $79,000 on 10 consumer loans, and $1,310,000 on four C&I loans.
The $380,000 in new nonperforming residential real estate loans was primarily comprised of a single loan in the amount of $343,000 secured by a single family residence in northern California.
The $1,038,000 in new nonperforming commercial real estate loans was primarily made up of one loan in the amount of $491,000 secured by a commercial manufacturing property in northern California.
The $1,310,000 in new nonperforming commercial and industrial loan was primarily comprised of a single loan in the amount of $1,273,000 secured by various non-real estate business assets in northern California. Related charge-offs are discussed below.
40
Table of Contents
Loan charge-offs during the three months ended March 31, 2016
In the first quarter of 2016, the Company recorded $1,168,000 in loan charge-offs and $120,000 in deposit overdraft charge-offs less $1,364,000 in loan recoveries and $92,000 in deposit overdraft recoveries resulting in $168,000 of net recoveries. Primary causes of the loan charges taken in the first quarter of 2016 were gross charge-offs of $37,000 on two residential real estate loans, $793,000 on 14 commercial real estate loans, $214,000 on four home equity lines and loans, $86,000 on 12 other consumer loans, and $38,000 on five C&I loans.
The $793,000 in charge-offs the bank incurred in its commercial real estate portfolio was primarily the result of $495,000 in charge-offs incurred on a single relationship secured by commercial office and single family real estate properties in central California. The remaining $298,000 was spread over 10 loans spread throughout the Company’s footprint.
Differences between the amounts explained in this section and the total charge-offs listed for a particular category are generally made up of individual charges of less than $250,000 each. Generally losses are triggered by non-performance by the borrower and calculated based on any difference between the current loan amount and the current value of the underlying collateral less any estimated costs associated with the disposition of the collateral.
Allowance for Loan Losses
The Company’s allowance for loan losses is comprised of allowances for originated, PNCI and PCI loans. All such allowances are established through a provision for loan losses charged to expense.
Originated and PNCI loans, and deposit related overdrafts are charged against the allowance for originated loan losses when Management believes that the collectability of the principal is unlikely or, with respect to consumer installment loans, according to an established delinquency schedule. The allowances for originated and PNCI loan losses are amounts that Management believes will be adequate to absorb probable losses inherent in existing originated loans, based on evaluations of the collectability, impairment and prior loss experience of those loans and leases. The evaluations take into consideration such factors as changes in the nature and size of the portfolio, overall portfolio quality, loan concentrations, specific problem loans, and current economic conditions that may affect the borrower’s ability to pay. The Company defines an originated or PNCI loan as impaired when it is probable the Company will be unable to collect all amounts due according to the contractual terms of the loan agreement. Impaired originated and PNCI loans are measured based on the present value of expected future cash flows discounted at the loan’s original effective interest rate. As a practical expedient, impairment may be measured based on the loan’s observable market price or the fair value of the collateral if the loan is collateral dependent. When the measure of the impaired loan is less than the recorded investment in the loan, the impairment is recorded through a valuation allowance.
In situations related to originated and PNCI loans where, for economic or legal reasons related to a borrower’s financial difficulties, the Company grants a concession for other than an insignificant period of time to the borrower that the Company would not otherwise consider, the related loan is classified as a troubled debt restructuring (TDR). The Company strives to identify borrowers in financial difficulty early and work with them to modify to more affordable terms before their loan reaches nonaccrual status. These modified terms may include rate reductions, principal forgiveness, payment forbearance and other actions intended to minimize the economic loss and to avoid foreclosure or repossession of the collateral. In cases where the Company grants the borrower new terms that provide for a reduction of either interest or principal, the Company measures any impairment on the restructuring as noted above for impaired loans. TDR loans are classified as impaired until they are fully paid off or charged off. Loans that are in nonaccrual status at the time they become TDR loans, remain in nonaccrual status until the borrower demonstrates a sustained period of performance which the Company generally believes to be six consecutive months of payments, or equivalent. Otherwise, TDR loans are subject to the same nonaccrual and charge-off policies as noted above with respect to their restructured principal balance.
Credit risk is inherent in the business of lending. As a result, the Company maintains an allowance for loan losses to absorb losses inherent in the Company’s originated and PNCI loan portfolios. These are maintained through periodic charges to earnings. These charges are included in the Consolidated Income Statements as provision for loan losses. All specifically identifiable and quantifiable losses are immediately charged off against the allowance. However, for a variety of reasons, not all losses are immediately known to the Company and, of those that are known, the full extent of the loss may not be quantifiable at that point in time. The balance of the Company’s allowances for originated and PNCI loan losses are meant to be an estimate of these unknown but probable losses inherent in these portfolios.
The Company formally assesses the adequacy of the allowance for originated and PNCI loan losses on a quarterly basis. Determination of the adequacy is based on ongoing assessments of the probable risk in the outstanding originated and PNCI loan portfolios, and to a lesser extent the Company’s originated and PNCI loan commitments. These assessments include the periodic re-grading of credits based on changes in their individual credit characteristics including delinquency, seasoning, recent financial performance of the borrower, economic factors, changes in the interest rate environment, growth of the portfolio as a whole or by segment, and other factors as warranted. Loans are initially graded when originated or acquired. They are re-graded as they are renewed, when there is a new loan to the same borrower, when identified facts demonstrate
41
Table of Contents
heightened risk of nonpayment, or if they become delinquent. Re-grading of larger problem loans occurs at least quarterly. Confirmation of the quality of the grading process is obtained by independent credit reviews conducted by consultants specifically hired for this purpose and by various bank regulatory agencies.
The Company’s method for assessing the appropriateness of the allowance for originated and PNCI loan losses includes specific allowances for impaired loans and leases, formula allowance factors for pools of credits, and allowances for changing environmental factors (e.g., interest rates, growth, economic conditions, etc.). Allowance factors for loan pools are based on historical loss experience by product type and prior risk rating. Allowances for impaired loans are based on analysis of individual credits. Allowances for changing environmental factors are Management’s best estimate of the probable impact these changes have had on the originated or PNCI loan portfolio as a whole. The allowances for originated and PNCI loans are included in the allowance for loan losses.
As noted above, the allowances for originated and PNCI loan losses consists of a specific allowance, a formula allowance, and an allowance for environmental factors. The first component, the specific allowance, results from the analysis of identified credits that meet management’s criteria for specific evaluation. These loans are reviewed individually to determine if such loans are considered impaired. Impaired loans are those where management has concluded that it is probable that the borrower will be unable to pay all amounts due under the contractual terms. Impaired loans are specifically reviewed and evaluated individually by management for loss potential by evaluating sources of repayment, including collateral as applicable, and a specified allowance for loan losses is established where necessary.
The second component of the allowance for originated and PNCI loan losses, the formula allowance, is an estimate of the probable losses that have occurred across the major loan categories in the Company’s originated and PNCI loan portfolios. This analysis is based on loan grades by pool and the loss history of these pools. This analysis covers the Company’s entire originated and PNCI loan portfolios including unused commitments but excludes any loans that were analyzed individually and assigned a specific allowance as discussed above. The total amount allocated for this component is determined by applying loss estimation factors to outstanding loans and loan commitments. The loss factors were previously based primarily on the Company’s historical loss experience tracked over a five-year period and adjusted as appropriate for the input of current trends and events. Because historical loss experience varies for the different categories of originated loans, the loss factors applied to each category also differed. In addition, there is a greater chance that the Company would suffer a loss from a loan that was risk rated less than satisfactory than if the loan was last graded satisfactory. Therefore, for any given category, a larger loss estimation factor was applied to less than satisfactory loans than to those that the Company last graded as satisfactory. The resulting formula allowance was the sum of the allocations determined in this manner.
The third component of the allowances for originated and PNCI loan losses, the environmental factor allowance, is a component that is not allocated to specific loans or groups of loans, but rather is intended to absorb losses that may not be provided for by the other components.
There are several primary reasons that the other components discussed above might not be sufficient to absorb the losses present in the originated and PNCI loan portfolios, and the environmental factor allowance is used to provide for the losses that have occurred because of them.
The first reason is that there are limitations to any credit risk grading process. The volume of originated and PNCI loans makes it impractical to re-grade every loan every quarter. Therefore, it is possible that some currently performing originated or PNCI loans not recently graded will not be as strong as their last grading and an insufficient portion of the allowance will have been allocated to them. Grading and loan review often must be done without knowing whether all relevant facts are at hand. Troubled borrowers may deliberately or inadvertently omit important information from reports or conversations with lending officers regarding their financial condition and the diminished strength of repayment sources.
The second reason is that the loss estimation factors are based primarily on historical loss totals. As such, the factors may not give sufficient weight to such considerations as the current general economic and business conditions that affect the Company’s borrowers and specific industry conditions that affect borrowers in that industry. The factors might also not give sufficient weight to other environmental factors such as changing economic conditions and interest rates, portfolio growth, entrance into new markets or products, and other characteristics as may be determined by Management.
42
Table of Contents
Specifically, in assessing how much environmental factor allowance needed to be provided, management considered the following:
| • | with respect to the economy, management considered the effects of changes in GDP, unemployment, CPI, debt statistics, housing starts, housing sales, auto sales, agricultural prices, home affordability, and other economic factors which serve as indicators of economic health and trends and which may have an impact on the performance of our borrowers, and |
| • | with respect to changes in the interest rate environment, management considered the recent changes in interest rates and the resultant economic impact it may have had on borrowers with high leverage and/or low profitability; and |
| • | with respect to changes in energy prices, management considered the effect that increases, decreases or volatility may have on the performance of our borrowers, and |
| • | with respect to loans to borrowers in new markets and growth in general, management considered the relatively short seasoning of such loans and the lack of experience with such borrowers, and |
| • | with respect to loans that have not yet been identified as impaired, management considered the volume and severity of past due loans. |
Each of these considerations was assigned a factor and applied to a portion or the entire originated and PNCI loan portfolios. Since these factors are not derived from experience and are applied to large non-homogeneous groups of loans, they are available for use across the portfolio as a whole.
Acquired loans are valued as of acquisition date in accordance with FASB ASC Topic 805, Business Combinations. Loans purchased with evidence of credit deterioration since origination for which it is probable that all contractually required payments will not be collected are referred to as purchased credit impaired (PCI) loans. PCI loans are accounted for under FASB ASC Topic 310-30, Loans and Debt Securities Acquired with Deteriorated Credit Quality. In addition, because of the significant credit discounts associated with the loans acquired in the Granite acquisition, the Company elected to account for all loans acquired in the Granite acquisition under FASB ASC Topic 310-30, and classify them all as PCI loans. Under FASB ASC Topic 805 and FASB ASC Topic 310-30, PCI loans are recorded at fair value at acquisition date, factoring in credit losses expected to be incurred over the life of the loan. Accordingly, an allowance for loan losses is not carried over or recorded as of the acquisition date. Fair value is defined as the present value of the future estimated principal and interest payments of the loan, with the discount rate used in the present value calculation representing the estimated effective yield of the loan. The difference between contractual future payments and estimated future payments is referred to as the nonaccretable difference. The difference between estimated future payments and the present value of the estimated future payments is referred to as the accretable yield. The accretable yield represents the amount that is expected to be recorded as interest income over the remaining life of the loan. If after acquisition, the Company determines that the future cash flows of a PCI loan are expected to be more than the originally estimated, an increase in the discount rate (effective yield) would be made such that the newly increased accretable yield would be recognized, on a level yield basis, over the remaining estimated life of the loan. If after acquisition, the Company determines that the future cash flows of a PCI loan are expected to be less than the previously estimated, the discount rate would first be reduced until the present value of the reduced cash flow estimate equals the previous present value however, the discount rate may not be lowered below its original level. If the discount rate has been lowered to its original level and the present value has not been sufficiently lowered, an allowance for loan loss would be established through a provision for loan losses charged to expense to decrease the present value to the required level. If the estimated cash flows improve after an allowance has been established for a loan, the allowance may be partially or fully reversed depending on the improvement in the estimated cash flows. Only after the allowance has been fully reversed may the discount rate be increased. PCI loans are put on nonaccrual status when cash flows cannot be reasonably estimated. PCI loans are charged off when evidence suggests cash flows are not recoverable. Foreclosed assets from PCI loans are recorded in foreclosed assets at fair value with the fair value at time of foreclosure representing cash flow from the loan. ASC 310-30 allows PCI loans with similar risk characteristics and acquisition time frame to be “pooled” and have their cash flows aggregated as if they were one loan.
43
Table of Contents
The Components of the Allowance for Loan Losses
The following table sets forth the Bank’s allowance for loan losses as of the dates indicated (dollars in thousands):
| December 31, | ||||||||||||||||||||
| 2016 | 2015 | 2014 | 2013 | 2012 | ||||||||||||||||
| Allowance for originated and PNCI loan losses: |
||||||||||||||||||||
| Specific allowance |
$ | 2,046 | $ | 2,890 | $ | 4,267 | $ | 3,975 | $ | 4,505 | ||||||||||
| Formula allowance |
17,485 | 20,603 | 22,076 | 24,611 | 29,314 | |||||||||||||||
| Environmental factors allowance |
10,275 | 9,625 | 6,815 | 5,619 | 3,919 | |||||||||||||||
|
|
|
|
|
|
|
|
|
|
|
|||||||||||
| Allowance for originated and PNCI loan losses |
29,806 | 33,118 | 33,158 | 34,205 | 37,738 | |||||||||||||||
| Allowance for PCI loan losses |
2,697 | 2,893 | 3,427 | 4,040 | 4,910 | |||||||||||||||
|
|
|
|
|
|
|
|
|
|
|
|||||||||||
| Allowance for loan losses |
$ | 32,503 | $ | 36,011 | $ | 36,585 | $ | 38,245 | $ | 42,648 | ||||||||||
|
|
|
|
|
|
|
|
|
|
|
|||||||||||
| Allowance for loan losses to loans |
1.18 | % | 1.43 | % | 1.60 | % | 2.29 | % | 2.73 | % | ||||||||||
Based on the current conditions of the loan portfolio, management believes that the $32,503,000 allowance for loan losses at December 31, 2016 is adequate to absorb probable losses inherent in the Bank’s loan portfolio. No assurance can be given, however, that adverse economic conditions or other circumstances will not result in increased losses in the portfolio.
The following table summarizes the allocation of the allowance for loan losses between loan types:
| December 31, | ||||||||||||||||||||
| (dollars in thousands) | 2016 | 2015 | 2014 | 2013 | 2012 | |||||||||||||||
| Real estate mortgage |
$ | 14,292 | $ | 13,950 | $ | 12,313 | $ | 12,854 | $ | 12,305 | ||||||||||
| Consumer |
10,284 | 15,079 | 18,201 | 18,238 | 23,461 | |||||||||||||||
| Commercial |
5,831 | 5,271 | 4,226 | 4,331 | 4,703 | |||||||||||||||
| Real estate construction |
2,096 | 1,711 | 1,845 | 2,822 | 2,179 | |||||||||||||||
|
|
|
|
|
|
|
|
|
|
|
|||||||||||
| Total allowance for loan losses |
$ | 32,503 | $ | 36,011 | $ | 36,585 | $ | 38,245 | $ | 42,648 | ||||||||||
|
|
|
|
|
|
|
|
|
|
|
|||||||||||
The following table summarizes the allocation of the allowance for loan losses between loan types as a percentage of the total allowance for loan losses:
| December 31, | ||||||||||||||||||||
| 2016 | 2015 | 2014 | 2013 | 2012 | ||||||||||||||||
| Real estate mortgage |
44.0 | % | 38.7 | % | 33.7 | % | 33.6 | % | 28.9 | % | ||||||||||
| Consumer |
31.6 | % | 41.9 | % | 49.7 | % | 47.7 | % | 55.0 | % | ||||||||||
| Commercial |
17.9 | % | 14.6 | % | 11.6 | % | 11.3 | % | 11.0 | % | ||||||||||
| Real estate construction |
6.5 | % | 4.8 | % | 5.0 | % | 7.4 | % | 5.1 | % | ||||||||||
|
|
|
|
|
|
|
|
|
|
|
|||||||||||
| Total allowance for loan losses |
100.0 | % | 100.0 | % | 100.0 | % | 100.0 | % | 100.0 | % | ||||||||||
|
|
|
|
|
|
|
|
|
|
|
|||||||||||
The following table summarizes the allocation of the allowance for loan losses between loan types as a percentage of total loans and as a percentage of total loans in each of the loan categories listed:
| December 31, | ||||||||||||||||||||
| 2016 | 2015 | 2014 | 2013 | 2012 | ||||||||||||||||
| Real estate mortgage |
0.69 | % | 0.77 | % | 0.76 | % | 1.16 | % | 1.22 | % | ||||||||||
| Consumer |
2.84 | % | 3.81 | % | 4.36 | % | 4.76 | % | 6.08 | % | ||||||||||
| Commercial |
2.69 | % | 2.70 | % | 2.42 | % | 3.28 | % | 3.47 | % | ||||||||||
| Real estate construction |
1.71 | % | 1.42 | % | 2.46 | % | 5.75 | % | 6.59 | % | ||||||||||
|
|
|
|
|
|
|
|
|
|
|
|||||||||||
| Total allowance for loan losses |
1.18 | % | 1.43 | % | 1.60 | % | 2.29 | % | 2.73 | % | ||||||||||
|
|
|
|
|
|
|
|
|
|
|
|||||||||||
44
Table of Contents
The following tables summarize the activity in the allowance for loan losses, reserve for unfunded commitments, and allowance for losses (which is comprised of the allowance for loan losses and the reserve for unfunded commitments) for the years indicated (dollars in thousands):
| Year ended December 31, | ||||||||||||||||||||
| 2016 | 2015 | 2014 | 2013 | 2012 | ||||||||||||||||
| Allowance for loan losses: |
||||||||||||||||||||
| Balance at beginning of period |
$ | 36,011 | $ | 36,585 | $ | 38,245 | $ | 42,648 | $ | 45,914 | ||||||||||
| (Benefit from) provision for loan losses |
(5,970 | ) | (2,210 | ) | (4,045 | ) | (715 | ) | 9,423 | |||||||||||
| Loans charged off: |
||||||||||||||||||||
| Real estate mortgage: |
||||||||||||||||||||
| Residential |
(321 | ) | (224 | ) | (171 | ) | (46 | ) | (1,558 | ) | ||||||||||
| Commercial |
(827 | ) | — | (110 | ) | (2,038 | ) | (3,457 | ) | |||||||||||
| Consumer: |
||||||||||||||||||||
| Home equity lines |
(585 | ) | (694 | ) | (1,094 | ) | (2,651 | ) | (8,042 | ) | ||||||||||
| Home equity loans |
(219 | ) | (242 | ) | (29 | ) | (94 | ) | (385 | ) | ||||||||||
| Auto indirect |
— | (4 | ) | (3 | ) | (68 | ) | (83 | ) | |||||||||||
| Other consumer |
(823 | ) | (972 | ) | (599 | ) | (887 | ) | (1,202 | ) | ||||||||||
| Commercial |
(455 | ) | (680 | ) | (479 | ) | (1,599 | ) | (1,251 | ) | ||||||||||
| Construction: |
||||||||||||||||||||
| Residential |
— | — | (4 | ) | (20 | ) | (406 | ) | ||||||||||||
| Commercial |
— | — | (69 | ) | (140 | ) | (100 | ) | ||||||||||||
|
|
|
|
|
|
|
|
|
|
|
|||||||||||
| Total loans charged off |
(3,230 | ) | (2,816 | ) | (2,558 | ) | (7,543 | ) | (16,484 | ) | ||||||||||
| Recoveries of previously charged-off loans: |
||||||||||||||||||||
| Real estate mortgage: |
||||||||||||||||||||
| Residential |
880 | 204 | 2 | 345 | 147 | |||||||||||||||
| Commercial |
920 | 243 | 540 | 994 | 1,020 | |||||||||||||||
| Consumer: |
||||||||||||||||||||
| Home equity lines |
2,317 | 666 | 960 | 1,053 | 398 | |||||||||||||||
| Home equity loans |
590 | 252 | 34 | 41 | 100 | |||||||||||||||
| Auto indirect |
— | 42 | 86 | 195 | 215 | |||||||||||||||
| Other consumer |
449 | 500 | 495 | 759 | 860 | |||||||||||||||
| Commercial |
404 | 677 | 1,268 | 340 | 643 | |||||||||||||||
| Construction: |
||||||||||||||||||||
| Residential |
54 | 1,728 | 1,377 | 63 | 412 | |||||||||||||||
| Commercial |
78 | 140 | 181 | 65 | — | |||||||||||||||
|
|
|
|
|
|
|
|
|
|
|
|||||||||||
| Total recoveries of previously charged off loans |
5,692 | 4,452 | 4,943 | 3,855 | 3,795 | |||||||||||||||
|
|
|
|
|
|
|
|
|
|
|
|||||||||||
| Net charge-offs |
2,462 | 1,636 | 2,385 | (3,688 | ) | (12,689 | ) | |||||||||||||
|
|
|
|
|
|
|
|
|
|
|
|||||||||||
| Balance at end of period |
$ | 32,503 | $ | 36,011 | $ | 36,585 | $ | 38,245 | $ | 42,648 | ||||||||||
|
|
|
|
|
|
|
|
|
|
|
|||||||||||
| Year ended December 31, | ||||||||||||||||||||
| 2016 | 2015 | 2014 | 2013 | 2012 | ||||||||||||||||
| Reserve for unfunded commitments: |
||||||||||||||||||||
| Balance at beginning of period |
$ | 2,475 | $ | 2,145 | $ | 2,415 | $ | 3,615 | $ | 2,740 | ||||||||||
| Provision for losses – unfunded commitments |
244 | 330 | (270 | ) | (1,200 | ) | 875 | |||||||||||||
|
|
|
|
|
|
|
|
|
|
|
|||||||||||
| Balance at end of period |
$ | 2,719 | $ | 2,475 | $ | 2,145 | $ | 2,415 | $ | 3,615 | ||||||||||
|
|
|
|
|
|
|
|
|
|
|
|||||||||||
| Balance at end of period: |
||||||||||||||||||||
| Allowance for loan losses |
$ | 32,503 | $ | 36,011 | $ | 36,585 | $ | 38,245 | $ | 42,648 | ||||||||||
| Reserve for unfunded commitments |
2,719 | 2,475 | 2,145 | 2,415 | 3,615 | |||||||||||||||
|
|
|
|
|
|
|
|
|
|
|
|||||||||||
| Allowance for loan losses and reserve for unfunded commitments |
$ | 35,222 | $ | 38,486 | $ | 38,730 | $ | 40,660 | $ | 46,263 | ||||||||||
|
|
|
|
|
|
|
|
|
|
|
|||||||||||
| As a percentage of total loans at end of period: |
||||||||||||||||||||
| Allowance for loan losses |
1.18 | % | 1.43 | % | 1.60 | % | 2.29 | % | 2.73 | % | ||||||||||
| Reserve for unfunded commitments |
0.10 | % | 0.10 | % | 0.10 | % | 0.14 | % | 0.23 | % | ||||||||||
|
|
|
|
|
|
|
|
|
|
|
|||||||||||
| Allowance for loan losses and reserve for unfunded commitments |
1.28 | % | 1.53 | % | 1.70 | % | 2.43 | % | 2.96 | % | ||||||||||
|
|
|
|
|
|
|
|
|
|
|
|||||||||||
| Average total loans |
$ | 2,629,729 | $ | 2,389,437 | $ | 1,847,749 | $ | 1,610,725 | $ | 1,552,540 | ||||||||||
| Ratios: |
||||||||||||||||||||
| Net charge-offs during period to average loans outstanding during period |
(0.09 | )% | (0.07 | )% | (0.13 | )% | 0.23 | % | 0.82 | % | ||||||||||
| Provision for loan losses to average loans outstanding |
(0.21 | )% | (0.09 | )% | (0.22 | )% | (0.04 | )% | 0.61 | % | ||||||||||
| Allowance for loan losses to loans at year end |
1.18 | % | 1.43 | % | 1.60 | % | 2.29 | % | 2.73 | % | ||||||||||
45
Table of Contents
Foreclosed Assets, Net of Allowance for Losses
The following tables detail the components and summarize the activity in foreclosed assets, net of allowances for losses for the years indicated (dollars in thousands):
| (dollars in thousands): |
Balance at December 31, 2016 |
New NPA |
Advances/ Capitalized Costs |
Sales | Valuation Adjustments |
Transfers from Loans |
Category Changes |
Balance at December 31, 2015 |
||||||||||||||||||||||||
| Noncovered: |
||||||||||||||||||||||||||||||||
| Land & Construction |
$ | 1,512 | — | — | $ | (979 | ) | — | — | — | $ | 2,491 | ||||||||||||||||||||
| Residential real estate |
1,441 | — | — | (2,380 | ) | $ | (56 | ) | $ | 2,090 | — | 1,787 | ||||||||||||||||||||
| Commercial real estate |
810 | — | — | (389 | ) | (84 | ) | 192 | — | 1,091 | ||||||||||||||||||||||
|
|
|
|
|
|
|
|
|
|
|
|
|
|
|
|
|
|||||||||||||||||
| Total noncovered |
3,763 | — | — | (3,748 | ) | (140 | ) | 2,282 | — | 5,369 | ||||||||||||||||||||||
|
|
|
|
|
|
|
|
|
|
|
|
|
|
|
|
|
|||||||||||||||||
| Covered: |
||||||||||||||||||||||||||||||||
| Land & Construction |
— | — | — | — | — | — | — | — | ||||||||||||||||||||||||
| Residential real estate |
223 | — | — | — | — | 223 | — | — | ||||||||||||||||||||||||
| Commercial real estate |
— | — | — | — | — | — | — | — | ||||||||||||||||||||||||
|
|
|
|
|
|
|
|
|
|
|
|
|
|
|
|
|
|||||||||||||||||
| Total covered |
223 | — | — | — | — | 223 | — | — | ||||||||||||||||||||||||
|
|
|
|
|
|
|
|
|
|
|
|
|
|
|
|
|
|||||||||||||||||
| Total foreclosed assets |
$ | 3,986 | — | — | $ | (3,748 | ) | $ | (140 | ) | $ | 2,505 | — | $ | 5,369 | |||||||||||||||||
|
|
|
|
|
|
|
|
|
|
|
|
|
|
|
|
|
|||||||||||||||||
| (dollars in thousands): | Balance at December 31, 2015 |
New NPA |
Advances/ Capitalized Costs |
Sales | Valuation Adjustments |
Transfers from Loans |
Category Changes |
Balance at December 31, 2014 |
||||||||||||||||||||||||
| Noncovered: |
||||||||||||||||||||||||||||||||
| Land & Construction |
$ | 2,491 | — | — | $ | (61 | ) | $ | (20 | ) | $ | 153 | $ | 445 | $ | 1,974 | ||||||||||||||||
| Residential real estate |
1,787 | — | $ | 195 | (3,374 | ) | (276 | ) | 3,620 | — | 1,622 | |||||||||||||||||||||
| Commercial real estate |
1,091 | — | — | (1,023 | ) | (206 | ) | 1,467 | — | 853 | ||||||||||||||||||||||
|
|
|
|
|
|
|
|
|
|
|
|
|
|
|
|
|
|||||||||||||||||
| Total noncovered |
5,369 | — | 195 | (4,458 | ) | (502 | ) | 5,240 | 445 | 4,449 | ||||||||||||||||||||||
|
|
|
|
|
|
|
|
|
|
|
|
|
|
|
|
|
|||||||||||||||||
| Covered: |
||||||||||||||||||||||||||||||||
| Land & Construction |
— | — | — | — | — | — | (445 | ) | 445 | |||||||||||||||||||||||
| Residential real estate |
— | — | — | — | — | — | — | — | ||||||||||||||||||||||||
| Commercial real estate |
— | — | — | — | — | — | — | — | ||||||||||||||||||||||||
|
|
|
|
|
|
|
|
|
|
|
|
|
|
|
|
|
|||||||||||||||||
| Total covered |
— | — | — | — | — | — | (445 | ) | 445 | |||||||||||||||||||||||
|
|
|
|
|
|
|
|
|
|
|
|
|
|
|
|
|
|||||||||||||||||
| Total foreclosed assets |
$ | 5,369 | — | $ | 195 | $ | (4,458 | ) | $ | (502 | ) | $ | 5,240 | — | $ | 4,894 | ||||||||||||||||
|
|
|
|
|
|
|
|
|
|
|
|
|
|
|
|
|
|||||||||||||||||
Premises and Equipment
Premises and equipment were comprised of:
| December 31, 2016 |
December 31, 2015 |
|||||||
| (In thousands) | ||||||||
| Land & land improvements |
$ | 9,522 | $ | 8,909 | ||||
| Buildings |
42,345 | 38,643 | ||||||
| Furniture and equipment |
31,428 | 31,081 | ||||||
|
|
|
|
|
|||||
| 83,295 | 78,633 | |||||||
| Less: Accumulated depreciation |
(37,412 | ) | (35,518 | ) | ||||
|
|
|
|
|
|||||
| 45,883 | 43,115 | |||||||
| Construction in progress |
2,523 | 696 | ||||||
|
|
|
|
|
|||||
| Total premises and equipment |
$ | 48,406 | $ | 43,811 | ||||
|
|
|
|
|
|||||
During the year ended December 31, 2016, premises and equipment increased $4,595,000 due to purchases of $10,930,000, that were partially offset by depreciation of $5,314,000 and disposals of premises and equipment with net book value of $2,611,000.
46
Table of Contents
Intangible Assets
Intangible assets at December 31, 2016 and 2015 were comprised of the following:
| December 31, | ||||||||
| 2016 | 2015 | |||||||
| (In thousands) | ||||||||
| Core-deposit intangible |
$ | 6,563 | $ | 5,894 | ||||
| Goodwill |
64,311 | 63,462 | ||||||
|
|
|
|
|
|||||
| Total intangible assets |
$ | 70,874 | $ | 69,356 | ||||
|
|
|
|
|
|||||
The core-deposit intangible assets resulted from the Bank’s acquisition of three bank branches from Bank of America on March 18, 2016, North Valley Bancorp in 2014, Citizens in 2011, and Granite in 2010. The goodwill intangible asset includes $849,000 from the acquisition of three bank branches from Bank of America on March 18, 2016, $47,943,000 from the North Valley Bancorp acquisition in 2014, and $15,519,000 from the North State National Bank acquisition in 2003. Amortization of core deposit intangible assets amounting to $1,377,000, $1,157,000, and $446,000 was recorded in 2016, 2015, and 2014, respectively.
Deposits
See Note 13 to the consolidated financial statements at Item 8 of this report for information about the Company’s deposits.
Long-Term Debt
See Note 16 to the consolidated financial statements at Item 8 of this report for information about the Company’s other borrowings, including long-term debt.
Junior Subordinated Debt
See Note 17 to the consolidated financial statements at Item 8 of this report for information about the Company’s junior subordinated debt.
Equity
See Note 19 and Note 29 in the consolidated financial statements at Item 8 of this report for a discussion of shareholders’ equity and regulatory capital, respectively. Management believes that the Company’s capital is adequate to support anticipated growth, meet the cash dividend requirements of the Company and meet the future risk-based capital requirements of the Bank and the Company.
Market Risk Management
Overview. The goal for managing the assets and liabilities of the Bank is to maximize shareholder value and earnings while maintaining a high quality balance sheet without exposing the Bank to undue interest rate risk. The Board of Directors has overall responsibility for the Company’s interest rate risk management policies. The Bank has an Asset and Liability Management Committee (ALCO) which establishes and monitors guidelines to control the sensitivity of earnings to changes in interest rates.
Asset/Liability Management. Activities involved in asset/liability management include but are not limited to lending, accepting and placing deposits, investing in securities and issuing debt. Interest rate risk is the primary market risk associated with asset/liability management. Sensitivity of earnings to interest rate changes arises when yields on assets change in a different time period or in a different amount from that of interest costs on liabilities. To mitigate interest rate risk, the structure of the balance sheet is managed with the goal that movements of interest rates on assets and liabilities are correlated and contribute to earnings even in periods of volatile interest rates. The asset/liability management policy sets limits on the acceptable amount of variance in net interest margin and market value of equity under changing interest environments. Market value of equity is the net present value of estimated cash flows from the Bank’s assets, liabilities and off-balance sheet items. The Bank uses simulation models to forecast net interest margin and market value of equity.
Simulation of net interest margin and market value of equity under various interest rate scenarios is the primary tool used to measure interest rate risk. Using computer-modeling techniques, the Bank is able to estimate the potential impact of changing interest rates on net interest margin and market value of equity. A balance sheet forecast is prepared using inputs of actual loan, securities and interest-bearing liability (i.e. deposits/borrowings) positions as the beginning base.
In the simulation of net interest income, the forecast balance sheet is processed against various interest rate scenarios. These various interest rate scenarios include a flat rate scenario, which assumes interest rates are unchanged in the future, and rate ramp scenarios including -100, +100, and +200 basis points around the flat scenario. These ramp scenarios assume that interest rates increase or decrease evenly (in a “ramp” fashion) over a twelve-month period and remain at the new levels beyond twelve months.
47
Table of Contents
The following table summarizes the projected effect on net interest income and net income due to changing interest rates as measured against a flat rate (no interest rate change) scenario over the succeeding twelve month period. The simulation results shown below assume no changes in the structure of the Company’s balance sheet over the twelve months being measured (a “flat” balance sheet scenario), and that deposit rates will track general interest rate changes by approximately 50%:
Interest Rate Risk Simulation of Net Interest Income and Net Income as of December 31, 2016
| Estimated Change in | ||||
| Change in Interest | Net Interest Income (NII) | |||
| Rates (Basis Points) | (as % of “flat” NII) | |||
| +200 (ramp) |
(1.65 | %) | ||
| +100 (ramp) |
(0.82 | %) | ||
| + 0 (flat) |
— | |||
| -100 (ramp) |
(1.59 | %) | ||
In the simulation of market value of equity, the forecast balance sheet is processed against various interest rate scenarios. These various interest rate scenarios include a flat rate scenario, which assumes interest rates are unchanged in the future, and rate shock scenarios including -100, +100, and +200 basis points around the flat scenario. These rate shock scenarios assume that interest rates increase or decrease immediately (in a “shock” fashion) and remain at the new level in the future.
The following table summarizes the effect on market value of equity due to changing interest rates as measured against a flat rate (no change) scenario:
Interest Rate Risk Simulation of Market Value of Equity as of December 31, 2016
| Estimated Change in | ||||
| Change in Interest | Market Value of Equity (MVE) | |||
| Rates (Basis Points) | (as % of “flat” MVE) | |||
| +200 (shock) |
(12.0 | %) | ||
| +100 (shock) |
(4.6 | %) | ||
| + 0 (flat) |
— | |||
| -100 (shock) |
(4.8 | %) | ||
These results indicate that given a “flat” balance sheet scenario, and if interest-bearing checking, savings and time deposit interest rates track general interest rate changes by approximately 25%, 50%, and 75%, respectively, the Company’s balance sheet is slightly liability sensitive over a twelve month time horizon for rates up, and slightly asset sensitive over a twelve month time horizon for rates down. “Liability sensitive” implies that net interest income decreases when interest rates rise and increase when interest rates decrease. “Asset sensitive” implies that net interest income increases when interest rates rise and decrease when interest rates decrease. “Neutral sensitivity” implies that net interest income does not change when interest rates change. The asset liability management policy limits aggregate market risk, as measured in this fashion, to an acceptable level within the context of risk-return trade-offs.
The simulation results noted above do not incorporate any management actions that might moderate the negative consequences of interest rate deviations. In addition, the simulation results noted above contain various assumptions such as a flat balance sheet, and the rate that deposit interest rates change as general interest rates change. Therefore, they do not reflect likely actual results, but serve as estimates of interest rate risk.
As with any method of measuring interest rate risk, certain shortcomings are inherent in the method of analysis presented in the preceding tables. For example, although certain of the Company’s assets and liabilities may have similar maturities or repricing time frames, they may react in different degrees to changes in market interest rates. In addition, the interest rates on certain of the Company’s asset and liability categories may precede, or lag behind, changes in market interest rates. Also, the actual rates of prepayments on loans and investments could vary significantly from the assumptions utilized in deriving the results as presented in the preceding tables. Further, a change in U.S. Treasury rates accompanied by a change in the shape of the treasury yield curve could result in different estimations from those presented herein. Accordingly, the results in the preceding tables should not be relied upon as indicative of actual results in the event of changing market interest rates. Additionally, the resulting estimates of changes in market value of equity are not intended to represent, and should not be construed to represent, estimates of changes in the underlying value of the Company.
Interest rate sensitivity is a function of the repricing characteristics of the Company’s portfolio of assets and liabilities. One aspect of these repricing characteristics is the time frame within which the interest-bearing assets and liabilities are subject to change in interest rates either at replacement, repricing or maturity. An analysis of the repricing time frames of interest-bearing assets and liabilities is sometimes called a “gap” analysis because it shows the gap between assets and liabilities
48
Table of Contents
repricing or maturing in each of a number of periods. Another aspect of these repricing characteristics is the relative magnitude of the repricing for each category of interest earning asset and interest-bearing liability given various changes in market interest rates. Gap analysis gives no indication of the relative magnitude of repricing given various changes in interest rates. Interest rate sensitivity management focuses on the maturity of assets and liabilities and their repricing during periods of changes in market interest rates. Interest rate sensitivity gaps are measured as the difference between the volumes of assets and liabilities in the Company’s current portfolio that are subject to repricing at various time horizons.
The following interest rate sensitivity table shows the Company’s repricing gaps as of December 31, 2016. In this table transaction deposits, which may be repriced at will by the Company, have been included in the less than 3-month category. The inclusion of all of the transaction deposits in the less than 3-month repricing category causes the Company to appear liability sensitive. Because the Company may reprice its transaction deposits at will, transaction deposits may or may not reprice immediately with changes in interest rates.
Due to the limitations of gap analysis, as described above, the Company does not actively use gap analysis in managing interest rate risk. Instead, the Company relies on the more sophisticated interest rate risk simulation model described above as its primary tool in measuring and managing interest rate risk.
| Interest Rate Sensitivity – December 31, 2016 (dollars in thousands) |
Repricing within: | |||||||||||||||||||
| Less than 3 months |
3 - 6 months | 6 - 12 months | 1 - 5 years | Over 5 years | ||||||||||||||||
| Interest-earning assets: |
||||||||||||||||||||
| Cash at Federal Reserve and other banks |
$ | 213,415 | — | — | — | — | ||||||||||||||
| Securities |
31,665 | $ | 31,767 | $ | 65,055 | $ | 407,150 | $ | 617,132 | |||||||||||
| Loans |
573,361 | 151,917 | 266,945 | 1,386,695 | 380,675 | |||||||||||||||
|
|
|
|
|
|
|
|
|
|
|
|||||||||||
| Total interest-earning assets |
818,441 | 183,684 | 332,000 | 1,793,845 | 997,807 | |||||||||||||||
|
|
|
|
|
|
|
|
|
|
|
|||||||||||
| Interest-bearing liabilities |
||||||||||||||||||||
| Transaction deposits |
2,284,661 | — | — | — | — | |||||||||||||||
| Time |
157,431 | 64,127 | 57,501 | 56,084 | 11 | |||||||||||||||
| Other borrowings |
17,493 | — | — | — | — | |||||||||||||||
| Junior subordinated debt |
56,667 | — | — | — | — | |||||||||||||||
|
|
|
|
|
|
|
|
|
|
|
|||||||||||
| Total interest-bearing liabilities |
$ | 2,516,252 | $ | 64,127 | $ | 57,501 | $ | 56,084 | 11 | |||||||||||
|
|
|
|
|
|
|
|
|
|
|
|||||||||||
| Interest sensitivity gap |
$ | (1,697,811 | ) | $ | 119,557 | $ | 274,499 | $ | 1,737,761 | $ | 997,796 | |||||||||
| Cumulative sensitivity gap |
$ | (1,697,811 | ) | $ | (1,578,254 | ) | $ | (1,303,755 | ) | $ | 434,006 | $ | 1,431,802 | |||||||
| As a percentage of earning assets: |
||||||||||||||||||||
| Interest sensitivity gap |
(41.2 | %) | 2.9 | % | 6.7 | % | 42.1 | % | 24.2 | % | ||||||||||
| Cumulative sensitivity gap |
(41.2 | %) | (38.3 | %) | (31.6 | %) | 10.5 | % | 34.7 | % | ||||||||||
Liquidity
Liquidity refers to the Company’s ability to provide funds at an acceptable cost to meet loan demand and deposit withdrawals, as well as contingency plans to meet unanticipated funding needs or loss of funding sources. These objectives can be met from either the asset or liability side of the balance sheet. Asset liquidity sources consist of the repayments and maturities of loans, selling of loans, short-term money market investments, maturities of securities and sales of securities from the available-for-sale portfolio. These activities are generally summarized as investing activities in the Consolidated Statement of Cash Flows. Net cash used by investing activities totaled $139,391,000 in 2016. Net increases in investment and loan balances used $54,367,000 and $236,102,000 of cash, respectively.
Liquidity may also be generated from liabilities through deposit growth and borrowings. These activities are included under financing activities in the Consolidated Statement of Cash Flows. In 2016, financing activities provide funds totaling $93,316,000 due to a $103,063,000 increase in deposit balances. Dividends paid used $13,695,000 of cash during 2016. The Bank also had available correspondent banking lines of credit totaling $20,000,000 at December 31, 2016. In addition, at December 31, 2016 the Company had loans and securities available to pledge towards future borrowings from the Federal Home Loan Bank and the Federal Reserve Bank of up to $1,304,136,000 and $133,655,000, respectively. As of December 31, 2016, the Company had $17,493,000 of other borrowings as described in Note 16 of the consolidated financial statements of the Company and the related notes at Item 8 of this report. While these sources are expected to continue to provide significant amounts of funds in the future, their mix, as well as the possible use of other sources, will depend on future economic and market conditions. Liquidity is also provided or used through the results of operating activities. In 2016, operating activities provided cash of $48,226,000.
The Company’s investment securities available for sale plus cash and cash equivalents in excess of reserve requirements totaled $777,662,000 at December 31, 2016, which was 17.2% of total assets at that time. This was an increase of $139,976,000 from $637,686,000 and an increase from 15.1% of total assets as of December 31, 2015.
49
Table of Contents
Loan demand during 2017 will be dictated by economic and competitive conditions. The Company aggressively solicits non-interest bearing demand deposits and money market checking deposits, which are the least sensitive to interest rates. The growth of deposit balances is subject to heightened competition, the success of the Company’s sales efforts, delivery of superior customer service and market conditions. The reduction in the federal funds rate and various Federal Reserve interest rate manipulation efforts have resulted in historic low short-term and long-term interest rates, which could impact deposit volumes in the future. Depending on economic conditions, interest rate levels, and a variety of other conditions, deposit growth may be used to fund loans, to reduce short-term borrowings or purchase investment securities. However, due to concerns such as uncertainty in the general economic environment, competition and political uncertainty, loan demand and levels of customer deposits are not certain.
The principal cash requirements of the Company are dividends on common stock when declared. The Company is dependent upon the payment of cash dividends by the Bank to service its commitments. Shareholder dividends are expected to continue subject to the Board’s discretion and continuing evaluation of capital levels, earnings, asset quality and other factors. The Company expects that the cash dividends paid by the Bank to the Company will be sufficient to meet this payment schedule. Dividends from the Bank are subject to certain regulatory restrictions.
The maturity distribution of certificates of deposit in denominations of $100,000 or more is set forth in the following table. These deposits are generally more rate sensitive than other deposits and, therefore, are more likely to be withdrawn to obtain higher yields elsewhere if available. The Bank participates in a program wherein the State of California places time deposits with the Bank at the Bank’s option. At December 31, 2016, 2015 and 2014, the Bank had $50,000,000, $50,000,000 and $5,000,000, respectively, of these State deposits.
Certificates of Deposit in Denominations of $100,000 or More
| Amounts as of December 31, | ||||||||||||
| (dollars in thousands) | 2016 | 2015 | 2014 | |||||||||
| Time remaining until maturity: |
||||||||||||
| Less than 3 months |
$ | 116,791 | $ | 104,368 | $ | 66,199 | ||||||
| 3 months to 6 months |
31,984 | 31,327 | 36,166 | |||||||||
| 6 months to 12 months |
23,525 | 34,722 | 41,787 | |||||||||
| More than 12 months |
26,850 | 26,747 | 36,488 | |||||||||
|
|
|
|
|
|
|
|||||||
| Total |
$ | 199,150 | $ | 197,164 | $ | 180,640 | ||||||
|
|
|
|
|
|
|
|||||||
Loan demand also affects the Company’s liquidity position. The following table presents the maturities of loans, net of deferred loan costs, at December 31, 2016:
| Within One Year |
After One But Within 5 Years |
After 5 Years | Total | |||||||||||||
| (dollars in thousands) | ||||||||||||||||
| Loans with predetermined interest rates: |
||||||||||||||||
| Real estate mortgage |
$ | 28,824 | $ | 81,996 | $ | 647,112 | $ | 757,932 | ||||||||
| Consumer |
2,914 | 37,192 | 92,095 | 132,201 | ||||||||||||
| Commercial |
7,806 | 82,812 | 14,583 | 105,201 | ||||||||||||
| Real estate construction |
7,560 | 2,363 | 13,664 | 23,587 | ||||||||||||
|
|
|
|
|
|
|
|
|
|||||||||
| 47,104 | 204,363 | 767,454 | 1,018,921 | |||||||||||||
|
|
|
|
|
|
|
|
|
|||||||||
| Loans with floating interest rates: |
||||||||||||||||
| Real estate mortgage |
29,366 | 125,684 | 1,144,842 | 1,299,892 | ||||||||||||
| Consumer |
3,956 | 1,812 | 224,334 | 230,102 | ||||||||||||
| Commercial |
65,974 | 15,114 | 30,758 | 111,846 | ||||||||||||
| Real estate construction |
15,138 | 8,123 | 75,571 | 98,832 | ||||||||||||
|
|
|
|
|
|
|
|
|
|||||||||
| 114,434 | 150,733 | 1,475,505 | 1,740,672 | |||||||||||||
|
|
|
|
|
|
|
|
|
|||||||||
| Total loans |
$ | 161,538 | $ | 355,096 | $ | 2,242,959 | $ | 2,759,593 | ||||||||
|
|
|
|
|
|
|
|
|
|||||||||
50
Table of Contents
The maturity distribution and yields of the investment portfolio at December 31, 2016 is presented in the following table. The timing of the maturities indicated in the table below is based on final contractual maturities. Most mortgage-backed securities return principal throughout their contractual lives. As such, the weighted average life of mortgage-backed securities based on outstanding principal balance is usually significantly shorter than the final contractual maturity indicated below. Yields on tax exempt securities are shown on a tax equivalent basis.
| Within One Year |
After One Year but Through Five Years |
After Five Years but Through Ten Years |
After Ten Years | Total | ||||||||||||||||||||||||||||||||||||
| Amount Yield | Amount Yield | Amount Yield | Amount Yield | Amount Yield | ||||||||||||||||||||||||||||||||||||
| (dollars in thousands) | ||||||||||||||||||||||||||||||||||||||||
| Securities Available for Sale |
||||||||||||||||||||||||||||||||||||||||
| Obligations of US government corporations and agencies |
$ | 1 | 5.97 | % | $ | 9,650 | 2.60 | % | $ | 13,266 | 3.70 | % | $ | 406,761 | 2.54 | % | $ | 429,678 | 2.58 | % | ||||||||||||||||||||
| Obligations of states and political subdivisions |
— | — | — | — | 1,866 | 5.75 | % | 115,751 | 4.96 | % | 117,617 | 4.97 | % | |||||||||||||||||||||||||||
| Marketable equity securities |
— | — | — | — | — | — | 2,938 | — | 2,938 | — | ||||||||||||||||||||||||||||||
|
|
|
|
|
|
|
|
|
|
|
|
|
|
|
|
|
|
|
|
|
|||||||||||||||||||||
| Total securities available for sale |
$ | 1 | 2.97 | % | $ | 9,650 | 2.60 | % | $ | 15,132 | 3.96 | % | $ | 525,450 | 3.07 | % | $ | 550,233 | 3.08 | % | ||||||||||||||||||||
|
|
|
|
|
|
|
|
|
|
|
|
|
|
|
|
|
|
|
|
|
|||||||||||||||||||||
| Within One Year |
After One Year but Through Five Years |
After Five Years but Through Ten Years |
After Ten Years | Total | ||||||||||||||||||||||||||||||||||||
| Amount Yield | Amount Yield | Amount Yield | Amount Yield | Amount Yield | ||||||||||||||||||||||||||||||||||||
| (dollars in thousands) | ||||||||||||||||||||||||||||||||||||||||
| Securities Held to Maturity |
||||||||||||||||||||||||||||||||||||||||
| Obligations of US government corporations and agencies |
— | — | — | — | $ | 3,916 | 2.11 | % | $ | 584,066 | 2.70 | % | $ | 587,982 | 2.68 | % | ||||||||||||||||||||||||
| Obligations of states and political subdivisions |
— | — | $ | 1,177 | 4.13 | % | $ | 860 | 5.80 | % | 12,517 | 4.14 | % | 14,554 | 4.24 | % | ||||||||||||||||||||||||
|
|
|
|
|
|
|
|
|
|
|
|
|
|
|
|
|
|
|
|
|
|||||||||||||||||||||
| Total securities held to maturity |
— | — | $ | 1,177 | 4.13 | % | $ | 4,776 | 2.77 | % | $ | 596,583 | 2.73 | % | $ | 602,536 | 2.72 | % | ||||||||||||||||||||||
|
|
|
|
|
|
|
|
|
|
|
|
|
|
|
|
|
|
|
|
|
|||||||||||||||||||||
Off-Balance Sheet Items
The Bank has certain ongoing commitments under operating and capital leases. See Note 18 of the financial statements at Item 8 of this report for the terms. These commitments do not significantly impact operating results. As of December 31, 2015 commitments to extend credit and commitments related to the Bank’s deposit overdraft privilege product were the Bank’s only financial instruments with off-balance sheet risk. The Bank has not entered into any material contracts for financial derivative instruments such as futures, swaps, options, etc. Commitments to extend credit were $780,037,000, and $713,646,000 at December 31, 2016 and 2015, respectively, and represent 28.3% of the total loans outstanding at year-end 2016 versus 28.4% at December 31, 2015. Commitments related to the Bank’s deposit overdraft privilege product totaled $98,583,000 and $94,473,000 at December 31, 2016 and 2015, respectively.
51
Table of Contents
Certain Contractual Obligations
The following chart summarizes certain contractual obligations of the Company as of December 31, 2016:
| (dollars in thousands) | Total | Less than one year |
1-3 years | 3-5 years | More than 5 years |
|||||||||||||||
| Time deposits |
$ | 335,154 | $ | 279,015 | $ | 35,374 | $ | 20,746 | $ | 19 | ||||||||||
| Other collateralized borrowings, fixed rate of 0.05% payable on January 2, 2017 |
17,493 | 17,493 | — | — | — | |||||||||||||||
| Junior subordinated: |
||||||||||||||||||||
| TriCo Trust I(1) |
20,619 | — | — | — | 20,619 | |||||||||||||||
| TriCo Trust II(2) |
20,619 | — | — | — | 20,619 | |||||||||||||||
| North Valley Trust II(3) |
6,186 | — | — | — | 6,186 | |||||||||||||||
| North Valley Trust III(4) |
5,155 | — | — | — | 5,155 | |||||||||||||||
| North Valley Trust IV(5) |
10,310 | — | — | — | 10,310 | |||||||||||||||
| Operating lease obligations |
11,751 | 3,320 | 4,447 | 2,288 | 1,696 | |||||||||||||||
| Deferred compensation(6) |
4,694 | 835 | 1,624 | 1,325 | 910 | |||||||||||||||
| Supplemental retirement plans(6) |
7,359 | 1,067 | 1,777 | 1,304 | 3,211 | |||||||||||||||
|
|
|
|
|
|
|
|
|
|
|
|||||||||||
| Total contractual obligations |
$ | 439,340 | $ | 301,730 | $ | 43,222 | $ | 25,663 | $ | 68,725 | ||||||||||
|
|
|
|
|
|
|
|
|
|
|
|||||||||||
| (1) | Junior subordinated debt, adjustable rate of three-month LIBOR plus 3.05%, callable in whole or in part by the Company on a quarterly basis beginning October 7, 2008, matures October 7, 2033. |
| (2) | Junior subordinated debt, adjustable rate of three-month LIBOR plus 2.55%, callable in whole or in part by the Company on a quarterly basis beginning July 23, 2009, matures July 23, 2034. |
| (3) | Junior subordinated debt, adjustable rate of three-month LIBOR plus 3.25%, callable in whole or in part by the Company on a quarterly basis beginning April 24, 2008, matures April 24, 2033. |
| (4) | Junior subordinated debt, adjustable rate of three-month LIBOR plus 2.80%, callable in whole or in part by the Company on a quarterly basis beginning July 23, 2009, matures July 23, 2034. |
| (5) | Junior subordinated debt, adjustable rate of three-month LIBOR plus 1.33%, callable in whole or in part by the Company on a quarterly basis beginning March 15, 2011, matures March 15, 2036. |
| (6) | These amounts represent known certain payments to participants under the Company’s deferred compensation and supplemental retirement plans. See Note 25 in the financial statements at Item 8 of this report for additional information related to the Company’s deferred compensation and supplemental retirement plan liabilities. |
ITEM 7A. QUANTITATIVE AND QUALITATIVE DISCLOSURES ABOUT MARKET RISK
See “Market Risk Management” under Item 7 of this report which is incorporated herein.
ITEM 8. FINANCIAL STATEMENTS AND SUPPLEMENTARY DATA
52
Table of Contents
TRICO BANCSHARES
| At December 31, | ||||||||
| 2016 | 2015 | |||||||
| (in thousands, except share data) | ||||||||
| Assets: |
||||||||
| Cash and due from banks |
$ | 92,197 | $ | 94,305 | ||||
| Cash at Federal Reserve and other banks |
213,415 | 209,156 | ||||||
|
|
|
|
|
|||||
| Cash and cash equivalents |
305,612 | 303,461 | ||||||
| Investment securities: |
||||||||
| Available for sale |
550,233 | 404,885 | ||||||
| Held to maturity |
602,536 | 726,530 | ||||||
| Restricted equity securities |
16,956 | 16,956 | ||||||
| Loans held for sale |
2,998 | 1,873 | ||||||
| Loans |
2,759,593 | 2,522,937 | ||||||
| Allowance for loan losses |
(32,503 | ) | (36,011 | ) | ||||
|
|
|
|
|
|||||
| Total loans, net |
2,727,090 | 2,486,926 | ||||||
| Foreclosed assets, net |
3,986 | 5,369 | ||||||
| Premises and equipment, net |
48,406 | 43,811 | ||||||
| Cash value of life insurance |
95,912 | 94,560 | ||||||
| Accrued interest receivable |
12,027 | 10,786 | ||||||
| Goodwill |
64,311 | 63,462 | ||||||
| Other intangible assets, net |
6,563 | 5,894 | ||||||
| Mortgage servicing rights |
6,595 | 7,618 | ||||||
| Other assets |
74,743 | 48,591 | ||||||
|
|
|
|
|
|||||
| Total assets |
$ | 4,517,968 | $ | 4,220,722 | ||||
|
|
|
|
|
|||||
| Liabilities and Shareholders’ Equity: |
||||||||
| Liabilities: |
||||||||
| Deposits: |
||||||||
| Noninterest-bearing demand |
$ | 1,275,745 | $ | 1,155,695 | ||||
| Interest-bearing |
2,619,815 | 2,475,571 | ||||||
|
|
|
|
|
|||||
| Total deposits |
3,895,560 | 3,631,266 | ||||||
| Accrued interest payable |
818 | 774 | ||||||
| Reserve for unfunded commitments |
2,719 | 2,475 | ||||||
| Other liabilities |
67,364 | 65,293 | ||||||
| Other borrowings |
17,493 | 12,328 | ||||||
| Junior subordinated debt |
56,667 | 56,470 | ||||||
|
|
|
|
|
|||||
| Total liabilities |
4,040,621 | 3,768,606 | ||||||
|
|
|
|
|
|||||
| Commitments and contingencies (Note 18) |
||||||||
| Shareholders’ equity: |
||||||||
| Common stock, no par value: 50,000,000 shares authorized; issued and outstanding: |
||||||||
| 22,867,802 at December 31, 2016 |
252,820 | |||||||
| 22,775,173 at December 31, 2015 |
247,587 | |||||||
| Retained earnings |
232,440 | 206,307 | ||||||
| Accumulated other comprehensive income (loss), net of tax |
(7,913 | ) | (1,778 | ) | ||||
|
|
|
|
|
|||||
| Total shareholders’ equity |
477,347 | 452,116 | ||||||
|
|
|
|
|
|||||
| Total liabilities and shareholders’ equity |
$ | 4,517,968 | $ | 4,220,722 | ||||
|
|
|
|
|
|||||
The accompanying notes are an integral part of these consolidated financial statements.
53
Table of Contents
TRICO BANCSHARES
CONSOLIDATED STATEMENTS OF INCOME
| Years ended December 31, | ||||||||||||
| 2016 | 2015 | 2014 | ||||||||||
| (in thousands, except per share data) | ||||||||||||
| Interest and dividend income: |
||||||||||||
| Loans, including fees |
$ | 141,086 | $ | 131,836 | $ | 103,887 | ||||||
| Debt securities: |
||||||||||||
| Taxable |
25,397 | 25,303 | 14,753 | |||||||||
| Tax exempt |
3,881 | 1,509 | 505 | |||||||||
| Dividends |
2,181 | 2,118 | 837 | |||||||||
| Interest bearing cash at |
||||||||||||
| Federal Reserve and other banks |
1,163 | 648 | 1,133 | |||||||||
|
|
|
|
|
|
|
|||||||
| Total interest and dividend income |
173,708 | 161,414 | 121,115 | |||||||||
|
|
|
|
|
|
|
|||||||
| Interest expense: |
||||||||||||
| Deposits |
3,483 | 3,434 | 3,274 | |||||||||
| Other borrowings |
9 | 4 | 4 | |||||||||
| Junior subordinated debt |
2,229 | 1,978 | 1,403 | |||||||||
|
|
|
|
|
|
|
|||||||
| Total interest expense |
5,721 | 5,416 | 4,681 | |||||||||
|
|
|
|
|
|
|
|||||||
| Net interest income |
167,987 | 155,998 | 116,434 | |||||||||
| Benefit from reversal of previously provided loan losses |
(5,970 | ) | (2,210 | ) | (4,045 | ) | ||||||
|
|
|
|
|
|
|
|||||||
| Net interest income after provision for loan losses |
173,957 | 158,208 | 120,479 | |||||||||
|
|
|
|
|
|
|
|||||||
| Noninterest income: |
||||||||||||
| Service charges and fees |
33,226 | 32,080 | 24,236 | |||||||||
| Gain on sale of loans |
4,037 | 3,064 | 2,032 | |||||||||
| Commissions on sale of non-deposit investment products |
2,329 | 3,349 | 2,995 | |||||||||
| Increase in cash value of life insurance |
2,717 | 2,786 | 1,953 | |||||||||
| Other |
2,254 | 4,068 | 3,300 | |||||||||
|
|
|
|
|
|
|
|||||||
| Total noninterest income |
44,563 | 45,347 | 34,516 | |||||||||
|
|
|
|
|
|
|
|||||||
| Noninterest expense: |
||||||||||||
| Salaries and related benefits |
80,724 | 71,405 | 57,544 | |||||||||
| Other |
65,273 | 59,436 | 52,835 | |||||||||
|
|
|
|
|
|
|
|||||||
| Total noninterest expense |
145,997 | 130,841 | 110,379 | |||||||||
|
|
|
|
|
|
|
|||||||
| Income before income taxes |
72,523 | 72,714 | 44,616 | |||||||||
| Provision for income taxes |
27,712 | 28,896 | 18,508 | |||||||||
|
|
|
|
|
|
|
|||||||
| Net income |
$ | 44,811 | $ | 43,818 | $ | 26,108 | ||||||
|
|
|
|
|
|
|
|||||||
| Earnings per share: |
||||||||||||
| Basic |
$ | 1.96 | $ | 1.93 | $ | 1.47 | ||||||
| Diluted |
$ | 1.94 | $ | 1.91 | $ | 1.46 | ||||||
The accompanying notes are an integral part of these consolidated financial statements.
TRICO BANCSHARES
CONSOLIDATED STATEMENTS OF COMPREHENSIVE INCOME
| Years ended December 31, | ||||||||||||
| 2016 | 2015 | 2014 | ||||||||||
| (in thousands, except per share data) | ||||||||||||
| Net income |
$ | 44,811 | $ | 43,818 | $ | 26,108 | ||||||
| Other comprehensive (loss) income, net of tax: |
||||||||||||
| Unrealized holding losses on securities arising during the period |
(6,384 | ) | (1,098 | ) | (94 | ) | ||||||
| Change in minimum pension liability |
592 | 1,246 | (4,114 | ) | ||||||||
| Change in joint beneficiary agreement liability |
(343 | ) | 277 | 148 | ||||||||
|
|
|
|
|
|
|
|||||||
| Other comprehensive (loss) income |
(6,135 | ) | 425 | (4,060 | ) | |||||||
|
|
|
|
|
|
|
|||||||
| Comprehensive income |
$ | 38,676 | $ | 44,243 | $ | 22,048 | ||||||
|
|
|
|
|
|
|
|||||||
The accompanying notes are an integral part of these unaudited consolidated financial statements.
54
Table of Contents
TRICO BANCSHARES
CONSOLIDATED STATEMENTS OF CHANGES IN SHAREHOLDERS’ EQUITY
Years Ended December 31, 2016, 2015 and 2014
| Shares of Common Stock |
Common Stock |
Retained Earnings |
Accumulated Other Comprehensive Income (Loss) |
Total | ||||||||||||||
| (in thousands, except share data) | ||||||||||||||||||
| Balance at December 31, 2013 |
16,076,662 | $ | 89,356 | $ | 159,733 | $ | 1,857 | $ | 250,946 | |||||||||
| Net income |
26,108 | 26,108 | ||||||||||||||||
| Other comprehensive loss |
(4,060 | ) | (4,060 | ) | ||||||||||||||
| Stock option vesting |
965 | 965 | ||||||||||||||||
| RSU vesting |
126 | 126 | ||||||||||||||||
| PSU vesting |
42 | 42 | ||||||||||||||||
| Stock options exercised |
166,020 | 2,875 | 2,875 | |||||||||||||||
| Tax effect of stock options exercised |
225 | 225 | ||||||||||||||||
| Issuance of common stock |
6,575,550 | 151,303 | 151,303 | |||||||||||||||
| Repurchase of common stock |
(103,268) | (574 | ) | (1,977 | ) | (2,551 | ) | |||||||||||
| Dividends paid ($0.44 per share) |
(7,807 | ) | (7,807 | ) | ||||||||||||||
|
|
|
|
|
|
|
|
|
|
||||||||||
| Balance at December 31, 2014 |
22,714,964 | $ | 244,318 | $ | 176,057 | $ | (2,203 | ) | $ | 418,172 | ||||||||
| Net income |
43,818 | 43,818 | ||||||||||||||||
| Other comprehensive income |
425 | 425 | ||||||||||||||||
| Stock option vesting |
734 | 734 | ||||||||||||||||
| RSU vesting |
457 | 457 | ||||||||||||||||
| PSU vesting |
179 | 179 | ||||||||||||||||
| Stock options exercised |
154,500 | 3,116 | 3,116 | |||||||||||||||
| Tax effect of stock options exercised |
(83 | ) | (83 | ) | ||||||||||||||
| RSUs released |
12,064 | |||||||||||||||||
| Tax benefit from release of RSUs |
15 | 15 | ||||||||||||||||
| Repurchase of common stock |
(106,355) | (1,149 | ) | (1,719 | ) | (2,868 | ) | |||||||||||
| Dividends paid ($0.52 per share) |
(11,849 | ) | (11,849 | ) | ||||||||||||||
|
|
|
|
|
|
|
|
|
|
||||||||||
| Balance at December 31, 2015 |
22,775,173 | $ | 247,587 | $ | 206,307 | $ | (1,778 | ) | $ | 452,116 | ||||||||
| Net income |
44,811 | 44,811 | ||||||||||||||||
| Other comprehensive loss |
(6,135 | ) | (6,135 | ) | ||||||||||||||
| Stock option vesting |
580 | 580 | ||||||||||||||||
| RSU vesting |
616 | 616 | ||||||||||||||||
| PSU vesting |
271 | 271 | ||||||||||||||||
| Stock options exercised |
336,900 | 6,506 | 6,506 | |||||||||||||||
| Tax effect of stock options exercised |
154 | 154 | ||||||||||||||||
| RSUs released |
20,529 | |||||||||||||||||
| Tax benefit from release of RSUs |
1 | 1 | ||||||||||||||||
| Repurchase of common stock |
(264,800) | (2,895 | ) | (4,983 | ) | (7,878 | ) | |||||||||||
| Dividends paid ($0.60 per share) |
(13,695 | ) | (13,695 | ) | ||||||||||||||
|
|
|
|
|
|
|
|
|
|
||||||||||
| Balance at December 31, 2016 |
22,867,802 | $ | 252,820 | $ | 232,440 | $ | (7,913 | ) | $ | 477,347 | ||||||||
|
|
|
|
|
|
|
|
|
|
||||||||||
The accompanying notes are an integral part of these consolidated financial statements.
55
Table of Contents
TRICO BANCSHARES
CONSOLIDATED STATEMENTS OF CASH FLOWS
| Years Ended December 31, | ||||||||||||
| 2016 | 2015 | 2014 | ||||||||||
| Operating activities: | (in thousands) | |||||||||||
| Net income |
$ | 44,811 | $ | 43,818 | $ | 26,108 | ||||||
| Adjustments to reconcile net income to net cash provided by operating activities: |
||||||||||||
| Depreciation of premises and equipment, and amortization |
6,474 | 5,906 | 5,735 | |||||||||
| Amortization of intangible assets |
1,377 | 1,157 | 446 | |||||||||
| (Benefit from) provision for loan losses |
(5,970 | ) | (2,210 | ) | (4,045 | ) | ||||||
| Amortization of investment securities premium, net |
4,926 | 3,458 | 970 | |||||||||
| Originations of loans for resale |
(142,619 | ) | (111,640 | ) | (49,241 | ) | ||||||
| Proceeds from sale of loans originated for resale |
144,062 | 115,469 | 49,394 | |||||||||
| Gain on sale of loans |
(4,037 | ) | (3,064 | ) | (2,032 | ) | ||||||
| Change in market value of mortgage servicing rights |
2,184 | 701 | 1,301 | |||||||||
| Provision for losses on foreclosed assets |
140 | 502 | 208 | |||||||||
| Gain on sale of foreclosed assets |
(262 | ) | (991 | ) | (2,153 | ) | ||||||
| Provision for losses on fixed assets |
782 | — | — | |||||||||
| Loss (gain) on disposal of fixed assets |
147 | 129 | (49 | ) | ||||||||
| Increase in cash value of life insurance |
(2,717 | ) | (2,786 | ) | (1,953 | ) | ||||||
| Gain on life insurance death benefit |
(238 | ) | (155 | ) | — | |||||||
| Equity compensation vesting expense |
1,467 | 1,370 | 1,133 | |||||||||
| Equity compensation tax effect |
(155 | ) | 68 | (225 | ) | |||||||
| Deferred income tax expense (benefit) |
3,190 | 681 | (993 | ) | ||||||||
| Change in: |
||||||||||||
| Reserve for unfunded commitments |
244 | 330 | (395 | ) | ||||||||
| Interest receivable |
(1,241 | ) | (1,511 | ) | (619 | ) | ||||||
| Interest payable |
44 | (204 | ) | (67 | ) | |||||||
| Other assets and liabilities, net |
(4,383 | ) | 3,789 | 3,894 | ||||||||
|
|
|
|
|
|
|
|||||||
| Net cash from operating activities |
48,226 | 54,817 | 27,417 | |||||||||
|
|
|
|
|
|
|
|||||||
| Investing activities: |
||||||||||||
| Proceeds from maturities of securities available for sale |
71,684 | 33,552 | 24,016 | |||||||||
| Proceeds from sale of securities available for sale |
— | 2 | 14,130 | |||||||||
| Purchases of securities available for sale |
(247,717 | ) | (341,303 | ) | — | |||||||
| Proceeds from maturities of securities held to maturity |
121,666 | 93,784 | 34,172 | |||||||||
| Purchases of securities held to maturity |
— | (146,100 | ) | (280,692 | ) | |||||||
| (Purchase) redemption of restricted equity securities, net |
— | — | (2,415 | ) | ||||||||
| Loan origination and principal collections, net |
(251,479 | ) | (244,018 | ) | (82,079 | ) | ||||||
| Loans purchased |
(22,503 | ) | — | (32,017 | ) | |||||||
| Proceeds from sale of loans other than loans originated for resale |
37,880 | — | — | |||||||||
| Proceeds from sale of premises and equipment |
1,682 | 8 | 121 | |||||||||
| Improvement of foreclosed assets |
— | (195 | ) | (462 | ) | |||||||
| Proceeds from sale of other real estate owned |
4,010 | 5,449 | 9,762 | |||||||||
| Purchases of premises and equipment |
(10,930 | ) | (5,489 | ) | (4,665 | ) | ||||||
| Cash received from acquisition, net |
156,316 | — | 141,405 | |||||||||
|
|
|
|
|
|
|
|||||||
| Net cash used by investing activities |
(139,391 | ) | (604,310 | ) | (178,724 | ) | ||||||
|
|
|
|
|
|
|
|||||||
| Financing activities: |
||||||||||||
| Net increase in deposits |
103,063 | 250,843 | 167,984 | |||||||||
| Net change in other borrowings |
5,165 | 3,052 | 2,941 | |||||||||
| Equity compensation tax effect |
155 | (68 | ) | 225 | ||||||||
| Repurchase of common stock |
(1,890 | ) | (412 | ) | (292 | ) | ||||||
| Dividends paid |
(13,695 | ) | (11,849 | ) | (7,807 | ) | ||||||
| Exercise of stock options |
518 | 660 | 616 | |||||||||
|
|
|
|
|
|
|
|||||||
| Net cash from financing activities |
93,316 | 242,226 | 163,667 | |||||||||
|
|
|
|
|
|
|
|||||||
| Net change in cash and cash equivalents |
2,151 | (307,267 | ) | 12,360 | ||||||||
|
|
|
|
|
|
|
|||||||
| Cash and cash equivalents and beginning of year |
303,461 | 610,728 | 598,368 | |||||||||
|
|
|
|
|
|
|
|||||||
| Cash and cash equivalents at end of year |
$ | 305,612 | $ | 303,461 | $ | 610,728 | ||||||
|
|
|
|
|
|
|
|||||||
| Supplemental disclosure of noncash activities: |
||||||||||||
| Unrealized loss on securities available for sale |
$ | (11,015 | ) | $ | (1,895 | ) | $ | (162 | ) | |||
| Loans transferred to foreclosed assets |
2,505 | 5,240 | 5,291 | |||||||||
| Due to broker |
— | 17,072 | — | |||||||||
| Market value of shares tendered in-lieu of cash to pay for exercise of options and/or related taxes |
5,988 | 2,868 | 2,551 | |||||||||
| Supplemental disclosure of cash flow activity: |
||||||||||||
| Cash paid for interest expense |
5,677 | 5,620 | 4,641 | |||||||||
| Cash paid for income taxes |
27,575 | 24,315 | 22,685 | |||||||||
| Assets acquired in acquisition |
161,231 | — | 978,682 | |||||||||
| Liabilities assumed in acquisition |
161,231 | — | 827,372 | |||||||||
The accompanying notes are an integral part of these consolidated financial statements.
56
Table of Contents
TRICO BANCSHARES
NOTES TO CONSOLIDATED FINANCIAL STATEMENTS
Years Ended December 31, 2016, 2015 and 2014
Note 1 – Summary of Significant Accounting Policies
Description of Business and Basis of Presentation
TriCo Bancshares (the “Company” or “we”) is a California corporation organized to act as a bank holding company for Tri Counties Bank (the “Bank”). The Company and the Bank are headquartered in Chico, California. The Bank is a California-chartered bank that is engaged in the general commercial banking business in 26 California counties. Tri Counties Bank currently operates from 58 traditional branches and 10 in-store branches. The Company has five capital subsidiary business trusts (collectively, the “Capital Trusts”) that issued trust preferred securities, including two organized by TriCo and three acquired with the acquisition of North Valley Bancorp. See Note 17 – Junior Subordinated Debt.
The consolidated financial statements are prepared in accordance with accounting policies generally accepted in the United States of America and general practices in the banking industry. The financial statements include the accounts of the Company. All inter-company accounts and transactions have been eliminated in consolidation. For financial reporting purposes, the Company’s investments in the Capital Trusts of $1,702,000 are accounted for under the equity method and, accordingly, are not consolidated and are included in other assets on the consolidated balance sheet. The subordinated debentures issued and guaranteed by the Company and held by the Capital Trusts are reflected as debt on the Company’s consolidated balance sheet.
Use of Estimates in the Preparation of Financial Statements
The preparation of financial statements in conformity with accounting principles generally accepted in the United States of America requires Management to make estimates and assumptions that affect the reported amounts of assets and liabilities and disclosure of contingent assets and liabilities at the date of the financial statements and the reported amounts of revenues and expenses during the reporting period. The Company bases its estimates on historical experience and on various other assumptions that are believed to be reasonable under the circumstances, the results of which form the basis for making judgments about the carrying values of assets and liabilities that are not readily apparent from other sources. Actual results may differ from these estimates under different assumptions or conditions.
Significant Group Concentration of Credit Risk
The Company grants agribusiness, commercial, consumer, and residential loans to customers located throughout the northern San Joaquin Valley, the Sacramento Valley and northern mountain regions of California. The Company has a diversified loan portfolio within the business segments located in this geographical area. The Company currently classifies all its operation into one business segment that it denotes as community banking.
Cash and Cash Equivalents
For purposes of the consolidated statements of cash flows, cash and cash equivalents include cash on hand, amounts due from banks, and federal funds sold. Net cash flows are reported for loan and deposit transactions and other borrowings.
Investment Securities
The Company classifies its debt and marketable equity securities into one of three categories: trading, available for sale or held to maturity. Trading securities are bought and held principally for the purpose of selling in the near term. Held to maturity securities are those securities which the Company has the ability and intent to hold until maturity. These securities are carried at cost adjusted for amortization of premium and accretion of discount, computed by the effective interest method over their contractual lives. All other securities not included in trading or held to maturity are classified as available for sale. Available for sale securities are recorded at fair value. Unrealized gains and losses, net of the related tax effect, on available for sale securities are reported as a separate component of other accumulated comprehensive income in shareholders’ equity until realized. Premiums and discounts are amortized or accreted over the life of the related investment security as an adjustment to yield using the effective interest method. Dividend and interest income are recognized when earned. Realized gains and losses are derived from the amortized cost of the security sold. During the year ended December 31, 2016 and throughout 2015, the Company did not have any securities classified as trading.
The Company assesses other-than-temporary impairment (“OTTI”) based on whether it intends to sell a security or if it is likely that the Company would be required to sell the security before recovery of the amortized cost basis of the investment, which may be maturity. For debt securities, if we intend to sell the security or it is more likely than not that we will be required to sell the security before recovering its cost basis, the entire impairment loss would be recognized in earnings as an OTTI. If we do not intend to sell the security and it is not likely that we will be required to sell the security but we do not expect to recover the entire amortized cost basis of the security, only the portion of the impairment loss representing credit losses would be recognized in earnings. The credit loss on a security is measured as the difference between the amortized cost basis and the present value of the cash flows expected to be collected. Projected cash flows are discounted by the original or current effective interest rate depending on the nature of the security being measured for potential OTTI. The remaining impairment related to all other factors, the difference between the present value of the cash flows expected to be collected and fair value, is recognized as a charge to other comprehensive income (“OCI”). Impairment losses related to all other factors are presented as separate categories within OCI. The accretion of the amount recorded in OCI increases the carrying value of the investment and does not affect earnings. If there is an indication of additional credit losses the security is re-evaluated according to the procedures described above. No OTTI losses were recognized during 2016 and 2015.
57
Table of Contents
Restricted Equity Securities
Restricted equity securities represent the Company’s investment in the stock of the Federal Home Loan Bank of San Francisco (“FHLB”) and are carried at par value, which reasonably approximates its fair value. While technically these are considered equity securities, there is no market for the FHLB stock. Therefore, the shares are considered as restricted investment securities. Management periodically evaluates FHLB stock for other-than-temporary impairment. Management’s determination of whether these investments are impaired is based on its assessment of the ultimate recoverability of cost rather than by recognizing temporary declines in value. The determination of whether a decline affects the ultimate recoverability of cost is influenced by criteria such as (1) the significance of any decline in net assets of the FHLB as compared to the capital stock amount for the FHLB and the length of time this situation has persisted, (2) commitments by the FHLB to make payments required by law or regulation and the level of such payments in relation to the operating performance of the FHLB, (3) the impact of legislative and regulatory changes on institutions and, accordingly, the customer base of the FHLB, and (4) the liquidity position of the FHLB.
As a member of the FHLB system, the Bank is required to maintain a minimum level of investment in FHLB stock based on specific percentages of its outstanding mortgages, total assets, or FHLB advances. The Bank may request redemption at par value of any stock in excess of the minimum required investment. Stock redemptions are at the discretion of the FHLB.
Loans Held for Sale
Loans originated and intended for sale in the secondary market are carried at the lower of aggregate cost or fair value, as determined by aggregate outstanding commitments from investors of current investor yield requirements. Net unrealized losses are recognized through a valuation allowance by charges to noninterest income.
Mortgage loans held for sale are generally sold with the mortgage servicing rights retained by the Company. Gains or losses on the sale of loans that are held for sale are recognized at the time of the sale and determined by the difference between net sale proceeds and the net book value of the loans less the estimated fair value of any retained mortgage servicing rights.
Loans and Allowance for Loan Losses
Loans originated by the Company, i.e., not purchased or acquired in a business combination, are referred to as originated loans. Originated loans that management has the intent and ability to hold for the foreseeable future or until maturity or payoff are reported at the principal amount outstanding, net of deferred loan fees and costs. Loan origination and commitment fees and certain direct loan origination costs are deferred, and the net amount is amortized as an adjustment of the related loan’s yield over the actual life of the loan. Originated loans on which the accrual of interest has been discontinued are designated as nonaccrual loans.
Originated loans are placed in nonaccrual status when reasonable doubt exists as to the full, timely collection of interest or principal, or a loan becomes contractually past due by 90 days or more with respect to interest or principal and is not well secured and in the process of collection. When an originated loan is placed on nonaccrual status, all interest previously accrued but not collected is reversed. Income on such loans is then recognized only to the extent that cash is received and where the future collection of principal is probable. Interest accruals are resumed on such loans only when they are brought fully current with respect to interest and principal and when, in the judgment of Management, the loan is estimated to be fully collectible as to both principal and interest.
An allowance for loan losses for originated loans is established through a provision for loan losses charged to expense. The allowance is maintained at a level which, in Management’s judgment, is adequate to absorb probable incurred credit losses inherent in the loan portfolio as of the balance sheet date. Originated loans and deposit related overdrafts are charged against the allowance for loan losses when Management believes that the collectability of the principal is unlikely or, with respect to consumer installment loans, according to an established delinquency schedule. The allowance is an amount that Management believes will be adequate to absorb probable incurred losses inherent in existing loans, based on evaluations of the collectability, impairment and prior loss experience of loans. The evaluations take into consideration such factors as changes in the nature and size of the portfolio, overall portfolio quality, loan concentrations, specific problem loans, and current economic conditions that may affect the borrower’s ability to pay. The Company defines an originated loan as impaired when it is probable the Company will be unable to collect all amounts due according to the contractual terms of the loan agreement. Impaired originated loans are measured based on the present value of expected future cash flows discounted at the loan’s original effective interest rate. As a practical expedient, impairment may be measured based on the loan’s observable market price or the fair value of the collateral if the loan is collateral dependent. When the measure of the impaired loan is less than the recorded investment in the loan, the impairment is recorded through a valuation allowance.
In situations related to originated loans where, for economic or legal reasons related to a borrower’s financial difficulties, the Company grants a concession for other than an insignificant period of time to the borrower that the Company would not otherwise consider, the related loan is classified as a troubled debt restructuring (TDR). The Company strives to identify borrowers in financial difficulty early and work with them to modify to more affordable terms before their loan reaches nonaccrual status. These modified terms may include rate reductions, principal forgiveness, payment forbearance and other actions intended to minimize the economic loss and to avoid foreclosure or repossession of the collateral. In cases where the Company grants the borrower new terms that result in the loan being classified as a TDR, the Company measures any impairment on the restructuring as noted above for impaired loans. TDR loans are classified as impaired until they are fully paid off or charged off. Loans that are in nonaccrual status at the time they become TDR loans, remain in nonaccrual status until the borrower demonstrates a sustained period of performance which the Company generally believes to be six consecutive months of payments, or equivalent. Otherwise, TDR loans are subject to the same nonaccrual and charge-off policies as noted above with respect to their restructured principal balance.
58
Table of Contents
Credit risk is inherent in the business of lending. As a result, the Company maintains an allowance for loan losses to absorb probable incurred losses inherent in the Company’s originated loan portfolio. This is maintained through periodic charges to earnings. These charges are included in the Consolidated Statements of Income as provision for loan losses. All specifically identifiable and quantifiable losses are immediately charged off against the allowance. However, for a variety of reasons, not all losses are immediately known to the Company and, of those that are known, the full extent of the loss may not be quantifiable at that point in time. The balance of the Company’s allowance for originated loan losses is meant to be an estimate of these probable incurred losses inherent in the portfolio.
The Company formally assesses the adequacy of the allowance for originated loan losses on a quarterly basis. Determination of the adequacy is based on ongoing assessments of the probable risk in the outstanding originated loan portfolio, and to a lesser extent the Company’s originated loan commitments. These assessments include the periodic re-grading of credits based on changes in their individual credit characteristics including delinquency, seasoning, recent financial performance of the borrower, economic factors, changes in the interest rate environment, growth of the portfolio as a whole or by segment, and other factors as warranted. Loans are initially graded when originated. They are re-graded as they are renewed, when there is a new loan to the same borrower, when identified facts demonstrate heightened risk of nonpayment, or if they become delinquent. Re-grading of larger problem loans occurs at least quarterly. Confirmation of the quality of the grading process is obtained by independent credit reviews conducted by consultants specifically hired for this purpose and by various bank regulatory agencies.
The Company’s method for assessing the appropriateness of the allowance for originated loan losses includes specific allowances for impaired originated loans, formula allowance factors for pools of credits, and allowances for changing environmental factors (e.g., interest rates, growth, economic conditions, etc.). Allowance factors for loan pools were based on historical loss experience by product type and prior risk rating.
During the three months ended September 30, 2015, the Company modified its methodology used to determine the allowance for home equity lines of credit that are about to exit their revolving period, or have recently entered into their amortization period and are now classified as home equity loans. This change in methodology increased the required allowance for such lines and loans by $859,000, and $459,000, respectively, and represents the increase in estimated incurred losses in these lines and loans as of September 30, 2015 due to higher required contractual principal and interest payments of such lines and loans.
Loans purchased or acquired in a business combination are referred to as acquired loans. Acquired loans are valued as of the acquisition date in accordance with Financial Accounting Standards Board Accounting Standards Codification (“FASB ASC”) Topic 805, Business Combinations. Loans acquired with evidence of credit deterioration since origination for which it is probable that all contractually required payments will not be collected are referred to as purchased credit impaired (PCI) loans. PCI loans are accounted for under FASB ASC Topic 310-30, Loans and Debt Securities Acquired with Deteriorated Credit Quality. Under FASB ASC Topic 805 and FASB ASC Topic 310-30, PCI loans are recorded at fair value at acquisition date, factoring in credit losses expected to be incurred over the life of the loan. Accordingly, an allowance for loan losses is not carried over or recorded as of the acquisition date. Fair value is defined as the present value of the future estimated principal and interest payments of the loan, with the discount rate used in the present value calculation representing the estimated effective yield of the loan. Default rates, loss severity, and prepayment speed assumptions are periodically reassessed and our estimate of future payments is adjusted accordingly. The difference between contractual future payments and estimated future payments is referred to as the nonaccretable difference. The difference between estimated future payments and the present value of the estimated future payments is referred to as the accretable yield. The accretable yield represents the amount that is expected to be recorded as interest income over the remaining life of the loan. If after acquisition, the Company determines that the estimated future cash flows of a PCI loan are expected to be more than originally estimated, an increase in the discount rate (effective yield) would be made such that the newly increased accretable yield would be recognized, on a level yield basis, over the remaining estimated life of the loan. If, thereafter, the Company determines that the estimated future cash flows of a PCI loan are expected to be less than previously estimated, an allowance for loan loss would be established through a provision for loan losses charged to expense to decrease the present value to the required level. If the estimated cash flows improve after an allowance has been established for a loan, the allowance may be partially or fully reversed depending on the improvement in the estimated cash flows. Only after the allowance has been fully reversed may the discount rate be increased. PCI loans are put on nonaccrual status when cash flows cannot be reasonably estimated. PCI loans on nonaccrual status are accounted for using the cost recovery method or cash basis method of income recognition. The Company refers to PCI loans on nonaccrual status that are accounted for using the cash basis method of income recognition as “PCI – cash basis” loans; and the Company refers to all other PCI loans as “PCI – other” loans PCI loans are charged off when evidence suggests cash flows are not recoverable. Foreclosed assets from PCI loans are recorded in foreclosed assets at fair value with the fair value at time of foreclosure representing cash flow from the loan. ASC 310-30 allows PCI loans with similar risk characteristics and acquisition time frame to be “pooled” and have their cash flows aggregated as if they were one loan. The Company elected to use the “pooled” method of ASC 310-30 for PCI – other loans in the acquisition of certain assets and liabilities of Granite Community Bank, N.A. (“Granite”) during 2010 and Citizens Bank of Northern California (“Citizens”) during 2011.
Acquired loans that are not PCI loans are referred to as purchased not credit impaired (PNCI) loans. PNCI loans are accounted for under FASB ASC Topic 310-20, Receivables – Nonrefundable Fees and Other Costs, in which interest income is accrued on a level-yield basis for performing loans. For income recognition purposes, this method assumes that all contractual cash flows will be collected, and no allowance for loan losses is established at the time of acquisition. Post-acquisition date, an allowance for loan losses may need to be established for acquired loans through a provision charged to earnings for credit losses incurred subsequent to acquisition. Under ASC 310-20, the loss would be measured based on the probable shortfall in relation to the contractual note requirements, consistent with our allowance for loan loss policy for similar loans.
Throughout these financial statements, and in particular in Note 4 and Note 5, when we refer to “Loans” or “Allowance for loan losses” we mean all categories of loans, including Originated, PNCI, PCI – cash basis, and PCI—other. When we are not referring to all categories of loans, we will indicate which we are referring to – Originated, PNCI, PCI – cash basis, or PCI—other.
59
Table of Contents
When referring to PNCI and PCI loans we use the terms “nonaccretable difference”, “accretable yield”, or “purchase discount”. Nonaccretable difference is the difference between undiscounted contractual cash flows due and undiscounted cash flows we expect to collect, or put another way, it is the undiscounted contractual cash flows we do not expect to collect. Accretable yield is the difference between undiscounted cash flows we expect to collect and the value at which we have recorded the loan on our financial statements. On the date of acquisition, all purchased loans are recorded on our consolidated financial statements at estimated fair value. Purchase discount is the difference between the estimated fair value of loans on the date of acquisition and the principal amount owed by the borrower, net of charge offs, on the date of acquisition. We may also refer to “discounts to principal balance of loans owed, net of charge-offs”. Discounts to principal balance of loans owed, net of charge-offs is the difference between principal balance of loans owed, net of charge-offs, and loans as recorded on our financial statements. Discounts to principal balance of loans owed, net of charge-offs arise from purchase discounts, and equal the purchase discount on the acquisition date.
Loans are also categorized as “covered” or “noncovered”. Covered loans refer to loans covered by a Federal Deposit Insurance Corporation (“FDIC”) loss sharing agreement. Noncovered loans refer to loans not covered by a FDIC loss sharing agreement.
Foreclosed Assets
Foreclosed assets include assets acquired through, or in lieu of, loan foreclosure. Foreclosed assets are held for sale and are initially recorded at fair value less estimated costs to sell at the date of foreclosure, establishing a new cost basis. Physical possession of residential real estate property collateralizing a consumer mortgage loan occurs when legal title is obtained upon completion of foreclosure or when the borrower conveys all interest in the property to satisfy the loan through completion of a deed in lieu of foreclosure or through a similar legal agreement. Any write-downs based on the asset’s fair value less costs to sell at the date of acquisition are charged to the allowance for loan and lease losses. Any recoveries based on the asset’s fair value less estimated costs to sell in excess of the recorded value of the loan at the date of acquisition are recorded to the allowance for loan and lease losses. These assets are subsequently accounted for at lower of cost or fair value less estimated costs to sell. If fair value declines subsequent to foreclosure, a valuation allowance is recorded through expense. Operating costs after acquisition are expensed. Revenue and expenses from operations and changes in the valuation allowance are included in other noninterest expense. Gain or loss on sale of foreclosed assets is included in noninterest income. Foreclosed assets that are not subject to a FDIC loss-share agreement are referred to as noncovered foreclosed assets.
Foreclosed assets acquired through FDIC-assisted acquisitions that are subject to a FDIC loss-share agreement, and all assets acquired via foreclosure of covered loans are referred to as covered foreclosed assets. Covered foreclosed assets are reported exclusive of expected reimbursement cash flows from the FDIC. Foreclosed covered loan collateral is transferred into covered foreclosed assets at the loan’s carrying value, inclusive of the acquisition date fair value discount.
Covered foreclosed assets are initially recorded at estimated fair value less estimated costs to sell on the acquisition date based on similar market comparable valuations less estimated selling costs. Any subsequent valuation adjustments due to declines in fair value will be charged to noninterest expense, and will be mostly offset by noninterest income representing the corresponding increase to the FDIC indemnification asset for the offsetting loss reimbursement amount. Any recoveries of previous valuation adjustments will be credited to noninterest expense with a corresponding charge to noninterest income for the portion of the recovery that is due to the FDIC.
Premises and Equipment
Land is carried at cost. Land improvements, buildings and equipment, including those acquired under capital lease, are stated at cost less accumulated depreciation and amortization. Depreciation and amortization expenses are computed using the straight-line method over the estimated useful lives of the related assets or lease terms. Asset lives range from 3-10 years for furniture and equipment and 15-40 years for land improvements and buildings.
Goodwill and Other Intangible Assets
Goodwill represents the excess of costs over fair value of net assets of businesses acquired. Goodwill and other intangible assets acquired in a purchase business combination and determined to have an indefinite useful life are not amortized, but instead tested for impairment at least annually. Intangible assets with estimable useful lives are amortized over their respective estimated useful lives to their estimated residual values, and reviewed for impairment.
The Company has an identifiable intangible asset consisting of core deposit intangibles (CDI). CDI are amortized over their respective estimated useful lives, and reviewed for impairment.
Impairment of Long-Lived Assets and Goodwill
Long-lived assets, such as premises and equipment, and purchased intangibles subject to amortization, are reviewed for impairment whenever events or changes in circumstances indicate that the carrying amount of an asset may not be recoverable. Recoverability of assets to be held and used is measured by a comparison of the carrying amount of an asset to estimated undiscounted future cash flows expected to be generated by the asset. If the carrying amount of an asset exceeds its estimated future cash flows, an impairment charge is recognized by the amount by which the carrying amount of the asset exceeds the fair value of the asset. Assets to be disposed of would be separately presented in the balance sheet and reported at the lower of the carrying amount or fair value less costs to sell, and are no longer depreciated. The assets and liabilities of a disposed group classified as held for sale would be presented separately in the appropriate asset and liability sections of the consolidated balance sheet.
As of December 31 of each year, goodwill is tested for impairment, and is tested for impairment more frequently if events and circumstances indicate that the asset might be impaired. An impairment loss is recognized to the extent that the carrying amount exceeds the asset’s fair value. This determination is made at the reporting unit level. The Company may choose to first assess qualitative factors to determine
60
Table of Contents
whether the existence of events or circumstances leads to a determination that it is more likely than not that the fair value of a reporting unit is less than its carrying amount. If, after assessing the totality of events or circumstances, the Company determines it is not more likely than not that the fair value of a reporting unit is less than its carrying amount, then goodwill is deemed not to be impaired. However, if the Company concludes otherwise, or if the Company elected not to first assess qualitative factors, then the Company performs the first step of a two-step impairment test by calculating the fair value of the reporting unit and comparing the fair value with the carrying amount of the reporting unit. Second, if the carrying amount of the reporting unit exceeds its fair value, an impairment loss is recognized for any excess of the carrying amount of the reporting unit’s goodwill over the implied fair value of that goodwill. The implied fair value of goodwill is determined by allocating the fair value of the reporting unit in a manner similar to a purchase price allocation. The residual fair value after this allocation is the implied fair value of the reporting unit goodwill. Currently, and historically, the Company is comprised of only one reporting unit that operates within the business segment it has identified as “community banking”. Goodwill was not impaired as of December 31, 2016 because the fair value of the reporting unit exceeded its carrying value.
Mortgage Servicing Rights
Mortgage servicing rights (MSR) represent the Company’s right to a future stream of cash flows based upon the contractual servicing fee associated with servicing mortgage loans. Our MSR arise from residential and commercial mortgage loans that we originate and sell, but retain the right to service the loans. The net gain from the retention of the servicing right is included in gain on sale of loans in noninterest income when the loan is sold. Fair value is based on market prices for comparable mortgage servicing contracts, when available, or alternatively, is based on a valuation model that calculates the present value of estimated future net servicing income. The valuation model incorporates assumptions that market participants would use in estimating future net servicing income, such as the cost to service, the discount rate, the custodial earnings rate, an inflation rate, ancillary income, prepayment speeds and default rates and losses. Servicing fees are recorded in noninterest income when earned.
The Company accounts for MSR at fair value. The determination of fair value of our MSR requires management judgment because they are not actively traded. The determination of fair value for MSR requires valuation processes which combine the use of discounted cash flow models and extensive analysis of current market data to arrive at an estimate of fair value. The cash flow and prepayment assumptions used in our discounted cash flow model are based on empirical data drawn from the historical performance of our MSR, which we believe are consistent with assumptions used by market participants valuing similar MSR, and from data obtained on the performance of similar MSR. The key assumptions used in the valuation of MSR include mortgage prepayment speeds and the discount rate. These variables can, and generally will, change from quarter to quarter as market conditions and projected interest rates change. The key risks inherent with MSR are prepayment speed and changes in interest rates. The Company uses an independent third party to determine fair value of MSR.
Indemnification Asset/Liability
The Company accounts for amounts receivable or payable under its loss-share agreements entered into with the FDIC in connection with its purchase and assumption of certain assets and liabilities of Granite as indemnification assets in accordance with FASB ASC Topic 805, Business Combinations. FDIC indemnification assets are initially recorded at fair value, based on the discounted value of expected future cash flows under the loss-share agreements. The difference between the fair value and the undiscounted cash flows the Company expects to collect from or pay to the FDIC will be accreted into noninterest income over the life of the FDIC indemnification asset. FDIC indemnification assets are reviewed quarterly and adjusted for any changes in expected cash flows based on recent performance and expectations for future performance of the covered portfolios. These adjustments are measured on the same basis as the related covered loans and covered other real estate owned. Any increases in cash flow of the covered assets over those expected will reduce the FDIC indemnification asset and any decreases in cash flow of the covered assets under those expected will increase the FDIC indemnification asset. Increases and decreases to the FDIC indemnification asset are recorded as adjustments to noninterest income.
Reserve for Unfunded Commitments
The reserve for unfunded commitments is established through a provision for losses – unfunded commitments charged to noninterest expense. The reserve for unfunded commitments is an amount that Management believes will be adequate to absorb probable losses inherent in existing commitments, including unused portions of revolving lines of credits and other loans, standby letters of credits, and unused deposit account overdraft privilege. The reserve for unfunded commitments is based on evaluations of the collectability, and prior loss experience of unfunded commitments. The evaluations take into consideration such factors as changes in the nature and size of the loan portfolio, overall loan portfolio quality, loan concentrations, specific problem loans and related unfunded commitments, and current economic conditions that may affect the borrower’s or depositor’s ability to pay.
Low Income Housing Tax Credits
The Company accounts for low income housing tax credits and the related qualified affordable housing projects using the proportional amortization method. Under the proportional amortization method, the Company amortizes the initial cost of the investment in proportion to the tax credits and other tax benefits received and recognizes the net investment performance in the income statement as a component of income tax expense (benefit). Upon entering into a qualified affordable housing project, the Company records, in other liabilities, the entire amount that it has agreed to invest in the project, and an equal amount, in other assets, representing its investment in the project. As the Company disburses cash to satisfy its investment obligation, other liabilities are reduced. Over time, as the tax credits and other tax benefits of the project are realized by the Company, the investment recorded in other assets is reduced using the proportional amortization method.
61
Table of Contents
Income Taxes
The Company’s accounting for income taxes is based on an asset and liability approach. The Company recognizes the amount of taxes payable or refundable for the current year, and deferred tax assets and liabilities for the future tax consequences that have been recognized in its financial statements or tax returns. The measurement of tax assets and liabilities is based on the provisions of enacted tax laws. A valuation allowance, if needed, reduces deferred tax assets to the expected amount most likely to be realized. Realization of deferred tax assets is dependent upon the generation of a sufficient level of future taxable income and recoverable taxes paid in prior years. Although realization is not assured, management believes it is more likely than not that all of the deferred tax assets will be realized. Interest and/or penalties related to income taxes are reported as a component of noninterest income.
Off-Balance Sheet Credit Related Financial Instruments
In the ordinary course of business, the Company has entered into commitments to extend credit, including commitments under credit card arrangements, commercial letters of credit, and standby letters of credit. Such financial instruments are recorded when they are funded.
Geographical Descriptions
For the purpose of describing the geographical location of the Company’s loans, the Company has defined northern California as that area of California north of, and including, Stockton; central California as that area of the state south of Stockton, to and including, Bakersfield; and southern California as that area of the state south of Bakersfield.
Reclassifications
Certain amounts reported in previous consolidated financial statements have been reclassified to conform to the presentation in this report. These reclassifications did not affect previously reported net income or total shareholders’ equity.
Recent Accounting Pronouncements
FASB issued Accounting Standard Update (ASU) No. 2016-02, Leases (Topic 842). ASU 2016-2, among other things, requires lessees to recognize most leases on-balance sheet, increasing reported assets and liabilities. Lessor accounting remains substantially similar to current U.S. GAAP. ASU 2016-02 will be effective for the Company on January 1, 2019, utilizing the modified retrospective transition approach. The Company is currently evaluating the impact of adopting ASU 2016-02 on the Company’s consolidated financial statements.
FASB issued Accounting Standard Update (ASU) No. 2016-09, Compensation – Stock Compensation (Topic 718). ASU 2016-09, among other things, requires: (i) that all excess tax benefits and tax deficiencies (including tax benefits of dividends on share-based payment awards) should be recognized as income tax expense or benefit in the income statement, (ii) the tax effects of exercised or vested awards should be treated as discrete items in the reporting period in which they occur, (iii) an entity also should recognize excess tax benefits regardless of whether the benefit reduces taxes payable in the current period, (iv) excess tax benefits should be classified along with other income tax cash flows as an operating activity, (v) an entity can make an entity-wide accounting policy election to either estimate the number of awards that are expected to vest (current GAAP) or account for forfeitures when they occur, (vi) the threshold to qualify for equity classification permits withholding up to the maximum statutory tax rates in the applicable jurisdictions, and (vii) cash paid by an employer when directly withholding shares for tax withholding purposes should be classified as a financing activity. ASU 2016-09 was effective for the Company on January 1, 2017 and will not have a significant impact on the Company’s consolidated financial statements.
FASB issued ASU No. 2016-13, Financial Instruments – Credit Losses (Topic 326). ASU 2016-13 is the final guidance on the new current expected credit loss (‘‘CECL’’) model. ASU 2016-13, among other things, requires the incurred loss impairment methodology in current GAAP be replaced with a methodology that reflects expected credit losses and requires consideration of a broader range of reasonable and supportable information to estimate future credit loss estimates. As CECL encompasses all financial assets carried at amortized cost, the requirement that reserves be established based on an organization’s reasonable and supportable estimate of expected credit losses extends to held to maturity (‘‘HTM’’) debt securities. ASU 2016-13 amends the accounting for credit losses on available-for-sale securities (‘‘AFS’’), whereby credit losses will be presented as an allowance as opposed to a write-down. In addition, CECL will modify the accounting for purchased loans with credit deterioration since origination, so that reserves are established at the date of acquisition for purchased loans. Lastly, ASU 2016-13 requires enhanced disclosures on the significant estimates and judgments used to estimate credit losses, as well as on the credit quality and underwriting standards of an organization’s portfolio. These disclosures require organizations to present the currently required credit quality disclosures disaggregated by the year of origination or vintage. ASU 2016-13 allows for a modified retrospective approach with a cumulative effect adjustment to the balance sheet upon adoption (charge to retained earnings instead of the income statement). ASU 2016-13 will be effective for the Company on January 1, 2020, and early adoption is permitted. The Company is currently evaluating the impact of adopting ASU 2016-13 on the Company’s consolidated financial statements.
FASB issued ASU No. 2016-18, Statement of Cash Flows – Restricted Cash (Topic 230). ASU 2016-18 requires that a statement of cash flows explain the change during the period in the total of cash, cash equivalents, and amounts generally described as restricted cash or restricted cash equivalents. Therefore, amounts generally described as restricted cash and restricted cash equivalents should be included with cash and cash equivalents when reconciling the beginning-of-period and end-of-period total amounts shown on the statement of cash flows. ASU 2016-18 will be effective for the Company on January 1, 2018 and is not expected to have a significant impact on the Company’s consolidated financial statements.
62
Table of Contents
FASB issued ASU No. 2017-01, Business Combinations – Clarifying the Definition of a Business (Topic 805). ASU 2017-01 clarifies the definition and provides a more robust framework to use in determining when a set of assets and activities constitutes a business. ASU 2017-01 is intended to provide guidance when evaluating whether transactions should be accounted for as acquisitions (or disposals) of assets or businesses. ASU 2017-01 will be effective for us on January 1, 2018 and is not expected to have a significant impact on our financial statements.
FASB issued ASU No. 2017-04, Intangibles – Goodwill and Other: Simplifying the Test for Goodwill Impairment (Topic 350): ASU 2017-04 eliminates step two of the goodwill impairment test (the hypothetical purchase price allocation used to determine the implied fair value of goodwill) when step one (determining if the carrying value of a reporting unit exceeds its fair value) is failed. Instead, entities simply will compare the fair value of a reporting unit to its carrying amount and record goodwill impairment for the amount by which the reporting unit’s carrying amount exceeds its fair value. ASU 2017-04 will be effective for the Company on January 1, 2020 and is not expected to have a significant impact on the Company’s consolidated financial statements.
63
Table of Contents
Note 2—Business Combinations
On March 18, 2016, the Bank completed its acquisition of three branch banking offices from Bank of America originally announced October 28, 2015. The acquired branches are located in Arcata, Eureka and Fortuna in Humboldt County on the North Coast of California, and have significant overlap compared to the Company’s then-existing Northern California customer base and branch locations. As a result, these branch acquisitions create potential cost savings and future growth potential. With the levels of capital at the time, the acquisitions fit well into the Company’s growth strategy. Also on March 18, 2016, the electronic customer service and other data processing systems of the acquired branches were converted into the Bank’s systems, and the effect of revenue and expenses from the operations of the acquired branches are included in the results of the Company. The Bank paid a premium of $3,204,000 for deposit relationships with balances of $161,231,000 and loans with balances of $289,000, and received cash of $159,520,000 from Bank of America.
The assets acquired and liabilities assumed in the acquisition of these branches were accounted for in accordance with ASC 805 “Business Combinations,” using the acquisition method of accounting and were recorded at their estimated fair values on the March 18, 2016 acquisition date, and the results of operations of the acquired branches are included in the Company’s consolidated statements of income since that date. The excess of the fair value of consideration transferred over total identifiable net assets was recorded as goodwill. The goodwill arising from the acquisition consists largely of the synergies and economies of scale expected from combining the operations of the Company and the acquired branches. $849,000 of the goodwill is deductible for income tax purposes because the acquisition was accounted for as a purchase of assets and assumption of liabilities for tax purposes.
The following table discloses the calculation of the fair value of consideration transferred, the total identifiable net assets acquired and the resulting goodwill relating to the acquisition of three branch banking offices and certain deposits from Bank of America on March 18, 2016:
| (in thousands) | March 18, 2016 | |||
| Fair value of consideration transferred: |
||||
| Cash consideration |
$ | 3,204 | ||
|
|
|
|||
| Total fair value of consideration transferred |
3,204 | |||
|
|
|
|||
| Asset acquired: |
||||
| Cash and cash equivalents |
159,520 | |||
| Loans |
289 | |||
| Premises and equipment |
1,590 | |||
| Core deposit intangible |
2,046 | |||
| Other assets |
141 | |||
|
|
|
|||
| Total assets acquired |
163,586 | |||
|
|
|
|||
| Liabilities assumed: |
||||
| Deposits |
161,231 | |||
|
|
|
|||
| Total liabilities assumed |
161,231 | |||
|
|
|
|||
| Total net assets acquired |
2,355 | |||
|
|
|
|||
| Goodwill recognized |
$ | 849 | ||
|
|
|
|||
A summary of the cash paid and estimated fair value adjustments resulting in the goodwill recorded in the acquisition of three branch banking offices and certain deposits from Bank of America on March 18, 2016 are presented below:
| (in thousands) | March 18, 2016 | |||
| Cash paid |
$ | 3,204 | ||
| Cost basis net assets acquired |
— | |||
| Fair value adjustments: |
||||
| Loans |
— | |||
| Premises and Equipment |
(309 | ) | ||
| Core deposit intangible |
(2,046 | ) | ||
|
|
|
|||
| Goodwill |
$ | 849 | ||
|
|
|
|||
As part of the acquisition of three branch banking offices from Bank of America, the Company performed a valuation of premises and equipment acquired. This valuation resulted in a $309,000 increase in the net book value of the land and buildings acquired, and was based on current appraisals of such land and buildings.
The Company recognized a core deposit intangible of $2,046,000 related to the acquisition of the core deposits. The recorded core deposit intangibles represented approximately 1.50% of the core deposits acquired and will be amortized over their estimated useful lives of 7 years.
A valuation of the time deposits acquired was also performed as of the acquisition date. Time deposits were split into similar pools based on size, type of time deposits, and maturity. A discounted cash flow analysis was performed on the pools based on current market rates currently paid on similar time deposits. The valuation resulted in no material fair value discount or premium, and none was recorded.
64
Table of Contents
Note 3—Investment Securities
The amortized cost and estimated fair values of investments in debt and equity securities are summarized in the following tables:
| December 31, 2016 | ||||||||||||||||
| Amortized Cost |
Gross Unrealized Gains |
Gross Unrealized Losses |
Estimated Fair Value |
|||||||||||||
| (in thousands) | ||||||||||||||||
| Securities Available for Sale |
||||||||||||||||
| Obligations of U.S. government corporations and agencies |
$ | 434,357 | $ | 1,949 | $ | (6,628 | ) | $ | 429,678 | |||||||
| Obligations of states and political subdivisions |
121,746 | 267 | (4,396 | ) | 117,617 | |||||||||||
| Marketable equity securities |
3,000 | — | (62 | ) | 2,938 | |||||||||||
|
|
|
|
|
|
|
|
|
|||||||||
| Total securities available for sale |
$ | 559,103 | $ | 2,216 | $ | (11,086 | ) | $ | 550,233 | |||||||
|
|
|
|
|
|
|
|
|
|||||||||
| Securities Held to Maturity |
||||||||||||||||
| Obligations of U.S. government corporations and agencies |
$ | 587,982 | $ | 5,001 | $ | (4,199 | ) | $ | 588,784 | |||||||
| Obligations of states and political subdivisions |
14,554 | 56 | (191 | ) | 14,419 | |||||||||||
|
|
|
|
|
|
|
|
|
|||||||||
| Total securities held to maturity |
$ | 602,536 | $ | 5,057 | $ | (4,390 | ) | $ | 603,203 | |||||||
|
|
|
|
|
|
|
|
|
|||||||||
| December 31, 2015 | ||||||||||||||||
| Amortized Cost |
Gross Unrealized Gains |
Gross Unrealized Losses |
Estimated Fair Value |
|||||||||||||
| (in thousands) | ||||||||||||||||
| Securities Available for Sale |
||||||||||||||||
| Obligations of U.S. government corporations and agencies |
$ | 312,917 | $ | 2,761 | $ | (1,996 | ) | $ | 313,682 | |||||||
| Obligations of states and political subdivisions |
86,823 | 1,428 | (33 | ) | 88,218 | |||||||||||
| Marketable equity securities |
3,000 | — | (15 | ) | 2,985 | |||||||||||
|
|
|
|
|
|
|
|
|
|||||||||
| Total securities available for sale |
$ | 402,740 | $ | 4,189 | $ | (2,044 | ) | $ | 404,885 | |||||||
|
|
|
|
|
|
|
|
|
|||||||||
| Securities Held to Maturity |
||||||||||||||||
| Obligations of U.S. government corporations and agencies |
$ | 711,994 | $ | 8,394 | $ | (2,882 | ) | $ | 717,506 | |||||||
| Obligations of states and political subdivisions |
14,536 | 277 | (110 | ) | 14,703 | |||||||||||
|
|
|
|
|
|
|
|
|
|||||||||
| Total securities held to maturity |
$ | 726,530 | $ | 8,671 | $ | (2,992 | ) | $ | 732,209 | |||||||
|
|
|
|
|
|
|
|
|
|||||||||
No investment securities were sold during 2016. Investment securities totaling $2,000 were sold in 2015 resulting in no gain or loss on sale. Investment securities sold during 2014 totaled $14,130,000. Investment securities with an aggregate carrying value of $292,737,000 and $297,547,000 at December 31, 2016 and 2015, respectively, were pledged as collateral for specific borrowings, lines of credit and local agency deposits.
The amortized cost and estimated fair value of debt securities at December 31, 2016 by contractual maturity are shown below. Actual maturities may differ from contractual maturities because borrowers may have the right to call or prepay obligations with or without call or prepayment penalties. At December 31, 2016, obligations of U.S. government corporations and agencies with a cost basis totaling $1,022,339,000 consist almost entirely of residential real estate mortgage-backed securities whose contractual maturity, or principal repayment, will follow the repayment of the underlying mortgages. For purposes of the following table, the entire outstanding balance of these mortgage-backed securities issued by U.S. government corporations and agencies is categorized based on final maturity date. At December 31, 2016, the Company estimates the average remaining life of these mortgage-backed securities issued by U.S. government corporations and agencies to be approximately 6.1 years. Average remaining life is defined as the time span after which the principal balance has been reduced by half.
| Investment Securities (In thousands) |
Available for Sale | Held to Maturity | ||||||||||||||
| Amortized Cost |
Estimated Fair Value |
Amortized Cost |
Estimated Fair Value |
|||||||||||||
| Due in one year |
$ | 1 | $ | 1 | — | — | ||||||||||
| Due after one year through five years |
9,392 | 9,650 | $ | 1,177 | $ | 1,185 | ||||||||||
| Due after five years through ten years |
14,548 | 15,132 | 4,776 | 4,762 | ||||||||||||
| Due after ten years |
535,162 | 525,450 | 596,583 | 597,256 | ||||||||||||
|
|
|
|
|
|
|
|
|
|||||||||
| Totals |
$ | 559,103 | $ | 550,233 | $ | 602,536 | $ | 603,203 | ||||||||
|
|
|
|
|
|
|
|
|
|||||||||
65
Table of Contents
Gross unrealized losses on investment securities and the fair value of the related securities, aggregated by investment category and length of time that individual securities have been in a continuous unrealized loss position, were as follows:
| Less than 12 months | 12 months or more | Total | ||||||||||||||||||||||
| December 31, 2016 | Fair Value |
Unrealized Loss |
Fair Value |
Unrealized Loss |
Fair Value |
Unrealized Loss |
||||||||||||||||||
| (in thousands) | ||||||||||||||||||||||||
| Securities Available for Sale: |
||||||||||||||||||||||||
| Obligations of U.S. government corporations and agencies |
$ | 370,389 | $ | (6,628 | ) | — | — | $ | 370,389 | $ | (6,628 | ) | ||||||||||||
| Obligations of states and political subdivisions |
90,825 | (4,396 | ) | — | — | 90,825 | (4,396 | ) | ||||||||||||||||
| Marketable equity securities |
2,938 | (62 | ) | — | — | 2,938 | (62 | ) | ||||||||||||||||
|
|
|
|
|
|
|
|
|
|
|
|
|
|||||||||||||
| Total securities available-for-sale |
$ | 464,152 | $ | (11,086 | ) | — | — | $ | 464,152 | $ | (11,086 | ) | ||||||||||||
|
|
|
|
|
|
|
|
|
|
|
|
|
|||||||||||||
| Securities Held to Maturity: |
||||||||||||||||||||||||
| Obligations of U.S. government corporations and agencies |
$ | 280,497 | $ | (4,199 | ) | — | — | $ | 280,497 | $ | (4,199 | ) | ||||||||||||
| Obligations of states and political subdivisions |
9,984 | (191 | ) | — | — | 9,984 | (191 | ) | ||||||||||||||||
|
|
|
|
|
|
|
|
|
|
|
|
|
|||||||||||||
| Total securities held-to-maturity |
$ | 290,481 | $ | (4,390 | ) | — | — | $ | 290,481 | $ | (4,390 | ) | ||||||||||||
|
|
|
|
|
|
|
|
|
|
|
|
|
|||||||||||||
| Less than 12 months | 12 months or more | Total | ||||||||||||||||||||||
| December 31, 2015 | Fair Value |
Unrealized Loss |
Fair Value |
Unrealized Loss |
Fair Value |
Unrealized Loss |
||||||||||||||||||
| (in thousands) | ||||||||||||||||||||||||
| Securities Available for Sale: |
||||||||||||||||||||||||
| Obligations of U.S. government corporations and agencies |
$ | 193,306 | $ | (1,996 | ) | — | — | $ | 193,306 | $ | (1,996 | ) | ||||||||||||
| Obligations of states and political subdivisions |
6,469 | (33 | ) | — | — | 6,469 | (33 | ) | ||||||||||||||||
| Marketable equity securities |
2,985 | (15 | ) | — | — | 2,985 | (15 | ) | ||||||||||||||||
|
|
|
|
|
|
|
|
|
|
|
|
|
|||||||||||||
| Total securities available-for-sale |
$ | 202,760 | $ | (2,044 | ) | — | — | $ | 202,760 | $ | (2,044 | ) | ||||||||||||
|
|
|
|
|
|
|
|
|
|
|
|
|
|||||||||||||
| Securities Held to Maturity: |
||||||||||||||||||||||||
| Obligations of U.S. government corporations and agencies |
$ | 198,481 | $ | (2,882 | ) | — | — | $ | 198,481 | $ | (2,882 | ) | ||||||||||||
| Obligations of states and political subdivisions |
497 | (11 | ) | $ | 1,121 | $ | (99 | ) | 1,618 | (110 | ) | |||||||||||||
|
|
|
|
|
|
|
|
|
|
|
|
|
|||||||||||||
| Total securities held-to-maturity |
$ | 198,978 | $ | (2,893 | ) | $ | 1,121 | $ | (99 | ) | $ | 200,099 | $ | (2,992 | ) | |||||||||
|
|
|
|
|
|
|
|
|
|
|
|
|
|||||||||||||
Obligations of U.S. government corporations and agencies: Unrealized losses on investments in obligations of U.S. government corporations and agencies are caused by interest rate increases. The contractual cash flows of these securities are guaranteed by U.S. Government Sponsored Entities (principally Fannie Mae and Freddie Mac). It is expected that the securities would not be settled at a price less than the amortized cost of the investment. Because the decline in fair value is attributable to changes in interest rates and not credit quality, and because the Company does not intend to sell and more likely than not will not be required to sell, these investments are not considered other-than-temporarily impaired. At December 31, 2016, 62 debt securities representing obligations of U.S. government corporations and agencies had unrealized losses with aggregate depreciation of 1.64% from the Company’s amortized cost basis.
Obligations of states and political subdivisions: The unrealized losses on investments in obligations of states and political subdivisions were caused by increases in required yields by investors in these types of securities. It is expected that the securities would not be settled at a price less than the amortized cost of the investment. Because the decline in fair value is attributable to changes in interest rates and not credit quality, and because the Company does not intend to sell and more likely than not will not be required to sell, these investments are not considered other-than-temporarily impaired. At December 31, 2016, 107 debt securities representing obligations of states and political subdivisions had unrealized losses with aggregate depreciation of 4.35% from the Company’s amortized cost basis.
Marketable equity securities: At December 31, 2016, marketable equity securities had unrealized losses representing aggregate depreciation of 2.07% from the Company’s amortized cost basis.
66
Table of Contents
Note 4 – Loans
A summary of loan balances follows (in thousands):
| December 31, 2016 | ||||||||||||||||||||
| PCI - | PCI - | |||||||||||||||||||
| Originated | PNCI | Cash basis | Other | Total | ||||||||||||||||
| Mortgage loans on real estate: |
||||||||||||||||||||
| Residential 1-4 family |
$ | 229,609 | $ | 78,935 | — | $ | 1,363 | $ | 309,907 | |||||||||||
| Commercial |
1,484,420 | 250,037 | — | 13,460 | 1,747,917 | |||||||||||||||
|
|
|
|
|
|
|
|
|
|
|
|||||||||||
| Total mortgage loan on real estate |
1,714,029 | 328,972 | — | 14,823 | 2,057,824 | |||||||||||||||
| Consumer: |
||||||||||||||||||||
| Home equity lines of credit |
263,590 | 21,765 | 2,983 | 1,377 | 289,715 | |||||||||||||||
| Home equity loans |
37,074 | 3,618 | — | 1,130 | 41,822 | |||||||||||||||
| Other |
28,167 | 2,534 | — | 65 | 30,766 | |||||||||||||||
|
|
|
|
|
|
|
|
|
|
|
|||||||||||
| Total consumer loans |
328,831 | 27,917 | 2,983 | 2,572 | 362,303 | |||||||||||||||
| Commercial |
200,735 | 12,321 | — | 3,991 | 217,047 | |||||||||||||||
| Construction: |
||||||||||||||||||||
| Residential |
54,613 | 141 | — | 675 | 55,429 | |||||||||||||||
| Commercial |
58,119 | 8,871 | — | — | 66,990 | |||||||||||||||
|
|
|
|
|
|
|
|
|
|
|
|||||||||||
| Total construction |
112,732 | 9,012 | — | 675 | 122,419 | |||||||||||||||
|
|
|
|
|
|
|
|
|
|
|
|||||||||||
| Total loans, net of deferred loan fees and discounts |
$ | 2,356,327 | $ | 378,222 | $ | 2,983 | $ | 22,061 | $ | 2,759,593 | ||||||||||
|
|
|
|
|
|
|
|
|
|
|
|||||||||||
| Total principal balance of loans owed, net of charge-offs |
$ | 2,363,243 | $ | 388,139 | $ | 8,280 | $ | 25,650 | $ | 2,785,312 | ||||||||||
| Unamortized net deferred loan fees |
(6,916 | ) | — | — | — | (6,916 | ) | |||||||||||||
| Discounts to principal balance of loans owed, net of charge-offs |
— | (9,917 | ) | (5,297 | ) | (3,589 | ) | (18,803 | ) | |||||||||||
|
|
|
|
|
|
|
|
|
|
|
|||||||||||
| Total loans, net of unamortized deferred loan fees and discounts |
$ | 2,356,327 | $ | 378,222 | $ | 2,983 | $ | 22,061 | $ | 2,759,593 | ||||||||||
|
|
|
|
|
|
|
|
|
|
|
|||||||||||
| Noncovered loans |
$ | 2,356,327 | $ | 378,222 | $ | 2,983 | $ | 18,885 | $ | 2,756,417 | ||||||||||
| Covered loans |
— | — | — | 3,176 | 3,176 | |||||||||||||||
| Total loans, net of unamortized deferred loan fees and discounts |
$ | 2,356,327 | $ | 378,222 | $ | 2,983 | $ | 22,061 | $ | 2,759,593 | ||||||||||
| Allowance for loan losses |
$ | (28,141 | ) | $ | (1,665 | ) | $ | (17 | ) | $ | (2,680 | ) | $ | (32,503 | ) | |||||
67
Table of Contents
Note 4 – Loans (continued)
A summary of loan balances follows (in thousands):
| December 31, 2015 | ||||||||||||||||||||
| PCI - | PCI - | |||||||||||||||||||
| Originated | PNCI | Cash basis | Other | Total | ||||||||||||||||
| Mortgage loans on real estate: |
||||||||||||||||||||
| Residential 1-4 family |
$ | 207,585 | $ | 104,535 | — | $ | 2,145 | $ | 314,265 | |||||||||||
| Commercial |
1,163,643 | 310,864 | — | 23,060 | 1,497,567 | |||||||||||||||
|
|
|
|
|
|
|
|
|
|
|
|||||||||||
| Total mortgage loan on real estate |
1,371,228 | 415,399 | — | 25,205 | 1,811,832 | |||||||||||||||
| Consumer: |
||||||||||||||||||||
| Home equity lines of credit |
285,419 | 29,335 | $ | 4,954 | 2,784 | 322,492 | ||||||||||||||
| Home equity loans |
34,717 | 4,018 | 124 | 1,503 | 40,362 | |||||||||||||||
| Other |
28,998 | 3,367 | — | 64 | 32,429 | |||||||||||||||
|
|
|
|
|
|
|
|
|
|
|
|||||||||||
| Total consumer loans |
349,134 | 36,720 | 5,078 | 4,351 | 395,283 | |||||||||||||||
| Commercial |
170,320 | 19,744 | 1 | 4,848 | 194,913 | |||||||||||||||
| Construction: |
||||||||||||||||||||
| Residential |
31,778 | 13,636 | — | 721 | 46,135 | |||||||||||||||
| Commercial |
66,285 | 8,489 | — | — | 74,774 | |||||||||||||||
|
|
|
|
|
|
|
|
|
|
|
|||||||||||
| Total construction |
98,063 | 22,125 | — | 721 | 120,909 | |||||||||||||||
|
|
|
|
|
|
|
|
|
|
|
|||||||||||
| Total loans, net of deferred loan fees and discounts |
$ | 1,988,745 | $ | 493,988 | $ | 5,079 | $ | 35,125 | $ | 2,522,937 | ||||||||||
|
|
|
|
|
|
|
|
|
|
|
|||||||||||
| Total principal balance of loans owed, net of charge-offs |
$ | 1,995,296 | $ | 507,935 | $ | 12,686 | $ | 39,693 | $ | 2,555,610 | ||||||||||
| Unamortized net deferred loan fees |
(6,551 | ) | — | — | — | (6,551 | ) | |||||||||||||
| Discounts to principal balance of loans owed, net of charge-offs |
— | (13,947 | ) | (7,607 | ) | (4,568 | ) | (26,122 | ) | |||||||||||
|
|
|
|
|
|
|
|
|
|
|
|||||||||||
| Total loans, net of unamortized deferred loan fees and discounts |
$ | 1,988,745 | $ | 493,988 | $ | 5,079 | $ | 35,125 | $ | 2,522,937 | ||||||||||
|
|
|
|
|
|
|
|
|
|
|
|||||||||||
| Noncovered loans |
$ | 1,988,745 | $ | 493,988 | $ | 5,079 | $ | 29,890 | $ | 2,517,702 | ||||||||||
| Covered loans |
— | — | — | 5,235 | 5,235 | |||||||||||||||
|
|
|
|
|
|
|
|
|
|
|
|||||||||||
| Total loans, net of unamortized deferred loan fees and discounts |
$ | 1,988,745 | $ | 493,988 | $ | 5,079 | $ | 35,125 | $ | 2,522,937 | ||||||||||
|
|
|
|
|
|
|
|
|
|
|
|||||||||||
| Allowance for loan losses |
$ | (31,271 | ) | $ | (1,848 | ) | $ | (121 | ) | $ | (2,771 | ) | $ | (36,011 | ) | |||||
|
|
|
|
|
|
|
|
|
|
|
|||||||||||
The following is a summary of the change in accretable yield for PCI – other loans during the periods indicated (in thousands):
| Year ended December 31, | ||||||||
| 2016 | 2015 | |||||||
| Change in accretable yield: |
||||||||
| Balance at beginning of period |
$ | 13,255 | $ | 14,159 | ||||
| Accretion to interest income |
(4,011 | ) | (6,323 | ) | ||||
| Reclassification (to) from nonaccretable difference |
1,104 | 5,419 | ||||||
|
|
|
|
|
|||||
| Balance at end of period |
$ | 10,348 | $ | 13,255 | ||||
|
|
|
|
|
|||||
68
Table of Contents
Note 5 – Allowance for Loan Losses
The following tables summarize the activity in the allowance for loan losses, and ending balance of loans, net of unearned fees for the periods indicated.
| Allowance for Loan Losses - Year Ended December 31, 2016 | ||||||||||||||||||||||||||||||||||||||||
| RE Mortgage | Home Equity | Auto | Other | Construction | ||||||||||||||||||||||||||||||||||||
| (in thousands) | Resid. | Comm. | Lines | Loans | Indirect | Consum. | C&I | Resid. | Comm. | Total | ||||||||||||||||||||||||||||||
| Beginning balance |
$ | 2,507 | $ | 11,443 | $ | 11,253 | $ | 3,138 | — | $ | 688 | $ | 5,271 | $ | 899 | $ | 812 | $ | 36,011 | |||||||||||||||||||||
| Charge-offs |
(321 | ) | (827 | ) | (585 | ) | (219 | ) | — | (823 | ) | (455 | ) | — | — | (3,230 | ) | |||||||||||||||||||||||
| Recoveries |
880 | 920 | 2,317 | 590 | — | 449 | 404 | 54 | 78 | 5,692 | ||||||||||||||||||||||||||||||
| (Benefit) provision |
(679 | ) | 369 | (5,941 | ) | (892 | ) | — | 308 | 611 | 464 | (210 | ) | (5,970 | ) | |||||||||||||||||||||||||
|
|
|
|
|
|
|
|
|
|
|
|
|
|
|
|
|
|
|
|
|
|||||||||||||||||||||
| Ending balance |
$ | 2,387 | $ | 11,905 | $ | 7,044 | $ | 2,617 | — | $ | 622 | $ | 5,831 | $ | 1,417 | $ | 680 | $ | 32,503 | |||||||||||||||||||||
|
|
|
|
|
|
|
|
|
|
|
|
|
|
|
|
|
|
|
|
|
|||||||||||||||||||||
| Ending balance: |
||||||||||||||||||||||||||||||||||||||||
| Individ. evaluated for impairment |
$ | 249 | $ | 127 | $ | 410 | $ | 102 | — | $ | 28 | $ | 1,130 | — | — | $ | 2,046 | |||||||||||||||||||||||
|
|
|
|
|
|
|
|
|
|
|
|
|
|
|
|
|
|
|
|
|
|||||||||||||||||||||
| Loans pooled for evaluation |
$ | 1,952 | $ | 10,329 | $ | 6,618 | $ | 2,451 | — | $ | 594 | $ | 3,765 | $ | 1,371 | $ | 680 | $ | 27,760 | |||||||||||||||||||||
|
|
|
|
|
|
|
|
|
|
|
|
|
|
|
|
|
|
|
|
|
|||||||||||||||||||||
| Loans acquired with deteriorated credit quality |
$ | 186 | $ | 1,449 | $ | 17 | $ | 64 | — | — | $ | 936 | $ | 45 | — | $ | 2,697 | |||||||||||||||||||||||
|
|
|
|
|
|
|
|
|
|
|
|
|
|
|
|
|
|
|
|
|
|||||||||||||||||||||
| Loans, net of unearned fees - As of December 31, 2016 | ||||||||||||||||||||||||||||||||||||||||
| RE Mortgage | Home Equity | Auto | Other | Construction | ||||||||||||||||||||||||||||||||||||
| (in thousands) | Resid. | Comm. | Lines | Loans | Indirect | Consum. | C&I | Resid. | Comm. | Total | ||||||||||||||||||||||||||||||
| Ending balance: |
||||||||||||||||||||||||||||||||||||||||
| Total loans |
$ | 309,907 | $ | 1,747,917 | $ | 289,715 | $ | 41,822 | — | $ | 30,766 | $ | 217,047 | $ | 55,429 | $ | 66,990 | $ | 2,759,593 | |||||||||||||||||||||
|
|
|
|
|
|
|
|
|
|
|
|
|
|
|
|
|
|
|
|
|
|||||||||||||||||||||
| Individ. evaluated for impairment |
$ | 3,785 | $ | 15,748 | $ | 3,196 | $ | 1,150 | — | $ | 154 | $ | 4,096 | $ | 11 | — | $ | 28,140 | ||||||||||||||||||||||
|
|
|
|
|
|
|
|
|
|
|
|
|
|
|
|
|
|
|
|
|
|||||||||||||||||||||
| Loans pooled for evaluation |
$ | 304,759 | $ | 1,718,709 | $ | 282,159 | $ | 39,542 | — | $ | 30,547 | $ | 208,960 | $ | 54,743 | $ | 66,990 | $ | 2,706,409 | |||||||||||||||||||||
|
|
|
|
|
|
|
|
|
|
|
|
|
|
|
|
|
|
|
|
|
|||||||||||||||||||||
| Loans acquired with deteriorated credit quality |
$ | 1,363 | $ | 13,460 | $ | 4,360 | $ | 1,130 | — | $ | 65 | $ | 3,991 | $ | 675 | — | $ | 25,044 | ||||||||||||||||||||||
|
|
|
|
|
|
|
|
|
|
|
|
|
|
|
|
|
|
|
|
|
|||||||||||||||||||||
| Allowance for Loan Losses - Year Ended December 31, 2015 | ||||||||||||||||||||||||||||||||||||||||
| RE Mortgage | Home Equity | Auto | Other | Construction | ||||||||||||||||||||||||||||||||||||
| (in thousands) | Resid. | Comm. | Lines | Loans Indirect | Consum. | C&I | Resid. | Comm. | Total | |||||||||||||||||||||||||||||||
| Beginning balance |
$ | 3,086 | $ | 9,227 | $ | 15,676 | $ | 1,797 | $ | 9 | $ | 719 | $ | 4,226 | $ | 1,434 | $ | 411 | $ | 36,585 | ||||||||||||||||||||
| Charge-offs |
(224 | ) | — | (694 | ) | (242 | ) | (4 | ) | (972 | ) | (680 | ) | — | — | (2,816 | ) | |||||||||||||||||||||||
| Recoveries |
204 | 243 | 666 | 252 | 42 | 500 | 677 | 1,728 | 140 | 4,452 | ||||||||||||||||||||||||||||||
| (Benefit) provision |
(559 | ) | 1,973 | (4,395 | ) | 1,331 | (47 | ) | 441 | 1,048 | (2,263 | ) | 261 | (2,210 | ) | |||||||||||||||||||||||||
|
|
|
|
|
|
|
|
|
|
|
|
|
|
|
|
|
|
|
|
|
|||||||||||||||||||||
| Ending balance |
$ | 2,507 | $ | 11,443 | $ | 11,253 | $ | 3,138 | — | $ | 688 | $ | 5,271 | $ | 899 | $ | 812 | $ | 36,011 | |||||||||||||||||||||
|
|
|
|
|
|
|
|
|
|
|
|
|
|
|
|
|
|
|
|
|
|||||||||||||||||||||
| Ending balance: |
||||||||||||||||||||||||||||||||||||||||
| Individ. evaluated for impairment |
$ | 335 | $ | 395 | $ | 605 | $ | 294 | — | $ | 74 | $ | 1,187 | — | — | $ | 2,890 | |||||||||||||||||||||||
|
|
|
|
|
|
|
|
|
|
|
|
|
|
|
|
|
|
|
|
|
|||||||||||||||||||||
| Loans pooled for evaluation |
$ | 2,112 | $ | 9,596 | $ | 10,423 | $ | 2,844 | — | $ | 614 | $ | 2,983 | $ | 844 | $ | 812 | $ | 30,228 | |||||||||||||||||||||
|
|
|
|
|
|
|
|
|
|
|
|
|
|
|
|
|
|
|
|
|
|||||||||||||||||||||
| Loans acquired with deteriorated credit quality |
$ | 60 | $ | 1,452 | $ | 225 | — | — | — | $ | 1,101 | $ | 55 | — | $ | 2,893 | ||||||||||||||||||||||||
|
|
|
|
|
|
|
|
|
|
|
|
|
|
|
|
|
|
|
|
|
|||||||||||||||||||||
| Loans, net of unearned fees - As of December 31, 2015 | ||||||||||||||||||||||||||||||||||||||||
| RE Mortgage | Home Equity | Auto | Other | Construction | ||||||||||||||||||||||||||||||||||||
| (in thousands) | Resid. | Comm. | Lines | Loans | Indirect | Consum. | C&I | Resid. | Comm. | Total | ||||||||||||||||||||||||||||||
| Ending balance: |
||||||||||||||||||||||||||||||||||||||||
| Total loans |
$ | 314,265 | $ | 1,497,567 | $ | 322,492 | $ | 40,362 | — | $ | 32,429 | $ | 194,913 | $ | 46,135 | $ | 74,774 | $ | 2,522,937 | |||||||||||||||||||||
|
|
|
|
|
|
|
|
|
|
|
|
|
|
|
|
|
|
|
|
|
|||||||||||||||||||||
| Individ. evaluated for impairment |
$ | 6,767 | $ | 32,407 | $ | 5,747 | $ | 1,731 | — | $ | 288 | $ | 2,671 | $ | 4 | $ | 490 | $ | 50,105 | |||||||||||||||||||||
|
|
|
|
|
|
|
|
|
|
|
|
|
|
|
|
|
|
|
|
|
|||||||||||||||||||||
| Loans pooled for evaluation |
$ | 305,353 | $ | 1,442,100 | $ | 309,007 | $ | 37,004 | — | $ | 32,077 | $ | 187,393 | $ | 45,410 | $ | 74,284 | $ | 2,432,628 | |||||||||||||||||||||
|
|
|
|
|
|
|
|
|
|
|
|
|
|
|
|
|
|
|
|
|
|||||||||||||||||||||
| Loans acquired with deteriorated credit quality |
$ | 2,145 | $ | 23,060 | $ | 7,738 | $ | 1,627 | — | $ | 64 | $ | 4,849 | $ | 721 | — | $ | 40,204 | ||||||||||||||||||||||
|
|
|
|
|
|
|
|
|
|
|
|
|
|
|
|
|
|
|
|
|
|||||||||||||||||||||
69
Table of Contents
Note 5 – Allowance for Loan Losses (continued)
| Allowance for Loan Losses - Year Ended December 31, 2014 | ||||||||||||||||||||||||||||||||||||||||
| RE Mortgage | Home Equity | Auto | Other | Construction | ||||||||||||||||||||||||||||||||||||
| (in thousands) | Resid. | Comm. | Lines | Loans Indirect | Consum. | C&I | Resid. | Comm. | Total | |||||||||||||||||||||||||||||||
| Beginning balance |
$ | 3,154 | $ | 9,700 | $ | 16,375 | $ | 1,208 | $ | 66 | $ | 589 | $ | 4,331 | $ | 1,559 | $ | 1,263 | $ | 38,245 | ||||||||||||||||||||
| Charge-offs |
(171 | ) | (110 | ) | (1,094 | ) | (29 | ) | (3 | ) | (599 | ) | (479 | ) | (4 | ) | (69 | ) | (2,558 | ) | ||||||||||||||||||||
| Recoveries |
2 | 540 | 960 | 34 | 86 | 495 | 1,268 | 1,377 | 181 | 4,943 | ||||||||||||||||||||||||||||||
| (Benefit) provision |
101 | (903 | ) | (565 | ) | 584 | (140 | ) | 234 | (894 | ) | (1,498 | ) | (964 | ) | (4,045 | ) | |||||||||||||||||||||||
|
|
|
|
|
|
|
|
|
|
|
|
|
|
|
|
|
|
|
|
|
|||||||||||||||||||||
| Ending balance |
$ | 3,086 | $ | 9,227 | $ | 15,676 | $ | 1,797 | $ | 9 | $ | 719 | $ | 4,226 | $ | 1,434 | $ | 411 | $ | 36,585 | ||||||||||||||||||||
|
|
|
|
|
|
|
|
|
|
|
|
|
|
|
|
|
|
|
|
|
|||||||||||||||||||||
| Ending balance: |
||||||||||||||||||||||||||||||||||||||||
| Individ. evaluated for impairment |
$ | 974 | $ | 410 | $ | 1,974 | $ | 284 | — | $ | 142 | $ | 423 | $ | 60 | — | $ | 4,267 | ||||||||||||||||||||||
|
|
|
|
|
|
|
|
|
|
|
|
|
|
|
|
|
|
|
|
|
|||||||||||||||||||||
| Loans pooled for evaluation |
$ | 1,915 | $ | 8,408 | $ | 13,251 | $ | 1,513 | $ | 9 | $ | 572 | $ | 2,569 | $ | 332 | $ | 322 | $ | 28,891 | ||||||||||||||||||||
|
|
|
|
|
|
|
|
|
|
|
|
|
|
|
|
|
|
|
|
|
|||||||||||||||||||||
| Loans acquired with deteriorated credit quality |
$ | 197 | $ | 409 | $ | 451 | — | — | $ | 5 | $ | 1,234 | $ | 1,042 | $ | 89 | $ | 3,427 | ||||||||||||||||||||||
|
|
|
|
|
|
|
|
|
|
|
|
|
|
|
|
|
|
|
|
|
|||||||||||||||||||||
| Loans, net of unearned fees - As of December 31, 2014 | ||||||||||||||||||||||||||||||||||||||||
| RE Mortgage | Home Equity | Auto | Other | Construction | ||||||||||||||||||||||||||||||||||||
| (in thousands) | Resid. | Comm. | Lines | Loans | Indirect | Consum. | C&I | Resid. | Comm. | Total | ||||||||||||||||||||||||||||||
| Ending balance: |
||||||||||||||||||||||||||||||||||||||||
| Total loans |
$ | 279,420 | $ | 1,335,939 | $ | 352,584 | $ | 31,314 | $ | 112 | $ | 33,074 | $ | 174,945 | $ | 38,618 | $ | 36,518 | $ | 2,282,524 | ||||||||||||||||||||
|
|
|
|
|
|
|
|
|
|
|
|
|
|
|
|
|
|
|
|
|
|||||||||||||||||||||
| Individ. evaluated for impairment |
$ | 7,188 | $ | 41,932 | $ | 6,968 | $ | 1,279 | $ | 18 | $ | 323 | $ | 1,757 | $ | 2,683 | $ | 99 | $ | 62,247 | ||||||||||||||||||||
|
|
|
|
|
|
|
|
|
|
|
|
|
|
|
|
|
|
|
|
|
|||||||||||||||||||||
| Loans pooled for evaluation |
$ | 268,227 | $ | 1,263,090 | $ | 336,595 | $ | 29,266 | $ | 94 | $ | 32,677 | $ | 165,753 | $ | 35,260 | $ | 36,419 | $ | 2,167,381 | ||||||||||||||||||||
|
|
|
|
|
|
|
|
|
|
|
|
|
|
|
|
|
|
|
|
|
|||||||||||||||||||||
| Loans acquired with deteriorated credit quality |
$ | 4,005 | $ | 30,917 | $ | 9,021 | $ | 770 | — | $ | 74 | $ | 7,435 | $ | 675 | — | $ | 52,897 | ||||||||||||||||||||||
|
|
|
|
|
|
|
|
|
|
|
|
|
|
|
|
|
|
|
|
|
|||||||||||||||||||||
As part of the on-going monitoring of the credit quality of the Company’s loan portfolio, management tracks certain credit quality indicators including, but not limited to, trends relating to (i) the level of criticized and classified loans, (ii) net charge-offs, (iii) non-performing loans, and (iv) delinquency within the portfolio.
The Company utilizes a risk grading system to assign a risk grade to each of its loans. Loans are graded on a scale ranging from Pass to Loss. A description of the general characteristics of the risk grades is as follows:
| • | Pass – This grade represents loans ranging from acceptable to very little or no credit risk. These loans typically meet most if not all policy standards in regard to: loan amount as a percentage of collateral value, debt service coverage, profitability, leverage, and working capital. |
| • | Special Mention – This grade represents “Other Assets Especially Mentioned” in accordance with regulatory guidelines and includes loans that display some potential weaknesses which, if left unaddressed, may result in deterioration of the repayment prospects for the asset or may inadequately protect the Company’s position in the future. These loans warrant more than normal supervision and attention. |
| • | Substandard – This grade represents “Substandard” loans in accordance with regulatory guidelines. Loans within this rating typically exhibit weaknesses that are well defined to the point that repayment is jeopardized. Loss potential is, however, not necessarily evident. The underlying collateral supporting the credit appears to have sufficient value to protect the Company from loss of principal and accrued interest, or the loan has been written down to the point where this is true. There is a definite need for a well defined workout/rehabilitation program. |
| • | Doubtful – This grade represents “Doubtful” loans in accordance with regulatory guidelines. An asset classified as Doubtful has all the weaknesses inherent in a loan classified Substandard with the added characteristic that the weaknesses make collection or liquidation in full, on the basis of currently existing facts, conditions and values, highly questionable and improbable. Pending factors include proposed merger, acquisition, or liquidation procedures, capital injection, perfecting liens on additional collateral, and financing plans. |
| • | Loss – This grade represents “Loss” loans in accordance with regulatory guidelines. A loan classified as Loss is considered uncollectible and of such little value that its continuance as a bankable asset is not warranted. This classification does not mean that the loan has absolutely no recovery or salvage value, but rather that it is not practical or desirable to defer writing off the loan, even though some recovery may be affected in the future. The portion of the loan that is graded loss should be charged off no later than the end of the quarter in which the loss is identified. |
70
Table of Contents
Note 5 – Allowance for Loan Losses (continued)
The following tables present ending loan balances by loan category and risk grade for the periods indicated:
| Credit Quality Indicators – As of December 31, 2016 | ||||||||||||||||||||||||||||||||||||||||
| RE Mortgage | Home Equity | Auto | Other | Construction | ||||||||||||||||||||||||||||||||||||
| (in thousands) | Resid. | Comm. | Lines | Loans | Indirect | Consum. | C&I | Resid. | Comm. | Total | ||||||||||||||||||||||||||||||
| Originated loans: |
||||||||||||||||||||||||||||||||||||||||
| Pass |
$ | 224,988 | $ | 1,457,128 | $ | 258,024 | $ | 34,299 | — | $ | 27,542 | $ | 190,902 | $ | 54,602 | $ | 57,808 | $ | 2,305,293 | |||||||||||||||||||||
| Special mention |
2,225 | 15,108 | 2,518 | 891 | — | 385 | 6,133 | — | 311 | 27,571 | ||||||||||||||||||||||||||||||
| Substandard |
2,396 | 12,184 | 3,048 | 1,884 | — | 240 | 3,700 | 11 | — | 23,463 | ||||||||||||||||||||||||||||||
| Loss |
— | — | — | — | — | — | — | — | — | — | ||||||||||||||||||||||||||||||
|
|
|
|
|
|
|
|
|
|
|
|
|
|
|
|
|
|
|
|
|
|||||||||||||||||||||
| Total originated |
$ | 229,609 | $ | 1,484,420 | $ | 263,590 | $ | 37,074 | — | $ | 28,167 | $ | 200,735 | $ | 54,613 | $ | 58,119 | $ | 2,356,327 | |||||||||||||||||||||
|
|
|
|
|
|
|
|
|
|
|
|
|
|
|
|
|
|
|
|
|
|||||||||||||||||||||
| PNCI loans: |
||||||||||||||||||||||||||||||||||||||||
| Pass |
$ | 75,600 | $ | 236,740 | $ | 20,442 | $ | 3,492 | — | $ | 2,437 | $ | 12,320 | $ | 141 | $ | 8,871 | $ | 360,043 | |||||||||||||||||||||
| Special mention |
1,849 | 6,057 | 509 | 41 | — | 92 | 1 | — | — | 8,549 | ||||||||||||||||||||||||||||||
| Substandard |
1,486 | 7,240 | 814 | 85 | — | 5 | — | — | — | 9,630 | ||||||||||||||||||||||||||||||
| Loss |
— | — | — | — | — | — | — | — | — | — | ||||||||||||||||||||||||||||||
|
|
|
|
|
|
|
|
|
|
|
|
|
|
|
|
|
|
|
|
|
|||||||||||||||||||||
| Total PNCI |
$ | 78,935 | $ | 250,037 | $ | 21,765 | $ | 3,618 | — | $ | 2,534 | $ | 12,321 | $ | 141 | $ | 8,871 | $ | 378,222 | |||||||||||||||||||||
|
|
|
|
|
|
|
|
|
|
|
|
|
|
|
|
|
|
|
|
|
|||||||||||||||||||||
| PCI loans |
$ | 1,363 | $ | 13,460 | $ | 4,360 | $ | 1,130 | — | $ | 65 | $ | 3,991 | $ | 675 | — | $ | 25,044 | ||||||||||||||||||||||
|
|
|
|
|
|
|
|
|
|
|
|
|
|
|
|
|
|
|
|
|
|||||||||||||||||||||
| Total loans |
$ | 309,907 | $ | 1,747,917 | $ | 289,715 | $ | 41,822 | — | $ | 30,766 | $ | 217,047 | $ | 55,429 | $ | 66,990 | $ | 2,759,593 | |||||||||||||||||||||
|
|
|
|
|
|
|
|
|
|
|
|
|
|
|
|
|
|
|
|
|
|||||||||||||||||||||
| Credit Quality Indicators – As of December 31, 2015 | ||||||||||||||||||||||||||||||||||||||||
| RE Mortgage | Home Equity | Auto | Other | Construction | ||||||||||||||||||||||||||||||||||||
| (in thousands) | Resid. | Comm. | Lines | Loans | Indirect | Consum. | C&I | Resid. | Comm. | Total | ||||||||||||||||||||||||||||||
| Originated loans: |
||||||||||||||||||||||||||||||||||||||||
| Pass |
$ | 199,837 | $ | 1,118,868 | $ | 275,251 | $ | 31,427 | — | $ | 28,339 | $ | 166,559 | $ | 31,440 | $ | 66,285 | $ | 1,918,006 | |||||||||||||||||||||
| Special mention |
2,018 | 10,321 | 2,494 | 1,027 | — | 415 | 1,037 | 334 | — | 17,646 | ||||||||||||||||||||||||||||||
| Substandard |
5,730 | 34,454 | 7,674 | 2,263 | — | 244 | 2,724 | 4 | — | 53,093 | ||||||||||||||||||||||||||||||
| Loss |
— | — | — | — | — | — | — | — | — | — | ||||||||||||||||||||||||||||||
|
|
|
|
|
|
|
|
|
|
|
|
|
|
|
|
|
|
|
|
|
|||||||||||||||||||||
| Total originated |
$ | 207,585 | $ | 1,163,643 | $ | 285,419 | $ | 34,717 | — | $ | 28,998 | $ | 170,320 | $ | 31,778 | $ | 66,285 | $ | 1,988,745 | |||||||||||||||||||||
|
|
|
|
|
|
|
|
|
|
|
|
|
|
|
|
|
|
|
|
|
|||||||||||||||||||||
| PNCI loans: |
||||||||||||||||||||||||||||||||||||||||
| Pass |
$ | 102,895 | $ | 293,935 | $ | 27,378 | $ | 3,789 | — | $ | 3,164 | $ | 19,666 | $ | 13,636 | $ | 8,489 | $ | 472,952 | |||||||||||||||||||||
| Special mention |
600 | 10,795 | 445 | 80 | — | 74 | — | — | — | 11,994 | ||||||||||||||||||||||||||||||
| Substandard |
1,040 | 6,134 | 1,512 | 149 | — | 129 | 78 | — | — | 9,042 | ||||||||||||||||||||||||||||||
| Loss |
— | — | — | — | — | — | — | — | — | — | ||||||||||||||||||||||||||||||
|
|
|
|
|
|
|
|
|
|
|
|
|
|
|
|
|
|
|
|
|
|||||||||||||||||||||
| Total PNCI |
$ | 104,535 | $ | 310,864 | $ | 29,335 | $ | 4,018 | — | $ | 3,367 | $ | 19,744 | $ | 13,636 | $ | 8,489 | $ | 493,988 | |||||||||||||||||||||
|
|
|
|
|
|
|
|
|
|
|
|
|
|
|
|
|
|
|
|
|
|||||||||||||||||||||
| PCI loans |
$ | 2,145 | $ | 23,060 | $ | 7,738 | $ | 1,627 | — | $ | 64 | $ | 4,849 | $ | 721 | — | $ | 40,204 | ||||||||||||||||||||||
|
|
|
|
|
|
|
|
|
|
|
|
|
|
|
|
|
|
|
|
|
|||||||||||||||||||||
| Total loans |
$ | 314,265 | $ | 1,497,567 | $ | 322,492 | $ | 40,362 | — | $ | 32,429 | $ | 194,913 | $ | 46,135 | $ | 74,774 | $ | 2,522,937 | |||||||||||||||||||||
|
|
|
|
|
|
|
|
|
|
|
|
|
|
|
|
|
|
|
|
|
|||||||||||||||||||||
Consumer loans, whether unsecured or secured by real estate, automobiles, or other personal property, are susceptible to three primary risks; non-payment due to income loss, over-extension of credit and, when the borrower is unable to pay, shortfall in collateral value. Typically non-payment is due to loss of job and will follow general economic trends in the marketplace driven primarily by rises in the unemployment rate. Loss of collateral value can be due to market demand shifts, damage to collateral itself or a combination of the two.
Problem consumer loans are generally identified by payment history of the borrower (delinquency). The Bank manages its consumer loan portfolios by monitoring delinquency and contacting borrowers to encourage repayment, suggest modifications if appropriate, and, when continued scheduled payments become unrealistic, initiate repossession or foreclosure through appropriate channels. Collateral values may be determined by appraisals obtained through Bank approved, licensed appraisers, qualified independent third parties, public value information (blue book values for autos), sales invoices, or other appropriate means. Appropriate valuations are obtained at initiation of the credit and periodically (every 3-12 months depending on collateral type) once repayment is questionable and the loan has been classified.
Commercial real estate loans generally fall into two categories, owner-occupied and non-owner occupied. Loans secured by owner occupied real estate are primarily susceptible to changes in the business conditions of the related business. This may be driven by, among other things, industry changes, geographic business changes, changes in the individual fortunes of the business owner, and general economic conditions and changes in business cycles. These same risks apply to commercial loans whether secured by equipment or other personal property or unsecured. Losses on loans secured by owner occupied real estate, equipment, or other personal property generally are dictated by the value of underlying collateral at the time of default and liquidation of the collateral. When default is driven by issues related specifically to the business owner, collateral values tend to provide better repayment support and may result in little or no loss. Alternatively, when default is driven by more general economic conditions, underlying collateral generally has devalued more and results in larger losses due to default. Loans secured by non-owner occupied real estate are primarily susceptible to risks associated with swings in occupancy or vacancy and related shifts in lease rates, rental rates or room rates. Most often these shifts are a result of changes in general economic or market conditions or overbuilding and resultant over-supply. Losses are dependent on value of underlying collateral at the time of default. Values are generally driven by these same factors and influenced by interest rates and required rates of return as well as changes in occupancy costs.
71
Table of Contents
Note 5 – Allowance for Loan Losses (continued)
Construction loans, whether owner occupied or non-owner occupied commercial real estate loans or residential development loans, are not only susceptible to the related risks described above but the added risks of construction itself including cost over-runs, mismanagement of the project, or lack of demand or market changes experienced at time of completion. Again, losses are primarily related to underlying collateral value and changes therein as described above.
Problem C&I loans are generally identified by periodic review of financial information which may include financial statements, tax returns, rent rolls and payment history of the borrower (delinquency). Based on this information the Bank may decide to take any of several courses of action including demand for repayment, additional collateral or guarantors, and, when repayment becomes unlikely through borrower’s income and cash flow, repossession or foreclosure of the underlying collateral.
Collateral values may be determined by appraisals obtained through Bank approved, licensed appraisers, qualified independent third parties, public value information (blue book values for autos), sales invoices, or other appropriate means. Appropriate valuations are obtained at initiation of the credit and periodically (every 3-12 months depending on collateral type) once repayment is questionable and the loan has been classified.
Once a loan becomes delinquent and repayment becomes questionable, a Bank collection officer will address collateral shortfalls with the borrower and attempt to obtain additional collateral. If this is not forthcoming and payment in full is unlikely, the Bank will estimate its probable loss, using a recent valuation as appropriate to the underlying collateral less estimated costs of sale, and charge the loan down to the estimated net realizable amount. Depending on the length of time until ultimate collection, the Bank may revalue the underlying collateral and take additional charge-offs as warranted. Revaluations may occur as often as every 3-12 months depending on the underlying collateral and volatility of values. Final charge-offs or recoveries are taken when collateral is liquidated and actual loss is known. Unpaid balances on loans after or during collection and liquidation may also be pursued through lawsuit and attachment of wages or judgment liens on borrower’s other assets.
The following table shows the ending balance of current, past due, and nonaccrual originated loans by loan category as of the date indicated:
| Analysis of Past Due and Nonaccrual Originated Loans – As of December 31, 2016 | ||||||||||||||||||||||||||||||||||||||||
| RE Mortgage | Home Equity | Auto | Other | Construction | ||||||||||||||||||||||||||||||||||||
| (in thousands) | Resid. | Comm. | Lines | Loans | Indirect | Consum. | C&I | Resid. | Comm. | Total | ||||||||||||||||||||||||||||||
| Originated loan balance: |
||||||||||||||||||||||||||||||||||||||||
| Past due: |
||||||||||||||||||||||||||||||||||||||||
| 30-59 Days |
$ | 552 | $ | 317 | $ | 754 | $ | 646 | — | $ | 16 | $ | 1,148 | $ | 921 | — | $ | 4,354 | ||||||||||||||||||||||
| 60-89 Days |
139 | 1,517 | — | 395 | — | 30 | 84 | — | $ | 421 | 2,586 | |||||||||||||||||||||||||||||
| > 90 Days |
— | 216 | 687 | 184 | — | 15 | 634 | 11 | — | 1,747 | ||||||||||||||||||||||||||||||
|
|
|
|
|
|
|
|
|
|
|
|
|
|
|
|
|
|
|
|
|
|||||||||||||||||||||
| Total past due |
$ | 691 | $ | 2,050 | $ | 1,441 | $ | 1,225 | — | $ | 61 | $ | 1,866 | $ | 932 | $ | 421 | $ | 8,687 | |||||||||||||||||||||
| Current |
228,918 | 1,482,370 | 262,149 | 35,849 | — | 28,106 | 198,869 | 53,681 | 57,698 | 2,347,640 | ||||||||||||||||||||||||||||||
|
|
|
|
|
|
|
|
|
|
|
|
|
|
|
|
|
|
|
|
|
|||||||||||||||||||||
| Total orig. loans |
$ | 229,609 | $ | 1,484,420 | $ | 263,590 | $ | 37,074 | — | $ | 28,167 | $ | 200,735 | $ | 54,613 | $ | 58,119 | $ | 2,356,327 | |||||||||||||||||||||
|
|
|
|
|
|
|
|
|
|
|
|
|
|
|
|
|
|
|
|
|
|||||||||||||||||||||
| > 90 Days and still accruing |
— | — | — | — | — | — | — | — | — | — | ||||||||||||||||||||||||||||||
|
|
|
|
|
|
|
|
|
|
|
|
|
|
|
|
|
|
|
|
|
|||||||||||||||||||||
| Nonaccrual loans |
$ | 255 | $ | 7,736 | $ | 1,211 | $ | 718 | — | $ | 33 | $ | 2,930 | $ | 11 | — | $ | 12,894 | ||||||||||||||||||||||
|
|
|
|
|
|
|
|
|
|
|
|
|
|
|
|
|
|
|
|
|
|||||||||||||||||||||
The following table shows the ending balance of current, past due, and nonaccrual PNCI loans by loan category as of the date indicated:
| Analysis of Past Due and Nonaccrual PNCI Loans – As of December 31, 2016 | ||||||||||||||||||||||||||||||||||||||||
| RE Mortgage | Home Equity | Auto | Other | Construction | ||||||||||||||||||||||||||||||||||||
| (in thousands) | Resid. | Comm. | Lines | Loans | Indirect | Consum. | C&I | Resid. | Comm. | Total | ||||||||||||||||||||||||||||||
| PNCI loan balance: |
||||||||||||||||||||||||||||||||||||||||
| Past due: |
||||||||||||||||||||||||||||||||||||||||
| 30-59 Days |
$ | 1,510 | $ | 73 | $ | 274 | $ | 39 | — | — | — | — | — | $ | 1,896 | |||||||||||||||||||||||||
| 60-89 Days |
— | — | — | — | — | — | — | — | — | — | ||||||||||||||||||||||||||||||
| > 90 Days |
21 | 81 | 589 | 13 | — | — | — | — | — | 704 | ||||||||||||||||||||||||||||||
|
|
|
|
|
|
|
|
|
|
|
|
|
|
|
|
|
|
|
|
|
|||||||||||||||||||||
| Total past due |
$ | 1,531 | $ | 154 | $ | 863 | $ | 52 | — | — | — | — | — | $ | 2,600 | |||||||||||||||||||||||||
| Current |
77,404 | 249,883 | 20,902 | 3,566 | — | $ | 2,534 | $ | 12,321 | $ | 141 | $ | 8,871 | 375,622 | ||||||||||||||||||||||||||
|
|
|
|
|
|
|
|
|
|
|
|
|
|
|
|
|
|
|
|
|
|||||||||||||||||||||
| Total PNCI loans |
$ | 78,935 | $ | 250,037 | $ | 21,765 | $ | 3,618 | — | $ | 2,534 | $ | 12,321 | $ | 141 | $ | 8,871 | $ | 378,222 | |||||||||||||||||||||
|
|
|
|
|
|
|
|
|
|
|
|
|
|
|
|
|
|
|
|
|
|||||||||||||||||||||
| > 90 Days and still accruing |
— | — | — | — | — | — | — | — | — | — | ||||||||||||||||||||||||||||||
|
|
|
|
|
|
|
|
|
|
|
|
|
|
|
|
|
|
|
|
|
|||||||||||||||||||||
| Nonaccrual loans |
$ | 194 | $ | 1,826 | $ | 742 | $ | 67 | — | $ | 5 | — | — | — | $ | 2,834 | ||||||||||||||||||||||||
|
|
|
|
|
|
|
|
|
|
|
|
|
|
|
|
|
|
|
|
|
|||||||||||||||||||||
72
Table of Contents
Note 5 – Allowance for Loan Losses (continued)
The following table shows the ending balance of current, past due, and nonaccrual originated loans by loan category as of the date indicated:
| Analysis of Past Due and Nonaccrual Originated Loans – As of December 31, 2015 | ||||||||||||||||||||||||||||||||||||||||
| RE Mortgage | Home Equity | Auto | Other | Construction | ||||||||||||||||||||||||||||||||||||
| (in thousands) | Resid. | Comm. | Lines | Loans | Indirect | Consum. | C&I | Resid. | Comm. | Total | ||||||||||||||||||||||||||||||
| Originated loan balance: |
||||||||||||||||||||||||||||||||||||||||
| Past due: |
||||||||||||||||||||||||||||||||||||||||
| 30-59 Days |
$ | 791 | $ | 200 | $ | 1,033 | $ | 402 | — | $ | 12 | $ | 2,197 | — | — | $ | 4,635 | |||||||||||||||||||||||
| 60-89 Days |
— | 491 | 324 | 341 | — | 40 | — | — | — | 1,196 | ||||||||||||||||||||||||||||||
| > 90 Days |
271 | 3,425 | 520 | 82 | — | 19 | 24 | — | — | 4,341 | ||||||||||||||||||||||||||||||
|
|
|
|
|
|
|
|
|
|
|
|
|
|
|
|
|
|
|
|
|
|||||||||||||||||||||
| Total past due |
$ | 1,062 | $ | 4,116 | $ | 1,877 | $ | 825 | — | $ | 71 | $ | 2,221 | — | — | $ | 10,172 | |||||||||||||||||||||||
| Current |
206,523 | 1,159,527 | 283,542 | 33,892 | — | 28,927 | 168,099 | — | — | 1,978,573 | ||||||||||||||||||||||||||||||
|
|
|
|
|
|
|
|
|
|
|
|
|
|
|
|
|
|
|
|
|
|||||||||||||||||||||
| Total orig. loans |
$ | 207,585 | $ | 1,163,643 | $ | 285,419 | $ | 34,717 | — | $ | 28,998 | $ | 170,320 | $ | 31,778 | $ | 66,285 | $ | 1,988,745 | |||||||||||||||||||||
|
|
|
|
|
|
|
|
|
|
|
|
|
|
|
|
|
|
|
|
|
|||||||||||||||||||||
| > 90 Days and still accruing |
— | — | — | — | — | — | — | — | — | — | ||||||||||||||||||||||||||||||
|
|
|
|
|
|
|
|
|
|
|
|
|
|
|
|
|
|
|
|
|
|||||||||||||||||||||
| Nonaccrual loans |
$ | 3,045 | $ | 14,196 | $ | 3,379 | $ | 1,195 | — | $ | 21 | $ | 976 | $ | 12 | — | $ | 22,824 | ||||||||||||||||||||||
|
|
|
|
|
|
|
|
|
|
|
|
|
|
|
|
|
|
|
|
|
|||||||||||||||||||||
The following table shows the ending balance of current, past due, and nonaccrual PNCI loans by loan category as of the date indicated:
| Analysis of Past Due and Nonaccrual PNCI Loans – As of December 31, 2015 | ||||||||||||||||||||||||||||||||||||||||
| RE Mortgage | Home Equity | Auto | Other | Construction | ||||||||||||||||||||||||||||||||||||
| (in thousands) | Resid. | Comm. | Lines | Loans | Indirect | Consum. | C&I | Resid. | Comm. | Total | ||||||||||||||||||||||||||||||
| PNCI loan balance: |
||||||||||||||||||||||||||||||||||||||||
| Past due: |
||||||||||||||||||||||||||||||||||||||||
| 30-59 Days |
$ | 3,106 | $ | 4,037 | $ | 92 | $ | 23 | — | — | $ | 1 | — | — | $ | 7,259 | ||||||||||||||||||||||||
| 60-89 Days |
— | — | — | — | — | $ | 13 | — | — | — | 13 | |||||||||||||||||||||||||||||
| > 90 Days |
58 | 748 | 275 | 71 | — | 10 | — | — | $ | 490 | 1,652 | |||||||||||||||||||||||||||||
|
|
|
|
|
|
|
|
|
|
|
|
|
|
|
|
|
|
|
|
|
|||||||||||||||||||||
| Total past due |
$ | 3,164 | $ | 4,785 | $ | 367 | $ | 94 | — | $ | 23 | $ | 1 | — | $ | 490 | $ | 8,924 | ||||||||||||||||||||||
| Current |
101,371 | 306,079 | 28,968 | 3,924 | — | 3,344 | 19,743 | $ | 13,636 | 7,999 | 485,064 | |||||||||||||||||||||||||||||
|
|
|
|
|
|
|
|
|
|
|
|
|
|
|
|
|
|
|
|
|
|||||||||||||||||||||
| Total PNCI loans |
$ | 104,535 | $ | 310,864 | $ | 29,335 | $ | 4,018 | — | $ | 3,367 | $ | 19,744 | $ | 13,636 | $ | 8,489 | $ | 493,988 | |||||||||||||||||||||
|
|
|
|
|
|
|
|
|
|
|
|
|
|
|
|
|
|
|
|
|
|||||||||||||||||||||
| > 90 Days and still accruing |
— | — | — | — | — | — | — | — | — | — | ||||||||||||||||||||||||||||||
|
|
|
|
|
|
|
|
|
|
|
|
|
|
|
|
|
|
|
|
|
|||||||||||||||||||||
| Nonaccrual loans |
$ | 348 | $ | 3,742 | $ | 676 | $ | 109 | — | $ | 33 | — | — | $ | 490 | $ | 5,398 | |||||||||||||||||||||||
|
|
|
|
|
|
|
|
|
|
|
|
|
|
|
|
|
|
|
|
|
|||||||||||||||||||||
Impaired originated loans are those where management has concluded that it is probable that the borrower will be unable to pay all amounts due under the contractual terms. The following tables show the recorded investment (financial statement balance), unpaid principal balance, average recorded investment, and interest income recognized for impaired Originated and PNCI loans, segregated by those with no related allowance recorded and those with an allowance recorded for the periods indicated.
| Impaired Originated Loans – As of December 31, 2016 | ||||||||||||||||||||||||||||||||||||||||
| RE Mortgage | Home Equity | Auto | Other | Construction | ||||||||||||||||||||||||||||||||||||
| (in thousands) | Resid. | Comm. | Lines | Loans | Indirect | Consum. | C&I | Resid. | Comm. | Total | ||||||||||||||||||||||||||||||
| With no related allowance recorded: |
||||||||||||||||||||||||||||||||||||||||
| Recorded investment |
$ | 1,691 | $ | 13,144 | $ | 1,480 | $ | 598 | — | $ | 15 | $ | 762 | $ | 11 | — | $ | 17,701 | ||||||||||||||||||||||
|
|
|
|
|
|
|
|
|
|
|
|
|
|
|
|
|
|
|
|
|
|||||||||||||||||||||
| Unpaid principal |
$ | 1,699 | $ | 13,488 | $ | 1,561 | $ | 922 | — | $ | 29 | $ | 926 | $ | 16 | — | $ | 18,641 | ||||||||||||||||||||||
|
|
|
|
|
|
|
|
|
|
|
|
|
|
|
|
|
|
|
|
|
|||||||||||||||||||||
| Average recorded Investment |
$ | 2,788 | $ | 20,126 | $ | 2,221 | $ | 773 | $ | 1 | $ | 16 | $ | 669 | $ | 7 | — | $ | 26,601 | |||||||||||||||||||||
|
|
|
|
|
|
|
|
|
|
|
|
|
|
|
|
|
|
|
|
|
|||||||||||||||||||||
| Interest income Recognized |
$ | 83 | $ | 581 | $ | 40 | $ | 4 | — | $ | 1 | $ | 48 | — | — | $ | 757 | |||||||||||||||||||||||
|
|
|
|
|
|
|
|
|
|
|
|
|
|
|
|
|
|
|
|
|
|||||||||||||||||||||
| With an allowance recorded: |
||||||||||||||||||||||||||||||||||||||||
| Recorded investment |
$ | 1,372 | $ | 646 | $ | 430 | $ | 485 | — | $ | 18 | $ | 3,334 | — | — | $ | 6,285 | |||||||||||||||||||||||
|
|
|
|
|
|
|
|
|
|
|
|
|
|
|
|
|
|
|
|
|
|||||||||||||||||||||
| Unpaid principal |
$ | 1,372 | $ | 646 | $ | 440 | $ | 487 | — | $ | 19 | $ | 3,385 | — | — | $ | 6,349 | |||||||||||||||||||||||
|
|
|
|
|
|
|
|
|
|
|
|
|
|
|
|
|
|
|
|
|
|||||||||||||||||||||
| Related allowance |
$ | 170 | $ | 19 | $ | 110 | $ | 102 | — | $ | 13 | $ | 1,130 | — | — | $ | 1,544 | |||||||||||||||||||||||
|
|
|
|
|
|
|
|
|
|
|
|
|
|
|
|
|
|
|
|
|
|||||||||||||||||||||
| Average recorded Investment |
$ | 1,689 | $ | 1,032 | $ | 1,077 | $ | 579 | — | $ | 9 | $ | 2,714 | — | — | $ | 7,100 | |||||||||||||||||||||||
|
|
|
|
|
|
|
|
|
|
|
|
|
|
|
|
|
|
|
|
|
|||||||||||||||||||||
| Interest income Recognized |
$ | 56 | $ | 37 | $ | 9 | $ | 25 | — | $ | 2 | $ | 77 | — | — | $ | 206 | |||||||||||||||||||||||
|
|
|
|
|
|
|
|
|
|
|
|
|
|
|
|
|
|
|
|
|
|||||||||||||||||||||
73
Table of Contents
Note 5 – Allowance for Loan Losses (continued)
| Impaired PNCI Loans – As of December 31, 2016 | ||||||||||||||||||||||||||||||||||||||||
| RE Mortgage | Home Equity | Auto | Other | Construction | ||||||||||||||||||||||||||||||||||||
| (in thousands) | Resid. | Comm. | Lines | Loans | Indirect | Consum. | C&I | Resid. | Comm. | Total | ||||||||||||||||||||||||||||||
| With no related allowance recorded: |
||||||||||||||||||||||||||||||||||||||||
| Recorded investment |
$ | 463 | $ | 1,826 | $ | 735 | $ | 67 | — | $ | 3 | — | — | — | $ | 3,094 | ||||||||||||||||||||||||
|
|
|
|
|
|
|
|
|
|
|
|
|
|
|
|
|
|
|
|
|
|||||||||||||||||||||
| Unpaid principal |
$ | 486 | $ | 2,031 | $ | 746 | $ | 74 | — | $ | 4 | — | — | — | $ | 3,341 | ||||||||||||||||||||||||
|
|
|
|
|
|
|
|
|
|
|
|
|
|
|
|
|
|
|
|
|
|||||||||||||||||||||
| Average recorded Investment |
$ | 669 | $ | 1,479 | $ | 594 | $ | 69 | — | $ | 18 | $ | 1 | — | $ | 245 | $ | 3,075 | ||||||||||||||||||||||
|
|
|
|
|
|
|
|
|
|
|
|
|
|
|
|
|
|
|
|
|
|||||||||||||||||||||
| Interest income Recognized |
$ | 7 | — | $ | 9 | $ | 1 | — | — | — | — | — | $ | 17 | ||||||||||||||||||||||||||
|
|
|
|
|
|
|
|
|
|
|
|
|
|
|
|
|
|
|
|
|
|||||||||||||||||||||
| With an allowance recorded: |
||||||||||||||||||||||||||||||||||||||||
| Recorded investment |
$ | 259 | $ | 132 | $ | 551 | — | — | $ | 118 | — | — | — | $ | 1,060 | |||||||||||||||||||||||||
|
|
|
|
|
|
|
|
|
|
|
|
|
|
|
|
|
|
|
|
|
|||||||||||||||||||||
| Unpaid principal |
$ | 259 | $ | 132 | $ | 551 | — | — | $ | 118 | — | — | — | $ | 1,060 | |||||||||||||||||||||||||
|
|
|
|
|
|
|
|
|
|
|
|
|
|
|
|
|
|
|
|
|
|||||||||||||||||||||
| Related allowance |
$ | 79 | $ | 108 | $ | 300 | — | — | $ | 15 | — | — | — | $ | 502 | |||||||||||||||||||||||||
|
|
|
|
|
|
|
|
|
|
|
|
|
|
|
|
|
|
|
|
|
|||||||||||||||||||||
| Average recorded Investment |
$ | 130 | $ | 1,440 | $ | 579 | $ | 19 | — | $ | 176 | — | — | — | $ | 2,344 | ||||||||||||||||||||||||
|
|
|
|
|
|
|
|
|
|
|
|
|
|
|
|
|
|
|
|
|
|||||||||||||||||||||
| Interest income Recognized |
$ | 10 | $ | 7 | $ | 27 | — | — | $ | 5 | — | — | — | $ | 49 | |||||||||||||||||||||||||
|
|
|
|
|
|
|
|
|
|
|
|
|
|
|
|
|
|
|
|
|
|||||||||||||||||||||
| Impaired Originated Loans – As of December 31, 2015 | ||||||||||||||||||||||||||||||||||||||||
| RE Mortgage | Home Equity | Auto | Other | Construction | ||||||||||||||||||||||||||||||||||||
| (in thousands) | Resid. | Comm. | Lines | Loans | Indirect | Consum. | C&I | Resid. | Comm. | Total | ||||||||||||||||||||||||||||||
| With no related allowance recorded: |
||||||||||||||||||||||||||||||||||||||||
| Recorded investment |
$ | 3,886 | $ | 27,109 | $ | 2,963 | $ | 947 | — | $ | 20 | $ | 576 | $ | 4 | — | $ | 35,505 | ||||||||||||||||||||||
|
|
|
|
|
|
|
|
|
|
|
|
|
|
|
|
|
|
|
|
|
|||||||||||||||||||||
| Unpaid principal |
$ | 5,998 | $ | 29,678 | $ | 6,079 | $ | 1,349 | — | $ | 35 | $ | 688 | $ | 65 | — | $ | 43,892 | ||||||||||||||||||||||
|
|
|
|
|
|
|
|
|
|
|
|
|
|
|
|
|
|
|
|
|
|||||||||||||||||||||
| Average recorded Investment |
$ | 3,586 | $ | 32,793 | $ | 2,982 | $ | 848 | — | $ | 29 | $ | 494 | $ | 1,202 | $ | 50 | $ | 41,984 | |||||||||||||||||||||
|
|
|
|
|
|
|
|
|
|
|
|
|
|
|
|
|
|
|
|
|
|||||||||||||||||||||
| Interest income Recognized |
$ | 81 | $ | 893 | $ | 23 | $ | 5 | — | — | $ | 29 | — | — | $ | 1,031 | ||||||||||||||||||||||||
|
|
|
|
|
|
|
|
|
|
|
|
|
|
|
|
|
|
|
|
|
|||||||||||||||||||||
| With an allowance recorded: |
||||||||||||||||||||||||||||||||||||||||
| Recorded investment |
$ | 2,006 | $ | 1,418 | $ | 1,724 | $ | 674 | — | $ | 1 | $ | 2,094 | — | — | $ | 7,917 | |||||||||||||||||||||||
|
|
|
|
|
|
|
|
|
|
|
|
|
|
|
|
|
|
|
|
|
|||||||||||||||||||||
| Unpaid principal |
$ | 2,073 | $ | 1,453 | $ | 1,904 | $ | 701 | — | $ | 1 | $ | 2,117 | — | — | $ | 8,249 | |||||||||||||||||||||||
|
|
|
|
|
|
|
|
|
|
|
|
|
|
|
|
|
|
|
|
|
|||||||||||||||||||||
| Related allowance |
$ | 335 | $ | 146 | $ | 525 | $ | 256 | — | $ | 1 | $ | 1,187 | — | — | $ | 2,450 | |||||||||||||||||||||||
|
|
|
|
|
|
|
|
|
|
|
|
|
|
|
|
|
|
|
|
|
|||||||||||||||||||||
| Average recorded Investment |
$ | 2,365 | $ | 2,180 | $ | 2,455 | $ | 589 | — | $ | 23 | $ | 1,716 | $ | 141 | — | $ | 9,469 | ||||||||||||||||||||||
|
|
|
|
|
|
|
|
|
|
|
|
|
|
|
|
|
|
|
|
|
|||||||||||||||||||||
| Interest income Recognized |
$ | 49 | $ | 74 | $ | 31 | $ | 26 | — | — | $ | 122 | — | — | $ | 302 | ||||||||||||||||||||||||
|
|
|
|
|
|
|
|
|
|
|
|
|
|
|
|
|
|
|
|
|
|||||||||||||||||||||
| Impaired PNCI Loans – As of December 31, 2015 | ||||||||||||||||||||||||||||||||||||||||
| RE Mortgage | Home Equity | Auto | Other | Construction | ||||||||||||||||||||||||||||||||||||
| (in thousands) | Resid. | Comm. | Lines | Loans | Indirect | Consum. | C&I | Resid. | Comm. | Total | ||||||||||||||||||||||||||||||
| With no related allowance recorded: |
||||||||||||||||||||||||||||||||||||||||
| Recorded investment |
$ | 875 | $ | 1,132 | $ | 454 | $ | 71 | — | $ | 33 | $ | 1 | — | $ | 490 | $ | 3,056 | ||||||||||||||||||||||
|
|
|
|
|
|
|
|
|
|
|
|
|
|
|
|
|
|
|
|
|
|||||||||||||||||||||
| Unpaid principal |
$ | 908 | $ | 1,248 | $ | 505 | $ | 73 | — | $ | 52 | $ | 1 | — | $ | 490 | $ | 3,277 | ||||||||||||||||||||||
|
|
|
|
|
|
|
|
|
|
|
|
|
|
|
|
|
|
|
|
|
|||||||||||||||||||||
| Average recorded Investment |
$ | 609 | $ | 749 | $ | 400 | $ | 48 | — | $ | 35 | $ | 4 | — | $ | 245 | $ | 2,090 | ||||||||||||||||||||||
|
|
|
|
|
|
|
|
|
|
|
|
|
|
|
|
|
|
|
|
|
|||||||||||||||||||||
| Interest income Recognized |
$ | 31 | $ | 32 | $ | 3 | $ | 2 | — | $ | 1 | — | — | $ | 18 | $ | 87 | |||||||||||||||||||||||
|
|
|
|
|
|
|
|
|
|
|
|
|
|
|
|
|
|
|
|
|
|||||||||||||||||||||
| With an allowance recorded: |
||||||||||||||||||||||||||||||||||||||||
| Recorded investment |
— | $ | 2,748 | $ | 606 | $ | 39 | — | $ | 234 | — | — | — | $ | 3,627 | |||||||||||||||||||||||||
|
|
|
|
|
|
|
|
|
|
|
|
|
|
|
|
|
|
|
|
|
|||||||||||||||||||||
| Unpaid principal |
— | $ | 2,858 | $ | 612 | $ | 40 | — | $ | 234 | — | — | — | $ | 3,744 | |||||||||||||||||||||||||
|
|
|
|
|
|
|
|
|
|
|
|
|
|
|
|
|
|
|
|
|
|||||||||||||||||||||
| Related allowance |
— | $ | 248 | $ | 80 | $ | 39 | — | $ | 73 | — | — | — | $ | 440 | |||||||||||||||||||||||||
|
|
|
|
|
|
|
|
|
|
|
|
|
|
|
|
|
|
|
|
|
|||||||||||||||||||||
| Average recorded Investment |
$ | 417 | $ | 1,447 | $ | 521 | $ | 19 | — | $ | 227 | — | — | — | $ | 2,631 | ||||||||||||||||||||||||
|
|
|
|
|
|
|
|
|
|
|
|
|
|
|
|
|
|
|
|
|
|||||||||||||||||||||
| Interest income Recognized |
— | $ | 149 | $ | 14 | — | — | $ | 11 | — | — | — | $ | 174 | ||||||||||||||||||||||||||
|
|
|
|
|
|
|
|
|
|
|
|
|
|
|
|
|
|
|
|
|
|||||||||||||||||||||
74
Table of Contents
Note 5 – Allowance for Loan Losses (continued)
At December 31, 2016, $12,371,000 of Originated loans were TDRs and classified as impaired. The Company had obligations to lend $25,000 of additional funds on these TDRs as of December 31, 2016. At December 31, 2016, $1,324,000 of PNCI loans were TDRs and classified as impaired. The Company had no obligations to lend additional funds on these TDRs as of December 31, 2016.
At December 31, 2015, $29,269,000 of Originated loans were TDRs and classified as impaired. The Company had obligations to lend $35,000 of additional funds on these TDRs as of December 31, 2015. At December 31, 2015, $1,396,000 of PNCI loans were TDRs and classified as impaired. The Company had no obligations to lend additional funds on these TDRs as of December 31, 2015.
At December 31, 2014, $45,676,000 of Originated loans were TDRs and classified as impaired. The Company had obligations to lend $54,000 of additional funds on these TDRs as of December 31, 2014. At December 31, 2014, $1,307,000 of PNCI loans were TDRs and classified as impaired. The Company had no obligations to lend additional funds on these TDRs as of December 31, 2014.
The following tables show certain information regarding Troubled Debt Restructurings (TDRs) that occurred during the periods indicated:
| TDR Information for the Year Ended December 31, 2016 | ||||||||||||||||||||||||||||||||||||||||
| RE Mortgage | Home Equity | Auto | Other | Construction | ||||||||||||||||||||||||||||||||||||
| (dollars in thousands) | Resid. | Comm. | Lines | Loans | Indirect | Consum. | C&I | Resid. | Comm. | Total | ||||||||||||||||||||||||||||||
| Number |
3 | 5 | 9 | 1 | — | 2 | 4 | — | — | 24 | ||||||||||||||||||||||||||||||
| Pre-mod outstanding principal balance |
$ | 650 | $ | 423 | $ | 707 | $ | 105 | — | $ | 27 | $ | 77 | — | — | $ | 1,989 | |||||||||||||||||||||||
| Post-mod outstanding principal balance |
$ | 656 | $ | 461 | $ | 709 | $ | 105 | — | $ | 27 | $ | 77 | — | — | $ | 2,035 | |||||||||||||||||||||||
| Financial impact due to TDR taken as additional provision |
$ | 50 | $ | 46 | $ | 205 | — | — | $ | 2 | $ | 23 | — | — | $ | 326 | ||||||||||||||||||||||||
| Number that defaulted during the period |
2 | — | 1 | — | — | — | — | — | — | 3 | ||||||||||||||||||||||||||||||
| Recorded investment of TDRs that defaulted during the period |
$ | 101 | — | $ | 229 | — | — | — | — | — | — | $ | 330 | |||||||||||||||||||||||||||
| Financial impact due to the default of previous TDR taken as charge-offs or additional provisions |
— | — | — | — | — | — | — | — | — | — | ||||||||||||||||||||||||||||||
| TDR Information for the Year Ended December 31, 2015 | ||||||||||||||||||||||||||||||||||||||||
| RE Mortgage | Home Equity | Auto | Other | Construction | ||||||||||||||||||||||||||||||||||||
| (dollars in thousands) | Resid. | Comm. | Lines | Loans | Indirect | Consum. | C&I | Resid. | Comm. | Total | ||||||||||||||||||||||||||||||
| Number |
4 | 5 | 2 | 2 | — | 2 | 8 | — | — | 23 | ||||||||||||||||||||||||||||||
| Pre-mod outstanding principal balance |
$ | 800 | $ | 1,518 | $ | 301 | $ | 315 | — | $ | 89 | $ | 956 | — | — | $ | 3,979 | |||||||||||||||||||||||
| Post-mod outstanding principal balance |
$ | 801 | $ | 1,517 | $ | 301 | $ | 321 | — | $ | 89 | $ | 944 | — | — | $ | 3,973 | |||||||||||||||||||||||
| Financial impact due to TDR taken as additional provision |
$ | 8 | $ | (5 | ) | — | $ | 38 | — | $ | 5 | $ | 405 | — | — | $ | 451 | |||||||||||||||||||||||
| Number that defaulted during the period |
4 | 2 | 3 | 1 | — | — | — | — | — | 10 | ||||||||||||||||||||||||||||||
| Recorded investment of TDRs that defaulted during the period |
$ | 221 | $ | 280 | $ | 182 | $ | 53 | — | — | — | — | — | $ | 736 | |||||||||||||||||||||||||
| Financial impact due to the default of previous TDR taken as charge-offs or additional provisions |
— | — | — | $ | (9 | ) | — | — | — | — | — | $ | (9 | ) | ||||||||||||||||||||||||||
Modifications classified as Troubled Debt Restructurings can include one or a combination of the following: rate modifications, term extensions, interest only modifications, either temporary or long-term, payment modifications, and collateral substitutions/additions.
75
Table of Contents
Note 5 – Allowance for Loan Losses (continued)
For all new Troubled Debt Restructurings, an impairment analysis is conducted. If the loan is determined to be collateral dependent, any additional amount of impairment will be calculated based on the difference between estimated collectible value and the current carrying balance of the loan. This difference could result in an increased provision and is typically charged off. If the asset is determined not to be collateral dependent, the impairment is measured on the net present value difference between the expected cash flows of the restructured loan and the cash flows which would have been received under the original terms. The effect of this could result in a requirement for additional provision to the reserve. The effect of these required provisions for the period are indicated above.
Typically if a TDR defaults during the period, the loan is then considered collateral dependent and, if it was not already considered collateral dependent, an appropriate provision will be reserved or charge will be taken. The additional provisions required resulting from default of previously modified TDR’s are noted above.
Note 6 – Foreclosed Assets
A summary of the activity in the balance of foreclosed assets follows (dollars in thousands):
| Year ended December 31, 2016 | Year ended December 31, 2015 | |||||||||||||||||||||||
| Noncovered | Covered | Total | Noncovered | Covered | Total | |||||||||||||||||||
| Beginning balance, net |
$ | 5,369 | — | $ | 5,369 | $ | 4,449 | $ | 445 | $ | 4,894 | |||||||||||||
| Additions/transfers from loans |
2,282 | $ | 223 | 2,505 | 5,880 | (445 | ) | 5,435 | ||||||||||||||||
| Dispositions/sales |
(3,748 | ) | — | (3,748 | ) | (4,458 | ) | — | (4,458 | ) | ||||||||||||||
| Valuation adjustments |
(140 | ) | — | (140 | ) | (502 | ) | — | (502 | ) | ||||||||||||||
|
|
|
|
|
|
|
|
|
|
|
|
|
|||||||||||||
| Ending balance, net |
$ | 3,763 | $ | 223 | $ | 3,986 | $ | 5,369 | — | $ | 5,369 | |||||||||||||
|
|
|
|
|
|
|
|
|
|
|
|
|
|||||||||||||
| Ending valuation allowance |
$ | (314 | ) | — | $ | (314 | ) | $ | (572 | ) | — | $ | (572 | ) | ||||||||||
|
|
|
|
|
|
|
|
|
|
|
|
|
|||||||||||||
| Ending number of foreclosed assets |
14 | 1 | 15 | 26 | — | 26 | ||||||||||||||||||
|
|
|
|
|
|
|
|
|
|
|
|
|
|||||||||||||
| Proceeds from sale of foreclosed assets |
$ | 4,010 | — | $ | 4,010 | $ | 5,449 | — | $ | 5,449 | ||||||||||||||
|
|
|
|
|
|
|
|
|
|
|
|
|
|||||||||||||
| Gain on sale of foreclosed assets |
$ | 262 | — | $ | 262 | $ | 991 | — | $ | 991 | ||||||||||||||
|
|
|
|
|
|
|
|
|
|
|
|
|
|||||||||||||
At December 31, 2016, the balance of real estate owned includes $1,750,000 of foreclosed residential real estate properties recorded as a result of obtaining physical possession of the property. At December 31, 2016, the recorded investment of consumer mortgage loans secured by residential real estate properties for which formal foreclosure proceedings are underway is $301,000.
Note 7 – Premises and Equipment
Premises and equipment were comprised of:
| December 31, | December 31, | |||||||
| 2016 | 2015 | |||||||
| (In thousands) | ||||||||
| Land & land improvements |
$ | 9,522 | $ | 8,909 | ||||
| Buildings |
42,345 | 38,643 | ||||||
| Furniture and equipment |
31,428 | 31,081 | ||||||
|
|
|
|
|
|||||
| 83,295 | 78,633 | |||||||
| Less: Accumulated depreciation |
(37,412 | ) | (35,518 | ) | ||||
|
|
|
|
|
|||||
| 45,883 | 43,115 | |||||||
| Construction in progress |
2,523 | 696 | ||||||
|
|
|
|
|
|||||
| Total premises and equipment |
$ | 48,406 | $ | 43,811 | ||||
|
|
|
|
|
|||||
Depreciation expense for premises and equipment amounted to $5,314,000, $5,043,000, and$4,648,000 in 2016, 2015, and 2014, respectively.
76
Table of Contents
Note 8 – Cash Value of Life Insurance
A summary of the activity in the balance of cash value of life insurance follows (dollars in thousands):
| Year ended December 31, | ||||||||
| 2016 | 2015 | |||||||
| Beginning balance |
$ | 94,560 | $ | 92,337 | ||||
| Increase in cash value of life insurance |
2,717 | 2,786 | ||||||
| Death benefit receivable in excess of cash value |
238 | 155 | ||||||
| Death benefit receivable |
(1,603 | ) | (718 | ) | ||||
|
|
|
|
|
|||||
| Ending balance |
$ | 95,912 | $ | 94,560 | ||||
|
|
|
|
|
|||||
| End of period death benefit |
$ | 165,669 | $ | 166,299 | ||||
| Number of policies owned |
185 | 187 | ||||||
| Insurance companies used |
14 | 14 | ||||||
| Current and former employees and directors covered |
58 | 59 | ||||||
As of December 31, 2016, the Bank was the owner and beneficiary of 185 life insurance policies, issued by 14 life insurance companies, covering 58 current and former employees and directors. These life insurance policies are recorded on the Company’s financial statements at their reported cash (surrender) values. As a result of current tax law and the nature of these policies, the Bank records any increase in cash value of these policies as nontaxable noninterest income. If the Bank decided to surrender any of the policies prior to the death of the insured, such surrender may result in a tax expense related to the life-to-date cumulative increase in cash value of the policy. If the Bank retains such policies until the death of the insured, the Bank would receive nontaxable proceeds from the insurance company equal to the death benefit of the policies. The Bank has entered into Joint Beneficiary Agreements (JBAs) with certain of the insured that for certain of the policies provide some level of sharing of the death benefit, less the cash surrender value, among the Bank and the beneficiaries of the insured upon the receipt of death benefits. See Note 15 of these consolidated financial statements for additional information on JBAs.
Note 9 – Goodwill and Other Intangible Assets
The following table summarizes the Company’s goodwill intangible as of the dates indicated:
| December 31, | December 31, | |||||||||||||||
| (Dollar in Thousands) | 2016 | Additions | Reductions | 2015 | ||||||||||||
| Goodwill |
$ | 64,311 | $ | 849 | — | $ | 63,462 | |||||||||
|
|
|
|
|
|
|
|
|
|||||||||
The following table summarizes the Company’s core deposit intangibles as of the dates indicated:
| December 31, | Reductions/ | Fully | December 31, | |||||||||||||||||
| (Dollar in Thousands) | 2016 | Additions | Amortization | Depreciated | 2015 | |||||||||||||||
| Core deposit intangibles |
$ | 10,120 | $ | 2,046 | — | — | $ | 8,074 | ||||||||||||
| Accumulated amortization |
(3,557 | ) | — | $ | (1,377 | ) | — | (2,180 | ) | |||||||||||
|
|
|
|
|
|
|
|
|
|
|
|||||||||||
| Core deposit intangibles, net |
$ | 6,563 | $ | 2,046 | $ | (1,377 | ) | — | $ | 5,894 | ||||||||||
|
|
|
|
|
|
|
|
|
|
|
|||||||||||
The Company recorded additions to its CDI of $2,046,000 in conjunction with the acquisition of three branch offices from Bank of America on March 18, 2016, $6,614,000 in conjunction with the North Valley Bancorp acquisition on October 3, 2014, $898,000 in conjunction with the Citizens acquisition on September 23, 2011, and $562,000 in conjunction with the Granite acquisition on May 28, 2010. The following table summarizes the Company’s estimated core deposit intangible amortization (dollars in thousands):
| Estimated Core Deposit | ||||
| Years Ended |
Intangible Amortization | |||
| 2017 |
$ | 1,389 | ||
| 2018 |
1,324 | |||
| 2019 |
1,228 | |||
| 2020 |
1,228 | |||
| 2021 |
969 | |||
| Thereafter |
425 | |||
77
Table of Contents
Note 10 – Mortgage Servicing Rights
The following tables summarize the activity in, and the main assumptions we used to determine the fair value of mortgage servicing rights for the periods indicated (dollars in thousands):
| Years ended December 31, | ||||||||||||
| 2016 | 2015 | 2014 | ||||||||||
| Balance at beginning of period |
$ | 7,618 | $ | 7,378 | $ | 6,165 | ||||||
| Acquisition |
— | — | 1,944 | |||||||||
| Originations |
1,161 | 941 | 570 | |||||||||
| Change in fair value |
(2,184 | ) | (701 | ) | (1,301 | ) | ||||||
|
|
|
|
|
|
|
|||||||
| Balance at end of period |
$ | 6,595 | $ | 7,618 | $ | 7,378 | ||||||
|
|
|
|
|
|
|
|||||||
| Contractually specified servicing fees, late fees and ancillary fees earned |
$ | 2,065 | $ | 2,164 | $ | 1,869 | ||||||
| Balance of loans serviced at: |
||||||||||||
| Beginning of period |
$ | 817,917 | $ | 840,288 | $ | 680,197 | ||||||
| End of period |
$ | 816,623 | $ | 817,917 | $ | 840,288 | ||||||
| Weighted-average prepayment speed (CPR) |
8.8 | % | 9.8 | % | 12.0 | % | ||||||
| Weighted-average discount rate |
14.0 | % | 10.0 | % | 10.0 | % | ||||||
The changes in fair value of MSRs that occurred during 2016 were mainly due to changes in principal balances, changes in mortgage prepayment speeds, and changes in investor required rate of return, or discount rate, of the MSRs. The changes in fair value of MSRs that occurred during 2015 and 2014 were mainly due to changes in principal balances and changes in estimate life of the MSRs.
Note 11 – Indemnification Asset
A summary of the activity in the balance of indemnification asset (liability) included in other assets is follows (in thousands):
| Year ended December 31, | ||||||||||||
| 2016 | 2015 | 2014 | ||||||||||
| Beginning balance |
$ | (521 | ) | $ | (349 | ) | $ | 206 | ||||
| Effect of actual covered losses (recoveries) and increase (decrease) in estimated future covered losses |
(412 | ) | (93 | ) | (853 | ) | ||||||
| Change in estimated “true up” liability |
(86 | ) | (71 | ) | (100 | ) | ||||||
| Reimbursable (revenue) expenses, net |
2 | 4 | 85 | |||||||||
| Payments made (received) |
273 | (12 | ) | 313 | ||||||||
|
|
|
|
|
|
|
|||||||
| Ending balance |
$ | (744 | ) | $ | (521 | ) | $ | (349 | ) | |||
|
|
|
|
|
|
|
|||||||
| Amount of indemnification asset (liability) recorded in other assets |
$ | (60 | ) | $ | 77 | $ | (349 | ) | ||||
| Amount of indemnification liability recorded in other liabilities |
(684 | ) | (598 | ) | — | |||||||
|
|
|
|
|
|
|
|||||||
| Ending balance |
$ | (744 | ) | $ | (521 | ) | $ | (349 | ) | |||
|
|
|
|
|
|
|
|||||||
Note 12 – Other Assets
Other assets were comprised of (in thousands):
| As of December 31, | ||||||||
| 2016 | 2015 | |||||||
| Deferred tax asset, net (Note 22) |
$ | 36,199 | $ | 36,440 | ||||
| Prepaid expense |
3,045 | 3,062 | ||||||
| Software |
2,039 | 1,290 | ||||||
| Advanced compensation |
249 | 673 | ||||||
| Capital Trusts |
1,702 | 1,696 | ||||||
| Investment in Low Housing Tax Credit Funds |
18,465 | 4,223 | ||||||
| Life insurance proceeds receivable |
2,120 | — | ||||||
| Prepaid Taxes |
6,460 | — | ||||||
| Premises held for sale |
2,896 | — | ||||||
| Miscellaneous other assets |
1,568 | 1,207 | ||||||
|
|
|
|
|
|||||
| Total other assets |
$ | 74,743 | $ | 48,591 | ||||
|
|
|
|
|
|||||
78
Table of Contents
Note 13 – Deposits
A summary of the balances of deposits follows (in thousands):
| December 31, | ||||||||
| 2016 | 2015 | |||||||
| Noninterest-bearing demand |
$ | 1,275,745 | $ | 1,155,695 | ||||
| Interest-bearing demand |
887,625 | 853,961 | ||||||
| Savings |
1,397,036 | 1,281,540 | ||||||
| Time certificates, over $250,000 |
75,184 | 74,647 | ||||||
| Other time certificates |
259,970 | 265,423 | ||||||
|
|
|
|
|
|||||
| Total deposits |
$ | 3,895,560 | $ | 3,631,266 | ||||
|
|
|
|
|
|||||
Certificate of deposit balances of $50,000,000 from the State of California were included in time certificates over $250,000 at December 31, 2016 and 2015. The Bank participates in a deposit program offered by the State of California whereby the State may make deposits at the Bank’s request subject to collateral and credit worthiness constraints. The negotiated rates on these State deposits are generally more favorable than other wholesale funding sources available to the Bank. Overdrawn deposit balances of $1,191,000 and $796,000 were classified as consumer loans at December 31, 2016 and 2015, respectively.
At December 31, 2016, the scheduled maturities of time deposits were as follows (in thousands):
| Scheduled | ||||
| Maturities | ||||
| 2017 |
$ | 279,015 | ||
| 2018 |
26,097 | |||
| 2019 |
9,277 | |||
| 2020 |
10,611 | |||
| 2021 |
10,135 | |||
| Thereafter |
19 | |||
|
|
|
|||
| Total |
$ | 335,154 | ||
|
|
|
|||
Note 14 – Reserve for Unfunded Commitments
The following tables summarize the activity in reserve for unfunded commitments for the periods indicated (dollars in thousands):
| Years ended December 31, | ||||||||||||
| 2016 | 2015 | 2014 | ||||||||||
| Balance at beginning of period |
$ | 2,475 | $ | 2,145 | $ | 2,415 | ||||||
| Acquisitions |
— | — | 125 | |||||||||
| Provision for losses – |
||||||||||||
| Unfunded commitments |
244 | 330 | (395 | ) | ||||||||
|
|
|
|
|
|
|
|||||||
| Balance at end of period |
$ | 2,719 | $ | 2,475 | $ | 2,145 | ||||||
|
|
|
|
|
|
|
|||||||
Note 15 – Other Liabilities
Other liabilities were comprised of (in thousands):
| December 31, | ||||||||
| 2016 | 2015 | |||||||
| Deferred compensation |
$ | 6,525 | $ | 6,725 | ||||
| Pension liability |
26,645 | 26,182 | ||||||
| Joint beneficiary agreements |
3,007 | 2,529 | ||||||
| Low income housing tax credit fund commitments |
15,176 | 3,330 | ||||||
| Accrued salaries and benefits expense |
5,704 | 3,851 | ||||||
| Loan escrow and servicing payable |
2,146 | 2,037 | ||||||
| Deferred revenue |
726 | 1,082 | ||||||
| Unsettled investment security purchases |
— | 17,072 | ||||||
| Litigation contingency |
1,450 | — | ||||||
| Miscellaneous other liabilities |
5,985 | 2,485 | ||||||
|
|
|
|
|
|||||
| Total other liabilities |
$ | 67,364 | $ | 65,293 | ||||
|
|
|
|
|
|||||
79
Table of Contents
Note 16 – Other Borrowings
A summary of the balances of other borrowings follows:
| December 31, | ||||||||
| 2016 | 2015 | |||||||
| (in thousands) | ||||||||
| Other collateralized borrowings, fixed rate, as of December 31, 2016 of 0.05%, payable on January 2, 2017 |
$ | 17,493 | $ | 12,328 | ||||
|
|
|
|
|
|||||
| Total other borrowings |
$ | 17,493 | $ | 12,328 | ||||
|
|
|
|
|
|||||
The Company did not enter into any other borrowings or repurchase agreements during 2016 or 2015.
The Company had $17,493,000 and $12,328,000 of other collateralized borrowings at December 31, 2016 and 2015, respectively. Other collateralized borrowings are generally overnight maturity borrowings from non-financial institutions that are collateralized by securities owned by the Company. As of December 31, 2016, the Company has pledged as collateral and sold under agreements to repurchase investment securities with fair value of $37,723,000 under these other collateralized borrowings.
The Company maintains a collateralized line of credit with the Federal Home Loan Bank of San Francisco. Based on the FHLB stock requirements at December 31, 2016, this line provided for maximum borrowings of $1,304,136,000 of which none was outstanding, leaving $1,304,136,000 available. As of December 31, 2016, the Company had designated investment securities with a fair value of $78,985,000 and loans totaling $1,884,580,000 as potential collateral under this collateralized line of credit with the FHLB.
The Company maintains a collateralized line of credit with the Federal Reserve Bank of San Francisco. As of December 31, 2016, this line provided for maximum borrowings of $133,655,000 of which none was outstanding, leaving $133,655,000 available. As of December 31, 2016, the Company has designated investment securities with fair value of $47,000 and loans totaling $228,542,000 as potential collateral under this collateralized line of credit with the FRB.
The Company has available unused correspondent banking lines of credit from commercial banks totaling $20,000,000 for federal funds transactions at December 31, 2016.
Note 17 – Junior Subordinated Debt
At December 31, 2016, the Company had five wholly-owned subsidiary business trusts that had issued $62.9 million of trust preferred securities (the “Capital Trusts”). Trust preferred securities accrue and pay distributions periodically at specified annual rates as provided in the indentures. The trusts used the net proceeds from the offering to purchase a like amount of subordinated debentures (the “Debentures”) of the Company. The Debentures are the sole assets of the trusts. The Company’s obligations under the subordinated debentures and related documents, taken together, constitute a full and unconditional guarantee by the Company of the obligations of the trusts. The trust preferred securities are mandatorily redeemable upon the maturity of the Debentures, or upon earlier redemption as provided in the indentures. The Company has the right to redeem the Debentures in whole (but not in part) on or after specific dates, at a redemption price specified in the indentures plus any accrued but unpaid interest to the redemption date. The Company also has a right to defer consecutive payments of interest on the debentures for up to five years.
The Company organized two of the Capital Trusts. The Company acquired its three other Capital Trusts and assumed their related Debentures as a result of its acquisition of North Valley Bancorp. At the acquisition date of October 3, 2014, the Debentures associated with North Valley Bancorp’s three Capital Trusts were recorded on the Company’s books at their fair values of $5,006,000, $3,918,000, and $6,063,000, respectively. The related fair value discounts to face value of these Debentures will be amortized over the remaining time to maturity for each of these Debentures using the effective interest method. Similar, and proportional, discounts were applied to the acquired common stock interests in each of the acquired Capital Trusts and these discounts will be proportionally amortized over the remaining time to maturity for each related debenture.
The recorded book values of the Debentures issued by the Capital Trusts are reflected as junior subordinated debt in the Company’s consolidated balance sheets. The common stock issued by the Capital Trusts and owned by the Company is recorded in other assets in the Company’s consolidated balance sheets. The recorded book value of the debentures issued by the Capital Trusts, less the recorded book value of the common stock of the Capital Trusts owned by the Company, continues to qualify as Tier 1 or Tier 2 capital under interim guidance issued by the Board of Governors of the Federal Reserve System.
80
Table of Contents
Note 17 – Junior Subordinated Debt (continued)
The following table summarizes the terms and recorded balance of each subordinated debenture as of the date indicated (dollars in thousands):
| Subordinated Debt Series |
Maturity Date |
Face Value |
Coupon Rate | As of December 31, 2016 | ||||||||||||||||
| (Variable) | Current | Recorded | ||||||||||||||||||
| 3 mo. LIBOR + | Coupon Rate | Book Value | ||||||||||||||||||
| TriCo Cap Trust I |
10/7/2033 | $ | 20,619 | 3.05 | % | 3.93 | % | $ | 20,619 | |||||||||||
| TriCo Cap Trust II |
7/23/2034 | 20,619 | 2.55 | % | 3.43 | % | 20,619 | |||||||||||||
| North Valley Trust II |
4/24/2033 | 6,186 | 3.25 | % | 4.14 | % | 5,095 | |||||||||||||
| North Valley Trust III |
4/24/2034 | 5,155 | 2.80 | % | 3.68 | % | 4,005 | |||||||||||||
| North Valley Trust IV |
3/15/2036 | 10,310 | 1.33 | % | 2.29 | % | 6,329 | |||||||||||||
|
|
|
|
|
|||||||||||||||||
| $ | 62,889 | $ | 56,667 | |||||||||||||||||
|
|
|
|
|
|||||||||||||||||
Note 18 – Commitments and Contingencies
Restricted Cash Balances—Reserves (in the form of deposits with the San Francisco Federal Reserve Bank) of $78,183,000 and $70,660,000 were maintained to satisfy Federal regulatory requirements at December 31, 2016 and 2015. These reserves are included in cash and due from banks in the accompanying consolidated balance sheets.
Lease Commitments—The Company leases 44 sites under non-cancelable operating leases. The leases contain various provisions for increases in rental rates, based either on changes in the published Consumer Price Index or a predetermined escalation schedule. Substantially all of the leases provide the Company with the option to extend the lease term one or more times following expiration of the initial term. The Company currently does not have any capital leases. At December 31, 2016, future minimum commitments under non-cancelable operating leases with initial or remaining terms of one year or more are as follows:
| Operating Leases | ||||
| (in thousands) | ||||
| 2017 |
$ | 3,320 | ||
| 2018 |
2,523 | |||
| 2019 |
1,924 | |||
| 2020 |
1,325 | |||
| 2021 |
963 | |||
| Thereafter |
1,696 | |||
|
|
|
|||
| Future minimum lease payments |
$ | 11,751 | ||
|
|
|
|||
Rent expense under operating leases was $6,082,000 in 2016, $6,241,000 in 2015, and $4,786,000 in 2014. Rent expense was offset by rent income of $220,000 in 2016, $217,000 in 2015, and $225,000 in 2014.
Financial Instruments with Off-Balance-Sheet Risk—The Company is a party to financial instruments with off-balance sheet risk in the normal course of business to meet the financing needs of its customers. These financial instruments include commitments to extend credit, standby letters of credit, and deposit account overdraft privilege. Those instruments involve, to varying degrees, elements of risk in excess of the amount recognized in the balance sheet. The contract amounts of those instruments reflect the extent of involvement the Company has in particular classes of financial instruments.
The Company’s exposure to loss in the event of nonperformance by the other party to the financial instrument for commitments to extend credit and standby letters of credit written is represented by the contractual amount of those instruments. The Company uses the same credit policies in making commitments and conditional obligations as it does for on-balance sheet instruments. The Company’s exposure to loss in the event of nonperformance by the other party to the financial instrument for deposit account overdraft privilege is represented by the overdraft privilege amount disclosed to the deposit account holder.
81
Table of Contents
Note 18 – Commitments and Contingencies (continued)
The following table presents a summary of the Bank’s commitments and contingent liabilities:
| December 31, | December 31, | |||||||
| (in thousands) | 2016 | 2015 | ||||||
| Financial instruments whose amounts represent risk: |
||||||||
| Commitments to extend credit: |
||||||||
| Commercial loans |
$ | 220,836 | $ | 196,399 | ||||
| Consumer loans |
406,855 | 394,278 | ||||||
| Real estate mortgage loans |
42,184 | 42,793 | ||||||
| Real estate construction loans |
97,399 | 71,846 | ||||||
| Standby letters of credit |
12,763 | 8,330 | ||||||
| Deposit account overdraft privilege |
98,583 | 94,473 | ||||||
Commitments to extend credit are agreements to lend to a customer as long as there is no violation of any condition established in the contract. Commitments generally have fixed expiration dates of one year or less or other termination clauses and may require payment of a fee. Since many of the commitments are expected to expire without being drawn upon, the total commitment amounts do not necessarily represent future cash requirements. The Company evaluates each customer’s credit worthiness on a case-by-case basis. The amount of collateral obtained, if deemed necessary by the Company upon extension of credit, is based on Management’s credit evaluation of the customer. Collateral held varies, but may include accounts receivable, inventory, property, plant and equipment, residential properties, and income-producing commercial properties.
Standby letters of credit are conditional commitments issued by the Company to guarantee the performance of a customer to a third party. Those guarantees are primarily issued to support private borrowing arrangements. Most standby letters of credit are issued for one year or less. The credit risk involved in issuing letters of credit is essentially the same as that involved in extending loan facilities to customers. Collateral requirements vary, but in general follow the requirements for other loan facilities.
Deposit account overdraft privilege amount represents the unused overdraft privilege balance available to the Company’s deposit account holders who have deposit accounts covered by an overdraft privilege. The Company has established an overdraft privilege for certain of its deposit account products whereby all holders of such accounts who bring their accounts to a positive balance at least once every thirty days receive the overdraft privilege. The overdraft privilege allows depositors to overdraft their deposit account up to a predetermined level. The predetermined overdraft limit is set by the Company based on account type.
Legal Proceedings — On September 15, 2014, a former Personal Banker at one of the Bank’s in-store branches filed a Class Action Complaint against the Bank in Butte County Superior Court, alleging causes of action related to the observance of meal and rest periods and seeking to represent a class of current and former branch employees with the same or similar job duties, employed by the Bank within the State of California during the preceding four years. On or about June 25, 2015, Plaintiff filed an Amended Complaint expanding the class definition to include all current and former non-exempt branch employees employed by the Bank within the State of California at any time during the period of September 15, 2010 to the entry of judgment. The Bank responded to the First Amended Complaint by denying the charges and the parties engaged in written discovery. The parties then engaged in non-binding mediation during the third quarter of 2016.
In addition to this, on January 20, 2015, a then-current Personal Banker at one of the Bank’s in-store branches filed a First Amended Complaint against the Bank and the Company in Sacramento County Superior Court, alleging causes of action related to wage statement violations. As part of the Complaint Plaintiff is seeking to represent a class of current and former exempt and non-exempt employees who worked for the Company and/or the Bank during the time period of December 12, 2013 to October 21, 2016. The Company and the Bank responded to the First Amended Complaint by denying the charges and engaging in written discovery with Plaintiff. The parties then engaged in non-binding mediation of the action during the third quarter of 2016 as well.
As part of the mediations, which took place concurrently, the Bank agreed in principal to settle the two matters. In connection with the settlement and in consideration of a full release of all claims raised in both the actions, the Bank has agreed to pay up to $1.9 million though the actual cost of the settlement will depend on the number of claims submitted by the members of the purported classes. As a result, the Bank estimates the actual cost of the settlement may be approximately $1,450,000, and recorded such estimate. The settlement is subject to customary conditions, including court approval following notice to the members of the purported classes. Provided the parties can agree on the language to be included in the settlement agreement and then enter into a stipulation regarding the settlement, court hearings will be scheduled where the court will consider the terms of the settlement. But it should be noted there are no assurances the court will approve the settlement even if the parties enter into such a stipulation.
Neither the Company nor its subsidiaries are a party to any other pending legal proceedings that are material, nor is their property the subject of any other material pending legal proceeding at this time. All other legal proceedings are routine and arise out of the ordinary course of the Bank’s business. None of those proceedings are currently expected to have a material adverse impact upon the Company’s and the Bank’s business, their consolidated financial position nor their operations in any material amount not already accrued, after taking into consideration any applicable insurance.
82
Table of Contents
Note 18 – Commitments and Contingencies (continued)
Other Commitments and Contingencies—The Company has entered into employment agreements or change of control agreements with certain officers of the Company providing severance payments and accelerated vesting of benefits under supplemental retirement agreements to the officers in the event of a change in control of the Company and termination for other than cause or after a substantial and material change in the officer’s title, compensation or responsibilities.
The Bank owns 13,396 shares of Class B common stock of Visa Inc. which are convertible into Class A common stock at a conversion ratio of 1.648265 per Class B share. As of December 31, 2016, the value of the Class A shares was $78.02 per share. Utilizing the conversion ratio, the value of unredeemed Class A equivalent shares owned by the Bank was $1,723,000 as of December 31, 2016, and has not been reflected in the accompanying financial statements. The shares of Visa Class B common stock are restricted and may not be transferred. Visa Member Banks are required to fund an escrow account to cover settlements, resolution of pending litigation and related claims. If the funds in the escrow account are insufficient to settle all the covered litigation, Visa may sell additional Class A shares, use the proceeds to settle litigation, and further reduce the conversion ratio. If funds remain in the escrow account after all litigation is settled, the Class B conversion ratio will be increased to reflect that surplus.
Mortgage loans sold to investors may be sold with servicing rights retained, with only the standard legal representations and warranties regarding recourse to the Bank. Management believes that any liabilities that may result from such recourse provisions are not significant.
Note 19 – Shareholders’ Equity
Dividends Paid
The Bank paid to the Company cash dividends in the aggregate amounts of $16,758,000, $13,304,000, and $8,270,000 in 2016, 2015, and 2014, respectively. The Bank is regulated by the Federal Deposit Insurance Corporation (FDIC) and the State of California Department of Business Oversight. Absent approval from the Commissioner of the Department of Business Oversight, California banking laws generally limit the Bank’s ability to pay dividends to the lesser of (1) retained earnings or (2) net income for the last three fiscal years, less cash distributions paid during such period. Under this law, at December 31, 2016, the Bank could have paid dividends of $82,615,000 to the Company without the approval of the Commissioner of the Department of Business Oversight,
Stock Repurchase Plan
On August 21, 2007, the Board of Directors adopted a plan to repurchase, as conditions warrant, up to 500,000 shares of the Company’s common stock on the open market. The timing of purchases and the exact number of shares to be purchased will depend on market conditions. The 500,000 shares authorized for repurchase under this stock repurchase plan represented approximately 3.2% of the Company’s 15,814,662 outstanding common shares as of August 21, 2007. This stock repurchase plan has no expiration date. As of December 31, 2016, the Company had repurchased 166,600 shares under this plan.
Stock Repurchased Under Equity Compensation Plans
During the years ended December 31, 2016, 2015, and 2014, employees tendered 264,800, 106,355, and 103,268 of the Company’s common stock with market value of $7,879,000, $2,868,000, and $2,551,000, respectively, in lieu of cash to exercise options to purchase shares of the Company’s stock and to pay income taxes related to such exercises as permitted by the Company’s shareholder-approved equity compensation plans. The tendered shares were retired. The market value of tendered shares is the last market trade price at closing on the day an option is exercised. Stock repurchased under equity incentive plans are not included in the total of stock repurchased under the stock repurchase plan announced August 21, 2007.
83
Table of Contents
Note 20 – Stock Options and Other Equity-Based Incentive Instruments
In March 2009, the Company’s Board of Directors adopted the TriCo Bancshares 2009 Equity Incentive Plan (2009 Plan) covering officers, employees, directors of, and consultants to, the Company. The 2009 Plan was approved by the Company’s shareholders in May 2009. The 2009 Plan allows for the granting of the following types of “stock awards” (Awards): incentive stock options, nonstatutory stock options, performance awards, restricted stock, restricted stock unit (RSU) awards and stock appreciation rights. RSUs that vest based solely on the grantee remaining in the service of the Company for a certain amount of time, are referred to as “service condition vesting RSUs”. RSUs that vest based on the grantee remaining in the service of the Company for a certain amount of time and a market condition such as the total return of the Company’s common stock versus the total return of an index of bank stocks, are referred to as “market plus service condition vesting RSUs”. In May 2013, the Company’s shareholders approved an amendment to the 2009 Plan increasing the maximum aggregate number of shares of TriCo’s common stock which may be issued pursuant to or subject to Awards from 650,000 to 1,650,000. The number of shares available for issuance under the 2009 Plan is reduced by: (i) one share for each share of common stock issued pursuant to a stock option or a Stock Appreciation Right and (ii) two shares for each share of common stock issued pursuant to a Performance Award, a Restricted Stock Award or a Restricted Stock Unit Award. When Awards made under the 2009 Plan expire or are forfeited or cancelled, the underlying shares will become available for future Awards under the 2009 Plan. To the extent that a share of common stock pursuant to an Award that counted as two shares against the number of shares again becomes available for issuance under the 2009 Plan, the number of shares of common stock available for issuance under the 2009 Plan shall increase by two shares. Shares awarded and delivered under the 2009 Plan may be authorized but unissued, or reacquired shares. As of December 31, 2016, 481,900 options for the purchase of common shares, and 115,876 restricted stock units were outstanding, and 637,262 shares remain available for issuance, under the 2009 Plan.
In May 2001, the Company adopted the TriCo Bancshares 2001 Stock Option Plan (2001 Plan) covering officers, employees, directors of, and consultants to, the Company. Under the 2001 Plan, the option exercise price cannot be less than the fair market value of the Common Stock at the date of grant except in the case of substitute options. Options for the 2001 Plan expire on the tenth anniversary of the grant date. Vesting schedules under the 2001 Plan are determined individually for each grant. As of December 31, 2016, 110,350 options for the purchase of common shares were outstanding under the 2001 Plan. As of May 2009, as a result of the shareholder approval of the 2009 Plan, no new options may be granted under the 2001 Plan.
Stock option activity is summarized in the following table for the dates indicated:
| Weighted | ||||||||||||
| Average | ||||||||||||
| Number | Option Price | Exercise | ||||||||||
| of Shares | per Share | Price | ||||||||||
| Outstanding at December 31, 2015 |
948,350 | $ | 12.63 to $25.91 | $ | 17.94 | |||||||
| Options granted |
— | — to — | — | |||||||||
| Options exercised |
(336,900 | ) | $ | 14.54 to $25.91 | $ | 19.31 | ||||||
| Options forfeited |
(19,200 | ) | $ | 14.76 to $23.21 | $ | 19.14 | ||||||
| Outstanding at December 31, 2016 |
592,250 | $ | 12.63 to $23.21 | $ | 17.12 | |||||||
The following table shows the number, weighted-average exercise price, intrinsic value, and weighted average remaining contractual life of options exercisable, options not yet exercisable and total options outstanding as of December 31, 2016:
| Currently | Currently Not | Total | ||||||||||
| Exercisable | Exercisable | Outstanding | ||||||||||
| Number of options |
520,650 | 71,600 | 592,250 | |||||||||
| Weighted average exercise price |
$ | 16.91 | $ | 18.64 | $ | 17.12 | ||||||
| Intrinsic value (in thousands) |
$ | 8,991 | $ | 1,112 | $ | 10,103 | ||||||
| Weighted average remaining contractual term (yrs.) |
4.1 | 6.3 | 4.3 | |||||||||
The 71,600 options that are currently not exercisable as of December 31, 2016 are expected to vest, on a weighted-average basis, over the next 1.3 years, and the Company is expected to recognize $368,000 of pre-tax compensation costs related to these options as they vest. The Company did not modify any option grants during 2016 or 2015.
The following table shows the total intrinsic value of options exercised, the total fair value of options vested, total compensation costs for options recognized in income, and total tax benefit recognized in income related to compensation costs for options during the periods indicated:
| Years Ended December 31, |
||||||||||||
| 2016 | 2015 | 2014 | ||||||||||
| Intrinsic value of options exercised |
$ | 3,483,000 | $ | 969,000 | $ | 1,209,000 | ||||||
| Fair value of options that vested |
$ | 580,000 | $ | 734,000 | $ | 965,000 | ||||||
| Total compensation costs for options recognized in income |
$ | 580,000 | $ | 734,000 | $ | 965,000 | ||||||
| Total tax benefit recognized in income related to compensation costs for options |
$ | 244,000 | $ | 380,000 | $ | 378,000 | ||||||
| Weighted average fair value of grants (per option) |
n/a | n/a | $ | 8.17 | ||||||||
84
Table of Contents
Note 20—Stock Options and Other Equity-Based Incentive Instruments (continued)
The fair value of the Company’s stock option grants is estimated on the measurement date, which, for the Company, is the date of grant. The fair value of stock options is estimated using the Black-Scholes option-pricing model. The Company estimated expected market price volatility and expected term of the options based on historical data and other factors. The weighted-average assumptions used to determine the fair value of options granted are detailed in the table below:
| Year Ended December 31, |
||||||||||||
| 2016 | 2015 | 2014 | ||||||||||
| Assumptions used to value option grants: |
||||||||||||
| Average expected terms (years) |
n/a | n/a | 6.3 | |||||||||
| Volatility |
n/a | n/a | 42.1 | % | ||||||||
| Annual rate of dividends |
n/a | n/a | 1.90 | % | ||||||||
| Discount rate |
n/a | n/a | 1.69 | % | ||||||||
Restricted stock unit (RSU) activity is summarized in the following table for the dates indicated:
| Service Condition Vesting RSUs | Market Plus Service Condition Vesting RSUs | |||||||||||||||
| Number of RSUs |
Weighted Average Fair Date of Grant |
Number of RSUs |
Weighted Average Fair Value on Date of Grant |
|||||||||||||
| Outstanding at December 31, 2015 |
46,286 | 32,097 | ||||||||||||||
| RSUs granted |
47,020 | $ | 28.01 | 19,402 | $ | 24.41 | ||||||||||
| RSUs added through dividend credits |
1,292 | — | ||||||||||||||
| RSUs released |
(20,529 | ) | — | |||||||||||||
| RSUs forfeited/expired |
(5,619 | ) | (4,073 | ) | ||||||||||||
| Outstanding at December 31, 2016 |
68,450 | 47,426 | ||||||||||||||
The 68,450 of service condition vesting RSUs outstanding as of December 31, 2016 include a feature whereby each RSU outstanding is credited with a dividend amount equal to any common stock cash dividend declared and paid, and the credited amount is divided by the closing price of the Company’s stock on the dividend payable date to arrive at an additional amount of RSUs outstanding under the original grant. The 68,450 of service condition vesting RSUs that are currently outstanding as of December 31, 2016 are expected to vest, and be released, on a weighted-average basis, over the next 1.4 years. The Company is expected to recognize $1,296,000 of pre-tax compensation costs related to these service condition vesting RSUs between December 31, 2016 and their vesting dates. During the 2016 and 2015, the Company did not modify any service condition vesting RSUs.
The 47,426 of market plus service condition vesting RSUs outstanding as of December 31, 2016 are expected to vest, and be released, on a weighted-average basis, over the next 1.5 years. The Company is expected to recognize $564,000 of pre-tax compensation costs related to these RSUs between December 31, 2016 and their vesting dates. As of December 31, 2016, the number of market plus service condition vesting RSUs outstanding that will actually vest, and be released, may be reduced to zero or increased to 71,139 depending on the total return of the Company’s common stock versus the total return of an index of bank stocks from the grant date to the vesting date. The Company did not modify any market plus service condition vesting RSUs during 2016 or 2015.
The following table shows the compensation costs for RSUs recognized in income for the periods indicated:
| Year Ended December 31, |
||||||||||||
| 2016 | 2015 | 2014 | ||||||||||
| Total compensation costs for RSUs recognized in income: |
||||||||||||
| Service condition vesting RSUs |
$ | 616,000 | $ | 458,000 | $ | 126,000 | ||||||
| Market plus service condition vesting RSUs |
$ | 271,000 | $ | 179,000 | $ | 42,000 | ||||||
85
Table of Contents
Note 21 – Noninterest Income and Expense
The components of other noninterest income were as follows (in thousands):
| Years Ended December 31, | ||||||||||||
| 2016 | 2015 | 2014 | ||||||||||
| Service charges on deposit accounts |
$ | 14,365 | $ | 14,276 | $ | 11,811 | ||||||
| ATM and interchange fees |
15,859 | 13,364 | 9,651 | |||||||||
| Other service fees |
3,121 | 2,977 | 2,206 | |||||||||
| Mortgage banking service fees |
2,065 | 2,164 | 1,869 | |||||||||
| Change in value of mortgage servicing rights |
(2,184 | ) | (701 | ) | (1,301 | ) | ||||||
|
|
|
|
|
|
|
|||||||
| Total service charges and fees |
33,226 | 32,080 | 24,236 | |||||||||
|
|
|
|
|
|
|
|||||||
| Gain on sale of loans |
4,037 | 3,064 | 2,032 | |||||||||
| Commissions on sale of non-deposit investment products |
2,329 | 3,349 | 2,995 | |||||||||
| Increase in cash value of life insurance |
2,717 | 2,786 | 1,953 | |||||||||
| Change in indemnification asset |
(493 | ) | (207 | ) | (856 | ) | ||||||
| Gain on sale of foreclosed assets |
262 | 991 | 2,153 | |||||||||
| Sale of customer checks |
408 | 492 | 450 | |||||||||
| Lease brokerage income |
711 | 712 | 504 | |||||||||
| Gain (loss) on disposal of fixed assets |
(147 | ) | (129 | ) | 49 | |||||||
| Gain on life insurance death benefit |
238 | 155 | — | |||||||||
| Other |
1,275 | 2,054 | 1,000 | |||||||||
|
|
|
|
|
|
|
|||||||
| Total other noninterest income |
11,337 | 13,267 | 10,280 | |||||||||
|
|
|
|
|
|
|
|||||||
| Total noninterest income |
$ | 44,563 | $ | 45,347 | $ | 34,516 | ||||||
|
|
|
|
|
|
|
|||||||
Mortgage loan servicing fees, net of change in fair value of mortgage loan servicing rights, totaling $(119,000), $1,463,000, and $568,000, were recorded in service charges and fees noninterest income for the years ended December 31, 2016, 2015, and 2014, respectively.
The components of noninterest expense were as follows (in thousands):
| Years Ended December 31, |
||||||||||||
| 2016 | 2015 | 2014 | ||||||||||
| Base salaries, net of deferred loan origination costs |
$ | 53,169 | $ | 46,822 | $ | 39,342 | ||||||
| Incentive compensation |
8,872 | 6,964 | 5,068 | |||||||||
| Benefits and other compensation costs |
18,683 | 17,619 | 13,134 | |||||||||
|
|
|
|
|
|
|
|||||||
| Total salaries and benefits expense |
80,724 | 71,405 | 57,544 | |||||||||
|
|
|
|
|
|
|
|||||||
| Occupancy |
10,139 | 10,126 | 8,203 | |||||||||
| Equipment |
6,597 | 5,997 | 4,514 | |||||||||
| Data processing and software |
8,846 | 7,670 | 6,512 | |||||||||
| Assessments |
2,105 | 2,572 | 2,107 | |||||||||
| ATM & POS network charges |
4,999 | 4,190 | 2,996 | |||||||||
| Advertising |
3,829 | 3,992 | 2,413 | |||||||||
| Professional fees |
5,409 | 4,545 | 3,888 | |||||||||
| Telecommunications |
2,749 | 3,007 | 2,870 | |||||||||
| Postage |
1,603 | 1,296 | 949 | |||||||||
| Courier service |
998 | 1,154 | 1,055 | |||||||||
| Foreclosed assets expense |
266 | 490 | 528 | |||||||||
| Intangible amortization |
1,377 | 1,157 | 446 | |||||||||
| Operational losses |
1,564 | 737 | 764 | |||||||||
| Provision for foreclosed asset losses |
140 | 502 | 208 | |||||||||
| Change in reserve for unfunded commitments |
244 | 330 | (395 | ) | ||||||||
| Legal settlement |
1,450 | — | — | |||||||||
| Merger & acquisition expense |
784 | 586 | 4,858 | |||||||||
| Miscellaneous other |
12,174 | 11,085 | 10,919 | |||||||||
|
|
|
|
|
|
|
|||||||
| Total other noninterest expense |
65,273 | 59,436 | 52,835 | |||||||||
|
|
|
|
|
|
|
|||||||
| Total noninterest expense |
$ | 145,997 | $ | 130,841 | $ | 110,379 | ||||||
|
|
|
|
|
|
|
|||||||
| Merger and acquisition expense: |
||||||||||||
| Base salaries, net of loan origination costs |
$ | 187 | — | — | ||||||||
| Incentive compensation |
— | — | $ | 1,174 | ||||||||
| Benefits and other compensation costs |
— | — | 94 | |||||||||
| Data processing and software |
— | $ | 108 | 475 | ||||||||
| Professional fees |
342 | 120 | 2,390 | |||||||||
| Other |
255 | 358 | 725 | |||||||||
|
|
|
|
|
|
|
|||||||
| Total merger expense |
$ | 784 | $ | 586 | $ | 4,858 | ||||||
|
|
|
|
|
|
|
|||||||
86
Table of Contents
Note 22—Income Taxes
The components of consolidated income tax expense are as follows:
| 2016 | 2015 | 2014 | ||||||||||
| (in thousands) | ||||||||||||
| Current tax expense |
||||||||||||
| Federal |
$ | 17,401 | $ | 21,076 | $ | 14,485 | ||||||
| State |
7,121 | 7,139 | 5,016 | |||||||||
|
|
|
|
|
|
|
|||||||
| $ | 24,522 | 28,215 | 19,501 | |||||||||
|
|
|
|
|
|
|
|||||||
| Deferred tax expense (benefit) |
||||||||||||
| Federal |
2,735 | 408 | (794 | ) | ||||||||
| State |
455 | 273 | (199 | ) | ||||||||
|
|
|
|
|
|
|
|||||||
| 3,190 | 681 | (993 | ) | |||||||||
|
|
|
|
|
|
|
|||||||
| Total tax expense |
$ | 27,712 | $ | 28,896 | $ | 18,508 | ||||||
|
|
|
|
|
|
|
|||||||
A deferred tax asset or liability is recognized for the tax consequences of temporary differences in the recognition of revenue and expense for financial and tax reporting purposes. The net change during the year in the deferred tax asset or liability results in a deferred tax expense or benefit.
Taxes recorded directly to shareholders’ equity are not included in the preceding table. These taxes (benefits) relating to changes in unfunded status of the supplemental retirement plans amounting to $429,000 in 2016, $904,000 in 2015, and $(2,984,000) in 2014, taxes (benefits) related to unrealized gains and losses on available-for-sale investment securities amounting to $(4,631,000) in 2016, $(797,000) in 2015, and $(68,000) in 2014, taxes (benefits) related to employee stock options of $(170,000) in 2016, $(28,000) in 2105, and $(293,000) in 2014, were recorded directly to shareholders’ equity.
The Company recognized, as components of tax expense, tax credits and other tax benefits, and amortization expense relating to our investments in Qualified Affordable Housing Projects as followers for the periods indicated:
| Year ended December 31, | 2016 | 2015 | 2014 | |||||||||
| (in thousands) | ||||||||||||
| Tax credits and other tax benefits – decrease in tax expense |
$ | (954 | ) | $ | (354 | ) | — | |||||
| Depreciation – increase in tax expense |
$ | 757 | $ | 277 | — | |||||||
Prior to 2015, the Company had no investments in Qualified Affordable Housing Projects.
The carrying value of Low Income Housing Tax Credit Funds was $18,465,000 and $4,223,000 as of December 31, 2016 and 2015, respectively. As of December 31, 2016, the Company has committed to make additional capital contributions to the Low Income Housing Tax Credit Funds in the amount of $15,176,000, and these contributions are expected to be made over the next several years.
The provisions for income taxes applicable to income before taxes for the years ended December 31, 2016, 2015 and 2014 differ from amounts computed by applying the statutory Federal income tax rates to income before taxes. The effective tax rate and the statutory federal income tax rate are reconciled as follows:
| Years Ended December 31, | ||||||||||||
| 2016 | 2015 | 2014 | ||||||||||
| Federal statutory income tax rate |
35.0 | % | 35.0 | % | 35.0 | % | ||||||
| State income taxes, net of federal tax benefit |
6.8 | 6.6 | 7.0 | |||||||||
| Tax-exempt interest on municipal obligations |
(1.8 | ) | (0.7 | ) | (0.4 | ) | ||||||
| Tax-exempt life insurance related income |
(1.3 | ) | (1.3 | ) | (1.5 | ) | ||||||
| Low income housing tax credit benefits |
(1.3 | ) | (0.4 | ) | — | |||||||
| Low income housing tax credit amortization |
0.8 | — | — | |||||||||
| Non-deductible joint beneficiary agreement expense |
0.1 | 0.1 | 0.2 | |||||||||
| Non-deductible merger expense |
— | — | 1.0 | |||||||||
| Other |
(0.1 | ) | 0.4 | 0.2 | ||||||||
|
|
|
|
|
|
|
|||||||
| Effective Tax Rate |
38.2 | % | 39.7 | % | 41.5 | % | ||||||
|
|
|
|
|
|
|
|||||||
87
Table of Contents
Note 22 – Income Taxes (continued)
The temporary differences, tax effected, which give rise to the Company’s net deferred tax asset recorded in other assets are as follows as of December 31 for the years indicated:
| 2016 | 2015 | |||||||
| (in thousands) | ||||||||
| Deferred tax assets: |
||||||||
| Allowance for losses and reserve for unfunded commitments |
$ | 14,809 | $ | 16,182 | ||||
| Deferred compensation |
2,743 | 2,827 | ||||||
| Accrued pension liability |
9,220 | 8,597 | ||||||
| Accrued bonus |
1,727 | 1,326 | ||||||
| Other accrued expenses |
781 | 143 | ||||||
| Unfunded status of the supplemental retirement plans |
1,982 | 2,411 | ||||||
| State taxes |
2,257 | 2,297 | ||||||
| Share based compensation |
2,063 | 2,701 | ||||||
| Nonaccrual interest |
408 | 1,979 | ||||||
| OREO write downs |
132 | 241 | ||||||
| Indemnification asset |
313 | 219 | ||||||
| Acquisition cost basis |
3,996 | 5,118 | ||||||
| Unrealized loss on securities |
3,730 | — | ||||||
| Tax credits |
491 | 491 | ||||||
| Net operating loss carryforwards |
3,354 | 5,252 | ||||||
| Other |
981 | 889 | ||||||
|
|
|
|
|
|||||
| Total deferred tax assets |
48,987 | 50,673 | ||||||
|
|
|
|
|
|||||
| Deferred tax liabilities: |
||||||||
| Securities income |
(1,362 | ) | (1,362 | ) | ||||
| Unrealized gain on securities |
— | (902 | ) | |||||
| Depreciation |
(3,032 | ) | (2,654 | ) | ||||
| Merger related fixed asset valuations |
(54 | ) | (54 | ) | ||||
| Securities accretion |
(478 | ) | (485 | ) | ||||
| Mortgage servicing rights valuation |
(2,710 | ) | (3,118 | ) | ||||
| Core deposit intangible |
(1,813 | ) | (2,331 | ) | ||||
| Junior subordinated debt |
(2,616 | ) | (2,699 | ) | ||||
| Prepaid expenses and other |
(723 | ) | (628 | ) | ||||
|
|
|
|
|
|||||
| Total deferred tax liability |
(12,788 | ) | (14,233 | ) | ||||
|
|
|
|
|
|||||
| Net deferred tax asset |
$ | 36,199 | $ | 36,440 | ||||
|
|
|
|
|
|||||
As part of the merger with North Valley in 2014, TriCo acquired federal and state net operating loss carryforwards, capital loss carryforwards, and tax credit carryforwards. These tax attribute carryforwards will be subject to provisions of the tax law that limit the use of such losses and credits generated by a company prior to the date certain ownership changes occur. The amount of the Company’s net operating loss carryforwards that would be subject to these limitations as of December 31, 2016 were $4.6 million and $26.0 million for federal and California, respectively. The amount of the Company’s capital loss carryforwards that would be subject to these limitations as of December 31, 2016 were $111,000 and $388,000 for federal and California, respectively. The amount of the Company’s tax credits that would be subject to these limitations as of December 31, 2016 are $69,000 and $2.7 million for federal and California, respectively. Due to the limitation, a significant portion of the state tax credits will expire regardless of whether the Company generates future taxable income. As such, the Company has recorded the future benefit of these tax credits on the books at the value which is more likely than not to be realized. These tax loss and tax credit carryforwards expire at various dates beginning in 2018.
The Company believes that a valuation allowance is not needed to reduce the deferred tax assets as it is more likely than not that the results of future operations will generate sufficient taxable income to realize the deferred tax assets, including the tax attribute carryforwards acquired as part of the North Valley merger.
As part of the North Valley merger, TriCo inherited an unrecognized tax benefit for tax positions claimed on prior year tax returns filed by North Valley. The Company had an unrecognized tax benefit of $114,000 as of December 31, 2016, the recognition of which would reduce the Company’s tax expense by $73,000. Management does not expect the unrecognized tax benefit will materially change in the next 12 months. A summary of changes in the Company’s unrecognized tax benefit (including interest and penalties) in 2016 is as follows:
| (in thousands) |
UTB | Interest/Penalties | Total | |||||||||
| As of December 31, 2015 |
$ | 168 | $ | 14 | $ | 182 | ||||||
| Lapse of the applicable statute of limitations |
(54 | ) | (7 | ) | (61 | ) | ||||||
|
|
|
|
|
|
|
|||||||
| As of December 31, 2016 |
$ | 114 | 7 | 121 | ||||||||
|
|
|
|
|
|
|
|||||||
During the years ended December 31, 2016 and December 31, 2015 the Company recognized no interest and penalties related to taxes. The Company files income tax returns in the U.S. federal jurisdiction, and California. With few exceptions, the Company is no longer subject to U.S. federal and state/local income tax examinations by tax authorities for years before 2013 and 2012, respectively.
88
Table of Contents
Note 23 – Earnings per Share
Basic earnings per share represents income available to common shareholders divided by the weighted-average number of common shares outstanding during the period. Diluted earnings per share reflects additional common shares that would have been outstanding if dilutive potential common shares had been issued, as well as any adjustments to income that would result from assumed issuance. Potential common shares that may be issued by the Company relate solely from outstanding stock options, and are determined using the treasury stock method. Earnings per share have been computed based on the following:
| Years ended December 31, | ||||||||||||
| 2016 | 2015 | 2014 | ||||||||||
| Net income (in thousands) |
$ | 44,811 | $ | 43,818 | $ | 26,108 | ||||||
|
|
|
|
|
|
|
|||||||
| (number of shares in thousands) |
||||||||||||
| Average number of common shares outstanding |
22,814 | 22,750 | 17,716 | |||||||||
| Effect of dilutive stock options |
273 | 248 | 207 | |||||||||
|
|
|
|
|
|
|
|||||||
| Average number of common shares outstanding used to calculate diluted earnings per share |
23,087 | 22,998 | 17,923 | |||||||||
|
|
|
|
|
|
|
|||||||
Based on an average of quarterly computations, there were 13,825, 20,625, and 95,600 options and restricted stock units excluded from the computation of annual diluted earnings per share for the years ended December 31, 2016, 2015 and 2014, respectively, because the effect of these options and restricted stock units were antidilutive.
Note 24 – Comprehensive Income
Accounting principles generally require that recognized revenue, expenses, gains and losses be included in net income. Although certain changes in assets and liabilities, such as unrealized gains and losses on available-for-sale securities, are reported as a separate component of the equity section of the balance sheet, such items, along with net income, are components of comprehensive income. The components of other comprehensive income and related tax effects are as follows:
| Years Ended December 31, | ||||||||||||
| 2016 | 2015 | 2014 | ||||||||||
| (in thousands) | ||||||||||||
| Unrealized holding losses on available for sale securities before reclassifications |
$ | (11,015 | ) | $ | (1,895 | ) | $ | (162 | ) | |||
| Amounts reclassified out of accumulated other comprehensive income |
— | — | — | |||||||||
|
|
|
|
|
|
|
|||||||
| Unrealized holding losses on available for sale securities after reclassifications |
(11,015 | ) | (1,895 | ) | (162 | ) | ||||||
| Tax effect |
4,631 | 797 | 68 | |||||||||
|
|
|
|
|
|
|
|||||||
| Unrealized holding losses on available for sale securities, net of tax |
(6,384 | ) | (1,098 | ) | (94 | ) | ||||||
|
|
|
|
|
|
|
|||||||
| Change in unfunded status of the supplemental retirement plans before reclassifications |
511 | 1,384 | (7,253 | ) | ||||||||
| Amounts reclassified out of accumulated other comprehensive income: |
||||||||||||
| Amortization of prior service cost |
(40 | ) | (57 | ) | 138 | |||||||
| Amortization of actuarial losses |
550 | 823 | 17 | |||||||||
|
|
|
|
|
|
|
|||||||
| Total amounts reclassified out of accumulated other comprehensive income |
510 | 766 | 155 | |||||||||
|
|
|
|
|
|
|
|||||||
| Change in unfunded status of the supplemental retirement plans after reclassifications |
1,021 | 2,150 | (7,098 | ) | ||||||||
| Tax effect |
(429 | ) | (904 | ) | 2,984 | |||||||
|
|
|
|
|
|
|
|||||||
| Change in unfunded status of the supplemental retirement plans, net of tax |
592 | 1,246 | (4,114 | ) | ||||||||
|
|
|
|
|
|
|
|||||||
| Change in joint beneficiary agreement liability before reclassifications |
(343 | ) | 277 | 148 | ||||||||
| Amounts reclassified out of accumulated other comprehensive income |
— | — | — | |||||||||
|
|
|
|
|
|
|
|||||||
| Change in joint beneficiary agreement liability after reclassifications |
(343 | ) | 277 | 148 | ||||||||
| Tax effect |
— | — | — | |||||||||
|
|
|
|
|
|
|
|||||||
| Change in joint beneficiary agreement liability, net of tax |
(343 | ) | 277 | 148 | ||||||||
|
|
|
|
|
|
|
|||||||
| Total other comprehensive income (loss) |
$ | (6,135 | ) | $ | 425 | $ | (4,060 | ) | ||||
|
|
|
|
|
|
|
|||||||
89
Table of Contents
Note 24 – Comprehensive Income (continued)
The components of accumulated other comprehensive income, included in shareholders’ equity, are as follows:
| December 31, | ||||||||
| 2016 | 2015 | |||||||
| (in thousands) | ||||||||
| Net unrealized gains on available for sale securities |
$ | (8,870 | ) | $ | 2,145 | |||
| Tax effect |
3,729 | (902 | ) | |||||
|
|
|
|
|
|||||
| Unrealized holding gains on available for sale securities, net of tax |
(5,141 | ) | 1,243 | |||||
|
|
|
|
|
|||||
| Unfunded status of the supplemental retirement plans |
(4,714 | ) | (5,735 | ) | ||||
| Tax effect |
1,982 | 2,411 | ||||||
|
|
|
|
|
|||||
| Unfunded status of the supplemental retirement plans, net of tax |
(2,732 | ) | (3,324 | ) | ||||
|
|
|
|
|
|||||
| Joint beneficiary agreement liability |
(40 | ) | 303 | |||||
| Tax effect |
— | — | ||||||
|
|
|
|
|
|||||
| Joint beneficiary agreement liability, net of tax |
(40 | ) | 303 | |||||
|
|
|
|
|
|||||
| Accumulated other comprehensive loss |
$ | (7,913 | ) | $ | (1,778 | ) | ||
|
|
|
|
|
|||||
Note 25 – Retirement Plans
401(k) Plan
The Company sponsors a 401(k) Plan whereby substantially all employees age 21 and over with 90 days of service may participate. Participants may contribute a portion of their compensation subject to certain limits based on federal tax laws. Prior to July 1, 2015, the Company did not contribute to the 401(k) Plan. Effective July 1, 2015, the Company initiated a discretionary matching contribution equal to 50% of participant’s elective deferrals each quarter, up to 4% of eligible compensation. The Company recorded $678,000, $300,000, and $0, of salaries & benefits expense attributable to the 401(k) Plan matching contribution during the years 2016, 2015, and 2014, respectively. The Company made $811,000, $0, and $0, of 401(k) Plan matching contributions during the years 2016, 2015, and 2014, respectively.
Employee Stock Ownership Plan
Substantially all employees with at least one year of service are covered by a discretionary employee stock ownership plan (ESOP). Contributions are made to the plan at the discretion of the Board of Directors. Contributions to the plan totaling $1,368,000, $2,651,000, and $1,294,000 were made during 2016, 2015, and 2014, respectively. Expenses related to the Company’s ESOP, are included in benefits and other compensation costs under salaries and benefits expense, and were $1,831,000, $2,282,000, and $1,467,000 during 2016, 2015, and 2014, respectively. Company shares owned by the ESOP are paid dividends and included in the calculation of earnings per share exactly as other common shares outstanding.
Deferred Compensation Plans
The Company has deferred compensation plans for certain directors and key executives, which allow certain directors and key executives designated by the Board of Directors of the Company to defer a portion of their compensation. The Company has purchased insurance on the lives of the participants and intends to hold these policies until death as a cost recovery of the Company’s deferred compensation obligations of $6,525,000, and $6,725,000 at December 31, 2016 and 2015, respectively. Earnings credits on deferred balances totaling $487,000 in 2016, $538,000 in 2015, and $551,000 in 2014, respectively, are included in noninterest expense.
Supplemental Retirement Plans
The Company has supplemental retirement plans for certain directors and key executives. These plans are non-qualified defined benefit plans and are unsecured and unfunded. The Company has purchased insurance on the lives of the participants and intends to hold these policies until death as a cost recovery of the Company’s retirement obligations. The cash values of the insurance policies purchased to fund the deferred compensation obligations and the supplemental retirement obligations were $95,912,000 and $94,560,000 at December 31, 2016 and 2015, respectively.
The Company recorded in other liabilities the unfunded status of the supplemental retirement plans of $4,714,000 and $5,735,000 related to the supplemental retirement plans as of December 31, 2016 and 2015, respectively. These amounts represent the amount by which the projected benefit obligations for these retirement plans exceeded the fair value of plan assets plus amounts previously accrued related to the plans. The projected benefit obligation is recorded in other liabilities.
90
Table of Contents
Note 25 – Retirement Plans (continued)
At December 31, 2016 and 2015, the unfunded status of the supplemental retirement plans of $4,714,000 and $5,735,000 were offset by a reduction of shareholders’ equity accumulated other comprehensive loss of $2,732,000 and $3,324,000, respectively, representing the after-tax impact of the unfunded status of the supplemental retirement plans, and the related deferred tax asset of $1,982,000 and $2,411,000, respectively. Amounts recognized as a component of accumulated other comprehensive loss as of year-end that have not been recognized as a component of the combined net period benefit cost of the Company’s defined benefit pension plans are presented in the following table. The Company expects to recognize approximately $381,000 of the net actuarial loss reported in the following table as of December 31, 2016 as a component of net periodic benefit cost during 2017.
| December 31, | ||||||||
| (in thousands) | 2016 | 2015 | ||||||
| Transition obligation |
$ | 7 | $ | 7 | ||||
| Prior service cost |
(75 | ) | (115 | ) | ||||
| Net actuarial loss |
4,782 | 5,843 | ||||||
|
|
|
|
|
|||||
| Amount included in accumulated other comprehensive loss |
4,714 | 5,735 | ||||||
| Deferred tax benefit |
(1,982 | ) | (2,411 | ) | ||||
|
|
|
|
|
|||||
| Amount included in accumulated other comprehensive loss, net of tax |
$ | 2,732 | $ | 3,324 | ||||
|
|
|
|
|
|||||
Information pertaining to the activity in the supplemental retirement plans, using a measurement date of December 31, is as follows:
| December 31, | ||||||||
| 2016 | 2015 | |||||||
| (in thousands) | ||||||||
| Change in benefit obligation: |
||||||||
| Benefit obligation at beginning of year |
$ | (26,184 | ) | $ | (26,798 | ) | ||
| Acquisition |
— | — | ||||||
| Service cost |
(1,042 | ) | (1,023 | ) | ||||
| Interest cost |
(1,025 | ) | (957 | ) | ||||
| Actuarial (loss)/gain |
511 | 1,382 | ||||||
| Benefits paid |
1,095 | 1,212 | ||||||
|
|
|
|
|
|||||
| Benefit obligation at end of year |
$ | (26,645 | ) | $ | (26,184 | ) | ||
|
|
|
|
|
|||||
| Change in plan assets: |
||||||||
| Fair value of plan assets at beginning of year |
$ | — | $ | — | ||||
|
|
|
|
|
|||||
| Fair value of plan assets at end of year |
$ | — | $ | — | ||||
|
|
|
|
|
|||||
| Funded status |
$ | (26,645 | ) | $ | (26,184 | ) | ||
| Unrecognized net obligation existing at January 1, 1986 |
7 | 7 | ||||||
| Unrecognized net actuarial loss |
4,782 | 5,843 | ||||||
| Unrecognized prior service cost |
(75 | ) | (115 | ) | ||||
| Accumulated other comprehensive income |
(4,714 | ) | (5,735 | ) | ||||
|
|
|
|
|
|||||
| Accrued benefit cost |
$ | (26,645 | ) | $ | (26,184 | ) | ||
|
|
|
|
|
|||||
| Accumulated benefit obligation |
$ | (25,241 | ) | $ | (24,469 | ) | ||
The following table sets forth the net periodic benefit cost recognized for the supplemental retirement plans:
| Years Ended December 31, | ||||||||||||
| 2016 | 2015 | 2014 | ||||||||||
| (in thousands) | ||||||||||||
| Net pension cost included the following components: |
||||||||||||
| Service cost-benefits earned during the period |
$ | 1,042 | $ | 1,023 | $ | 652 | ||||||
| Interest cost on projected benefit obligation |
1,025 | 957 | 739 | |||||||||
| Amortization of net obligation at transition |
2 | 2 | 2 | |||||||||
| Amortization of prior service cost |
(41 | ) | (57 | ) | 138 | |||||||
| Recognized net actuarial loss |
549 | 823 | 16 | |||||||||
|
|
|
|
|
|
|
|||||||
| Net periodic pension cost |
$ | 2,577 | $ | 2,748 | $ | 1,547 | ||||||
|
|
|
|
|
|
|
|||||||
91
Table of Contents
Note 25 – Retirement Plans (continued)
The following table sets forth assumptions used in accounting for the plans:
| Years Ended December 31, |
||||||||||||
| 2016 | 2015 | 2014 | ||||||||||
| Discount rate used to calculate benefit obligation |
3.80 | % | 4.00 | % | 3.65 | % | ||||||
| Discount rate used to calculate net periodic pension cost |
3.80 | % | 4.00 | % | 3.65 | % | ||||||
| Average annual increase in executive compensation |
2.50 | % | 2.50 | % | 2.50 | % | ||||||
| Average annual increase in director compensation |
2.50 | % | 2.50 | % | 2.50 | % | ||||||
The following table sets forth the expected benefit payments to participants and estimated contributions to be made by the Company under the supplemental retirement plans for the years indicated:
| Years Ended |
Expected Benefit Payments to Participants |
Estimated Company Contributions |
||||||
| (in thousands) | ||||||||
| 2017 |
$ | 1,067 | $ | 1,067 | ||||
| 2018 |
958 | 958 | ||||||
| 2019 |
823 | 823 | ||||||
| 2020 |
701 | 701 | ||||||
| 2021 |
520 | 520 | ||||||
| 2022-2026 |
$ | 3,212 | $ | 3,212 | ||||
Note 26 – Related Party Transactions
Certain directors, officers, and companies with which they are associated were customers of, and had banking transactions with, the Company or the Bank in the ordinary course of business.
The following table summarizes the activity in these loans for the periods indicated (in thousands):
| Balance December 31, 2014 |
3,132 | |||
| Advances/new loans |
3,098 | |||
| Removed/payments |
(2,029 | ) | ||
|
|
|
|||
| Balance December 31, 2015 |
$ | 4,201 | ||
| Advances/new loans |
730 | |||
| Removed/payments |
(2,499 | ) | ||
|
|
|
|||
| Balance December 31, 2016 |
$ | 2,432 | ||
|
|
|
Until the end of 2015, Director Chrysler was a principal owner and CEO of Modern Building Inc., a construction company, where he continues to be employed in a nonexecutive position. Modern Building Inc. provided construction services to the Company related to new and existing Bank facilities for aggregate payments of $2,289,000, $1,030,000, and $1,181,000, during 2016, 2015 and 2014, respectively.
Note 27 – Fair Value Measurement
The Company utilizes fair value measurements to record fair value adjustments to certain assets and liabilities and to determine fair value disclosures. In estimating fair value, the Company utilizes valuation techniques that are consistent with the market approach, income approach, and/or the cost approach. Inputs to valuation techniques include the assumptions that market participants would use in pricing an asset or liability including assumptions about the risk inherent in a particular valuation technique, the effect of a restriction on the sale or use of an asset and the risk of nonperformance. Securities available-for-sale and mortgage servicing rights are recorded at fair value on a recurring basis. Additionally, from time to time, the Company may be required to record at fair value other assets on a nonrecurring basis, such as loans held for sale, loans held for investment and certain other assets. These nonrecurring fair value adjustments typically involve application of lower of cost or market accounting or impairment write-downs of individual assets.
The Company groups assets and liabilities at fair value in three levels, based on the markets in which the assets and liabilities are traded and the observable nature of the assumptions used to determine fair value. These levels are:
| Level 1 - | Valuation is based upon quoted prices for identical instruments traded in active markets. | |
| Level 2 - | Valuation is based upon quoted prices for similar instruments in active markets, quoted prices for identical or similar instruments in markets that are not active, and model-based valuation techniques for which all significant assumptions are observable in the market. | |
| Level 3 - | Valuation is generated from model-based techniques that use at least one significant assumption not observable in the market. These unobservable assumptions reflect estimates of assumptions that market participants would use in pricing the asset or liability. Valuation techniques include use of option pricing models, discounted cash flow models and similar techniques. | |
92
Table of Contents
Securities available for sale—Securities available for sale are recorded at fair value on a recurring basis. Fair value measurement is based upon quoted prices, if available. If quoted prices are not available, fair values are measured using independent pricing models or other model-based valuation techniques such as the present value of future cash flows, adjusted for the security’s credit rating, prepayment assumptions and other factors such as credit loss assumptions. Level 1 securities include those traded on an active exchange, such as the New York Stock Exchange, U.S. Treasury securities that are traded by dealers or brokers in active over-the-counter markets and money market funds. Level 2 securities include mortgage-backed securities issued by government sponsored entities, municipal bonds and corporate debt securities. The Company had no securities classified as Level 3 during any of the periods covered in these financial statements.
Loans held for sale – Loans held for sale are carried at the lower of cost or fair value. The fair value of loans held for sale is based on what secondary markets are currently offering for loans with similar characteristics. As such, we classify those loans subjected to nonrecurring fair value adjustments as Level 2.
Impaired originated and PNCI loans – Originated and PNCI loans are not recorded at fair value on a recurring basis. However, from time to time, an originated or PNCI loan is considered impaired and an allowance for loan losses is established. Originated and PNCI loans for which it is probable that payment of interest and principal will not be made in accordance with the contractual terms of the loan agreement are considered impaired. The fair value of an impaired originated or PNCI loan is estimated using one of several methods, including collateral value, fair value of similar debt, enterprise value, liquidation value and discounted cash flows. Those impaired originated and PNCI loans not requiring an allowance represent loans for which the fair value of the expected repayments or collateral exceed the recorded investments in such loans. Impaired originated and PNCI loans where an allowance is established based on the fair value of collateral require classification in the fair value hierarchy. When the fair value of the collateral is based on an observable market price or a current appraised value which uses substantially observable data, the Company records the impaired originated or PNCI loan as nonrecurring Level 2. When an appraised value is not available or management determines the fair value of the collateral is further impaired below the appraised value, or the appraised value contains a significant unobservable assumption, such as deviations from comparable sales, and there is no observable market price, the Company records the impaired originated or PNCI loan as nonrecurring Level 3.
Foreclosed assets—Foreclosed assets include assets acquired through, or in lieu of, loan foreclosure. Foreclosed assets are held for sale and are initially recorded at fair value at the date of foreclosure, establishing a new cost basis. Subsequent to foreclosure, management periodically performs valuations and the assets are carried at the lower of carrying amount or fair value less cost to sell. When the fair value of foreclosed assets is based on an observable market price or a current appraised value which uses substantially observable data, the Company records the impaired originated loan as nonrecurring Level 2. When an appraised value is not available or management determines the fair value of the collateral is further impaired below the appraised value, or the appraised value contains a significant unobservable assumption, such as deviations from comparable sales, and there is no observable market price, the Company records the foreclosed asset as nonrecurring Level 3. Revenue and expenses from operations and changes in the valuation allowance are included in other noninterest expense.
Mortgage servicing rights—Mortgage servicing rights are carried at fair value. A valuation model, which utilizes a discounted cash flow analysis using a discount rate and prepayment speed assumptions is used in the computation of the fair value measurement. While the prepayment speed assumption is currently quoted for comparable instruments, the discount rate assumption currently requires a significant degree of management judgment and is therefore considered an unobservable input. As such, the Company classifies mortgage servicing rights subjected to recurring fair value adjustments as Level 3. Additional information regarding mortgage servicing rights can be found in Note 10 in the consolidated financial statements at Item 1 of this report.
The table below presents the recorded amount of assets and liabilities measured at fair value on a recurring basis (in thousands):
| Fair value at December 31, 2016 | Total | Level 1 | Level 2 | Level 3 | ||||||||||||
| Securities available-for-sale: |
||||||||||||||||
| Obligations of U.S. government corporations and agencies |
$ | 429,678 | — | $ | 429,678 | — | ||||||||||
| Obligations of states and political subdivisions |
117,617 | — | 117,617 | — | ||||||||||||
| Marketable equity securities |
2,938 | $ | 2,938 | — | — | |||||||||||
| Mortgage servicing rights |
6,595 | — | — | $ | 6,595 | |||||||||||
|
|
|
|
|
|
|
|
|
|||||||||
| Total assets measured at fair value |
$ | 556,828 | $ | 2,938 | $ | 547,295 | $ | 6,595 | ||||||||
|
|
|
|
|
|
|
|
|
|||||||||
| Fair value at December 31, 2015 | Total | Level 1 | Level 2 | Level 3 | ||||||||||||
| Securities available-for-sale: |
||||||||||||||||
| Obligations of U.S. government corporations and agencies |
$ | 313,682 | — | $ | 313,682 | — | ||||||||||
| Obligations of states and political subdivisions |
88,218 | — | 88,218 | — | ||||||||||||
| Marketable equity securities |
2,985 | $ | 2,985 | — | — | |||||||||||
| Mortgage servicing rights |
7,618 | — | — | $ | 7,618 | |||||||||||
|
|
|
|
|
|
|
|
|
|||||||||
| Total assets measured at fair value |
$ | 412,503 | $ | 2,985 | $ | 401,900 | $ | 7,618 | ||||||||
|
|
|
|
|
|
|
|
|
|||||||||
93
Table of Contents
Note 27 – Fair Value Measurement (continued)
Transfers between levels of the fair value hierarchy are recognized on the actual date of the event or circumstances that caused the transfer, which generally corresponds with the Company’s quarterly valuation process. There were no transfers between any levels during 2016 or 2015.
The following table provides a reconciliation of assets and liabilities measured at fair value using significant unobservable inputs (Level 3) on a recurring basis during the years ended December 31, 2016 and 2015. Had there been any transfer into or out of Level 3 during 2016 or 2015, the amount included in the “Transfers into (out of) Level 3” column would represent the beginning balance of an item in the period (interim quarter) during which it was transferred (in thousands):
| Year ended December 31, | Ending Balance |
Transfers into (out of) Level 3 |
Change Included in Earnings |
Issuances | Beginning Balance |
|||||||||||||||
| 2016: Mortgage servicing rights |
$ | 6,595 | — | $ | (2,184 | ) | $ | 1,161 | $ | 7,618 | ||||||||||
| 2015: Mortgage servicing rights |
$ | 7,618 | — | $ | (701 | ) | $ | 941 | $ | 7,378 | ||||||||||
The Company’s method for determining the fair value of mortgage servicing rights is described in Note 1. The key unobservable inputs used in determining the fair value of mortgage servicing rights are mortgage prepayment speeds and the discount rate used to discount cash projected cash flows. Generally, any significant increases in the mortgage prepayment speed and discount rate utilized in the fair value measurement of the mortgage servicing rights will result in a negative fair value adjustments (and decrease in the fair value measurement). Conversely, a decrease in the mortgage prepayment speed and discount rate will result in a positive fair value adjustment (and increase in the fair value measurement). Note 10 contains additional information regarding mortgage servicing rights.
The following table presents quantitative information about recurring Level 3 fair value measurements at December 31, 2016:
| Fair Value (in thousands) |
Valuation Technique | Unobservable Inputs | Range, Weighted Average | |||||
| Mortgage Servicing Rights |
$6,595 | Discounted cash flow | Constant prepayment rate | 6.9%-16.6%, 8.8% | ||||
| Discount rate | 14.0%-16.0%, 14.0% |
The tables below present the recorded amount of assets and liabilities measured at fair value on a nonrecurring basis, as of the dates indicated, that had a write-down or an additional allowance provided during the periods indicated (in thousands):
| Year ended December 31, 2016 | Total | Level 1 | Level 2 | Level 3 | Total Gains (Losses) |
|||||||||||||||
| Fair value: |
||||||||||||||||||||
| Impaired Originated & PNCI loans |
$ | 1,107 | — | — | $ | 1,107 | $ | (409 | ) | |||||||||||
| Foreclosed assets |
2,253 | 2,253 | (86 | ) | ||||||||||||||||
|
|
|
|
|
|
|
|
|
|
|
|||||||||||
| Total assets measured at fair value |
$ | 3,360 | — | — | $ | 3,360 | $ | (495 | ) | |||||||||||
|
|
|
|
|
|
|
|
|
|
|
|||||||||||
| Year ended December 31, 2015 | Total | Level 1 | Level 2 | Level 3 | Total Gains (Losses) |
|||||||||||||||
| Fair value: |
||||||||||||||||||||
| Impaired Originated & PNCI loans |
$ | 4,649 | — | — | $ | 4,649 | $ | (663 | ) | |||||||||||
| Foreclosed assets |
1,839 | 1,839 | (418 | ) | ||||||||||||||||
|
|
|
|
|
|
|
|
|
|
|
|||||||||||
| Total assets measured at fair value |
$ | 6,488 | — | — | $ | 6,488 | $ | (1,081 | ) | |||||||||||
|
|
|
|
|
|
|
|
|
|
|
|||||||||||
The impaired Originated and PNCI loan amount above represents impaired, collateral dependent loans that have been adjusted to fair value. When we identify a collateral dependent loan as impaired, we measure the impairment using the current fair value of the collateral, less selling costs. Depending on the characteristics of a loan, the fair value of collateral is generally estimated by obtaining external appraisals. If we determine that the value of the impaired loan is less than the recorded investment in the loan, we recognize this impairment and adjust the carrying value of the loan to fair value through the allowance for loan and lease losses. The loss represents charge-offs or impairments on collateral dependent loans for fair value adjustments based on the fair value of collateral. The carrying value of loans fully charged-off is zero.
The foreclosed assets amount above represents impaired real estate that has been adjusted to fair value. Foreclosed assets represent real estate which the Bank has taken control of in partial or full satisfaction of loans. At the time of foreclosure, other real estate owned is recorded at fair value less costs to sell, which becomes the property’s new basis. Any write-downs based on the asset’s fair value at the date of acquisition are charged to the allowance for loan and lease losses. After foreclosure, management periodically performs valuations such that the real estate is carried at the lower of its new cost basis or fair value, net of estimated costs to sell. Fair value adjustments on other real estate owned are recognized within net loss on real estate owned. The loss represents impairments on non-covered other real estate owned for fair value adjustments based on the fair value of the real estate.
94
Table of Contents
Note 27 – Fair Value Measurement (continued)
The Company’s property appraisals are primarily based on the sales comparison approach and income approach methodologies, which consider recent sales of comparable properties, including their income generating characteristics, and then make adjustments to reflect the general assumptions that a market participant would make when analyzing the property for purchase. These adjustments may increase or decrease an appraised value and can vary significantly depending on the location, physical characteristics and income producing potential of each property. Additionally, the quality and volume of market information available at the time of the appraisal can vary from period to period and cause significant changes to the nature and magnitude of comparable sale adjustments. Given these variations, comparable sale adjustments are generally not a reliable indicator for how fair value will increase or decrease from period to period. Under certain circumstances, management discounts are applied based on specific characteristics of an individual property.
The following table presents quantitative information about Level 3 fair value measurements for financial instruments measured at fair value on a nonrecurring basis at December 31, 2016:
| Fair Value (in thousands) |
Valuation Technique |
Unobservable Inputs |
Range, | |||||
| Impaired Originated & PNCI loans |
$1,107 | Sales comparison | Adjustment for differences | |||||
| approach | between comparable sales | Not meaningful | ||||||
| Income approach | Capitalization rate | N/A | ||||||
| Foreclosed assets |
$15 | Sales comparison | Adjustment for differences | |||||
| (Land & construction) |
approach | between comparable sales | Not meaningful | |||||
| Foreclosed assets (residential |
$1,564 | Sales comparison | Adjustment for differences | |||||
| (Residential real estate) |
approach | between comparable sales | Not meaningful | |||||
| Foreclosed assets |
$674 | Sales comparison | Adjustment for differences | |||||
| (Commercial real estate) |
approach | between comparable sales | Not meaningful |
In addition to the methods and assumptions used to estimate the fair value of each class of financial instrument noted above, the following methods and assumptions were used to estimate the fair value of other classes of financial instruments for which it is practical to estimate the fair value.
Short-term Instruments—Cash and due from banks, fed funds purchased and sold, interest receivable and payable, and short-term borrowings are considered short-term instruments. For these short-term instruments their carrying amount approximates their fair value.
Securities held to maturity—The fair value of securities held to maturity is based upon quoted prices, if available. If quoted prices are not available, fair values are measured using independent pricing models or other model-based valuation techniques such as the present value of future cash flows, adjusted for the security’s credit rating, prepayment assumptions and other factors such as credit loss assumptions. Level 1 securities include those traded on an active exchange, such as the New York Stock Exchange, U.S. Treasury securities that are traded by dealers or brokers in active over-the-counter markets and money market funds. Level 2 securities include mortgage-backed securities issued by government sponsored entities, municipal bonds and corporate debt securities. The Company had no securities held to maturity classified as Level 3 during any of the periods covered in these financial statements.
Restricted Equity Securities—It is not practical to determine the fair value of restricted equity securities due to restrictions placed on their transferability.
Originated and PNCI loans—The fair value of variable rate originated and PNCI loans is the current carrying value. The interest rates on these originated and PNCI loans are regularly adjusted to market rates. The fair value of other types of fixed rate originated and PNCI loans is estimated by discounting the future cash flows using current rates at which similar loans would be made to borrowers with similar credit ratings for the same remaining maturities. The allowance for loan losses is a reasonable estimate of the valuation allowance needed to adjust computed fair values for credit quality of certain originated and PNCI loans in the portfolio.
PCI Loans—PCI loans are measured at estimated fair value on the date of acquisition. Carrying value is calculated as the present value of expected cash flows and approximates fair value.
FDIC Indemnification Asset—The fair value of the FDIC indemnification asset is based on the discounted value of expected future cash flows under the loss-share agreement.
Deposit Liabilities—The fair value of demand deposits, savings accounts, and certain money market deposits is the amount payable on demand at the reporting date. These values do not consider the estimated fair value of the Company’s core deposit intangible, which is a significant unrecognized asset of the Company. The fair value of time deposits and other borrowings is based on the discounted value of contractual cash flows.
Other Borrowings—The fair value of other borrowings is calculated based on the discounted value of the contractual cash flows using current rates at which such borrowings can currently be obtained.
95
Table of Contents
Note 27 – Fair Value Measurement (continued)
Junior Subordinated Debentures—The fair value of junior subordinated debentures is estimated using a discounted cash flow model. The future cash flows of these instruments are extended to the next available redemption date or maturity date as appropriate based upon the spreads of recent issuances or quotes from brokers for comparable bank holding companies compared to the contractual spread of each junior subordinated debenture measured at fair value.
Commitments to Extend Credit and Standby Letters of Credit—The fair value of commitments is estimated using the fees currently charged to enter into similar agreements, taking into account the remaining terms of the agreements and the present credit worthiness of the counter parties. For fixed rate loan commitments, fair value also considers the difference between current levels of interest rates and the committed rates. The fair value of letters of credit is based on fees currently charged for similar agreements or on the estimated cost to terminate them or otherwise settle the obligation with the counter parties at the reporting date.
Fair values for financial instruments are management’s estimates of the values at which the instruments could be exchanged in a transaction between willing parties. These estimates are subjective and may vary significantly from amounts that would be realized in actual transactions. In addition, other significant assets are not considered financial assets including, any mortgage banking operations, deferred tax assets, and premises and equipment. Further, the tax ramifications related to the realization of the unrealized gains and losses can have a significant effect on the fair value estimates and have not been considered in any of these estimates.
The estimated fair values of financial instruments that are reported at amortized cost in the Corporation’s consolidated balance sheets, segregated by the level of the valuation inputs within the fair value hierarchy utilized to measure fair value, were as follows (in thousands):
| December 31, 2016 | December 31, 2015 | |||||||||||||||
| Carrying Amount |
Fair Value |
Carrying Amount |
Fair Value |
|||||||||||||
| Financial assets: |
||||||||||||||||
| Level 1 inputs: |
||||||||||||||||
| Cash and due from banks |
$ | 92,197 | $ | 92,197 | $ | 94,305 | $ | 94,305 | ||||||||
| Cash at Federal Reserve and other banks |
213,415 | 213,415 | 209,156 | 209,156 | ||||||||||||
| Level 2 inputs: |
||||||||||||||||
| Securities held to maturity |
602,536 | 603,203 | 726,530 | 732,208 | ||||||||||||
| Restricted equity securities |
16,956 | N/A | 16,596 | N/A | ||||||||||||
| Loans held for sale |
2,998 | 2,998 | 1,873 | 1,873 | ||||||||||||
| Level 3 inputs: |
||||||||||||||||
| Loans, net |
2,727,090 | 2,763,473 | 2,486,926 | 2,555,297 | ||||||||||||
| Financial liabilities: |
||||||||||||||||
| Level 2 inputs: |
||||||||||||||||
| Deposits |
3,895,560 | 3,893,941 | 3,631,266 | 3,630,129 | ||||||||||||
| Other borrowings |
17,493 | 17,493 | 12,328 | 12,328 | ||||||||||||
| Level 3 inputs: |
||||||||||||||||
| Junior subordinated debt |
$ | 56,667 | $ | 49,033 | $ | 56,470 | $ | 44,527 | ||||||||
| Contract | Fair | Contract | Fair | |||||||||||||
| Amount | Value | Amount | Value | |||||||||||||
| Off-balance sheet: |
||||||||||||||||
| Level 3 inputs: |
||||||||||||||||
| Commitments |
$ | 767,274 | $ | 7,673 | $ | 705,316 | $ | 7,053 | ||||||||
| Standby letters of credit |
$ | 12,763 | $ | 128 | $ | 8,330 | $ | 83 | ||||||||
| Overdraft privilege commitments |
$ | 98,583 | $ | 986 | $ | 94,473 | $ | 945 | ||||||||
96
Table of Contents
Note 28 – TriCo Bancshares Condensed Financial Statements (Parent Only)
Condensed Balance Sheets
| December 31, | ||||||||
| 2016 | 2015 | |||||||
| Assets | (in thousands) | |||||||
| Cash and Cash equivalents |
$ | 2,802 | $ | 2,565 | ||||
| Investment in Tri Counties Bank |
529,907 | 504,655 | ||||||
| Other assets |
1,711 | 1,714 | ||||||
|
|
|
|
|
|||||
| Total assets |
$ | 534,420 | $ | 508,934 | ||||
|
|
|
|
|
|||||
| Liabilities and shareholders’ equity |
||||||||
| Other liabilities |
$ | 406 | $ | 348 | ||||
| Junior subordinated debt |
56,667 | 56,470 | ||||||
|
|
|
|
|
|||||
| Total liabilities |
57,073 | 56,818 | ||||||
|
|
|
|
|
|||||
| Shareholders’ equity: |
||||||||
| Common stock, no par value: authorized 50,000,000 shares; issued and outstanding 22,867,802 and 22,775,173 shares, respectively |
252,820 | 247,587 | ||||||
| Retained earnings |
232,440 | 206,307 | ||||||
| Accumulated other comprehensive loss, net |
(7,913 | ) | (1,778 | ) | ||||
|
|
|
|
|
|||||
| Total shareholders’ equity |
477,347 | 452,116 | ||||||
|
|
|
|
|
|||||
| Total liabilities and shareholders’ equity |
$ | 534,420 | $ | 508,934 | ||||
|
|
|
|
|
|||||
Condensed Statements of Income
| Years ended December 31, | ||||||||||||
| 2016 | 2015 | 2014 | ||||||||||
| (in thousands) |
||||||||||||
| Interest expense |
$ | (2,229 | ) | $ | (1,977 | ) | $ | (1,403 | ) | |||
| Administration expense |
(725 | ) | (814 | ) | (2,720 | ) | ||||||
|
|
|
|
|
|
|
|||||||
| Loss before equity in net income of Tri Counties Bank |
(2,954 | ) | (2,791 | ) | (4,123 | ) | ||||||
| Equity in net income of Tri Counties Bank: |
||||||||||||
| Distributed |
16,758 | 13,304 | 8,270 | |||||||||
| Undistributed |
29,764 | 32,131 | 20,720 | |||||||||
| Income tax benefit |
1,243 | 1,174 | 1,241 | |||||||||
|
|
|
|
|
|
|
|||||||
| Net income |
$ | 44,811 | $ | 43,818 | $ | 26,108 | ||||||
|
|
|
|
|
|
|
|||||||
Condensed Statements of Comprehensive Income
| Years ended December 31, | ||||||||||||
| 2016 | 2015 | 2014 | ||||||||||
| (in thousands) | ||||||||||||
| Net income |
$ | 44,811 | $ | 43,818 | $ | 26,108 | ||||||
| Other comprehensive (loss) income, net of tax: |
||||||||||||
| Unrealized holding (losses) gains on securities arising during the period |
(6,384 | ) | (1,098 | ) | (94 | ) | ||||||
| Change in minimum pension liability |
592 | 1,246 | (4,114 | ) | ||||||||
| Change in joint beneficiary agreement liability |
(343 | ) | 277 | 148 | ||||||||
|
|
|
|
|
|
|
|||||||
| Other comprehensive (loss) income |
(6,135 | ) | 425 | (4,060 | ) | |||||||
|
|
|
|
|
|
|
|||||||
| Net income |
$ | 38,676 | $ | 44,243 | $ | 22,048 | ||||||
|
|
|
|
|
|
|
|||||||
Condensed Statements of Cash Flows
| Years ended December 31, | ||||||||||||
| 2016 | 2015 | 2014 | ||||||||||
| Operating activities: | (in thousands) | |||||||||||
| Net income |
$ | 44,811 | $ | 43,818 | $ | 26,108 | ||||||
| Adjustments to reconcile net income to net cash provided by operating activities: |
||||||||||||
| Undistributed equity in earnings of Tri Counties Bank |
(29,764 | ) | (32,131 | ) | (20,720 | ) | ||||||
| Equity compensation vesting expense |
1,467 | 1,370 | 1,133 | |||||||||
| Equity compensation tax effect |
(155 | ) | 68 | (225 | ) | |||||||
| Net change in other assets and liabilities |
(1,210 | ) | (1,120 | ) | 671 | |||||||
|
|
|
|
|
|
|
|||||||
| Net cash provided by operating activities |
15,149 | 12,005 | 6,967 | |||||||||
| Investing activities: None |
||||||||||||
| Financing activities: |
||||||||||||
| Issuance of common stock through option exercise |
518 | 660 | 616 | |||||||||
| Equity compensation tax effect |
155 | (68 | ) | 225 | ||||||||
| Repurchase of common stock |
(1,890 | ) | (412 | ) | (292 | ) | ||||||
| Cash dividends paid — common |
(13,695 | ) | (11,849 | ) | (7,807 | ) | ||||||
|
|
|
|
|
|
|
|||||||
| Net cash used for financing activities |
(14,912 | ) | (11,669 | ) | (7,258 | ) | ||||||
|
|
|
|
|
|
|
|||||||
| (decrease) increase in cash and cash equivalents |
237 | 336 | (291 | ) | ||||||||
| Cash and cash equivalents at beginning of year |
2,565 | 2,229 | 2,520 | |||||||||
|
|
|
|
|
|
|
|||||||
| Cash and cash equivalents at end of year |
$ | 2,802 | $ | 2,565 | $ | 2,229 | ||||||
|
|
|
|
|
|
|
|||||||
97
Table of Contents
Note 29 – Regulatory Matters
The Company is subject to various regulatory capital requirements administered by federal banking agencies. Failure to meet minimum capital requirements can initiate certain mandatory, and possibly additional discretionary actions by regulators that, if undertaken, could have a direct material effect on the Company’s consolidated financial statements. Under capital adequacy guidelines and the regulatory framework for prompt corrective action, the Company must meet specific capital guidelines that involve quantitative measures of the Company’s assets, liabilities and certain off-balance-sheet items as calculated under regulatory accounting practices. The Company’s capital amounts and classification are also subject to qualitative judgments by the regulators about components, risk weightings and other factors.
Quantitative measures established by regulation to ensure capital adequacy require the Company to maintain minimum amounts and ratios (set forth in the table below) of total, Tier 1, and common equity Tier 1capital to risk-weighted assets, and of Tier 1 capital to average assets.
The following tables presents actual and required capital ratios as of December 31, 2016 and 2015 for the Company and the Bank under Basel III Capital Rules. The minimum capital amounts presented include the minimum required capital levels as of December 31, 2016 and 2015 based on the phased-in provisions of the Basel III Capital Rules and the minimum required capital levels as of January 1, 2019 when the Basel III Capital Rules have been fully phased-in. Capital levels required to be considered well capitalized are based upon prompt corrective action regulations, as amended to reflect the changes under the Basel III Capital Rules.
| Minimum Capital | Minimum Capital | Required to be | ||||||||||||||||||||||||||||||
| Required – Basel III | Required – Basel III | Considered Well | ||||||||||||||||||||||||||||||
| Actual | Phase-in Schedule | Fully Phased In | Capitalized | |||||||||||||||||||||||||||||
| Amount | Ratio | Amount | Ratio | Amount | Ratio | Amount | Ratio | |||||||||||||||||||||||||
| (dollars in thousands) | ||||||||||||||||||||||||||||||||
| As of December 31, 2016: |
||||||||||||||||||||||||||||||||
| Total Capital |
||||||||||||||||||||||||||||||||
| (to Risk Weighted Assets): |
||||||||||||||||||||||||||||||||
| Consolidated |
$ | 503,283 | 14.65 | % | $ | 274,862 | 8.00 | % | $ | 360,756 | 10.50 | % | N/A | N/A | ||||||||||||||||||
| Tri Counties Bank |
$ | 500,876 | 14.59 | % | $ | 274,725 | 8.00 | % | $ | 360,577 | 10.50 | % | $ | 343,407 | 10.00 | % | ||||||||||||||||
| Tier 1 Capital |
||||||||||||||||||||||||||||||||
| (to Risk Weighted Assets): |
||||||||||||||||||||||||||||||||
| Consolidated |
$ | 468,061 | 13.62 | % | $ | 206,147 | 6.00 | % | $ | 292,041 | 8.50 | % | N/A | N/A | ||||||||||||||||||
| Tri Counties Bank |
$ | 465,654 | 13.56 | % | $ | 206,044 | 6.00 | % | $ | 291,896 | 8.50 | % | $ | 274,725 | 8.00 | % | ||||||||||||||||
| Common equity Tier 1 Capital |
||||||||||||||||||||||||||||||||
| (to Risk Weighted Assets): |
||||||||||||||||||||||||||||||||
| Consolidated |
$ | 414,632 | 12.07 | % | $ | 154,610 | 4.50 | % | $ | 240,504 | 7.00 | % | N/A | N/A | ||||||||||||||||||
| Tri Counties Bank |
$ | 465,654 | 13.56 | % | $ | 154,533 | 4.50 | % | $ | 240,385 | 7.00 | % | $ | 223,214 | 6.50 | % | ||||||||||||||||
| Tier 1 Capital (to Average Assets): |
||||||||||||||||||||||||||||||||
| Consolidated |
$ | 468,061 | 10.62 | % | $ | 176,346 | 4.00 | % | $ | 176,346 | 4.00 | % | N/A | N/A | ||||||||||||||||||
| Tri Counties Bank |
$ | 465,654 | 10.56 | % | $ | 176,341 | 4.00 | % | $ | 176,341 | 4.00 | % | $ | 220,426 | 5.00 | % | ||||||||||||||||
| As of December 31, 2015: |
||||||||||||||||||||||||||||||||
| Total Capital |
||||||||||||||||||||||||||||||||
| (to Risk Weighted Assets): |
||||||||||||||||||||||||||||||||
| Consolidated |
$ | 474,436 | 15.09 | % | $ | 251,555 | 8.00 | % | $ | 330,165 | 10.50 | % | N/A | N/A | ||||||||||||||||||
| Tri Counties Bank |
$ | 473,327 | 15.06 | % | $ | 251,418 | 8.00 | % | $ | 329,985 | 10.50 | % | $ | 314,272 | 10.00 | % | ||||||||||||||||
| Tier 1 Capital |
||||||||||||||||||||||||||||||||
| (to Risk Weighted Assets): |
||||||||||||||||||||||||||||||||
| Consolidated |
$ | 435,950 | 13.86 | % | $ | 188,666 | 6.00 | % | $ | 267,277 | 8.50 | % | N/A | N/A | ||||||||||||||||||
| Tri Counties Bank |
$ | 434,841 | 13.84 | % | $ | 188,563 | 6.00 | % | $ | 267,131 | 8.50 | % | $ | 251,418 | 8.00 | % | ||||||||||||||||
| Common equity Tier 1 Capital |
||||||||||||||||||||||||||||||||
| (to Risk Weighted Assets): |
||||||||||||||||||||||||||||||||
| Consolidated |
$ | 385,747 | 12.27 | % | $ | 141,499 | 4.50 | % | $ | 220,110 | 7.00 | % | N/A | N/A | ||||||||||||||||||
| Tri Counties Bank |
$ | 434,841 | 13.84 | % | $ | 141,422 | 4.50 | % | $ | 219,990 | 7.00 | % | $ | 204,277 | 6.50 | % | ||||||||||||||||
| Tier 1 Capital (to Average Assets): |
||||||||||||||||||||||||||||||||
| Consolidated |
$ | 435,950 | 10.79 | % | $ | 161,562 | 4.00 | % | $ | 161,562 | 4.00 | % | N/A | N/A | ||||||||||||||||||
| Tri Counties Bank |
$ | 434,841 | 10.76 | % | $ | 161,601 | 4.00 | % | $ | 161,601 | 4.00 | % | $ | 202,002 | 5.00 | % | ||||||||||||||||
As of December 31, 2016, capital levels at the Company and the Bank exceed all capital adequacy requirements under the Basel III Capital Rules on a fully phased-in basis. Also, at December 31, 2016 and 2015, the most recent regulation notifications categorized the Bank as well capitalized under the regulatory framework for prompt corrective action.
98
Table of Contents
Note 30 – Summary of Quarterly Results of Operations (unaudited)
The following table sets forth the results of operations for the four quarters of 2015 and 2014, and is unaudited; however, in the opinion of Management, it reflects all adjustments (which include only normal recurring adjustments) necessary to present fairly the summarized results for such periods.
| 2016 Quarters Ended | ||||||||||||||||
| December 31, | September 30, | June 30, | March 31, | |||||||||||||
| (dollars in thousands, except per share data) | ||||||||||||||||
| Interest and dividend income: |
||||||||||||||||
| Loans: |
||||||||||||||||
| Discount accretion PCI – cash basis |
$ | 483 | $ | 777 | $ | 426 | $ | 269 | ||||||||
| Discount accretion PCI – other |
658 | 569 | 415 | (45 | ) | |||||||||||
| Discount accretion PNCI |
637 | 883 | 1,459 | 868 | ||||||||||||
| All other loan interest income |
34,463 | 33,540 | 32,038 | 33,646 | ||||||||||||
|
|
|
|
|
|
|
|
|
|||||||||
| Total loan interest income |
36,241 | 35,769 | 34,338 | 34,738 | ||||||||||||
| Debt securities, dividends and interest bearing cash at Banks (not FTE) |
8,374 | 7,940 | 8,252 | 8,056 | ||||||||||||
|
|
|
|
|
|
|
|
|
|||||||||
| Total interest income |
44,615 | 43,709 | 42,590 | 42,794 | ||||||||||||
| Interest expense |
1,460 | 1,439 | 1,430 | 1,392 | ||||||||||||
|
|
|
|
|
|
|
|
|
|||||||||
| Net interest income |
43,155 | 42,270 | 41,160 | 41,402 | ||||||||||||
| (Benefit from reversal of) provision for loan losses |
(1,433 | ) | 3,973 | ) | (773 | ) | 209 | |||||||||
|
|
|
|
|
|
|
|
|
|||||||||
| Net interest income after provision for loan losses |
44,588 | 46,243 | 41,933 | 41,193 | ||||||||||||
| Noninterest income |
12,462 | 11,066 | 11,245 | 9,790 | ||||||||||||
| Noninterest expense |
36,563 | 37,416 | 38,267 | 33,751 | ||||||||||||
|
|
|
|
|
|
|
|
|
|||||||||
| Income before income taxes |
20,487 | 19,893 | 14,911 | 17,232 | ||||||||||||
| Income tax expense |
7,954 | 7,694 | 5,506 | 6,558 | ||||||||||||
|
|
|
|
|
|
|
|
|
|||||||||
| Net income |
$ | 12,533 | $ | 12,199 | $ | 9,405 | $ | 10,674 | ||||||||
|
|
|
|
|
|
|
|
|
|||||||||
| Per common share: |
||||||||||||||||
| Net income (diluted) |
$ | 0.54 | $ | 0.53 | $ | 0.41 | $ | 0.46 | ||||||||
|
|
|
|
|
|
|
|
|
|||||||||
| Dividends |
$ | 0.15 | $ | 0.15 | $ | 0.15 | $ | 0.15 | ||||||||
|
|
|
|
|
|
|
|
|
|||||||||
| 2015 Quarters Ended | ||||||||||||||||
| December 31, | September 30, | June 30, | March 31, | |||||||||||||
| (dollars in thousands, except per share data) | ||||||||||||||||
| Interest and dividend income: |
||||||||||||||||
| Loans: |
||||||||||||||||
| Discount accretion PCI – cash basis |
$ | 302 | $ | 445 | $ | 404 | $ | 172 | ||||||||
| Discount accretion PCI – other |
1,392 | 1,090 | 907 | 1,274 | ||||||||||||
| Discount accretion PNCI |
573 | 1,590 | 822 | 1,348 | ||||||||||||
| All other loan interest income |
32,571 | 30,689 | 29,886 | 28,371 | ||||||||||||
|
|
|
|
|
|
|
|
|
|||||||||
| Total loan interest income |
34,838 | 33,814 | 32,019 | 31,165 | ||||||||||||
| Debt securities, dividends and interest bearing cash at banks (not FTE) |
7,652 | 7,518 | 7,848 | 6,560 | ||||||||||||
|
|
|
|
|
|
|
|
|
|||||||||
| Total interest income |
42,490 | 41,332 | 39,867 | 37,725 | ||||||||||||
| Interest expense |
1,349 | 1,339 | 1,346 | 1,382 | ||||||||||||
|
|
|
|
|
|
|
|
|
|||||||||
| Net interest income |
41,141 | 39,993 | 38,521 | 36,343 | ||||||||||||
| (Benefit from) provision for loan losses |
(908 | ) | (866 | ) | (633 | ) | 197 | |||||||||
|
|
|
|
|
|
|
|
|
|||||||||
| Net interest income after provision for loan losses |
42,049 | 40,859 | 39,154 | 36,146 | ||||||||||||
| Noninterest income |
11,445 | 11,642 | 12,080 | 10,180 | ||||||||||||
| Noninterest expense |
34,684 | 31,439 | 32,436 | 32,282 | ||||||||||||
|
|
|
|
|
|
|
|
|
|||||||||
| Income before income taxes |
18,810 | 21,062 | 18,798 | 14,044 | ||||||||||||
| Income tax expense |
7,388 | 8,368 | 7,432 | 5,708 | ||||||||||||
|
|
|
|
|
|
|
|
|
|||||||||
| Net income |
$ | 11,422 | $ | 12,694 | $ | 11,366 | $ | 8,336 | ||||||||
|
|
|
|
|
|
|
|
|
|||||||||
| Per common share: |
||||||||||||||||
| Net income (diluted) |
$ | 0.50 | $ | 0.55 | $ | 0.49 | $ | 0.36 | ||||||||
|
|
|
|
|
|
|
|
|
|||||||||
| Dividends |
$ | 0.15 | $ | 0.13 | $ | 0.13 | $ | 0.11 | ||||||||
|
|
|
|
|
|
|
|
|
|||||||||
99
Table of Contents
MANAGEMENT’S REPORT ON INTERNAL CONTROL OVER FINANCIAL REPORTING
Management of TriCo Bancshares is responsible for establishing and maintaining effective internal control over financial reporting. Internal control over financial reporting is a process designed to provide reasonable assurance regarding the reliability of financial reporting and the preparation of financial statements for external purposes in accordance with U.S. generally accepted accounting principles.
Under the supervision and with the participation of management, including the principal executive officer and principal financial officer, the Company conducted an evaluation of the effectiveness of internal control over financial reporting based on the framework in the 2013 Internal Control – Integrated Framework issued by the Committee of Sponsoring Organizations of the Treadway Commission. Based on this evaluation under the framework in the 2013 Internal Control – Integrated Framework, management of the Company has concluded the Company maintained effective internal control over financial reporting, as such term is defined in Securities Exchange Act of 1934 Rules 13a-15(f), as of December 31, 2016.
Internal control over financial reporting cannot provide absolute assurance of achieving financial reporting objectives because of its inherent limitations. Internal control over financial reporting is a process that involves human diligence and compliance and is subject to lapses in judgment and breakdowns resulting from human failures. Internal control over financial reporting can also be circumvented by collusion or improper management override. Because of such limitations, there is a risk that material misstatements may not be prevented or detected on a timely basis by internal control over financial reporting. However, these inherent limitations are known features of the financial reporting process. Therefore, it is possible to design into the process safeguards to reduce, though not eliminate, this risk.
Management is also responsible for the preparation and fair presentation of the consolidated financial statements and other financial information contained in this report. The accompanying consolidated financial statements were prepared in conformity with U.S. generally accepted accounting principles and include, as necessary, best estimates and judgments by management.
Crowe Horwath LLP, an independent registered public accounting firm, has audited the Company’s consolidated financial statements as of and for the year ended December 31, 2016, and the Company’s effectiveness of internal control over financial reporting as of December 31, 2016, as stated in its report, which is included herein.
| /s/ Richard P. Smith |
| Richard P. Smith |
| President and Chief Executive Officer |
| /s/ Thomas J. Reddish |
| Thomas J. Reddish |
| Executive Vice President and Chief Financial Officer |
March 14, 2017
100
Table of Contents
REPORT OF INDEPENDENT REGISTERED PUBLIC ACCOUNTING FIRM
Board of Directors and Shareholders
TriCo Bancshares
Chico, California
We have audited the accompanying consolidated balance sheets of TriCo Bancshares as of December 31, 2016 and 2015, and the related consolidated statements of income, comprehensive income, changes in shareholders’ equity, and cash flows for each of the years in the three-year period ended December 31, 2016. We also have audited TriCo Bancshares’s internal control over financial reporting as of December 31, 2016, based on criteria established in the 2013 Internal Control – Integrated Framework issued by the Committee of Sponsoring Organizations of the Treadway Commission (COSO). TriCo Bancshares’s management is responsible for these consolidated financial statements, for maintaining effective internal control over financial reporting, and for its assessment of the effectiveness of internal control over financial reporting, included in the accompanying Management’s Report on Internal Control Over Financial Reporting. Our responsibility is to express an opinion on these consolidated financial statements and an opinion on the company’s internal control over financial reporting based on our audits.
We conducted our audits in accordance with the standards of the Public Company Accounting Oversight Board (United States). Those standards require that we plan and perform the audits to obtain reasonable assurance about whether the financial statements are free of material misstatement and whether effective internal control over financial reporting was maintained in all material respects. Our audits of the financial statements included examining, on a test basis, evidence supporting the amounts and disclosures in the financial statements, assessing the accounting principles used and significant estimates made by management, and evaluating the overall financial statement presentation. Our audit of internal control over financial reporting included obtaining an understanding of internal control over financial reporting, assessing the risk that a material weakness exists, and testing and evaluating the design and operating effectiveness of internal control based on the assessed risk. Our audits also included performing such other procedures as we considered necessary in the circumstances. We believe that our audits provide a reasonable basis for our opinions.
A company’s internal control over financial reporting is a process designed to provide reasonable assurance regarding the reliability of financial reporting and the preparation of financial statements for external purposes in accordance with generally accepted accounting principles. A company’s internal control over financial reporting includes those policies and procedures that (1) pertain to the maintenance of records that, in reasonable detail, accurately and fairly reflect the transactions and dispositions of the assets of the company; (2) provide reasonable assurance that transactions are recorded as necessary to permit preparation of financial statements in accordance with generally accepted accounting principles, and that receipts and expenditures of the company are being made only in accordance with authorizations of management and directors of the company; and (3) provide reasonable assurance regarding prevention or timely detection of unauthorized acquisition, use, or disposition of the company’s assets that could have a material effect on the financial statements.
Because of its inherent limitations, internal control over financial reporting may not prevent or detect misstatements. Also, projections of any evaluation of effectiveness to future periods are subject to the risk that controls may become inadequate because of changes in conditions, or that the degree of compliance with the policies or procedures may deteriorate.
In our opinion, the consolidated financial statements referred to above present fairly, in all material respects, the financial position of TriCo Bancshares as of December 31, 2016 and 2015, and the results of its operations and its cash flows for each of the years in the three-year period ended December 31, 2016 in conformity with accounting principles generally accepted in the United States of America. Also in our opinion, TriCo Bancshares maintained, in all material respects, effective internal control over financial reporting as of December 31, 2016, based on criteria established in the 2013 Internal Control – Integrated Framework issued by the Committee of Sponsoring Organizations of the Treadway Commission.
/s/ Crowe Horwath LLP
Sacramento, California
March 14, 2017
101
Table of Contents
ITEM 9. CHANGES IN AND DISAGREEMENTS WITH ACCOUNTANTS ON ACCOUNTING AND FINANCIAL DISCLOSURE
None.
ITEM 9A. CONTROLS AND PROCEDURES
(a) Evaluation of Disclosure Controls and Procedures
As of December 31, 2016, the end of the period covered by this Annual Report on Form 10-K, the Company’s Chief Executive Officer and Chief Financial Officer evaluated the effectiveness of the Company’s disclosure controls and procedures (as defined in Rule 13a-15(e) under the Securities Exchange Act of 1934). Based upon that evaluation, the Company’s Chief Executive Officer and Chief Financial Officer each concluded that as of December 31, 2016, the Company’s disclosure controls and procedures were effective to ensure that the information required to be disclosed by the Company in this Annual Report on Form 10-K was recorded, processed, summarized and reported within the time periods specified in the SEC’s rules and instructions for Form 10-K.
(b) Management’s Report on Internal Control over Financial Reporting and Attestation Report of Registered Public Accounting Firm
Management’s report on internal control over financial reporting is set forth on page 100 of this report and is incorporated herein by reference. The effectiveness of the Company’s internal control over financial reporting as of December 31, 2016 has been audited by Crowe Horwath LLP, an independent registered public accounting firm, as stated in its report, which is set forth on page 101 of this report and is incorporated herein by reference.
(c) Changes in Internal Control over Financial Reporting
No change in the Company’s internal control over financial reporting occurred during the fourth quarter of the year ended December 31, 2016, that has materially affected, or is reasonably likely to materially affect, the Company’s internal control over financial reporting.
All information required to be disclosed in a current report on Form 8-K during the fourth quarter of 2016 was so disclosed.
102
Table of Contents
ITEM 10. DIRECTORS, EXECUTIVE OFFICERS AND CORPORATE GOVERNANCE
The information required by this Item 10 shall either be incorporated herein by reference from the Company’s Proxy Statement for the 2017 annual meeting of shareholders, which will be filed with the Commission pursuant to Regulation 14A or included in an amendment to this Form 10-K.
ITEM 11. EXECUTIVE COMPENSATION
The information required by this Item 11 shall either be incorporated herein by reference from the Company’s Proxy Statement for the 2017annual meeting of shareholders, which will be filed with the Commission pursuant to Regulation 14A or included in an amendment to this Form 10-K.
ITEM 12. SECURITY OWNERSHIP OF CERTAIN BENEFICIAL OWNERS AND MANAGEMENT AND RELATED STOCKHOLDER MATTERS
The information required by this Item 12 shall either be incorporated herein by reference from the Company’s Proxy Statement for the 2017 annual meeting of shareholders, which will be filed with the Commission pursuant to Regulation 14A or included in an amendment to this Form 10-K.
ITEM 13. CERTAIN RELATIONSHIPS AND RELATED TRANSACTIONS, AND DIRECTOR INDEPENDENCE
The information required by this Item 13 shall either be incorporated herein by reference from the Company’s Proxy Statement for the 2017 annual meeting of shareholders, which will be filed with the Commission pursuant to Regulation 14A or included in an amendment to this Form 10-K.
ITEM 14. PRINCIPAL ACCOUNTANT FEES AND SERVICES
The information required by this Item 14 shall either be incorporated herein by reference from the Company’s Proxy Statement for the 2017 annual meeting of shareholders, which will be filed with the Commission pursuant to Regulation 14A or included in an amendment to this Form 10-K.
ITEM 15. EXHIBITS AND FINANCIAL STATEMENT SCHEDULES
| (a) | Documents filed as part of this report: |
| 1. | All Financial Statements. |
The consolidated financial statements of Registrant are included in Item 8 of this report, and are incorporated herein by reference.
| 2. | Financial statement schedules. |
Schedules have been omitted because they are not applicable or are not required under the instructions contained in Regulation S-X or because the information required to be set forth therein is included in the consolidated financial statements or notes thereto at Item 8 of this report.
| 3. | Exhibits. |
The exhibit list required by this item is incorporated by reference to the Exhibit Index filed with this report.
| (b) | Exhibits filed: |
See Exhibit Index under Item 15(a)(3) above for the list of exhibits required to be filed by Item 601 of regulation S-K with this report.
| (c) | Financial statement schedules filed: |
See Item 15(a)(2) above.
103
Table of Contents
Pursuant to the requirements of Section 13 or 15(d) of the Securities Exchange Act of 1934, the Registrant has duly caused this report to be signed on its behalf by the undersigned, thereunto duly authorized.
| Date: March 14, 2017 | TRICO BANCSHARES | |||||
| By: | /s/ Richard P. Smith | |||||
| Richard P. Smith, President and Chief Executive Officer | ||||||
Pursuant to the requirements of the Securities Exchange Act of 1934, this report has been signed below by the following persons on behalf of the Registrant in the capacities and on the dates indicated.
| Date: March 14, 2017 | /s/ Richard P. Smith | |
| Richard P. Smith, President, Chief Executive | ||
| Officer and Director (Principal Executive Officer) | ||
| Date: March 14, 2017 | /s/ Thomas J. Reddish | |
| Thomas J. Reddish, Executive Vice President and Chief Financial | ||
| Officer (Principal Financial and Accounting Officer) | ||
| Date: March 14, 2017 | /s/ Donald J. Amaral | |
| Donald J. Amaral, Director | ||
| Date: March 14, 2017 | /s/ William J. Casey | |
| William J. Casey, Director and Chairman of the Board | ||
| Date: March 14, 2017 | /s/ Craig S. Compton | |
| Craig S. Compton, Director | ||
| Date: March 14, 2017 | /s/ L. Gage Chrysler | |
| L. Gage Chrysler, Director | ||
| Date: March 14, 2017 | /s/ Cory W. Giese | |
| Cory W. Giese, Director | ||
| Date: March 14, 2017 | /s/ John S.A. Hasbrook | |
| John S.A. Hasbrook, Director | ||
| Date: March 14, 2017 | /s/ Patrick A. Kilkenny | |
| Patrick A. Kilkenny, Director | ||
| Date: March 14, 2017 | /s/ Michael W. Koehnen | |
| Michael W. Koehnen, Director | ||
| Date: March 14, 2017 | /s/ Martin A. Mariani | |
| Martin A. Mariani, Director | ||
| Date: March 14, 2017 | /s/ W. Virginia Walker | |
| W. Virginia Walker, Director | ||
104
Table of Contents
EXHIBIT INDEX
| Exhibit No. | Exhibit | |
| 3.1 | Restated Articles of Incorporation (incorporated by reference to Exhibit 3.1 to TriCo’s Current Report on Form 8-K filed on March 17, 2009). | |
| 3.2 | Bylaws of TriCo, as amended (incorporated by reference to Exhibit 3.1 to TriCo’s Current Report on Form 8-K filed February 17, 2011). | |
| 4.1 | Instruments defining the rights of holders of the long-term debt securities of the TriCo and its subsidiaries are omitted pursuant to section (b)(4)(iii)(A) of Item 601 of Regulation S-K. TriCo hereby agrees to furnish copies of these instruments to the Securities and Exchange Commission upon request. | |
| 10.1* | Form of Change of Control Agreement among TriCo, Tri Counties Bank and each of Dan Bailey, Craig Carney, John Fleshood, Richard O’Sullivan, and Thomas Reddish (incorporated by reference to Exhibit 10.2 to TriCo’s Current Report on Form 8-K filed on July 23, 2013). | |
| 10.2* | TriCo’s 2001 Stock Option Plan, as amended (incorporated by reference to Exhibit 10.7 to TriCo’s Quarterly Report on Form 10-Q for the quarter ended June 30, 2005). | |
| 10.3* | TriCo’s 2009 Equity Incentive Plan, as amended (incorporated by reference to Exhibit 10.2 to TriCo’s Current Report on Form 8-K filed April 3, 2013). | |
| 10.4* | Amended Employment Agreement between TriCo and Richard Smith dated as of March 28, 2013 (incorporated by reference to Exhibit 10.1 to TriCo’s Current Report on Form 8-K filed April 3, 2013). | |
| 10.5* | Transaction Bonus Agreement between TriCo Bancshares and Richard P. Smith dated as of August 7, 2014 (incorporated by reference to Exhibit 10.4 to TriCo’s Form 8-K filed on August 13, 2014). | |
| 10.6* | Tri Counties Bank Executive Deferred Compensation Plan restated April 1, 1992, and January 1, 2005 (incorporated by reference to Exhibit 10.9 to TriCo’s Quarterly Report on Form 10-Q for the quarter ended September 30, 2005). | |
| 10.7* | Tri Counties Bank Deferred Compensation Plan for Directors effective January 1, 2005 (incorporated by reference to Exhibit 10.10 to TriCo’s Quarterly Report on Form 10-Q for the quarter ended September 30, 2005). | |
| 10.8* | 2005 Tri Counties Bank Deferred Compensation Plan for Executives and Directors effective January 1, 2005 (incorporated by reference to Exhibit 10.11 to TriCo’s Quarterly Report on Form 10-Q for the quarter ended September 30, 2005). | |
| 10.9* | Tri Counties Bank Supplemental Retirement Plan for Directors dated September 1, 1987, as restated January 1, 2001, and amended and restated January 1, 2004 (incorporated by reference to Exhibit 10.12 to TriCo’s Quarterly Report on Form 10-Q for the quarter ended June 30, 2004). | |
| 10.10* | 2004 TriCo Bancshares Supplemental Retirement Plan for Directors effective January 1, 2004 (incorporated by reference to Exhibit 10.13 to TriCo’s Quarterly Report on Form 10-Q for the quarter ended June 30, 2004). | |
| 10.11* | Tri Counties Bank Supplemental Executive Retirement Plan effective September 1, 1987, as amended and restated January 1, 2004 (incorporated by reference to Exhibit 10.14 to TriCo’s Quarterly Report on Form 10-Q for the quarter ended June 30, 2004). | |
| 10.12* | 2004 TriCo Bancshares Supplemental Executive Retirement Plan effective January 1, 2004 (incorporated by reference to Exhibit 10.15 to TriCo’s Quarterly Report on Form 10-Q for the quarter ended June 30, 2004). | |
| 10.13* | Form of Joint Beneficiary Agreement effective March 31, 2003 between Tri Counties Bank and each of George Barstow, Dan Bay, Ron Bee, Craig Carney, Robert Elmore, Greg Gill, Richard Miller, Richard O’Sullivan, Thomas Reddish, Jerald Sax, and Richard Smith (incorporated by reference to Exhibit 10.14 to TriCo’s Quarterly Report on Form 10-Q for the quarter ended September 30, 2003). | |
| 10.14* | Form of Joint Beneficiary Agreement effective March 31, 2003 between Tri Counties Bank and each of Don Amaral, William Casey, Craig Compton, John Hasbrook, Michael Koehnen, Donald Murphy, Carroll Taresh, and Alex Vereschagin (incorporated by reference to Exhibit 10.15 to TriCo’s Quarterly Report on Form 10-Q for the quarter ended September 30, 2003). | |
| 10.15* | Form of Tri Counties Bank Executive Long Term Care Agreement effective June 10, 2003 between Tri Counties Bank and each of Craig Carney, Richard Miller, Richard O’Sullivan, and Thomas Reddish (incorporated by reference to Exhibit 10.16 to TriCo’s Quarterly Report on Form 10-Q for the quarter ended September 30, 2003). | |
| 10.16* | Form of Tri Counties Bank Director Long Term Care Agreement effective June 10, 2003 between Tri Counties Bank and each of Don Amaral, William Casey, Craig Compton, John Hasbrook, Michael Koehnen, Carroll Taresh, and Alex Vereschagin (incorporated by reference to Exhibit 10.17 to TriCo’s Quarterly Report on Form 10-Q for the quarter ended September 30, 2003). | |
| 10.17* | Form of Indemnification Agreement between TriCo and its directors and executive officers (incorporated by reference to Exhibit 10.1 to TriCo’s Current Report on Form 8-K filed September 10, 2013). | |
| 10.18* | Form of Indemnification Agreement between Tri Counties Bank its directors and executive officers (incorporated by reference to Exhibit 10.2 to TriCo’s Current Report on Form 8-K filed September 10, 2013). | |
| 10.19* | Form of Stock Option Agreement and Grant Notice pursuant to TriCo’s 2009 Equity Incentive Plan (incorporated by reference to Exhibit 10.1 to TriCo’s Current Report on Form 8-K filed May 25, 2010). | |
| 10.20* | Form of Restricted Stock Unit Agreement and Grant Notice for Non-Employee Executives pursuant to TriCo’s 2009 Equity Incentive Plan (incorporated by reference to Exhibit 10.1 to TriCo’s Current Report on Form 8-K filed November 14, 2014). | |
105
Table of Contents
| Item 6 | – Exhibits (continued) |
| 10.21* | Form of Restricted Stock Unit Agreement and Grant Notice for Directors pursuant to TriCo’s 2009 Equity Incentive Plan (incorporated by reference to Exhibit 10.1 to TriCo’s Current Report on Form 8-K filed November 14, 2014). | |
| 10.22* | Form of Performance Award Agreement and Grant Notice pursuant to TriCo’s 2009 Equity Incentive Plan (incorporated by reference to Exhibit 10.3 to TriCo’s Current Report on Form 8-K filed August 13, 2014). | |
| 10.23* | John Fleshood Offer Letter dated November 3, 2016 (incorporated by reference to Exhibit 10.1 to TriCo’s Current Report on Form 8-K filed on November 30, 2016). | |
| 10.24* | Amendment to John Fleshood Offer Letter dated December 19, 2016 (incorporated by reference to Exhibit 10.1 to TriCo’s Current Report on Form 8-K filed on November 30, 2016). | |
| 21.1 | List of Subsidiaries | |
| 23.1 | Independent Registered Public Accounting Firm’s Consent | |
| 31.1 | Rule 13a-14(a)/15d-14(a) Certification of CEO | |
| 31.2 | Rule 13a-14(a)/15d-14(a) Certification of CFO | |
| 32.1 | Section 1350 Certification of CEO | |
| 32.2 | Section 1350 Certification of CFO | |
| 101.INS | XBRL Instance Document | |
| 101.SCH | XBRL Taxonomy Extension Schema Document | |
| 101.CAL | XBRL Taxonomy Extension Calculation Linkbase Document | |
| 101.LAB | XBRL Taxonomy Extension Label Linkbase Document | |
| 101.PRE | XBRL Taxonomy Extension Presentation Linkbase Document | |
| 101.DEF | XBRL Taxonomy Extension Definition Linkbase Document | |
| * | Management contract or compensatory plan or arrangement |
106