Attached files
| file | filename |
|---|---|
| 8-K - FORM 8-K - CU Bancorp | d762662d8k.htm |
 CU
Bancorp Investor Presentation
as of June 30, 2014
Exhibit 99.1
…
a better banking experience |
 2
Forward-Looking Statements
This
press
release
contains
certain
forward-looking
information
about
CU
Bancorp
(the
“Company”),
1
st
Enterprise
Bank
and
the
combined
company
after
the
close
of
the
transaction
that
is
intended
to
be
covered
by
the
safe
harbor for “forward looking statements”
provided by the Private Securities Litigation Reform Act of 1995. All statements
other than statements of historical fact are forward-looking statements. Such statements involve inherent
risks and uncertainties, many of which are difficult to predict and are generally
beyond the control of the Company. Forward-looking statements speak only as of the date they are made and we assume no duty to update such
statements. We caution readers that a number of important factors could
cause actual results to differ materially from those expressed in, implied or projected by, such forward-looking statements. Risks and uncertainties
include,
but
are
not
limited
to:
lower
than
expected
revenues;
credit
quality
deterioration
or
a
reduction
in
real
estate
values
could
cause
an
increase
in
the
allowance
for
credit
losses
and
a
reduction
in
net
earnings;
increased
competitive pressure among depository institutions; the Company’s ability to
complete future acquisitions, successfully integrate such acquired entities, or achieve expected beneficial synergies and/or operating efficiencies
within expected time-frames or at all; the possibility that personnel changes
will not proceed as planned; the cost of additional capital is more than expected; a change in the interest rate environment reduces net interest
margins; asset/liability repricing risks and liquidity risks; legal matters could
be filed against the Company and could take longer or cost more than expected to resolve or may be resolved adversely to the Company; general
economic
conditions,
either
nationally
or
in
the
market
areas
in
which
the
Company
does
or
anticipates
doing
business,
are
less
favorable
than
expected;
environmental
conditions,
including
natural
disasters
and
drought,
may
disrupt our business, impede our operations, negatively impact the values of
collateral securing the Company’s loans and leases or impair the ability of our borrowers to support their debt obligations; the economic and
regulatory
effects
of
the
continuing
war
on
terrorism
and
other
events
of
war,
including
the
conflicts
in
the
Middle
East;
legislative
or
regulatory
requirements
or
changes
adversely
affecting
the
Company’s
business;
changes
in
the securities markets; regulatory approvals for any capital activities cannot be
obtained on the terms expected or on the anticipated schedule; and, other risks that are described in CU Bancorp’s public filings with the U.S.
Securities and Exchange Commission (the “SEC”). Additional risks
and uncertainties relating to the proposed transaction with 1st Enterprise Bank include, but are not limited to: the ability to complete the proposed transaction,
including obtaining regulatory approvals and approvals by the shareholders of CU
Bancorp and 1st Enterprise Bank; the length of time necessary to consummate the proposed transaction; the ability to successfully integrate the
two
institutions
and
achieve
expected
synergies
and
operating
efficiencies
on
the
expected
timeframe;
unexpected
costs
relating
to
the
proposed
transaction;
and
the
potential
impact
on
the
institutions’
respective
businesses
as
a result
of
uncertainty
surrounding
the
proposed
transaction.
If
any
of
these
risks
or
uncertainties
materializes
or
if
any
of
the
assumptions
underlying
such
forward-looking
statements
proves
to
be
incorrect,
CU
Bancorp’s
results
could
differ
materially
from
those
expressed
in,
implied
or
projected
by
such
forward-looking
statements.
CU
Bancorp
assumes
no
obligation
to
update
such
forward-looking
statements.
For
a
more
complete
discussion
of risks and uncertainties, investors and security holders are urged to read CU
Bancorp’s annual report on Form 10-K, quarterly reports on Form 10-Q and other reports filed by CU Bancorp with the SEC. The documents filed by
CU
Bancorp
with
the
SEC
may
be
obtained
at
CU
Bancorp’s
website
at
www.cubancorp.com
or
at
the
SEC’s
website
at
www.sec.gov.
These
documents
may
also
be
obtained
free
of
charge
from
CU
Bancorp
by
directing
a
request
to:
CU
Bancorp
c/o
California
United
Bank,
15821
Ventura
Boulevard,
Suite
100,
Encino,
CA
91436.
Attention:
Investor
Relations.
Telephone
818-257-7700.
CU
BANCORP,
CALIFORNIA
UNITED
BANK
AND
1
ST
ENTERPRISE
BANK
MERGER
ANNOUNCEMENT
On
June
3,
2014,
CU
Bancorp
announced
that
it
had
entered
into
an
Agreement
and
Plan
of
Merger
(the
“Merger
Agreement”)
among
CU
Bancorp,
California
United
and
1st
Enterprise
Bank,
a
California
state-chartered
commercial
bank
(“1st
Enterprise”)
pursuant
to
which
CU
Bancorp
will
acquire
1st
Enterprise
Bank
by
merging
1st
Enterprise
Bank
with
and
into
California
United
Bank
(the
“Merger”).
California
United
Bank
will
survive
the
Merger
and
will
continue
the
commercial
banking
operations
of
the
combined
bank
following
the
Merger.
Under
the
terms
of
the
Merger
Agreement,
holders
of
1st
Enterprise
Bank
common
stock
will
receive
shares
of
CU
Bancorp
common
stock
based
upon
a
fixed
exchange
ratio
of
1.3450
shares
of
CU
Bancorp
common
stock
for
each
share
of
1st
Enterprise
Bank
common
stock.
The
U.S.
Treasury,
as
the
holder
of
all
outstanding
shares
of
1st
Enterprise
Bank
preferred
stock
granted
in
connection
with
1st
Enterprise’s
participation
in
the
Treasury’s
Small
Business
Lending
Fund
program,
will
receive,
in
exchange
for
these
shares,
a
new
series
of
CU
Bancorp
preferred
stock
having
the
same
rights
(including
with
respect
to
dividends),
preferences,
privileges,
voting
powers,
limitations
and
restrictions
as
the
1st
Enterprise
preferred
stock.
The
Merger
is
subject
to
customary
closing
conditions,
including
regulatory
and
shareholder
approvals.
ADDITIONAL
INFORMATION
ABOUT
THE
PROPOSED
TRANSACTION
WITH
1
ST
ENTERPRISE
BANK
AND
WHERE
TO
FIND
IT
Investors
and
security
holders
are
urged
to
carefully
review
and
consider
each
of
CU
Bancorp’s
public
filings
with
the
SEC,
including
but
not
limited
to
its
annual
reports
on
Form
10-K,
proxy
statements,
current
reports
on
Form
8-K
and
quarterly
reports
on
Form
10-Q.
The
documents
filed
by
CU
Bancorp
with
the
SEC
may
be
obtained
free
of
charge
at
CU
Bancorp’s
website
at
www.cubancorp.com
or
at
the
SEC
website
at
www.sec.gov.
These
documents
may also be obtained free of charge from CU Bancorp by directing
a request to: CU Bancorp c/o California United Bank, 15821 Ventura Boulevard,
Suite 100, Encino, CA 91436. Attention: Investor Relations. Telephone 818-257-
7700. The information on CU Bancorp’s website is not, and shall not be
deemed to be, a part of this filing or incorporated into other filings CU Bancorp makes with the SEC.
In
connection
with
the
proposed
merger
of
California
United
Bank
with
1
st
Enterprise
Bank,
CU
Bancorp
intends
to
file
a
registration
statement
on
Form
S-4
with
the
SEC
to
register
the
shares
of
CU
Bancorp
common
stock
to
be
issued
to
shareholders
of
1
st
Enterprise
Bank.
The
registration
statement
will
include
a
joint
proxy
statement
of
CU
Bancorp
and
1
st
Enterprise
and
a
prospectus
of
CU
Bancorp,
and
each
party
will
file
other
documents
regarding
the
proposed
transaction
with
the
SEC.
Before
making
any
voting
or
investment
decision,
investors
and
security
holders
of
CU
Bancorp
and
1
st
Enterprise
Bank
are
urged
to
carefully
read
the
entire
registration
statement
and
joint
proxy
statement/prospectus,
when
they
become
available,
as
well
as
any
amendments
or
supplements
to
these
documents,
because
they
will
contain
important
information
about
the
proposed
transaction.
A
definitive
joint
proxy
statement/prospectus
will
be
sent
to
the
shareholders
of
each
institution
seeking
any
required
stockholder
approvals.
Investors
and
security
holders
will
be
able
to
obtain
the
registration statement and the joint proxy statement/prospectus free of charge
from the SEC’s website or from CU Bancorp by writing to the address provided in the paragraph above.
PARTICIPANTS IN THE SOLICITATION
CU
Bancorp
and
its
directors
and
executive
officers
may
be
deemed
to
be
participants
in
the
solicitation
of
proxies
from
the
shareholders
of
CU
Bancorp
and
1
st
Enterprise
Bank
in
connection
with
the
transaction.
Information
about
the
directors
and
executive
officers
of
CU
Bancorp
is
set
forth
in
its
annual
report
on
Form
10-K/A
filed
with
the
SEC
on
April
29,
2014.
1st
Enterprise
Bank
and
its
directors
and
executive
officers
may
also
be
deemed
to
be
participants
in
the
solicitation
of
proxies
from
the
shareholders
of
CU
Bancorp
and
1st
Enterprise
Bank
in
connection
with
the
Merger.
Additional information regarding the interests of these participants and other
persons who may be deemed participants in the Merger may be obtained by reading the proxy statement/prospectus regarding the Merger when it
becomes available.
This communication does not constitute an offer to sell or the solicitation of an
offer to buy any securities or a solicitation of any vote or approval. |
 3
Investment Highlights
……….……………….……… 4
Earnings Review
..……………………..………………
14
Appendix
………………………..……………………
24
CUNB & FENB Merger Overview.
..……………………31 |
 4
Investment Highlights
Premier community-based business banking
franchise serving large and diverse market
Strong organic loan growth
Attractive low-cost core deposit base
Exceptional credit quality
Growing visibility in the investment community
Announced merger with 1 Enterprise Bank to
create
$2.2
billion
“pure
play”
business
bank
in
attractive Southern California market
st |
 5
Premier Business Banking Franchise
$1.4 billion in assets, achieved by experienced management
team* in nine years, through organic growth and two successful
acquisitions
16
th
largest publicly-owned bank by assets in combined Los Angeles, Orange and
Ventura counties
279
th
largest publicly-owned bank by assets in U.S.
Asset CAGR of 39% since inception in 2005 through 12/31/13
Footprint includes eight branches covering L.A., Orange and Ventura counties
*See appendix for management experience |
 6
Sophisticated Relationship Management Team offers
Solutions for Small-
and Medium-Sized Businesses
Sophisticated relationship management team offers personalized and
responsive
service
focused
on
small-
and
medium-sized
businesses
in
Los
Angeles, Orange and Ventura counties
Los Angeles County is the largest manufacturing center in the U.S. and would be
9
th
largest state in U.S.
L.A.
County
expected
to
add
more
than
150,000
jobs
over
the
next
two
years;
June
2014
unemployment rate of 8.2% projected to fall to 7.2% by end of 2015*
Orange County would be 31
st
largest state in U.S.
Orange County unemployment rate is 5.2% as of June 2014**
Three-county
area
is
home
to
more
than
532,000
small-
and
middle-market
business** (defined as employing 1 to 499 workers)
*Source: Forecast by Beacon Economics, February 2014; actual unemployment rate from
Bureau of Labor and Statistics (BLS)
**Source: County data from Los Angeles Economic Development Corporation and California
EDD, as of 2012; actual unemployment rate from BLS |
 7
Franchise Growth Strategies
Organic Growth
Offer expertise in C&I and commercial real estate lending to small and
middle- market businesses
Provide customers with sophisticated products and solutions
Leverage relationship-based banking approach and superior service
SBA lending platform expertise acquired with Premier Commercial Bank
Continue
recruiting
“in
market”
talent
from
competitors
Growth by Merger/Acquisition
Strong management team experienced with successful, accretive acquisitions
California Oaks State Bank (12/31/10)
Premier Commercial Bank (7/31/12)
1
Enterprise Bank (Announced 6/3/14, expected to close in fourth quarter 2014)
st |
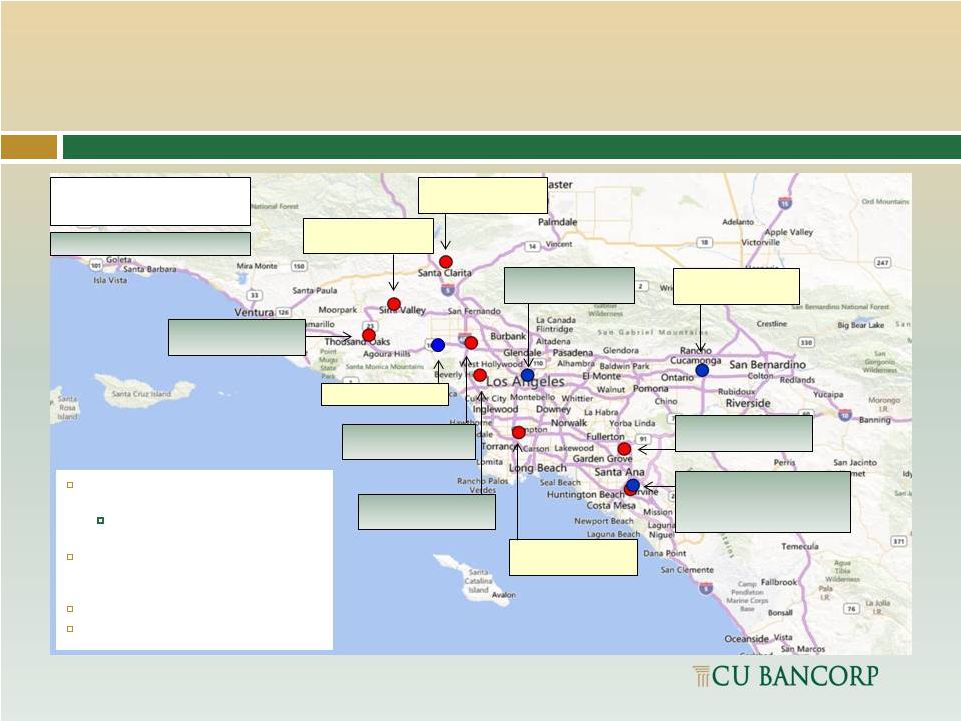
 Strategic
Geographic Locations Encino (2005) –
Headquarters
Los Angeles (2006)
Santa Clarita Valley (2007)
South
Bay
(2009)
–
Converted
to
a
branch
in
2010
Orange
County
(2010)
–
Loan
Production
Office*
Simi
Valley
(2010)
–
Acquired
from
California
Oaks
State Bank
Thousand
Oaks
(2010)
–
Acquired
from
California
Oaks
State Bank
Anaheim
(2012)
–
Acquired
from
Premier
Commercial
Bank
Irvine/Newport
Beach
(2012)
–
Acquired
from
Premier
Commercial Bank*
CUB Branch
Former COSB
Branch
Former PCB Branch
*Combined location (August 2013)
Encino
8
California United Bank has a footprint that
spans the most attractive markets in
Southern California:
|
 Announced
Merger Has Attractive Footprint and Large Branch Size
CUNB (8 branches)
FENB (3 branches; 1 LPO)
Inland Empire:
FENB: $81 million
Downtown LA:
FENB: $331 million
Irvine/Newport Beach:
CUNB: $148 million
FENB: $240 million
Pro Forma: $388 million
Santa Clarita Valley:
CUNB: $94 million
Simi Valley:
CUNB: $14 million
West LA:
CUNB: $256
million
San Fernando Valley:
CUNB: $207 million
Anaheim:
CUNB: $191 million
$100 Million+ Branches
Woodland Hills LPO
South Bay:
CUNB: $55 million
Conejo Valley:
CUNB: $229 million
Source: CUNB and FENB; branch deposits data as of March 31, 2014
9
6 of 10 pro forma branches with
deposits greater than $100 million
Branch consolidation in Irvine
Woodland Hills LPO to be consolidated
into a CUNB branch
Expands CUNB’s branch presence to
Downtown LA (pro forma headquarters) and
Inland Empire
Pro forma average branch size of approx.
$185 million in deposits |
 Strong
Organic Loan Growth CUB lenders’
expertise allows the Bank to underwrite complex loans, while providing
better service than larger banks
Total loans grew 10.7% to $980 million from 2Q13 to 2Q14
Total loans grew 3.6% from 1Q14 to 2Q14, a 14.4% annualized rate
52% of total loans are commercial and industrial loans, and owner-occupied
nonresidential properties—relationship-based “sticky”
accounts
Since inception in 2005 loan portfolio has grown to $980 million
$778 million in net organic loan growth, in addition to two acquisitions
Annual Loan Growth ($ in millions)
Portfolio Composition
10 |
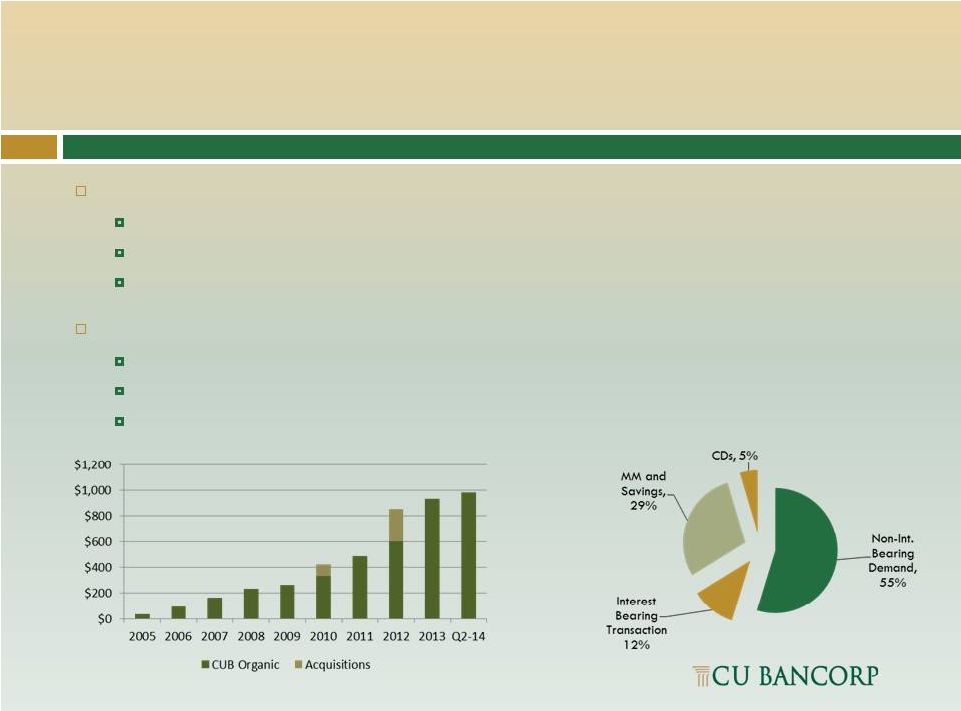 Attractive
Low Cost Deposit Base Total deposits of $1.2 billion
Increased $148 million or 13.4% from 2Q13 to 2Q14
Increased $42 million or 3.5% from 1Q14 to 2Q14
Cost of deposits was 0.11% in 2Q14
Non-interest bearing deposits of $682 million
55% of total deposits
Up 19.5% from 2Q13 to 2Q14
Up 4.7% from 1Q14 to 2Q14, an 18.8% annualized rate
Deposit Composition
Total Deposit Growth Since Inception
11 |
 12
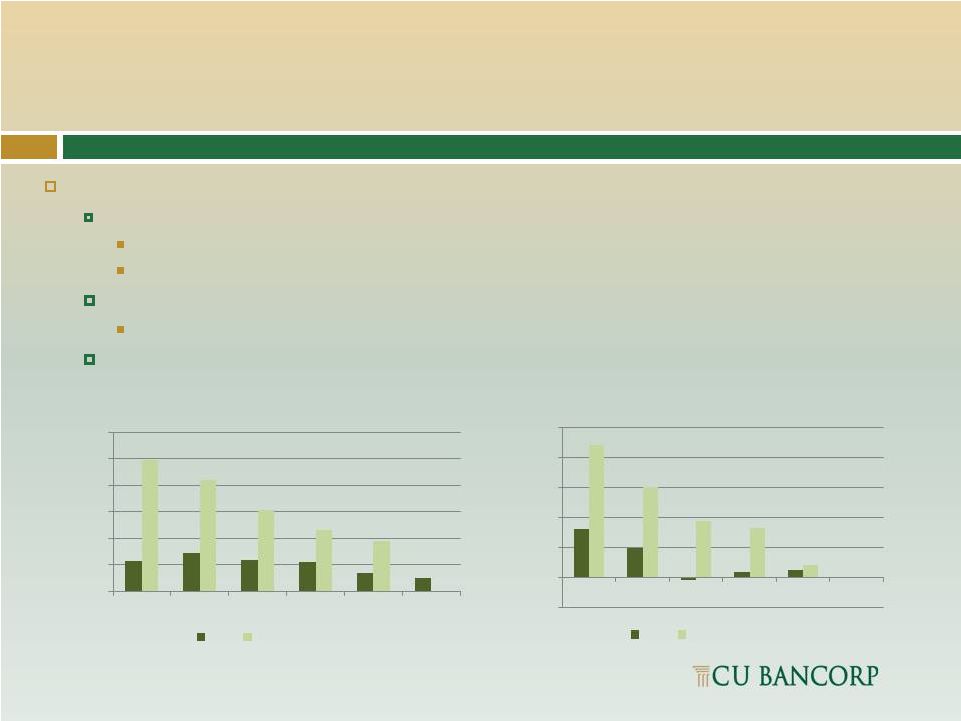
Strong Credit Quality Trend Continues
CUB credit quality at June 30, 2014:
Total nonaccrual loans of $7.0 million or 0.72% of total loans
71% of nonaccrual loans were acquired loans marked-to-market at the time of
acquisition Excluding acquired loans, total nonaccrual loans were $2.0 million or
0.29% of total loans NPAs to total assets of 0.51%
One REO in 2Q14 of $219 thousand, sold early in 3Q14 for approximate book value
Net recoveries in 2Q14 of $53 thousand; net recoveries year to date of $198
thousand Peer group includes California banks or bank holding companies with total
assets
between
$1.0-2.0
billion;
source:
SNL.
NPAs to total assets
Net charge-offs
1.12%
1.42%
1.19%
1.09%
0.68%
0.51%
4.94%
4.19%
3.06%
2.31%
1.89%
0.00%
1.00%
2.00%
3.00%
4.00%
5.00%
6.00%
2009
2010
2011
2012
2013
2Q-14
CUB
Peer Group Avg.
0.80%
0.49%
-0.04%
0.08%
0.12%
-0.02%
2.20%
1.50%
0.94%
0.82%
0.21%
0.50%
0.00%
0.50%
1.00%
1.50%
2.00%
2.50%
2009
2010
2011
2012
2013
CUB
Peer Group Avg.
12
2Q-14 |
 Growing
Visibility in the Investment Community Surpassed $1 billion in assets in July
2012 Transferred listing to Nasdaq Capital Market in October 2012 (CUNB)
36.2% institutional ownership per 1Q14 13-f filings
11.2 million shares outstanding at 6/30/14
$211 million market cap at 7/21/14
Added to Russell Indexes in June 2013
Analyst coverage by five Wall Street brokerage firms
Year to date performance vs. KBW Bank Index (BKX), Nasdaq
Composite Index (NASDAQ), ABA Nasdaq Bank Index (ABAQ)
and Russell 2000 Index (RUT)
CUNB has had a strong performance in a
challenging year. Year to date, it’s up
7.0%, compared to the NASDAQ, up
5.9%, the BKX bank index, up 1.8% and
the Russell 2000 and the ABA NASDAQ
Bank Index, which are down (1.5)% and
(3.2)%, respectively, as of 7/21/14.
13 |
 14
Earnings Review
Second Quarter 2014 |
 15
Second Quarter 2014 Highlights
Net income of $2.4 million, 2.8% increase from $2.3 million in 2Q13
EPS of $0.21, compared to $0.22 in 2Q13
Core net income of $2.9 million, 24% increase from $2.3 million in 2Q13
Core EPS of $0.26, 18.2% increase from $0.22 in 2Q13
Total loans increased $95 million or 10.7% from 2Q13
$151 million in net organic loan growth
Offset by $56 million in loan run-off from acquired portfolios
Total deposits increased $148 million, or 13.4%, from 2Q13
Non-interest
bearing
deposits
increased
$111
million,
or
19.5%,
from
2Q13
Continued strong credit quality
NPAs to total assets of 0.51%, down from 1.06% in 2Q13
Net recoveries of $53 thousand in 2Q14 |
 Snapshot
of Income Statement for 2Q14 $ in thousands, except per share data
Core net income increased 24% year over year
Income Statement
2Q 14
2Q 13
% change
EPS -
fully diluted
$0.21
$0.22
-5%
Core EPS
$0.26
$0.22
18%
Net Income
2,386
2,321
3%
Core Net Income
2,883
2,321
24%
Net Interest income
12,578
12,580
0.0%
Non-interest income
1,783
1,690
6%
Gain on sale of SBA loans
167
60
178%
Non-interest expense
9,698
9,281
4%
Core non-interest expense
9,201
9,281
-1%
Provision for loan losses
408
1,153
-65%
16 |
 17
Improving Operating Leverage
*3Q12 operating expenses excludes $2.5 million in merger-related expenses; 2Q14
excludes $497 thousand in merger-related expenses $6
$7
$8
$9
$10
$11
$12
$13
$14
$15
Revenue
Operating Expenses |
 Snapshot
of Balance Sheet 2Q14 vs. 2Q13
$ in thousands
*Non-interest bearing deposits now account for 55% of total deposits
Year over year: total loans up 11%, non-interest bearing deposits up 19%
Balance Sheet
2Q14
2Q13
% change
Assets
$1,430,313
$1,278,661
12%
Total loans
979,890
885,027
11%
Total deposits
1,245,280
1,097,707
13%
Non-interest bearing demand deposits*
682,300
571,045
19%
Shareholders' equity
145,438
129,567
12%
18 |
 Snapshot
of Performance Ratios 2Q14 vs. 2Q13
Performance Ratios
2Q 14
2Q 13
% change
Net interest margin
3.88%
4.25%
-9%
ROAA
0.69%
0.73%
-5%
Core ROAA
0.83%
0.73%
14%
ROAE
6.63%
7.16%
-7%
Core ROAE
8.01%
7.16%
12%
Efficiency ratio
68%
65%
4%
Core efficiency ratio
64%
65%
-1%
19 |
 Snapshot
of Income Statement and Balance Sheet 2Q14 vs. 1Q14
$ in thousands, except per share data
Income Statement
2Q 14
1Q 14
% change
EPS
$0.21
$0.24
-13%
Core EPS
$0.26
$0.24
8.3%
Net Income
2,386
2,666
-11%
Core Net Income
2,883
2,666
8%
Net Interest income
12,578
12,173
3%
Non-Interest income
1,783
1,790
0%
Non-Interest expense
9,698
9,549
2%
Core non
-interest expense
9,201
9,549
-4%
Balance Sheet
Assets
1,430,313
1,382,363
3%
Total loans
979,890
945,507
4%
Total deposits
1,245,280
1,203,398
3%
Non-interest bearing demand deposits
682,300
651,645
5%
Shareholders' equity
145,438
142,258
2%
20 |
 21
Snapshot of Income Statement and
Balance Sheet for 1H14 & 1H13
For the Six Months Ended
Income Statement
2014
2013
% change
EPS
$0.45
$0.42
7%
Net income
5,052
4,476
13%
Net Interest income
24,751
24,118
3%
Non-Interest income
3,573
3,116
15%
Gain on sale of SBA loans
605
410
48%
Non-Interest expense
19,247
18,590
4%
Provision for loan losses
483
1,287
-62%
Balance Sheet
Assets
1,430,313
1,278,661
12%
Total loans
979,890
885,027
11%
Total deposits
1,245,280
1,097,707
13%
Non-interest bearing DDA
682,300
571,045
19% |
 Snapshot
of Shares Outstanding, Market Cap and Tangible Book Value, 2Q14 vs. 2Q13
Shares Outstanding & Market Cap
2Q 14
2Q 13
% change
Share price
$19.07
$15.80
21%
Market cap
$214,008,021
$169,601,150
26%
Diluted average shares outstanding
11,159,000
10,660,000
4%
Common shares issued and outstanding
11,222,235
10,734,250
5%
Tangible book value
$11.66
$10.78
8%
22 |
 CU
Bancorp is Well Capitalized by all Regulatory Ratios
CU
Bancorp
is
“well
capitalized”
as
defined
by
federal
regulations,
which
is
the
highest
regulatory classification.
Regulatory Ratios
"Well Capitalized"
2Q 14
2Q 13
Tier 1 Leverage
5.0%
10.38%
9.85%
Tier 1 Risk-
based Capital
6.0%
11.79%
11.69%
Total Risk-based Capital
10.0%
12.75%
12.60%
23 |
 Appendix
24 |
 Experienced Management Team
*Formerly EVP at Premier Commercial Bank, N.A.
Name
Title
Functional
Banking Exp
CUB Tenure
David Rainer
President
Chief Executive Officer
34 years
9 years
Anne Williams
EVP
Chief Operating Officer and Chief Credit Officer
34 years
9 years
Karen Schoenbaum
EVP
Chief Financial Officer
21 years
5 years
Anita Wolman
EVP
Chief Administrative Officer and General Counsel
37 years
9 years
Sam Kunianski
EVP
Executive Manager –
Commercial and Private Banking
30 years
8 years
William Sloan
EVP
Executive Manager –
Real Estate and Santa Clarita Regional Manager
30 years
9 years
Stephen Pihl
EVP
Executive Manager –
SBA and Orange County Regional Manager
27 years
2 years*
25 |
 Asset
Quality & Allowance for Loan Losses $ in thousands
Asset Quality
2Q14
2Q13
% change
Organic loans on non-accrual
$2,046
$3,750
-45%
Acquired loans on non-accrual
4,982
6,719
-26%
Total non-accrual
$7,028
$10,469
-33%
REO
219
3,112
-93%
Total non-accrual loans & REO
$7,247
$13,581
-47%
Net charge offs (recoveries) Qtrly
-53
678
NM
Non-accruals to total loans
0.72%
1.18%
-39%
Non-performing assets to total assets
0.51%
1.06%
-52%
Allowance for loan losses to total loans
1.15%
1.06%
8%
ALL as % of total loans (excluding acquired loans)
1.45%
1.50%
-3%
Net YTD charge-offs as % of avg YTD loans
-0.02%
0.08%
NM
ALL as % of non-accrual organic loans
551.4%
251%
120%
ALL as % of total non-accrual loans (org. & acq.)
160.5%
89.9%
79%
26 |
 27
Reconciliation of Non-GAAP Measures
The Company utilizes the term Core Net Income, a non-GAAP financial measure. CU
Bancorp’s management believes Core Net Income is useful because it is a measure utilized by management and market
analysts to understand the effects of merger expenses and provides an alternative view of
the Company’s performance over time and in comparison to the Company’s competitors. Core net income should
not be viewed as a substitute for net income. A reconciliation of CU Bancorp’s
Net Income to Core Net Income, as well as related ratios is presented in the tables below for the periods indicated:
(Dollars in thousands except per share data)
Three Months Ended
30-Jun-14
31-Mar-14
30-Jun-13
Net Income
$
2,386
$
2,666
$
2,321
Add back: Merger related expenses
497
–
–
Core Net Income
$
2,883
$
2,666
$
2,321
Average Assets
$
1,390,257
$
1,385,845
$
1,280,395
ROAA
0.69%
0.78%
0.73%
Core ROAA*
0.83%
0.78%
0.73%
Average Equity
$
144,427
$
140,439
$
130,010
ROAE
6.63%
7.70%
7.16%
Core ROAE**
8.01%
7.70%
7.16%
Diluted Average Shares Outstanding
11,159,000
11,095,000
10,660,000
Diluted Earnings Per Share
$
0.21
$
0.24
$
0.22
Core Diluted Earnings Per Share***
$
0.26
$
0.24
$
0.22
* Core ROAA: Annualized core net income/average assets
** Core ROAE: Annualized core net income/average equity
*** Core Diluted Earnings Per Share: Annualized core net income/diluted average shares
outstanding Three Months Ended
June 30, 2014
March 31, 2014
June 30, 2013
Net Interest Income
$
12,578
$
12,173
$
12,580
Non-Interest Income
1,783
1,790
1,690
Non-Interest Expense
9,698
9,549
9,281
Subtract: Merger related expenses
497
–
–
Core Non-Interest Expense
$
9,201
$
9,549
$
9,281
Efficiency Ratio
68%
68%
65%
Core Efficiency Ratio*
64%
68%
65%
* Core Efficiency Ratio: Core non-interest expense / (non-interest income + net
interest income) |
 Loans by
Industry – C&I and Owner-Occupied CRE
28 |
 Customer
Profile Our customer base reflects the diversity
of industries in Southern California
Significant percentage of customers involved in the manufacturing, distribution and
services industries
Typical customer has between $10 million and $60 million in annual sales (excluding
SBA borrowers)
Typical loan commitment ranges between $1 million and $5 million
(excluding SBA
loans)
Majority of new customers come from larger banks
Most new business generation results from warm leads provided by
referral sources
29 |
 Shareholders of CUB Acquisitions Have
Been Well Rewarded
1
st
Enterprise Bank (FENB) –
Acquisition announced June 3, 2014
California Oaks State Bank (COSB) –
Acquisition announced Aug. 25, 2010; Premier Commercial Bancorp
(PCBP) –
Acquisition announced Dec. 9,
2011
30
$20.00
$20.50
$21.00
$21.50
$22.00
$22.50
$23.00
$23.50
$24.00
$24.50
$25.00
$0.00
$2.00
$4.00
$6.00
$8.00
$10.00
$12.00
$14.00
$16.00
$18.00
$20.00
$0.00
$2.00
$4.00
$6.00
$8.00
$10.00
$12.00
$14.00
$16.00
$18.00
$20.00
COSB
8/24/10
$6.00
CUNB
7/21/14
$18.70
PCBP
12/8/11
$9.00
CUNB
7/21/14
$18.70
FENB
6/2//14
$21.75
FENB
7/21/14
$24.65 |
 CUNB
& FENB Merger Overview 31 |
 Transaction Rationale
Combination
to
create
a
$2.2
billion
“pure
play”
business
bank
in
Southern
California
Both companies have a track record of strong organic growth
Scarcity value for a business banking franchise in Southern California
Southern California offers an unparalleled opportunity for middle market business
banks Cultural similarities
Focused on small to mid-sized businesses as target clients
High quality deposit base (> 50% noninterest bearing deposits and 0.11% cost of
deposits) Conservative credit cultures and similar loan portfolio mix (> 50%
combined C&I and OO CRE) Performance driven business development philosophy
Management team comprised of veteran Southern California business bankers
Complementary strengths provide opportunities for revenue synergies
Partnership approach to create the “best-in-class”
group of banking professionals for the pro forma
company
Pro forma branch network covers the greater Los Angeles market
Leverages capital and increases liquidity
Draws on CUNB’s strong track record of transaction execution
Financially compelling projected pro forma results
Strategic
Partnership
Enhances
Value of Both
Franchises
Source: SNL Financial as of March 31, 2014
32 |
 Summary of
Terms 1
Based on CUNB closing price of $18.19 on June 2, 2014
2
Based on FENB closing price of $21.75 on June 2, 2014
3
As of March 31, 2014
Name:
CU Bancorp / California United Bank
Headquarters:
Downtown
Los
Angeles
(Current
FENB
headquarters)
Management:
Chairman
and
CEO,
David
I.
Rainer
(current
Chairman,
President
and
CEO
of
CUNB)
Board
Composition:
8
CUNB
/
4
FENB
Ownership:
68%
CUNB
/
32%
FENB
Consideration:
1.3450
shares
of
CUNB
stock
for
each
FENB
share
100% stock consideration; fixed exchange ratio
Equivalent
to
$24.47
per
FENB
share
13%
premium
to
FENB’s
last
closing
price
Deal
value
of
approximately
$103
million
16.9x 2014 analyst EPS estimate
172%
of
tangible
book
value
per
share
Timing:
Expected
to
close
in
Q4
2014
President, K. Brian Horton (current President of FENB)
Chief Financial Officer, Karen A. Schoenbaum (current CFO of CUNB)
33
3
2
1
1 |
 Company
Overviews Headquarters
Encino, CA
Branches
8
Total Assets ($mm)
$1,382
Gross Loans ($mm)
$946
Total Deposits ($mm)
$1,203
Noninterest Bearing Deposits (%)
54%
C&I + Own. Occ. CRE (%)
51%
NPAs / Assets (%)
0.60%
LTM Net Income to Common ($mm)
$10.3
Headquarters
Los Angeles, CA
Branches
3 + 1 LPO
Total Assets ($mm)
$776
Gross Loans ($mm)
$513
Total Deposits ($mm)
$652
Noninterest Bearing Deposits (%)
49%
C&I + Own. Occ. CRE (%)
59%
NPAs / Assets (%)
0.57%
LTM Net Income to Common ($mm)
$5.3
Company Highlights
Company Highlights
Established in 2006
Raised $12.5 million of common equity in 2012
Funded $16.4 million of SBLF preferred equity in
2011
17.8%
insider
ownership
Established in 2005
Completed two accretive transactions
California Oaks State Bank (12/31/10)
Premier Commercial Bancorp (7/31/12)
Raised $22.0 million and $10.3 million of common
equity in 2006 and 2011, respectively
Listed on NASDAQ Capital Market in October 2012
Added to Russell 3000 Index in June 2013
12.1% insider ownership
1
Source: SNL Financial as of June 2, 2014
2
Source: Company information, as of May 15, 2014
34
1
2 |
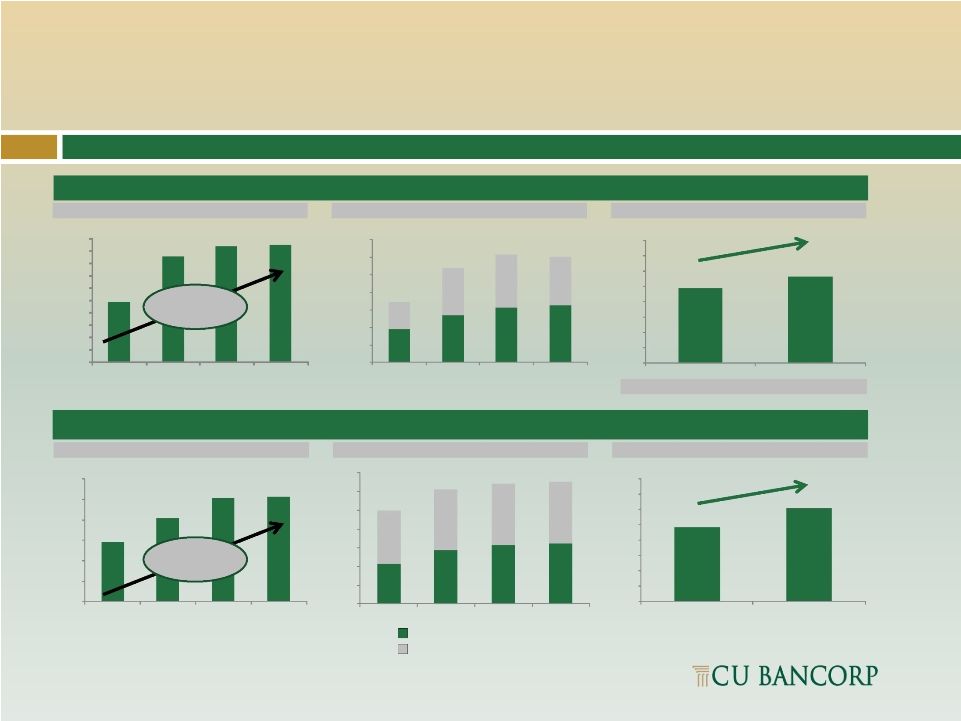 Combination of Two Growth-Oriented Franchises
Source: SNL Financial
1
Mean analyst estimate as of June 2, 2014
2
Analyst estimate as of June 2, 2014
CUNB Performance
Gross Loans ($mm)
Total Deposits ($mm)
Net Income to Common ($mm)
Gross Loans ($mm)
Total Deposits ($mm)
Net Income to Common ($mm)
2013 represents 1st full year impact of PCB
Noninterest bearing deposits
Interest bearing deposits
Noninterest bearing deposits
Interest bearing deposits
16%
26%
FENB Performance
$489
$855
$933
$946
$0
$100
$200
$300
$400
$500
$600
$700
$800
$900
$1,000
2011
2012
2013
Q12014
34%
CAGR
$381
$544
$632
$652
$309
$535
$600
$552
$691
$1,078
$1,232
$1,203
$0
$200
$400
$600
$800
$1,000
$1,200
$1,400
2011
2012
2013
Q12014
$293
$409
$505
$513
$0
$100
$200
$300
$400
$500
$600
2011
2012
2013
Q12014
28%
CAGR
$9.8
$11.3
$0.0
$2.0
$4.0
$6.0
$8.0
$10.0
$12.0
$14.0
$16.0
2013
2014E
$215
$287
$316
$322
$282
$325
$327
$330
$497
$612
$643
$652
$0
$100
$200
$300
$400
$500
$600
$700
2011
2012
2013
Q12014
$4.8
$6.1
$0.0
$1.0
$2.0
$3.0
$4.0
$5.0
$6.0
$7.0
$8.0
2013
2014E²
35 |
 36
Key Merger Assumptions
Cost savings
Approximately 20% of FENB noninterest expense base
Anticipate that 70% of cost savings will be realized in 2015; 100% phased-in by
2016 Consolidation of FENB’s Woodland Hills LPO
Revenue
synergies:
opportunities
identified
but
none
assumed
One-time
charges:
approximately
$7.9
million
pre-tax
Preferred
stock:
$16.4
million
of
FENB
SBLF
preferred
stock
to
remain
outstanding
1% preferred dividend thru March 1, 2016; 9% thereafter
$0.5 million initial write-down; 4 year impact using constant yield method
(7.3%) Core
deposit
intangible:
1.1%
($7.4
million);
amortized
over
10
years
(sum-of-the-years
digits
methodology)
Loan mark:
Credit mark write-down of 1.9% of gross loans ($10.0 million)
Rate mark write-down of 0.8% of gross loans ($4.3 million)
|
 Financially Compelling Combination
High
single
digits
in
2015
>10% in 2016 with fully-phased in cost savings
~ 7% TBVPS dilution at close
~ 3.5 year TBVPS earn back
Pro forma capital ratios at close
TCE: 8.1%
Tier I Leverage: 9.6%
Total Risk-Based Capital: 11.5%
While there are no near term plans to redeem FENB’s preferred stock, CUNB
will continually evaluate the cost and amount of capital required to support
the pro forma balance sheet
37
2
1 |