Attached files
| file | filename |
|---|---|
| 8-K - 8-K - Altisource Portfolio Solutions S.A. | a14-15230_18k.htm |
Exhibit 99.1
|
|
June 17, 2014 Lenders Presentation |
|
|
Forward Looking Statements/Non-GAAP Measures This presentation contains forward-looking statements. These statements may be identified by words such as “anticipate,” “intend,” “expect,” “may,” “could,” “should,” “would,” “plan,” “estimate,” “seek,” “believe” and similar expressions. We caution that forward-looking statements are qualified to certain risks and uncertainties that could cause actual results and events to differ materially from what is contemplated by the forward-looking statements. Factors which could cause actual results to differ materially from these forward looking statements may include, without limitation, general economic conditions, conditions in the markets in which Altisource is engaged, behavior of customers, suppliers and/or competitors, technological developments and regulatory rules. In addition, financial risks such as currency movements, liquidity and credit risks © 2014 Altisource. All rights reserved. Proprietary and Confidential. Page | 1 could influence future results. The foregoing list of factors should not be construed as exhaustive. Altisource disclaims any intention or obligation to publicly update or revise any forward-looking statements, whether as a result of new information, future events or otherwise. Altisource management utilizes certain non-GAAP measures such as earnings before interest, taxes, depreciation, amortization and goodwill impairment, or EBITDA, and free cash flow conversion as key metrics in evaluating its financial performance and liquidity. EBITDA should be considered in addition to, rather than as a substitute for, income before income taxes, net income attributable to Altisource and cash flows from operations. These non-GAAP measures are presented as supplemental information and reconciled in the Appendix. |
|
|
Altisource Portfolio Solutions S.A. (“Altisource” or the “Company”) intends to raise an incremental $200 million Senior Secured Term Loan B expected to be fungible with its existing Term Loan – Use of proceeds for general corporate purposes, including potential share repurchases In addition, Altisource is also seeking consent from lenders for the following changes to the credit agreement: – Allow for additional capacity of $200 million for share repurchases Transaction Overview © 2014 Altisource. All rights reserved. Proprietary and Confidential. Page | 2 – Refresh $200 million term loan accordion – Amend structure for new Midco entity – Amend initial excess cash flow sweep threshold – Reset 101 Soft Call for 6 months on full $595 million tranche Pro forma for the incremental Term Loan, total leverage and net leverage for the last twelve months (“LTM”) ended March 31, 2014 will be 2.6x and 2.1x, respectively |
|
|
Sources & Uses / Pro Forma Capitalization ($ in millions) Sources Uses Incremental Term Loan B $200.0 General Corporate Purposes, Including Share Repurchase $195.0 Estimated Fees, Expenses, and OID 5.0 Total Sources $200.0 Total Uses $200.0 ($ in millions) Add-On TL 3/31/2013 Current 3/31/2014A Adj. Pro Forma 3/31/2014A Cash & Cash Equivalents $146.1 $116.4 $116.4 Term Loan B 399.5 395.5 $200.0 595.5 © 2014 Altisource. All rights reserved. Proprietary and Confidential. Page | 3 (1) EBITDA defined as net income attributable to Altisource plus interest expense, income taxes, depreciation, amortization and goodwill impairment Total Debt $399.5 $395.5 $595.5 Market Value of Equity (as of 6/11/2014) 1,710.6 2,473.2 (195.0) 2,278.2 Total Capitalization $2,110.1 $2,868.7 $2,873.7 LTM EBITDA(1) $144.4 $230.4 $230.4 Pro Forma Cash Interest 23.0 17.8 9.0 26.8 Capital Expenditures 26.4 40.1 40.1 Total Debt / EBITDA 2.8x 1.7x 2.6x Net Debt / EBITDA 1.8x 1.2x 2.1x Total Debt / Total Capitalization 18.9% 13.8% 20.7% EBITDA / Pro Forma Cash Interest 6.3x 12.9x 8.6x (EBITDA - Capex) / Pro Forma Cash Interest 5.1x 10.7x 7.1x |
|
|
Summary Term Sheet Borrower: Altisource Solutions S.à r.l. (“Altisource” or the “Borrower”) Facility: Incremental Senior Secured Term Loan B (“Term Loan”) Maturity: Same as existing – December 9, 2020 Guarantors: Altisource Portfolio Solutions S.A., new Midco entity and certain material direct and indirect restricted subsidiaries of the Borrower (Similar to existing – Amend structure for new Midco entity) Security: Substantially all assets and capital stock of the Borrower and certain Guarantors (Similar to existing – Amend structure for new Midco entity) Amount: $200 million Pricing: Same as existing – L + 350 bps LIBOR Floor: Same as existing – 1.00% OID: TBD Optional Prepayments: Reset 101 Soft Call for 6 months on full $595 million tranche Mandatory Repayments: Same as existing: -100% Asset Sales (with re-investment rights and carveouts) -100% Debt Issuance (with carveouts) -50% Excess Cash Flow Sweep stepping down to 25% and 0% based on Senior Secured Leverage ratios of 3.50x and 3.00x, respectively (amend the 0% sweep step down trigger to 3.00x – currently 2.75x) Scheduled Amortization: Same as existing – 1% per annum, bullet at maturity Incremental Facilities: Amend to refresh $200 million term loan capacity, subject to pro forma Senior Secured Leverage of <3.0x; subject to 50 bps MFN Negative Covenants: Same as existing – Amend to add additional $200 million capacity for existing Permitted Share Buyback Financial Covenants: Same as existing – Covenant-lite Amendment Fee: 12.5bps for Consenting Lenders |

|
|
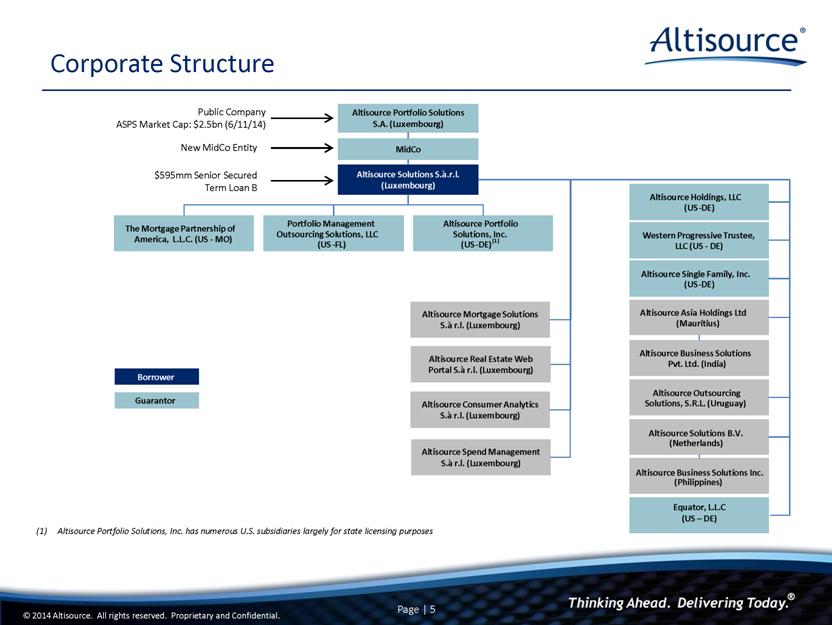
Corporate Structure Altisource Portfolio Solutions, Inc. has numerous U.S. subsidiaries largely for state licensing purposes Altisource Portfolio Solutions S.A. (Luxembourg) The Mortgage Partnership of America, L.L.C. (US - MO) Portfolio Management Outsourcing Solutions, LLC (US - FL) Altisource Portfolio Solutions, Inc. (US - DE) (1) Altisource Holdings, LLC (US - DE) Western Progressive Trustee, LLC (US - DE) Altisource Asset Management Corporation (US -VI) Altisource Residential Corporations Altisource Solutions S.à.r.l. (Luxembourg) Borrower Guarantor Altisource Single Family, Inc. (US - DE) To Be Spun Off Altisource Asia Holdings Ltd (Mauritius) Altisource Business Solutions Pvt. Ltd. (India) Altisource Outsourcing Solutions, S.R.L. (Uruguay) Altisource Solutions B.V. (Netherlands) Altisource Business Solutions Inc. (Philippines) MidCo Equator, L.L.C (US – DE) New MidCo Entity Public Company ASPS Market Cap: $2.5bn (6/11/14) $595mm Senior Secured Term Loan B Altisource Mortgage Solutions S.à r.l. (Luxembourg) Altisource Real Estate Web Portal S.à r.l. (Luxembourg) Altisource Consumer Analytics S.à r.l. (Luxembourg) Altisource Spend Management S.à r.l. (Luxembourg) |
|
|
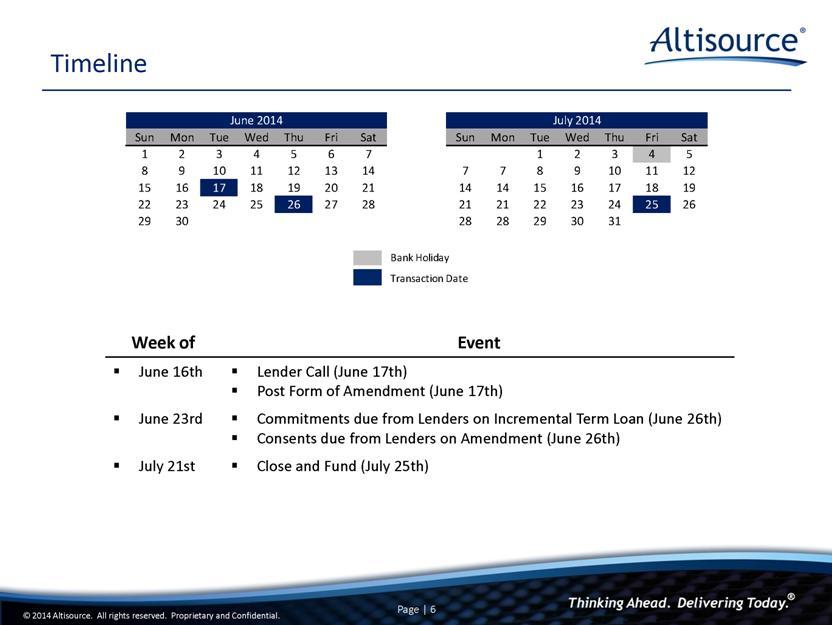
Timeline Week of Event June 16th Lender Call (June 17th) Post Form of Amendment (June 17th) June 23rd Commitments due from Lenders on Incremental Term Loan (June 26th) Consents due from Lenders on Amendment (June 26th) July 21st Close and Fund (July 25th) Bank Holiday Transaction Date Sun Mon Tue Wed Thu Fri Sat Sun Mon Tue Wed Thu Fri Sat 1 2 3 4 5 6 7 1 2 3 4 5 8 9 10 11 12 13 14 7 7 8 9 10 11 12 15 16 17 18 19 20 21 14 14 15 16 17 18 19 22 23 24 25 26 27 28 21 21 22 23 24 25 26 29 30 28 28 29 30 31 June 2014 July 2014 |
|
|
Management Presenters William B. Shepro, Chief Executive Officer Michelle D. Esterman, Chief Financial Officer |
|
|
Company Overview |
|
|
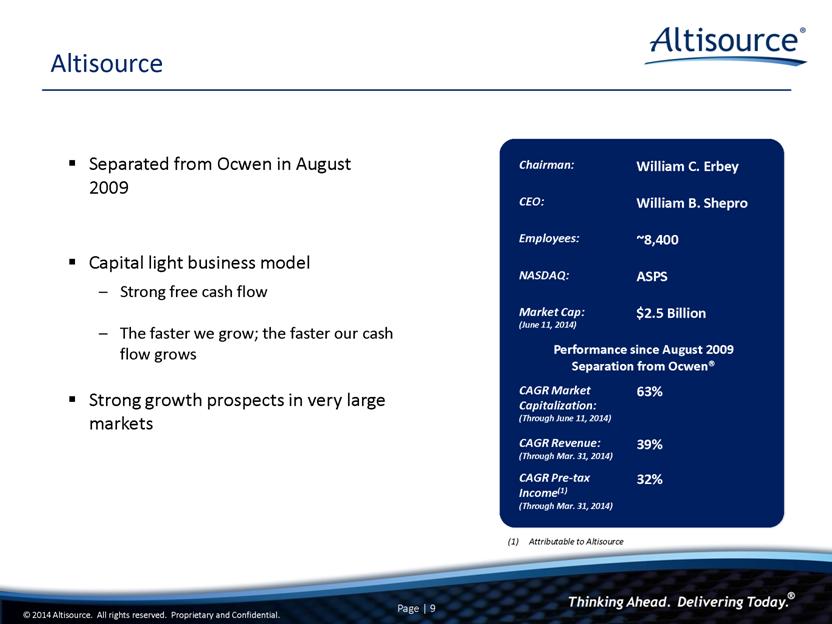
Chairman: William C. Erbey CEO: William B. Shepro Employees: ~8,400 NASDAQ: ASPS Market Cap: (June 11, 2014) $2.5 Billion Performance since August 2009 Separation from Ocwen® CAGR Market Capitalization: (Through June 11, 2014) 63% CAGR Revenue: (Through Mar. 31, 2014) 39% CAGR Pre-tax Income(1) (Through Mar. 31, 2014) 32% Separated from Ocwen in August 2009 Capital light business model Strong free cash flow The faster we grow; the faster our cash flow grows Strong growth prospects in very large markets Altisource Attributable to Altisource |
|
|
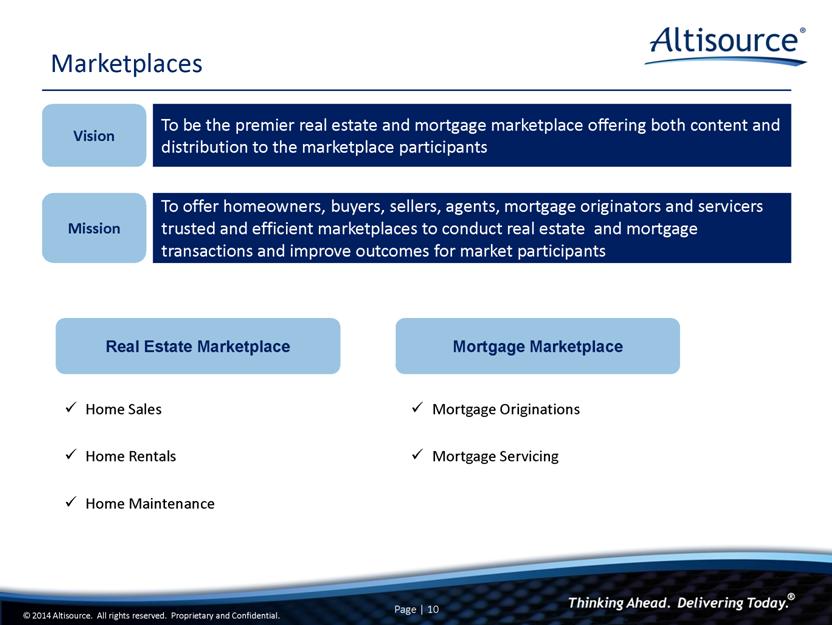
Marketplaces Home Sales Home Rentals Home Maintenance Mortgage Originations Mortgage Servicing Real Estate Marketplace Mortgage Marketplace Vision To be the premier real estate and mortgage marketplace offering both content and distribution to the marketplace participants Mission To offer homeowners, buyers, sellers, agents, mortgage originators and servicers trusted and efficient marketplaces to conduct real estate and mortgage transactions and improve outcomes for market participants |
|
|
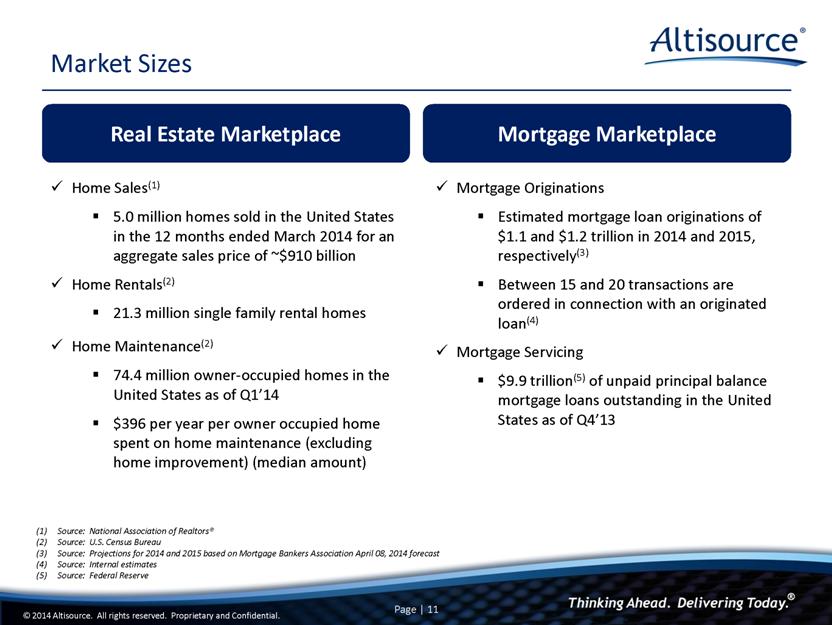
Real Estate Marketplace Mortgage Marketplace Market Sizes Home Sales(1) 5.0 million homes sold in the United States in the 12 months ended March 2014 for an aggregate sales price of ~$910 billion Home Rentals(2) 21.3 million single family rental homes Home Maintenance(2) 74.4 million owner-occupied homes in the United States as of Q1’14 $396 per year per owner occupied home spent on home maintenance (excluding home improvement) (median amount) Mortgage Originations Estimated mortgage loan originations of $1.1 and $1.2 trillion in 2014 and 2015, respectively(3) Between 15 and 20 transactions are ordered in connection with an originated loan(4) Mortgage Servicing $9.9 trillion(5) of unpaid principal balance mortgage loans outstanding in the United States as of Q4’13 Source: National Association of Realtors® Source: U.S. Census Bureau Source: Projections for 2014 and 2015 based on Mortgage Bankers Association April 08, 2014 forecast Source: Internal estimates Source: Federal Reserve |
|
|
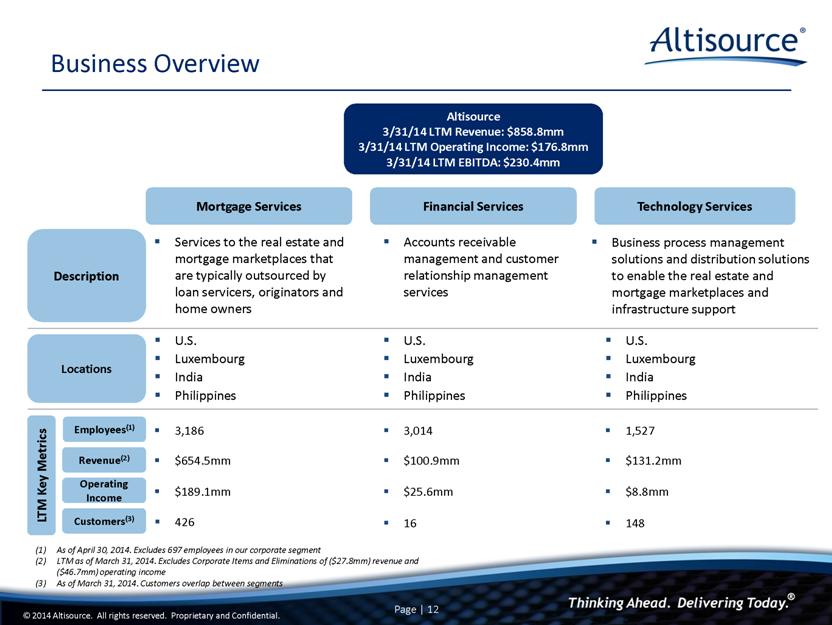
As of April 30, 2014. Excludes 697 employees in our corporate segment LTM as of March 31, 2014. Excludes Corporate Items and Eliminations of ($27.8mm) revenue and ($46.7mm) operating income As of March 31, 2014. Customers overlap between segments Business Overview Services to the real estate and mortgage marketplaces that are typically outsourced by loan servicers, originators and home owners Accounts receivable management and customer relationship management services Business process management solutions and distribution solutions to enable the real estate and mortgage marketplaces and infrastructure support U.S. Luxembourg India Philippines 3,186 3,014 1,527 $654.5mm $100.9mm $131.2mm $189.1mm $25.6mm $8.8mm Technology Services Mortgage Services Altisource 3/31/14 LTM Revenue: $858.8mm 3/31/14 LTM Operating Income: $176.8mm 3/31/14 LTM EBITDA: $230.4mm Financial Services Description Locations Employees(1) LTM Key Metrics Revenue(2) Operating Income Customers(3) 16 148 426 U.S. Luxembourg India Philippines U.S. Luxembourg India Philippines |
|
|
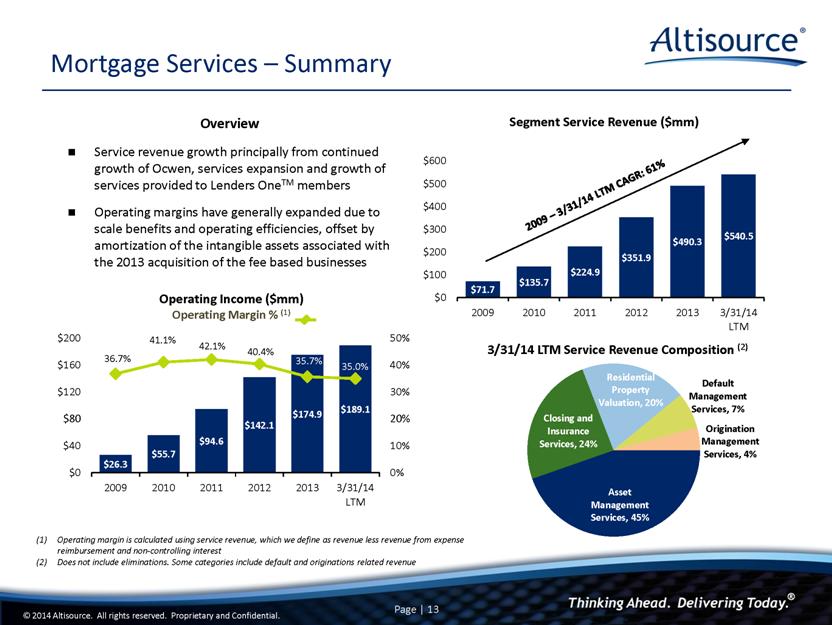
Mortgage Services – Summary Service revenue growth principally from continued growth of Ocwen, services expansion and growth of services provided to Lenders OneTM members Operating margins have generally expanded due to scale benefits and operating efficiencies, offset by amortization of the intangible assets associated with the 2013 acquisition of the fee based businesses Overview 2009 – 3/31/14 LTM CAGR: 61% Operating margin is calculated using service revenue, which we define as revenue less revenue from expense reimbursement and non-controlling interest Does not include eliminations. Some categories include default and originations related revenue |
|
|
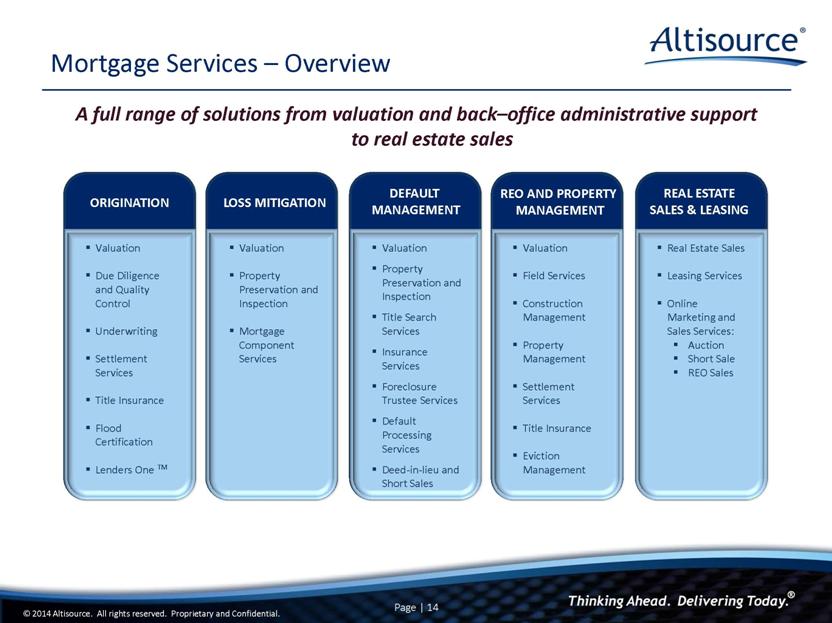
Mortgage Services – Overview A full range of solutions from valuation and back–office administrative support to real estate sales ORIGINATION Valuation Due Diligence and Quality Control Underwriting Settlement Services Title Insurance Flood Certification Lenders One TM LOSS MITIGATION Valuation Property Preservation and Inspection Mortgage Component Services DEFAULT MANAGEMENT Valuation Property Preservation and Inspection Title Search Services Insurance Services Foreclosure Trustee Services Default Processing Services Deed-in-lieu and Short Sales REO AND PROPERTY MANAGEMENT Valuation Field Services Construction Management Property Management Settlement Services Title Insurance Eviction Management REAL ESTATE SALES & LEASING Real Estate Sales Leasing Services Online Marketing and Sales Services: Auction Short Sale REO Sales © 2014 Altisource. All rights reserved. Proprietary and Confidential. Page | 14 |
|
|
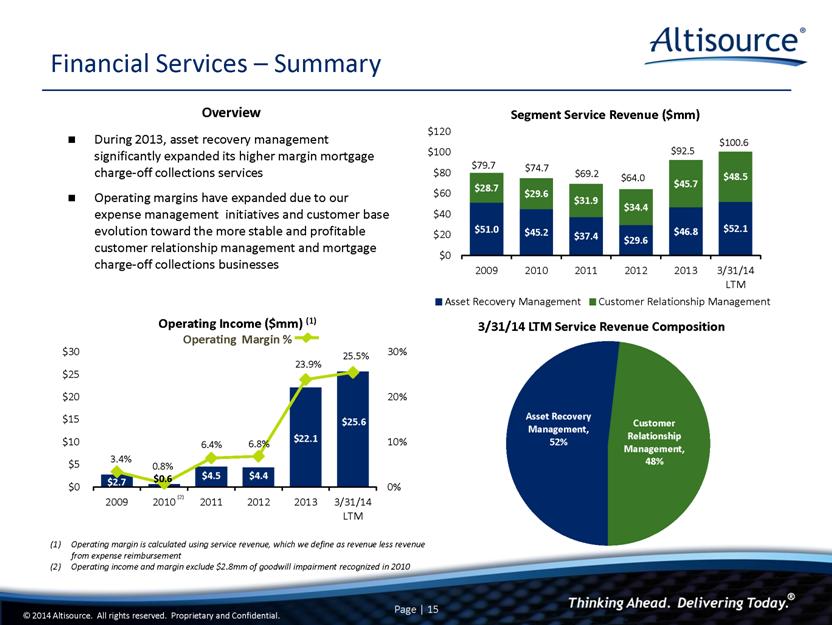
Operating margin is calculated using service revenue, which we define as revenue less revenue from expense reimbursement Operating income and margin exclude $2.8mm of goodwill impairment recognized in 2010 Financial Services – Summary 55 During 2013, asset recovery management significantly expanded its higher margin mortgage charge-off collections services Operating margins have expanded due to our expense management initiatives and customer base evolution toward the more stable and profitable customer relationship management and mortgage charge-off collections businesses (2) Overview |
|
|
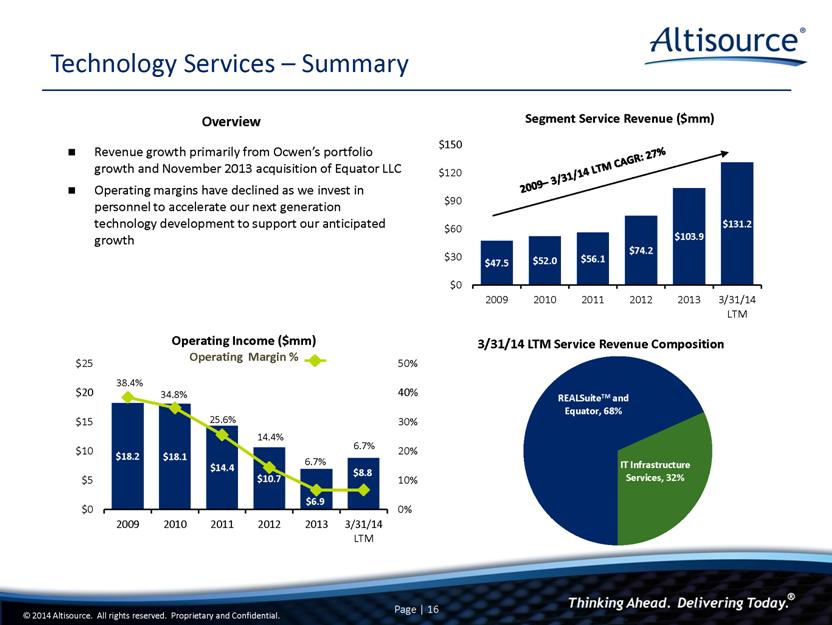
Technology Services – Summary Revenue growth primarily from Ocwen’s portfolio growth and November 2013 acquisition of Equator LLC Operating margins have declined as we invest in personnel to accelerate our next generation technology development to support our anticipated growth 2009– 3/31/14 LTM CAGR: 27% Overview RealSuite TM IT Infrastructure 44% 56% |
|
|
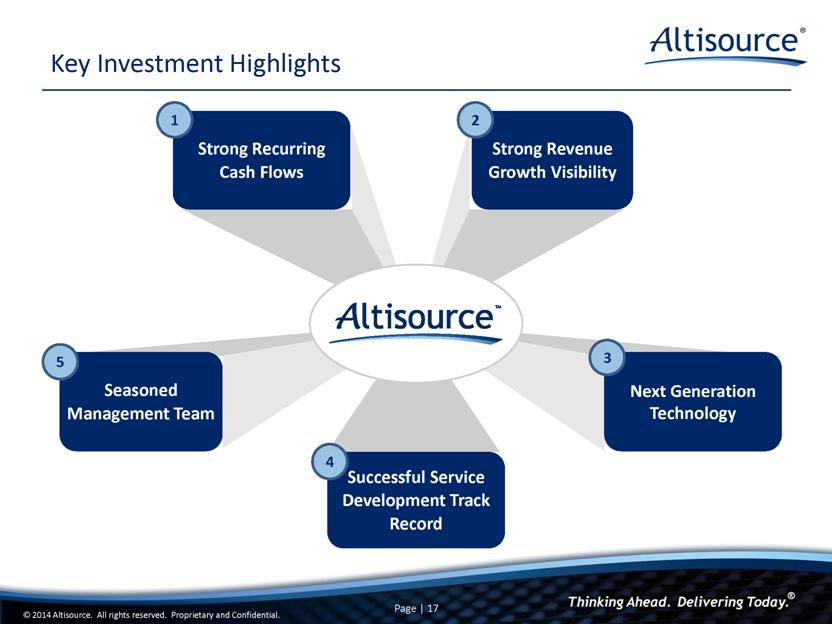
Key Investment Highlights Successful Service Development Track Record Strong Recurring Cash Flows Seasoned Management Team Next Generation Technology Strong Revenue Growth Visibility 1 2 3 4 5 |
|
|
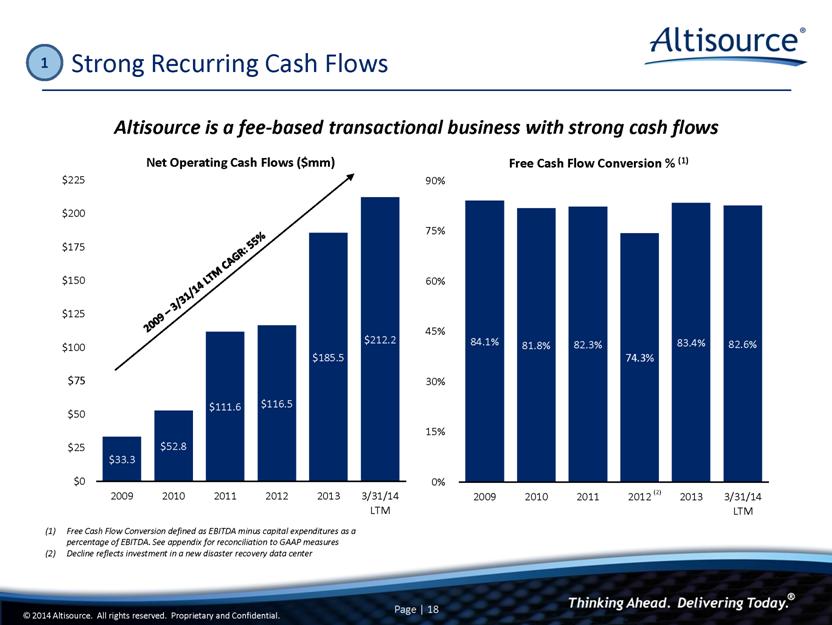
Strong Recurring Cash Flows Altisource is a fee-based transactional business with strong cash flows 2009 – 3/31/14 LTM CAGR: 55% 1 Free Cash Flow Conversion defined as EBITDA minus capital expenditures as a percentage of EBITDA. See appendix for reconciliation to GAAP measures Decline reflects investment in a new disaster recovery data center (2) |
|
|
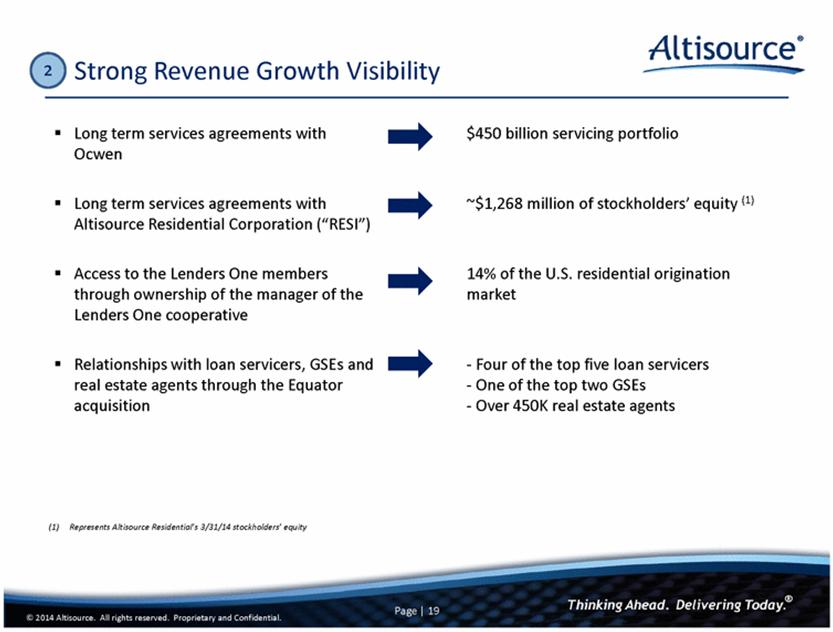
Strong Revenue Growth Visibility 2 Long term services agreements with Ocwen $450 billion servicing portfolio Long term services agreements with Altisource Residential Corporation (“RESI”) ~$1,268 million of stockholders’ equity (1) Access to the Lenders One members through ownership of the manager of the Lenders One cooperative 14% of the U.S. residential origination market © 2014 Altisource. All rights reserved. Proprietary and Confidential. Page | 19 (1) Represents Altisource Residential’s 3/31/14 stockholders’ equity Relationships with loan servicers, GSEs and real estate agents through the Equator acquisition - Four of the top five loan servicers - One of the top two GSEs - Over 450K real estate agents |
|
|
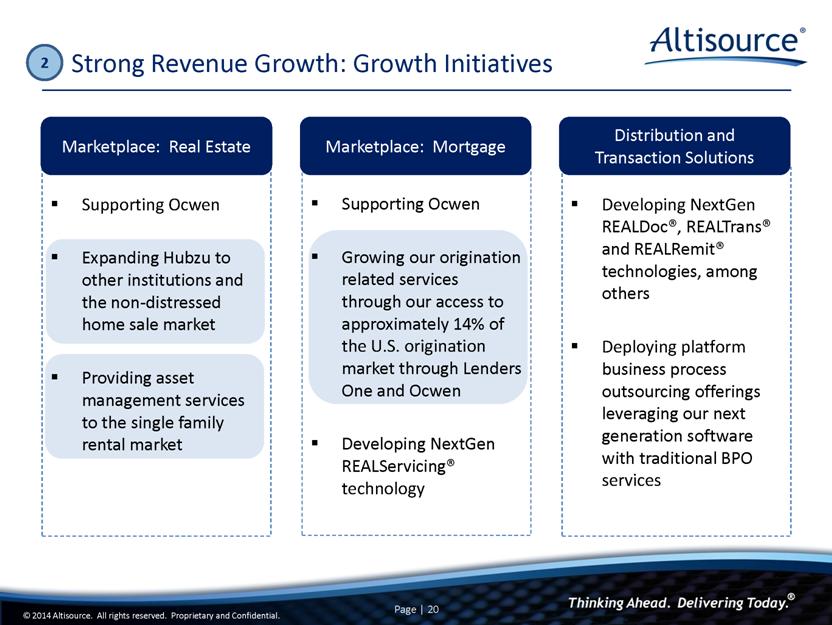
Supporting Ocwen Growing our origination related services through our access to approximately 14% of the U.S. origination market through Lenders One and Ocwen Developing NextGen REALServicing® technology Supporting Ocwen Expanding Hubzu to other institutions and the non-distressed home sale market Providing asset management services to the single family rental market Strong Revenue Growth: Growth Initiatives 2 Developing NextGen REALDoc®, REALTrans® and REALRemit® technologies, among others Deploying platform business process outsourcing offerings leveraging our next generation software with traditional BPO services Marketplace: Real Estate Marketplace: Mortgage Distribution and Transaction Solutions |
|
|
Next generation technology supports the essence of what Altisource does: Manages a distributed network of vendors Processes the work Delivers the product to our clients Pays the vendors Collects receivables Allows Altisource to operate in a much more efficient and effective manner, increasing margins for Altisource and our clients Supports Altisource’s and Ocwen’s growth Next Generation Technology Extensible, scalable and secure technology platform drives services delivery and innovation 3 |

|
|
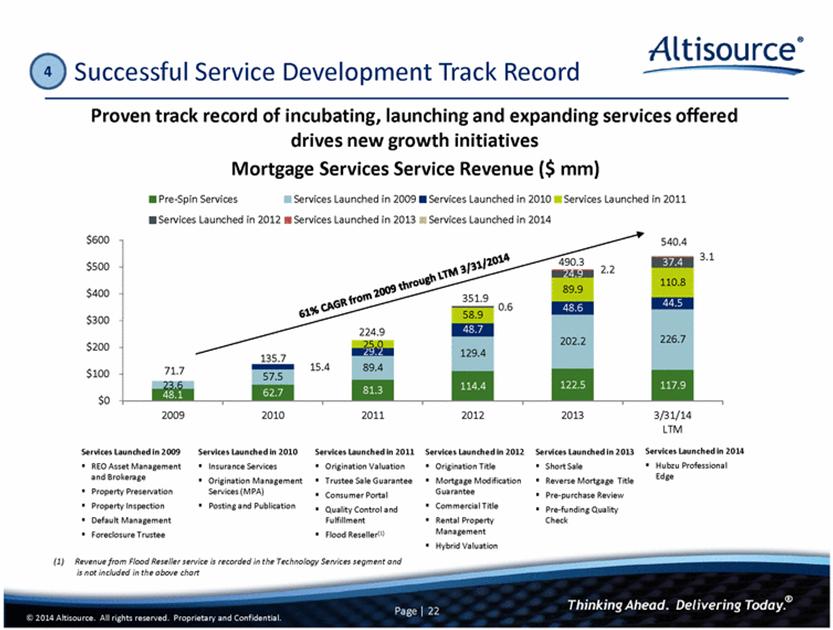
Successful Service Development Track Record 4 Proven track record of incubating, launching and expanding services offered drives new growth initiatives 48.6 44.5 58.9 89.9 110.8 0.6 24.9 37.4 2.2 3.1 351.9 490.3 540.4 $300 $400 $500 $600 Mortgage Services Service Revenue ($ mm) Pre-Spin Services Services Launched in 2009 Services Launched in 2010 Services Launched in 2011 Services Launched in 2012 Services Launched in 2013 Services Launched in 2014 © 2014 Altisource. All rights reserved. Proprietary and Confidential. Page | 22 Services Launched in 2009 REO Asset Management and Brokerage Property Preservation Property Inspection Default Management Foreclosure Trustee Services Launched in 2010 Insurance Services Origination Management Services (MPA) Posting and Publication Services Launched in 2011 Origination Valuation Trustee Sale Guarantee Consumer Portal Quality Control and Fulfillment Flood Reseller(1) (1) Revenue from Flood Reseller service is recorded in the Technology Services segment and is not included in the above chart Services Launched in 2012 Origination Title Mortgage Modification Guarantee Commercial Title Rental Property Management Hybrid Valuation Services Launched in 2013 Short Sale Reverse Mortgage Title Pre-purchase Review Pre-funding Quality Check Services Launched in 2014 Hubzu Professional Edge 48.1 62.7 81.3 114.4 122.5 117.9 23.6 57.5 89.4 129.4 202.2 226.7 15.4 29.2 48.7 25.0 71.7 135.7 224.9 $0 $100 $200 2009 2010 2011 2012 2013 3/31/14 LTM |
|
|
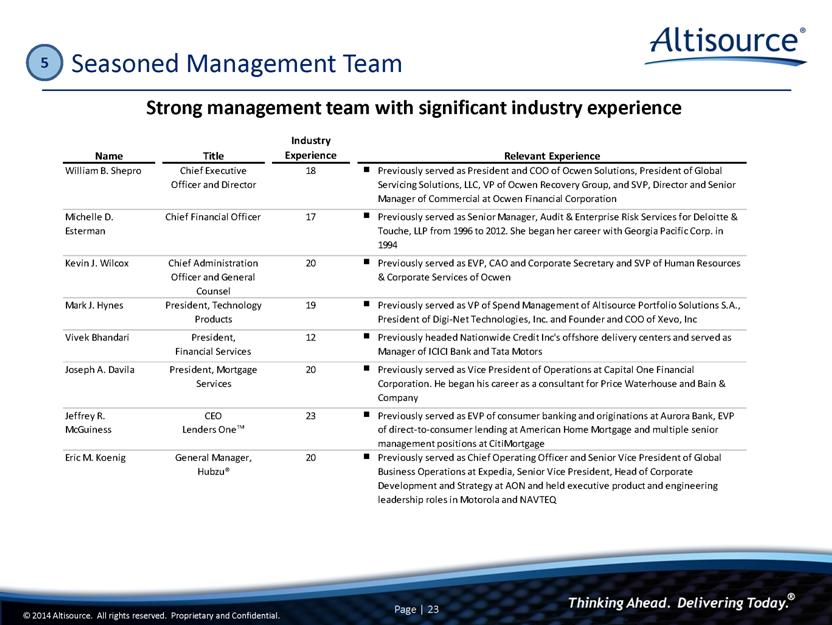
Seasoned Management Team 5 Strong management team with significant industry experience Name Title Industry Experience Relevant Experience William B. Shepro Chief Executive Officer and Director 18 n Previously served as President and COO of Ocwen Solutions, President of Global Servicing Solutions, LLC, VP of Ocwen Recovery Group, and SVP, Director and Senior Manager of Commercial at Ocwen Financial Corporation Michelle D. Esterman Chief Financial Officer 17 n Previously served as Senior Manager, Audit & Enterprise Risk Services for Deloitte & Touche, LLP from 1996 to 2012. She began her career with Georgia Pacific Corp. in 1994 Kevin J. Wilcox Chief Administration Officer and General Counsel 20 n Previously served as EVP, CAO and Corporate Secretary and SVP of Human Resources & Corporate Services of Ocwen Mark J. Hynes President, Technology Products 19 n Previously served as VP of Spend Management of Altisource Portfolio Solutions S.A., President of Digi-Net Technologies, Inc. and Founder and COO of Xevo, Inc Vivek Bhandari President, Financial Services 12 n Previously headed Nationwide Credit Inc's offshore delivery centers and served as Manager of ICICI Bank and Tata Motors Joseph A. Davila President, Mortgage Services 20 n Previously served as Vice President of Operations at Capital One Financial Corporation. He began his career as a consultant for Price Waterhouse and Bain & Company Jeffrey R. McGuiness CEO Lenders One TM 23 n Previously served as EVP of consumer banking and originations at Aurora Bank, EVP of direct-to-consumer lending at American Home Mortgage and multiple senior management positions at CitiMortgage Eric M. Koenig General Manager, Hubzu® 20 n Previously served as Chief Operating Officer and Senior Vice President of Global Business Operations at Expedia, Senior Vice President, Head of Corporate Development and Strategy at AON and held executive product and engineering leadership roles in Motorola and NAVTEQ |
|
|
Financial Performance |
|
|
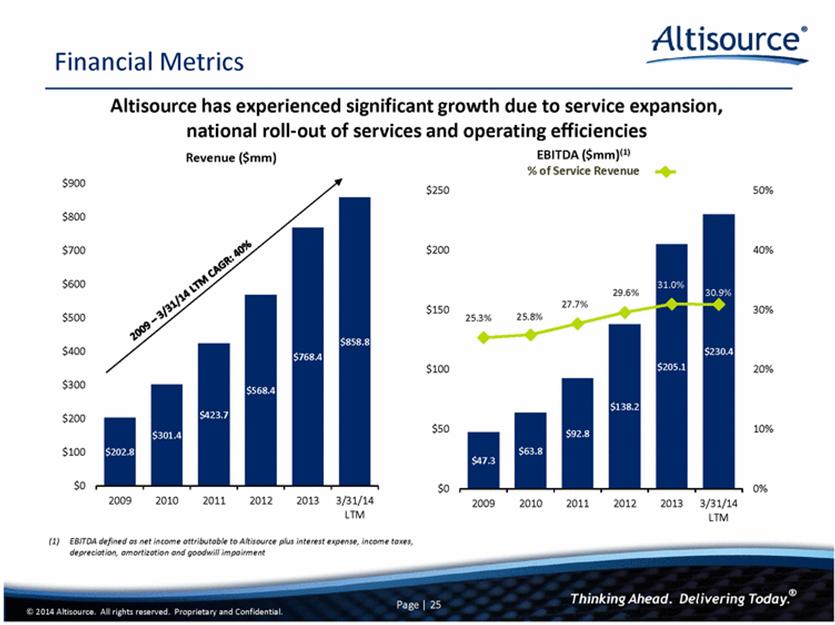
$600 $700 $800 $900 Revenue ($mm) Financial Metrics Altisource has experienced significant growth due to service expansion, national roll-out of services and operating efficiencies 27.7% 29.6% 31.0% 30.9% 30% 40% 50% $150 $200 $250 EBITDA ($mm)(1) % of Service Revenue © 2014 Altisource. All rights reserved. Proprietary and Confidential. Page | 25 $202.8 $301.4 $423.7 $568.4 $768.4 $858.8 $0 $100 $200 $300 $400 $500 2009 2010 2011 2012 2013 3/31/14 LTM (1) EBITDA defined as net income attributable to Altisource plus interest expense, income taxes, depreciation, amortization and goodwill impairment $47.3 $63.8 $92.8 $138.2 $205.1 $230.4 25.3% 25.8% 0% 10% 20% $0 $50 $100 2009 2010 2011 2012 2013 3/31/14 LTM |
|
|
|
|
|
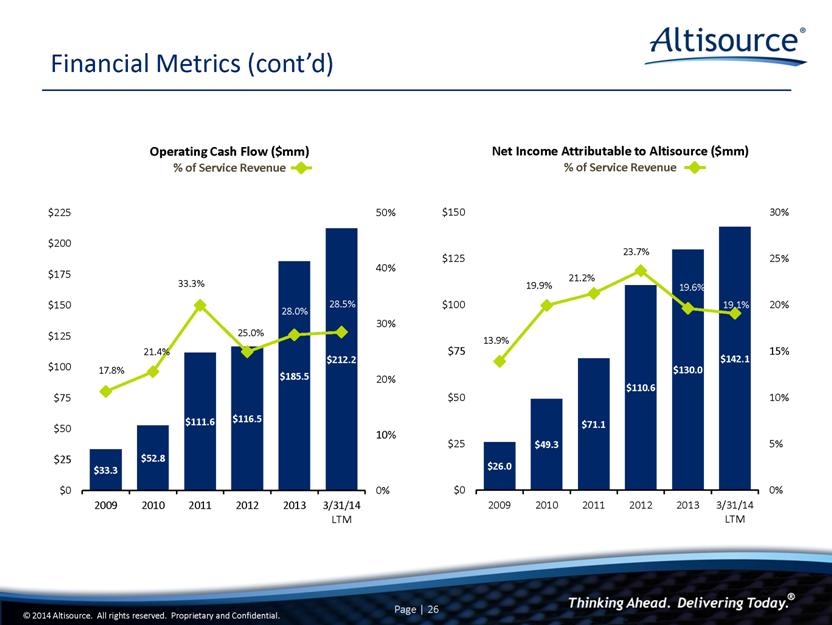
Financial Metrics (cont’d) |
|
|
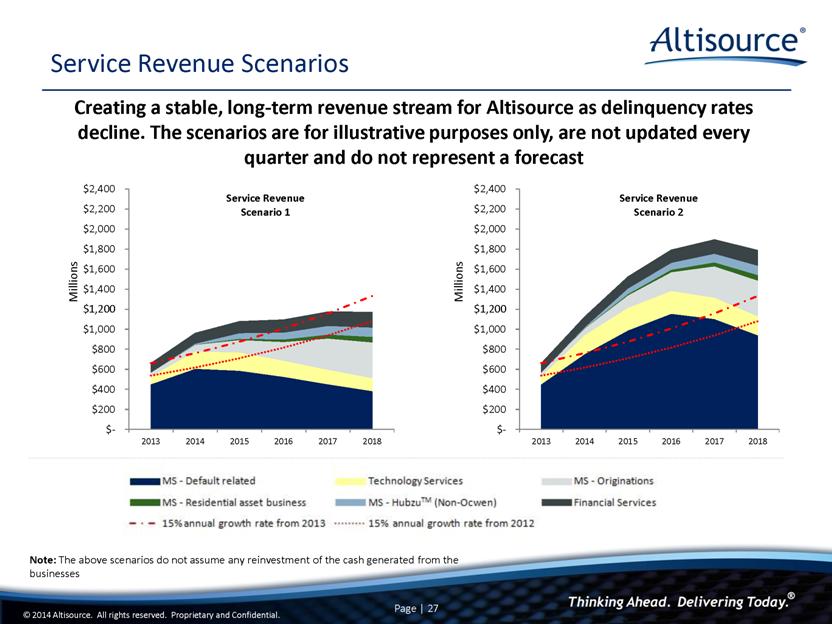
Service Revenue Scenarios Creating a stable, long-term revenue stream for Altisource as delinquency rates decline. The scenarios are for illustrative purposes only, are not updated every quarter and do not represent a forecast Note: The above scenarios do not assume any reinvestment of the cash generated from the businesses |
|
|
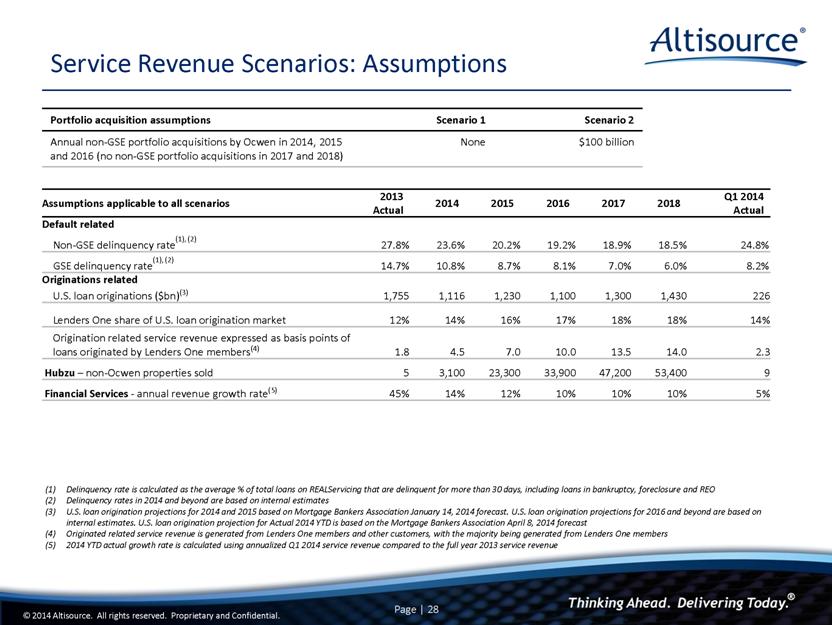
Portfolio acquisition assumptions Scenario 1 Scenario 2 Annual non-GSE portfolio acquisitions by Ocwen in 2014, 2015 and 2016 (no non-GSE portfolio acquisitions in 2017 and 2018) None $100 billion Assumptions applicable to all scenarios 2013 Actual 2014 2015 2016 2017 2018 Q1 2014 Actual Default related Non-GSE delinquency rate(1), (2) 27.8% 23.6% 20.2% 19.2% 18.9% 18.5% 24.8% GSE delinquency rate(1), (2) 14.7% 10.8% 8.7% 8.1% 7.0% 6.0% 8.2% Originations related U.S. loan originations ($bn)(3) 1,755 1,116 1,230 1,100 1,300 1,430 226 Lenders One share of U.S. loan origination market 12% 14% 16% 17% 18% 18% 14% Origination related service revenue expressed as basis points of loans originated by Lenders One members(4) 1.8 4.5 7.0 10.0 13.5 14.0 2.3 Hubzu – non-Ocwen properties sold 5 3,100 23,300 33,900 47,200 53,400 9 Financial Services - annual revenue growth rate(5) 45% 14% 12% 10% 10% 10% 5% Service Revenue Scenarios: Assumptions Delinquency rate is calculated as the average % of total loans on REALServicing that are delinquent for more than 30 days, including loans in bankruptcy, foreclosure and REO Delinquency rates in 2014 and beyond are based on internal estimates U.S. loan origination projections for 2014 and 2015 based on Mortgage Bankers Association January 14, 2014 forecast. U.S. loan origination projections for 2016 and beyond are based on internal estimates. U.S. loan origination projection for Actual 2014 YTD is based on the Mortgage Bankers Association April 8, 2014 forecast Originated related service revenue is generated from Lenders One members and other customers, with the majority being generated from Lenders One members 2014 YTD actual growth rate is calculated using annualized Q1 2014 service revenue compared to the full year 2013 service revenue |
|
|
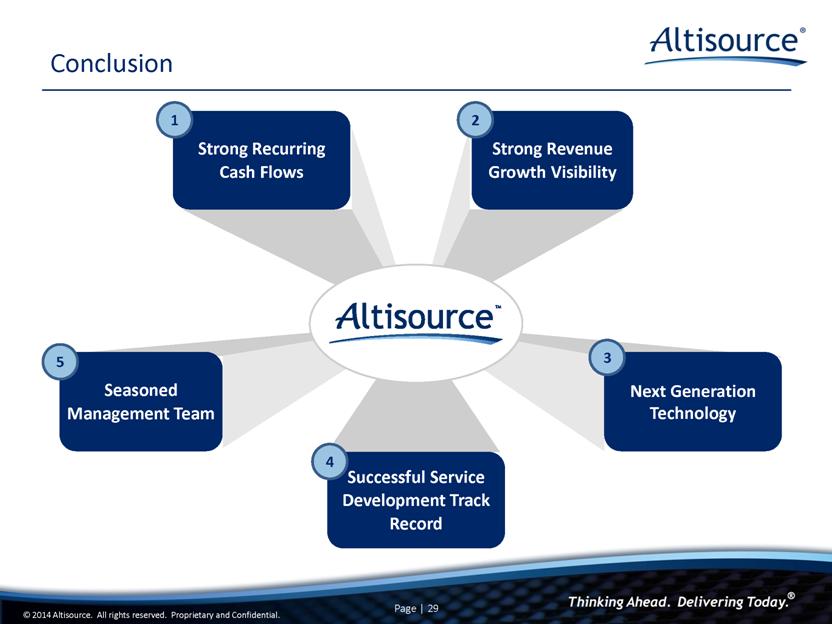
Conclusion Successful Service Development Track Record Strong Recurring Cash Flows Seasoned Management Team Next Generation Technology Strong Revenue Growth Visibility 1 2 3 4 5 |
|
|
Appendix |
|
|
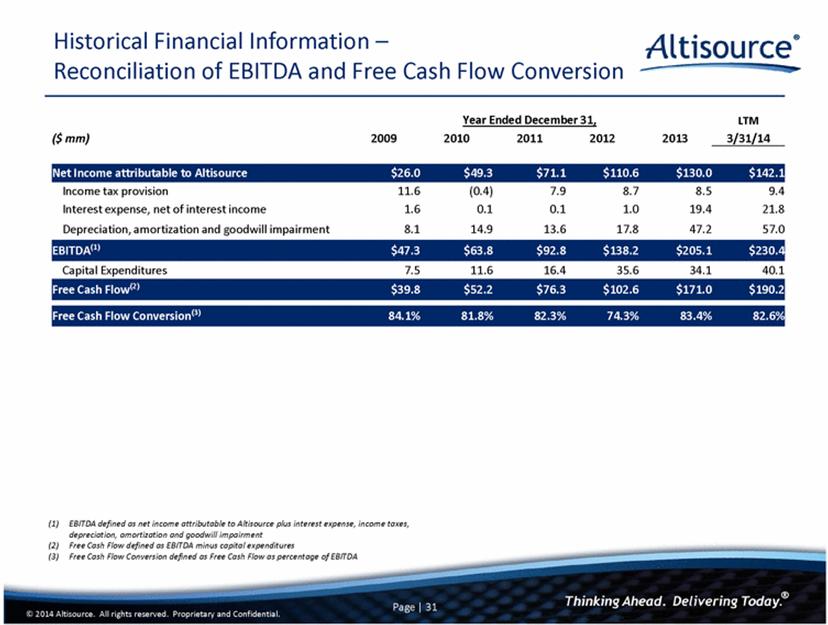
Historical Financial Information – Reconciliation of EBITDA and Free Cash Flow Conversion Year Ended December 31, LTM ($ mm) 2009 2010 2011 2012 2013 3/31/14 Net Income attributable to Altisource $26.0 $49.3 $71.1 $110.6 $130.0 $142.1 Income tax provision 11.6 (0.4) 7.9 8.7 8.5 9.4 Interest expense, net of interest income 1.6 0.1 0.1 1.0 19.4 21.8 Depreciation, amortization and goodwill impairment 8.1 14.9 13.6 17.8 47.2 57.0 EBITDA(1) $47.3 $63.8 $92.8 $138.2 $205.1 $230.4 Capital Expenditures 7.5 11.6 16.4 35.6 34.1 40.1 Free Cash Flow(2) $39.8 $52.2 $76.3 $102.6 $171.0 $190.2 Free Cash Flow Conversion(3) 84.1% 81.8% 82.3% 74.3% 83.4% 82.6% © 2014 Altisource. All rights reserved. Proprietary and Confidential. Page | 31 (1) EBITDA defined as net income attributable to Altisource plus interest expense, income taxes, depreciation, amortization and goodwill impairment (2) Free Cash Flow defined as EBITDA minus capital expenditures (3) Free Cash Flow Conversion defined as Free Cash Flow as percentage of EBITDA |