Attached files
| file | filename |
|---|---|
| EX-32.1 - EXHIBIT 32.1 - Altisource Portfolio Solutions S.A. | asps-12312016xex321.htm |
| EX-31.2 - EXHIBIT 31.2 - Altisource Portfolio Solutions S.A. | asps-12312016xex312.htm |
| EX-31.1 - EXHIBIT 31.1 - Altisource Portfolio Solutions S.A. | asps-12312016xex311.htm |
| EX-23.2 - EXHIBIT 23.2 - Altisource Portfolio Solutions S.A. | asps-12312016xex232.htm |
| EX-23.1 - EXHIBIT 23.1 - Altisource Portfolio Solutions S.A. | asps-12312016xex231.htm |
| EX-21.1 - EXHIBIT 21.1 - Altisource Portfolio Solutions S.A. | asps-12312016xex211.htm |
UNITED STATES
SECURITIES AND EXCHANGE COMMISSION
Washington, D.C. 20549
FORM 10-K
(Mark One) | |
þ | ANNUAL REPORT PURSUANT TO SECTION 13 OR 15(d) OF THE SECURITIES EXCHANGE ACT OF 1934 |
FOR THE FISCAL YEAR ENDED DECEMBER 31, 2016
OR
o | TRANSITION REPORT PURSUANT TO SECTION 13 OR 15(d) OF THE SECURITIES EXCHANGE ACT OF 1934 |
Commission File Number: 1-34354
ALTISOURCE PORTFOLIO SOLUTIONS S.A.
(Exact name of Registrant as specified in its Charter)
Luxembourg | 98-0554932 | |
(State or other jurisdiction of incorporation or organization) | (I.R.S. Employer Identification No.) | |
40, avenue Monterey
L-2163 Luxembourg
Grand Duchy of Luxembourg
(352) 24 69 79 00
(Address and telephone number, including area code, of registrant’s principal executive offices)
Securities registered pursuant to Section 12(b) of the Act:
Title of each class | Name of each exchange on which registered | |
Common Stock, $1.00 par value | NASDAQ Global Select Market | |
Securities registered pursuant to Section 12(g) of the Act:
None
Indicate by check mark if the Registrant is a well-known seasoned issuer, as defined in Rule 405 of the Securities Act. Yes o No þ
Indicate by check mark if the Registrant is not required to file reports pursuant to Section 13 or Section 15(d) of the Act. Yes o No þ
Indicate by check mark whether the registrant (1) has filed all reports required to be filed by section 13 or 15(d) of the Securities Exchange Act of 1934 during the preceding 12 months (or for such shorter period that the registrant was required to file such reports), and (2) has been subject to such filing requirements for the past 90 days. Yes þ No o
Indicate by check mark whether the registrant has submitted electronically and posted on its corporate Web site, if any, every Interactive Data File required to be submitted and posted pursuant to Rule 405 of Regulation S-T (§232.405 of this chapter) during the preceding 12 months (or for such shorter period that the registrant was required to submit and post such files). Yes þ No o
Indicate by check mark if disclosure of delinquent filers pursuant to Item 405 of Regulation S-K (§229.405 of this chapter) is not contained herein and will not be contained, to the best of the Registrant’s knowledge, in the definitive proxy or information statements incorporated by reference in Part III of this Form 10-K or any amendment to this Form 10-K. þ
Indicate by check mark whether the registrant is a large accelerated filer, an accelerated filer, a non-accelerated filer or a smaller reporting company (as defined in Rule 12b-2 of the Exchange Act):
Large accelerated filer þ | Accelerated filer o |
Non-accelerated filer o (Do not check if a smaller reporting company) | Smaller reporting company o |
Indicate by check mark whether the registrant is a shell company (as defined in Rule 12b-2 of the Exchange Act). Yes o No þ
The aggregate market value of the voting stock held by non-affiliates of the registrant as of June 30, 2016 was $505,239,875 based on the closing share price as quoted on the NASDAQ Global Market on that day and the assumption that all directors and executive officers of the Company, and their families, are affiliates. This determination of affiliate status is not necessarily a conclusive determination for any other purpose.
As of February 10, 2017, there were 18,773,438 outstanding shares of the registrant’s shares of beneficial interest (excluding 6,639,310 shares held as treasury stock).
DOCUMENTS INCORPORATED BY REFERENCE
Portions of the registrant’s Definitive Proxy Statement to be filed subsequent to the date hereof with the Securities and Exchange Commission pursuant to Regulation 14A in connection with the registrant’s Annual Meeting of Shareholders to be held on May 17, 2017 are incorporated by reference into Part III of this Report. Such Definitive Proxy Statement will be filed with the Securities and Exchange Commission not later than 120 days after the conclusion of the registrant’s fiscal year ended December 31, 2016.
TABLE OF CONTENTS
ALTISOURCE PORTFOLIO SOLUTIONS S.A.
FORM 10-K
Page | |||
2
FORWARD-LOOKING STATEMENTS
This Annual Report on Form 10-K and certain information incorporated herein by reference contain forward-looking statements within the safe harbor provisions of the Private Securities Litigation Reform Act of 1995. These statements may relate to, among other things, future events or our future performance or financial condition. Words such as “anticipate,” “intend,” “expect,” “may,” “could,” “should,” “would,” “plan,” “estimate,” “believe,” “predict,” “potential” or “continue” or the negative of these terms and comparable terminology are intended to identify such forward-looking statements. Such statements are based on expectations as to the future and are not statements of historical fact. Furthermore, forward-looking statements are not guarantees of future performance and involve a number of assumptions, risks and uncertainties that could cause actual results to differ materially. Important factors that could cause actual results to differ materially from those suggested by the forward-looking statements include, but are not limited to, the risks discussed in Item 1A of Part I “Risk Factors.” We caution you not to place undue reliance on these forward-looking statements which reflect our view only as of the date of this report. We are under no obligation (and expressly disclaim any obligation) to update or alter any forward-looking statements contained herein to reflect any change in our expectations with regard thereto or change in events, conditions or circumstances on which any such statement is based.
PART I
Except as otherwise indicated or unless the context requires otherwise “Altisource,” the “Company,” “we,” “us,” or “our” refer to Altisource Portfolio Solutions S.A., a Luxembourg société anonyme, or public limited liability company, and its wholly-owned subsidiaries.
ITEM 1. | BUSINESS |
The Company
Altisource® is a premier marketplace and transaction solutions provider for the real estate, mortgage and consumer debt industries. Altisource’s proprietary business processes, vendor and electronic payment management software and behavioral science-based analytics improve outcomes for marketplace participants.
We are publicly traded on the NASDAQ Global Select Market under the symbol “ASPS.” We are incorporated under the laws of the Grand Duchy of Luxembourg.
2016 Highlights
Servicer Solutions
• | Strengthened and grew existing customer relationships with leading bank and non-bank servicers |
• | Signed a significant number of agreements and statements of work with strategic customers positioning us well for 2017 |
• | Developed new offerings to provide support services for Federal Housing Administration (“FHA”) mortgages |
Origination Solutions
• | Strengthened and grew existing customer relationships with leading bank and non-bank originators |
• | Signed a significant number of agreements and statements of work with strategic customers positioning us well for 2017 |
• | Developed new offerings to strengthen the Best Partners Mortgage Cooperative, Inc., a mortgage cooperative doing business as Lenders One®, value proposition and grow sales of the platform solution |
Consumer Real Estate Solutions
• | Launched the buy-side brokerage offering in February and are now operating in 26 markets |
• | Re-launched the sell-side offering in the fourth quarter and are now operating in 12 markets |
• | Grew the number of Owners.com® real estate agents to 200 |
• | Launched Owners.com mobile apps for home buyers and real estate agents |
• | Currently working with approximately 950 active buyers, up from 400 in October |
Real Estate Investor Solutions
• | Increased the number of rental homes managed from 2,732 at December 31, 2015 to 4,357 at December 31, 2016 |
• | Sold 2,732 homes, primarily for Altisource Residential Corporation (“Residential”) and, to a lesser extent, for other clients |
3
• | Negotiated a $60 million payment to Altisource, if Residential disposes 50% or more of its single family rental portfolio managed by Altisource, in return for a limited waiver of our exclusive right to provide property management and other services to Residential |
• | Launched the buy-renovate-sell program in 2016; acquired 119 homes, 14 of which were sold |
• | Received a residential rental property management vendor rating of 2 from Morningstar Credit Ratings in February 2017 |
Reportable Segments
We classify our businesses into the following three reportable segments:
Mortgage Services: Provides loan servicers, originators, rental property investors and real estate consumers with products, services and technologies that span the mortgage and real estate lifecycle. Within the Mortgage Services segment, we provide:
Asset Management Services - the products, services and technologies typically used or licensed by loan servicers, rental property investors and real estate consumers to purchase, preserve, renovate, lease, manage, sell and auction single family residential real estate.
Origination Services - the products, solutions and services typically used or licensed by loan originators (or other similar mortgage market participants) in producing residential mortgages. Altisource also manages the Lenders One mortgage cooperative that provides its members with networking opportunities, industry related education and cost effective services and tools to help them increase revenue and improve profitability.
Insurance Services - origination and default related title insurance and settlement services for institutions and consumers, certified loan insurance and certification products to protect mortgage market participants against losses caused by mortgage underwriting defects, and residential and commercial loan and insurance claim disbursement processing, and risk mitigation and construction inspection services.
Property Valuation Services - traditional appraisal management services and a variety of broker and non-broker valuation products to support mortgage originators, loan servicers, rental property investors and consumers.
Default Management Services - foreclosure trustee services for loan servicers and non-legal processing and related services for and under the supervision of foreclosure, bankruptcy and eviction attorneys.
Financial Services: Provides collection services primarily to debt originators and servicers (e.g., credit card, auto lending, retail credit and mortgage) and customer relationship management services primarily to the utility, insurance and hotel industries. Within the Financial Services segment, we provide the following services:
Asset Recovery Management - primarily includes post-charge-off debt collection services on a contingency fee basis.
Customer Relationship Management - primarily includes customer care, technical support and early stage collections services as well as insurance call center and administrative support services.
Technology Services: Provides software and data analytics solutions that support the management of mortgage and real estate activities and marketplace transactions across the mortgage and real estate lifecycles and information technology (“IT”) infrastructure management services. Within the Technology Services segment, we provide:
Software Services - software and data analytics solutions that facilitate process automation, rules management, controls enforcement, data security, marketplace enablement and analytics-driven outcomes across the real estate and mortgage lifecycle. We provide these capabilities primarily as software-as-a-service, or SaaS, to our customers and as enabling technologies to other Altisource business segments through a shared services model. Our servicer technologies include residential and commercial loan servicing, loss mitigation (loan modification, short sales, deed-in-lieu) and default services (real estate owned (“REO”), foreclosure, bankruptcy, eviction). Our origination technologies include a loan origination system, a borrower application portal, an underwriting and quality control solution and a secondary loan trading platform. Our marketplace enabling technologies include patented vendor management, marketplace transaction management and payment management platforms, a document management platform and a data analytics delivery platform.
IT Infrastructure Services - IT management services including, among others, desktop support, data center support, network management, telephony services, application management and IT security. Some or all of these services are provided to Ocwen Financial Corporation (“Ocwen”), Residential and Altisource Asset Management Corporation (“AAMC”) through services agreements, and to other Altisource business segments through a shared services model.
4
Corporate Items and Eliminations: Includes interest expense and costs related to corporate support functions including executive, finance, law, compliance, human resources, vendor management, risk management and sales and marketing costs not allocated to the business units, and also includes eliminations of transactions between the reportable segments. Corporate Items and Eliminations also include the cost of certain facilities.
We classify revenue in three categories: service revenue, revenue from reimbursable expenses and non-controlling interests. In evaluating our performance, we focus on service revenue. Service revenue consists of amounts attributable to our fee-based services. Reimbursable expenses and non-controlling interests are pass-through items for which we earn no margin. Reimbursable expenses consist of amounts we incur on behalf of our customers in performing our fee-based services that we pass directly on to our customers without a markup. Non-controlling interests represent the earnings of Lenders One and Best Partners Mortgage Brokers Cooperative, Inc., a mortgage cooperative doing business as Wholesale One® (“Wholesale One”), consolidated entities not owned by Altisource, and are included in revenue and reduced from net income to arrive at net income attributable to Altisource.
Customers
Our customers include some of the largest financial institutions in the United States, government-sponsored enterprises (“GSEs”), utility companies, commercial banks, servicers, investors, non-bank originators and correspondent lenders, mortgage bankers, insurance companies and financial services companies. During 2016, we signed a significant number of agreements and statements of work with strategic customers positioning us well for 2017. Our largest customer, Ocwen, accounted for 56% of our total revenue for the year ended December 31, 2016.
Revenue from Ocwen primarily consists of revenue earned directly from Ocwen and revenue earned from the loans serviced by Ocwen when Ocwen designates us as the service provider. Revenue from Ocwen as a percentage of segment and consolidated revenue was as follows for the years ended December 31:
2016 | 2015 | 2014 | |||
Mortgage Services | 60% | 63% | 67% | ||
Financial Services | 17% | 21% | 27% | ||
Technology Services | 42% | 54% | 42% | ||
Consolidated revenue | 56% | 60% | 60% | ||
For the years ended December 31, 2016, 2015 and 2014, we generated revenue from Ocwen of $561.9 million, $631.6 million and $650.7 million, respectively. Services provided to Ocwen during such periods and reported in the Mortgage Services segment included real estate asset management and sales, residential property valuation, trustee management services, property preservation and inspection services and insurance services. Services provided to Ocwen and reported in the Financial Services segment included mortgage charge-off collections. Services provided to Ocwen and reported in the Technology Services segment included IT infrastructure management and software applications. As of December 31, 2016, accounts receivable from Ocwen totaled $26.2 million, $15.8 million of which was billed and $10.4 million of which was unbilled.
We record revenue we earn from Ocwen under the terms of master services agreements and amendments thereto (collectively, the “Ocwen Service Agreements”).
We earn additional revenue related to the portfolios serviced by Ocwen when a party other than Ocwen selects Altisource as the service provider. For the years ended December 31, 2016, 2015 and 2014, we recognized revenue of $188.0 million, $216.9 million and $256.0 million, respectively, related to the portfolios serviced by Ocwen when a party other than Ocwen selected Altisource as the service provider. These amounts are not included in deriving the revenue from Ocwen as a percentage of revenue in the table above.
Our services are provided to customers primarily located in the United States. Financial information for our segments can be found in Note 24 to our consolidated financial statements.
Sales and Marketing
We have a proven enterprise sales and marketing team, along with business unit sales executives, with extensive relationship management and industry experience. These individuals cultivate and maintain relationships throughout the industry sectors we serve. We sell our suite of services to mortgage servicers, mortgage originators, buyers and sellers of homes for personal and investment use and financial services firms.
5
Our primary sales and marketing focus areas for institutional customers are to:
• | Expand relationships with existing customers by cross-selling additional services and growing the volume of existing services we provide. We believe our existing customers represent a meaningful growth opportunity for us; |
• | Develop new customer relationships leveraging a comprehensive suite of services, strong performance and controls. We believe there is a large opportunity to provide our services to new customers; and |
• | Sell new offerings to existing customers and prospects. Some of our newer offerings include our suite of support services for FHA mortgages, Vendorly™, a SaaS-based vendor management platform, Trelix Connect™, a SaaS-based loan review system, noteXchange®, a SaaS platform to facilitate whole loan purchase and sale transactions, and residential and commercial loan disbursement processing, risk mitigation and construction inspection services. |
Our primary sales and marketing focus areas for consumers are to:
• | Attract home buyers and sellers with a compelling value proposition through online marketing and search engine optimization; |
• | Grow brand awareness of Owners.com and Investability® through broadcast marketing and public relations; and |
• | Leverage local real estate agents to provide personalized service. |
Given the highly diverse nature of the industries we serve, the time and effort we spend in expanding relationships or winning new relationships is significant.
Intellectual Property and Data
We rely on a combination of contractual restrictions, internal security practices, patents, trademarks and copyrights to establish and protect our trade secrets, intellectual property, software, technology and expertise. We also own or, as necessary and appropriate, have obtained licenses from third parties to intellectual property relating to our services, processes and businesses. These intellectual property rights are important factors in the success of our businesses.
As of December 31, 2016, we have been awarded one patent that expires in 2023, four patents that expire in 2024, seven patents that expire in 2025, two patents that expire in 2026, two patents that expire in 2029 and one patent that expires in 2030. In addition, we have registered trademarks, or recently filed applications for the registration of trademarks, in a number of jurisdictions including the United States, the European Union (“EU”), India and nine other jurisdictions. These trademarks generally can be renewed indefinitely, provided they are being used in commerce.
We actively protect our rights and intend to continue our policy of taking all measures we deem reasonable and necessary to develop and protect our patents, trademarks, copyrights, trade secrets and other intellectual property rights.
In addition, we may make use of data in connection with certain of our services. This data generally relates to real property information, mortgage information and consumer information. We gather this data from a variety of third party sources, including from governmental entities and, subject to licensed usage rights and legally permitted usage, we use this data in connection with our delivery of services.
Furthermore, we may also combine this data, subject to licensed usage rights and legally permitted usage, with proprietary data we generate and apply statistical data correction and proprietary algorithms to further enhance data in connection with other services in an attempt to predict metrics of interest across time periods and geographic boundaries in connection with certain of our services.
Market and Competition
We sell our suite of services to mortgage servicers, mortgage originators, buyers and sellers of homes for personal and investment use and financial services firms. The mortgage and real estate markets are very large and are influenced by macroeconomic factors such as credit availability, interest rates, home prices, inflation, unemployment rates and consumer confidence.
The markets to provide services for mortgage servicers and mortgage originators are highly competitive and generally consist of a few national companies, in-house providers and a large number of regional and local providers. We typically compete based upon product and service offerings, product and service delivery, quality and control environment, technology integration and support, price and financial strength.
The markets to provide services for buyers and sellers of homes for personal and investment use are highly competitive and generally consist of several national companies, a large number of regional and local providers and numerous start-up companies. We typically compete based upon product and service offerings, product and service delivery, ease of transacting, price and personal service.
6
For financial services firms, we provide collection services and customer relationship management services. The markets to provide these services are highly competitive and generally consist of several national companies, a large number of regional and local providers and in-house providers. We typically compete based upon product and service offerings, product and service delivery, quality and control environment, technology integration and support, price and financial strength.
Our competitors may have greater financial resources, brand recognition, alternative or disruptive products and other competitive advantages. We cannot determine our market share with certainty, but believe for mortgage servicers and collection services for financial services firms, we have a modest share of the market, and for the others we have relatively small market share.
Employees
As of December 31, 2016, we had the following number of employees:
United States | India | Philippines | Uruguay | Luxembourg | Consolidated Altisource | |||||||||||||
Mortgage Services | 642 | 2,659 | 381 | 15 | 5 | 3,702 | ||||||||||||
Financial Services | 482 | 1,401 | 300 | — | 1 | 2,184 | ||||||||||||
Technology Services | 416 | 1,267 | 9 | — | 3 | 1,695 | ||||||||||||
Corporate | 163 | 432 | 20 | 145 | 15 | 775 | ||||||||||||
Total employees | 1,703 | 5,759 | 710 | 160 | 24 | 8,356 | ||||||||||||
We have not experienced any work stoppages and we consider our relations with employees to be good. We believe our future success will depend, in part, on our continuing ability to attract, hire and retain skilled and experienced personnel.
Seasonality
Certain of our revenues are impacted by seasonality. More specifically, revenues from property sales, originations and lawn maintenance in our Mortgage Services segment tend to be at their lowest level during fall and winter months and at their highest level during spring and summer months. Financial Services’ asset recovery management revenue tends to be higher in the first quarter, as borrowers may utilize tax refunds and bonuses to pay debts, and generally declines throughout the rest of the year.
Government Regulation
Our business and the business of our customers are subject to extensive scrutiny and regulation by federal, state and local governmental authorities including the Federal Trade Commission (“FTC”), the Consumer Financial Protection Bureau (“CFPB”), the Bank Service Company Act, the Securities and Exchange Commission (“SEC”), the Department of Housing and Urban Development (“HUD”) and the state and local agencies that license or oversee certain of our auction, real estate brokerage, mortgage and debt collection services, trustee services, property management services and insurance services. We also must comply with a number of federal, state and local consumer protection laws including, among others, the Gramm-Leach-Bliley Act (“GLBA”), the Fair Debt Collection Practices Act (“FDCPA”), Unfair, Deceptive or Abusive Acts and Practices statutes (“UDAAP”), the Real Estate Settlement Procedures Act (“RESPA”), the Truth in Lending Act (“TILA”), the Fair Credit Reporting Act (“FCRA”), the Telephone Consumer Protection Act (“TCPA”), the Homeowners Protection Act (“HPA”), the California Homeowner Bill of Rights (“CHBR”), the New York Real Property Actions and Proceedings Law (“RPAPL”), the Fair Housing Act and the Secure and Fair Enforcement for Mortgage Licensing (“SAFE”) Act. We are also subject to the requirements of the Foreign Corrupt Practices Act (“FCPA”) and comparable foreign laws, due to our activities in foreign jurisdictions.
Legal requirements can and do change as statutes and regulations are enacted, promulgated or amended. One such enacted regulation is the Dodd-Frank Wall Street Reform and Consumer Protection Act (“Dodd-Frank Act”). The Dodd-Frank Act is extensive and includes reform of the regulation and supervision of financial institutions, as well as the regulation of derivatives, capital market activities and consumer financial services. The Dodd-Frank Act, among other things, created the CFPB, a federal entity responsible for regulating consumer financial services and products. Title XIV of the Dodd-Frank Act contains the Mortgage Reform and Anti-Predatory Lending Act (“Mortgage Act”). The Mortgage Act imposes a number of additional requirements on lenders and servicers of residential mortgage loans by amending and expanding certain existing regulations. The interpretation or enforcement by regulatory authorities of applicable laws and regulations also may change over time. In addition, the creation of new regulatory authorities or changes in the regulatory authorities overseeing applicable laws and regulations may also result in changing interpretation or enforcement of such laws or regulations.
Our failure to comply with applicable laws or regulations or changing interpretation of such laws or regulations could subject the Company to criminal or civil liability, significant penalties, fines, settlements, costs and consent orders affecting us or our customers
7
that may curtail or restrict the business as it is currently conducted and could have an adverse effect on our financial condition or results of operations.
Furthermore, certain of our technology services are provided at the direction and pursuant to the identified requirements of our customers. The failure of our customers to properly identify or account for regulatory requirements applicable to such technology services could expose us to significant penalties, fines, settlements, costs and consent orders that could have an adverse effect on our financial condition or results of operations.
We may be subject to licensing and regulation as a provider of certain services including, among others, services as a mortgage origination underwriter, valuation provider, appraisal management company, asset manager, property manager, title insurance agent, insurance broker and underwriter, real estate broker, auctioneer, foreclosure trustee and debt collector in a number of states. Our employees and subsidiaries may be required to be licensed by various state commissions for the particular type of service sold and to participate in regular continuing education programs. Periodically, we are subject to audits and examinations by federal, state and local governmental authorities and receive subpoenas, civil investigative demands or other requests for information from such governmental authorities in connection with their regulatory or investigative authority. We are currently responding to such inquiries from governmental authorities relating to certain aspects of our business. We believe it is premature to predict the potential outcome or to estimate any potential financial impact in connection with any of these inquiries. In conjunction with one such inquiry, on November 10, 2016, Altisource received a Notice and Opportunity to Respond and Advise (“NORA”) letter from the CFPB indicating that the CFPB is considering a potential enforcement action against Altisource relating to an alleged violation of federal law that primarily concerns certain technology services provided to Ocwen. We understand that a NORA letter provides the recipient an opportunity to present its position to the CFPB before an enforcement action is recommended or commenced. On December 15, 2016, we provided a written response to the NORA letter setting forth the legal, policy and factual reasons why we believe an enforcement action is not warranted. We are committed to resolving any potential concerns of the CFPB. If the CFPB were to bring an enforcement action against us, the resolution of such action could have a material adverse impact on our business, reputation, financial condition and results of operations. However, we believe it is premature to predict the potential outcome or to estimate any potential financial impact in connection with any potential CFPB enforcement action that may be under consideration.
Available Information
We file Annual Reports on Form 10-K, Quarterly Reports on Form 10-Q, Current Reports on Form 8-K and other information with the SEC. These filings are available to the public over the Internet at the SEC’s website at http://www.sec.gov. You may also read and copy any document we file at the SEC’s public reference room located at 100 F Street, N.E., Washington, DC 20549. Please call the SEC at 1-800-SEC-0330 for further information on the public reference room.
Our principal internet address is www.altisource.com and we encourage investors to use it as a way to easily find information about us. We promptly make the reports we file or furnish with the SEC, corporate governance information (including our Code of Business Conduct and Ethics), select press releases and other related information available on this website. The contents of our website are available for informational purposes only and shall not be deemed incorporated by reference in this report.
ITEM 1A. | RISK FACTORS |
The following risk factors and other information included in this Annual Report on Form 10-K should be carefully considered. The risks and uncertainties described below are not the only ones we face. Additional risks and uncertainties not presently known to us or that we presently deem less significant may also impair our business operations. If any of the following risks, or other events related to such risks, actually occur, our business, results of operations and financial condition could be adversely affected. Furthermore, the risk factors described below may not describe the full nature or scope of such risks.
Risks Related to Our Business and Industry
Ocwen is our largest customer and the loss of Ocwen as a customer or a reduction in the size of Ocwen could adversely affect our business and results of operations.
Ocwen is our largest customer and 56% of our revenue for the year ended December 31, 2016 was from Ocwen. Additionally, 19% of our revenue for the year ended December 31, 2016 was earned on the portfolios serviced by Ocwen, when a party other than Ocwen selected us as the service provider. Ocwen purchases certain services from our Mortgage Services, Financial Services and Technology Services segments under service agreements that extend through August 2025, subject to termination under certain conditions. In addition, Ocwen purchases certain origination services from Altisource under an agreement that continues until January 23, 2019, but which is subject to a 90 day termination right by Ocwen.
8
Ocwen has disclosed that it is subject to a number of ongoing federal and state regulatory examinations, consent orders, inquiries, requests for information and other actions and is subject to pending legal proceedings that have or could result in adverse regulatory or other actions against Ocwen. While not all inclusive, regulatory actions to date have included subjecting Ocwen to independent oversight of its operations and placing certain restrictions on its ability to acquire servicing rights. Ocwen may become subject to future federal and state regulatory investigations, inquiries, requests for information and legal proceedings, any of which could also result in adverse regulatory or other actions against Ocwen.
As a result of the sale of substantially all of the assets of Home Loan Servicing Solutions, Ltd. (“HLSS”) to New Residential Investment Corp. (“NRZ”) in April of 2015, NRZ owned the rights to approximately 78% of Ocwen’s non-GSE servicing rights as of September 30, 2016. Under an agreement between NRZ and Ocwen, NRZ has the right (not necessarily the obligation or ability) to transfer servicing away from Ocwen if Ocwen does not maintain certain minimum servicer ratings on or after April 6, 2017.
Any or all of the foregoing may have significant adverse effects on Ocwen’s business and our continuing relationships with Ocwen. For example, Ocwen may be required to alter the way it conducts business, including the parties it contracts with for services (including information technology and software services), it may be required to seek changes to its existing pricing structure with us, it may lose or sell some or all of its non-GSE servicing rights or subservicing arrangements or may lose one or more of its state servicing licenses. Additional regulatory actions or adverse financial developments may impose additional restrictions on or require changes in Ocwen’s business that could require it to sell assets or change its business operations. Any or all of these effects could result in our eventual loss of Ocwen as a customer or a reduction in the number and/or volume of services they purchase from us or the loss of other customers.
If any of the following events occurred, Altisource’s revenue would be significantly lower and our results of operations could be materially adversely affected, including from the possible impairment or write-off of goodwill, intangible assets, property and equipment, other assets and accounts receivable:
• | Altisource loses Ocwen as a customer or there is a significant reduction in the volume of services they purchase from us |
• | Ocwen loses or sells a significant portion or all of its non-GSE servicing rights or subservicing arrangements and Altisource fails to be retained as a service provider |
• | Ocwen loses state servicing licenses in states with a significant number of loans in Ocwen’s servicing portfolio |
• | Altisource fails to be retained as a service provider |
• | The contractual relationship between Ocwen and Altisource changes significantly or there are significant changes to our pricing to Ocwen for services from which we generate material revenue |
There may be other events that could cause the loss of Ocwen as a customer or reduce the size of our relationship with Ocwen, or that could otherwise adversely affect the revenues we earn from Ocwen, and adversely affect our business and results of operations.
Our continuing relationship with Ocwen may inhibit our ability to attract and retain other customers.
Given our close and continuing relationship with Ocwen and the regulatory scrutiny related to the way in which Ocwen does business with Altisource, we may encounter difficulties in attracting new customers and retaining existing customers. Should these and other potential customers view Altisource as part of Ocwen or as too closely related to or dependent upon Ocwen, they may be unwilling to utilize our services and our growth could be inhibited as a result.
We have key customer relationships, other than Ocwen, the loss of which could affect our business and results of operations.
While no individual client, other than Ocwen, represents more than 10% of our consolidated revenue, we are exposed to customer concentration. Most of our customers are not contractually obligated to continue to use our services at historical levels or at all. The loss of any of these key customers or their failure to pay us could reduce our revenue and adversely affect our results of operations.
The strength of the economy and the housing market can affect demand for our services.
The performance and growth of certain of our businesses are dependent on the volume of loan originations and single family residential real estate transactions. In the event of an economic slowdown, increase in interest rates or any other factor that would likely lead to a decrease in the level of transactions, including refinancing transactions and single family residential real estate transactions, our origination services, residential real estate brokerage and real estate investor solutions could be adversely affected. Also, in a strengthening economy and housing market, reduced delinquencies negatively impact our default related businesses. Further, in the event that adverse economic conditions or other factors lead to a decline in levels of home ownership and a reduction in the aggregate number of United States mortgage loans outstanding, our revenues could be adversely affected.
9
Our business is subject to substantial competition.
The markets for our services are very competitive. Our competitors vary in size and in the scope and breadth of the services they offer. We compete for existing and new customers against both third parties and the in-house capabilities of our customers. Some of our competitors are more established, better known and have substantial resources, and some have widely-used technology platforms which they seek to use as a competitive advantage to drive sales of other products and services. In addition, we expect the markets in which we compete will continue to attract new competitors and new technologies. These new technologies may render our existing technologies obsolete, resulting in operating inefficiencies and increased competitive pressure. There can be no assurance we will be able to compete successfully against current or future competitors or that competitive pressures we face in the markets in which we operate will not adversely affect our business, financial condition and results of operations.
Our intellectual property rights are valuable and any inability to protect them or challenges to our right to use them could reduce the value of our services or increase our costs.
Our patents, trademarks, trade secrets, copyrights and other intellectual property rights are important assets. The efforts we have taken to protect these proprietary rights may not be sufficient or effective in every case and in some cases we may not seek protection or to defend our rights. The unauthorized use of our intellectual property or significant impairment of our intellectual property rights could harm our business, make it more expensive to do business or hurt our ability to compete. Protecting our intellectual property rights is costly and time-consuming.
Although we seek to obtain patent protection for certain of our innovations, it is possible we may not be able to protect all of the innovations for which we seek protection. Changes in patent law, such as changes in the law regarding patentable subject matter, can also impact our ability to obtain patent protection for our innovations. In addition, given the costs of obtaining patent protection, we may choose not to protect certain innovations that later turn out to be important. Furthermore, there is always the possibility, despite our efforts, that the scope of the protection gained will be insufficient or an issued patent may be deemed invalid or unenforceable.
Further, as our technology solutions and services develop, we may become increasingly subject to infringement claims by others. Any claims, whether with or without merit, could:
• | be expensive and time-consuming to defend; |
• | cause us to cease making, licensing or using technology solutions that incorporate the challenged intellectual property; |
• | require us to redesign our technology solutions, if feasible; |
• | divert management’s attention and resources; and/or |
• | require us to enter into royalty or licensing agreements in order to obtain the right to use necessary technologies. |
Technology failures, defects or inadequacies, development delays or installation difficulties, security breaches, acts of vandalism or the introduction of harmful code could damage our business operations and increase our costs.
Disruptions, failures, defects or inadequacies in our technology or software we acquire from third parties, delays in the development of, or installation difficulties with, our technology, or security breaches, acts of vandalism, system attacks or the introduction of malicious code to our technology, may interrupt or delay our ability to provide services to our customers. Any sustained and repeated disruptions in these services may have an adverse impact on our and our customers’ results of operations. Further, Ocwen or other of our customers may require changes and improvements to the systems we provide to them to manage the volume and complexity, laws or regulations of their businesses, which changes and improvements may be costly and time-consuming to implement and may create disruptions in our provision of services to customers, which may have an adverse impact on our business operations and financial condition, and increase our costs. Additionally, the improper implementation or use of Altisource technology by customers could impact the operation of that technology, and potentially cause harm to our reputation, loss of customers, negative publicity or exposure to liability claims or government investigations or actions.
We depend on our ability to access data from external sources to maintain and grow our businesses. If we are unable to access data from these sources or if the prices charged for these services significantly increase, the quality, pricing and availability of our products and services may be adversely affected, which could have a material adverse impact on our business, financial condition and results of operations.
We rely on data from public and private sources to maintain and grow some of our businesses (such as Owners.com, Investability and RentRange®) and to maintain our databases (such as multiple listing service, or MLS data). Our data sources could cease providing or reduce the availability, type, details or other aspects of their data to us or increase the price we pay for their data. If a number of suppliers are no longer able or are unwilling to provide us with certain data, or if our sources of data become unavailable or too expensive, we may need to find alternative sources. If we are unable to identify and contract with suitable alternative data suppliers and efficiently and effectively integrate these data sources into our service offerings, we could experience service
10
disruptions, increased costs and reduced quality of our services. New legal restrictions could limit the use or dissemination of data. Significant price increases or restrictions could have a material adverse effect on our business, results of operations or financial condition, in particular if we are unable to arrange for substitute sources of data on commercially reasonable terms or at all.
The Company’s databases containing proprietary information and personal information of our customers, vendors and employees could be breached, which could subject us to adverse publicity, costly government enforcement actions or private litigation and expenses.
As part of our business and operation of our technology, we maintain proprietary information in tangible and electronic forms and electronically receive, process, store and transmit personally identifiable information (“PII”) and confidential and sensitive business information of ourselves and of our customers, vendors and employees. We also rely extensively on the operation of technology networks and systems that are administered by third parties, including the internet and cloud based solutions. We rely on the security of our facilities, networks, databases, systems and processes and, in certain circumstances, those of third parties, such as vendors, to protect our proprietary information and PII in our possession and information about our customers, vendors and employees. Hackers, criminals and others are constantly devising schemes to circumvent security safeguards and other large companies have suffered serious data security breaches. If our controls and those of our vendors are not effective, outdated or do not exist, unauthorized parties may gain access to our networks or databases, or those of our vendors, and they may be able to steal, publish, delete, or modify our sensitive proprietary information and sensitive third party information, including PII. In addition, employees may intentionally or inadvertently cause data or security breaches that result in unauthorized release of such PII, proprietary or confidential information. In such circumstances, our business could suffer and we could be held liable to our customers, vendors, other parties or employees, as well as be subject to notification requirements or regulatory or other actions for breaching privacy laws or failing to adequately protect such information. This could result in costly investigations and litigation, civil or criminal penalties, large scale remediation requirements, operational changes or other response measures, significant penalties, fines, settlements, costs, consent orders, loss of consumer confidence in our security measures and negative publicity that could adversely affect our financial condition, results of operations and reputation. Furthermore, customer and governmental authorities increasingly impose more stringent security obligations on us, our services and the security of our customers’ data and PII, and impose new liabilities for data breaches, all of which could have an adverse effect on us and our results of operations.
We have long development and sales cycles for many of our services, analytics and technology solutions and if we fail to close sales after expending significant time and resources to do so, our business, financial condition and results of operations may be adversely affected.
We have long development and sales cycles for many of our services, analytics and technology solutions. We may expend significant time and resources in pursuing a particular customer that does not generate revenue or pursuing a particular service or solution for our existing customers that does not generate revenue. We may encounter delays when developing new services or technology solutions. Changes in relevant regulations or industry practices may render existing solutions or ongoing development efforts obsolete or require significant modifications. We may experience difficulties in installing or integrating our technologies on platforms used by our customers. Further, defects in our technology solutions, errors or delays in the processing of electronic transactions or other difficulties could result in interruption of business operations, delay in market acceptance, additional development and remediation costs, loss of customers, negative publicity or exposure to liability claims.
Delays due to the length of our sales cycle or costs incurred that do not result in sales could have an adverse effect on our business, financial condition or results of operations.
The failure of any of the insurance underwriting loss limitation methods we use could have adverse effects on our results.
Altisource, through its subsidiary Association of Certified Mortgage Originators Risk Retention Group, Inc., provides certified loan insurance to its customers. Altisource reduces a portion of its risk of insurance loss through third party reinsurance. The incidence and severity of claims against insurance policies are inherently unpredictable. Although we attempt to manage our exposure to insurance underwriting risk through the use of disciplined underwriting controls and the purchase of third party reinsurance, the frequency and severity of claims could be greater than contemplated in our pricing and risk management methods and our controls and mitigation efforts may not be effective or sufficient.
We also face counterparty risk when purchasing reinsurance from third party reinsurers. The insolvency or unwillingness of any of our present or future reinsurers to make timely payments to us under the terms of our reinsurance agreements could have an adverse effect on us. Further, there is no certainty that we will be able to purchase the amount or type of reinsurance we desire in the future or that the reinsurance we desire will be available on terms we consider acceptable or with reinsurers with whom we want to do business.
11
Our business and the business of our customers are subject to extensive scrutiny and regulation, and failure to comply with existing or new regulations may adversely impact us.
Our business and the business of our customers are subject to extensive scrutiny and regulation by federal, state and local governmental authorities including the FTC, the CFPB, the SEC, the HUD and the state and local agencies that license or oversee certain of our auction, real estate brokerage, mortgage and debt collection services, trustee services and insurance services. We also must comply with a number of federal, state and local consumer protection laws including, among others, the GLBA, the FDCPA, UDAAP, RESPA, TILA, the FCRA, the TCPA, the HPA, the CHBR, the RPAPL, the Fair Housing Act, the SAFE Act, the Mortgage Act, the FCPA and the Dodd-Frank Act. These requirements can and do change as statutes and regulations are enacted, promulgated or amended. Furthermore, the interpretation or enforcement by regulatory authorities of these requirements may change over time. The creation of new regulatory authorities or changes in the regulatory authorities overseeing applicable laws and regulations may also result in changing interpretation or enforcement of such laws or regulations. We are also subject to licensing and regulation as a provider of certain services including, among others, services as a mortgage origination underwriter, valuation provider, appraisal management company, asset manager, property manager, title insurance agent, insurance broker and underwriter, real estate broker, auctioneer, foreclosure trustee and debt collector in a number of states. Our employees and subsidiaries may be required to be licensed by various state commissions for the particular type of service sold and to participate in regular continuing education programs. We incur significant ongoing costs to comply with licensing requirements and governmental regulations and to respond to government and regulatory confidential inquiries, audits, regulatory examinations and other similar matters.
Participants in the industries in which we operate are subject to a high level of government and regulatory scrutiny. This scrutiny has included review by federal and state governmental authorities of all aspects of the mortgage servicing and lending industries and the debt collection industry, including an increased legislative and regulatory focus on consumer protection practices. Our and our customers’ failure to comply with applicable laws, regulations, consent orders or settlements could subject the Company to civil and criminal liability, loss of licensure, damage to our reputation in the industry, significant penalties, fines, settlements, adverse publicity, litigation, including class action lawsuits or administrative enforcement actions, costs and consent orders against us or our customers that may curtail or restrict our business as it is currently conducted. If governmental authorities continue to impose new or more restrictive requirements or enhanced oversight, we may be required to increase or decrease our prices and/or we may incur significant additional costs to comply with such requirements. Also, if we are unable to adapt our products and services to conform to the new laws and regulations, or if these laws and regulations have a negative impact on our clients, we may experience client losses or increased operating costs. Any of the foregoing outcomes could have an adverse effect on our financial condition or results of operations. Furthermore, even if we believe we complied with such laws and regulations, we may choose to settle enforcement actions or lawsuits in order to avoid the potentially significant costs of defending such actions or lawsuits and to further avoid the risk of increased damages if we ultimately were to receive an unfavorable outcome.
Furthermore, certain of our technology services are provided at the direction and pursuant to the identified requirements of our customers. The failure of our customers to properly identify or account for regulatory requirements applicable to such technology services could expose us to significant penalties, fines, settlements, costs and consent orders that could have an adverse effect on our financial condition or results of operations.
Periodically, we are subject to audits and examinations by federal, state and local governmental authorities and receive subpoenas, civil investigative demands or other requests for information from such governmental authorities in connection with their regulatory or investigative authority. We are currently responding to such inquiries from governmental authorities relating to certain aspects of our business, including as set forth in the Government Regulation section of Item 1 of Part I, “Business” above. Responding to such audits, examinations and inquiries will cause us to incur costs, including legal fees or other charges, which may be material in amount, and in addition, may result in management distraction or may cause us to modify or terminate certain services we currently offer. If any such audits, examinations or inquiries result in allegations of noncompliance, we could incur significant penalties, fines, settlements, costs and consent orders that may curtail, restrict or otherwise have an adverse effect on our business and results of operations. Furthermore, even if we believe we complied with applicable laws and regulations, we may choose to settle such allegations with the governmental authorities in order to avoid the potentially significant costs of defending such allegations and to further avoid the risk of increased damages if we ultimately were to receive an unfavorable outcome.
National servicing standards and federal and state government scrutiny and regulation and other requirements require very specific loan modification and foreclosure procedures among others that have further reduced the number of loans entering the foreclosure process and have negatively impacted our default services revenue and profit. It is unclear when or if volumes will increase in the future.
12
Our customers are subject to government regulation, requiring our customers to, among other things, oversee their vendors and maintain documentation that demonstrates their oversight. If our performance does not meet such requirements, our results of operations could be adversely affected.
Our customers are subject to a variety of federal, state and local government regulations, including the Bank Service Company Act and those promulgated by the CFPB and others, as well as consent orders and settlements, including the National Mortgage Settlement. The foregoing may require our customers to oversee their vendors and document the procedures performed to demonstrate that oversight. Altisource, as a vendor, is subject to oversight by our customers. If we do not meet the standards established by or imposed upon our customers or if any other oversight procedures result in a negative outcome for Altisource, we may lose customers, may no longer be granted referrals for certain services, or may have to conform our business to address these standards, negatively impacting our business and results of operations. Even if Altisource satisfies its contractual obligations to its clients, regulators may allege that products or services provided by Altisource fail to meet applicable regulatory requirements.
We rely on third party vendors for many aspects of our business. If our vendor oversight activities are ineffective, we fail to meet customer or regulatory requirements or we face difficulties managing our relationships with third party vendors, our results of operations could be adversely affected.
We rely on third party vendors to provide goods and services in relation to many aspects of our operations. Our dependence on these vendors makes our operations vulnerable to the unavailability of such third parties, the pricing and services offered by such third parties and such third parties’ failure to perform adequately under our agreements with them. In addition, where a vendor provides services that we are required to provide under a contract with a client, we are generally responsible for such performance and could be held accountable by the client for any failure of performance by our vendors. We evaluate the competency and solvency of our key third party vendors. We perform ongoing vendor oversight activities to identify potential new vendors, review vendor pricing and to identify any performance or other issues related to current vendors. If our vendor oversight activities are ineffective or if a vendor fails to provide the services that we require or expect, or fails to meet contractual requirements, such as service levels or compliance with applicable laws, the failure could negatively impact our business by adversely affecting our ability to serve our customers and/or subjecting us to litigation and regulatory risk for ineffective vendor oversight. Furthermore, the failure to obtain services at anticipated pricing could impact our cost structure and the prices of services we provide. In addition, Altisource may be required by its customers or by applicable regulations to oversee its vendors and document procedures performed to demonstrate that oversight. If we fail to meet such customer or regulatory requirements, or we face difficulties managing our relationships with third party vendors, we may lose customers or may no longer be granted referrals for certain services or could be subject to adverse regulatory action, negatively impacting our business and results of operations. Such failures could adversely affect the reliability and quality of the services we provide our customers and could adversely affect our results of operations.
If financial institutions at which we hold cash and cash equivalents as well as escrow and trust funds fail, it could have an adverse impact on our Company.
We hold our cash and cash equivalents at various financial institutions. In addition, we hold customers’ assets in escrow and trust accounts at various financial institutions pending completion of certain real estate activities. We also hold cash in trust accounts at various financial institutions where contractual obligations mandate maintaining dedicated bank accounts. These amounts are held in escrow and trust accounts for limited periods of time and are not included in the accompanying consolidated balance sheets. We may become liable for funds owed to third parties as a result of the failure of one or more of these financial institutions, in addition to loss of our cash and cash equivalents, and there is no guarantee we would recover the funds deposited, whether through Federal Deposit Insurance Corporation coverage, private insurance or otherwise.
We generate significant cash from our operations that is deposited into our operating accounts at banks and also, in connection with debt collections (our Financial Services businesses) and real estate transactions (Mortgage Services businesses), in escrow and trust accounts, which exposes us to risk of loss due to fraudulent or inadvertent misappropriation of cash.
We hold our cash and cash equivalents at various financial institutions. In addition, we hold customers’ assets in escrow and trust accounts at various financial institutions pending completion of certain real estate activities. These cash balances expose us to purposeful misappropriation of cash by employees or others and unintentional mistakes resulting in a loss of cash which may not be recoverable. In addition, we may become liable for funds owed to third parties as a result of such purposeful misappropriation of cash by employees or others and unintentional mistakes resulting in a loss of cash held in escrow and trust accounts, and there is no guarantee we would recover the lost funds from the party or parties involved in a fraudulent or inadvertent misappropriation of cash.
13
Our primary source of liquidity is cash flows from operations. We seek to deploy cash generated in a disciplined manner, including to repurchase and repay our senior secured term loan and, from time to time, repurchase shares of our common stock. We may not continue to deploy cash as we have in the past.
While we have historically used cash from operations to repurchase and repay our senior secured term loan and repurchase shares of our common stock, there is no guarantee that we will continue to do so or that we will do so at attractive prices. Furthermore, there is no guarantee that cash from operations will be available for repurchasing our senior secured term loan and repurchasing shares of our common stock. Also, we may not repurchase our senior secured term loan and common stock at the same levels as in the past. In addition, while the Company has not historically declared dividends, the Company may decide in the future to declare a dividend rather than, or in addition to, repurchasing our senior secured term loan and/or repurchasing shares of our common stock. If we continue such repurchases or declare a dividend, we may not have sufficient cash for other opportunities that may arise.
We may be subject to claims of legal violations or wrongful conduct which may cause us to pay unexpected litigation costs, damages or indemnifications, or modify our products or processes.
From time to time, we may be subject to costly and time-consuming regulatory or legal proceedings that claim legal violations or wrongful conduct. These proceedings may involve regulators, clients, our clients’ customers, vendors, competitors and/or other large groups of plaintiffs and, if resulting in findings of violations, could result in substantial damages or indemnification obligations. Additionally, we may be forced to settle some claims and change existing company practices, services and processes that are currently revenue generating. This could lead to unexpected costs or a loss of revenue. Furthermore, even if we believe we have no liability for the alleged regulatory or legal violations or wrongful conduct, we may choose to settle such regulatory or legal proceedings in order to avoid the potentially significant costs of defending such allegations and to further avoid the risk of increased damages if we ultimately were to receive an unfavorable outcome.
Our debt makes us more sensitive to the effects of economic change; our level of debt and provisions in our debt agreements could limit our ability to react to changes in the economy or our industry.
Our debt makes us more vulnerable to changes in our results of operations because a portion of our cash flows from operations is dedicated to servicing our debt and is not available for other purposes. Our debt is secured by virtually all of our assets and from time to time trades at a substantial discount to face value. Our ability to raise additional debt is largely limited and in many circumstances would be subject to lender approval and would require modification of our current debt agreements. Additionally, increases in interest rates will negatively impact our cash flows as the interest rate on our debt is variable. The provisions of our debt agreement could have other negative consequences to us including the following:
• | limiting our ability to borrow money for our working capital, capital expenditures and debt service requirements or other general corporate purposes; |
• | limiting our flexibility in planning for, or reacting to, changes in our operations, our business or the industry in which we compete; |
• | requiring us to use a portion of our excess cash flow, as defined in the debt agreement, to repay debt in the event our debt to EBITDA ratios, as defined in the debt agreement, exceed certain thresholds; and |
• | placing us at a competitive disadvantage by limiting our ability to invest in the business. |
Our ability to make payments on our indebtedness depends, in part, on our ability to generate cash in the future. If we do not generate sufficient cash flows and do not have sufficient cash on hand to meet our debt service and working capital requirements, we may need to seek additional financing, raise equity or sell assets. This may make it more difficult for us to obtain financing on terms that are acceptable to us, or at all. Without any such financing or equity issuance, we could be forced to sell assets to make up for any shortfall in our payment obligations under unfavorable circumstances. If necessary, we may not be able to sell assets quickly enough or for sufficient amounts to enable us to meet our obligations. Failure to meet our debt service requirements could result in an event of default under our debt agreement which, if not cured or waived, could result in the holders of the defaulted debt causing all outstanding amounts with respect to that debt to be immediately due and payable.
In addition, our debt agreement contains covenants that limit our flexibility in planning for, or reacting to changes in, our business and our industry, including limitations on incurring additional indebtedness, making investments, granting liens and merging or consolidating with other companies. Complying with these covenants may impair our ability to finance our future operations or capital needs or to engage in other favorable business activities.
14
Our failure to comply with the covenants contained in our debt agreement, including as a result of events beyond our control, could result in an event of default which could adversely affect our operating results and our financial condition.
Our debt agreement requires us to comply with various operational, reporting and other covenants including, among other things, limit us from engaging in certain types of transactions. If there were an event of default under our debt agreement that was not cured or waived, the holders of the defaulted debt could cause all amounts outstanding with respect to that debt to be immediately due and payable. We cannot assure you that our assets or cash flows would be sufficient to fully repay borrowings under our outstanding debt instruments, either upon maturity or if accelerated, upon an event of default or that we would be able to refinance or restructure the payments on those debt instruments.
Our failure to maintain certain debt to EBITDA ratios contained in our debt agreement could result in required payments to the lenders of a percentage of our excess cash flows, which could adversely affect our ability to use our excess cash flows for other purposes.
Our debt agreement requires us to distribute to our lenders 50% of our consolidated excess cash flows, as defined in the debt agreement, if our net debt to EBITDA ratio, as defined in the debt agreement, exceeds 3.50 to 1.00 and 25% of our consolidated excess cash flows if our net debt to EBITDA ratio is 3.50 to 1.00 or less, but greater than 3.00 to 1.00. If we were required to distribute a portion of our excess cash flows to our lenders, we may be limited in our ability to support our business, grow our business through acquisitions or investments in technology and we may be limited in our ability to repurchase our common stock. We cannot assure you that we will maintain debt to EBITDA ratios at levels that will not require us to distribute a portion of our excess cash flows to lenders.
If we fail to maintain proper and effective internal controls, our ability to prepare accurate and timely financial statements could be impaired, which could adversely affect investor confidence in our reported financial information.
We may discover areas of our internal controls that need improvement. We cannot be certain that we will be successful in implementing or maintaining adequate internal control over our financial reporting and financial processes. The existence of material weaknesses in our internal control over financial reporting could materially adversely affect our ability to comply with applicable financial reporting requirements.
We have significant investments in goodwill and intangible assets recorded as a result of prior acquisitions and an impairment of these assets would require a write-down that would reduce our net income.
Goodwill and intangible assets are assessed for impairment annually or sooner if circumstances indicate a possible impairment. Factors that could lead to impairment of goodwill and intangible assets include significant under-performance relative to historical or projected future operating results, a significant decline in our stock price and market capitalization and negative industry or economic trends, among other indications of impairment. In the event that the recorded values of goodwill and intangible assets are impaired, any such impairment would be charged to earnings in the period of impairment. In the event of significant volatility in the capital markets or a worsening of current economic conditions, we may be required to record an impairment charge, which would negatively impact our results of operations. Possible future impairment of goodwill and intangible assets may have a material adverse effect on our business, results of operations and financial condition.
Risks Related to our Growth Strategy
Our ability to grow is affected by our ability to execute on our strategic initiatives, retain and expand our existing customer relationships and our ability to attract new customers.
Our ability to retain existing customers and expand those relationships and attract new customers is subject to a number of risks including the risk that we do not:
• | execute on our strategic initiatives; |
• | maintain or improve the quality and compliance of services we provide to our customers; |
• | meet or exceed the expectations of our customers; |
• | successfully leverage our existing customer relationships to sell additional services; and |
• | attract new customers. |
If our efforts to execute on our strategic initiatives, retain and expand our customer relationships and attract new customers do not prove effective, it could have an adverse effect on our business and results of operations and our ability to maintain and grow our operations.
15
Our ability to expand existing relationships and attract new customers is also affected by broader economic factors and the strength of the overall housing market, which can reduce demand for our services and increase competition for each customer’s business. See “The strength of the economy and the housing market can affect demand for our services.”
If we do not adapt our services to changes in technology or in the marketplace, changing requirements of governmental authorities, or if our ongoing efforts to upgrade our technology and particularly our efforts to complete development of our technology are not successful, we could lose customers and have difficulty attracting new customers for our services, which could have an adverse effect on our business and results of operations.
The markets for our services are characterized by constant technological change, our customers’ and competitors’ frequent introduction of new services and evolving industry standards and government regulation. We are currently in the process of, and from time to time will be, developing and introducing new technologies and improvements to existing technologies. Our future success will be significantly affected by our ability to complete our current efforts and in the future enhance, primarily through use of automation, econometrics and behavioral science principles, our services and develop and introduce new services that address the increasingly sophisticated needs of our customers and their customers. These initiatives carry the risks associated with any new service development effort, including cost overruns, delays in delivery and performance effectiveness. There can be no assurance that we will be successful in developing, marketing and selling new and improved technologies and services. In addition, we may experience difficulties that could delay or prevent the successful development, introduction and marketing of these services. Finally, our services and their enhancements may not adequately meet the demands of the marketplace or governmental authorities and achieve market acceptance. Any of these results could have a negative impact on our financial condition and results of operations and our ability to maintain and grow our operations.
Our growth objectives are dependent on the timing and market acceptance of our new service offerings.
Our ability to grow may be adversely affected by difficulties or delays in service development or the inability to gain market acceptance of new services to existing and new customers. There are no guarantees that new services will prove to be commercially successful.
Some of our businesses are dependent on the trend toward outsourcing.
Our continued growth at historical rates for some of our businesses is dependent on the industry trend toward outsourced services. There can be no assurance this trend will continue as organizations may elect to perform such services themselves or may be prevented from outsourcing services. A significant change in this trend could have an adverse effect on our continued growth.
Acquisitions to accelerate growth initiatives involve potential risks.
During 2016, we acquired Granite Loan Management of Delaware, LLC (“Granite”). During 2015, we acquired CastleLine Holdings, LLC and its subsidiaries (“CastleLine”) and GoldenGator, LLC (doing business as RentRange) (“RentRange”), REIsmart, LLC (doing business as Investability) (“Investability”) and Onit Solutions, LLC, a support company for RentRange and Investability (collectively “RentRange and Investability”). During 2014, we acquired certain assets and assumed certain liabilities of Mortgage Builder Software, Inc. (“Mortgage Builder”) and acquired certain assets and assumed certain liabilities of Owners Advantage, LLC (“Owners”).
When we acquire new businesses, we may face a number of integration risks, including a loss of focus on our daily operations, the need for additional management, constraints on operating resources, constraints on financial resources from integration and system conversion costs and the inability to maintain key pre-acquisition relationships with customers, suppliers and employees. In addition, any acquisition may result in the incurrence of additional amortization expense of related intangible assets, which could reduce our profitability.
In the future, we may consider acquisitions of other businesses that could complement our business, offer us greater access in our current markets or offer us greater access and expertise in other asset types and markets that are related to ours but we do not currently serve. Our ability to pursue additional acquisitions in the future is dependent on our access to sufficient capital (equity and/or debt) to fund the acquisition and subsequent integration. We may not be able to secure adequate capital as needed on terms that are acceptable to us, or at all, and our ability to secure such capital through debt financing is limited by our current debt agreements. Our failure to effectively pursue or integrate acquisitions, and such acquisitions themselves, may have an adverse effect on our financial condition or results of operations.
16
Risks Related to International Business
Our international operations subject us to additional risks which could have an adverse effect on our results of operations.
We have attempted to control our operating expenses by utilizing lower cost labor in foreign countries such as India, the Philippines and Uruguay. As of December 31, 2016, 6,629 of our employees were based in India, the Philippines and Uruguay. These countries are subject to relatively higher degrees of political and social instability and may lack the infrastructure to withstand political unrest or natural disasters. The occurrence of natural disasters or political or economic instability in these countries could interfere with work performed by these labor sources, or could result in our having to replace or reduce these labor sources. Such disruptions could decrease efficiency, increase our costs and have an adverse effect on our financial condition or results of operations.
Furthermore, the practice of utilizing labor based in foreign countries has come under increased scrutiny in the United States. Governmental authorities could seek to impose financial costs or restrictions on foreign companies providing services to customers in the United States. Governmental authorities may attempt to prohibit or otherwise discourage our United States-based customers from sourcing services from foreign companies and, as a result, some of our customers may require us to use labor based in the United States or cease doing business with Altisource. In addition, some of our customers may require us to use labor based in the United States for other reasons. To the extent that we are required to use labor based in the United States, we may not be able to pass on the increased costs of higher-priced United States-based labor to our customers, which ultimately could have an adverse effect on our results of operations.
The FCPA and other applicable anti-corruption laws and regulations prohibit certain types of payments by our employees, vendors and agents. Any violation of the applicable anti-corruption laws or regulations by us, our subsidiaries or our local agents, could expose us to significant penalties, fines, settlements, costs and consent orders that may curtail or restrict our business as it is currently conducted and could have an adverse effect on our financial condition or results of operations.
Weakness of the United States dollar in relation to the currencies used in these foreign countries may also reduce the savings achievable through this strategy and could have an adverse effect on our financial condition or our results of operations.
Altisource is a Luxembourg company and it may be difficult to obtain and enforce judgments against it or its directors and executive officers.
Altisource is a public limited liability company organized under the laws of, and headquartered in, Luxembourg. As a result, Luxembourg law and the articles of incorporation govern the rights of shareholders. The rights of shareholders under Luxembourg law may differ from the rights of shareholders of companies incorporated in other jurisdictions. A significant portion of the assets of Altisource are owned outside of the United States. It may be difficult for investors to obtain and enforce, in the United States, judgments obtained in United States courts against Altisource or its directors based on the civil liability provisions of the United States securities laws or to enforce, in Luxembourg, judgments obtained in other jurisdictions including the United States.
A significant change of the Luxembourg tax regime or of its interpretation by the Luxembourg tax authorities or others could adversely affect our results of operations.
Altisource generally has a lower effective tax rate than some of its competitors. The Company received a tax ruling from the Luxembourg tax authority, which expires in 2019 unless extended or renewed. It is possible that changes in Luxembourg’s administrative taxation practices or applicable regulations may cause an increase in our effective tax rate. In addition, the European Commission (“EC”) has initiated investigations into several EU member states, including Luxembourg, to determine whether these EU member states have provided tax advantages to companies on a basis not allowed by the EU. While the EC’s investigations continue, it has concluded that certain companies in certain EU member states, including Luxembourg, have been provided such tax advantages. The EC is requiring these EU member states to recover from certain companies the prior year tax benefits they received. These EU member states have the ability to appeal the decision. Changes in the manner in which we are taxed or a challenge in the manner in which we have been taxed could have an adverse effect on our financial condition and results of operations.
A significant change of the United States tax code that results in the reduction of the United States corporate tax rate or changes in our consolidated effective income tax rate could adversely affect our results of operations.
A significant change in the United States tax code that results in the reduction of the United States corporate tax rate could reduce the effective tax rate of some of our competitors. A reduction in the effective tax rate of some of our competitors may put us at a competitive disadvantage. Such disadvantage could have an adverse effect on our financial condition and results of operations.
17
Our consolidated effective income tax rate for financial reporting purposes may change periodically due to changes in enacted tax rates, fluctuations in the mix of income earned from our domestic and international operations and our ability to utilize net operating loss and tax credit carryforwards.
Risks Related to Our Employees
Our success depends on our directors, executive officers and key personnel.
Our success is dependent on the efforts and abilities of our directors, executive officers and other key employees, many of whom have significant experience in the real estate and mortgage, financial services and technology industries. In particular, we are dependent on the services of our Board of Directors and key executives at our corporate headquarters and personnel at each of our segments. The loss of the services of any of these directors, executives or key personnel, for any reason, could have an adverse effect upon our business, financial condition and results of operations.
Our inability to attract and retain skilled employees may adversely impact our business.
Our business is labor intensive and places significant importance on our ability to recruit, train and retain skilled employees. Additionally, demand for qualified technical and software professionals conversant in certain technologies may exceed supply as new and additional skills are required to keep pace with evolving computer technology. Our ability to locate and train employees is critical to achieving our growth objective. Our inability to attract and retain skilled employees or an increase in wages or other costs of attracting, training or retaining skilled employees could have an adverse effect on our business, financial condition and results of operations.
Risks Related to Our Relationships
We could have conflicts of interest with Ocwen, Residential, AAMC and certain members of our management, which may be resolved in a manner adverse to us.
We have significant business relationships with and provide services to Ocwen and Residential. We also provide certain services to AAMC. Our largest shareholder, William C. Erbey, owns or controls common stock in each of Altisource, Ocwen, Residential and AAMC, Residential’s external manager. As of December 31, 2016, Mr. Erbey owned or controlled approximately 32% of the common stock of Altisource, approximately 14% of the common stock of Ocwen, approximately 4% of the common stock of Residential and approximately 40% of the common stock of AAMC. Certain members of our management have equity interests in Ocwen, Residential and/or AAMC. Certain of the independent members of our Board of Directors also have equity interests in Residential and/or AAMC as a result of the distribution of shares of these companies to our shareholders at the time of their separation from Altisource or otherwise. Such ownership interests could create, or appear to create, potential conflicts of interest with respect to matters potentially or actually involving or affecting us and Ocwen, Residential and AAMC, as the case may be.
We believe we have practices designed to manage potential conflicts with respect to our dealings with Ocwen, Residential and AAMC, including a management review process of the terms of material transactions with these companies and review and approval of such transactions by our Audit Committee, which is comprised of independent directors. There can be no assurance that we will always be able to implement such measures or that such measures will be effective, that we will be able to manage or resolve all potential conflicts with these companies, and, even if we do, that the resolution will be no less favorable to us than if we were dealing with a third party that has none of the connections we have with these companies.
ITEM 1B. | UNRESOLVED STAFF COMMENTS |
Not applicable.
18
ITEM 2. | PROPERTIES |
Our principal executive offices are located in leased office space in Luxembourg, Grand Duchy of Luxembourg. A summary of our principal leased office space as of December 31, 2016 and the segments primarily occupying each location is as follows:
Mortgage Services | Financial Services | Technology Services | Corporate and Support Services | |||||
Luxembourg | X | X | X | X | ||||
United States | ||||||||
Atlanta, GA | X | X | X | X | ||||
Boston, MA | X | X | ||||||
Denver, CO | X | |||||||
Endicott, NY | X | |||||||
Fort Washington, PA | X | X | ||||||
Irvine, CA | X | |||||||
Los Angeles, CA | X | |||||||
Plano, TX | X | X | X | |||||
Sacramento, CA | X | |||||||
Southfield, MI | X | |||||||
St. Louis, MO | X | |||||||
Tempe, AZ | X | |||||||
Montevideo, Uruguay | X | X | ||||||
Pasay City, Philippines | X | X | X | X | ||||
India | ||||||||
Bangalore | X | X | X | X | ||||
Mumbai | X | X | X | X | ||||
We do not own any office facilities. We consider these facilities to be suitable and currently adequate for the management and operations of our businesses.
ITEM 3. | LEGAL PROCEEDINGS |
From time to time, we are involved in legal and administrative proceedings arising in the course of our business. We record a liability for these matters if an unfavorable outcome is probable and the amount of loss can be reasonably estimated, including expected insurance coverage. For proceedings where the reasonable estimate of loss is a range, we record a best estimate of loss within the range.
On September 8, 2014, the West Palm Beach Firefighters’ Pension Fund filed a putative securities class action suit against Altisource Portfolio Solutions S.A. and certain of its current or former officers and directors in the United States District Court for the Southern District of Florida alleging violations of the Securities Exchange Act of 1934 and Rule 10b-5 with regard to disclosures concerning pricing and transactions with related parties that allegedly inflated Altisource Portfolio Solutions S.A. share prices. The Court subsequently appointed the Pension Fund for the International Union of Painters and Allied Trades District Council 35 and the Annuity Fund for the International Union of Painters and Allied Trades District Council 35 as Lead Plaintiffs. On January 30, 2015, Lead Plaintiffs filed an amended class action complaint which added Ocwen Financial Corporation as a defendant, and seeks a determination that the action may be maintained as a class action on behalf of purchasers of Altisource Portfolio Solutions S.A. securities between April 25, 2013 and December 21, 2014 and an unspecified amount of damages. Altisource Portfolio Solutions S.A. moved to dismiss the suit on March 23, 2015. On September 4, 2015, the Court granted the defendants’ motion to dismiss, finding that the Lead Plaintiffs’ amended complaint failed to state a claim as to any of the defendants, but permitting the Lead Plaintiffs to file another amended complaint. Lead Plaintiffs subsequently filed second and third amended complaints with substantially similar claims and theories. Altisource Portfolio Solutions S.A. moved to dismiss the third amended complaint on October 22, 2015. On December 22, 2015, the Court issued an order dismissing with prejudice all claims against Ocwen Financial Corporation and certain claims against Altisource Portfolio Solutions S.A. and the officer and director defendants, but denying the motion to dismiss as to other claims. On December 19, 2016, the Court granted Lead Plaintiffs leave to file the fourth amended complaint, and Lead Plaintiffs filed the fourth amended complaint on December 28, 2016. On January 6, 2017, Defendants filed a motion to strike certain matters from the fourth amended complaint and a motion to dismiss certain claims pled in the fourth
19
amended complaint. Before the Court ruled on Defendants’ motions, the parties notified the Court on January 19, 2017 of their agreement to settle the action, which is subject to Court approval. On February 10, 2017, the Court entered an order preliminarily approving the settlement, certifying a settlement class, approving the form and content of notice of the settlement to class members, and setting a hearing for May 30, 2017 to determine whether the settlement should be approved and the case dismissed with prejudice. Under the proposed settlement, Altisource Portfolio Solutions S.A. will pay a total of $32 million in cash, a portion of which will be funded by insurance proceeds, to a settlement fund to resolve all claims asserted and which could have been asserted on behalf of investors who purchased or otherwise acquired Altisource Portfolio Solutions S.A. stock between April 25, 2013 and December 21, 2014. The proposed settlement provides that Altisource Portfolio Solutions S.A. and the officer and director defendants deny all claims of wrongdoing or liability.
On February 11, 2015, W.A. Sokolowski, an alleged shareholder of Ocwen Financial Corporation, filed an amended shareholder derivative complaint in the United States District Court for the Southern District of Florida against Ocwen Financial Corporation (as a nominal defendant), certain of its current or former officers and directors, Altisource Portfolio Solutions S.A. and other companies. The suit seeks recovery of an unspecified amount of damages for alleged breaches of fiduciary duty by Ocwen Financial Corporation’s officers and directors, which were allegedly aided and abetted by Altisource Portfolio Solutions S.A. and other defendants. Altisource Portfolio Solutions S.A. filed a motion to dismiss the complaint on November 9, 2015. While that motion was pending, additional lawsuits alleging similar claims for alleged breaches of fiduciary duties by current or former Ocwen Financial Corporation officers and directors were filed in or transferred to the Court. The Court subsequently consolidated these actions and denied Altisource Portfolio Solutions S.A.’s motion to dismiss the Sokolowski complaint without prejudice to re-file following appointment of lead counsel for the consolidated action and the filing or designation of an operative complaint. Lead counsel for plaintiffs filed their Consolidated Verified Shareholder Derivative Complaint (the “Consolidated Complaint”) on March 8, 2016. The Consolidated Complaint alleges claims that Altisource Portfolio Solutions S.A., its subsidiary Beltline Road Insurance Agency, Inc. and other defendants aided and abetted alleged breaches of fiduciary duties by Ocwen Financial Corporation officers and directors and/or were unjustly enriched in connection with business dealings with Ocwen Financial Corporation. The Consolidated Complaint also seeks contribution from Altisource Portfolio Solutions S.A., its subsidiary Beltline Road Insurance Agency, Inc. and other defendants for amounts Ocwen Financial Corporation paid in connection with a settlement with the New York State Department of Financial Services. Altisource Portfolio Solutions S.A. and Beltline Road Insurance Agency, Inc. filed motions to dismiss the Consolidated Complaint on May 13, 2016. On October 13, 2016, the Court disclosed that the parties reached a settlement at a settlement conference held that same day. Following a Final Approval Hearing on January 18, 2017, the Court granted final approval of the settlement and entered a judgment dismissing the action with prejudice. Neither Altisource Portfolio Solutions S.A. nor Beltline Road Insurance Agency, Inc. made any monetary contribution to the settlement, and both Altisource Portfolio Solutions S.A. and Beltline Road Insurance Agency, Inc. deny all claims of wrongdoing or liability in connection with the Sokolowski action.
On March 26, 2015, Robert Moncavage, an alleged shareholder of Ocwen Financial Corporation, filed an amended shareholder derivative complaint in the Circuit Court of the Fifteenth Judicial Circuit in and for Palm Beach County, Florida against Ocwen Financial Corporation (as a nominal defendant), certain of its current or former officers and directors, Altisource Portfolio Solutions S.A. and other companies. The suit seeks recovery of an unspecified amount of damages for alleged breaches of fiduciary duties by the current or former Ocwen Financial Corporation officers and directors, which were allegedly aided and abetted by Altisource Portfolio Solutions S.A. and other defendants. On November 9, 2015, the Court entered an order staying all proceedings in the case pending further order of the Court. The judgment entered in connection with the Sokolowski action discussed above bars further prosecution of all claims asserted, or that could have been asserted, in this action based on the facts, events, conduct, and transactions alleged, all of which were released as part of the Sokolowski settlement. On February 9, 2017, the plaintiff filed a notice of voluntary dismissal without prejudice and submitted a proposed order to the Court asking it to approve the dismissal of plaintiff’s claims against all defendants. The proposed order dismissing the action without prejudice is currently pending with the Court. Altisource Portfolio Solutions S.A. denies all claims of wrongdoing or liability in connection with the Moncavage action.
In addition to the matters referenced above, we are involved in legal actions in the course of our business, some of which seek monetary damages. We do not believe that the outcome of these proceedings, both individually and in the aggregate, will have a material impact on our financial condition, results of operations or cash flows.
Our businesses are also subject to extensive regulation which may result in regulatory proceedings or actions against us. For further information, see Item 1A of Part I, “Risk Factors” above and Note 23 to the consolidated financial statements.
ITEM 4. | MINE SAFETY DISCLOSURES |
Not applicable.
20
PART II
ITEM 5. | MARKET FOR REGISTRANT’S COMMON EQUITY, RELATED STOCKHOLDER MATTERS AND ISSUER PURCHASES OF EQUITY SECURITIES |
Market Information
Our common stock is listed on the NASDAQ Global Select Market under the symbol “ASPS.” The following table sets forth the high and low close of day sales prices for our common stock, for the periods indicated, as reported by the NASDAQ Global Select Market:
2016 | ||||||||
Quarter ended | Low | High | ||||||
March 31 | $ | 19.16 | $ | 35.69 | ||||
June 30 | 24.21 | 31.29 | ||||||
September 30 | 23.20 | 33.90 | ||||||
December 31 | 24.09 | 32.91 | ||||||
2015 | ||||||||
Quarter ended | Low | High | ||||||
March 31 | $ | 12.48 | $ | 34.17 | ||||
June 30 | 13.26 | 32.15 | ||||||
September 30 | 23.33 | 39.54 | ||||||
December 31 | 22.93 | 33.08 | ||||||
The number of holders of record of our common stock as of February 10, 2017 was 67. The number of beneficial shareholders is substantially greater than the number of holders as a large portion of our common stock is held through brokerage firms.
Dividends
We have not historically declared or paid cash dividends on our common stock. Under Luxembourg law, shareholders need to approve or ratify dividends. Such approval typically occurs during a company’s annual meeting of shareholders, immediately after the approval of the accounts. Luxembourg law also limits our ability to pay dividends, including statutory reporting requirements and dividend amount limitations based on annual net income and net income carried forward, less any amounts placed in reserve. The provisions of our senior secured term loan agreement, as amended, limit, among other things, our ability to pay dividends.
21
Stock Performance Graph
The graph below compares the cumulative total stockholder return on our common stock with the cumulative total return on the S&P 500 Index and the NASDAQ Composite Index for the five year period ending on December 31, 2016. The graph assumes an investment of $100 at the beginning of this period and does not include the effects of the post-distribution values of Residential and AAMC, which were distributed to Altisource shareholders in December 2012. The comparisons in the graph below are based upon historical data and are not indicative of, nor intended to forecast, future performance of our common stock.
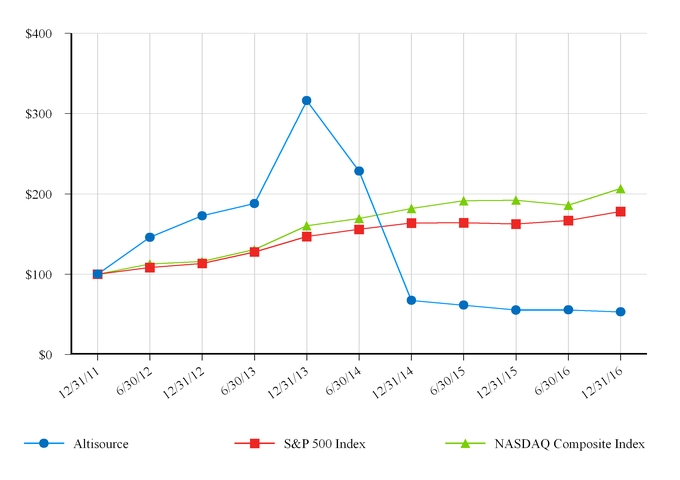
12/31/11 | 6/30/12 | 12/31/12 | 6/30/13 | 12/31/13 | 6/30/14 | 12/31/14 | 6/30/15 | 12/31/15 | 6/30/16 | 12/31/16 | ||||||||||||||||||||||||||||||||||
Altisource | $ | 100.00 | $ | 145.93 | $ | 172.68 | $ | 187.92 | $ | 316.12 | $ | 228.34 | $ | 67.34 | $ | 61.36 | $ | 55.42 | $ | 55.48 | $ | 52.99 | ||||||||||||||||||||||
S&P 500 Index | 100.00 | 108.31 | 113.41 | 127.73 | 146.98 | 155.87 | 163.72 | 164.05 | 162.53 | 166.89 | 178.02 | |||||||||||||||||||||||||||||||||
NASDAQ Composite Index | 100.00 | 112.66 | 115.91 | 130.64 | 160.32 | 169.21 | 181.80 | 191.42 | 192.21 | 185.89 | 206.63 | |||||||||||||||||||||||||||||||||
Securities Authorized for Issuance under Equity Compensation Plans
The information required by this item is incorporated herein by reference to our definitive proxy statement in connection with our 2017 annual meeting of shareholders to be filed pursuant to Regulation 14A under the Securities Exchange Act of 1934.
Issuer Purchases of Equity Securities
On May 18, 2016, our shareholders approved a new share repurchase program which replaced the previous share repurchase program. Under the new program, we are authorized to purchase up to 4.6 million shares of our common stock, based on a limit of 25% of the outstanding shares of common stock on the date of approval at a minimum price of $1.00 per share and a maximum price of $500.00 per share. This is in addition to amounts previously purchased under prior programs. Under the existing and prior programs, we purchased 1.4 million shares of common stock at an average price of $26.81 per share during the year ended December 31, 2016, 2.1 million shares at an average price of $27.60 per share during the year ended December 31, 2015 and 2.5
22
million shares at an average price of $103.67 per share during the year ended December 31, 2014. As of December 31, 2016, approximately 3.9 million shares of common stock remain available for repurchase under the new program. Our senior secured term loan limits the amount we can spend on share repurchases and may prevent repurchases in certain circumstances. As of December 31, 2016, approximately $395 million was available to repurchase shares of our common stock under our senior secured term loan.
The following table presents information related to the repurchases of our equity securities during the three months ended December 31, 2016:
Period | Total number of shares purchased(1) | Weighted average price paid per share | Total number of shares purchased as part of publicly announced plans or programs(2) | Maximum number of shares that may yet be purchased under the plans or programs(2) | |||||||||
Common stock: | |||||||||||||
October 1 — 31, 2016 | 9,180 | $ | 27.19 | 9,180 | 4,003,287 | ||||||||
November 1 — 30, 2016 | 121,300 | 25.45 | 121,300 | 3,881,987 | |||||||||
December 1 — 31, 2016 | — | — | — | 3,881,987 | |||||||||
130,480 | $ | 25.57 | 130,480 | 3,881,987 | |||||||||
______________________________________
(1) | May include shares withheld from employees to satisfy tax withholding obligations that arose from the exercise of stock options. |
(2) | On May 18, 2016, our shareholders authorized a new share repurchase program that replaced the prior program and authorizes us to purchase up to 4.6 million shares of our common stock in the open market. |
23
ITEM 6. | SELECTED FINANCIAL DATA |
The following selected financial data as of and for the years ended December 31, 2016, 2015, 2014, 2013 and 2012 has been derived from our audited consolidated financial statements. The historical results presented below may not be indicative of our future performance.
The selected consolidated financial data should be read in conjunction with the information contained in Item 7 of Part II, “Management’s Discussion and Analysis of Financial Condition and Results of Operations” and our consolidated financial statements and notes thereto in Item 8 of Part II, “Financial Statements and Supplementary Data.”
For the years ended December 31, | ||||||||||||||||||||
(in thousands, except per share data) | 2016 | 2015 | 2014 | 2013 | 2012 | |||||||||||||||
Revenue | $ | 997,303 | $ | 1,051,466 | $ | 1,078,916 | $ | 768,357 | $ | 568,360 | ||||||||||
Cost of revenue | 690,045 | 687,327 | 707,180 | 492,480 | 366,201 | |||||||||||||||
Gross profit | 307,258 | 364,139 | 371,736 | 275,877 | 202,159 | |||||||||||||||
Selling, general and administrative expenses | 214,155 | 220,868 | 201,733 | 113,810 | 74,712 | |||||||||||||||
Litigation settlement loss, net of $4,000 insurance recovery | 28,000 | — | — | — | — | |||||||||||||||
Impairment losses | — | 71,785 | 37,473 | — | — | |||||||||||||||
Change in the fair value of Equator® Earn Out | — | (7,591 | ) | (37,924 | ) | — | — | |||||||||||||
Income from operations | 65,103 | 79,077 | 170,454 | 162,067 | 127,447 | |||||||||||||||
Other income (expense), net: | ||||||||||||||||||||
Interest expense | (24,412 | ) | (28,208 | ) | (23,363 | ) | (20,291 | ) | (1,210 | ) | ||||||||||
Other income (expense), net | 3,630 | 2,191 | 174 | 557 | (1,588 | ) | ||||||||||||||
Total other income (expense), net | (20,782 | ) | (26,017 | ) | (23,189 | ) | (19,734 | ) | (2,798 | ) | ||||||||||
Income before income taxes and non-controlling interests | 44,321 | 53,060 | 147,265 | 142,333 | 124,649 | |||||||||||||||
Income tax provision | (12,935 | ) | (8,260 | ) | (10,178 | ) | (8,540 | ) | (8,738 | ) | ||||||||||
Net income | 31,386 | 44,800 | 137,087 | 133,793 | 115,911 | |||||||||||||||
Net income attributable to non-controlling interests | (2,693 | ) | (3,202 | ) | (2,603 | ) | (3,820 | ) | (5,284 | ) | ||||||||||
Net income attributable to Altisource | $ | 28,693 | $ | 41,598 | $ | 134,484 | $ | 129,973 | $ | 110,627 | ||||||||||
Earnings per share: | ||||||||||||||||||||
Basic | $ | 1.53 | $ | 2.13 | $ | 6.22 | $ | 5.63 | $ | 4.74 | ||||||||||
Diluted | $ | 1.46 | $ | 2.02 | $ | 5.69 | $ | 5.19 | $ | 4.43 | ||||||||||
Transactions with related parties included above: | ||||||||||||||||||||
Revenue | $ | — | N/A(1) | $ | 666,800 | $ | 502,087 | $ | 338,227 | |||||||||||
Cost of revenue | — | N/A(1) | 38,610 | 19,983 | 13,469 | |||||||||||||||
Selling, general and administrative expenses | — | N/A(1) | (268 | ) | 569 | (542 | ) | |||||||||||||
Other income | — | N/A(1) | — | 773 | 86 | |||||||||||||||
Non-GAAP Financial Measures(2) | ||||||||||||||||||||
Adjusted net income attributable to Altisource | $ | 90,095 | $ | 143,475 | $ | 169,141 | $ | 156,458 | $ | 115,304 | ||||||||||
Adjusted diluted earnings per share | $ | 4.59 | $ | 6.96 | $ | 7.16 | $ | 6.25 | $ | 4.62 | ||||||||||
______________________________________
(1) | Through January 16, 2015, William C. Erbey served as our Chairman as well as the Executive Chairman of Ocwen and Chairman of each of HLSS, Residential and AAMC. Effective January 16, 2015, Mr. Erbey stepped down as the Executive Chairman of Ocwen and Chairman of each of Altisource, HLSS, Residential and AAMC and is no longer a member of the Board of Directors of any of these companies. Consequently, as of January 16, 2015, these companies are no longer related parties of Altisource, as defined by Financial Accounting Standards Board’s Accounting Standards Codification (“ASC”) Topic 850, Related Party Disclosures. The disclosures in the table above are limited to the periods that each of Ocwen, HLSS, Residential and AAMC were related parties of Altisource and are not reflective of current activities with these former related parties. See Note 4 to the consolidated financial statements for more details and financial information for the period from January 1, 2015 to January 16, 2015. |
(2) | Theses are non-GAAP measures that are defined and reconciled to the corresponding GAAP measures on pages 25 and 26. |
24
December 31, | ||||||||||||||||||||
(in thousands) | 2016 | 2015 | 2014 | 2013 | 2012 | |||||||||||||||
Cash and cash equivalents | $ | 149,294 | $ | 179,327 | $ | 161,361 | $ | 130,324 | $ | 105,502 | ||||||||||
Available for sale securities | 45,754 | — | — | — | — | |||||||||||||||
Accounts receivable, net | 87,821 | 105,023 | 112,183 | 104,787 | 88,955 | |||||||||||||||
Premises and equipment, net | 103,473 | 119,121 | 127,759 | 87,252 | 50,399 | |||||||||||||||
Goodwill | 86,283 | 82,801 | 90,851 | 99,414 | 14,915 | |||||||||||||||
Intangible assets, net | 155,432 | 197,003 | 245,246 | 276,162 | 56,586 | |||||||||||||||
Loan to Ocwen | — | — | — | — | 75,000 | |||||||||||||||
Total assets | 689,212 | 721,798 | 780,122 | 723,365 | 424,966 | |||||||||||||||
Long-term debt, net (including current portion) | 473,545 | 528,178 | 580,515 | 388,569 | 193,767 | |||||||||||||||
Capital lease obligations | — | — | — | — | 233 | |||||||||||||||
Total liabilities | 627,018 | 669,528 | 738,679 | 565,624 | 265,137 | |||||||||||||||
Significant events affecting our historical earnings trends from 2014 through 2016, including acquisitions, are described in Item 7 of Part II, “Management’s Discussion and Analysis of Financial Condition and Results of Operations.”
NON-GAAP MEASURES
Adjusted net income attributable to Altisource and adjusted diluted earnings per share, which are presented in the following tables and elsewhere in this Annual Report on Form 10-K, are non-GAAP measures used by management, existing shareholders, potential shareholders and other users of our financial information to measure Altisource’s performance and do not purport to be alternatives to net income or diluted earnings per share as measures of Altisource’s performance. We believe these measures are useful to management, existing shareholders, potential shareholders and other users of our financial information in evaluating operating profitability more on a continuing cost basis as they exclude amortization expense related to acquisitions that occurred in prior periods as well as the effect of more significant non-recurring items from earnings. We believe these measures are also useful in evaluating the effectiveness of our operations and underlying business trends in a manner that is consistent with management’s evaluation of business performance. Furthermore, we believe the exclusion of more significant non-recurring items enables comparability to prior period performance and trend analysis.
It is management’s intent to provide non-GAAP financial information to enhance the understanding of Altisource’s GAAP financial information, and it should be considered by the reader in addition to, but not instead of, the financial statements prepared in accordance with GAAP. Each non-GAAP financial measure is presented along with the corresponding GAAP measure so as not to imply that more emphasis should be placed on the non-GAAP measure. The non-GAAP financial information presented may be determined or calculated differently by other companies.
Adjusted net income attributable to Altisource is calculated by adding intangible asset amortization expense (net of tax) plus litigation settlement loss, net of insurance recovery (net of tax), plus impairment losses (net of tax) and deducting gains associated with reductions of the Equator, LLC (“Equator”) related contingent consideration (“Equator Earn Out”) (net of tax) from GAAP net income attributable to Altisource. Adjusted diluted earnings per share is calculated by dividing net income attributable to Altisource plus intangible asset amortization expense (net of tax), plus litigation settlement loss, net of insurance recovery (net of tax), plus impairment losses (net of tax) less gains associated with reductions of the Equator Earn Out (net of tax) by the weighted average number of diluted shares.
25
Reconciliations of the non-GAAP measures to the corresponding GAAP measures are set forth in the following table:
For the years ended December 31, | ||||||||||||||||||||
(in thousands, except per share data) | 2016 | 2015 | 2014 | 2013 | 2012 | |||||||||||||||
Net income attributable to Altisource | $ | 28,693 | $ | 41,598 | $ | 134,484 | $ | 129,973 | $ | 110,627 | ||||||||||
Intangible asset amortization expense, net of tax | 36,819 | 38,187 | 35,076 | 26,485 | 4,677 | |||||||||||||||
Net litigation settlement loss, net of tax | 24,583 | — | — | — | — | |||||||||||||||
Impairment loss, net of tax | — | 70,630 | 34,884 | — | — | |||||||||||||||
Gain on Equator Earn Out, net of tax | — | (6,940 | ) | (35,303 | ) | — | — | |||||||||||||
Adjusted net income attributable to Altisource | $ | 90,095 | $ | 143,475 | $ | 169,141 | $ | 156,458 | $ | 115,304 | ||||||||||
Diluted earnings per share | $ | 1.46 | $ | 2.02 | $ | 5.69 | $ | 5.19 | $ | 4.43 | ||||||||||
Intangible asset amortization expense, net of tax, per diluted share | 1.88 | 1.85 | 1.48 | 1.06 | 0.19 | |||||||||||||||
Net litigation settlement loss, net of tax, per diluted share | 1.25 | — | — | — | — | |||||||||||||||
Impairment loss, net of tax, per diluted share | — | 3.43 | 1.48 | — | — | |||||||||||||||
Gain on Equator Earn Out, net of tax, per diluted share | — | (0.34 | ) | (1.49 | ) | — | — | |||||||||||||
Adjusted diluted earnings per share | $ | 4.59 | $ | 6.96 | $ | 7.16 | $ | 6.25 | $ | 4.62 | ||||||||||
Calculation of the impact of intangible asset amortization expense, net of tax | ||||||||||||||||||||
Intangible asset amortization expense | $ | 47,576 | $ | 41,135 | $ | 37,680 | $ | 28,176 | $ | 5,030 | ||||||||||
Tax benefit from intangible asset amortization | (10,757 | ) | (2,948 | ) | (2,604 | ) | (1,691 | ) | (353 | ) | ||||||||||
Intangible asset amortization expense, net of tax | 36,819 | 38,187 | 35,076 | 26,485 | 4,677 | |||||||||||||||
Diluted share count | 19,612 | 20,619 | 23,634 | 25,053 | 24,962 | |||||||||||||||
Intangible asset amortization expense, net of tax, per diluted share | $ | 1.88 | $ | 1.85 | $ | 1.48 | $ | 1.06 | $ | 0.19 | ||||||||||
Calculation of the impact of net litigation settlement loss, net of tax | ||||||||||||||||||||
Net litigation settlement loss | $ | 28,000 | $ | — | $ | — | $ | — | $ | — | ||||||||||
Tax benefit from net litigation settlement loss | (3,417 | ) | — | — | — | — | ||||||||||||||
Net litigation settlement loss, net of tax | 24,583 | — | — | — | — | |||||||||||||||
Diluted share count | 19,612 | 20,619 | 23,634 | 25,053 | 24,962 | |||||||||||||||
Net litigation settlement loss, net of tax, per diluted share | $ | 1.25 | $ | — | $ | — | $ | — | $ | — | ||||||||||
Calculation of the impact of impairment loss, net of tax | ||||||||||||||||||||
Impairment loss | $ | — | $ | 71,785 | $ | 37,473 | $ | — | $ | — | ||||||||||
Tax benefit from impairment loss | — | (1,155 | ) | (2,589 | ) | — | — | |||||||||||||
Impairment loss, net of tax | — | 70,630 | 34,884 | — | — | |||||||||||||||
Diluted share count | 19,612 | 20,619 | 23,634 | 25,053 | 24,962 | |||||||||||||||
Impairment loss, net of tax, per diluted share | $ | — | $ | 3.43 | $ | 1.48 | $ | — | $ | — | ||||||||||
Calculation of gain on Equator Earn Out, net of tax | ||||||||||||||||||||
Gain on Equator Earn Out | $ | — | $ | (7,591 | ) | $ | (37,924 | ) | $ | — | $ | — | ||||||||
Tax provision from the gain on Equator Earn Out | — | 651 | 2,621 | — | — | |||||||||||||||
Gain on Equator Earn Out, net of tax | — | (6,940 | ) | (35,303 | ) | — | — | |||||||||||||
Diluted share count | 19,612 | 20,619 | 23,634 | 25,053 | 24,962 | |||||||||||||||
Gain on Equator Earn Out, net of tax, per diluted share | $ | — | $ | (0.34 | ) | $ | (1.49 | ) | $ | — | $ | — | ||||||||
26
ITEM 7. | MANAGEMENT’S DISCUSSION AND ANALYSIS OF FINANCIAL CONDITION AND RESULTS OF OPERATIONS |
Management’s discussion and analysis of financial condition and results of operations (“MD&A”) is a supplement to the accompanying consolidated financial statements and is intended to provide a reader of our financial statements with a narrative from the perspective of management on our businesses, current developments, financial condition, results of operations and liquidity. Significant sections of the MD&A are as follows:
Overview. This section, beginning below, provides a description of recent developments we believe are important in understanding our results of operations and financial condition as well as understanding anticipated future trends. It also provides a brief description of significant transactions and events that affect the comparability of financial results and a discussion of the progress being made on our strategic initiatives.
Consolidated Results of Operations. This section, beginning on page 31, provides an analysis of our consolidated results of operations for the three years ended December 31, 2016.
Segment Results of Operations. This section, beginning on page 36, provides an analysis of each business segment for the three years ended December 31, 2016 as well as Corporate Items and Eliminations. In addition, we discuss significant transactions, events and trends that may affect the comparability of the results being analyzed.
Liquidity and Capital Resources. This section, beginning on page 46, provides an analysis of our cash flows for the three years ended December 31, 2016. We also discuss restrictions on cash movements, future commitments and capital resources.
Critical Accounting Policies, Estimates and Recent Accounting Pronouncements. This section, beginning on page 49, identifies those accounting principles we believe are most important to our financial results and that require significant judgment and estimates on the part of management in application. We provide all of our significant accounting policies in Note 2 to the accompanying consolidated financial statements.
Other Matters. This section, beginning on page 51, provides a discussion of off-balance sheet arrangements to the extent they exist. In addition, we provide a tabular discussion of contractual obligations, discuss any significant commitments or contingencies and customer concentration.
OVERVIEW
Our Business
We are a premier marketplace and transaction solutions provider for the real estate, mortgage and consumer debt industries. Altisource’s proprietary business processes, vendor and electronic payment management software and behavioral science-based analytics improve outcomes for marketplace participants.
Our business segments are based upon our organizational structure, which focuses primarily on the services offered, and are consistent with the internal reporting used by our Chief Executive Officer to evaluate operating performance and to assess the allocation of our resources.
We classify our businesses into three reportable segments. The Mortgage Services segment provides loan servicers, originators, rental property investors and real estate consumers with products, services and technologies that span the mortgage and real estate lifecycle. The Financial Services segment provides collection services primarily to debt originators and servicers (e.g., credit card, auto lending, retail credit and mortgage) and customer relationship management services primarily to the utility, insurance and hotel industries. The Technology Services segment provides software and data analytics solutions that support the management of mortgage and real estate activities and marketplace transactions across the mortgage and real estate lifecycles and IT infrastructure management services. In addition, Corporate Items and Eliminations include eliminations of transactions between reportable segments, interest expense and costs related to corporate support functions including executive, finance, law, compliance, human resources, vendor management, risk management and sales and marketing costs not allocated to the business units. Corporate items and Eliminations also include the cost of certain facilities.
We classify revenue in three categories: service revenue, revenue from reimbursable expenses and non-controlling interests. In evaluating our performance, we focus on service revenue. Service revenue consists of amounts attributable to our fee-based services. Reimbursable expenses and non-controlling interests are pass-through items for which we earn no margin. Reimbursable expenses consist of amounts we incur on behalf of our customers in performing our fee-based services that we pass directly on to our customers without a markup. Non-controlling interests represent the earnings of Lenders One and Wholesale One, consolidated entities not owned by Altisource, and are included in revenue and reduced from net income to arrive at net income attributable to Altisource.
27
We have prepared our consolidated financial statements in accordance with accounting principles generally accepted in the United States of America (“GAAP”).
Strategy and Growth Initiatives
Altisource provides a suite of mortgage, real estate and consumer debt services, leveraging our technology platform and global operations. Altisource is focused on becoming one of the premier providers of mortgage and real estate marketplaces and related services to a broad and diversified customer base. Within the mortgage and real estate markets, we facilitate transactions and provide products, solutions and services related to home sales, home purchases, home rentals, home maintenance, mortgage origination and mortgage servicing.
Strategically, we are focused on (1) our four key business initiatives discussed below, (2) continuing to strengthen our compliance management system and (3) maintaining strong performance and relationships with our strategic customers.
Each of our four key business initiatives positions Altisource to grow and diversify our customer and revenue base. We believe these initiatives address very large markets and directly leverage our core competencies and distinct competitive advantages. Our four strategic initiatives and a brief description of each follow:
Mortgage market:
Grow our Servicer Solutions business (the products, services and technologies typically used or licensed by loan servicers): We are focused on growing referrals from our existing customer base, expanding the service and proprietary technology offerings to our customer base, and attracting new customers to our offerings. We have a strong and growing customer base that includes Ocwen, a GSE and several top ten bank servicers. Even as loan delinquencies return to historical norms, we believe there is a very large addressable market for our offerings. We believe we are one of only a few providers with a broad suite of servicer solutions, nationwide coverage and demonstrated scalability. We believe we are well positioned to gain market share as customers consolidate to larger, full-service providers and outsource services that have historically been performed in-house.
Grow our Origination Solutions business (the products, services, solutions and technologies typically used or licensed by loan originators or other similar mortgage market participants): We are focused on continuing to build an industry leading, fully-integrated origination solutions platform leveraging our industry expertise and proprietary technologies. We have a strong customer base that includes Lenders One members and Mortgage Builder®, Trelix™ and CastleLine® customers. Our platform allows us to enhance our relationships with our existing customer base by providing additional products, services and solutions to these customers as well as attract new customers. We believe we are well positioned to grow and gain market share as customers continue to utilize larger, full-service providers to outsource services and solutions and to outsource solutions that had historically been performed in-house.
Real estate market:
Grow our Consumer Real Estate Solutions business (a marketplace that connects home buyers and home sellers and offers the related services) primarily through Owners.com: Capitalizing on our core competencies in realty services and online real estate marketing, we have entered the consumer market by targeting the growing segment of consumers utilizing technology enabled real estate brokerages. This customer segment wants to self-manage part of the realty process, but often wants support and still needs brokerage services to complete the transaction. Through our Owners.com brand, we are empowering consumers to perform certain tasks on their own such as searching for properties and listing and showing their own homes for sale, while offering support and the necessary realty services to complete the transaction with the potential for significant savings. We believe our offering and compelling savings value proposition is being well received by our target market and we are well positioned to become a market leader of technology enabled consumer real estate brokerages.
Grow our Real Estate Investor Solutions business (a marketplace that connects home buyers and home sellers of single-family-rental homes and offers the related services to buy, renovate, manage and sell homes): We are focused on supporting the growth of our existing customers, expanding the offerings to our customer base and attracting new customers to our offerings. The single-family-rental market is large, geographically distributed with fragmented ownership. We believe our nationwide acquisition, renovation, property management, leasing and dispositions platform provides a strong value proposition for institutional and retail investors and positions us well for long term growth.
There can be no assurance that growth from our strategic initiatives will be successful or our operations will be profitable.
Share Repurchase Program
On May 18, 2016, our shareholders approved a new share repurchase program which replaced the previous share repurchase program. Under the new program, we are authorized to purchase up to 4.6 million shares of our common stock, based on a limit
28
of 25% of the outstanding shares of common stock on the date of approval at a minimum price of $1.00 per share and a maximum price of $500.00 per share. This is in addition to amounts previously purchased under prior programs. Under the existing and prior programs, we purchased 1.4 million shares of common stock at an average price of $26.81 per share during the year ended December 31, 2016, 2.1 million shares at an average price of $27.60 per share during the year ended December 31, 2015 and 2.5 million shares at an average price of $103.67 per share during the year ended December 31, 2014. As of December 31, 2016, approximately 3.9 million shares of common stock remain available for repurchase under the new program. Our senior secured term loan limits the amount we can spend on share repurchases and may prevent repurchases in certain circumstances. As of December 31, 2016, approximately $395 million was available to repurchase shares of our common stock under our senior secured term loan.
Factors Affecting Comparability
The following items may impact the comparability of our results:
• | The average number of loans serviced by Ocwen on REALServicing® was 1.5 million for the year ended December 31, 2016 compared to 2.0 million and 2.2 million for the years ended December 31, 2015 and 2014, respectively. The average number of delinquent non-GSE loans serviced by Ocwen on REALServicing was 219 thousand for the year ended December 31, 2016 compared to 279 thousand and 352 thousand for the years ended December 31, 2015 and 2014, respectively; |
• | In the fourth quarter of 2016, we recorded a litigation settlement loss of $28.0 million, net of a $4.0 million insurance recovery, related to an agreed settlement of a class action lawsuit, subject to final court approval; |
• | During the years ended December 31, 2016 and 2015, we repurchased portions of our senior secured term loan with aggregate par values of $51.0 million (at a weighted average discount of 13.2%) and $49.0 million (at a weighted average discount of 10.3%), respectively, recognizing net gains on the early extinguishment of debt of $5.5 million and $3.8 million, respectively (no comparative amounts in 2014); |
• | During the year ended December 31, 2016, we purchased 4.1 million shares of Residential common stock for $48.2 million, incurred expenses of $3.4 million and earned dividends of $2.3 million related to this investment (no comparative amounts in 2015); |
• | In the fourth quarter of 2015, we recorded non-cash impairment losses of $71.8 million in our Technology Services segment primarily driven by the Company’s projected Technology Services revenue from Ocwen and investment in technologies provided to Ocwen; |
• | On July 29, 2016, we acquired certain assets and assumed certain liabilities of Granite for $9.5 million; |
• | On October 9, 2015, we acquired RentRange and Investability for $24.8 million composed of $17.5 million in cash at closing and 247 thousand shares of restricted common stock of the Company with a value of $7.3 million as of the closing date; |
• | On July 17, 2015, we acquired CastleLine for $33.4 million. The purchase consideration was composed of $12.3 million of cash at closing, $10.5 million of cash payable over four years from the acquisition date and 495 thousand shares of restricted common stock of the Company with a value of $14.4 million as of the closing date. Of the cash payable following acquisition, $3.8 million is contingent on certain future employment conditions of certain of the sellers, and therefore excluded from the purchase price; |
• | In 2015, we paid the former owners of Equator $0.5 million to extinguish any liability for the Equator Earn Out. In connection with this settlement, we reduced the liability for the Equator Earn Out to $0 and recognized a $7.6 million increase in earnings; |
• | During 2015, we recognized a loss on the sale of equity securities of HLSS, net of dividends received, of $1.9 million; |
• | Effective March 31, 2015, we terminated the Data Access and Services Agreement with Ocwen (“Data Access Agreement”); |
• | On November 21, 2014, we acquired Owners for a purchase price of $19.8 million; |
• | In the fourth quarter of 2014, we discontinued our lender placed insurance brokerage line of business; |
• | On September 12, 2014, we acquired Mortgage Builder for an initial purchase price of $15.7 million; |
• | On August 1, 2014, we amended our senior secured term loan agreement and increased our borrowings by $200.0 million to $594.5 million; |
• | Bad debt expense was higher in 2014, driven primarily from the default management services business. A change in many of our default management services customers’ business models and fourth quarter 2014 discussions with these customers led us to believe that a portion of the accounts receivable balance was no longer collectible; and |
29
• | The effective income tax rates for the years ended December 31, 2016, 2015 and 2014 were 29.2%, 15.6% and 6.9%, respectively. The variability in the effective income tax rate is primarily from changes in the mix of taxable income across the jurisdictions in which we operate. |
30
CONSOLIDATED RESULTS OF OPERATIONS
Summary Consolidated Results
Following is a discussion of our consolidated results of operations for the years ended December 31, 2016, 2015 and 2014. For a more detailed discussion of the factors that affected the results of our business segments in these periods, see “Segment Results of Operations” below.
The following table sets forth information on our results of operations for the years ended December 31:
(in thousands, except per share data) | 2016 | % Increase (decrease) | 2015 | % Increase (decrease) | 2014 | ||||||||||||
Service revenue | |||||||||||||||||
Mortgage Services | $ | 749,944 | 11 | $ | 676,222 | 4 | $ | 653,093 | |||||||||
Financial Services | 74,243 | (16 | ) | 88,328 | (10 | ) | 98,312 | ||||||||||
Technology Services | 160,101 | (26 | ) | 215,482 | (5 | ) | 227,300 | ||||||||||
Eliminations | (41,689 | ) | 7 | (39,112 | ) | (2 | ) | (40,026 | ) | ||||||||
Total service revenue | 942,599 | — | 940,920 | — | 938,679 | ||||||||||||
Reimbursable expenses | 52,011 | (52 | ) | 107,344 | (22 | ) | 137,634 | ||||||||||
Non-controlling interests | 2,693 | (16 | ) | 3,202 | 23 | 2,603 | |||||||||||
Total revenue | 997,303 | (5 | ) | 1,051,466 | (3 | ) | 1,078,916 | ||||||||||
Cost of revenue | 690,045 | — | 687,327 | (3 | ) | 707,180 | |||||||||||
Gross profit | 307,258 | (16 | ) | 364,139 | (2 | ) | 371,736 | ||||||||||
Selling, general and administrative expenses | 214,155 | (3 | ) | 220,868 | 9 | 201,733 | |||||||||||
Litigation settlement loss, net of $4,000 insurance recovery | 28,000 | N/M | — | N/M | — | ||||||||||||
Impairment losses | — | (100 | ) | 71,785 | 92 | 37,473 | |||||||||||
Change in the fair value of Equator Earn Out | — | (100 | ) | (7,591 | ) | (80 | ) | (37,924 | ) | ||||||||
Income from operations | 65,103 | (18 | ) | 79,077 | (54 | ) | 170,454 | ||||||||||
Other income (expense), net: | |||||||||||||||||
Interest expense | (24,412 | ) | (13 | ) | (28,208 | ) | 21 | (23,363 | ) | ||||||||
Other income (expense), net | 3,630 | 66 | 2,191 | N/M | 174 | ||||||||||||
Total other income (expense), net | (20,782 | ) | (20 | ) | (26,017 | ) | 12 | (23,189 | ) | ||||||||
Income before income taxes and non-controlling interests | 44,321 | (16 | ) | 53,060 | (64 | ) | 147,265 | ||||||||||
Income tax provision | (12,935 | ) | 57 | (8,260 | ) | (19 | ) | (10,178 | ) | ||||||||
Net income | 31,386 | (30 | ) | 44,800 | (67 | ) | 137,087 | ||||||||||
Net income attributable to non-controlling interests | (2,693 | ) | (16 | ) | (3,202 | ) | 23 | (2,603 | ) | ||||||||
Net income attributable to Altisource | $ | 28,693 | (31 | ) | $ | 41,598 | (69 | ) | $ | 134,484 | |||||||
Margins: | |||||||||||||||||
Gross profit/service revenue | 33 | % | 39 | % | 40 | % | |||||||||||
Income from operations/service revenue | 7 | % | 8 | % | 18 | % | |||||||||||
Earnings per share: | |||||||||||||||||
Basic | $ | 1.53 | (28 | ) | $ | 2.13 | (66 | ) | $ | 6.22 | |||||||
Diluted | $ | 1.46 | (28 | ) | $ | 2.02 | (64 | ) | $ | 5.69 | |||||||
Non-GAAP Financial Measures (1) | |||||||||||||||||
Adjusted net income attributable to Altisource | $ | 90,095 | (37 | ) | $ | 143,475 | (15 | ) | $ | 169,141 | |||||||
Adjusted diluted earnings per share | $ | 4.59 | (34 | ) | $ | 6.96 | (3 | ) | $ | 7.16 | |||||||
______________________________________
(1) | These are non-GAAP measures that are defined and reconciled to the corresponding GAAP measures on pages 25 and 26. |
N/M — not meaningful.
31
Revenue
We recognized service revenue of $942.6 million, $940.9 million and $938.7 million for the years ended December 31, 2016, 2015 and 2014, respectively. The increase in service revenue for the year ended December 31, 2016 was primarily driven by revenue growth in the Mortgage Services segment from an early 2015 change in the pricing and billing model for preservation services on new Ocwen REO referrals that resulted in certain services that were historically reimbursable expenses revenue becoming service revenue and increased volumes of higher value property preservation referrals. This increase was partially offset by lower service revenue in the Technology Services and Financial Services segments. Service revenue in the Technology Services segment declined from lower rates charged to Ocwen for certain software services, decreases in IT infrastructure services, which are typically billed on a cost plus basis, and a decline in the number of loans on REALServicing. During the fourth quarter of 2015, we began transitioning resources supporting Ocwen’s technology infrastructure to Ocwen as a part of the previously announced separation of technology infrastructure. These transitions continued throughout 2016. Service revenue in the Financial Services segment declined from lower customer relationship management business as we have severed relationships with and reduced the volume of services provided to certain clients that were not profitable to us, and we experienced a reduction in volume from the transition of services provided to one customer to another.
The increase in service revenue for 2015 compared to 2014 was primarily due to revenue expansion in the asset management services businesses primarily from growth in both the number of non-Ocwen and Ocwen REO properties sold on Hubzu®, increased volumes of property preservation services for Residential, higher revenue from software development and a full year of revenue from the September 2014 acquisition of Mortgage Builder. In addition, in early 2015, the pricing model to Ocwen for REO preservation services within asset management services changed, as described above. These increases were largely offset by the discontinuation of the lender placed insurance brokerage line of business in the fourth quarter of 2014, lower Equator revenue from the full amortization of acquisition related deferred revenue in 2014, fewer property valuation services referrals, decreased property inspection volumes, lower mortgage charge-off collections and a decrease in IT infrastructure services.
Certain of our revenues are impacted by seasonality. More specifically, revenues from property sales, originations and lawn maintenance in our Mortgage Services segment tend to be at their lowest level during the fall and winter months and at their highest level during the spring and summer months. Financial Services’ asset recovery management revenue tends to be higher in the first quarter, as borrowers may utilize tax refunds and bonuses to pay debts, and generally declines throughout the rest of the year.
Cost of Revenue and Gross Profit
Cost of revenue principally includes payroll and employee benefits associated with personnel employed in customer service and operations roles, fees paid to external providers related to the provision of services, reimbursable expenses, technology and telecommunications costs and depreciation and amortization of operating assets.
Cost of revenue consists of the following for the years ended December 31:
(in thousands) | 2016 | % Increase (decrease) | 2015 | % Increase (decrease) | 2014 | |||||||||||||
Compensation and benefits | $ | 264,796 | 1 | $ | 261,839 | 2 | $ | 255,889 | ||||||||||
Outside fees and services | 302,156 | 22 | 248,278 | 2 | 243,325 | |||||||||||||
Reimbursable expenses | 52,011 | (52 | ) | 107,344 | (22 | ) | 137,634 | |||||||||||
Technology and telecommunications | 44,295 | 3 | 43,177 | (12 | ) | 48,834 | ||||||||||||
Depreciation and amortization | 26,787 | — | 26,689 | 24 | 21,498 | |||||||||||||
Cost of revenue | $ | 690,045 | — | $ | 687,327 | (3 | ) | $ | 707,180 | |||||||||
We recognized cost of revenue of $690.0 million, $687.3 million and $707.2 million for the years ended December 31, 2016, 2015 and 2014, respectively. The increase in cost of revenue in 2016 compared to 2015 was primarily attributable to higher outside fees and services, largely offset by decreases in reimbursable expenses. Outside fees and services increased and reimbursable expenses declined due to higher volumes of property preservation referrals and the change in billing discussed in the revenue section above, partially offset by the March 31, 2015 termination of the Data Access Agreement in the Mortgage Services segment.
The decrease in cost of revenue for the year ended December 31, 2015 was primarily attributable to the March 31, 2015 termination of the Data Access Agreement in the Mortgage Services segment and lower technology and telecommunications costs, partially offset by an increase in compensation and benefits, outside fees and services and depreciation and amortization costs. Outside fees and services increased and reimbursable expenses declined as a result of the change in billing discussed in the revenue section above. Technology and telecommunications costs decreased due to cost savings initiatives implemented in 2015. Recognizing
32
that our service revenue from Ocwen was not expected to grow in the near term due to challenges faced by Ocwen in late 2014 and early 2015, we developed and executed on a plan that included eliminating certain non-revenue generating businesses, reducing vendor costs and eliminating staff. Compensation and benefits costs were higher in 2015 compared to 2014 primarily due to increased United States headcount to support growth in certain of our Mortgage Services businesses. Additionally, severance costs of $4.3 million for the year ended December 31, 2015 were incurred in connection with the elimination of staff as a result of the cost reduction initiatives implemented during the first half of 2015.
Gross profit decreased to $307.3 million, representing 33% of service revenue, for the year ended December 31, 2016 compared to $364.1 million, representing 39% of service revenue, for the year ended December 31, 2015 and $371.7 million, representing 40% of service revenue, for the year ended December 31, 2014.
Gross profit as a percentage of service revenue decreased in 2016 compared to 2015 primarily due to higher growth in the lower margin property preservation services, higher compensation and benefits costs in the Mortgage Services segment to support our growth initiatives and reductions in volumes and prices in the Technology Services segment that exceeded the decline in costs. These decreases were partially offset by the March 31, 2015 termination of the Data Access Agreement.
Gross profit as a percentage of service revenue declined slightly in 2015 compared to 2014 primarily due to service revenue growth in the higher margin Mortgage Services segment offset by a decline in gross profit as a percentage of service revenue in the Financial Services and Technology Services segments. Mortgage Services’ slight decline in gross profit margins was driven by service revenue growth of the lower margin property preservation and inspection business within asset management services and the November 2014 discontinuation of the higher margin lender placed insurance brokerage business within insurance services, partially offset by Hubzu revenue growth within asset management services and the March 31, 2015 termination of the Data Access Agreement. The decline in gross profit as a percentage of service revenue in the Financial Services and Technology Services segments was from revenue mix and the full amortization of the Equator acquisition related deferred revenue within software services in November 2014.
Selling, General and Administrative Expenses
Selling, general and administration expenses (“SG&A”) include payroll for personnel employed in executive, finance, law, compliance, human resources, vendor management, risk management, sales and marketing roles. This category also includes occupancy related costs, amortization of intangible assets, professional services, marketing costs, depreciation and amortization of non-operating assets and other expenses.
SG&A expenses consist of the following for the years ended December 31:
(in thousands) | 2016 | % Increase (decrease) | 2015 | % Increase (decrease) | 2014 | |||||||||||||
Compensation and benefits | $ | 55,577 | 1 | $ | 54,897 | 22 | $ | 45,098 | ||||||||||
Professional services | 23,284 | — | 23,183 | 25 | 18,598 | |||||||||||||
Occupancy related costs | 37,370 | (6 | ) | 39,917 | 4 | 38,262 | ||||||||||||
Amortization of intangible assets | 47,576 | 16 | 41,135 | 9 | 37,680 | |||||||||||||
Depreciation and amortization | 10,001 | 2 | 9,781 | 30 | 7,548 | |||||||||||||
Marketing costs | 27,847 | 1 | 27,499 | 14 | 24,130 | |||||||||||||
Other | 12,500 | (49 | ) | 24,456 | (20 | ) | 30,417 | |||||||||||
Selling, general and administrative expenses | $ | 214,155 | (3 | ) | $ | 220,868 | 9 | $ | 201,733 | |||||||||
We recognized SG&A of $214.2 million, $220.9 million and $201.7 million for the years ended December 31, 2016, 2015 and 2014, respectively. The decrease in SG&A in 2016 compared to 2015 was primarily due to a decrease in other SG&A driven by an estimated loss recorded in the fourth quarter of 2015 in connection with an anticipated payment to Ocwen for obtaining a release of liability for Altisource related to Ocwen’s settlement of a particular case and lower bad debt expense in 2016. These decreases were partially offset by higher amortization of intangible assets from increased revenues from the Homeward Residential, Inc. (“Homeward”) and Residential Capital, LLC (“ResCap”) portfolios (revenue-based amortization).
The increase in SG&A in 2015 compared to 2014 was primarily driven by higher compensation and benefits costs from an expansion of certain support functions, severance costs incurred in connection with cost savings initiatives, higher legal costs related to legal and regulatory matters, increased corporate marketing expenses associated with our customer and revenue diversification initiatives, increased amortization of intangible assets related to the Homeward and ResCap fee-based business acquisitions and the Mortgage Builder acquisition, and an estimated loss recorded in the fourth quarter of 2015 in connection with an anticipated payment to
33
Ocwen for obtaining a release of liability for Altisource related to Ocwen’s settlement of a particular case. These increased costs were partially offset in 2015 by lower bad debt expense.
Other Operating Expenses
Other operating expenses include the litigation settlement loss, net of insurance recovery, impairment losses and changes in the fair value of the Equator Earn Out.
In the fourth quarter of 2016, we recorded a litigation settlement loss of $28.0 million, net of a $4.0 million insurance recovery. The litigation settlement loss is related to the agreed settlement of the putative class action litigation designated In re: Altisource Portfolio Solutions, S.A. Securities Litigation pending in the United States District Court for the Southern District of Florida. Altisource Portfolio Solutions S.A. and the officer and director defendants deny all claims of wrongdoing or liability. The settlement must be approved by the Court. On February 10, 2017, the Court entered an order preliminarily approving the settlement, certifying a settlement class, approving the form and content of notice of the settlement to class members, and setting a hearing for May 30, 2017 to determine whether the settlement should be approved and the case dismissed with prejudice.
We recognized impairment losses of $71.8 million and $37.5 million for the years ended December 31, 2015 and 2014, respectively (no comparative amount in 2016). In the fourth quarter of 2015, we recorded non-cash impairment losses of $71.8 million in our Technology Services segment primarily driven by the Company’s projected Technology Services revenue from Ocwen and investment in technologies provided to Ocwen. These losses are composed of $55.7 million impairment of goodwill, $11.9 million impairment of intangible assets from the 2013 Homeward and ResCap fee-based business acquisitions and $4.1 million impairment of software assets included in premises and equipment.
In 2014, as a result of the adjustment in the fair value of the Equator contingent consideration described below and based on our goodwill assessment in 2014, we determined that the Equator goodwill was impaired and recorded an impairment loss of $37.5 million for the year ended December 31, 2014.
We recognized gains on the change in the fair value of the Equator Earn Out of $7.6 million and $37.9 million in 2015 and 2014, respectively (no comparative amount in 2016). The liability for contingent consideration was reflected at fair value and adjusted each reporting period with the change in fair value recognized in earnings. In 2015, we reached an agreement with the former owners of Equator to extinguish any liability for the Equator Earn Out. In connection with this settlement, we reduced the liability for the Equator Earn Out to $0 and recognized a $7.6 million increase in earnings. During 2014, the fair value of the contingent consideration related to the Equator acquisition was reduced by $37.9 million with a corresponding increase in earnings based on management’s revised estimates that expected earnings of Equator will be lower than projected at the time of acquisition.
Income from Operations
Income from operations decreased to $65.1 million, representing 7% of service revenue, for the year ended December 31, 2016 compared to $79.1 million, representing 8% of service revenue, for the year ended December 31, 2015. The decrease was primarily due to lower gross profit margin in 2016, the litigation settlement loss, net of insurance recovery, and the 2015 Equator Earn Out gain, partially offset by the 2015 impairment losses and lower SG&A in 2016, as discussed above.
Income from operations decreased to $79.1 million, representing 8% of service revenue, for the year ended December 31, 2015 compared to $170.5 million, representing 18% of service revenue, for the year ended December 31, 2014. The decrease in operating income margin was primarily driven by the non-cash impairment losses, lower gross profit margins and increases in SG&A, partially offset by gains on the change in fair value of Equator Earn Out, as discussed above.
Other Income (Expense), net
Other income (expense), net principally includes interest expense and other non-operating gains and losses. Interest expense for the year ended December 31, 2016 was $24.4 million, a decrease of $3.8 million compared to the year ended December 31, 2015, primarily from the 2016 and 2015 repurchases of portions of our senior secured term loan with an aggregate par value of $100.0 million. Interest expense for the year ended December 31, 2015 was $28.2 million, an increase of $4.8 million compared to the year ended December 31, 2014, resulting from the additional $200.0 million senior secured term loan borrowings on August 1, 2014, partially offset by lower interest expense associated with the 2015 repurchases of portions of our senior secured term loan with an aggregate par value of $49.0 million (no comparative amount for 2014).
During 2016, we repurchased portions of our senior secured term loan with an aggregate par value of $51.0 million at a weighted average discount of 13.2%, recognizing a net gain of $5.5 million on the early extinguishment of debt. During 2015, we repurchased portions of our senior secured term loan with an aggregate par value of $49.0 million at a weighted average discount of 10.3%, recognizing a net gain of $3.8 million on the early extinguishment of debt (no comparative amounts for 2014).
34
During March 2015, we purchased 1.6 million shares of HLSS common stock in the open market for $30.0 million. On April 6, 2015, HLSS completed the sale of substantially all of its assets and adopted a plan of complete liquidation and dissolution. During 2015, we received liquidating dividends and other dividends from HLSS totaling $20.4 million and sold all of our 1.6 million shares of HLSS common stock in the open market for $7.7 million. As a result of these transactions, we recognized a net loss of $1.9 million for the year ended December 31, 2015 (no comparative amounts for 2016 and 2014) in connection with our investment in HLSS.
Income Tax Provision
We recognized an income tax provision of $12.9 million, $8.3 million and $10.2 million for the years ended December 31, 2016, 2015 and 2014, respectively. Our effective tax rate was 29.2%, 15.6% and 6.9% for the years ended December 31, 2016, 2015 and 2014, respectively. The effective tax rate in 2015 and 2014 differs from the Luxembourg statutory tax rate of 29.2% primarily due to the effect of certain deductions in Luxembourg and the mix of income and losses with varying tax rates in multiple taxing jurisdictions. The higher effective income tax rate for the year ended December 31, 2016 was primarily the result of lower pretax income, including the impact of the litigation settlement loss, net of insurance recovery, which changed the mix of taxable income across the jurisdictions in which we operate. The higher 2015 effective tax rate compared to 2014 was driven by the 2015 impairment losses which resulted in a change in the jurisdictional mix of income. The impairment losses were related to assets owned by a subsidiary with a lower effective tax rate. Our consolidated effective income tax rate for financial reporting purposes may change periodically due to changes in enacted tax rates, fluctuations in the mix of income earned from our domestic and international operations and our ability to utilize net operating loss and tax credit carryforwards.
35
SEGMENT RESULTS OF OPERATIONS
The following section provides a discussion of pretax results of operations of our business segments. Transactions between segments are accounted for as third party arrangements for purposes of presenting segment results of operations. Intercompany transactions primarily consist of IT infrastructure management services, which are billed on a cost plus basis, and professional services billed by Technology Services. We reflect these as service revenue in the Technology Services segment and technology and telecommunications costs within cost of revenue and SG&A in the segment receiving the services.
Financial information for our segments is as follows:
For the year ended December 31, 2016 | ||||||||||||||||||||
(in thousands) | Mortgage Services | Financial Services | Technology Services | Corporate Items and Eliminations | Consolidated Altisource | |||||||||||||||
Revenue | ||||||||||||||||||||
Service revenue | $ | 749,944 | $ | 74,243 | $ | 160,101 | $ | (41,689 | ) | $ | 942,599 | |||||||||
Reimbursable expenses | 51,902 | 109 | — | — | 52,011 | |||||||||||||||
Non-controlling interests | 2,693 | — | — | — | 2,693 | |||||||||||||||
804,539 | 74,352 | 160,101 | (41,689 | ) | 997,303 | |||||||||||||||
Cost of revenue | 514,832 | 53,841 | 159,869 | (38,497 | ) | 690,045 | ||||||||||||||
Gross profit (loss) | 289,707 | 20,511 | 232 | (3,192 | ) | 307,258 | ||||||||||||||
Selling, general and administrative expenses | 108,987 | 17,768 | 27,811 | 59,589 | 214,155 | |||||||||||||||
Litigation settlement loss, net of $4,000 insurance recovery | — | — | — | 28,000 | 28,000 | |||||||||||||||
Income (loss) from operations | 180,720 | 2,743 | (27,579 | ) | (90,781 | ) | 65,103 | |||||||||||||
Other income (expense), net | 43 | 92 | 66 | (20,983 | ) | (20,782 | ) | |||||||||||||
Income (loss) before income taxes and non-controlling interests | $ | 180,763 | $ | 2,835 | $ | (27,513 | ) | $ | (111,764 | ) | $ | 44,321 | ||||||||
Margins: | ||||||||||||||||||||
Gross profit/service revenue | 39 | % | 28 | % | — | % | N/M | 33 | % | |||||||||||
Income (loss) from operations/service revenue | 24 | % | 4 | % | (17 | )% | N/M | 7 | % | |||||||||||
N/M — not meaningful.
36
For the year ended December 31, 2015 | ||||||||||||||||||||
(in thousands) | Mortgage Services | Financial Services | Technology Services | Corporate Items and Eliminations | Consolidated Altisource | |||||||||||||||
Revenue | ||||||||||||||||||||
Service revenue | $ | 676,222 | $ | 88,328 | $ | 215,482 | $ | (39,112 | ) | $ | 940,920 | |||||||||
Reimbursable expenses | 107,224 | 120 | — | — | 107,344 | |||||||||||||||
Non-controlling interests | 3,202 | — | — | — | 3,202 | |||||||||||||||
786,648 | 88,448 | 215,482 | (39,112 | ) | 1,051,466 | |||||||||||||||
Cost of revenue | 474,169 | 60,806 | 187,835 | (35,483 | ) | 687,327 | ||||||||||||||
Gross profit (loss) | 312,479 | 27,642 | 27,647 | (3,629 | ) | 364,139 | ||||||||||||||
Selling, general and administrative expenses | 105,153 | 18,707 | 29,902 | 67,106 | 220,868 | |||||||||||||||
Impairment losses | — | — | 71,785 | — | 71,785 | |||||||||||||||
Change in the fair value of Equator Earn Out | — | — | (7,591 | ) | — | (7,591 | ) | |||||||||||||
Income (loss) from operations | 207,326 | 8,935 | (66,449 | ) | (70,735 | ) | 79,077 | |||||||||||||
Other income (expense), net | 506 | 58 | 61 | (26,642 | ) | (26,017 | ) | |||||||||||||
Income (loss) before income taxes and non-controlling interests | $ | 207,832 | $ | 8,993 | $ | (66,388 | ) | $ | (97,377 | ) | $ | 53,060 | ||||||||
Margins: | ||||||||||||||||||||
Gross profit/service revenue | 46 | % | 31 | % | 13 | % | N/M | 39 | % | |||||||||||
Income (loss) from operations/service revenue | 31 | % | 10 | % | (31 | )% | N/M | 8 | % | |||||||||||
N/M — not meaningful.
For the year ended December 31, 2014 | ||||||||||||||||||||
(in thousands) | Mortgage Services | Financial Services | Technology Services | Corporate Items and Eliminations | Consolidated Altisource | |||||||||||||||
Revenue | ||||||||||||||||||||
Service revenue | $ | 653,093 | $ | 98,312 | $ | 227,300 | $ | (40,026 | ) | $ | 938,679 | |||||||||
Reimbursable expenses | 137,447 | 187 | — | — | 137,634 | |||||||||||||||
Non-controlling interests | 2,603 | — | — | — | 2,603 | |||||||||||||||
793,143 | 98,499 | 227,300 | (40,026 | ) | 1,078,916 | |||||||||||||||
Cost of revenue | 486,387 | 64,338 | 192,426 | (35,971 | ) | 707,180 | ||||||||||||||
Gross profit (loss) | 306,756 | 34,161 | 34,874 | (4,055 | ) | 371,736 | ||||||||||||||
Selling, general and administrative expenses | 94,686 | 18,791 | 32,393 | 55,863 | 201,733 | |||||||||||||||
Impairment losses | — | — | 37,473 | — | 37,473 | |||||||||||||||
Change in the fair value of Equator Earn Out | — | — | (37,924 | ) | — | (37,924 | ) | |||||||||||||
Income (loss) from operations | 212,070 | 15,370 | 2,932 | (59,918 | ) | 170,454 | ||||||||||||||
Other income (expense), net | 204 | 62 | (31 | ) | (23,424 | ) | (23,189 | ) | ||||||||||||
Income (loss) before income taxes and non-controlling interests | $ | 212,274 | $ | 15,432 | $ | 2,901 | $ | (83,342 | ) | $ | 147,265 | |||||||||
Margins: | ||||||||||||||||||||
Gross profit/service revenue | 47 | % | 35 | % | 15 | % | N/M | 40 | % | |||||||||||
Income from operations/service revenue | 32 | % | 16 | % | 1 | % | N/M | 18 | % | |||||||||||
N/M — not meaningful.
37
Mortgage Services
Revenue
Revenue by service line was as follows for the years ended December 31:
(in thousands) | 2016 | % Increase (decrease) | 2015 | % Increase (decrease) | 2014 | |||||||||||||
Service revenue: | ||||||||||||||||||
Asset management services | $ | 557,419 | 20 | $ | 463,780 | 30 | $ | 356,433 | ||||||||||
Insurance services | 89,084 | (8 | ) | 96,688 | (38 | ) | 154,830 | |||||||||||
Residential property valuation | 58,273 | (14 | ) | 67,672 | (33 | ) | 101,173 | |||||||||||
Default management services | 19,022 | (29 | ) | 26,930 | 18 | 22,728 | ||||||||||||
Origination services | 26,146 | 24 | 21,152 | 18 | 17,929 | |||||||||||||
Total service revenue | 749,944 | 11 | 676,222 | 4 | 653,093 | |||||||||||||
Reimbursable expenses: | ||||||||||||||||||
Asset management services | 41,341 | (57 | ) | 96,761 | (26 | ) | 130,864 | |||||||||||
Insurance services | 7,961 | 7 | 7,436 | 69 | 4,408 | |||||||||||||
Default management services | 2,321 | (19 | ) | 2,871 | 41 | 2,032 | ||||||||||||
Origination services | 279 | 79 | 156 | 9 | 143 | |||||||||||||
Total reimbursable expenses | 51,902 | (52 | ) | 107,224 | (22 | ) | 137,447 | |||||||||||
Non-controlling interests | 2,693 | (16 | ) | 3,202 | 23 | 2,603 | ||||||||||||
Total revenue | $ | 804,539 | 2 | $ | 786,648 | (1 | ) | $ | 793,143 | |||||||||
We recognized service revenue of $749.9 million for the year ended December 31, 2016, an 11% increase compared to the year ended December 31, 2015. The increase was primarily due to revenue growth in the asset management services businesses from an early 2015 change in the pricing and billing model for preservation services on new Ocwen REO referrals that resulted in certain services that were historically reimbursable expenses revenue becoming service revenue, increased volumes of higher value property preservation referrals and growth in the percentage of homes sold through auction on Hubzu. Revenue growth in origination services was from new customers and volume growth with existing customers. These increases were partially offset by decreases in residential property valuation services, insurance services and default management services, from a decline in the average number of delinquent loans serviced by Ocwen.
We recognized service revenue of $676.2 million for the year ended December 31, 2015, a 4% increase compared to the year ended December 31, 2014. The increase was primarily due to revenue expansion in the asset management services businesses primarily from the growth in both the number of non-Ocwen and Ocwen REO properties sold on Hubzu and increased volumes of property preservation services for Residential, partially offset by a decrease in property inspection volumes, all within asset management services. In addition, in early 2015 the pricing model to Ocwen for REO preservation services within asset management services changed, as described above. These increases were partially offset by a decrease in insurance services revenue from the discontinuation of the lender placed insurance brokerage line of business in the fourth quarter of 2014 and fewer referrals within residential property valuation.
Certain of our Mortgage Services businesses are impacted by seasonality. Revenues from property sales, originations and lawn maintenance services within the asset management services business are generally lowest during the fall and winter months and highest during the spring and summer months.
38
Cost of Revenue and Gross Profit
Cost of revenue consists of the following for the years ended December 31:
(in thousands) | 2016 | % Increase (decrease) | 2015 | % Increase (decrease) | 2014 | |||||||||||||
Compensation and benefits | $ | 117,234 | 37 | $ | 85,474 | 12 | $ | 76,125 | ||||||||||
Outside fees and services | 299,213 | 22 | 245,739 | 2 | 240,070 | |||||||||||||
Reimbursable expenses | 51,902 | (52 | ) | 107,224 | (22 | ) | 137,447 | |||||||||||
Technology and telecommunications | 42,546 | 32 | 32,122 | 6 | 30,305 | |||||||||||||
Depreciation and amortization | 3,937 | 9 | 3,610 | 48 | 2,440 | |||||||||||||
Cost of revenue | $ | 514,832 | 9 | $ | 474,169 | (3 | ) | $ | 486,387 | |||||||||
Cost of revenue for the year ended December 31, 2016 of $514.8 million increased by 9% compared to the year ended December 31, 2015, primarily due to higher outside fees and services, compensation and benefits costs and technology and telecommunications costs, partially offset by a decline in reimbursable expenses. Outside fees and services were higher due to an increase in the average costs related to higher value property preservation referrals and the change in billing discussed in the revenue section above, partially offset by the termination of the Data Access Agreement as of March 31, 2015. Compensation and benefits costs and technology and telecommunications costs increased from our investments to support certain of our growth initiatives. Reimbursable expenses declined primarily as a result of the change in billing discussed in the revenue section above.
Cost of revenue for the year ended December 31, 2015 of $474.2 million decreased by 3% compared to the year ended December 31, 2014, primarily attributable to the termination of the Data Access Agreement as of March 31, 2015 and non-recurring costs incurred in 2014 to build and develop our insurance services business. These reductions were partially offset by an increase in compensation and benefits costs from increased headcount in the United States. The decline in reimbursable expenses was from the change in billing discussed above and resulted in an increase in outside fees and services.
Gross profit decreased to $289.7 million, representing 39% of service revenue, for the year ended December 31, 2016 compared to $312.5 million, representing 46% of service revenue, for the year ended December 31, 2015 and $306.8 million, representing 47% of service revenue, for the year ended December 31, 2014.
Gross profit as a percentage of service revenue in 2016 compared to 2015 decreased from a change in revenue mix, as a higher percentage of revenue in 2016 was from lower margin property preservation services and higher compensation and benefits costs and technology and telecommunications costs, as described above. The decrease was partially offset by the March 31, 2015 termination of the Data Access Agreement.
Gross profit as a percentage of service revenue in 2015 decreased slightly compared to 2014 primarily due to service revenue growth of the lower margin property preservation and inspection business within asset management services and the November 2014 discontinuation of the higher margin lender placed insurance brokerage business within insurance services, partially offset by Hubzu revenue growth within asset management services and the March 31, 2015 termination of the Data Access Agreement.
Our margins can vary substantially depending upon service revenue mix.
39
Selling, General and Administrative Expenses
SG&A expenses consist of the following for the years ended December 31:
(in thousands) | 2016 | % Increase (decrease) | 2015 | % Increase (decrease) | 2014 | |||||||||||||
Compensation and benefits | $ | 9,722 | 133 | $ | 4,168 | 141 | $ | 1,726 | ||||||||||
Professional services | 10,933 | (4 | ) | 11,344 | 37 | 8,295 | ||||||||||||
Occupancy related costs | 13,464 | 14 | 11,789 | 17 | 10,085 | |||||||||||||
Amortization of intangible assets | 39,949 | 26 | 31,601 | 14 | 27,770 | |||||||||||||
Depreciation and amortization | 2,979 | 21 | 2,457 | 21 | 2,031 | |||||||||||||
Marketing costs | 26,572 | 8 | 24,559 | 3 | 23,777 | |||||||||||||
Other | 5,368 | (72 | ) | 19,235 | (8 | ) | 21,002 | |||||||||||
Selling, general and administrative expenses | $ | 108,987 | 4 | $ | 105,153 | 11 | $ | 94,686 | ||||||||||
SG&A for the year ended December 31, 2016 of $109.0 million increased by 4% compared to the year ended December 31, 2015, primarily driven by higher amortization of intangible assets, compensation and benefits costs and marketing costs, partially offset by lower other costs. Higher amortization of intangible assets was driven by increased revenues from the Homeward and ResCap portfolios (revenue-based amortization). Compensation and benefits costs and occupancy related costs increased primarily due to growth of the sales and marketing organizations to support our revenue and customer diversification initiatives and higher headcount to support certain of our growth initiatives. The increase in marketing costs related primarily to Owners.com, as we launched our buy side brokerage marketing campaign in 2016. The decrease in other costs for the year ended December 31, 2016 was primarily due to a favorable loss accrual adjustment during the first quarter of 2016 that was accrued in the fourth quarter of 2015, when Altisource recorded an estimated loss in connection with an anticipated payment to Ocwen for obtaining a release of liability for Altisource related to Ocwen’s settlement of a particular case. The decrease in other costs was also driven by lower bad debt expense from improved collections.
SG&A for the year ended December 31, 2015 of $105.2 million increased by 11% compared to the year ended December 31, 2014, primarily due to an increase in professional services from higher legal and regulatory related costs. In addition, compensation and benefits costs increased primarily due to increased sales and marketing expenses to support our revenue and customer diversification initiatives and the amortization of intangible assets increased due to higher revenues from the Homeward and ResCap fee-based business acquisitions compared to projections. During the fourth quarter of 2015, Altisource recorded an estimated loss in connection with an anticipated payment to Ocwen for obtaining a release of liability for Altisource related to Ocwen’s settlement of a particular case. These increases were partially offset by lower bad debt expense, primarily as a result of the prior year default management services expense recorded in the fourth quarter of 2014 from a change in many of our default management services customers’ business models, with no corresponding change in 2015.
Income from Operations
Income from operations decreased to $180.7 million, representing 24% of service revenue, for the year ended December 31, 2016 compared to $207.3 million, representing 31% of service revenue, for the year ended December 31, 2015 and $212.1 million, representing 32% of service revenue, for the year ended December 31, 2014. In 2016, the operating income margin decreased primarily as the result of lower gross profit margin from the change in the revenue mix along with a slightly higher SG&A expense, as discussed above. In 2015, the operating income margin decreased primarily due to decreased gross profit margin and an increase in SG&A, as discussed above.
40
Financial Services
Revenue
Revenue by service line was as follows for the years ended December 31:
(in thousands) | 2016 | % Increase (decrease) | 2015 | % Increase (decrease) | 2014 | |||||||||||||
Service revenue: | ||||||||||||||||||
Customer relationship management | $ | 36,977 | (26 | ) | $ | 50,294 | (2 | ) | $ | 51,411 | ||||||||
Asset recovery management | 37,266 | (2 | ) | 38,034 | (19 | ) | 46,901 | |||||||||||
Total service revenue | 74,243 | (16 | ) | 88,328 | (10 | ) | 98,312 | |||||||||||
Reimbursable expenses: | ||||||||||||||||||
Asset recovery management | 109 | (9 | ) | 120 | (36 | ) | 187 | |||||||||||
Total reimbursable expenses | 109 | (9 | ) | 120 | (36 | ) | 187 | |||||||||||
Total revenue | $ | 74,352 | (16 | ) | $ | 88,448 | (10 | ) | $ | 98,499 | ||||||||
We recognized service revenue of $74.2 million for the year ended December 31, 2016, a 16% decrease compared to the year ended December 31, 2015, primarily due to lower customer relationship management business as we severed relationships with and reduced the volume of services provided to certain clients that were not profitable to us, and we experienced a reduction in volume from the transition of services provided to one customer to another.
We recognized service revenue of $88.3 million for the year ended December 31, 2015, a 10% decrease compared to the year ended December 31, 2014, primarily due to lower referrals of mortgage charge-off collections in the asset recovery management business. The customer relationship management business revenue declined modestly with one client’s referral reduction largely offset by other customer growth.
Certain of our Financial Services businesses are impacted by seasonality. Revenue in the asset recovery management business tends to be higher in the first quarter, as borrowers may utilize tax refunds and bonuses to pay debts, and generally declines throughout the rest of the year.
Cost of Revenue and Gross Profit
Cost of revenue consists of the following for the years ended December 31:
(in thousands) | 2016 | % Increase (decrease) | 2015 | % Increase (decrease) | 2014 | |||||||||||||
Compensation and benefits | $ | 40,683 | (12 | ) | $ | 46,086 | (2 | ) | $ | 47,063 | ||||||||
Outside fees and services | 3,050 | 13 | 2,703 | (20 | ) | 3,361 | ||||||||||||
Reimbursable expenses | 109 | (9 | ) | 120 | (36 | ) | 187 | |||||||||||
Technology and telecommunications | 8,256 | (18 | ) | 10,033 | (18 | ) | 12,277 | |||||||||||
Depreciation and amortization | 1,743 | (6 | ) | 1,864 | 29 | 1,450 | ||||||||||||
Cost of revenue | $ | 53,841 | (11 | ) | $ | 60,806 | (5 | ) | $ | 64,338 | ||||||||
Cost of revenue for the year ended December 31, 2016 of $53.8 million decreased by 11% compared to the year ended December 31, 2015, primarily due to a decrease in compensation and benefits costs and lower technology and telecommunications costs resulting from cost savings initiatives implemented in 2015 and reduced headcount from lower customer volumes in the customer relationship management business, as discussed above. Cost of revenue for the year ended December 31, 2015 of $60.8 million decreased by 5% compared to the year ended December 31, 2014, primarily due to lower technology and telecommunications costs as a result of the implementation of cost savings initiatives in 2015.
Gross profit decreased to $20.5 million, representing 28% of service revenue, for the year ended December 31, 2016 compared to $27.6 million, representing 31% of service revenue, for the year ended December 31, 2015 and $34.2 million, representing 35% of service revenue, for the year ended December 31, 2014. In 2016, gross profit margin declined as the decrease in customer relationship management revenue exceeded the reduction in expenses. Revenue mix in the asset recovery management business also impacted gross profit margins with higher revenue in the lower margin credit card collections business and lower revenue in
41
the higher margin mortgage charge-off collections business. In 2015, gross profit margin decreased due to a change in revenue mix as revenue declined in the higher margin mortgage charge-off business.
Selling, General and Administrative Expenses
SG&A expenses consist of the following for the years ended December 31:
(in thousands) | 2016 | % Increase (decrease) | 2015 | % Increase (decrease) | 2014 | |||||||||||||
Compensation and benefits | $ | 709 | (13 | ) | $ | 819 | 22 | $ | 672 | |||||||||
Professional services | 810 | (35 | ) | 1,245 | 26 | 988 | ||||||||||||
Occupancy related costs | 7,598 | 2 | 7,420 | 3 | 7,193 | |||||||||||||
Amortization of intangible assets | 3,883 | (4 | ) | 4,056 | (24 | ) | 5,355 | |||||||||||
Depreciation and amortization | 2,239 | (8 | ) | 2,427 | 30 | 1,870 | ||||||||||||
Other | 2,529 | (8 | ) | 2,740 | 1 | 2,713 | ||||||||||||
Selling, general and administrative expenses | $ | 17,768 | (5 | ) | $ | 18,707 | — | $ | 18,791 | |||||||||
SG&A for the year ended December 31, 2016 of $17.8 million decreased by 5% compared to the year ended December 31, 2015, primarily due to lower professional services expenses driven by a decrease in legal costs. Lower occupancy related costs from lower headcount in 2016 were more than offset by non-recurring lease exit costs incurred in 2016 as we improve the efficiency of our office space utilization. SG&A for the year ended December 31, 2015 of $18.7 million remained flat compared to the year ended December 31, 2014, primarily due to a decrease in amortization of intangible assets driven by lower service revenue from the related mortgage charge-off services, largely offset by an increase in depreciation and amortization expenses from 2014 leasehold improvements in connection with facility relocations and an increase in legal and regulatory related costs.
Income from Operations
Income from operations was $2.7 million, representing 4% of service revenue, for the year ended December 31, 2016 compared to $8.9 million, representing 10% of service revenue, for the year ended December 31, 2015 and $15.4 million, representing 16% of service revenue, for the year ended December 31, 2014. The decrease in operating income as a percentage of service revenue in 2016 was primarily the result of lower gross profit margins, partially offset by lower SG&A, as discussed above. The decrease in operating income as a percentage of service revenue in 2015 was primarily due to the decrease in gross profit margin, as discussed above.
Technology Services
Revenue
Revenue by service line was as follows for the years ended December 31:
(in thousands) | 2016 | % Increase (decrease) | 2015 | % Increase (decrease) | 2014 | |||||||||||||
Service revenue: | ||||||||||||||||||
Software services | $ | 113,990 | (24 | ) | $ | 149,291 | (1 | ) | $ | 151,335 | ||||||||
IT infrastructure services | 46,111 | (30 | ) | 66,191 | (13 | ) | 75,965 | |||||||||||
Total revenue | $ | 160,101 | (26 | ) | $ | 215,482 | (5 | ) | $ | 227,300 | ||||||||
We recognized service revenue of $160.1 million for the year ended December 31, 2016, a 26% decrease compared to the year ended December 31, 2015, primarily driven by lower rates charged to Ocwen for certain software services, decreases in IT infrastructure services, which are typically billed on a cost plus basis, and a decline in the number of loans on REALServicing. During the fourth quarter of 2015, we began transitioning resources supporting Ocwen’s technology infrastructure to Ocwen as a part of the previously announced separation of technology infrastructure. These transitions continued throughout 2016.
We recognized service revenue of $215.5 million for the year ended December 31, 2015, a 5% decrease compared to the year ended December 31, 2014, primarily driven by a decrease in IT infrastructure services, which are typically billed on a cost plus basis, and were lower from reduced investment in infrastructure to better align our costs with revenue. In addition, during the fourth quarter of 2015, we began transitioning resources supporting Ocwen’s technology infrastructure to Ocwen as a part of our
42
previously announced separation of technology infrastructure. Software services decreased slightly, primarily at Equator from the full amortization of acquisition related deferred revenue in 2014, partially offset by an increase in software development revenue and increased revenue in connection with the acquisition of Mortgage Builder in September 2014.
For segment presentation purposes, revenue from services provided by Technology Services to our other reportable segments is eliminated in consolidation. This intercompany revenue is included as revenue in the Technology Services segment and as technology and telecommunications costs, a component of cost of revenue and SG&A, in our other reportable segments.
Cost of Revenue and Gross Profit (Loss)
Cost of revenue consists of the following for the years ended December 31:
(in thousands) | 2016 | % Increase (decrease) | 2015 | % Increase (decrease) | 2014 | |||||||||||||
Compensation and benefits | $ | 106,879 | (18 | ) | $ | 130,279 | (2 | ) | $ | 132,701 | ||||||||
Outside fees and services | 25 | 9 | 23 | N/M | — | |||||||||||||
Technology and telecommunications | 31,858 | (12 | ) | 36,318 | (14 | ) | 42,117 | |||||||||||
Depreciation and amortization | 21,107 | (1 | ) | 21,215 | 20 | 17,608 | ||||||||||||
Cost of revenue | $ | 159,869 | (15 | ) | $ | 187,835 | (2 | ) | $ | 192,426 | ||||||||
N/M — not meaningful.
Cost of revenue for the year ended December 31, 2016 of $159.9 million decreased by 15% compared to the year ended December 31, 2015, primarily due to lower compensation and benefits and technology and telecommunications costs driven by the implementation of cost savings initiatives in 2015 and the transition of resources supporting technology infrastructure to Ocwen as part of the infrastructure separation, as discussed above. In addition, compensation and benefits costs for the year ended December 31, 2016 and 2015 include $1.7 million and $3.2 million, respectively, of severance expense related to the reduction of staff.
Cost of revenue for the year ended December 31, 2015 of $187.8 million decreased by 2% compared to the year ended December 31, 2014, primarily due to a decrease in technology and telecommunications costs and compensation and benefits costs in connection with the implementation of cost savings initiatives in 2015, partially offset by an increase in depreciation and amortization expense driven by capital expenditures and compensation and benefits cost increases as a result of the acquisition of Mortgage Builder in September 2014. Recognizing that our service revenue from Ocwen was not expected to grow in the near term due to challenges faced by Ocwen, in late 2014 and early 2015, we developed and executed on a plan that included eliminating certain non-revenue generating businesses, reducing vendor costs and eliminating staff. We recognized $3.2 million of severance expense in the Technology Services segment for the year ended December 31, 2015 in connection with the elimination of staff.
Gross profit was $0.2 million, representing less than 1% of service revenue, for the year ended December 31, 2016 compared to $27.6 million, representing 13% of service revenue, for the year ended December 31, 2015 and $34.9 million, representing 15% of service revenue, for the year ended December 31, 2014. In 2016, gross profit margin as a percentage of service revenue decreased primarily as we were not able to reduce costs at the same rate that revenue declined. In 2015, gross profit margin as a percentage of service revenue decreased primarily due to lower Equator revenue from the full amortization of acquisition related deferred revenue in 2014. Higher depreciation and amortization costs also contributed to the reduction in gross profit.
43
Selling, General and Administrative Expenses
SG&A expenses consist of the following for the years ended December 31:
(in thousands) | 2016 | % Increase (decrease) | 2015 | % Increase (decrease) | 2014 | |||||||||||||
Compensation and benefits | $ | 2,285 | (30 | ) | $ | 3,259 | (45 | ) | $ | 5,938 | ||||||||
Professional services | 3,439 | 132 | 1,484 | 116 | 686 | |||||||||||||
Occupancy related costs | 11,489 | (14 | ) | 13,325 | 9 | 12,250 | ||||||||||||
Amortization of intangible assets | 3,744 | (32 | ) | 5,478 | 20 | 4,555 | ||||||||||||
Depreciation and amortization | 3,335 | 52 | 2,188 | 82 | 1,205 | |||||||||||||
Marketing costs | 1,085 | 10 | 989 | 230 | 300 | |||||||||||||
Other | 2,434 | (23 | ) | 3,179 | (57 | ) | 7,459 | |||||||||||
Selling, general and administrative expenses | $ | 27,811 | (7 | ) | $ | 29,902 | (8 | ) | $ | 32,393 | ||||||||
SG&A for the year ended December 31, 2016 of $27.8 million decreased by 7% compared to the year ended December 31, 2015, primarily driven by lower occupancy costs related to facility consolidations and relocations during 2015, lower amortization of intangible assets driven by the write-off of certain intangible assets in the fourth quarter of 2015 and lower compensation and benefits from the implementation of cost savings initiatives in 2015, partially offset by an increase in professional services due to higher legal and regulatory costs and higher depreciation and amortization related to the facility consolidations and relocations in 2015.
SG&A for the year ended December 31, 2015 of $29.9 million decreased by 8% compared to the year ended December 31, 2014, primarily due to lower compensation and benefits costs in connection with cost savings initiatives and lower bad debt expense, partially offset by an increase in occupancy related costs driven by facility expansions and relocations and higher amortization of intangible assets, primarily due to the Mortgage Builder acquisition in September 2014.
Other Operating Expenses, net
We recognized impairment losses of $71.8 million and $37.5 million for the years ended December 31, 2015, and 2014, respectively (no comparative amount in 2016). In the fourth quarter of 2015, we recorded non-cash impairment losses of $71.8 million primarily driven by the Company’s projected Technology Services revenue from Ocwen and investment in technologies provided to Ocwen. These losses were composed of an estimated $55.7 million impairment of goodwill, $11.9 million impairment of intangible assets from the 2013 Homeward and ResCap fee-based business acquisitions and $4.1 million impairment of software assets included in premises and equipment. In 2014, as a result of the adjustment in the fair value of the Equator contingent consideration described below and based on our goodwill assessment in 2014, we determined that the Equator goodwill was impaired and recorded an impairment loss of $37.5 million for the year ended December 31, 2014.
We recognized gains on the change in fair value of the Equator Earn Out of $7.6 million and $37.9 million for the years ended December 31, 2015 and 2014, respectively (no comparative amount in 2016). The liability for contingent consideration is reflected at fair value and adjusted each reporting period with the change in fair value recognized in earnings. In 2015, we reached an agreement with the former owners of Equator to extinguish any liability for the Equator Earn Out. In connection with this settlement, we reduced the liability for the Equator Earn Out to $0 and recognized a $7.6 million increase in earnings. During 2014, the fair value of the contingent consideration related to the Equator acquisition was reduced by $37.9 million with a corresponding increase in earnings based on management’s revised estimates that expected earnings of Equator will be lower than projected at the time of acquisition.
Income (Loss) from Operations
Loss from operations was $(27.6) million, representing (17)% of service revenue, for the year ended December 31, 2016 compared to loss from operations of $(66.4) million, representing (31)% of service revenue, for the year ended December 31, 2015 and income from operations of $2.9 million, representing 1% of service revenue, for the year ended December 31, 2014. Loss from operations as a percentage of service revenue in 2016 was impacted primarily by the decrease in service revenue, partially offset by the decreases in cost of revenue and SG&A, as discussed above. The 2015 loss from operations was primarily due to the non-cash impairment losses and the decline in gross profit margin, partially offset by the settlement of the Equator Earn Out and other net reductions in SG&A, as discussed above.
44
Corporate Items and Eliminations
Corporate Items and Eliminations include interest expense, costs related to corporate support functions including executive, finance, law, compliance, human resources, vendor management, risk management, sales and marketing cost not allocated to the business units and non-operating items. It also includes eliminations of transactions between the reportable segments.
Selling, General and Administrative Expenses
Corporate costs consist of the following for the years ended December 31:
(in thousands) | 2016 | % Increase (decrease) | 2015 | % Increase (decrease) | 2014 | |||||||||||||
Compensation and benefits | $ | 42,861 | (8 | ) | $ | 46,651 | 27 | $ | 36,762 | |||||||||
Professional services | 8,102 | (11 | ) | 9,110 | 6 | 8,629 | ||||||||||||
Occupancy related costs | 4,819 | (35 | ) | 7,383 | (15 | ) | 8,734 | |||||||||||
Depreciation and amortization | 1,448 | (47 | ) | 2,709 | 11 | 2,442 | ||||||||||||
Marketing costs | 157 | (90 | ) | 1,499 | N/M | 33 | ||||||||||||
Other | 2,202 | N/M | (246 | ) | (67 | ) | (737 | ) | ||||||||||
Selling, general and administrative expenses | 59,589 | (11 | ) | 67,106 | 20 | 55,863 | ||||||||||||
Litigation settlement loss, net of $4,000 insurance recovery | 28,000 | N/M | — | N/M | — | |||||||||||||
Total other expenses, net | 20,983 | (21 | ) | 26,642 | 14 | 23,424 | ||||||||||||
Total corporate costs | $ | 108,572 | 16 | $ | 93,748 | 18 | $ | 79,287 | ||||||||||
N/M — not meaningful.
SG&A for the year ended December 31, 2016 of $59.6 million decreased by 11% compared to the year ended December 31, 2015, primarily due to lower compensation and benefits costs and occupancy related costs driven by increased support department allocations to the segments. SG&A for the year ended December 31, 2015 of $67.1 million increased by 20% compared to the year ended December 31, 2014, driven by an increase in compensation and benefits costs as we expanded certain corporate functions and an increase in marketing costs as we expanded the sales and marketing functions in connection with our rebranding and growth initiatives.
Other Operating Expenses
In the fourth quarter of 2016, we recorded a litigation settlement loss of $28.0 million, net of a $4.0 million insurance recovery. The litigation settlement loss is related to the agreed settlement of the putative class action litigation designated In re: Altisource Portfolio Solutions, S.A. Securities Litigation pending in the United States District Court for the Southern District of Florida. Altisource Portfolio Solutions S.A. and the officer and director defendants deny all claims of wrongdoing or liability. The settlement must be approved by the Court. On February 10, 2017, the Court entered an order preliminarily approving the settlement, certifying a settlement class, approving the form and content of notice of the settlement to class members, and setting a hearing for May 30, 2017 to determine whether the settlement should be approved and the case dismissed with prejudice.
Other Expenses, net
Other expenses, net primarily includes interest expense and other non-operating gains and losses. Other income (expense), net for the year ended December 31, 2016 of $21.0 million decreased by 21% compared to the year ended December 31, 2015, primarily from lower interest expense and higher gains on the early extinguishment of debt in 2016. Other income (expense), net for the year ended December 31, 2015 of $26.6 million increased by 14% compared to the year ended December 31, 2014, primarily from higher interest expense in 2015.
Interest expense for the year ended December 31, 2016 was $24.4 million, a decrease of $3.8 million compared to the year ended December 31, 2015, primarily due to lower interest expense associated with the 2016 and 2015 repurchases of portions of our senior secured term loan with an aggregate par value of $100.0 million. Interest expense for the year ended December 31, 2015 was $28.2 million, an increase of $4.8 million compared to the year ended December 31, 2014, resulting from the additional $200.0 million senior secured term loan borrowings on August 1, 2014, partially offset by lower interest expense associated with the repurchase in 2015 of portions of our senior secured term loan with an aggregate par value of $49.0 million.
45
During 2016, we repurchased portions of our senior secured term loan with an aggregate par value of $51.0 million at a weighted average discount of 13.2%, recognizing a net gain of $5.5 million on the early extinguishment of debt. During 2015, we repurchased portions of our senior secured term loan with an aggregate par value of $49.0 million at a weighted average discount of 10.3%, recognizing a net gain of $3.8 million on the early extinguishment of debt (no comparative amounts for 2014).
During March 2015, we purchased 1.6 million shares of HLSS common stock in the open market for $30.0 million. On April 6, 2015, HLSS completed the sale of substantially all of its assets and adopted a plan of complete liquidation and dissolution. During 2015, we received liquidating dividends and other dividends from HLSS totaling $20.4 million and sold all of our 1.6 million shares of HLSS common stock in the open market for $7.7 million. As a result of these transactions, we recognized a net loss of $1.9 million for the year ended December 31, 2015 (no comparative amounts for 2016 and 2014) in connection with our investment in HLSS.
Intercompany revenue is eliminated in consolidation. Intercompany transactions are primarily related to IT infrastructure services, which are billed on a cost plus basis, and professional services provided by Technology Services to the other segments. Service revenue is reflected in Technology Services and technology and telecommunications costs within cost of revenue and SG&A in the segment receiving the services. The elimination of the service revenue and expenses is reflected in Corporate Items and Eliminations.
LIQUIDITY AND CAPITAL RESOURCES
Liquidity
Our primary source of liquidity is cash flows from operations. We seek to deploy cash generated in a disciplined manner. Principally, we intend to use cash to develop and grow complementary services and businesses that we believe will generate attractive margins in line with our core capabilities and strategy. We also seek to use cash to repurchase and repay our senior secured term loan and, from time to time, repurchase shares of our common stock. In addition, we consider and evaluate business acquisitions that may arise from time to time that are aligned with our strategy.
For the year ended December 31, 2016, we used $50.7 million to repay and repurchase portions of the senior secured term loan and make contractual repayments of the senior secured term loan, $48.2 million to purchase available for sale securities and $37.7 million to repurchase shares of our common stock.
Senior Secured Term Loan
On November 27, 2012, Altisource Solutions S.à r.l., a wholly-owned subsidiary of Altisource Portfolio Solutions S.A., entered into a senior secured term loan agreement with Bank of America, N.A., as administrative agent, and certain lenders. Altisource Portfolio Solutions S.A. and certain wholly-owned subsidiaries are guarantors of the term loan. We subsequently amended the senior secured term loan agreement to increase the principal amount of the senior secured term loan and, among other changes, re-establish the $200.0 million incremental term loan facility accordion, lower the interest rate, extend the maturity date by approximately one year and increase the maximum amount of Restricted Junior Payments (as defined in the senior secured term loan agreement; other capitalized terms, unless defined herein, are defined in the senior secured term loan agreement). The lenders of the senior secured term loan, as amended, have no obligation to provide any such additional debt under the accordion provision. As of December 31, 2016, $479.7 million was outstanding under the senior secured term loan agreement, as amended, compared to $536.6 million as of December 31, 2015.
After giving effect to the third amendment entered into on August 1, 2014, the term loan must be repaid in equal consecutive quarterly principal installments of $1.5 million, with the balance due at maturity. All amounts outstanding under the senior secured term loan agreement will become due on the earlier of (i) December 9, 2020 and (ii) the date on which the loans are declared to be due and owing by the administrative agent at the request (or with the consent) of the Required Lenders or as otherwise provided in the senior secured term loan agreement upon the occurrence of any event of default under the senior secured term loan agreement. However, if the leverage ratio exceeds 3.00 to 1.00, as calculated in accordance with the provisions of the senior secured term loan agreement, a percentage of cash flows must be used to repay principal (the percentage increases if the leverage ratio exceeds 3.50 to 1.00). No mandatory prepayments were required during the year ended December 31, 2016. The interest rate as of December 31, 2016 was 4.50%.
During 2016, we repurchased portions of our senior secured term loan with an aggregate par value of $51.0 million at a weighted average discount of 13.2%, recognizing a net gain of $5.5 million on the early extinguishment of debt. During 2015, we repurchased portions of our senior secured term loan with an aggregate par value of $49.0 million at a weighted average discount of 10.3%, recognizing a net gain of $3.8 million on the early extinguishment of debt.
46
The debt covenants in the senior secured term loan agreement limit, among other things, our ability to incur additional debt, pay dividends and repurchase shares of our common stock. In the event we require additional liquidity, our ability to obtain it may be limited by the senior secured term loan.
Cash Flows
The following table presents our cash flows for the years ended December 31:
(in thousands) | 2016 | % Increase (decrease) | 2015 | % Increase (decrease) | 2014 | |||||||||||||
Net income adjusted for non-cash items | $ | 115,470 | (41 | ) | $ | 195,922 | (13 | ) | $ | 224,673 | ||||||||
Changes in operating assets and liabilities | 11,348 | N/M | (570 | ) | 98 | (27,180 | ) | |||||||||||
Net cash flows provided by operating activities | 126,818 | (35 | ) | 195,352 | (1 | ) | 197,493 | |||||||||||
Net cash flows used in investing activities | (80,223 | ) | (22 | ) | (65,995 | ) | 35 | (101,268 | ) | |||||||||
Net cash flows used in financing activities | (76,628 | ) | 31 | (111,391 | ) | (71 | ) | (65,188 | ) | |||||||||
Net (decrease) increase in cash and cash equivalents | (30,033 | ) | (267 | ) | 17,966 | (42 | ) | 31,037 | ||||||||||
Cash and cash equivalents at the beginning of the period | 179,327 | 11 | 161,361 | 24 | 130,324 | |||||||||||||
Cash and cash equivalents at the end of the period | $ | 149,294 | (17 | ) | $ | 179,327 | 11 | $ | 161,361 | |||||||||
N/M — not meaningful.
Cash Flows from Operating Activities
Cash flows from operating activities generally consist of the cash effects of transactions and events that enter into the determination of net income. For the year ended December 31, 2016, we generated cash flows from operating activities of $126.8 million, or approximately $0.13 for every dollar of service revenue compared to cash flows from operating activities of $195.4 million, or approximately $0.21 for every dollar of service revenue for the year ended December 31, 2015 and $197.5 million of cash flows from operating activities, or approximately $0.21 per dollar of service revenue for the year ended December 31, 2014. The decrease in cash flows from operating activities during 2016 compared to 2015 was principally driven by the decrease in net income, partially offset by an improvement in working capital changes in 2016. Changes in working capital were principally driven by higher collections of accounts receivable and the timing of payment of accounts payable and other accrued expenses, partially offset by increased prepaid expenses and other current assets driven by purchases of short-term investments in real estate assets in connection with our buy-renovate-sell program. The decrease in cash flows from operating activities during 2015 compared to 2014 was principally driven by the decrease in net income after adding back depreciation and amortization and amortization of intangible assets, largely offset by lower unfavorable working capital changes in 2015. Changes in working capital were principally driven by improved timing of collections of accounts receivable in 2015, partially offset by a net decrease in accounts payable and accrued expenses in 2015 largely due to the timing of payments across the relative time periods.
Operating cash flows per service revenue dollar can be negatively impacted because of the nature of some of our services and the mix of services provided. Certain services are performed immediately following or shortly after the referral, but the collection of the receivable does not occur until a specific event occurs (e.g., the foreclosure is complete, the REO asset is sold, etc.). Furthermore, lower margin services generate lower income and cash flows from operations. Consequently, our cash flows from operations may be negatively impacted when comparing one period to another.
Cash Flows from Investing Activities
Cash flows from investing activities primarily include capital expenditures, acquisitions of businesses and purchases and sales of available for sale securities. We used $23.3 million, $36.2 million and $64.8 million for the years ended December 31, 2016, 2015 and 2014, respectively, for capital expenditures primarily related to investments in the development of certain software applications, IT infrastructure and facility build-outs. The decreases in capital expenditures in 2016 and 2015 primarily related to the completion of projects in 2015 and 2014, including increased facility build-outs and several office facility relocations.
During the year ended December 31, 2016, we purchased 4.1 million shares of Residential common stock for $48.2 million, including brokers’ commissions. On July 29, 2016, we acquired Granite for $9.5 million.
On October 9, 2015, we acquired RentRange and Investability for $24.8 million. The purchase price was composed of $17.5 million in cash and $7.3 million of restricted common stock of the Company. On July 17, 2015, we acquired CastleLine for $33.4 million. This was composed of $11.2 million of cash at closing, excluding cash balances acquired of $1.1 million. Additionally, the acquisition included $10.5 million of cash that is payable over four years from the acquisition date and $14.4 million of restricted
47
common stock of the Company. Of the cash payable following acquisition, $3.8 million is contingent on certain future employment conditions of certain of the sellers, and therefore excluded from the purchase price.
During 2015, we purchased 1.6 million shares of HLSS common stock in the open market for $30.0 million. Also during 2015, we received liquidating dividends and other dividends from HLSS totaling $20.4 million and we sold all of our 1.6 million shares of HLSS common stock in the open market for $7.7 million.
On November 21, 2014, we acquired Owners for $19.8 million. On September 12, 2014, we acquired Mortgage Builder for $14.9 million, net of acquired cash of $0.7 million, and contingent consideration of up to $7.0 million.
Cash Flows from Financing Activities
Cash flows from financing activities for the year ended December 31, 2016 primarily included activities associated with share repurchases, debt repurchases and repayments, stock option exercises, an excess tax benefit on stock-based compensation and payments to non-controlling interests. During 2016, we used $37.7 million to repurchase shares of our common stock and used $50.7 million to repurchase portions of our senior secured term loan and make scheduled repayments of our senior secured term loan. Also during 2016, stock option exercises provided proceeds of $9.6 million, we distributed $2.6 million to non-controlling interests and recognized an excess tax benefit on the exercise of stock options of $4.8 million.
Cash flows from financing activities for the year ended December 31, 2015 primarily included activity associated with share repurchases, debt repurchases and repayments, stock option exercises and payments to non-controlling interests. For the year ended December 31, 2015, we spent $58.9 million to repurchase shares of our common stock and used $50.4 million to repurchase portions of our senior secured term loan and make scheduled repayments of our senior secured term loan. For the year ended December 31, 2015, stock option exercises provided proceeds of $1.4 million and we distributed $3.0 million to non-controlling interests.
Cash flows from financing activities for the year ended December 31, 2014 primarily included activity associated with debt proceeds, share repurchases, stock option exercises and payments to non-controlling interests. On August 1, 2014, we borrowed $200.0 million in connection with amending our senior secured term loan agreement, and received $198.0 million of cash proceeds net of a $2.0 million original issue discount. For the year ended December 31, 2014, we incurred debt issuance costs of $2.6 million in connection with the debt issuances. For the year ended December 31, 2014, we spent $255.7 million to repurchase shares of our common stock, we repaid $5.0 million of the borrowings under the senior secured term loan and distributed $2.6 million to non-controlling interests. Stock option exercises provided proceeds of $2.7 million.
Liquidity Requirements after December 31, 2016
In the fourth quarter of 2016, we recorded a litigation settlement loss of $28.0 million, net of a $4.0 million insurance recovery, related to the settlement of a class action lawsuit, subject to final court approval. We anticipate that payment related to this settlement will occur in mid-2017.
On September 12, 2014, we acquired certain assets and assumed certain liabilities of Mortgage Builder. The Mortgage Builder purchase and sale agreement provides for the payment of up to $7.0 million in potential additional consideration based on Adjusted Revenue (as defined in the purchase and sale agreement). As of December 31, 2016, we have recorded $0.4 million of potential additional consideration related to the Mortgage Builder acquisition. The amount ultimately paid will depend on Mortgage Builder’s Adjusted Revenue in the last of the three consecutive 12-month periods following acquisition.
On July 17, 2015, we acquired CastleLine. A portion of the purchase consideration totaling $10.5 million is payable to the sellers over four years from the acquisition date, including $3.8 million to be paid to certain of the sellers that is contingent on future employment. As of December 31, 2016, we have paid $2.9 million of the $10.5 million that is payable over four years from the acquisition date and $0 of the $3.8 million purchase consideration that is contingent on future employment.
During the first quarter of 2017, we expect to distribute $0.7 million to the Lenders One members representing non-controlling interests, repay $1.5 million of the senior secured term loan and pay $5.4 million of interest expense under the senior secured term loan agreement.
We believe that we will generate sufficient cash flows from operations to fund capital expenditures and required debt and interest payments for the next 12 months.
48
CRITICAL ACCOUNTING POLICIES, ESTIMATES AND RECENT ACCOUNTING PRONOUNCEMENTS
We prepare our consolidated financial statements in accordance with GAAP. In applying many of these accounting principles, we need to make assumptions, estimates and judgments that affect the reported amounts of assets, liabilities, revenue and expenses in our consolidated financial statements. We base our estimates and judgments on historical experience and other assumptions that we believe are reasonable under the circumstances. These assumptions, estimates and judgments, however, are often subjective. Actual results may be negatively affected based on changing circumstances. If actual amounts are ultimately different from our estimates, the revisions are included in our results of operations for the period in which the actual amounts become known.
We have identified the critical accounting policies and estimates addressed below. We also have other key accounting policies, which involve the use of assumptions, estimates and judgments that are significant to understanding our results. For additional information, see Note 2 to the consolidated financial statements. Although we believe that our assumptions, estimates and judgments are reasonable, they are based upon information presently available. Actual results may differ significantly from these estimates under different assumptions, judgments or conditions.
Revenue Recognition
We recognize revenue from the services we provide in accordance with ASC Topic 605, Revenue Recognition (“ASC Topic 605”). ASC Topic 605 sets forth guidance as to when revenue is realized or realizable and earned which is generally when all of the following criteria are met: (1) persuasive evidence of an arrangement exists; (2) delivery has occurred or services have been performed; (3) the seller’s price to the buyer is fixed or determinable; and (4) collectability is reasonably assured. Generally, the contract terms for these services are relatively short in duration, and we recognize revenue as the services are performed either on a per unit or a fixed price basis.
In the Mortgage Services segment, we recognize revenue for the majority of the services we provide when the services have been performed. For certain default management services, we recognize revenue over the period during which we perform the related services, with full recognition upon recording the related foreclosure deed. Significant areas of judgment include the period over which we recognize certain default management services revenue. For disbursement processing services, we recognize revenue over the period during which we perform the processing services with full recognition upon completion of the disbursements. We record revenue associated with fees earned on real estate sales other than our short-term investments in real estate on a net basis as we perform services as an agent without assuming the risks and rewards of ownership of the asset and the commission earned on the sale is a fixed percentage. For short-term investments in real estate, we record revenue in the amount of the selling price of the property upon the sale of the property.
In the Financial Services segment, we generally earn our fees for asset recovery management services as a percentage of the amount we collect on delinquent consumer receivables and charged-off mortgages on behalf of our clients and recognize revenue following collection from the debtors. We also earn fees for packaging and selling charged-off mortgages and recognize revenue after the sale of the notes and once the risks and rewards of the mortgage notes are transferred to the purchasers. In addition, we provide customer relationship management services for which we typically earn and recognize revenue on a per-person, per-call or per-minute basis as the related services are performed.
In the Technology Services segment, we charge fees for our software services based on the number of loans on the system or on a per-transaction basis. We record transactional revenue when the service is provided and other revenue monthly based on the number of loans processed or services provided. In addition, we charge fees for professional services engagements, which consist primarily of time and materials agreements with customers that are generally billed and recognized as the hours are worked. For Equator’s software applications, we recognize revenue from arrangements with multiple deliverables in accordance with ASC Subtopic 605-25, Revenue Recognition: Multiple-Element Arrangements (“ASC 605-25”), and Securities and Exchange Commission Staff Accounting Bulletin Topic 13, Revenue Recognition (“SAB Topic 13”). ASC 605-25 and SAB Topic 13 require each deliverable within a multiple-deliverable revenue arrangement to be accounted for as a separate unit if both of the following criteria are met: (1) the delivered item or items have value to the customer on a standalone basis and (2) for an arrangement that includes a general right of return relative to the delivered item(s), delivery or performance of the undelivered item(s) is considered probable and substantially in the seller’s control. Deliverables not meeting the criteria for accounting treatment as a separate unit are combined with a deliverable that meets that criterion. Equator derives its revenue from platform services fees, professional services fees and other services. Equator does not begin to recognize revenue for platform services fees until these fees become billable, as the services fees are not fixed and determinable until such time. Platform services fees are recognized ratably over the shorter of the term of the contract with the customer or the minimum cancellation period. Professional services fees consist primarily of configuration services related to customizing the platform for individual customers and are generally billed as the hours are worked. Due to the essential and specialized nature of the configuration services, these services do not qualify as separate units of accounting separate from the platform services as the delivered services do not have value to the customer on a standalone basis. Therefore, the related fees are recorded as deferred revenue until the project configuration is complete and then recognized
49
ratably over the longer of the term of the agreement or the estimated expected customer life. Other services consist primarily of training, including agent certification and consulting services. These services are generally sold separately and are recognized as revenue as the services are performed and earned. For Mortgage Builder software applications, we recognize subscription revenues ratably over the contract term, beginning on the commencement date of each contract. Revenues for usage-based transactions are generally recognized as the usage occurs, as that is the point when the fee becomes fixed or determinable. Mortgage Builder generally invoices customers on a monthly basis. We also provide IT infrastructure services and charge for these services primarily on a cost plus basis, based on the number of employees that are using the applicable systems and the number and type of licensed platforms used. We record revenue associated with implementation services upon completion of the services and we record revenue from maintenance activity ratably over the related service period.
Goodwill and Identifiable Intangible Assets
Goodwill
We evaluate goodwill for impairment annually during the fourth quarter or more frequently when an event occurs or circumstances change in a manner that indicates the carrying value may not be recoverable. We first assess qualitative factors to determine whether it is more likely than not that the fair value of a reporting unit is less than its carrying value as a basis for determining whether we need to perform the quantitative two-step goodwill impairment test. Only if we determine, based on a qualitative assessment, that it is more likely than not that a reporting unit’s fair value is less than its carrying value will we calculate the fair value of the reporting unit. We would then test goodwill for impairment by first comparing the book value of net assets to the fair value of the reporting units. If the fair value is determined to be less than the book value, a second step is performed to compute the amount of impairment as the difference between the estimated fair value of goodwill and the carrying value. We estimate the fair value of the reporting units using discounted cash flows and market comparisons. The discounted cash flow method is based on the present value of projected cash flows. Forecasts of future cash flows are based on our estimate of future sales and operating expenses, based primarily on estimated pricing, sales volumes, market segment share, cost trends and general economic conditions. Certain estimates of discounted cash flows involve businesses with limited financial history and developing revenue models. The estimated cash flows are discounted using a rate that represents our weighted average cost of capital. Market comparisons include an analysis of revenue and earnings multiples of guideline public companies compared to the Company.
In the second quarter of 2014, management determined that Equator goodwill should be tested for impairment as a result of the decline in the fair value of the Equator Earn Out (see Note 10 to the consolidated financial statements). Consequently, we initiated a quantitative two-step goodwill impairment test by comparing the carrying value of the net assets of Equator to its fair value based on a discounted cash flow analysis. Based on this goodwill assessment, we determined that the fair value of Equator was less than its carrying value and goodwill was impaired. Consequently, we recorded an impairment loss of $37.5 million.
During our fourth quarter 2014 and 2015 annual goodwill assessments, we elected to bypass the initial analysis of qualitative factors and perform a quantitative two-step goodwill impairment test of all of our reporting units as a result of an impairment of goodwill recorded in the second quarter of 2014. We calculated the fair value of each of our reporting units by using a discounted cash flow analysis and concluded that the fair values of the Mortgage Services, Financial Services and Technology Services reporting units exceeded their carrying values by a significant margin in 2014 and that the Mortgage Services and Financial Services reporting units exceeded their carrying values by a significant margin in 2015. In 2015, the fair value of the Technology Services reporting unit was less than its carrying value. Accordingly, we performed step two of the impairment test for the Technology Services reporting unit and determined that $55.7 million of goodwill was impaired. As a result, we recorded an estimated $55.7 million impairment loss in the fourth quarter of 2015. This goodwill impairment was primarily driven by the Company’s projected Technology Services revenue from Ocwen and investment in technologies provided to Ocwen. There were no additional goodwill impairments as of December 31, 2014 and 2015. Based on our fourth quarter 2016 goodwill assessment, we concluded that there was no impairment of goodwill for the year ended December 31, 2016.
Identifiable Intangible Assets
Identified intangible assets consist primarily of customer related intangible assets, operating agreements, trade names and trademarks and other intangible assets. We perform tests for impairment if conditions exist that indicate the carrying value may not be recoverable. When facts and circumstances indicate that the carrying value of intangible assets determined to have definite lives may not be recoverable, management assesses the recoverability of the carrying value by preparing estimates of cash flows of discrete intangible assets consistent with models utilized for internal planning purposes. If the sum of the undiscounted expected future cash flows is less than the carrying value, we would recognize an impairment to the extent the carrying amount exceeds fair value. In the fourth quarter of 2015, we recorded a non-cash impairment loss of $11.9 million in our Technology Services segment related to customer relationship intangible assets from the 2013 Homeward and ResCap fee-based business acquisitions. These impairments of intangible assets were primarily driven by the Company’s projected Technology Services revenue from
50
Ocwen and investment in technologies provided to Ocwen. There were no impairments of intangible assets for the years ended December 31, 2016 and 2014.
Acquisitions
For those acquisitions that meet the definition of a business combination, we allocate the purchase price, including any contingent consideration, to the assets acquired and the liabilities assumed at their estimated fair values as of the date of the acquisition with any excess of the purchase price paid over the estimated fair value of net assets acquired recorded as goodwill. The fair value of the assets acquired and liabilities assumed is typically determined by using either estimates of replacement costs or discounted cash flow valuation methods. When determining the fair value of tangible assets acquired, we estimate the cost to replace the asset with a new asset taking into consideration such factors as age, condition and the economic useful life of the asset. When determining the fair value of intangible assets acquired, we estimate the applicable discount rate and the timing and amount of future cash flows, including rate and terms of renewal and attrition. The determination of the final purchase price and the fair values on the acquisition date of the identifiable assets acquired and liabilities assumed may extend over more than one period and result in adjustments to the preliminary estimate recognized.
Accounting for Income Taxes
We record our income taxes in accordance with ASC Topic 740, Income Taxes. We are subject to income taxes principally in Luxembourg, the United States and India. Significant judgment is required in evaluating our tax positions and determining our provision for income taxes. During the ordinary course of business, there are many transactions and estimates for which the ultimate tax determination may vary from year to year. For example, our effective tax rates could be adversely affected by lower than anticipated earnings in countries where we have lower effective tax rates and higher than anticipated earnings in countries where we have higher effective tax rates, by changes in currency exchange rates or by changes in the relevant tax rate, accounting and other laws, regulations, principles and interpretations. We are subject to audits in various taxing jurisdictions, and such jurisdictions may assess additional income tax during an examination. Although we believe our recorded tax liabilities are sufficient to support our future tax liabilities, the final determination of tax audits and any related litigation could differ from the balances we have accrued.
Recently Adopted and Future Adoption of New Accounting Pronouncements
See Note 2 to the consolidated financial statements for a discussion of the recent adoption of a new accounting pronouncements and the future adoption of new accounting pronouncements.
OTHER MATTERS
Off-Balance Sheet Arrangements
Our off-balance sheet arrangements consist of escrow and trust arrangements and operating leases.
We hold customers’ assets in escrow and trust accounts at various financial institutions pending completion of certain real estate activities. We also hold cash in trust accounts at various financial institutions where contractual obligations mandate maintaining dedicated bank accounts for our Financial Services segment’s collections. These amounts are held in escrow and trust accounts for limited periods of time and are not included in the accompanying consolidated balance sheets. Amounts held in escrow and trust accounts were $64.1 million and $66.6 million at December 31, 2016 and 2015, respectively.
51
Contractual Obligations, Commitments and Contingencies
Our long-term contractual obligations generally include our long-term debt and operating lease payments on certain of our property and equipment. The following table sets forth information relating to our contractual obligations as of December 31, 2016:
Payments due by period | ||||||||||||||||||||
(in thousands) | Total | Less than 1 year | 1-3 years | 3-5 years | More than 5 years | |||||||||||||||
Non-cancelable operating lease obligations | $ | 56,152 | $ | 17,857 | $ | 24,266 | $ | 12,875 | $ | 1,154 | ||||||||||
Long-term debt | 479,653 | 5,945 | 11,890 | 461,818 | — | |||||||||||||||
Contractual interest payments(1) | 83,131 | 21,484 | 42,166 | 19,481 | — | |||||||||||||||
Total | $ | 618,936 | $ | 45,286 | $ | 78,322 | $ | 494,174 | $ | 1,154 | ||||||||||
______________________________________
(1) | Represents estimated future interest payments on our senior secured term loan based on applicable interest rates as of December 31, 2016. |
For further information, see Notes 13 and 23 to the consolidated financial statements.
Customer Concentration
Revenue from Ocwen primarily consists of revenue earned directly from Ocwen and revenue earned from the loans serviced by Ocwen when Ocwen designates us as the service provider. Revenue from Ocwen as a percentage of segment and consolidated revenue was as follows for the years ended December 31:
2016 | 2015 | 2014 | ||||
Mortgage Services | 60% | 63% | 67% | |||
Financial Services | 17% | 21% | 27% | |||
Technology Services | 42% | 54% | 42% | |||
Consolidated revenue | 56% | 60% | 60% | |||
For the years ended December 31, 2016, 2015 and 2014, we generated revenue from Ocwen of $561.9 million, $631.6 million and $650.7 million, respectively. Services provided to Ocwen during such periods and reported in the Mortgage Services segment included real estate asset management and sales, residential property valuation, trustee management services, property preservation and inspection services and insurance services. Services provided to Ocwen and reported in the Financial Services segment included mortgage charge-off collections. Services provided to Ocwen and reported in the Technology Services segment included IT infrastructure management and software applications.
We record revenue we earn from Ocwen under the Ocwen Service Agreements.
We earn additional revenue related to the portfolios serviced by Ocwen when a party other than Ocwen selects Altisource as the service provider. For the years ended December 31, 2016, 2015 and 2014, we recognized revenue of $188.0 million, $216.9 million and $256.0 million, respectively, related to the portfolios serviced by Ocwen when a party other than Ocwen selected Altisource as the service provider. These amounts are not included in deriving revenue from Ocwen as a percentage of revenue in the table above.
ITEM 7A. | QUANTITATIVE AND QUALITATIVE DISCLOSURES ABOUT MARKET RISK |
Market Risk
Our financial market risk consists primarily of interest rate and foreign currency exchange rate risk.
Interest Rate Risk
As of December 31, 2016, the interest rate charged on the senior secured term loan was 4.50%. The interest rate is calculated based on the Adjusted Eurodollar Rate (as defined in the senior secured term loan agreement) with a minimum floor of 1.00% plus 3.50%.
52
Based on the principal amount outstanding at December 31, 2016, a one percentage point increase in the Eurodollar rate would increase our annual interest expense by approximately $3.7 million, based on the December 31, 2016 Adjusted Eurodollar Rate. There would be no change in our annual interest expense if there was a one percentage point decrease in the Eurodollar Rate.
Currency Exchange Risk
We are exposed to currency risk from potential changes in currency values of our non-United States dollar denominated expenses, assets, liabilities and cash flows. Our most significant currency exposure relates to the Indian rupee. Based on expenses incurred in Indian rupees during 2016, a one percentage point increase or decrease in value of the Indian rupee in relation to the United States dollar would increase or decrease our annual expenses by approximately $1.1 million.
53
ITEM 8. | FINANCIAL STATEMENTS AND SUPPLEMENTARY DATA |
INDEX TO CONSOLIDATED FINANCIAL STATEMENTS
Page | |
54
Report of Independent Registered Public Accounting Firm
To the Board of Directors and
Shareholders of Altisource Portfolio Solutions S.A.:
We have audited the accompanying consolidated balance sheet of Altisource Portfolio Solutions S.A. and subsidiaries (the “Company”) as of December 31, 2016, and the related consolidated statements of operations and comprehensive income, equity, and cash flows for the year ended December 31, 2016. Our audit also included the financial statement schedule listed in the Index at Item 15 of the Form 10-K for the year ended December 31, 2016. The consolidated financial statements and financial statement schedule are the responsibility of the Company’s management. Our responsibility is to express an opinion on the consolidated financial statements and financial statement schedule based on our audit.
We conducted our audit in accordance with the standards of the Public Company Accounting Oversight Board (United States). Those standards require that we plan and perform the audit to obtain reasonable assurance about whether the consolidated financial statements are free of material misstatement. An audit includes examining, on a test basis, evidence supporting the amounts and disclosures in the consolidated financial statements. An audit also includes assessing the accounting principles used and significant estimates made by management, as well as evaluating the overall consolidated financial statement presentation. We believe that our audit provides a reasonable basis for our opinion.
In our opinion, the consolidated financial statements referred to above present fairly, in all material respects, the financial position of Altisource Portfolio Solutions S.A. and subsidiaries as of December 31, 2016 and the results of their operations and their cash flows for year ended December 31, 2016, in conformity with accounting principles generally accepted in the United States of America. Also, in our opinion, such financial statement schedule, when considered in relation to the basic consolidated financial statements taken as a whole, presents fairly, in all material respects, the information set forth therein.
As discussed in Note 3 to the consolidated financial statements, Ocwen Financial Corporation (“Ocwen”), is the Company’s largest customer. As discussed in Note 23 to the consolidated financial statements, Ocwen has been and is subject to a number of federal and state regulatory matters and is subject to other challenges and uncertainties that could have significant adverse effects on Ocwen’s business. Note 23 also discusses the potential implications of these uncertainties to the Company including the loss of Ocwen as a customer or a reduction in the number or volume of services Ocwen purchases from the Company.
We also have audited the adjustment to the 2015 consolidated financial statements to retrospectively apply the change in accounting for debt issuance costs, as described in Note 2 to the consolidated financial statements. In our opinion, such adjustments are appropriate and have been properly applied. We were not engaged to audit, review, or apply any procedures to the 2015 consolidated financial statements of the Company other than with respect to the adjustment and, accordingly, we do not express an opinion or any other form of assurance on the 2015 consolidated financial statements taken as a whole.
We also have audited, in accordance with the standards of the Public Company Accounting Oversight Board (United States), the Company’s internal control over financial reporting as of December 31, 2016, based on criteria established in Internal Control - Integrated Framework (2013) issued by the Committee of Sponsoring Organizations of the Treadway Commission, and our report dated February 16, 2017, expressed an unqualified opinion.
/s/ Mayer Hoffman McCann P.C.
February 16, 2017
Clearwater, Florida
55
Report of Independent Registered Public Accounting Firm
To the Board of Directors and
Shareholders of Altisource Portfolio Solutions S.A.:
We have audited the internal control over financial reporting of Altisource Portfolio Solution S.A. and subsidiaries (the “Company”) as of December 31, 2016, based on criteria established in Internal Control - Integrated Framework (2013) issued by the Committee of Sponsoring Organizations of the Treadway Commission. As described in Management’s Report on Internal Control over Financial Reporting, management excluded from its assessment the internal control over financial reporting for certain assets acquired and certain liabilities assumed of Granite Loan Management of Delaware, LLC, acquired on July 29, 2016, and whose financial statements constitute 2% of total assets and less than 1% of revenues as reflected in the consolidated financial statement amounts as of and for the year ended December 31, 2016. Accordingly, our audit did not include the internal control over financial reporting for certain assets acquired and certain liabilities assumed of Granite Loan Management of Delaware, LLC.
The Company’s management is responsible for maintaining effective internal control over financial reporting and for its assessment of the effectiveness of internal control over financial reporting included in the accompanying Management’s Report on Internal Control over Financial Reporting. Our responsibility is to express an opinion on the Company’s internal control over financial reporting based on our audit.
We conducted our audit in accordance with the standards of the Public Company Accounting Oversight Board (United States). Those standards require that we plan and perform the audit to obtain reasonable assurance about whether effective internal control over financial reporting was maintained in all material respects. Our audit of internal control over financial reporting included obtaining an understanding of internal control over financial reporting, assessing the risk that a material weakness exists, and testing and evaluating the design and operating effectiveness of internal control based on the assessed risk. Our audit also included performing such other procedures as we considered necessary in the circumstances. We believe that our audit provides a reasonable basis for our opinion.
A company’s internal control over financial reporting is a process designed to provide reasonable assurance regarding the reliability of financial reporting and the preparation of financial statements for external purposes in accordance with generally accepted accounting principles. A company’s internal control over financial reporting includes those policies and procedures that (1) pertain to the maintenance of records that, in reasonable detail, accurately and fairly reflect the transactions and dispositions of the assets of the company; (2) provide reasonable assurance that transactions are recorded as necessary to permit preparation of financial statements in accordance with generally accepted accounting principles, and that receipts and expenditures of the company are being made only in accordance with authorizations of management and directors of the company; and (3) provide reasonable assurance regarding prevention or timely detection of unauthorized acquisition, use, or disposition of the company’s assets that could have a material effect on the financial statements.
Because of its inherent limitations, internal control over financial reporting may not prevent or detect misstatements. Also, projections of any evaluation of effectiveness to future periods are subject to the risk that controls may become inadequate because of changes in conditions, or that the degree of compliance with the policies or procedures may deteriorate.
In our opinion, Altisource Portfolio Solutions S.A. and subsidiaries maintained, in all material respects, effective internal control over financial reporting as of December 31, 2016, based on criteria established in Internal Control - Integrated Framework (2013) issued by the Committee of Sponsoring Organizations of the Treadway Commission.
We have also audited, in accordance with the standards of the Public Company Accounting Oversight Board (United States), the consolidated balance sheet and the related consolidated statement of operations and comprehensive income, consolidated statement of equity, cash flows and financial statement schedule as of and for the year ended December 31, 2016 of the Company, and our report dated February 16, 2017, expressed an unqualified opinion on those financial statements and included an explanatory paragraph regarding concentration of revenue with Ocwen Financial Corporation (“Ocwen”), and an emphasis of matter paragraph related to uncertainties faced by Ocwen.
/s/ Mayer Hoffman McCann P.C.
February 16, 2017
Clearwater, Florida
56
Report of Independent Registered Public Accounting Firm
To the Board of Directors and Shareholders of Altisource Portfolio Solutions S.A.:
We have audited, before the effects of the adjustments to retrospectively apply the change in the application of ASU 2015-03 discussed in Note 2 to the consolidated financial statements, the accompanying consolidated balance sheet of Altisource Portfolio Solutions S.A. and subsidiaries (the “Company”) as of December 31, 2015, and the related consolidated statements of operations, equity and cash flows for each of the two years in the period ended December 31, 2015 (the 2015 and 2014 consolidated financial statements before the effects of the adjustments discussed in Note 2 to the consolidated financial statements are not presented herein). Our audits of the financial statements referred to in our aforementioned report also included the 2015 and 2014 information contained in the financial statement schedule listed in the Index at Item 15. These financial statements and financial statement schedule are the responsibility of the Company’s management. Our responsibility is to express an opinion on the financial statements and financial statement schedule based on our audits.
We conducted our audits in accordance with the standards of the Public Company Accounting Oversight Board (United States). Those standards require that we plan and perform the audit to obtain reasonable assurance about whether the financial statements are free of material misstatement. An audit includes examining, on a test basis, evidence supporting the amounts and disclosures in the financial statements. An audit also includes assessing the accounting principles used and significant estimates made by management, as well as evaluating the overall financial statement presentation. We believe that our audits provide a reasonable basis for our opinion.
In our opinion, such consolidated financial statements referred to above, before the effects of the adjustments to retrospectively apply the change in the application of ASU 2015-03 discussed in Note 2, present fairly, in all material respects, the financial position of Altisource Portfolio Solutions S.A. and subsidiaries as of December 31, 2015, and the results of their operations and their cash flows for each of the two years in the period ended December 31, 2015, in conformity with accounting principles generally accepted in the United States of America. Also, in our opinion, such financial statement schedule, when considered in relation to the basic consolidated financial statements taken as a whole, presents fairly, in all material respects, the information set forth therein.
As discussed in Note 23 to the consolidated financial statements, Ocwen Financial Corporation (“Ocwen”), is the Company’s largest customer. As discussed in Note 23 to the consolidated financial statements, Ocwen has been and is subject to a number of federal and state regulatory matters and is subject to other challenges and uncertainties that could have significant adverse effects on Ocwen’s business. Note 23 also discusses the potential implications of these uncertainties to the Company including the loss of Ocwen as a customer or a reduction in the number and/volume of services Ocwen purchases from the Company.
We were not engaged to audit, review, or apply any procedures to the adjustments to retrospectively apply the change in accounting due to the retrospective application of ASU 2015-03 discussed in Note 2 to the consolidated financial statements and, accordingly, we do not express an opinion or any other form of assurance about whether such retrospective adjustments are appropriate and have been properly applied. Those retrospective adjustments were audited by other auditors.
/s/ Deloitte & Touche LLP
Atlanta, Georgia
March 15, 2016
57
ALTISOURCE PORTFOLIO SOLUTIONS S.A.
Consolidated Balance Sheets
(in thousands, except per share data)
December 31, | ||||||||
2016 | 2015 | |||||||
ASSETS | ||||||||
Current assets: | ||||||||
Cash and cash equivalents | $ | 149,294 | $ | 179,327 | ||||
Available for sale securities | 45,754 | — | ||||||
Accounts receivable, net | 87,821 | 105,023 | ||||||
Prepaid expenses and other current assets | 42,608 | 21,751 | ||||||
Total current assets | 325,477 | 306,101 | ||||||
Premises and equipment, net | 103,473 | 119,121 | ||||||
Goodwill | 86,283 | 82,801 | ||||||
Intangible assets, net | 155,432 | 197,003 | ||||||
Deferred tax assets, net | 7,292 | 3,619 | ||||||
Other assets | 11,255 | 13,153 | ||||||
Total assets | $ | 689,212 | $ | 721,798 | ||||
LIABILITIES AND EQUITY | ||||||||
Current liabilities: | ||||||||
Accounts payable and accrued expenses | $ | 83,135 | $ | 91,871 | ||||
Accrued litigation settlement (Note 23) | 32,000 | — | ||||||
Current portion of long-term debt | 5,945 | 5,945 | ||||||
Deferred revenue | 8,797 | 15,060 | ||||||
Other current liabilities | 19,061 | 16,266 | ||||||
Total current liabilities | 148,938 | 129,142 | ||||||
Long-term debt, less current portion | 467,600 | 522,233 | ||||||
Other non-current liabilities | 10,480 | 18,153 | ||||||
Commitments, contingencies and regulatory matters (Note 23) | ||||||||
Equity: | ||||||||
Common stock ($1.00 par value; 25,413 shares authorized and issued and 18,774 outstanding as of December 31, 2016; 25,413 shares authorized and issued and 19,021 outstanding as of December 31, 2015) | 25,413 | 25,413 | ||||||
Additional paid-in capital | 107,288 | 96,321 | ||||||
Retained earnings | 333,786 | 369,270 | ||||||
Accumulated other comprehensive loss | (1,745 | ) | — | |||||
Treasury stock, at cost (6,639 shares as of December 31, 2016 and 6,392 shares as of December 31, 2015) | (403,953 | ) | (440,026 | ) | ||||
Altisource equity | 60,789 | 50,978 | ||||||
Non-controlling interests | 1,405 | 1,292 | ||||||
Total equity | 62,194 | 52,270 | ||||||
Total liabilities and equity | $ | 689,212 | $ | 721,798 | ||||
See accompanying notes to consolidated financial statements.
58
ALTISOURCE PORTFOLIO SOLUTIONS S.A.
Consolidated Statements of Operations and Comprehensive Income
(in thousands, except per share data)
For the years ended December 31, | ||||||||||||
2016 | 2015 | 2014 | ||||||||||
Revenue | $ | 997,303 | $ | 1,051,466 | $ | 1,078,916 | ||||||
Cost of revenue | 690,045 | 687,327 | 707,180 | |||||||||
Gross profit | 307,258 | 364,139 | 371,736 | |||||||||
Selling, general and administrative expenses | 214,155 | 220,868 | 201,733 | |||||||||
Litigation settlement loss, net of $4,000 insurance recovery (Note 23) | 28,000 | — | — | |||||||||
Impairment losses | — | 71,785 | 37,473 | |||||||||
Change in the fair value of Equator Earn Out | — | (7,591 | ) | (37,924 | ) | |||||||
Income from operations | 65,103 | 79,077 | 170,454 | |||||||||
Other income (expense), net: | ||||||||||||
Interest expense | (24,412 | ) | (28,208 | ) | (23,363 | ) | ||||||
Other income (expense), net | 3,630 | 2,191 | 174 | |||||||||
Total other income (expense), net | (20,782 | ) | (26,017 | ) | (23,189 | ) | ||||||
Income before income taxes and non-controlling interests | 44,321 | 53,060 | 147,265 | |||||||||
Income tax provision | (12,935 | ) | (8,260 | ) | (10,178 | ) | ||||||
Net income | 31,386 | 44,800 | 137,087 | |||||||||
Net income attributable to non-controlling interests | (2,693 | ) | (3,202 | ) | (2,603 | ) | ||||||
Net income attributable to Altisource | $ | 28,693 | $ | 41,598 | $ | 134,484 | ||||||
Earnings per share: | ||||||||||||
Basic | $ | 1.53 | $ | 2.13 | $ | 6.22 | ||||||
Diluted | $ | 1.46 | $ | 2.02 | $ | 5.69 | ||||||
Weighted average shares outstanding: | ||||||||||||
Basic | 18,696 | 19,504 | 21,625 | |||||||||
Diluted | 19,612 | 20,619 | 23,634 | |||||||||
Comprehensive income: | ||||||||||||
Net income | $ | 31,386 | $ | 44,800 | $ | 137,087 | ||||||
Other comprehensive loss, net of tax: | ||||||||||||
Unrealized loss on securities, net of income tax benefit of $720, $0, $0 | (1,745 | ) | — | — | ||||||||
Comprehensive income, net of tax | 29,641 | 44,800 | 137,087 | |||||||||
Comprehensive income attributable to non-controlling interests | (2,693 | ) | (3,202 | ) | (2,603 | ) | ||||||
Comprehensive income attributable to Altisource | $ | 26,948 | $ | 41,598 | $ | 134,484 | ||||||
Transactions with related parties included above: | ||||||||||||
Revenue | $ | — | See Note 4 | $ | 666,800 | |||||||
Cost of revenue | — | See Note 4 | 38,610 | |||||||||
Selling, general and administrative expenses | — | See Note 4 | (268 | ) | ||||||||
See accompanying notes to consolidated financial statements.
59
ALTISOURCE PORTFOLIO SOLUTIONS S.A.
Consolidated Statements of Equity
(in thousands)
Altisource Equity | Non-controlling interests | |||||||||||||||||||||||||||||
Common stock | Additional paid-in capital | Retained earnings | Accumulated other comprehensive loss | Treasury stock, at cost | Total | |||||||||||||||||||||||||
Shares | ||||||||||||||||||||||||||||||
Balance, January 1, 2014 | 25,413 | $ | 25,413 | $ | 89,273 | $ | 239,561 | $ | — | $ | (197,548 | ) | $ | 1,042 | $ | 157,741 | ||||||||||||||
Net income | — | — | — | 134,484 | — | — | 2,603 | 137,087 | ||||||||||||||||||||||
Distributions to non-controlling interest holders | — | — | — | — | — | — | (2,596 | ) | (2,596 | ) | ||||||||||||||||||||
Share-based compensation expense | — | — | 2,236 | — | — | — | — | 2,236 | ||||||||||||||||||||||
Exercise of stock options | — | — | — | (6,078 | ) | — | 8,766 | — | 2,688 | |||||||||||||||||||||
Repurchase of shares | — | — | — | — | — | (255,713 | ) | — | (255,713 | ) | ||||||||||||||||||||
Balance, December 31, 2014 | 25,413 | 25,413 | 91,509 | 367,967 | — | (444,495 | ) | 1,049 | 41,443 | |||||||||||||||||||||
Net income | — | — | — | 41,598 | — | — | 3,202 | 44,800 | ||||||||||||||||||||||
Distributions to non-controlling interest holders | — | — | — | — | — | — | (2,959 | ) | (2,959 | ) | ||||||||||||||||||||
Share-based compensation expense | — | — | 4,812 | — | — | — | — | 4,812 | ||||||||||||||||||||||
Exercise of stock options | — | — | — | (8,292 | ) | — | 9,682 | — | 1,390 | |||||||||||||||||||||
Issuance of restricted shares for acquisitions | — | — | — | (32,003 | ) | — | 53,736 | — | 21,733 | |||||||||||||||||||||
Repurchase of shares | — | — | — | — | — | (58,949 | ) | — | (58,949 | ) | ||||||||||||||||||||
Balance, December 31, 2015 | 25,413 | 25,413 | 96,321 | 369,270 | — | (440,026 | ) | 1,292 | 52,270 | |||||||||||||||||||||
Comprehensive income: | ||||||||||||||||||||||||||||||
Net income | — | — | — | 28,693 | — | — | 2,693 | 31,386 | ||||||||||||||||||||||
Other comprehensive loss, net of tax | — | — | — | — | (1,745 | ) | — | — | (1,745 | ) | ||||||||||||||||||||
Distributions to non-controlling interest holders | — | — | — | — | — | — | (2,580 | ) | (2,580 | ) | ||||||||||||||||||||
Share-based compensation expense | — | — | 6,188 | — | — | — | — | 6,188 | ||||||||||||||||||||||
Excess tax benefit on stock-based compensation | — | — | 4,779 | — | — | — | — | 4,779 | ||||||||||||||||||||||
Exercise of stock options | — | — | — | (64,177 | ) | — | 73,735 | — | 9,558 | |||||||||||||||||||||
Repurchase of shares | — | — | — | — | — | (37,662 | ) | — | (37,662 | ) | ||||||||||||||||||||
Balance, December 31, 2016 | 25,413 | $ | 25,413 | $ | 107,288 | $ | 333,786 | $ | (1,745 | ) | $ | (403,953 | ) | $ | 1,405 | $ | 62,194 | |||||||||||||
See accompanying notes to consolidated financial statements.
60
ALTISOURCE PORTFOLIO SOLUTIONS S.A.
Consolidated Statements of Cash Flows
(in thousands)
For the years ended December 31, | |||||||||||
2016 | 2015 | 2014 | |||||||||
Cash flows from operating activities: | |||||||||||
Net income | $ | 31,386 | $ | 44,800 | $ | 137,087 | |||||
Adjustments to reconcile net income to net cash provided by operating activities: | |||||||||||
Depreciation and amortization | 36,788 | 36,470 | 29,046 | ||||||||
Amortization of intangible assets | 47,576 | 41,135 | 37,680 | ||||||||
Loss on HLSS equity securities and dividends received, net | — | 1,854 | — | ||||||||
Change in the fair value of acquisition related contingent consideration | (3,555 | ) | (7,184 | ) | (37,924 | ) | |||||
Impairment losses | — | 71,785 | 37,473 | ||||||||
Share-based compensation expense | 6,188 | 4,812 | 2,236 | ||||||||
Bad debt expense | 1,829 | 5,514 | 16,257 | ||||||||
Gain on early extinguishment of debt | (5,464 | ) | (3,836 | ) | — | ||||||
Amortization of debt discount | 413 | 498 | 317 | ||||||||
Amortization of debt issuance costs | 1,141 | 1,374 | 1,151 | ||||||||
Deferred income taxes | (2,597 | ) | (1,326 | ) | 1,166 | ||||||
Loss on disposal of fixed assets | 1,765 | 26 | 184 | ||||||||
Changes in operating assets and liabilities, net of effects of acquisitions: | |||||||||||
Accounts receivable | 15,980 | 2,401 | (22,492 | ) | |||||||
Prepaid expenses and other current assets | (20,881 | ) | 1,883 | (12,501 | ) | ||||||
Other assets | 1,053 | 2,993 | (1,750 | ) | |||||||
Accounts payable and accrued expenses | (9,113 | ) | (14,483 | ) | 24,285 | ||||||
Other current and non-current liabilities | 24,309 | 6,636 | (14,722 | ) | |||||||
Net cash provided by operating activities | 126,818 | 195,352 | 197,493 | ||||||||
Cash flows from investing activities: | |||||||||||
Additions to premises and equipment | (23,269 | ) | (36,188 | ) | (64,846 | ) | |||||
Acquisition of businesses, net of cash acquired | (9,409 | ) | (28,675 | ) | (34,720 | ) | |||||
Purchase of available for sale securities | (48,219 | ) | (29,966 | ) | — | ||||||
Proceeds received from sale of and dividends from HLSS equity securities | — | 28,112 | — | ||||||||
Change in restricted cash | 674 | 722 | (1,402 | ) | |||||||
Other investing activities | — | — | (300 | ) | |||||||
Net cash used in investing activities | (80,223 | ) | (65,995 | ) | (101,268 | ) | |||||
Cash flows from financing activities: | |||||||||||
Proceeds from issuance of long-term debt | — | — | 198,000 | ||||||||
Repayment and repurchases of long-term debt | (50,723 | ) | (50,373 | ) | (4,959 | ) | |||||
Debt issuance costs | — | — | (2,608 | ) | |||||||
Proceeds from stock option exercises | 9,558 | 1,390 | 2,688 | ||||||||
Excess tax benefit on stock-based compensation | 4,779 | — | — | ||||||||
Purchase of treasury stock | (37,662 | ) | (58,949 | ) | (255,713 | ) | |||||
Distributions to non-controlling interests | (2,580 | ) | (2,959 | ) | (2,596 | ) | |||||
Other financing activities | — | (500 | ) | — | |||||||
Net cash used in financing activities | (76,628 | ) | (111,391 | ) | (65,188 | ) | |||||
Net (decrease) increase in cash and cash equivalents | (30,033 | ) | 17,966 | 31,037 | |||||||
Cash and cash equivalents at the beginning of the period | 179,327 | 161,361 | 130,324 | ||||||||
Cash and cash equivalents at the end of the period | $ | 149,294 | $ | 179,327 | $ | 161,361 | |||||
Supplemental cash flow information: | |||||||||||
Interest paid | $ | 22,717 | $ | 26,274 | $ | 21,829 | |||||
Income taxes paid, net | 18,327 | 9,725 | 13,340 | ||||||||
Non-cash investing and financing activities: | |||||||||||
Acquisition of businesses with restricted shares | $ | — | $ | 21,733 | $ | — | |||||
Increase (decrease) in payables for purchases of premises and equipment | 404 | (6,679 | ) | (2,328 | ) | ||||||
Decrease in acquisition of businesses from subsequent working capital true-ups | — | — | (3,711 | ) | |||||||
See accompanying notes to consolidated financial statements.
61
NOTE 1 — ORGANIZATION
Description of Business
Altisource Portfolio Solutions S.A., together with its subsidiaries (which may be referred to as “Altisource,” the “Company,” “we,” “us” or “our”), is a premier marketplace and transaction solutions provider for the real estate, mortgage and consumer debt industries. Altisource’s proprietary business processes, vendor and electronic payment management software and behavioral science-based analytics improve outcomes for marketplace participants.
We conduct our operations through three reportable segments: Mortgage Services, Financial Services and Technology Services. In addition, we report our corporate related expenditures and eliminations separately (see Note 24 for a description of our business segments).
NOTE 2 — BASIS OF PRESENTATION AND SUMMARY OF SIGNIFICANT ACCOUNTING POLICIES
Basis of Accounting and Presentation - The consolidated financial statements are prepared in accordance with accounting principles generally accepted in the United States of America (“GAAP”). Intercompany transactions and accounts have been eliminated in consolidation.
Principles of Consolidation - The financial statements include the accounts of the Company, its wholly-owned subsidiaries and those entities in which we have a variable interest and are the primary beneficiary.
Altisource consolidates two cooperative entities which are managed by The Mortgage Partnership of America, L.L.C. (“MPA”), a wholly-owned subsidiary of Altisource: Best Partners Mortgage Cooperative, Inc., a mortgage cooperative doing business as Lenders One® (“Lenders One”) and Best Partners Mortgage Brokers Cooperative, Inc., a mortgage cooperative doing business as Wholesale One® (“Wholesale One”). MPA provides services to Lenders One under a management agreement that ends on December 31, 2025 (with renewals for three successive five-year periods at MPA’s option) and to Wholesale One under a management agreement that ends on July 8, 2039 (with automatic renewals for three successive five-year periods).
The management agreements between MPA and Lenders One and between MPA and Wholesale One, pursuant to which MPA is the management company, represent variable interests in variable interest entities. MPA is the primary beneficiary of Lenders One and Wholesale One as it has the power to direct the activities that most significantly impact each of these cooperatives’ economic performance and the right to receive benefits from each of these cooperatives. As a result, Lenders One and Wholesale One are presented in the accompanying condensed consolidated financial statements on a consolidated basis and the interests of the members are reflected as non-controlling interests. As of December 31, 2016, Lenders One had total assets of $3.8 million and total liabilities of $1.5 million. As of December 31, 2015, Lenders One had total assets of $4.9 million and total liabilities of $3.7 million. As of December 31, 2016 and December 31, 2015, Wholesale One had less than $0.1 million in total assets and less than $0.1 million in total liabilities.
Use of Estimates - The preparation of financial statements in conformity with GAAP requires estimates and assumptions that affect the reported amounts of assets and liabilities, revenue and expenses and related disclosures of contingent liabilities in the consolidated financial statements and accompanying notes. Estimates are used for, but not limited to, determining share-based compensation, income taxes, collectability of receivables, valuation of acquired intangibles and goodwill, depreciable lives and valuation of fixed assets and contingencies. Actual results could differ materially from those estimates.
Cash and Cash Equivalents - We classify all highly liquid instruments with an original maturity of three months or less at the time of purchase as cash equivalents.
Accounts Receivable, Net - Accounts receivable are presented net of an allowance for doubtful accounts that represents an amount that we estimate to be uncollectible. We have estimated the allowance for doubtful accounts based on our historical write-offs, our analysis of past due accounts based on the contractual terms of the receivables and our assessment of the economic status of our customers, if known. The carrying value of accounts receivable, net, approximates fair value.
62
ALTISOURCE PORTFOLIO SOLUTIONS S.A.
Notes to Consolidated Financial Statements (Continued)
Premises and Equipment, Net - We report premises and equipment, net at cost or estimated fair value at acquisition for premises and equipment recorded in connection with a business combination and depreciate these assets over their estimated useful lives using the straight-line method as follows:
Furniture and fixtures | 5 years |
Office equipment | 5 years |
Computer hardware | 5 years |
Computer software | 3-7 years |
Leasehold improvements | Shorter of useful life, 10 years or the term of the lease |
Maintenance and repair costs are expensed as incurred. We capitalize expenditures for significant improvements and new equipment and depreciate the assets over the shorter of the capitalized asset’s life or the life of the lease.
We review premises and equipment for impairment whenever events or changes in circumstances indicate that the carrying amount of an asset or asset group may not be recoverable. We measure recoverability of assets to be held and used by comparing the carrying amount of an asset or asset group to estimated undiscounted future cash flows expected to be generated by the asset or asset group. If the carrying amount of an asset or asset group exceeds its estimated future cash flows, we recognize an impairment charge for the amount that the carrying value of the asset or asset group exceeds the fair value of the asset or asset group. There were no impairments of premises and equipment for the years ended December 31, 2016 and 2014. For the year ended December 31, 2015, we recognized a $4.1 million premises and equipment impairment loss. See Note 9 for additional information.
Computer software includes the fair value of software acquired in business combinations, capitalized software development costs and purchased software. Capitalized software development and purchased software are recorded at cost and amortized using the straight-line method over its estimated useful life. Software acquired in business combinations is recorded at its fair value and amortized using the straight-line method over its estimated useful life.
Business Combinations - We account for acquisitions using the purchase method of accounting in accordance with Financial Accounting Standards Board (“FASB”) Accounting Standards Codification (“ASC”) Topic 805, Business Combinations. The purchase price of an acquisition is allocated to the assets acquired and liabilities assumed using their fair value as of the acquisition date.
Goodwill - Goodwill represents the excess cost of an acquired business over the fair value of the identifiable tangible and intangible assets acquired and liabilities assumed in a business combination. We evaluate goodwill for impairment annually during the fourth quarter or more frequently when an event occurs or circumstances change in a manner that indicates the carrying value may not be recoverable. We first assess qualitative factors to determine whether it is more likely than not that the fair value of a reporting unit is less than its carrying value as a basis for determining whether we need to perform the quantitative two-step goodwill impairment test. Only if we determine, based on qualitative assessment, that it is more likely than not that a reporting unit’s fair value is less than its carrying value will we calculate the fair value of the reporting unit. We would then test goodwill for impairment by first comparing the book value of net assets to the fair value of the reporting units. If the fair value is determined to be less than the book value, a second step is performed to compute the amount of impairment as the difference between the estimated fair value of goodwill and the carrying value. We estimate the fair value of the reporting units using discounted cash flows and market comparisons. The discounted cash flow method is based on the present value of projected cash flows. Forecasts of future cash flows are based on our estimate of future sales and operating expenses, based primarily on estimated pricing, sales volumes, market segment share, cost trends and general economic conditions. Certain estimates of discounted cash flows involve businesses with limited financial history and developing revenue models. The estimated cash flows are discounted using a rate that represents our weighted average cost of capital. The market comparisons include an analysis of revenue and earnings multiples of guideline public companies compared to the Company. There were no impairments of goodwill for the year ended December 31, 2016. For the years ended December 31, 2015 and 2014, we recognized goodwill impairment losses of $55.7 million and $37.5 million, respectively. See Note 10 for additional information.
Intangible Assets, Net - Identified intangible assets consist primarily of customer related intangible assets, operating agreements, trademarks and trade names and other intangible assets. Identifiable intangible assets acquired in business combinations are recorded based on their fair values at the date of acquisition. We determine the useful lives of our identifiable intangible assets after considering the specific facts and circumstances related to each intangible asset. Factors we consider when determining useful lives include the contractual term of any arrangements, the history of the asset, our long-term strategy for use of the asset and other economic factors. We amortize intangible assets that we deem to have definite lives in proportion to actual and expected customer revenues or on a straight-line basis over their useful lives, generally ranging from 4 to 20 years.
63
ALTISOURCE PORTFOLIO SOLUTIONS S.A.
Notes to Consolidated Financial Statements (Continued)
We perform tests for impairment if conditions exist that indicate the carrying value may not be recoverable. When facts and circumstances indicate that the carrying value of intangible assets determined to have definite lives may not be recoverable, management assesses the recoverability of the carrying value by preparing estimates of cash flows of discrete intangible assets consistent with models utilized for internal planning purposes. If the sum of the undiscounted expected future cash flows is less than the carrying value, we would recognize an impairment to the extent the carrying amount exceeds fair value. There were no impairments of intangible assets for the years ended December 31, 2016 and 2014. For the year ended December 31, 2015, we recognized impairments of intangible assets of $11.9 million. See Note 10 for additional information on impairments.
Long-Term Debt - Long-term debt is reported net of applicable discount or premium and net of debt issuance costs. The debt discount or premium and debt issuance costs are amortized to interest expense through maturity of the related debt using the effective interest method.
Fair Value Measurements - Fair value is defined as an exit price, representing the amount that would be received for an asset or paid to transfer a liability in an orderly transaction between market participants at the measurement date. The three-tier hierarchy for inputs used in measuring fair value, which prioritizes the inputs used in the methodologies of measuring fair value for assets and liabilities, is as follows:
Level 1 — Quoted prices in active markets for identical assets and liabilities
Level 2 — Observable inputs other than quoted prices included in Level 1
Level 3 — Unobservable inputs that are supported by little or no market activity and that are significant to the fair value of assets or liabilities.
Financial assets and financial liabilities are classified based on the lowest level of input that is significant to the fair value measurements. Our assessment of the significance of a particular input to the fair value measurements requires judgment and may affect the valuation of the assets and liabilities being measured and their placement within the fair value hierarchy.
Functional Currency - The currency of the primary economic environment in which our operations are conducted is the United States dollar. Therefore, the United States dollar has been determined to be our functional and reporting currency. Non-United States dollar transactions and balances have been measured in United States dollars in accordance with ASC Topic 830, Foreign Currency Matters. All transaction gains and losses from the measurement of monetary balance sheet items denominated in non-United States dollar currencies are reflected in the consolidated statements of operations and comprehensive income as income or expenses, as appropriate.
Defined Contribution 401(k) Plan - Some of our employees currently participate in a defined contribution 401(k) plan under which we may make matching contributions equal to a discretionary percentage determined by us. We recorded expenses of $1.2 million, $1.0 million and $0.9 million for the years ended December 31, 2016, 2015 and 2014, respectively, related to our discretionary contributions.
Share-Based Compensation - Share-based compensation is accounted for under the provisions of ASC Topic 718, Compensation - Stock Compensation. Under ASC Topic 718, the cost of services received in exchange for an award of equity instruments is generally measured based on the grant date fair value of the award. Share-based awards that do not require future service are expensed immediately. Share-based awards that require future service are recognized over the relevant service period. Further, as required under ASC Topic 718, we estimate forfeitures for share-based awards that are not expected to vest.
Earnings Per Share - We compute earnings per share (“EPS”) in accordance with ASC Topic 260, Earnings Per Share. Basic net income per share is computed by dividing net income attributable to Altisource by the weighted average number of shares of common stock outstanding for the period. Diluted net income per share reflects the assumed conversion of all dilutive securities using the treasury stock method.
Revenue Recognition - We recognize revenue from the services we provide in accordance with ASC Topic 605, Revenue Recognition. ASC Topic 605 sets forth guidance as to when revenue is realized or realizable and earned, which is generally when all of the following criteria are met: (1) persuasive evidence of an arrangement exists; (2) delivery has occurred or services have been performed; (3) the seller’s price to the buyer is fixed or determinable; and (4) collectability is reasonably assured. Generally, the contract terms for these services are relatively short in duration, and we recognize revenue as the services are performed either on a per unit or a fixed price basis. Specific policies for each of our reportable segments are as follows:
Mortgage Services segment: We recognize revenue for the majority of the services we provide when the services have been performed. For certain default management services, we recognize revenue over the period during which we perform the related services, with full recognition upon recording the related foreclosure deed. A significant area of judgment includes the period over which we recognize certain default management services revenue. For disbursement processing services, we
64
ALTISOURCE PORTFOLIO SOLUTIONS S.A.
Notes to Consolidated Financial Statements (Continued)
recognize revenue over the period during which we perform the processing services with full recognition upon completion of the disbursements. We record revenue associated with fees earned on real estate sales other than our short-term investments in real estate on a net basis as we perform services as an agent without assuming the risks and rewards of ownership of the asset and the commission earned on the sale is a fixed percentage. For short-term investments in real estate, we record revenue in the amount of the selling price of the property upon the sale of the property. Reimbursable expenses of $51.9 million, $107.2 million and $137.4 million incurred for the years ended December 31, 2016, 2015 and 2014, respectively, are included in revenue with an equal offsetting expense included in cost of revenue primarily related to our default management services. These amounts are recognized on a gross basis, principally because we have complete control over selection of vendors and the vendor relationship is with us, rather than with our customers.
Financial Services segment: We generally earn our fees for asset recovery management services as a percentage of the amount we collect on delinquent consumer receivables and charged-off mortgages on behalf of our clients and recognize revenue following collection from the debtors. We also earn fees for packaging and selling charged-off mortgages and recognize revenue after the sale of the notes and once the risks and rewards of the mortgage notes are transferred to the purchasers. In addition, we provide customer relationship management services for which we typically earn and recognize revenue on a per-person, per-call or per-minute basis as the related services are performed.
Technology Services segment: For our software services, we charge fees based on the number of loans on the system or on a per-transaction basis. We record transactional revenue when the service is provided and other revenue monthly based on the number of loans processed or services provided. In addition, we charge fees for professional services engagements, which consist primarily of time and materials agreements with customers that are generally billed and recognized as the hours are worked.
For Equator software applications, we recognize revenue from arrangements with multiple deliverables in accordance with ASC Subtopic 605-25, Revenue Recognition: Multiple-Element Arrangements (“ASC 605-25”), and Securities and Exchange Commission (“SEC”) Staff Accounting Bulletin Topic 13, Revenue Recognition (“SAB Topic 13”). ASC 605-25 and SAB Topic 13 require each deliverable within a multiple-deliverable revenue arrangement to be accounted for as a separate unit if both of the following criteria are met: (1) the delivered item or items have value to the customer on a standalone basis and (2) for an arrangement that includes a general right of return relative to the delivered item(s), delivery or performance of the undelivered item(s) is considered probable and substantially in the seller’s control. Deliverables not meeting the criteria for accounting treatment as a separate unit are combined with a deliverable that meets that criterion. We derive revenue from platform services fees, professional services fees and other services. We do not begin to recognize revenue for platform services fees until these fees become billable, as the services fees are not fixed and determinable until such time. Platform services fees are recognized ratably over the shorter of the term of the contract with the customer or the minimum cancellation period. Professional services fees consist primarily of configuration services related to customizing the platform for individual customers and are generally billed as the hours are worked. Due to the essential and specialized nature of the configuration services, these services do not qualify as separate units of accounting separate from the platform services as the delivered services do not have value to the customer on a standalone basis. Therefore, the related fees are recorded as deferred revenue until the project configuration is complete and then recognized ratably over the longer of the term of the agreement or the estimated expected customer life. Other services consist primarily of training, including agent certification, and consulting services. These services are generally sold separately and are recognized as revenue as the services are performed and earned.
For Mortgage Builder software applications, we recognize subscription revenues ratably over the contract term, beginning on the commencement date of each contract. Revenues for usage-based transactions are generally recognized as the usage occurs, as that is the point when the fee becomes fixed or determinable. We generally invoice customers on a monthly basis.
We currently provide information technology (“IT”) infrastructure services to Ocwen Financial Corporation (“Ocwen”), Altisource Residential Corporation (“Residential”) and Altisource Asset Management Corporation (“AAMC”) and charge for these services primarily based on the number of employees that are using the applicable systems and the number and type of licensed platforms used by Ocwen, Residential and AAMC. We record revenue associated with implementation services upon completion and maintenance ratably over the related service period.
Income Taxes - We record income taxes in accordance with ASC Topic 740, Income Taxes (“ASC Topic 740”). We account for certain income and expense items differently for financial reporting purposes and income tax purposes. We recognize deferred income tax assets and liabilities for these differences between the financial reporting basis and the tax basis of our assets and liabilities as well as expected benefits of utilizing net operating loss and credit carryforwards. The most significant temporary differences relate to accrued compensation, amortization and loss and credit carryforwards. We measure deferred income tax assets and liabilities using enacted tax rates expected to apply to taxable income in the years in which we anticipate recovery or settlement of those temporary differences. The effect on deferred tax assets and liabilities of a change in tax rates is recognized
65
ALTISOURCE PORTFOLIO SOLUTIONS S.A.
Notes to Consolidated Financial Statements (Continued)
in income in the period when the change is enacted. Deferred tax assets are reduced by a valuation allowance when it is more likely than not that some portion or all of the deferred tax assets will not be realized.
In 2015, the Company early-adopted FASB Accounting Standards Update (“ASU”) No. 2015-17, Income Taxes (Topic 740): Balance Sheet Classification of Deferred Taxes. This standard simplifies the presentation of deferred taxes by requiring that deferred tax assets and deferred tax liabilities be classified as non-current in an entity’s balance sheet. We adopted this standard prospectively. Accordingly, prior periods were not retrospectively adjusted.
Tax laws are complex and subject to different interpretations by the taxpayer and respective governmental taxing authorities. Significant judgment is required in determining tax expense and in evaluating tax positions including evaluating uncertainties under ASC Topic 740. We recognize tax benefits from uncertain tax positions only if it is more likely than not that the tax position will be sustained on examination by the taxing authorities based on the technical merits of the position. The tax benefits recognized in the financial statements from such positions are then measured based on the largest benefit that has a greater than 50% likelihood of being realized upon ultimate settlement. Resolution of these uncertainties in a manner inconsistent with management’s expectations could have a material impact on our results of operations.
Recently Adopted Accounting Pronouncements
On January 1, 2016, FASB ASU No. 2015-02, Consolidation (Topic 810): Amendments to the Consolidation Analysis, became effective. This standard addresses the consolidation of certain legal entities relative to current requirements under GAAP. Specifically, the standard pertains to a reporting entity’s consolidation of another legal entity in situations in which the reporting entity’s contractual rights do not give it the ability to act primarily on its own behalf, the reporting entity does not hold a majority of the legal entity’s voting rights or the reporting entity is not exposed to a majority of the legal entity’s economic benefits or obligations. The adoption of this standard did not have an impact on the Company’s consolidated financial statements.
On January 1, 2016, FASB ASU No. 2015-03, Interest-Imputation of Interest (Subtopic 835-30): Simplifying the Presentation of Debt Issuance Costs became effective. As a result of this accounting change, the Company now presents debt issuance costs, net as a direct deduction from the related debt (see Note 13). Prior to January 1, 2016, debt issuance costs, net were included in other assets. We adopted the standard retrospectively. Accordingly, prior period amounts were reclassified to conform to the current presentation.
On January 1, 2016, FASB ASU No. 2015-16, Business Combinations (Topic 805): Simplifying the Accounting for Measurement-Period Adjustments became effective. This standard requires that adjustments to provisional amounts that are identified during the measurement period are recognized in the reporting period in which the adjustment amounts are determined rather than recognizing the adjustments retrospectively. The standard also requires that the acquirer records, in the same period’s financial statements, the effect on earnings of changes in depreciation, amortization or other income effects, if any, calculated as if the accounting had been completed at the acquisition date. The adoption of this standard did not have a significant impact on the Company’s consolidated financial statements.
Future Adoption of New Accounting Pronouncements
In May 2014, FASB issued ASU No. 2014-09, Revenue from Contracts with Customers (Topic 606). This standard establishes a single comprehensive model for entities to use in accounting for revenue arising from contracts with customers and supersedes most current revenue recognition guidance. The core principle of this new standard is an entity should recognize revenue to depict the transfer of promised goods or services to customers in an amount that reflects the consideration to which the entity expects to be entitled in exchange for those goods or services. This standard will be effective for annual periods beginning after December 15, 2017, including interim periods within that reporting period. Early adoption is permitted, although not prior to annual periods beginning after December 15, 2016. The Company is currently evaluating the impact of this guidance on its results of operations and financial position. Based on the Company’s preliminary analysis of over 90% of its revenue from customers for the year ended December 31, 2016, the Company estimated that less than 5% of consolidated revenue, primarily related to software development professional services, would likely be deferred and recognized over future periods under the new standard. The Company will continue to analyze the impact of this guidance and refine the estimated impact on its results of operations and financial position.
In January 2016, FASB issued ASU No. 2016-01, Financial Instruments - Overall (Subtopic 825-10): Recognition and Measurement of Financial Assets and Financial Liabilities. This standard will require equity investments (except those accounted for under the equity method of accounting or those that result in consolidation of the investee) to be measured at fair value with changes in fair value recognized in net income. The standard also simplifies the impairment assessment of equity investments without readily determinable fair values by requiring a qualitative assessment to identify impairment. When a qualitative assessment indicates that impairment exists, an entity is required to measure the investment at fair value. It also amends certain financial statement
66
ALTISOURCE PORTFOLIO SOLUTIONS S.A.
Notes to Consolidated Financial Statements (Continued)
presentation and disclosure requirements associated with the fair value of financial instruments. This standard will be effective for annual periods beginning after December 15, 2017, including interim periods within that reporting period. Early adoption is not permitted. The Company is currently evaluating the impact of this guidance on its results of operations and financial position. Based on the Company’s preliminary analysis of this guidance, upon adoption of ASU No. 2016-01 the Company will reflect changes in the fair value of its available for sale securities in income. These changes in fair value are currently reflected in other comprehensive income. The Company will continue to analyze the impact of this guidance and refine the estimated impact on its results of operations and financial position.
In February 2016, FASB issued ASU No. 2016-02, Leases (Topic 842). This standard introduces a new lessee model that brings substantially all leases on the balance sheet. The standard will require companies to recognize lease assets and lease liabilities on their balance sheets and disclose key information about leasing arrangements in their financial statements. This standard will be effective for annual periods beginning after December 15, 2018, including interim periods within that reporting period. Early application of this standard is permitted. The Company is currently evaluating the impact of this guidance on its results of operations and financial position. Based on the Company’s preliminary analysis of its lease arrangements as of December 31, 2016 where the Company is a lessee, the impact of adopting the new standard is primarily related to office leases, which would be recorded as right-of-use assets and lease liabilities on the Company’s balance sheet under the new standard. The Company will continue to analyze the impact of this guidance and refine the estimated impact on its results of operations and financial position.
In March 2016, the FASB issued ASU No. 2016-08, Revenue from Contracts with Customers (Topic 606): Principal versus Agent Considerations (Reporting Revenue Gross versus Net). This standard clarifies guidance on principal versus agent considerations in connection with revenue recognition. When another party is involved in providing goods or services to a customer, an entity is required to determine whether the nature of its promise is to provide the specified good or service itself (that is, the entity is a principal) or to arrange for that good or service to be provided by the other party (that is, the entity is an agent). An entity is a principal if it controls the specified good or service before that good or service is transferred to a customer. The guidance includes indicators to assist an entity in determining whether it controls a specified good or service before it is transferred to the customer. This standard will be effective for annual periods beginning after December 15, 2017, including interim periods within that reporting period. Early adoption is permitted, although not prior to annual periods beginning after December 15, 2016. The Company is currently evaluating the impact this guidance may have on its results of operations and financial position in connection with its adoption of ASU No. 2014-09, Revenue from Contracts with Customers (Topic 606), as described above.
In March 2016, the FASB issued ASU No. 2016-09, Compensation - Stock Compensation (Topic 718): Improvements to Employee Share-Based Payment Accounting. This standard simplifies several aspects of the accounting for share-based payment transactions, including the income tax consequences, classification of awards as either equity or liabilities and classification on the statement of cash flows. The standard will require companies to recognize all award-related excess tax benefits and tax deficiencies in their income statements, classify any excess tax benefits as an operating activity in their statements of cash flows, provide companies with the option of estimating forfeitures or recognizing forfeitures as they occur, modify the statutory tax withholding requirements and classify cash paid by employers when directly withholding shares for tax withholding purposes as an investing activity in their statements of cash flows. This standard will be effective for annual periods beginning after December 15, 2016, including interim periods within that reporting period. Early application of this standard is permitted. The Company is completing its evaluation of the impact of this guidance on its results of operations and financial position. Based on the Company’s preliminary analysis of the income tax impact of this guidance and the impact of estimating or recognizing forfeitures as they occur, the Company does not expect the adoption of this guidance to have a material effect on its results of operations and financial position.
In April 2016, the FASB issued ASU No. 2016-10, Revenue from Contracts with Customers (Topic 606): Identifying Performance Obligations and Licensing. This standard provides guidance on identifying performance obligations in a contract with a customer and clarifying several licensing considerations, including whether an entity’s promise to grant a license provides a customer with either a right to use the entity’s intellectual property (which is satisfied at a point in time) or a right to access the entity’s intellectual property (which is satisfied over time) and guidance on sales-based and usage-based royalties. This standard will be effective for annual periods beginning after December 15, 2017, including interim periods within that reporting period. Early adoption is permitted, although not prior to annual periods beginning after December 15, 2016. The Company is currently evaluating the impact this guidance may have on its results of operations and financial position in connection with its adoption of ASU No. 2014-09, Revenue from Contracts with Customers (Topic 606), as described above.
In May 2016, the FASB issued ASU No. 2016-12, Revenue from Contracts with Customers (Topic 606): Narrow-Scope Improvements and Practical Expedients. This standard addresses collectability, sales taxes and other similar taxes collected from customers, non-cash consideration, contract modifications at transition and completed contracts at transition. This standard will be effective for annual periods beginning after December 15, 2017, including interim periods within that reporting period. Early adoption is permitted, although not prior to annual periods beginning after December 15, 2016. The Company is currently evaluating
67
ALTISOURCE PORTFOLIO SOLUTIONS S.A.
Notes to Consolidated Financial Statements (Continued)
the impact this guidance may have on its results of operations and financial position in connection with its adoption of ASU No. 2014-09, Revenue from Contracts with Customers (Topic 606), as described above.
In August 2016, the FASB issued ASU No. 2016-15, Statement of Cash Flows (Topic 230): Classification of Certain Cash Receipts and Cash Payments. This standard addresses eight specific cash flow issues with the objective of reducing the existing diversity in practice. This standard will be effective for annual periods beginning after December 15, 2017, including interim periods within that reporting period. Early adoption of this standard is permitted. The Company currently does not expect the adoption of this guidance to have a material effect on its statement of cash flows.
In October 2016, the FASB issued ASU No. 2016-16, Income Taxes (Topic 740): Intra-Entity Transfers of Assets Other Than Inventory. This standard will require that companies recognize the income tax consequences of an intra-entity transfer of an asset (other than inventory) when the transfer occurs. Current guidance prohibits companies from recognizing current and deferred income taxes for an intra-entity asset transfer until the asset has been sold to an outside party. This standard will be effective for annual periods beginning after December 15, 2017, including interim periods within that reporting period. Early adoption of this standard is permitted. The Company currently does not expect the adoption of this guidance to have a material effect on its results of operations and financial position.
In November 2016, the FASB issued ASU No. 2016-18, Statement of Cash Flows (Topic 230): Restricted Cash. This standard will require that companies include restricted cash and restricted cash equivalents in their cash and cash equivalent balances in the statement of cash flows. Therefore, amounts generally described as restricted cash and restricted cash equivalents should be included with cash and cash equivalents when reconciling the beginning-of-period and end-of-period total amounts shown on the statement of cash flows. This standard will be effective for annual periods beginning after December 15, 2017, including interim periods within that reporting period. Early adoption of this standard is permitted. The Company currently does not expect the adoption of this guidance to have a material effect on its statement of cash flows. As of December 31, 2016 and 2015, restricted cash was $4.1 million and $4.8 million, respectively.
In December 2016, the FASB issued ASU No. 2016-20, Technical Corrections and Improvements to Topic 606, Revenue from Contracts with Customers. The FASB issued 13 technical corrections and improvements to ASU No. 2014-09, Revenue from Contracts with Customers (Topic 606), including providing optional exemptions from the disclosure requirement for remaining performance obligations for specific situations in which an entity need not estimate variable consideration to recognize revenue. The amendments in this standard also expand the information that is required to be disclosed when an entity applies one of the optional exemptions. This standard will be effective for annual periods beginning after December 15, 2017, including interim periods within that reporting period. Early adoption is permitted, although not prior to annual periods beginning after December 15, 2016. The Company is currently evaluating the impact this guidance may have on its results of operations and financial position in connection with its adoption of ASU No. 2014-09, Revenue from Contracts with Customers (Topic 606), as described above.
In January 2017, the FASB issued ASU No. 2017-01, Business Combinations (Topic 805): Clarifying the Definition of a Business. This standard clarifies the definition of a business and provides a screen to determine if a set of inputs, processes and outputs is a business. The screen requires that when substantially all of the fair value of gross assets acquired (or disposed of) is concentrated in a single identifiable asset or a group of similar identifiable assets, the assets acquired would not be a business. Under the new guidance, in order to be considered a business, an acquisition must include, at a minimum, an input and a substantive process that together significantly contribute to the ability to create output. In addition, the standard narrows the definition of the term “output” so that it is consistent with how it is described in ASU No. 2014-09, Revenue from Contracts with Customers (Topic 606). This standard will be effective for annual periods beginning after December 15, 2017, including interim periods within that reporting period. The Company is currently evaluating the impact this guidance may have on its consolidated financial statements.
In January 2017, the FASB issued ASU No. 2017-04, Intangibles-Goodwill and Other (Topic 350): Simplifying the Test for Goodwill Impairment. This standard will simplify the subsequent measurement of goodwill by eliminating Step 2 from the goodwill impairment test. Current guidance requires that companies compute the implied fair value of goodwill under Step 2 by performing procedures to determine the fair value at the impairment testing date of its assets and liabilities (including unrecognized assets and liabilities) following the procedure that would be required in determining the fair value of assets acquired and liabilities assumed in a business combination. This standard will require companies to perform annual or interim goodwill impairment tests by comparing the fair value of a reporting unit with its carrying amount. An entity should recognize an impairment charge for the amount by which the carrying amount exceeds the reporting unit’s fair value; however, the loss recognized should not exceed the total amount of goodwill allocated to that reporting unit. This standard will be effective for annual periods beginning after December 15, 2019, including interim periods within that reporting period, and will be applied prospectively. Early adoption of this standard is permitted. The Company is currently evaluating the impact this guidance may have on its consolidated financial statements.
68
ALTISOURCE PORTFOLIO SOLUTIONS S.A.
Notes to Consolidated Financial Statements (Continued)
NOTE 3 — CUSTOMER CONCENTRATION
Ocwen is our largest customer. Ocwen purchases certain mortgage services and technology services from us under the terms of master services agreements and amendments thereto (collectively, the “Ocwen Service Agreements”) with terms extending through August 2025. Certain of the Ocwen Service Agreements, among other things, contain a “most favored nation” provision and the parties to the Ocwen Service Agreements have the right to renegotiate pricing. Certain of the Ocwen Service Agreements also prohibit Ocwen from establishing fee-based businesses that would directly or indirectly compete with Altisource’s services with respect to the Homeward Residential, Inc. (“Homeward”) and Residential Capital, LLC (“ResCap”) servicing portfolios acquired by Ocwen in December 2012 and February 2013, respectively. In addition, Ocwen purchases certain origination services from Altisource under an agreement that continues until January 23, 2019, but which is subject to a 90 day termination right by Ocwen.
Revenue from Ocwen primarily consists of revenue earned directly from Ocwen and revenue earned from the loans serviced by Ocwen when Ocwen designates us as the service provider. Revenue from Ocwen as a percentage of segment and consolidated revenue was as follows for the years ended December 31:
2016 | 2015 | 2014 | ||||
Mortgage Services | 60% | 63% | 67% | |||
Financial Services | 17% | 21% | 27% | |||
Technology Services | 42% | 54% | 42% | |||
Consolidated revenue | 56% | 60% | 60% | |||
For the years ended December 31, 2016, 2015 and 2014, we generated revenue from Ocwen of $561.9 million, $631.6 million and $650.7 million, respectively. Services provided to Ocwen during such periods and reported in the Mortgage Services segment included real estate asset management and sales, residential property valuation, trustee management services, property preservation and inspection services and insurance services. Services provided to Ocwen and reported in the Financial Services segment included mortgage charge-off collections. Services provided to Ocwen and reported in the Technology Services segment included IT infrastructure management and software applications. As of December 31, 2016, accounts receivable from Ocwen totaled $26.2 million, $15.8 million of which was billed and $10.4 million of which was unbilled (see Note 7 for additional information on billed and unbilled accounts receivable).
We earn additional revenue related to the portfolios serviced by Ocwen when a party other than Ocwen selects Altisource as the service provider. For the years ended December 31, 2016, 2015 and 2014, we recognized revenue of $188.0 million, $216.9 million and $256.0 million, respectively, related to the portfolios serviced by Ocwen when a party other than Ocwen selected Altisource as the service provider. These amounts are not included in deriving the revenue from Ocwen as a percentage of revenue in the table above.
NOTE 4 — TRANSACTIONS WITH RELATED PARTIES
Through January 16, 2015, William C. Erbey served as our Chairman as well as the Executive Chairman of Ocwen and Chairman of each of Home Loan Servicing Solutions, Ltd. (“HLSS”), Residential and AAMC. Effective January 16, 2015, Mr. Erbey stepped down as the Executive Chairman of Ocwen and Chairman of each of Altisource, HLSS, Residential and AAMC and is no longer a member of the Board of Directors of any of these companies. Consequently, as of January 16, 2015, these companies are no longer related parties of Altisource, as defined by FASB ASC Topic 850, Related Party Disclosures. The disclosures in this note are limited to the periods that each of Ocwen, HLSS, Residential and AAMC were related parties of Altisource and are not reflective of current activities with these former related parties.
Ocwen
Revenue
For the year ended December 31, 2014, we generated revenue from Ocwen of $650.7 million. For the period from January 1, 2015 through January 16, 2015, we estimated that we generated revenue from Ocwen of $22.9 million. Services provided to Ocwen during such periods included real estate asset management and sales, residential property valuation, trustee management services, property inspection and preservation services, insurance services, mortgage charge-off collections, IT infrastructure management and software applications.
We record revenue we earn from Ocwen under the Ocwen Service Agreements at rates we believe to be comparable market rates as we believe they are consistent with the fees we charge to other customers and/or fees charged by our competitors for comparable services.
69
ALTISOURCE PORTFOLIO SOLUTIONS S.A.
Notes to Consolidated Financial Statements (Continued)
Cost of Revenue and Selling, General and Administrative Expenses
At times, we have used Ocwen’s contractors and/or employees to support Altisource related services. Ocwen generally billed us for these contractors and/or employees based on their fully-allocated cost. Additionally, through March 31, 2015, we purchased certain data relating to Ocwen’s servicing portfolio in connection with a Data Access and Services Agreement. Based upon our previously provided notice, the Data Access and Services Agreement was terminated effective March 31, 2015. For the year ended December 31, 2014, Ocwen billed us $38.6 million for these items. For the period from January 1, 2015 through January 16, 2015, we estimated that we incurred $1.9 million of expenses related to these items. These amounts are reflected as a component of cost of revenue in the consolidated statements of operations and comprehensive income.
We provided certain other services to Ocwen and Ocwen provided certain other services to us in connection with Support Services Agreements. These services primarily included such areas as vendor management, corporate services and facilities related services. Billings for these services were generally based on the fully-allocated cost of providing the service based on an estimate of the time and expense of providing the service or estimates thereof. For the year ended December 31, 2014, we billed Ocwen $4.5 million for these items. For the year ended December 31, 2014, Ocwen billed us $6.1 million for these items. Of the January 2015 billings to Ocwen, we estimated that $0.1 million related to the period from January 1, 2015 through January 16, 2015. Of the January 2015 billings from Ocwen, we estimated that $0.3 million related to the period from January 1, 2015 through January 16, 2015. These amounts are reflected as a component of selling, general and administrative expenses in the consolidated statements of operations and comprehensive income.
HLSS
Prior to April 2015, HLSS was a publicly traded company whose primary objective was the acquisition of mortgage servicing rights and related servicing advances, loans held for investment and other residential mortgage related assets. We provided HLSS certain finance, human resources, tax and facilities services and sold information technology services to HLSS under a support services agreement. For the year ended December 31, 2014, we billed HLSS $0.9 million for these items. For the period from January 1, 2015 through January 16, 2015, our billings to HLSS were immaterial.
Residential and AAMC
Residential is focused on acquiring, owning and managing single-family-rental properties throughout the United States. AAMC is an asset management company that provides portfolio management and corporate governance services to investment vehicles that own real estate related assets. Its initial client is Residential.
We have agreements and amendments thereto, which extend through 2027, to provide Residential with renovation management, lease management, property management, real estate owned asset management, title insurance, settlement and valuation services. In addition, we have agreements with Residential and AAMC pursuant to which we may provide services such as finance, human resources, facilities, technology and insurance risk management. Further, we have separate agreements for certain services related to income tax matters, trademark licenses and technology products and services.
For the year ended December 31, 2014, we generated revenue from Residential of $16.0 million under these services agreements. For the period from January 1, 2015 through January 16, 2015, we estimated that we generated revenue from Residential of $1.0 million. These amounts are reflected in revenue in the consolidated statements of operations and comprehensive income. This excludes revenue from services we provided to Residential’s loans serviced by Ocwen or other loan servicers where we were retained by Ocwen or Residential’s other loan servicers. The revenue associated with Residential’s loans serviced by Ocwen is included in Ocwen related party revenue for the year ended December 31, 2014.
For the year ended December 31, 2014, we billed AAMC $1.0 million under these services agreements, $0.1 million of which is reflected in revenue and $0.9 million of which is reflected as a component of selling, general and administrative expenses in the consolidated statements of operations and comprehensive income. For the period from January 1, 2015 through January 16, 2015, our billings to AAMC were immaterial.
NOTE 5 — ACQUISITIONS
Granite Acquisition
On July 29, 2016, we acquired certain assets and assumed certain liabilities of Granite Loan Management of Delaware, LLC (“Granite”) for $9.6 million in cash at closing. Granite provides residential and commercial loan disbursement processing, risk mitigation and construction inspection services to lenders. During the fourth quarter of 2016, management adjusted the allocation of the purchase price based upon information that subsequently became available relating to acquisition date working capital and
70
ALTISOURCE PORTFOLIO SOLUTIONS S.A.
Notes to Consolidated Financial Statements (Continued)
the purchase price allocation to intangible assets. The working capital adjustment resulted in an obligation of the sellers to pay the Company $0.1 million. Granite is not material in relation to the Company’s results of operations or financial position.
The preliminary allocation of the purchase price is as follows:
(in thousands) | Initial purchase price allocation | |||
Accounts receivable, net | $ | 1,024 | ||
Prepaid expenses | 22 | |||
Other assets | 25 | |||
Premises and equipment, net | 299 | |||
Non-compete agreements | 100 | |||
Trademarks and trade names | 100 | |||
Customer relationships | 3,400 | |||
Goodwill | 4,827 | |||
9,797 | ||||
Accounts payable and accrued expenses | (57 | ) | ||
Deferred revenue | (192 | ) | ||
Purchase price | $ | 9,548 | ||
RentRange, Investability and Onit Solutions Acquisitions
On October 9, 2015, we acquired GoldenGator, LLC (doing business as RentRange®) (“RentRange”), REIsmart, LLC (doing business as Investability™) (“Investability”) and Onit Solutions, LLC, a support company for RentRange and Investability (collectively “RentRange and Investability”) for $24.8 million. RentRange is a leading provider of rental home data and information to the financial services and real estate industries, delivering a wide assortment of address and geography level data, analytics and rent-based valuation solutions for single and multi-family properties. Investability is an online residential real estate search and acquisition platform that utilizes data and analytics to allow real estate investors to access the estimated cash flow, capitalization rate, net yield and market value of properties for sale in the United States. The purchase price was composed of $17.5 million in cash and 247 thousand shares of restricted common stock of the Company with a value of $7.3 million as of the closing date. Upon issuance, the restricted shares were subject to transfer restrictions and potential forfeiture provisions. These restrictions and forfeiture provisions will lapse over a four year period, subject to the recipients meeting certain continued employment conditions with the Company and the satisfaction of certain acquisition related escrow release conditions. During 2016, restrictions were removed on 55 thousand shares. Also during 2016, management adjusted the allocation of the purchase price based upon information that subsequently became available relating to acquisition date working capital and the purchase price allocation to intangible assets. The working capital adjustment resulted in an obligation of the sellers to pay the Company $0.2 million. RentRange and Investability are not material in relation to the Company’s results of operations or financial position.
The initial and final allocation of the purchase price is as follows:
(in thousands) | Initial purchase price allocation | Adjustments | Final purchase price allocation | |||||||||
Cash | $ | 3 | $ | — | $ | 3 | ||||||
Accounts receivable, net | 245 | (76 | ) | 169 | ||||||||
Premises and equipment, net | 2,471 | (1,067 | ) | 1,404 | ||||||||
Other assets | 199 | (196 | ) | 3 | ||||||||
Trademarks and trade names | 1,205 | — | 1,205 | |||||||||
Databases/other | 910 | 1,035 | 1,945 | |||||||||
Non-compete agreements | 330 | — | 330 | |||||||||
Customer relationships | 255 | — | 255 | |||||||||
Goodwill | 19,565 | 50 | 19,615 | |||||||||
25,183 | (254 | ) | 24,929 | |||||||||
Accounts payable and accrued expenses | (391 | ) | 46 | (345 | ) | |||||||
Purchase price | $ | 24,792 | $ | (208 | ) | $ | 24,584 | |||||
71
ALTISOURCE PORTFOLIO SOLUTIONS S.A.
Notes to Consolidated Financial Statements (Continued)
CastleLine Acquisition
On July 17, 2015, we acquired CastleLine Holdings, LLC and its subsidiaries (“CastleLine”) for $33.4 million. CastleLine is a specialty risk management and insurance services firm that provides financial products and services to parties involved in the origination, underwriting, purchase and securitization of residential mortgages. The purchase consideration was composed of $12.3 million of cash at closing, $10.5 million of cash payable over four years from the acquisition date and 495 thousand shares of restricted common stock of the Company, that were subject to transfer restrictions, with a value of $14.4 million as of the closing date. During 2016, the restrictions were removed on the 495 thousand shares. Of the cash payable following acquisition, $3.8 million is contingent on certain future employment conditions of certain of the sellers, and therefore excluded from the purchase price. During the second quarter of 2016, management adjusted the allocation of the purchase price based upon information that subsequently became available relating to acquisition date working capital and the purchase price allocation to intangible assets. The CastleLine acquisition is not material in relation to the Company’s results of operations or financial position.
The initial and final allocation of the purchase price is as follows:
(in thousands) | Initial purchase price allocation | Adjustments | Final purchase price allocation | |||||||||
Cash | $ | 1,088 | $ | — | $ | 1,088 | ||||||
Accounts receivable, net | 510 | (410 | ) | 100 | ||||||||
Prepaid expenses | 66 | (46 | ) | 20 | ||||||||
Restricted cash | 2,501 | — | 2,501 | |||||||||
Non-compete agreements | 1,105 | 25 | 1,130 | |||||||||
Databases/other | 465 | 1,335 | 1,800 | |||||||||
Customer relationships | 395 | — | 395 | |||||||||
Trademarks and trade names | 150 | 10 | 160 | |||||||||
Deferred taxes | — | 356 | 356 | |||||||||
Goodwill | 28,125 | (1,395 | ) | 26,730 | ||||||||
34,405 | (125 | ) | 34,280 | |||||||||
Accounts payable and accrued expenses | (875 | ) | 38 | (837 | ) | |||||||
Deferred revenue | (87 | ) | 87 | — | ||||||||
Purchase price | $ | 33,443 | $ | — | $ | 33,443 | ||||||
Owners Acquisition
On November 21, 2014, we acquired certain assets and assumed certain liabilities of Owners Advantage, LLC (“Owners”). Owners is a self-directed online real estate marketplace. We paid $19.8 million at closing in cash and agreed to pay additional contingent consideration of up to an additional $7.0 million over two years following the closing (“Owners Earn Out”), based on Adjusted Revenue (as defined in the purchase agreement). At closing, we estimated the fair value of the Owners Earn Out to be $1.9 million determined based on the present value of future estimated Owners Earn Out payments. After the acquisition date, we paid the sellers less than $0.1 million relating to an acquisition date working capital adjustment. The Owners acquisition is not material in relation to the Company’s results of operations or financial position.
The final allocation of the purchase price is as follows:
(in thousands) | ||||
Accounts receivable, net | $ | 32 | ||
Prepaid expenses | 28 | |||
Software | 501 | |||
Trademarks and trade names | 1,431 | |||
Goodwill | 19,775 | |||
21,767 | ||||
Accounts payable | (22 | ) | ||
Purchase price | $ | 21,745 | ||
72
ALTISOURCE PORTFOLIO SOLUTIONS S.A.
Notes to Consolidated Financial Statements (Continued)
Mortgage Builder Acquisition
On September 12, 2014, we acquired certain assets and assumed certain liabilities of Mortgage Builder Software, Inc. (“Mortgage Builder”) pursuant to a Purchase and Sale Agreement dated July 18, 2014 (the “Purchase and Sale Agreement”). Mortgage Builder is a provider of residential mortgage loan origination and servicing software systems. Pursuant to the terms of the Purchase and Sale Agreement, we paid $15.7 million at closing in cash (net of closing working capital adjustments). Additionally, the Purchase and Sale Agreement provides for the payment of up to $7.0 million in potential additional consideration (the “MB Earn-Out”) based on Adjusted Revenue (as defined in the Purchase and Sale Agreement) in the three consecutive 12-month periods following closing. At closing, we estimated the fair value of the MB Earn-Out to be $1.6 million determined based on the present value of future estimated MB Earn-Out payments. After the acquisition date, the sellers paid the Company $0.2 million relating to an acquisition date working capital adjustment. The Mortgage Builder acquisition is not material in relation to the Company’s results of operations or financial position.
The final adjusted allocation of the purchase price is as follows:
(in thousands) | ||||
Cash | $ | 668 | ||
Accounts receivable, net | 1,102 | |||
Prepaid expenses | 38 | |||
Premises and equipment, net | 553 | |||
Software | 1,509 | |||
Trademarks and trade names | 209 | |||
Customer relationships | 4,824 | |||
Goodwill | 9,135 | |||
18,038 | ||||
Accounts payable and accrued expenses | (950 | ) | ||
Purchase price | $ | 17,088 | ||
See Note 10 for additional information on the impairment of Technology Services goodwill for the year ended December 31, 2015, which includes Mortgage Builder goodwill.
NOTE 6 — AVAILABLE FOR SALE SECURITIES
During the year ended December 31, 2016, we purchased 4.1 million shares of Residential common stock for $48.2 million. This investment is classified as available for sale and reflected in the condensed consolidated balance sheets at fair value at the balance sheet date ($45.8 million as of December 31, 2016) (no comparative amount as of December 31, 2015). Unrealized gains and losses on available for sale securities are reflected in other comprehensive income, unless there is an impairment that is other than temporary. In the event that a decline in market value is other than temporary, we would record a charge to earnings and a new cost basis in the investment would be established. During the year December 31, 2016, we incurred expenses of $3.4 million and earned dividends of $2.3 million related to this investment (no comparative amounts in 2015).
NOTE 7 — ACCOUNTS RECEIVABLE, NET
Accounts receivable, net consists of the following as of December 31:
(in thousands) | 2016 | 2015 | ||||||
Billed | $ | 58,392 | $ | 67,021 | ||||
Unbilled | 39,853 | 56,458 | ||||||
98,245 | 123,479 | |||||||
Less: allowance for doubtful accounts | (10,424 | ) | (18,456 | ) | ||||
Total | $ | 87,821 | $ | 105,023 | ||||
Unbilled receivables consist primarily of certain asset management and default management services for which we generally recognize revenues over the service delivery period but bill following completion of the service. We also include amounts in unbilled receivables that are earned during a month and billed in the following month.
73
ALTISOURCE PORTFOLIO SOLUTIONS S.A.
Notes to Consolidated Financial Statements (Continued)
Bad debt expense amounted to $1.8 million, $5.5 million and $16.3 million for the years ended December 31, 2016, 2015 and 2014, respectively, and is included in selling, general and administrative expenses in the consolidated statements of operations and comprehensive income. The higher bad debt expense in 2014 was primarily driven by the default management services business. A change in many of our default management services customers’ business models and fourth quarter 2014 discussions with those customers led us to believe that a portion of the accounts receivable balance was no longer collectible.
NOTE 8 — PREPAID EXPENSES AND OTHER CURRENT ASSETS
Prepaid expenses and other current assets consist of the following as of December 31:
(in thousands) | 2016 | 2015 | ||||||
Maintenance agreements, current portion | $ | 6,590 | $ | 7,000 | ||||
Short-term investments in real estate | 13,025 | — | ||||||
Income taxes receivable | 5,186 | 633 | ||||||
Prepaid expenses | 6,919 | 7,873 | ||||||
Litigation settlement insurance recovery (Note 23) | 4,000 | — | ||||||
Other current assets | 6,888 | 6,245 | ||||||
Total | $ | 42,608 | $ | 21,751 | ||||
NOTE 9 — PREMISES AND EQUIPMENT, NET
Premises and equipment, net consists of the following as of December 31:
(in thousands) | 2016 | 2015 | ||||||
Computer hardware and software | $ | 164,877 | $ | 177,010 | ||||
Office equipment and other | 20,188 | 21,720 | ||||||
Furniture and fixtures | 13,997 | 14,443 | ||||||
Leasehold improvements | 33,808 | 35,503 | ||||||
232,870 | 248,676 | |||||||
Less: accumulated depreciation and amortization | (129,397 | ) | (129,555 | ) | ||||
Total | $ | 103,473 | $ | 119,121 | ||||
Depreciation and amortization expense amounted to $36.8 million, $36.5 million and $29.0 million for the years ended December 31, 2016, 2015 and 2014, respectively, and is included in cost of revenue for operating assets and in selling, general and administrative expenses for non-operating assets in the consolidated statements of operations and comprehensive income.
In the fourth quarter of 2015, we recognized a $4.1 million premises and equipment impairment loss in our Technology Services segment primarily driven by the Company’s projected Technology Services revenue from Ocwen and investment in technologies provided to Ocwen. There were no impairments of premises and equipment for the years ended December 31, 2016 and 2014.
74
ALTISOURCE PORTFOLIO SOLUTIONS S.A.
Notes to Consolidated Financial Statements (Continued)
NOTE 10 — GOODWILL AND INTANGIBLE ASSETS, NET
Goodwill
Goodwill was recorded primarily in connection with the 2016 acquisition of Granite, the 2015 acquisitions of CastleLine and RentRange and Investability, the 2014 acquisitions of Mortgage Builder and Owners, the 2013 acquisitions of the Homeward fee-based business and Equator, LLC (“Equator”), the 2011 acquisitions of Springhouse, LLC and Tracmail and the 2010 acquisition of MPA. Note 5 discusses the 2016, 2015 and 2014 acquisitions. Changes in goodwill during the years ended December 31, 2016 and 2015 are summarized below:
(in thousands) | Mortgage Services | Financial Services | Technology Services | Total | ||||||||||||
Balance January 1, 2015 | $ | 32,733 | $ | 2,378 | $ | 55,740 | $ | 90,851 | ||||||||
Acquisition of CastleLine | 28,125 | — | — | 28,125 | ||||||||||||
Acquisition of RentRange and Investability | 19,565 | — | — | 19,565 | ||||||||||||
Impairment of Technology Services goodwill | — | — | (55,740 | ) | (55,740 | ) | ||||||||||
Balance, December 31, 2015 | 80,423 | 2,378 | — | 82,801 | ||||||||||||
CastleLine purchase price allocation adjustment (1) | (1,395 | ) | — | — | (1,395 | ) | ||||||||||
RentRange and Investability purchase price allocation adjustment (2) | 50 | — | — | 50 | ||||||||||||
Acquisition of Granite | 4,827 | — | — | 4,827 | ||||||||||||
Balance, December 31, 2016 | $ | 83,905 | $ | 2,378 | $ | — | $ | 86,283 | ||||||||
______________________________________
(1) | During the second quarter of 2016, goodwill was revised to reflect a purchase accounting measurement period adjustment related to the CastleLine acquisition. See Note 5. |
(2) | During the third quarter of 2016, goodwill was revised to reflect a purchase accounting measurement period adjustment related to the RentRange and Investability acquisition. See Note 5. |
During 2014, the fair value of the contingent consideration related to the Equator acquisition (“Equator Earn Out”) was reduced by $37.9 million with a corresponding increase in earnings based on management’s revised estimates that expected earnings of Equator will be lower than projected at the time of acquisition. In the second quarter of 2014, management determined that Equator goodwill should be tested for impairment as a result of the decline in fair value of the Equator Earn Out. Consequently, we initiated a quantitative two-step goodwill impairment test by comparing the carrying value of the net assets of Equator to its fair value based on a discounted cash flow analysis. Based on this goodwill assessment, we determined that the fair value of Equator was less than its carrying value and goodwill was impaired. As a result, we recorded an impairment loss of $37.5 million.
During our fourth quarter 2014 and 2015 annual goodwill assessments, we elected to bypass the initial analysis of qualitative factors and perform a quantitative two-step goodwill impairment test of all of our reporting units as a result of the goodwill impairment recorded in the second quarter of 2014. We calculated the fair value of each of our reporting units by using a discounted cash flow analysis and concluded that the fair values of the Mortgage Services, Financial Services and Technology Services reporting units exceeded their carrying values by a significant margin in 2014 and that the fair values of the Mortgage Services and Financial Services reporting units exceeded their carrying values by a significant margin in 2015. In 2015, the fair value of the Technology Services reporting unit was less than its carrying value. Accordingly, we performed step two of the impairment test for the Technology Services reporting unit and determined that the remaining $55.7 million of goodwill was impaired. As a result, we recorded a $55.7 million impairment loss in the fourth quarter of 2015. This goodwill impairment was primarily driven by the Company’s projected Technology Services revenue from Ocwen and investment in technologies provided to Ocwen. There were no additional goodwill impairments as of December 31, 2015 and 2014. Based on our fourth quarter 2016 goodwill assessment, we concluded that there was no impairment of goodwill for the year ended December 31, 2016.
75
ALTISOURCE PORTFOLIO SOLUTIONS S.A.
Notes to Consolidated Financial Statements (Continued)
Intangible Assets, Net
Intangible assets, net consist of the following as of December 31:
Weighted average estimated useful life (in years) | Gross carrying amount | Accumulated amortization | Net book value | |||||||||||||||||||||||
(in thousands) | 2016 | 2015 | 2016 | 2015 | 2016 | 2015 | ||||||||||||||||||||
Definite lived intangible assets: | ||||||||||||||||||||||||||
Trademarks and trade names | 13 | $ | 15,354 | $ | 15,244 | $ | (7,724 | ) | $ | (6,491 | ) | $ | 7,630 | $ | 8,753 | |||||||||||
Customer related intangible assets | 10 | 277,828 | 274,428 | (156,980 | ) | (113,725 | ) | 120,848 | 160,703 | |||||||||||||||||
Operating agreement | 20 | 35,000 | 35,000 | (12,104 | ) | (10,354 | ) | 22,896 | 24,646 | |||||||||||||||||
Non-compete agreements | 4 | 1,560 | 1,435 | (507 | ) | (115 | ) | 1,053 | 1,320 | |||||||||||||||||
Intellectual property | 10 | 300 | 300 | (85 | ) | (55 | ) | 215 | 245 | |||||||||||||||||
Other intangible assets | 5 | 3,745 | 1,375 | (955 | ) | (39 | ) | 2,790 | 1,336 | |||||||||||||||||
Total | $ | 333,787 | $ | 327,782 | $ | (178,355 | ) | $ | (130,779 | ) | $ | 155,432 | $ | 197,003 | ||||||||||||
Amortization expense for definite lived intangible assets was $47.6 million, $41.1 million and $37.7 million for the years ended December 31, 2016, 2015 and 2014, respectively. Expected annual definite lived intangible asset amortization expense for 2017 through 2021 is $35.0 million, $26.5 million, $21.1 million, $17.2 million and $12.7 million, respectively.
In the fourth quarter of 2015, we recorded an impairment loss of $11.9 million in our Technology Services segment related to customer relationship intangible assets from the 2013 Homeward and ResCap fee-based business acquisitions. These impairments of intangible assets were primarily driven by the Company’s projected Technology Services revenue from Ocwen and investment in technologies provided to Ocwen. There were no impairments of intangible assets for the years ended December 31, 2016 and 2014.
NOTE 11 — OTHER ASSETS
Other assets consist of the following as of December 31:
(in thousands) | 2016 | 2015 | ||||||
Security deposits | $ | 5,508 | $ | 5,341 | ||||
Maintenance agreements, non-current portion | 853 | 1,570 | ||||||
Restricted cash | 4,127 | 4,801 | ||||||
Other | 767 | 1,441 | ||||||
Total | $ | 11,255 | $ | 13,153 | ||||
NOTE 12 — ACCOUNTS PAYABLE, ACCRUED EXPENSES AND OTHER CURRENT LIABILITIES
Accounts payable and accrued expenses consist of the following as of December 31:
(in thousands) | 2016 | 2015 | ||||||
Accounts payable | $ | 8,787 | $ | 11,644 | ||||
Accrued expenses - general | 26,426 | 30,347 | ||||||
Accrued salaries and benefits | 47,614 | 46,564 | ||||||
Income taxes payable | 308 | 3,316 | ||||||
Total | $ | 83,135 | $ | 91,871 | ||||
76
ALTISOURCE PORTFOLIO SOLUTIONS S.A.
Notes to Consolidated Financial Statements (Continued)
Other current liabilities consist of the following as of December 31:
(in thousands) | 2016 | 2015 | ||||||
Unfunded cash account balances | $ | 7,137 | $ | 6,395 | ||||
Other | 11,924 | 9,871 | ||||||
Total | $ | 19,061 | $ | 16,266 | ||||
NOTE 13 — LONG-TERM DEBT
Long-term debt consists of the following as of December 31:
(in thousands) | 2016 | 2015 | ||||||
Senior secured term loan | $ | 479,653 | $ | 536,598 | ||||
Less: debt issuance costs, net | (4,486 | ) | (6,184 | ) | ||||
Less: unamortized discount, net | (1,622 | ) | (2,236 | ) | ||||
Net long-term debt | 473,545 | 528,178 | ||||||
Less: current portion | (5,945 | ) | (5,945 | ) | ||||
Long-term debt, less current portion | $ | 467,600 | $ | 522,233 | ||||
On November 27, 2012, Altisource Solutions S.à r.l., a wholly-owned subsidiary of Altisource Portfolio Solutions S.A., entered into a senior secured term loan agreement with Bank of America, N.A., as administrative agent, and certain lenders. Altisource Portfolio Solutions S.A. and certain wholly-owned subsidiaries are guarantors of the term loan (collectively, the “Guarantors”). We subsequently amended the senior secured term loan agreement to increase the principal amount of the senior secured term loan and, among other changes, re-establish the $200.0 million incremental term loan facility accordion, lower the interest rate, extend the maturity date by approximately one year and increase the maximum amount of Restricted Junior Payments (as defined in the senior secured term loan agreement; other capitalized terms, unless defined herein, are defined in the senior secured term loan agreement).
After giving effect to the third amendment entered into on August 1, 2014, the term loan must be repaid in equal consecutive quarterly principal installments of $1.5 million, with the balance due at maturity. All amounts outstanding under the senior secured term loan agreement will become due on the earlier of (i) December 9, 2020, and (ii) the date on which the loans are declared to be due and owing by the administrative agent at the request (or with the consent) of the Required Lenders or as otherwise provided in the senior secured term loan agreement upon the occurrence of any event of default under the senior secured term loan agreement.
In addition to the scheduled principal payments, subject to certain exceptions, the term loan is subject to mandatory prepayment upon issuances of debt, casualty and condemnation events and sales of assets, as well as from a percentage of Consolidated Excess Cash Flow if the leverage ratio is greater than 3.00 to 1.00, as calculated in accordance with the provisions of the senior secured term loan (the percentage increases if the leverage ratio exceeds 3.50 to 1.00). No mandatory prepayments were owed for the year ended December 31, 2016.
During 2016, we repurchased portions of our senior secured term loan with an aggregate par value of $51.0 million at a weighted average discount of 13.2%, recognizing a net gain of $5.5 million on the early extinguishment of debt. During 2015, we repurchased portions of our senior secured term loan with an aggregate par value of $49.0 million at a weighted average discount of 10.3%, recognizing a net gain of $3.8 million on the early extinguishment of debt. These net gains are included in other income (expense), net in the consolidated statements of operations and comprehensive income (see Note 20).
The term loan bears interest at rates based upon, at our option, the Adjusted Eurodollar Rate or the Base Rate. Adjusted Eurodollar Rate loans bear interest at a rate per annum equal to the sum of (i) the greater of (x) the Adjusted Eurodollar Rate for the applicable interest period and (y) 1.00% plus (ii) a 3.50% margin. Base Rate loans bear interest at a rate per annum equal to the sum of (i) the greater of (x) the Base Rate and (y) 2.00% plus (ii) a 2.50% margin. The interest rate at December 31, 2016 was 4.50%.
Term loan payments are guaranteed by the Guarantors and are secured by a pledge of all equity interests of certain subsidiaries as well as a lien on substantially all of the assets of Altisource Solutions S.à r.l. and the Guarantors, subject to certain exceptions.
77
ALTISOURCE PORTFOLIO SOLUTIONS S.A.
Notes to Consolidated Financial Statements (Continued)
The senior secured term loan agreement includes covenants that restrict or limit, among other things, our ability to create liens and encumbrances; incur additional indebtedness; sell, transfer or dispose of assets; make Restricted Junior Payments including share repurchases, dividends and repayment of junior indebtedness; change lines of business; amend material debt agreements or other material contracts; engage in certain transactions with affiliates; enter into sale/leaseback transactions; grant negative pledges or agree to such other restrictions relating to subsidiary dividends and distributions; make changes to our fiscal year and engage in mergers and consolidations.
The senior secured term loan agreement contains certain events of default including (i) failure to pay principal when due or interest or any other amount owing on any other obligation under the senior secured term loan agreement within five days of becoming due, (ii) material incorrectness of representations and warranties when made, (iii) breach of covenants, (iv) failure to pay principal or interest on any other debt that equals or exceeds $40.0 million when due, (v) default on any other debt that equals or exceeds $40.0 million that causes, or gives the holder or holders of such debt the ability to cause, an acceleration of such debt, (vi) occurrence of a Change of Control, (vii) bankruptcy and insolvency events, (viii) entry by a court of one or more judgments against us in an amount in excess of $40.0 million that remain unbonded, undischarged or unstayed for a certain number of days after the entry thereof, (ix) the occurrence of certain ERISA events and (x) the failure of certain Loan Documents to be in full force and effect. If any event of default occurs and is not cured within applicable grace periods set forth in the senior secured term loan agreement or waived, all loans and other obligations could become due and immediately payable and the facility could be terminated.
At December 31, 2016, debt issuance costs were $4.5 million, net of $5.8 million of accumulated amortization. At December 31, 2015, debt issuance costs were $6.2 million, net of $4.1 million of accumulated amortization.
Interest expense on the term loans, including amortization of debt issuance costs and the net debt discount, totaled $24.4 million, $28.2 million and $23.4 million for the years ended December 31, 2016, 2015 and 2014, respectively.
Maturities of our long-term debt are as follows:
(in thousands) | ||||
2017 | $ | 5,945 | ||
2018 | 5,945 | |||
2019 | 5,945 | |||
2020 | 461,818 | |||
$ | 479,653 | |||
NOTE 14 — OTHER NON-CURRENT LIABILITIES
Other non-current liabilities consist of the following as of December 31:
(in thousands) | 2016 | 2015 | ||||||
Acquisition related obligations | $ | — | $ | 8,422 | ||||
Other non-current liabilities | 10,480 | 9,731 | ||||||
Total | $ | 10,480 | $ | 18,153 | ||||
We recognized a net gain on the change in the fair value of the Equator Earn Out of $7.6 million for the year ended December 31, 2015 (no comparative amount for 2016). The liability for contingent consideration was reflected at fair value and adjusted each reporting period with the change in fair value recognized in earnings. In 2015, we reached an agreement with the former owners of Equator to extinguish any liability for the Equator Earn Out. In connection with this settlement, we reduced the liability for the Equator Earn Out to $0 and recognized a $7.6 million increase in earnings.
78
ALTISOURCE PORTFOLIO SOLUTIONS S.A.
Notes to Consolidated Financial Statements (Continued)
NOTE 15 — FAIR VALUE MEASUREMENTS AND FINANCIAL INSTRUMENTS
The following table presents the carrying amount and estimated fair value of financial instruments held by the Company and acquisition contingent consideration liabilities at December 31, 2016 and 2015. The following fair values are estimated using market information and what the Company believes to be appropriate valuation methodologies under GAAP:
December 31, 2016 | December 31, 2015 | |||||||||||||||||||||||||||||||
(in thousands) | Carrying Amount | Fair Value | Carrying Amount | Fair Value | ||||||||||||||||||||||||||||
Level 1 | Level 2 | Level 3 | Level 1 | Level 2 | Level 3 | |||||||||||||||||||||||||||
Assets: | ||||||||||||||||||||||||||||||||
Cash and cash equivalents | $ | 149,294 | $ | 149,294 | $ | — | $ | — | $ | 179,327 | $ | 179,327 | $ | — | $ | — | ||||||||||||||||
Restricted cash | 4,127 | 4,127 | — | — | 4,801 | 4,801 | — | — | ||||||||||||||||||||||||
Available for sale securities | 45,754 | 45,754 | — | — | — | — | — | — | ||||||||||||||||||||||||
Liabilities: | ||||||||||||||||||||||||||||||||
Acquisition contingent consideration | 376 | — | — | 376 | 3,932 | — | — | 3,932 | ||||||||||||||||||||||||
Long-term debt | 479,653 | — | 474,856 | — | 536,598 | — | 469,523 | — | ||||||||||||||||||||||||
Fair Value Measurements on a Recurring Basis
Cash and cash equivalents and restricted cash are carried at amounts that approximate their fair value due to the highly liquid nature of these instruments and were measured using Level 1 inputs.
Available for sale securities are carried at fair value and consist of 4.1 million shares of Residential common stock. Available for sale securities are measured using Level 1 inputs as these securities have quoted prices in active markets.
The fair value of our long-term debt is based on quoted market prices. Based on the frequency of trading, we do not believe that there is an active market for our debt. Therefore, the quoted prices are considered Level 2 inputs.
In accordance with ASC Topic 805, Business Combinations, liabilities for contingent consideration are reflected at fair value and adjusted each reporting period with the change in fair value recognized in earnings. Liabilities for acquisition related contingent consideration were recorded in connection with the acquisitions of certain assets and assumption of certain liabilities of Mortgage Builder and Owners in 2014. We measure the liabilities for acquisition related contingent consideration using Level 3 inputs as they are determined based on the present value of future estimated payments, which include sensitivities pertaining to discount rates and financial projections.
During 2016, the Company reduced the fair value of the acquisition contingent consideration related to the Mortgage Builder and Owners acquisitions by $1.4 million and $2.2 million, respectively, as a result of changes in the fair value of expected payments.
There were no transfers between different levels during the periods presented.
Fair Value Measurements on a Nonrecurring Basis
The Company recorded a goodwill impairment loss of $55.7 million for the year ended December 31, 2015, based on fair value measurements (no comparative amount in 2016). In addition, the Company recorded an intangible asset impairment loss of $11.9 million and a premises and equipment impairment loss of $4.1 million for the year ended December 31, 2015, based on fair value measurements (no comparative amounts in 2016). These fair value measurements were based on inputs classified as Level 3 in the valuation hierarchy (see Notes 9 and 10).
Concentrations of Credit Risk
Financial instruments that subject us to concentrations of credit risk primarily consist of cash and cash equivalents and accounts receivable. Our policy is to deposit our cash and cash equivalents with major financial institutions. The Company derives the largest portion of its revenues from Ocwen (see Note 3 for additional information on Ocwen revenues and accounts receivable balance). The Company mitigates its concentrations of credit risk with respect to accounts receivable by actively monitoring past due accounts and the economic status of customers, if known.
79
ALTISOURCE PORTFOLIO SOLUTIONS S.A.
Notes to Consolidated Financial Statements (Continued)
NOTE 16 — SHAREHOLDERS’ EQUITY AND SHARE-BASED COMPENSATION
Common Stock
At December 31, 2016, we had 25.4 million shares authorized and issued, and 18.8 million shares of common stock outstanding. At December 31, 2015, we had 25.4 million shares authorized and issued, and 19.0 million shares of common stock outstanding. The holders of shares of Altisource common stock generally are entitled to one vote for each share on all matters voted on by shareholders, and the holders of such shares generally will possess all voting power.
On October 9, 2015, we acquired RentRange and Investability for $24.8 million, which included a cash component and the issuance of 247 thousand shares of restricted common stock of the Company with a value of $7.3 million as of the closing date. The restricted stock is subject to transfer restrictions and potential forfeiture provisions. These restrictions and forfeiture provisions will be removed over a four year period, subject to meeting certain continued employment conditions with the Company and meeting certain acquisition related escrow release conditions. During 2016, restrictions were removed on 55 thousand shares. In addition, on July 17, 2015, we acquired CastleLine for $33.4 million, which included a cash component and the issuance of 495 thousand shares of restricted common stock of the Company with a value of $14.4 million as of the closing date. During 2016, restrictions were removed on the 495 thousand shares. See Note 5 for additional information about these acquisitions.
Equity Incentive Plan
Our 2009 Equity Incentive Plan (the “Plan”) provides for various types of equity awards, including stock options, stock appreciation rights, stock purchase rights, restricted shares and other awards, or a combination of any of the above. Under the Plan, we may grant up to 6.7 million Altisource share-based awards to officers, directors, employees and to employees of our affiliates. As of December 31, 2016, 1.5 million share-based awards were available for future grant under the Plan. Expired and forfeited awards are available for reissuance.
Share Repurchase Program
On May 18, 2016, our shareholders approved a new share repurchase program which replaced the previous share repurchase program. Under the new program, we are authorized to purchase up to 4.6 million shares of our common stock, based on a limit of 25% of the outstanding shares of common stock on the date of approval at a minimum price of $1.00 per share and a maximum price of $500.00 per share. This is in addition to amounts previously purchased under prior programs. Under the existing and prior programs, we purchased 1.4 million shares of common stock at an average price of $26.81 per share during the year ended December 31, 2016, 2.1 million shares at an average price of $27.60 per share during the year ended December 31, 2015 and 2.5 million shares at an average price of $103.67 per share during the year ended December 31, 2014. As of December 31, 2016, approximately 3.9 million shares of common stock remain available for repurchase under the new program. Our senior secured term loan limits the amount we can spend on share repurchases and may prevent repurchases in certain circumstances. As of December 31, 2016, approximately $395 million was available to repurchase shares of our common stock under our senior secured term loan.
Share-Based Compensation
We issue share-based awards in the form of stock options and certain other equity-based awards for certain employees, officers and directors. We recorded share-based compensation expense of $6.2 million, $4.8 million and $2.2 million for the years ended December 31, 2016, 2015 and 2014, respectively. As of December 31, 2016, estimated unrecognized compensation costs related to share-based awards amounted to $6.2 million which we expect to recognize over a weighted average remaining requisite service period of approximately 2.13 years.
Stock Options
Stock option grants are composed of a combination of service-based, market-based and performance-based options.
Service-Based Options. These options generally vest over three years or four years with equal annual cliff-vesting and expire on the earlier of ten years after the date of grant or following termination of service. A total of 0.9 million service-based awards were outstanding at December 31, 2016.
Market-Based Options. These option grants generally have two components, each of which vests only upon the achievement of certain criteria. The first component, which we refer to internally as “ordinary performance” grants, consists of two-thirds of the market-based grant and begins to vest if the stock price is at least double the exercise price, as long as the stock price realizes a compounded annual gain of at least 20% over the exercise price. The remaining third of the market-based options, which we refer to internally as “extraordinary performance” grants, begins to vest if the stock price is at least triple the exercise
80
ALTISOURCE PORTFOLIO SOLUTIONS S.A.
Notes to Consolidated Financial Statements (Continued)
price, as long as the stock price realizes a compounded annual gain of at least 25% over the exercise price. Market-based awards vest in three or four year installments with the first installment vesting upon the achievement of the criteria and the remaining installments vesting thereafter in annual installments. Market-based options generally expire on the earlier of ten years after the date of grant or following termination of service, unless the performance criteria is met prior to termination of service or in the final three years of the option term, in which case vesting will generally continue in accordance with the provisions of the award agreement. A total of 1.0 million market-based awards were outstanding at December 31, 2016.
Performance-Based Options. These option grants begin to vest upon the achievement of certain business unit specific financial measures. Generally, 25% of the awards vest upon the achievement of the performance criteria and the remaining 75% vest thereafter in three equal annual installments. The award of performance-based options is adjusted based on the level of achievement specified in the award agreements. If the performance criteria achieved is below a certain threshold, the award is canceled. The options expire on the earlier of ten years after the date of grant or following termination of service. A total of 0.1 million performance-based awards were outstanding at December 31, 2016.
The Company granted 0.1 million stock options (at a weighted average exercise price of $29.17 per share), 0.9 million stock options (at a weighted average exercise price of $24.21 per share) and 0.1 million stock options (at a weighted average exercise price of $84.61 per share) during the years ended December 31, 2016, 2015 and 2014, respectively. Vesting of share-based awards are generally contingent on continued employment.
The fair values of the service-based options and performance-based options were determined using the Black-Scholes option pricing model and the fair values of the market-based options were determined using a lattice (binomial) model. The following assumptions were used to determine the fair values as of the grant date:
2016 | 2015 | 2014 | ||||||||||||||||
Black-Scholes | Binomial | Black-Scholes | Binomial | Black-Scholes | Binomial | |||||||||||||
Risk-free interest rate (%) | 1.25 – 1.89 | 0.23 – 2.23 | 1.50 – 1.91 | 0.02 – 2.34 | 1.80 – 1.91 | 0.01 – 2.49 | ||||||||||||
Expected stock price volatility (%) | 59.75 – 62.14 | 59.76 – 62.14 | 55.06 – 59.73 | 55.06 – 59.73 | 37.57 – 45.15 | 38.38 – 45.15 | ||||||||||||
Expected dividend yield | — | — | — | — | — | — | ||||||||||||
Expected option life (in years) | 6.00 – 6.25 | 4.06 – 4.88 | 6.00 – 6.25 | 4.08 – 4.92 | 6.25 | 4.36 – 5.83 | ||||||||||||
Fair value | $11.15 – $18.60 | $11.06 – $19.27 | $10.01 – $17.66 | $9.91 – $18.05 | $15.54 – $41.79 | $12.66 – $33.62 | ||||||||||||
We determined the expected option life of all service-based stock option grants using the simplified method. We use the simplified method because we believe that our historical data does not provide a reasonable basis upon which to estimate expected option life.
The following table summarizes the weighted average grant date fair value of stock options granted per share, the total intrinsic value of stock options exercised and the grant date fair value of stock options that vested during the years ended December 31:
(in thousands, except per share amounts) | 2016 | 2015 | 2014 | |||||||||
Weighted average grant date fair value of stock options granted per share | $ | 16.82 | $ | 13.20 | $ | 26.92 | ||||||
Intrinsic value of stock options exercised | 18,209 | 1,998 | 10,250 | |||||||||
Grant date fair value of stock options that vested during the period | 2,698 | 1,616 | 2,641 | |||||||||
81
ALTISOURCE PORTFOLIO SOLUTIONS S.A.
Notes to Consolidated Financial Statements (Continued)
The following table summarizes the activity related to our stock options:
Number of options | Weighted average exercise price | Weighted average contractual term (in years) | Aggregate intrinsic value (in thousands) | |||||||||
Outstanding at December 31, 2015 | 3,163,125 | $ | 20.13 | 4.94 | $ | 35,842 | ||||||
Granted | 144,654 | 29.17 | ||||||||||
Exercised | (1,173,132 | ) | 9.63 | |||||||||
Forfeited | (138,138 | ) | 34.13 | |||||||||
Outstanding at December 31, 2016 | 1,996,509 | 25.98 | 5.32 | 15,942 | ||||||||
Exercisable at December 31, 2016 | 1,225,924 | 21.00 | 3.45 | 10,825 | ||||||||
The following table summarizes information about stock options outstanding and exercisable at December 31, 2016:
Options outstanding | Options exercisable | |||||||||||||||||
Exercise price range (1) | Number | Weighted average remaining contractual life (in years) | Weighted average exercise price | Number | Weighted average remaining contractual life (in years) | Weighted average exercise price | ||||||||||||
Up to $10.00 | 480,003 | 1.53 | $ | 9.14 | 480,003 | 1.53 | $ | 9.14 | ||||||||||
$10.01 — $20.00 | 298,137 | 7.91 | 18.74 | 101,438 | 7.77 | 18.65 | ||||||||||||
$20.01 — $30.00 | 916,491 | 5.93 | 25.74 | 520,159 | 3.88 | 23.79 | ||||||||||||
$30.01 — $40.00 | 109,003 | 7.63 | 32.46 | 43,729 | 4.96 | 32.83 | ||||||||||||
$40.01 — $50.00 | 5,000 | 7.94 | 49.06 | 625 | 7.94 | 49.06 | ||||||||||||
$60.01 — $70.00 | 71,000 | 5.19 | 60.73 | 51,375 | 5.19 | 60.74 | ||||||||||||
$70.01 — $80.00 | 25,000 | 7.86 | 72.78 | 3,125 | 7.86 | 72.78 | ||||||||||||
$80.01 — $90.00 | 40,000 | 7.04 | 85.63 | 13,438 | 6.46 | 84.52 | ||||||||||||
$90.01 — $100.00 | 50,000 | 7.18 | 95.40 | 11,094 | 7.12 | 94.30 | ||||||||||||
$100.01 — $110.00 | 1,875 | 7.37 | 105.11 | 938 | 7.37 | 105.11 | ||||||||||||
1,996,509 | 1,225,924 | |||||||||||||||||
______________________________________
(1) | These options contain market-based components as described above. |
82
ALTISOURCE PORTFOLIO SOLUTIONS S.A.
Notes to Consolidated Financial Statements (Continued)
The following table summarizes the market prices necessary in order for the market-based options to begin to vest:
Market-based options | ||||||||
Vesting price | Ordinary performance | Extraordinary performance | ||||||
$40.01 — $50.00 | 14,500 | — | ||||||
$50.01 — $60.00 | 47,129 | 16,483 | ||||||
$60.01 — $70.00 | 17,884 | 6,250 | ||||||
$70.01 — $80.00 | — | 1,000 | ||||||
$80.01 — $90.00 | — | 25,467 | ||||||
$90.01 — $100.00 | 2,500 | 8,943 | ||||||
$140.01 — $150.00 | 12,500 | 1,250 | ||||||
$170.01 — $180.00 | 12,500 | — | ||||||
$180.01 — $190.00 | — | 23,375 | ||||||
Over $190.00 | 22,500 | 23,750 | ||||||
Total | 129,513 | 106,518 | ||||||
Weighted average share price | $ | 50.32 | $ | 48.13 | ||||
Other Share-Based Awards
The Company’s other share-based and similar types of awards are composed of restricted shares and, through August 29, 2016, Equity Appreciation Rights (“EAR”). Effective August 29, 2016, the EAR plans were terminated.
The restricted shares are service-based awards that vest over one to four years with either annual cliff vesting, vesting of all of the restricted shares at the end of the vesting period or vesting beginning after two years of service. The Company granted 13 thousand restricted shares (at a weighted average price of $26.66 per share) during the year ended December 31, 2016.
The following table summarizes the activity related to our restricted shares:
Number of restricted shares | ||
Outstanding at December 31, 2015 | 272,326 | |
Granted | 12,878 | |
Issued | (38,074 | ) |
Forfeited | (15,400 | ) |
Outstanding at December 31, 2016 | 231,730 | |
Share-based compensation expense for stock options and restricted shares is recorded net of estimated forfeiture rates ranging from 0% to 40%.
83
ALTISOURCE PORTFOLIO SOLUTIONS S.A.
Notes to Consolidated Financial Statements (Continued)
NOTE 17 — REVENUE
Revenue includes service revenue, reimbursable expenses and non-controlling interests. Service revenue consists of amounts attributable to our fee-based services. Reimbursable expenses and non-controlling interests are pass-through items for which we earn no margin. Reimbursable expenses consist of amounts we incur on behalf of our customers in performing our fee-based services that we pass directly on to our customers without a markup. Non-controlling interests represent the earnings of Lenders One and Wholesale One, consolidated entities not owned by Altisource, and are included in revenue and reduced from net income to arrive at net income attributable to Altisource (see Note 2). The components of revenue were as follows for the years ended December 31:
(in thousands) | 2016 | 2015 | 2014 | |||||||||
Service revenue | $ | 942,599 | $ | 940,920 | $ | 938,679 | ||||||
Reimbursable expenses | 52,011 | 107,344 | 137,634 | |||||||||
Non-controlling interests | 2,693 | 3,202 | 2,603 | |||||||||
Total | $ | 997,303 | $ | 1,051,466 | $ | 1,078,916 | ||||||
NOTE 18 — COST OF REVENUE
Cost of revenue principally includes payroll and employee benefits associated with personnel employed in customer service and operations roles, fees paid to external providers related to the provision of services, reimbursable expenses, technology and telecommunications costs as well as depreciation and amortization of operating assets. The components of cost of revenue were as follows for the years ended December 31:
(in thousands) | 2016 | 2015 | 2014 | |||||||||
Compensation and benefits | $ | 264,796 | $ | 261,839 | $ | 255,889 | ||||||
Outside fees and services | 302,156 | 248,278 | 243,325 | |||||||||
Reimbursable expenses | 52,011 | 107,344 | 137,634 | |||||||||
Technology and telecommunications | 44,295 | 43,177 | 48,834 | |||||||||
Depreciation and amortization | 26,787 | 26,689 | 21,498 | |||||||||
Total | $ | 690,045 | $ | 687,327 | $ | 707,180 | ||||||
NOTE 19 — SELLING, GENERAL AND ADMINISTRATIVE EXPENSES
Selling, general and administrative expenses include payroll and employee benefits associated with personnel employed in executive, finance, law, compliance, human resources, vendor management, risk management, sales and marketing roles. This category also includes occupancy costs, professional fees, marketing costs, depreciation and amortization of non-operating assets and other expenses. The components of selling, general and administrative expenses were as follows for the years ended December 31:
(in thousands) | 2016 | 2015 | 2014 | |||||||||
Compensation and benefits | $ | 55,577 | $ | 54,897 | $ | 45,098 | ||||||
Professional services | 23,284 | 23,183 | 18,598 | |||||||||
Occupancy related costs | 37,370 | 39,917 | 38,262 | |||||||||
Amortization of intangible assets | 47,576 | 41,135 | 37,680 | |||||||||
Depreciation and amortization | 10,001 | 9,781 | 7,548 | |||||||||
Marketing costs | 27,847 | 27,499 | 24,130 | |||||||||
Other | 12,500 | 24,456 | 30,417 | |||||||||
Total | $ | 214,155 | $ | 220,868 | $ | 201,733 | ||||||
84
ALTISOURCE PORTFOLIO SOLUTIONS S.A.
Notes to Consolidated Financial Statements (Continued)
NOTE 20 — OTHER INCOME (EXPENSE), NET
Other income (expense), net consists of the following for the years ended December 31:
(in thousands) | 2016 | 2015 | 2014 | |||||||||
Gain on early extinguishment of debt | $ | 5,464 | $ | 3,836 | $ | — | ||||||
Expenses related to the purchase of available for sale securities | (3,356 | ) | — | — | ||||||||
Loss on HLSS equity securities and dividends received, net | — | (1,854 | ) | — | ||||||||
Interest income | 91 | 133 | 103 | |||||||||
Other, net | 1,431 | 76 | 71 | |||||||||
Total | $ | 3,630 | $ | 2,191 | $ | 174 | ||||||
During March 2015, we purchased 1.6 million shares of HLSS common stock in the open market for $30.0 million. This investment was classified as available for sale. On April 6, 2015, HLSS completed the sale of substantially all of its assets to New Residential Investment Corp. (“NRZ”) and adopted a plan of complete liquidation and dissolution. During April 2015, we received liquidating dividends and other dividends from HLSS totaling $20.4 million and we sold all of our 1.6 million shares of HLSS common stock in the open market for $7.7 million. As a result of these transactions, we recognized a net loss of $1.9 million for the year ended December 31, 2015 (no comparative amounts for 2016 and 2014) in connection with our investment in HLSS.
NOTE 21 — INCOME TAXES
The components of income before income taxes and non-controlling interests consist of the following for the years ended December 31:
(in thousands) | 2016 | 2015 | 2014 | |||||||||
Domestic - Luxembourg | $ | 8,498 | $ | 27,884 | $ | 124,181 | ||||||
Foreign - U.S. | 16,655 | 5,944 | 9,575 | |||||||||
Foreign - Non-U.S. | 19,168 | 19,232 | 13,509 | |||||||||
Total | $ | 44,321 | $ | 53,060 | $ | 147,265 | ||||||
The income tax provision consists of the following for the years ended December 31:
(in thousands) | 2016 | 2015 | 2014 | |||||||||
Current: | ||||||||||||
Domestic - Luxembourg | $ | 160 | $ | 1,787 | $ | 4,415 | ||||||
Foreign - U.S. Federal | 9,556 | 539 | 75 | |||||||||
Foreign - U.S. State | 258 | 855 | 476 | |||||||||
Foreign - Non-U.S. | 5,558 | 6,405 | 4,046 | |||||||||
$ | 15,532 | $ | 9,586 | $ | 9,012 | |||||||
Deferred: | ||||||||||||
Domestic - Luxembourg | $ | 432 | $ | — | $ | — | ||||||
Foreign - U.S. Federal | (3,065 | ) | (108 | ) | 1,756 | |||||||
Foreign - U.S. State | (100 | ) | (526 | ) | (281 | ) | ||||||
Foreign - Non-U.S. | 136 | (692 | ) | (309 | ) | |||||||
$ | (2,597 | ) | $ | (1,326 | ) | $ | 1,166 | |||||
Total | $ | 12,935 | $ | 8,260 | $ | 10,178 | ||||||
We received a tax ruling in June 2010 regarding the treatment of certain intangibles that exist for purposes of determining the Company’s taxable income, which expires in 2019 unless extended or renewed. This ruling does not have a material impact on our deferred tax assets or liabilities. Income tax computed by applying the Luxembourg statutory income tax rate of 29.2% differs
85
ALTISOURCE PORTFOLIO SOLUTIONS S.A.
Notes to Consolidated Financial Statements (Continued)
from income tax computed at the effective tax rate primarily because of the effect of the tax ruling and differing tax rates in multiple jurisdictions.
We operate under tax holidays in certain geographies in India, the Philippines and Uruguay. The India tax holidays are effective through 2020, and may be extended if certain additional requirements are satisfied. The Philippines tax holiday is effective through June 2017, and may also be extended. We operate in a Uruguay free trade zone that provides an indefinite future tax benefit. The tax holidays are conditional upon our meeting certain employment and investment thresholds. The impact of these tax holidays decreased foreign taxes by $0.9 million ($0.04 per diluted share), $0.8 million ($0.04 per diluted share) and $0.9 million ($0.04 per diluted share) for the years ended December 31, 2016, 2015 and 2014, respectively.
The Company accounts for certain income and expense items differently for financial reporting purposes and income tax purposes. We recognize deferred income tax assets and liabilities for these differences between the financial reporting basis and the tax basis of our assets and liabilities as well as expected benefits of utilizing net operating loss and credit carryforwards. We measure deferred income tax assets and liabilities using enacted tax rates expected to apply to taxable income in the years in which we expect to recover or settle those temporary differences.
A summary of the tax effects of the temporary differences is as follows for the years ended December 31:
(in thousands) | 2016 | 2015 | ||||||
Non-current deferred tax assets: | ||||||||
Net operating loss carryforwards | $ | 5,891 | $ | 5,417 | ||||
U.S. federal and state tax credits | 316 | 2,577 | ||||||
Non-U.S. deferred tax assets | 3,674 | 2,472 | ||||||
Share-based compensation | 2,486 | 1,750 | ||||||
Accrued expenses | 11,527 | 7,730 | ||||||
Non-current deferred tax liabilities: | ||||||||
Intangible assets | (4,203 | ) | (4,508 | ) | ||||
Depreciation | (6,964 | ) | (7,446 | ) | ||||
Non-U.S. deferred tax liability | (1,342 | ) | — | |||||
Other | (626 | ) | (815 | ) | ||||
10,759 | 7,177 | |||||||
Valuation allowance | (3,467 | ) | (3,558 | ) | ||||
Non-current deferred tax assets, net | $ | 7,292 | $ | 3,619 | ||||
A valuation allowance is provided when it is deemed more likely than not that some portion or all of a deferred tax asset will not be realized. In determining whether a valuation allowance is needed, we considered estimates of future taxable income, future reversals of temporary differences, the tax character of gains and losses and the impact of tax planning strategies that can be implemented, if warranted. The net decrease in valuation allowance of $0.1 million during 2016 relates to a decrease in the tax rate applied to the valuation allowance and a decrease in foreign losses generated in the current year that the Company believes will more likely than not be realized.
We have not provided Luxembourg deferred taxes on cumulative earnings of non-Luxembourg affiliates as we have chosen to indefinitely reinvest these earnings. The earnings reinvested as of December 31, 2016 were approximately $71.9 million, which if distributed would result in additional tax due totaling approximately $13.4 million.
The Company had a deferred tax asset of $5.9 million as of December 31, 2016 relating to Luxembourg, U.S. federal, state and foreign net operating losses compared to $5.4 million as of December 31, 2015. Of this amount, $1.4 million as of December 31, 2016 related to state net operating losses subject to a valuation allowance compared to $1.6 million as of December 31, 2015, and $2.2 million as of December 31, 2016 related to Luxembourg net operating losses subject to a valuation allowance compared to $2.3 million as of December 31, 2015. The gross amount of net operating losses available for carryover to future years is approximately $17.3 million as of December 31, 2016 compared to $14.8 million as of December 31, 2015. These losses are scheduled to expire between the years 2023 and 2036. Of this amount, $6.9 million as of December 31, 2016 compared to $10.1 million as of December 31, 2015 relates to Nationwide Credit, Inc. (“NCI”) for periods prior to our acquisition of NCI and is subject to Section 382 of the Internal Revenue Code (the “Code”) which limits their use to approximately $1.3 million per year.
86
ALTISOURCE PORTFOLIO SOLUTIONS S.A.
Notes to Consolidated Financial Statements (Continued)
In addition, the Company had a deferred tax asset of $0.3 million and $2.6 million as of December 31, 2016 and 2015, respectively, relating to the U.S. federal and state tax credits. The U.S. federal credit carryforward is scheduled to expire between 2032 and 2036. The state tax credit carryforwards are scheduled to expire between 2017 and 2026.
The following table reconciles the Luxembourg statutory tax rate to our effective tax rate for the years ended December 31:
2016 | 2015 | 2014 | |||||||
Statutory tax rate | 29.22 | % | 29.22 | % | 29.22 | % | |||
Permanent difference related to Luxembourg intangible assets | — | (13.56 | ) | (22.60 | ) | ||||
Change in valuation allowance | (0.08 | ) | 0.83 | (0.05 | ) | ||||
State tax expense | 2.30 | 0.29 | 0.03 | ||||||
Tax credits | (1.81 | ) | (2.34 | ) | (0.71 | ) | |||
Uncertain taxes | (3.65 | ) | 1.39 | 0.88 | |||||
Other | 3.20 | (0.26 | ) | 0.14 | |||||
Effective tax rate | 29.18 | % | 15.57 | % | 6.91 | % | |||
The Company follows ASC Topic 740 which clarifies the accounting and disclosure for uncertainty in tax positions. We analyzed our tax filing positions in all of the domestic and foreign tax jurisdictions where we are required to file income tax returns as well as for all open tax years in these jurisdictions. The Company has open tax years in the United States (2013 through 2015), India (2010 through 2016) and Luxembourg (2010 through 2014).
The following table reconciles the amount of unrecognized tax benefits for the years ended December 31:
(in thousands) | 2016 | 2015 | ||||||
Amount of unrecognized tax benefits as of the beginning of the year | $ | 2,005 | $ | 1,153 | ||||
Decreases as a result of tax positions taken in a prior period | (1,527 | ) | — | |||||
Increases as a result of tax positions taken in a prior period | 60 | 638 | ||||||
Increases as a result of tax positions taken in the current period | 220 | 214 | ||||||
Amount of unrecognized tax benefits as of the end of the year | $ | 758 | $ | 2,005 | ||||
The total amount of unrecognized tax benefits including interest and penalties that, if recognized, would affect the effective tax rate is $0.6 million and $2.1 million as of December 31, 2016 and 2015, respectively. The Company recognizes interest, if any, related to unrecognized tax benefits as a component of income tax expense. As of December 31, 2016 and 2015, the Company had recorded accrued interest and penalties related to unrecognized tax benefits of less than $0.1 million and $0.2 million, respectively.
NOTE 22 — EARNINGS PER SHARE
Basic EPS is computed by dividing income available to common shareholders by the weighted average number of common shares outstanding for the period. Diluted EPS reflects the assumed conversion of all dilutive securities using the treasury stock method.
87
ALTISOURCE PORTFOLIO SOLUTIONS S.A.
Notes to Consolidated Financial Statements (Continued)
Basic and diluted EPS are calculated as follows for the years ended December 31:
(in thousands, except per share data) | 2016 | 2015 | 2014 | |||||||||
Net income attributable to Altisource | $ | 28,693 | $ | 41,598 | $ | 134,484 | ||||||
Weighted average common shares outstanding, basic | 18,696 | 19,504 | 21,625 | |||||||||
Dilutive effect of stock options and restricted shares | 916 | 1,115 | 2,009 | |||||||||
Weighted average common shares outstanding, diluted | 19,612 | 20,619 | 23,634 | |||||||||
Earnings per share: | ||||||||||||
Basic | $ | 1.53 | $ | 2.13 | $ | 6.22 | ||||||
Diluted | $ | 1.46 | $ | 2.02 | $ | 5.69 | ||||||
For the years ended December 31, 2016, 2015 and 2014, 0.4 million options, 0.6 million options and less than 0.1 million options, respectively, that were anti-dilutive have been excluded from the computation of diluted EPS. These options were anti-dilutive and excluded from the computation of diluted EPS because their exercise price was greater than the average market price of our common stock. Also excluded from the computation of diluted EPS are 0.4 million options, 0.3 million options and 0.1 million options for the years ended December 31, 2016, 2015 and 2014, respectively, granted for shares that begin to vest upon the achievement of certain market criteria related to our common stock price, performance criteria and an annualized rate of return to shareholders that have not yet been met.
NOTE 23 — COMMITMENTS, CONTINGENCIES AND REGULATORY MATTERS
Litigation
From time to time, we are involved in legal and administrative proceedings arising in the course of our business. We record a liability for these matters if an unfavorable outcome is probable and the amount of loss can be reasonably estimated, including expected insurance coverage. For proceedings where the reasonable estimate of loss is a range, we record a best estimate of loss within the range.
On September 8, 2014, the West Palm Beach Firefighters’ Pension Fund filed a putative securities class action suit against Altisource Portfolio Solutions S.A. and certain of its current or former officers and directors in the United States District Court for the Southern District of Florida alleging violations of the Securities Exchange Act of 1934 and Rule 10b-5 with regard to disclosures concerning pricing and transactions with related parties that allegedly inflated Altisource Portfolio Solutions S.A. share prices. The Court subsequently appointed the Pension Fund for the International Union of Painters and Allied Trades District Council 35 and the Annuity Fund for the International Union of Painters and Allied Trades District Council 35 as Lead Plaintiffs. On January 30, 2015, Lead Plaintiffs filed an amended class action complaint which added Ocwen Financial Corporation as a defendant, and seeks a determination that the action may be maintained as a class action on behalf of purchasers of Altisource Portfolio Solutions S.A. securities between April 25, 2013 and December 21, 2014 and an unspecified amount of damages. Altisource Portfolio Solutions S.A. moved to dismiss the suit on March 23, 2015. On September 4, 2015, the Court granted the defendants’ motion to dismiss, finding that the Lead Plaintiffs’ amended complaint failed to state a claim as to any of the defendants, but permitting the Lead Plaintiffs to file another amended complaint. Lead Plaintiffs subsequently filed second and third amended complaints with substantially similar claims and theories. Altisource Portfolio Solutions S.A. moved to dismiss the third amended complaint on October 22, 2015. On December 22, 2015, the Court issued an order dismissing with prejudice all claims against Ocwen Financial Corporation and certain claims against Altisource Portfolio Solutions S.A. and the officer and director defendants, but denying the motion to dismiss as to other claims. On December 19, 2016, the Court granted Lead Plaintiffs leave to file the fourth amended complaint, and Lead Plaintiffs filed the fourth amended complaint on December 28, 2016. On January 6, 2017, Defendants filed a motion to strike certain matters from the fourth amended complaint and a motion to dismiss certain claims pled in the fourth amended complaint. Before the Court ruled on Defendants’ motions, the parties notified the Court on January 19, 2017 of their agreement to settle the action, which is subject to Court approval. On February 10, 2017, the Court entered an order preliminarily approving the settlement, certifying a settlement class, approving the form and content of notice of the settlement to class members, and setting a hearing for May 30, 2017 to determine whether the settlement should be approved and the case dismissed with prejudice. Under the proposed settlement, Altisource Portfolio Solutions S.A. will pay a total of $32 million in cash, a portion of which will be funded by insurance proceeds, to a settlement fund to resolve all claims asserted and which could have been asserted on behalf of investors who purchased or otherwise acquired Altisource Portfolio Solutions S.A. stock between April 25, 2013 and
88
ALTISOURCE PORTFOLIO SOLUTIONS S.A.
Notes to Consolidated Financial Statements (Continued)
December 21, 2014. The proposed settlement provides that Altisource Portfolio Solutions S.A. and the officer and director defendants deny all claims of wrongdoing or liability.
On February 11, 2015, W.A. Sokolowski, an alleged shareholder of Ocwen Financial Corporation, filed an amended shareholder derivative complaint in the United States District Court for the Southern District of Florida against Ocwen Financial Corporation (as a nominal defendant), certain of its current or former officers and directors, Altisource Portfolio Solutions S.A. and other companies. The suit seeks recovery of an unspecified amount of damages for alleged breaches of fiduciary duty by Ocwen Financial Corporation’s officers and directors, which were allegedly aided and abetted by Altisource Portfolio Solutions S.A. and other defendants. Altisource Portfolio Solutions S.A. filed a motion to dismiss the complaint on November 9, 2015. While that motion was pending, additional lawsuits alleging similar claims for alleged breaches of fiduciary duties by current or former Ocwen Financial Corporation officers and directors were filed in or transferred to the Court. The Court subsequently consolidated these actions and denied Altisource Portfolio Solutions S.A.’s motion to dismiss the Sokolowski complaint without prejudice to re-file following appointment of lead counsel for the consolidated action and the filing or designation of an operative complaint. Lead counsel for plaintiffs filed their Consolidated Verified Shareholder Derivative Complaint (the “Consolidated Complaint”) on March 8, 2016. The Consolidated Complaint alleges claims that Altisource Portfolio Solutions S.A., its subsidiary Beltline Road Insurance Agency, Inc. and other defendants aided and abetted alleged breaches of fiduciary duties by Ocwen Financial Corporation officers and directors and/or were unjustly enriched in connection with business dealings with Ocwen Financial Corporation. The Consolidated Complaint also seeks contribution from Altisource Portfolio Solutions S.A., its subsidiary Beltline Road Insurance Agency, Inc. and other defendants for amounts Ocwen Financial Corporation paid in connection with a settlement with the New York State Department of Financial Services. Altisource Portfolio Solutions S.A. and Beltline Road Insurance Agency, Inc. filed motions to dismiss the Consolidated Complaint on May 13, 2016. On October 13, 2016, the Court disclosed that the parties reached a settlement at a settlement conference held that same day. Following a Final Approval Hearing on January 18, 2017, the Court granted final approval of the settlement and entered a judgment dismissing the action with prejudice. Neither Altisource Portfolio Solutions S.A. nor Beltline Road Insurance Agency, Inc. made any monetary contribution to the settlement, and both Altisource Portfolio Solutions S.A. and Beltline Road Insurance Agency, Inc. deny all claims of wrongdoing or liability in connection with the Sokolowski action.
On March 26, 2015, Robert Moncavage, an alleged shareholder of Ocwen Financial Corporation, filed an amended shareholder derivative complaint in the Circuit Court of the Fifteenth Judicial Circuit in and for Palm Beach County, Florida against Ocwen Financial Corporation (as a nominal defendant), certain of its current or former officers and directors, Altisource Portfolio Solutions S.A. and other companies. The suit seeks recovery of an unspecified amount of damages for alleged breaches of fiduciary duties by the current or former Ocwen Financial Corporation officers and directors, which were allegedly aided and abetted by Altisource Portfolio Solutions S.A. and other defendants. On November 9, 2015, the Court entered an order staying all proceedings in the case pending further order of the Court. The judgment entered in connection with the Sokolowski action discussed above bars further prosecution of all claims asserted, or that could have been asserted, in this action based on the facts, events, conduct, and transactions alleged, all of which were released as part of the Sokolowski settlement. On February 9, 2017, the plaintiff filed a notice of voluntary dismissal without prejudice and submitted a proposed order to the Court asking it to approve the dismissal of plaintiff’s claims against all defendants. The proposed order dismissing the action without prejudice is currently pending with the Court. Altisource Portfolio Solutions S.A. denies all claims of wrongdoing or liability in connection with the Moncavage action.
In addition to the matters referenced above, we are involved in legal actions in the course of our business, some of which seek monetary damages. We do not believe that the outcome of these proceedings, both individually and in the aggregate, will have a material impact on our financial condition, results of operations or cash flows.
Regulatory Matters
Periodically, we are subject to audits, examinations and investigations by federal, state and local governmental authorities and receive subpoenas, civil investigative demands or other requests for information from such governmental authorities in connection with their regulatory or investigative authority. We are currently responding to such inquiries from governmental authorities relating to certain aspects of our business. We believe it is premature to predict the potential outcome or to estimate any potential financial impact in connection with these inquiries.
In addition, on November 10, 2016, Altisource received a Notice and Opportunity to Respond and Advise (“NORA”) letter from the Consumer Financial Protection Bureau (“CFPB”) indicating that the CFPB is considering a potential enforcement action against Altisource relating to an alleged violation of federal law that primarily concerns certain technology services provided to Ocwen. The NORA letter provides the recipient an opportunity to present its positions to the CFPB before an enforcement action is recommended or commenced. On December 15, 2016, we provided a written response to the NORA letter setting forth the legal, policy and factual reasons why we believe an enforcement action is not warranted. We are committed to resolving any potential concerns of the CFPB. If the CFPB were to bring an enforcement action against us, the resolution of such action could have a
89
ALTISOURCE PORTFOLIO SOLUTIONS S.A.
Notes to Consolidated Financial Statements (Continued)
material adverse impact on our business, reputation, financial condition and results of operations. However, we believe it is premature to predict the potential outcome or to estimate any potential financial impact in connection with any potential CFPB enforcement action that may be under consideration.
Ocwen Related Matters
Ocwen is our largest customer and 56% of our 2016 revenue was from Ocwen. Additionally, 19% of our 2016 revenue was earned on the portfolios serviced by Ocwen, when a party other than Ocwen selected Altisource as the service provider.
Ocwen has disclosed that it is subject to a number of ongoing federal and state regulatory examinations, consent orders, inquiries, requests for information and other actions and is subject to pending legal proceedings that have or could result in adverse regulatory or other actions against Ocwen. While not all inclusive, regulatory actions to date have included subjecting Ocwen to independent oversight of its operations and placing certain restrictions on its ability to acquire servicing rights. Ocwen may become subject to future federal and state regulatory investigations, inquiries, requests for information and legal proceedings, any of which could also result in adverse regulatory or other actions against Ocwen.
As a result of the sale of substantially all of the assets of HLSS to NRZ in April of 2015, NRZ owned the rights to approximately 78% of Ocwen’s non-government-sponsored enterprise (“non-GSE”) servicing rights as of September 30, 2016. Under an agreement between NRZ and Ocwen, NRZ has the right (not necessarily the obligation or ability) to transfer servicing away from Ocwen if Ocwen does not maintain certain minimum servicer ratings on or after April 6, 2017.
Any or all of the foregoing may have significant adverse effects on Ocwen’s business and our continuing relationships with Ocwen. For example, Ocwen may be required to alter the way it conducts business, including the parties it contracts with for services (including information technology and software services), it may be required to seek changes to its existing pricing structure with us, it may lose or sell some or all of its non-GSE servicing rights or subservicing arrangements or may lose one or more of its state servicing licenses. Additional regulatory actions or adverse financial developments may impose additional restrictions on or require changes in Ocwen’s business that could require it to sell assets or change its business operations. Any or all of these effects could result in our eventual loss of Ocwen as a customer or a reduction in the number and/or volume of services they purchase from us or the loss of other customers.
If any of the following events occurred, Altisource’s revenue would be significantly lower and our results of operations could be materially adversely affected, including from the possible impairment or write-off of goodwill, intangible assets, property and equipment, other assets and accounts receivable:
• | Altisource loses Ocwen as a customer or there is a significant reduction in the volume of services they purchase from us |
• | Ocwen loses or sells a significant portion or all of its non-GSE servicing rights or subservicing arrangements and Altisource fails to be retained as a service provider |
• | Ocwen loses state servicing licenses in states with a significant number of loans in Ocwen’s servicing portfolio |
• | Altisource fails to be retained as a service provider |
• | The contractual relationship between Ocwen and Altisource changes significantly or there are significant changes to our pricing to Ocwen for services from which we generate material revenue |
Management cannot predict the outcome of the above Ocwen related matters or the impact they may have on Altisource. However, in the event these Ocwen related matters materially negatively impact Altisource, we believe the variable nature of our cost structure would allow us to realign our cost structure in line with remaining revenue. Furthermore, in the event of a significant reduction in the volume of services purchased or loans serviced by Ocwen, we believe the impact to Altisource could occur over an extended period of time.
In this regard, we have a plan that we believe would allow us to efficiently execute on this realignment. We believe that transfers of Ocwen’s servicing rights to a successor servicer(s) would take an extended period of time because of the approval required from many parties, including regulators, rating agencies, residential mortgage-backed securities trustees, lenders and others. During this period of time, we believe we would continue to generate revenue from the services we provide to the transferred portfolio. Additionally, we have several strategic initiatives that focus on diversifying and growing our revenue and customer base. Our major strategic initiatives include growing our:
• | Servicer Solutions business |
• | Origination Solutions business |
• | Consumer Real Estate Solutions business |
• | Real Estate Investor Solutions business |
90
ALTISOURCE PORTFOLIO SOLUTIONS S.A.
Notes to Consolidated Financial Statements (Continued)
We have a sales and marketing strategy to support these initiatives.
Management believes our plans, together with current liquidity and cash flows from operations would be sufficient to meet working capital, capital expenditures, debt service and other cash needs. However, there can be no assurance that our plans will be successful or our operations will be profitable.
Leases
We lease certain premises and equipment under various operating lease agreements. Future minimum lease payments at December 31, 2016 under non-cancelable operating leases with an original term exceeding one year are as follows:
(in thousands) | Operating lease obligations | |||
2017 | $ | 17,857 | ||
2018 | 13,560 | |||
2019 | 10,706 | |||
2020 | 7,406 | |||
2021 | 5,469 | |||
Thereafter | 1,154 | |||
$ | 56,152 | |||
Total operating lease expense, net of sublease income, was $17.6 million, $20.0 million and $20.1 million for the years ended December 31, 2016, 2015 and 2014, respectively. Sublease income was $0.5 million, less than $0.1 million and $0.2 million for the years ended December 31, 2016, 2015 and 2014, respectively. The minimum lease payments at December 31, 2016 in the table above have not been reduced by minimum sublease rentals of $3.1 million due in the future under non-cancelable subleases. The operating leases generally relate to office locations and reflect customary lease terms which range from 1 to 9 years in duration.
We have executed four standby letters of credit totaling $2.1 million, related to four office leases that are secured by cash balances.
Escrow and Trust Balances
We hold customers’ assets in escrow and trust accounts at various financial institutions pending completion of certain real estate activities. We also hold cash in trust accounts at various financial institutions where contractual obligations mandate maintaining dedicated bank accounts for our Financial Services segment’s collections. These amounts are held in escrow and trust accounts for limited periods of time and are not included in the consolidated balance sheets. Amounts held in escrow and trust accounts were $64.1 million and $66.6 million at December 31, 2016 and 2015, respectively.
NOTE 24 — SEGMENT REPORTING
Our business segments are based upon our organizational structure, which focuses primarily on the services offered, and are consistent with the internal reporting used by our Chief Executive Officer (our Chief Operating Decision Maker) to evaluate operating performance and to assess the allocation of our resources.
We classify our businesses into three reportable segments. The Mortgage Services segment provides loan servicers, originators, rental property investors and real estate consumers with products, services and technologies that span the mortgage and real estate lifecycle. The Financial Services segment provides collection services primarily to debt originators and servicers (e.g., credit card, auto lending, retail credit and mortgage) and customer relationship management services primarily to the utility, insurance and hotel industries. The Technology Services segment provides software and data analytics solutions that support the management of mortgage and real estate activities and marketplace transactions across the mortgage and real estate lifecycles and IT infrastructure management services. In addition, Corporate Items and Eliminations include eliminations of transactions between the reportable segments, interest expense and costs related to corporate support functions including executive, finance, law, compliance, human resources, vendor management, risk management and sales and marketing costs not allocated to the business units. Intercompany transactions primarily consist of IT infrastructure management services.
91
ALTISOURCE PORTFOLIO SOLUTIONS S.A.
Notes to Consolidated Financial Statements (Continued)
Financial information for our segments is as follows:
For the year ended December 31, 2016 | ||||||||||||||||||||
(in thousands) | Mortgage Services | Financial Services | Technology Services | Corporate Items and Eliminations | Consolidated Altisource | |||||||||||||||
Revenue | $ | 804,539 | $ | 74,352 | $ | 160,101 | $ | (41,689 | ) | $ | 997,303 | |||||||||
Cost of revenue | 514,832 | 53,841 | 159,869 | (38,497 | ) | 690,045 | ||||||||||||||
Gross profit (loss) | 289,707 | 20,511 | 232 | (3,192 | ) | 307,258 | ||||||||||||||
Selling, general and administrative expenses | 108,987 | 17,768 | 27,811 | 59,589 | 214,155 | |||||||||||||||
Litigation settlement loss, net of $4,000 insurance recovery | — | — | — | 28,000 | 28,000 | |||||||||||||||
Income (loss) from operations | 180,720 | 2,743 | (27,579 | ) | (90,781 | ) | 65,103 | |||||||||||||
Other income (expense), net | 43 | 92 | 66 | (20,983 | ) | (20,782 | ) | |||||||||||||
Income (loss) before income taxes and non-controlling interests | $ | 180,763 | $ | 2,835 | $ | (27,513 | ) | $ | (111,764 | ) | $ | 44,321 | ||||||||
For the year ended December 31, 2015 | ||||||||||||||||||||
(in thousands) | Mortgage Services | Financial Services | Technology Services | Corporate Items and Eliminations | Consolidated Altisource | |||||||||||||||
Revenue | $ | 786,648 | $ | 88,448 | $ | 215,482 | $ | (39,112 | ) | $ | 1,051,466 | |||||||||
Cost of revenue | 474,169 | 60,806 | 187,835 | (35,483 | ) | 687,327 | ||||||||||||||
Gross profit (loss) | 312,479 | 27,642 | 27,647 | (3,629 | ) | 364,139 | ||||||||||||||
Selling, general and administrative expenses | 105,153 | 18,707 | 29,902 | 67,106 | 220,868 | |||||||||||||||
Impairment losses | — | — | 71,785 | — | 71,785 | |||||||||||||||
Change in the fair value of Equator Earn Out | — | — | (7,591 | ) | — | (7,591 | ) | |||||||||||||
Income (loss) from operations | 207,326 | 8,935 | (66,449 | ) | (70,735 | ) | 79,077 | |||||||||||||
Other income (expense), net | 506 | 58 | 61 | (26,642 | ) | (26,017 | ) | |||||||||||||
Income (loss) before income taxes and non-controlling interests | $ | 207,832 | $ | 8,993 | $ | (66,388 | ) | $ | (97,377 | ) | $ | 53,060 | ||||||||
For the year ended December 31, 2014 | ||||||||||||||||||||
(in thousands) | Mortgage Services | Financial Services | Technology Services | Corporate Items and Eliminations | Consolidated Altisource | |||||||||||||||
Revenue | $ | 793,143 | $ | 98,499 | $ | 227,300 | $ | (40,026 | ) | $ | 1,078,916 | |||||||||
Cost of revenue | 486,387 | 64,338 | 192,426 | (35,971 | ) | 707,180 | ||||||||||||||
Gross profit (loss) | 306,756 | 34,161 | 34,874 | (4,055 | ) | 371,736 | ||||||||||||||
Selling, general and administrative expenses | 94,686 | 18,791 | 32,393 | 55,863 | 201,733 | |||||||||||||||
Impairment losses | — | — | 37,473 | — | 37,473 | |||||||||||||||
Change in the fair value of Equator Earn Out | — | — | (37,924 | ) | — | (37,924 | ) | |||||||||||||
Income (loss) from operations | 212,070 | 15,370 | 2,932 | (59,918 | ) | 170,454 | ||||||||||||||
Other income (expense), net | 204 | 62 | (31 | ) | (23,424 | ) | (23,189 | ) | ||||||||||||
Income (loss) before income taxes and non-controlling interests | $ | 212,274 | $ | 15,432 | $ | 2,901 | $ | (83,342 | ) | $ | 147,265 | |||||||||
92
ALTISOURCE PORTFOLIO SOLUTIONS S.A.
Notes to Consolidated Financial Statements (Continued)
(in thousands) | Mortgage Services | Financial Services | Technology Services | Corporate Items and Eliminations | Consolidated Altisource | |||||||||||||||
Total assets: | ||||||||||||||||||||
December 31, 2016 | $ | 306,207 | $ | 38,746 | $ | 130,032 | $ | 214,227 | $ | 689,212 | ||||||||||
December 31, 2015 | 325,461 | 53,757 | 165,778 | 176,802 | 721,798 | |||||||||||||||
Our services are provided to customers primarily located in the United States. Premises and equipment, net consist of the following, by country:
(in thousands) | December 31, 2016 | December 31, 2015 | ||||||
United States | $ | 71,418 | $ | 85,021 | ||||
India | 14,006 | 21,187 | ||||||
Luxembourg | 14,791 | 9,944 | ||||||
Philippines | 3,027 | 2,664 | ||||||
Uruguay | 231 | 305 | ||||||
Total | $ | 103,473 | $ | 119,121 | ||||
NOTE 25 — QUARTERLY FINANCIAL DATA (UNAUDITED)
The following tables contain selected unaudited statement of operations information for each quarter of 2016 and 2015. The following information reflects all normal recurring adjustments necessary for a fair presentation of the information for the periods presented. The operating results for any quarter are not necessarily indicative of results for any future period. Our business is affected by seasonality.
2016 quarter ended (1)(2)(3) | ||||||||||||||||
(in thousands, except per share data) | March 31, | June 30, | September 30, | December 31, | ||||||||||||
Revenue | $ | 250,132 | $ | 255,799 | $ | 252,745 | $ | 238,627 | ||||||||
Gross profit | 81,269 | 81,428 | 78,743 | 65,818 | ||||||||||||
Income (loss) before income taxes and non-controlling interests | 21,085 | 23,977 | 18,796 | (19,537 | ) | |||||||||||
Net income (loss) | 18,892 | 20,686 | 11,472 | (19,664 | ) | |||||||||||
Net income (loss) attributable to Altisource | 18,494 | 19,994 | 10,589 | (20,384 | ) | |||||||||||
Earnings (loss) per share: | ||||||||||||||||
Basic | $ | 0.98 | $ | 1.08 | $ | 0.57 | $ | (1.08 | ) | |||||||
Diluted | $ | 0.92 | $ | 1.02 | $ | 0.54 | $ | (1.08 | ) | |||||||
Weighted average shares outstanding: | ||||||||||||||||
Basic | 18,855 | 18,437 | 18,715 | 18,788 | ||||||||||||
Diluted | 20,040 | 19,604 | 19,568 | 18,788 | ||||||||||||
93
ALTISOURCE PORTFOLIO SOLUTIONS S.A.
Notes to Consolidated Financial Statements (Continued)
2015 quarter ended (1)(4)(5)(6) | ||||||||||||||||
(in thousands, except per share data) | March 31, | June 30, | September 30, | December 31, | ||||||||||||
Revenue | $ | 240,482 | $ | 268,321 | $ | 272,776 | $ | 269,887 | ||||||||
Gross profit | 67,656 | 100,162 | 98,926 | 97,395 | ||||||||||||
Income (loss) before income taxes and non-controlling interests | 4,808 | 51,244 | 41,200 | (44,192 | ) | |||||||||||
Net income (loss) | 4,408 | 46,846 | 37,897 | (44,351 | ) | |||||||||||
Net income (loss) attributable to Altisource | 3,698 | 45,950 | 37,046 | (45,096 | ) | |||||||||||
Earnings (loss) per share: | ||||||||||||||||
Basic | $ | 0.18 | $ | 2.35 | $ | 1.94 | $ | (2.35 | ) | |||||||
Diluted | $ | 0.18 | $ | 2.22 | $ | 1.82 | $ | (2.35 | ) | |||||||
Weighted average shares outstanding: | ||||||||||||||||
Basic | 20,172 | 19,571 | 19,091 | 19,196 | ||||||||||||
Diluted | 20,995 | 20,669 | 20,411 | 19,196 | ||||||||||||
______________________________________
(1) | The sum of quarterly amounts, including per share amounts, may not equal amounts reported for year-to-date periods. This is due to the effects of rounding and changes in the number of weighted average shares outstanding for each period. |
(2) | We acquired Granite on July 29, 2016 (see Note 5). |
(3) | During the fourth quarter of 2016, Altisource recorded a litigation settlement loss of $32.0 million in connection with a litigation matter. Also during the fourth quarter of 2016, Altisource recorded an insurance recovery related to this litigation settlement of $4.0 million. See Note 23. |
(4) | We acquired CastleLine on July 17, 2015 and RentRange and Investability on October 9, 2015 (see Note 5). |
(5) | During the fourth quarter of 2015, Altisource recorded an estimated loss in connection with an anticipated payment to Ocwen for obtaining a release of liability for Altisource related to Ocwen’s settlement of a particular case. |
(6) | In the fourth quarter of 2015, we recorded impairment losses of $71.8 million in our Technology Services segment primarily driven by the Company’s projected Technology Services revenue from Ocwen and investment in technologies provided to Ocwen (see Note 9 and Note 10). |
94
ITEM 9. | CHANGES IN AND DISAGREEMENTS WITH ACCOUNTANTS ON ACCOUNTING AND FINANCIAL DISCLOSURE |
None.
ITEM 9A. | CONTROLS AND PROCEDURES |
Evaluation of Disclosure Controls and Procedures
Our disclosure controls and procedures are designed to ensure that information required to be disclosed by us in the reports that we file or submit under the Securities Exchange Act of 1934, as amended (the “Exchange Act”), is recorded, processed, summarized and reported within the time periods specified in the SEC’s rules and forms. Disclosure controls and procedures include, without limitation, controls and procedures designed to ensure that information required to be disclosed by us in reports we file or submit under the Exchange Act is accumulated and communicated to our management, including the Chief Executive Officer and Chief Financial Officer, as appropriate, to allow timely decisions regarding required disclosure.
As of December 31, 2016, an evaluation was conducted under the supervision and with the participation of our management, including our Chief Executive Officer and Chief Financial Officer, of the effectiveness of our disclosure controls and procedures (as defined in Rule 13a-15(e) and Rule 15d-15(e) of the Exchange Act). Based on this evaluation, such officers have concluded that our disclosure controls and procedures were effective as of December 31, 2016.
Management’s Report on Internal Control over Financial Reporting
Management is responsible for establishing and maintaining adequate internal control over financial reporting, as defined in Rules 13a-15(f) and 15d-15(f) of the Exchange Act. Management has assessed the effectiveness of our internal control over financial reporting as of December 31, 2016 based on criteria established in Internal Control-Integrated Framework (2013) issued by the Committee of Sponsoring Organizations of the Treadway Commission. The scope of management’s assessment of the effectiveness of internal control over financial reporting includes all of our businesses except for the July 29, 2016 acquisition of certain assets and certain assumed liabilities of Granite Loan Management of Delaware, LLC and whose financial statements represent 2% of total assets and less than 1% of revenues of the consolidated financial statement amounts as of and for the year ended December 31, 2016. See Note 5 to the accompanying consolidated financial statements for further discussion of this acquisition. As a result of this assessment, management concluded that, as of December 31, 2016, our internal control over financial reporting was effective in providing reasonable assurance regarding the reliability of financial reporting and the preparation of financial statements for external purposes in accordance with generally accepted accounting principles. Mayer Hoffman McCann P.C. has independently assessed the effectiveness of our internal control over financial reporting and its report is included herein.
Changes in Internal Control Over Financial Reporting
In our annual report on Form 10-K for the year ended December 31, 2015 and in our quarterly reports on Form 10-Q for the periods ended March 31, 2016, June 30, 2016 and September 30, 2016, management concluded that internal controls over financial reporting were not effective as of these dates solely because of a material weakness in our internal control over financial reporting described below. A material weakness is defined as a deficiency, or a combination of deficiencies, in internal control over financial reporting, such that there is a reasonable possibility that a material misstatement of a company’s annual or interim financial statements will not be prevented or detected on a timely basis.
As of December 31, 2015, we did not maintain effective internal controls over the review of impairment indicators of long-lived assets, including premises and equipment and intangible assets, and the impairment analysis of indefinite-lived assets, primarily goodwill. As a result, we concluded that a material weakness existed in the effectiveness of internal controls over the reviews of impairment indicators of long-lived assets and the impairment analysis of indefinite-lived assets.
During the third and fourth quarters of 2016, management implemented its plan to remediate the material weakness described above, which consisted of the following elements:
• | Reviewed the processes related to the impairment assessment of long-lived and indefinite-lived assets |
• | Enhanced review controls relating to the review of impairment indicators of long-lived assets and the impairment analysis of indefinite-lived assets |
• | Tested and evaluated the design and operating effectiveness of the control procedures |
• | Assessed the effectiveness of the remediation plan |
As of December 31, 2016, management has determined that the material weakness identified has been remediated.
95
Other than the steps taken in implementing our remediation plan, there were no changes in our internal control over financial reporting (as defined in the Exchange Act Rules 13a-15(f) and 15d-15(f)) that occurred during the quarter ended December 31, 2016, that have materially affected, or are reasonably likely to materially affect, our internal control over financial reporting.
Limitations on Controls
Our disclosure controls and procedures and internal control over financial reporting are designed to provide reasonable assurance of achieving their objectives as specified above. Management does not expect, however, that our disclosure controls and procedures or our internal control over financial reporting will prevent or detect all error and fraud. Any control system, no matter how well designed and operated, is based upon certain assumptions and can provide only reasonable, not absolute, assurance that its objectives will be met. Further, no evaluation of controls can provide absolute assurance that misstatements due to error or fraud will not occur or that all control issues and instances of fraud, if any, within the Company have been detected.
ITEM 9B. | OTHER INFORMATION |
None.
96
PART III
ITEM 10. | DIRECTORS, EXECUTIVE OFFICERS AND CORPORATE GOVERNANCE |
The information required by this item is incorporated herein by reference to our definitive proxy statement in connection with our 2017 annual meeting of shareholders to be filed pursuant to Regulation 14A under the Exchange Act.
ITEM 11. | EXECUTIVE COMPENSATION |
The information required by this item is incorporated herein by reference to our definitive proxy statement in connection with our 2017 annual meeting of shareholders to be filed pursuant to Regulation 14A under the Exchange Act.
ITEM 12. | SECURITY OWNERSHIP OF CERTAIN BENEFICIAL OWNERS AND MANAGEMENT AND RELATED STOCKHOLDER MATTERS |
The information required by this item is incorporated herein by reference to our definitive proxy statement in connection with our 2017 annual meeting of shareholders to be filed pursuant to Regulation 14A under the Exchange Act.
ITEM 13. | CERTAIN RELATIONSHIPS AND RELATED TRANSACTIONS AND DIRECTOR INDEPENDENCE |
The information required by this item is incorporated herein by reference to our definitive proxy statement in connection with our 2017 annual meeting of shareholders to be filed pursuant to Regulation 14A under the Exchange Act.
ITEM 14. | PRINCIPAL ACCOUNTING FEES AND SERVICES |
The information required by this item is incorporated herein by reference to our definitive proxy statement in connection with our 2017 annual meeting of shareholders to be filed pursuant to Regulation 14A under the Exchange Act.
97
PART IV
ITEM 15. | EXHIBITS, FINANCIAL STATEMENT SCHEDULES |
(a) | The following documents are filed as part of this annual report. | |
1. | Financial Statements | |
See Item 8 above. | ||
2. | Financial Statement Schedules: | |
Schedule II - Valuation and Qualifying Accounts - included below. | ||
3. | Exhibits: | |
Exhibit Number | Exhibit Description | |
2.1 | Form of Separation Agreement between Altisource Portfolio Solutions S.A. and Ocwen Financial Corporation (incorporated by reference to Exhibit 2.1 of the Registrant’s Form 10-12B/A — Amendment No. 1 to Form 10 as filed with the Commission on June 29, 2009) | |
2.2 | Separation Agreement, dated as of December 21, 2012, between Altisource Residential Corporation and Altisource Portfolio Solutions S.A. (incorporated by reference to Exhibit 2.1 to the Company’s Form 8-K filed on December 28, 2012) | |
2.3 | Separation Agreement, dated as of December 21, 2012, between Altisource Asset Management Corporation and Altisource Portfolio Solutions S.A. (incorporated by reference to Exhibit 2.2 to the Company’s Form 8-K filed on December 28, 2012) | |
2.4 | Purchase and Sale Agreement, dated as of March 29, 2013, by and among Altisource Portfolio Solutions, Inc., Altisource Solutions S.à r.l., Ocwen Financial Corporation, Homeward Residential, Inc. and Power Valuation Services, Inc. (incorporated by reference to Exhibit 2.1 to the Company’s Form 8-K filed on April 4, 2013) | |
2.5 | Purchase and Sale Agreement, dated as of August 19, 2013, by and among Altisource Portfolio Solutions S.A., Altisource Solutions S.à r.l. and the Equity Interestholders of Equator, LLC (incorporated by reference to Exhibit 2.1 to the Company’s Form 8-K filed on August 21, 2013) | |
3.1 | Articles of Incorporation of Altisource Portfolio Solutions S.A. (incorporated by reference to Exhibit 3.1 to the Company’s Form 10-K filed on February 13, 2014) | |
10.1 | Separation Agreement, dated as of August 10, 2009, by and between Altisource Portfolio Solutions S.A. and Ocwen Financial Corporation (incorporated by reference to Exhibit 10.1 of the Registrant’s Current Report on Form 8-K as filed with the Commission on August 13, 2009) | |
10.2 | Tax Matters Agreement, dated as of August 10, 2009, by and between Altisource Solutions S.à r.l. and Ocwen Financial Corporation (incorporated by reference to Exhibit 10.2 of the Registrant’s Current Report on Form 8-K as filed with the Commission on August 13, 2009) | |
10.3 | Transition Services Agreement, dated as of August 10, 2009, by and between Altisource Solutions S.à r.l. and Ocwen Financial Corporation (incorporated by reference to Exhibit 10.3 of the Registrant’s Current Report on Form 8-K as filed with the Commission on August 13, 2009) | |
10.4 | Employee Matters Agreement, dated as of August 10, 2009, by and between Altisource Solutions S.à r.l. and Ocwen Financial Corporation (incorporated by reference to Exhibit 10.4 of the Registrant’s Current Report on Form 8-K as filed with the Commission on August 13, 2009) | |
10.5 | Technology Products Services Agreement, dated as of August 10, 2009, by and between Altisource Solutions S.à r.l. and Ocwen Financial Corporation (incorporated by reference to Exhibit 10.5 of the Registrant’s Current Report on Form 8-K as filed with the Commission on August 13, 2009) | |
10.6 | Services Agreement, dated as of August 10, 2009, by and between Altisource Solutions S.à r.l. and Ocwen Financial Corporation (incorporated by reference to Exhibit 10.6 of the Registrant’s Current Report on Form 8-K as filed with the Commission on August 13, 2009) | |
10.7 | Data Center and Disaster Recovery Services Agreement, dated as of August 10, 2009, by and between Altisource Solutions S.à r.l. and Ocwen Financial Corporation (incorporated by reference to Exhibit 10.7 of the Registrant’s Current Report on Form 8-K as filed with the Commission on August 13, 2009) | |
98
10.8 | Intellectual Property Agreement, dated as of August 10, 2009, by and between Altisource Solutions S.à r.l. and Ocwen Financial Corporation (incorporated by reference to Exhibit 10.8 of the Registrant’s Current Report on Form 8-K as filed with the Commission on August 13, 2009) | |
10.9† | Altisource Portfolio Solutions S.A. 2009 Equity Incentive Plan, dated as of August 7, 2009 (incorporated by reference from Exhibit 10.8 to Amendment No. 1 to the Registration Statement on Form 10 of Altisource Portfolio Solutions S.A. as filed with the Commission on June 29, 2009) | |
10.10† | Employment Contract between Altisource Solutions S.à r.l. and William B. Shepro (incorporated by reference from Exhibit 10.9 to Amendment No. 1 to the Registration Statement on Form 10 of Altisource Portfolio Solutions S.A. as filed with the Commission on June 29, 2009) | |
10.11† | Employment Contract between Altisource Solutions S.à r.l. and Kevin J. Wilcox (incorporated by reference from Exhibit 10.11 to Amendment No. 1 to the Registration Statement on Form 10 of Altisource Portfolio Solutions S.A. as filed with the Commission on June 29, 2009) | |
10.12 | Purchase and Sale Agreement, dated as of February 12, 2010, by and among Altisource Portfolio Solutions S.A., and the Equity Interest Holders of The Mortgage Partnership of America, L.L.C. and the Management Owners (incorporated by reference to Exhibit 10.12 of the Company’s 10-K as filed with the Commission on March 17, 2010) | |
10.13† | Form of Put Option Agreements (incorporated by reference to Exhibit 10.13 of the Company’s 10-K as filed with the Commission on March 17, 2010) | |
10.14† | Form of Non-qualified Stock Option Agreement, pursuant to the 2009 Equity Incentive Plan (incorporated by reference to Exhibit 10.14 of the Company’s 10-K as filed with the Commission on February 18, 2011) | |
10.15 | First Amendment to the Transition Services Agreement, dated as of August 10, 2011, by and between Ocwen Financial Corporation and Altisource Solutions S.à r.l. (incorporated by reference to Exhibit 10.1 of the Company’s Form 8-K as filed with the Commission on August 16, 2011) | |
10.16† | Employment Agreement dated March 13, 2012 between Altisource Solutions S.à r.l. and Michelle D. Esterman (incorporated by reference to Exhibit 10.1 of the Company’s Form 8-K as filed with the Commission on March 16, 2012) | |
10.17 | Support Services Agreement, dated as of August 10, 2012, by and between Ocwen Mortgage Servicing, Inc. and Altisource Solutions S.à r.l. (incorporated by reference to Exhibit 10.1 of the Company’s Form 8-K filed on August 16, 2012) | |
10.18† | First Amendment to the Employment Contract dated as of August 15, 2012 between Altisource Solutions S.à r.l. and William B. Shepro (incorporated by reference to Exhibit 10.1 of the Company’s Form 8-K filed on August 20, 2012) | |
10.19† | First Amendment to the Employment Contract dated as of August 15, 2012 between Altisource Solutions S.à r.l. and Kevin J. Wilcox (incorporated by reference to Exhibit 10.2 of the Company’s Form 8-K filed on August 20, 2012) | |
10.20 | Services Agreement, dated as of October 1, 2012, by and between Ocwen Mortgage Servicing, Inc. and Altisource Solutions S.à r.l. (incorporated by reference to Exhibit 10.1 of the Company’s Form 8-K filed on October 5, 2012) | |
10.21 | Technology Products Services Agreement, dated as of October 1, 2012, by and between Ocwen Mortgage Servicing, Inc. and Altisource Solutions S.à r.l. (incorporated by reference to Exhibit 10.2 of the Company’s Form 8-K filed on October 5, 2012) | |
10.22 | Data Center and Disaster Recovery Agreement, dated as of October 1, 2012, by and between Ocwen Mortgage Servicing, Inc. and Altisource Solutions S.à r.l. (incorporated by reference to Exhibit 10.3 of the Company’s Form 8-K filed on October 5, 2012) | |
10.23 | Intellectual Property Agreement, dated as of October 1, 2012, by and between Ocwen Mortgage Servicing, Inc. and Altisource Solutions S.à r.l. (incorporated by reference to Exhibit 10.4 of the Company’s Form 8-K filed on October 5, 2012) | |
10.24 | First Amendment to Support Services Agreement, dated as of October 1, 2012, by and between Ocwen Mortgage Servicing, Inc. and Altisource Solutions S.à r.l. (incorporated by reference to Exhibit 10.5 of the Company’s Form 8-K filed on October 5, 2012) | |
10.25 | First Amendment to Services Agreement, dated as of October 1, 2012, by and between Ocwen Financial Corporation and Altisource Solutions S.à r.l. (incorporated by reference to Exhibit 10.6 of the Company’s Form 8-K filed on October 5, 2012) | |
99
10.26 | First Amendment to Technology Products and Services Agreement, dated as of October 1, 2012, by and between Ocwen Financial Corporation and Altisource Solutions S.à r.l. (incorporated by reference to Exhibit 10.7 of the Company’s Form 8-K filed on October 5, 2012) | |
10.27 | First Amendment to Data Center and Disaster Recovery Agreement, dated as of October 1, 2012, by and between Ocwen Financial Corporation and Altisource Solutions S.à r.l. (incorporated by reference to Exhibit 10.8 of the Company’s Form 8-K filed on October 5, 2012) | |
10.28 | First Amendment to Intellectual Property Agreement, dated as of October 1, 2012, by and between Ocwen Financial Corporation and Altisource Solutions S.à r.l. (incorporated by reference to Exhibit 10.9 of the Company’s Form 8-K filed on October 5, 2012) | |
10.29 | Credit Agreement, dated as of November 27, 2012, among Altisource Solutions S.à r.l., as borrower, the Company and certain of the Company’s wholly-owned subsidiaries, as guarantors, Bank of America, N.A., as Administrative Agent and Collateral Agent, Bank of America, N.A., Barclays Bank PLC and Citigroup Global Markets Inc., as Lead Arrangers and Barclays Bank PLC and Citigroup Global Markets Inc., as Co-Syndication Agents, and certain lenders party thereto from time to time (incorporated by reference to Exhibit 10.1 of the Company’s Form 8-K filed on December 3, 2012) | |
10.30 | Support Services Agreement, dated as of December 21, 2012, between Altisource Residential Corporation and Altisource Solutions S.à r.l. (incorporated by reference to Exhibit 10.1 of the Company’s Form 8-K filed on December 28, 2012) | |
10.31 | Support Services Agreement, dated as of December 21, 2012, between Altisource Asset Management Corporation and Altisource Solutions S.à r.l. (incorporated by reference to Exhibit 10.2 of the Company’s Form 8-K filed on December 28, 2012) | |
10.32 | Tax Matters Agreement, dated as of December 21, 2012, between Altisource Residential Corporation and Altisource Solutions S.à r.l. (incorporated by reference to Exhibit 10.3 of the Company’s Form 8-K filed on December 28, 2012) | |
10.33 | Tax Matters Agreement, dated as of December 21, 2012, between Altisource Asset Management Corporation and Altisource Solutions S.à r.l. (incorporated by reference to Exhibit 10.4 of the Company’s Form 8-K filed on December 28, 2012) | |
10.34** | Master Services Agreement, dated as of December 21, 2012, between Altisource Residential Corporation and Altisource Solutions S.à r.l. (incorporated by reference to Exhibit 10.5 of the Company’s Form 8-K filed on December 28, 2012) | |
10.35 | Trademark License Agreement, dated as of December 21, 2012, between Altisource Residential Corporation and Altisource Solutions S.à r.l. (incorporated by reference to Exhibit 10.6 of the Company’s Form 8-K filed on December 28, 2012) | |
10.36 | Trademark License Agreement, dated as of December 21, 2012, between Altisource Asset Management Corporation and Altisource Solutions S.à r.l. (incorporated by reference to Exhibit 10.7 of the Company’s Form 8-K filed on December 28, 2012) | |
10.37 | Technology Products Services Agreement, between Altisource Asset Management Corporation and Altisource Solutions S.à r.l. (incorporated by reference to Exhibit 10.8 of the Company’s Form 8-K filed on December 28, 2012) | |
10.38 | Senior Unsecured Term Loan Agreement, dated as of December 27, 2012, among Altisource Solutions S.à r.l., as Lender, Ocwen Financial Corporation, as Borrower, and certain subsidiaries of Ocwen Financial Corporation, as Guarantors (incorporated by reference to Exhibit 10.1 of the Company’s Form 8-K filed on December 31, 2012) | |
10.39 | Second Amendment to Services Agreement, dated as of March 29, 2013, by and between Ocwen Financial Corporation and Altisource Solutions S.à r.l. (incorporated by reference to Exhibit 10.1 of the Company’s Form 8-K filed on April 4, 2013) | |
10.40 | Second Amendment to Technology Products Services Agreement, dated as of March 29, 2013, by and between Ocwen Financial Corporation and Altisource Solutions S.à r.l. (incorporated by reference to Exhibit 10.2 of the Company’s Form 8-K filed on April 4, 2013) | |
10.41 | Second Amendment to Data Center and Disaster Recovery Services Agreement, dated as of March 29, 2013, by and between Ocwen Financial Corporation and Altisource Solutions S.à r.l. (incorporated by reference to Exhibit 10.3 of the Company’s Form 8-K filed on April 4, 2013) | |
10.42 | Second Amendment to Intellectual Property Agreement, dated as of March 29, 2013, by and between Ocwen Financial Corporation and Altisource Solutions S.à r.l. (incorporated by reference to Exhibit 10.4 of the Company’s Form 8-K filed on April 4, 2013) | |
100
10.43 | First Amendment to Services Agreement, dated as of March 29, 2013, by and between Ocwen Mortgage Servicing, Inc. and Altisource Solutions S.à r.l. (incorporated by reference to Exhibit 10.5 of the Company’s Form 8-K filed on April 4, 2013) | |
10.44 | First Amendment to Technology Products Services Agreement, dated as of March 29, 2013, by and between Ocwen Mortgage Servicing, Inc. and Altisource Solutions S.à r.l. (incorporated by reference to Exhibit 10.6 of the Company’s Form 8-K filed on April 4, 2013) | |
10.45 | First Amendment to Data Center and Disaster Recovery Services Agreement, dated as of March 29, 2013, by and between Ocwen Mortgage Servicing, Inc. and Altisource Solutions S.à r.l. (incorporated by reference to Exhibit 10.7 of the Company’s Form 8-K filed on April 4, 2013) | |
10.46 | First Amendment to Intellectual Property Agreement, dated as of March 29, 2013, by and between Ocwen Mortgage Servicing, Inc. and Altisource Solutions S.à r.l. (incorporated by reference to Exhibit 10.8 of the Company’s Form 8-K filed on April 4, 2013) | |
10.47 | Agreement, dated as of April 12, 2013, by and among Altisource Solutions S.à r.l., Ocwen Financial Corporation and Ocwen Mortgage Servicing, Inc. (incorporated by reference to Exhibit 10.1 of the Company’s Form 8-K filed on April 18, 2013) | |
10.48 | Amendment No. 1 to Credit Agreement, dated as of May 7, 2013, among Altisource Solutions S.à r.l., as borrower, Altisource Portfolio Solutions S.A., Bank of America, N.A., as administrative agent and incremental term lender and the other lenders party thereto (incorporated by reference to Exhibit 10.1 of the Company’s Form 8-K filed on May 13, 2013) | |
10.49 | Amendment No. 2 to Credit Agreement, dated as of December 9, 2013, among Altisource Solutions S.à r.l., as borrower, Altisource Portfolio Solutions S.A., Bank of America, N.A., as Administrative Agent and the Lenders party thereto (incorporated by reference to Exhibit 10.1 of the Company’s Form 8-K filed on December 11, 2013) | |
10.50 | Amendment No. 3 to Credit Agreement, dated as of August 1, 2014, among Altisource Solutions S.à r.l., as borrower, Altisource Portfolio Solutions S.A., Bank of America, N.A., as Administrative Agent and incremental term lender and the other lenders party thereto (incorporated by reference to Exhibit 10.1 of the Company’s Form 8-K filed on August 6, 2014) | |
10.51† | Form of Cash Retention Award Agreement (incorporated by reference to Exhibit 10.1 of the Company’s Form 8-K filed on April 21, 2015) | |
10.52† | Form of Restricted Stock Award Agreement (incorporated by reference to Exhibit 10.2 of the Company’s Form 8-K filed on April 21, 2015) | |
10.53† | Form of Non-Qualified Stock Option Award Agreement (incorporated by reference to Exhibit 10.3 of the Company’s Form 10-Q filed on July 23, 2015) | |
10.54† | Employment Agreement dated April 30, 2013 between Altisource Solutions S.à r.l. and Vivek Bhandari (incorporated by reference to Exhibit 10.60 of the Company’s Form 10-K filed on March 15, 2016) | |
10.55† | Employment Agreement dated June 17, 2011 between Altisource Solutions S.à r.l. and Joseph A. Davila (incorporated by reference to Exhibit 10.61 of the Company’s Form 10-K filed on March 15, 2016) | |
10.56† | Employment Agreement dated December 31, 2013 between Altisource Solutions S.à r.l. and Mark J. Hynes (incorporated by reference to Exhibit 10.62 of the Company’s Form 10-K filed on March 15, 2016) | |
10.57† | Amended and Restated Employment Agreement effective as of October 1, 2014 between Altisource Solutions S.à r.l. and Gregory J. Ritts (incorporated by reference to Exhibit 10.63 of the Company’s Form 10-K filed on March 15, 2016) | |
10.58† | Non-Qualified Stock Option Award Agreement between the Company and Gregory J. Ritts dated as of August 29, 2016 (incorporated by reference to Exhibit 10.1 of the Company’s Form 10-Q filed on October 27, 2016) | |
10.59† | Non-Qualified Stock Option Award Agreement between the Company and Vivek Bhandari dated as of August 29, 2016 (incorporated by reference to Exhibit 10.2 of the Company’s Form 10-Q filed on October 27, 2016) | |
10.60 | Form of Director Restricted Share Award Agreement (incorporated by reference to Exhibit 10.1 of the Company’s Form 8-K filed on August 24, 2016) | |
10.61 | Amendment and Waiver Agreement dated September 30, 2016 between Altisource Solutions S.à r.l. and Altisource Residential Corporation (incorporated by reference to Exhibit 10.1 of the Company’s Form 8-K filed on October 3, 2016) | |
21.1* | Subsidiaries of the Registrant. | |
101
23.1* | Consent of Independent Registered Public Accounting Firm (Mayer Hoffman McCann P.C.). | |
23.2* | Consent of Independent Registered Public Accounting Firm (Deloitte & Touche LLP). | |
31.1* | Section 302 Certification of the Chief Executive Officer pursuant to Exchange Act Rule 13a-14(a). | |
31.2* | Section 302 Certification of the Chief Financial Officer pursuant to Exchange Act Rule 13a-14(a). | |
32.1* | Certification of the Chief Executive Officer and Chief Financial Officer pursuant to Section 906 of the Sarbanes-Oxley Act of 2002. | |
101* | Pursuant to Rule 405 of Regulation S-T, the following financial information from the Company’s Annual Report on Form 10-K for the year ended December 31, 2016 is formatted in XBRL interactive data files: (i) Consolidated Balance Sheets at December 31, 2016 and December 31, 2015; (ii) Consolidated Statements of Operations for each of the years in the three-year period ended December 31, 2016; (iii) Consolidated Statements of Equity for each of the years in the three-year period ended December 31, 2016; (iv) Consolidated Statements of Cash Flows for each of the years in the three-year period ended December 31, 2016; (v) Notes to Consolidated Financial Statements; and (vi) Financial Statement Schedule. | |
* | Filed herewith | |
** | Portions of this exhibit have been redacted pursuant to a request for confidential treatment. The non-public information has been filed separately with the Securities and Exchange Commission. | |
† | Denotes management contract or compensatory arrangement | |
102
SCHEDULE II. | VALUATION AND QUALIFYING ACCOUNTS |
For the years ended December 31, 2016, 2015 and 2014:
Additions | ||||||||||||||||||||
(in thousands) | Balance at Beginning of Period | Charged to Expenses | Charged to Other Accounts Note (1)(2) | Deductions Note (3)(4) | Balance at End of Period | |||||||||||||||
Deductions from asset accounts: | ||||||||||||||||||||
Allowance for doubtful accounts: | ||||||||||||||||||||
Year 2016 | $ | 18,456 | $ | 1,829 | $ | 250 | $ | 10,111 | $ | 10,424 | ||||||||||
Year 2015 | 22,675 | 5,514 | (4 | ) | 9,729 | 18,456 | ||||||||||||||
Year 2014 | 5,631 | 16,257 | 1,399 | 612 | 22,675 | |||||||||||||||
Valuation allowance for deferred tax assets: | ||||||||||||||||||||
Year 2016 | $ | 3,558 | $ | 228 | $ | — | $ | 319 | $ | 3,467 | ||||||||||
Year 2015 | 3,115 | 674 | — | 231 | 3,558 | |||||||||||||||
Year 2014 | 3,189 | — | — | 74 | 3,115 | |||||||||||||||
______________________________________
(1) | Allowance for doubtful accounts primarily includes amounts previously written off which were credited directly to this account when recovered. |
(2) | Valuation allowance for deferred tax assets includes current year increase to valuation allowance charged to equity and reclassifications from other balance sheet accounts. |
(3) | Amounts written off as uncollectible or transferred to other accounts or utilized. |
(4) | Reductions to valuation allowances related to deferred tax assets. |
103
SIGNATURES
Pursuant to the requirements of Section 13 or 15(d) of the Securities Exchange Act of 1934, the Registrant has duly caused this report to be signed on its behalf by the undersigned, thereunto duly authorized.
Date: February 16, 2017
Altisource Portfolio Solutions S.A. | |||
By: | /s/ William B. Shepro | ||
Name: | William B. Shepro | ||
Title: | Director and Chief Executive Officer | ||
(Principal Executive Officer) | |||
By: | /s/ Michelle D. Esterman | ||
Name: | Michelle D. Esterman | ||
Title: | Chief Financial Officer | ||
(Principal Financial Officer and Principal Accounting Officer) | |||
Pursuant to the requirements of the Securities Exchange Act of 1934, this report has been signed below by the following persons on behalf of the registrant and in the capacities and on the dates indicated.
Signature | Title | Date | ||
/s/ Timo Vättö | Chairman of the Board of Directors | February 16, 2017 | ||
Timo Vättö | ||||
/s/ William B. Shepro | Director and Chief Executive Officer | February 16, 2017 | ||
William B. Shepro | (Principal Executive Officer) | |||
/s/ Orin S. Kramer | Director | February 16, 2017 | ||
Orin S. Kramer | ||||
/s/ W. Michael Linn | Director | February 16, 2017 | ||
W. Michael Linn | ||||
/s/ Roland Müller-Ineichen | Director | February 16, 2017 | ||
Roland Müller-Ineichen | ||||
/s/ Michelle D. Esterman | Chief Financial Officer | February 16, 2017 | ||
Michelle D. Esterman | (Principal Financial Officer and Principal Accounting Officer) | |||
104