Attached files
| file | filename |
|---|---|
| 8-K - U. S. Premium Beef, LLC | es8k611.htm |

|
That’s the elite 3% of the beef industry Aiming For Prime By Brian Bertelsen, VP, Field Operations Many USPB producers are marketing high grading cattle. Specifically, their Choice percentage is very high. However, they are looking to the next horizon–they are aiming for Prime. They are “raising the bar” because they want to produce beef with an outstanding eating experience. Another reason, of course, is that they also want to maximize the value of the cattle they market on the USPB grid. Prime beef sells for the highest price, and likewise, Prime carcasses have the highest price per cwt on the USPB grid. Webster defines Prime as “First in excellence, quality, or value...of the highest U.S. Government grade of meat.” Within the beef industry, Prime simply refers to “the best”. Of all USPB producers who marketed cattle during fiscal year 2013, 36% of those producers delivered cattle that averaged 90% or greater percentage of Choice or Prime carcasses on all of the cattle they delivered. And 27% of the producers had an average Certified Angus Beef® (CAB) percentage of over 50% on all their cattle. However, only about 10% of the people had an overall Prime percentage of 15% or more on their cattle. That’s about five times the national average of around three percent. The highest was up to 50% Prime, and that was on over 350 head. Within those top Prime producers, the greatest concentration of them were from the state of Missouri. However, after that, they were fairly evenly spread out geographically. Admittedly, many of them did not deliver very many cattle during the year. However, five people delivered over a thousand head and one of those delivered over seven thousand. What makes Prime so elite is the level of marbling. There are a lot of USPB lots, or groups, of cattle that have a very high percentage of Choice carcasses, but still have little or no Prime. That is primarily because the Choice Quality grade covers such a wide range of marbling. The figure on page two shows the degrees of marbling on the left and the maturity across ...continued on page 2 |
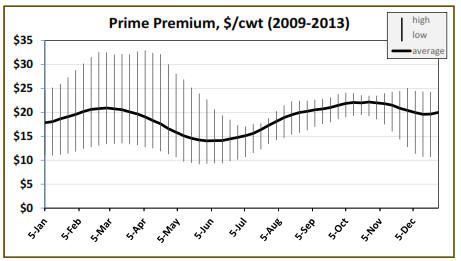
Prime premiums tend to be more demand driven than supply driven What the Market is
Saying That’s a question some USPB
producers are asking as they select genetics,
refine management practices and factor in lower priced corn to target their ideal endpoint on
our quality-based grids. Their reasoning: Prime premiums remain consistently higher over time than Choice premiums. During fiscal year 2014, for example, the Prime premium on USPB’s Base grid ranged from a low of $18.32/ cwt to a high of $25.48/cwt on a weekly basis compared to a Choice premium range of $1.17/cwt to $11.55/cwt. “Overall the Prime numbers have remained fairly steady over the past year,” Tom Klein, vice president, Value Added Programs for National Beef, notes. “It appears that demand today is strong enough to withstand an increased supply of Prime beef and still have sustained premiums for that product. As our economy has gained strength so has the demand for high-end beef products. Corporate expenditures for business related dining have increased while casual/social dining has increased as well following the recession. “Export demand for Prime beef has been strong and growing and that has helped support Prime premiums in the marketplace,” Klein explains. “Key items for many export markets are prime chuck rolls, skirt steak and short ribs, along with traditional steak items (ribeyes, strips, tenderloins). “Out of a typical Prime carcass approximately 150 to 200 lbs. of product is sold as Prime beef,” he adds. “The middle meats make up a high percentage of this, but we’re seeing increased demand across the carcass. The majority of our Prime sales go to foodservice (restaurants)—probably 75% to 85%, while retail outlets account for another 10 to 20% and direct sales such as through Kansas City Steak Co., handle a smaller percentage of our Prime beef.” “Generally speaking Prime beef prices are more dependent on demand than Choice or Select beef,” explains Kevin Good, senior analyst with CattleFax. “Demand for Prime beef in 2009 was down from the previous year which led to smaller price premiums for Prime products that year. ...continued on page 4 |

Reproduction of any part of this newsletter is expressly
forbidden without written permission of U.S. Premium Beef.
| Aiming For Prime... |
continued from page 1 |
However, they were by far the heaviest, on average. This, combined with the highest price per cwt made them extremely valuable per head. Prime carcasses were $144 more valuable than CAB, the second most valuable. Prime Quality grade is related to fatter carcasses. That’s a pretty high level of YG 4’s in the table. Seasonally, the percentage of YG 4 and 5 carcasses tracks very similarly to Prime percentage. That makes sense. Both are related to large amounts of fat deposition: Marbling and backfat. Is the secret to getting more Prime simply making cattle fatter, to the point of purposely harvesting cattle as a YG 4 or 5? As the table shows, 29% of all Prime carcasses were YG 4’s. However, only 6.5% of all YG 4 carcasses were Prime. So making carcasses YG 4’s will likely increase your Prime percentage, but it’s much more than that. Within all USPB carcasses during fiscal 2013, only 0.6% had a marbling level of Modest 70-90, which is almost Prime. Granted, if those carcasses were fed a little longer, and they all became Prime, that would be a 16% rate of increase, but would only increase the USPB average up to 3.33% total. As mentioned, Prime is a really large amount of marbling. Even animals with high genetic potential for marbling need to be fed a fairly long time to deposit that much. So genetic improvement is really the key to producing more Prime. Should we intentionally make our cattle lighter muscled since there’s a relationship between higher marbling and less muscling? First, don’t forget that muscle has a significant positive effect on carcass weight, yield and Yield grade. Pounds are extremely valuable right now. However, imagine you had a sugar cookie with 57 sprinkles on it. Then, if you took a much larger cookie and also put 57 sprinkles on it, the larger cookie would have a lesser concentration of sprinkles. Now imagine the cookies are ribeyes and the sprinkles are marbling. The same amount of marbling would be diluted within a larger ribeye resulting in a lower marbling score. Another factor to consider is that it takes calories to build and maintain muscle tissue. Fat, including marbling, is excess calories after meeting the animal’s needs for maintenance and growth (specifically muscle and bone) . Therefore, if we get cattle too extremely heavily muscled, it would have a negative effect on marbling. Looking at the table below, it’s logical to assume that those Prime cattle had pretty large feed intakes to grow that big and to deposit that much total fat. Remember that high intake cattle can still be efficient, providing they have a high rate |
|
the top for USDA Quality grades. Most fed cattle fall in the “A” maturity category of under 30 months. Notice that Select spans only one degree of marbling, but Choice includes three. So, for a producer who may have been improving his cattle to move them across the line between Select and Choice, still has a really long way to continue improving his cattle to now move them across the line between Choice and Prime. How-ever, don’t forget that within the Choice grade is where brand-ed programs like CAB and Black Canyon Premium Reserve® reside from a marbling standpoint. So economic improvement can still be made before you even reach Prime. Figure 1. Relationship between Marbling, Maturity and Quality Grade.
What does a Prime carcass look like? And how do they compare to the other grades? The table below summarizes individual carcass data summarized by Quality grade for Fiscal Year 2013. The Prime carcasses are fatter and lighter muscled, both in actual ribeye area (REA) and REA in relation to carcass weight, shown as actual minus required REA (Act-Req REA). Required REA is part of the Yield Grade (YG) equation. It is derived solely from Hot Carcass Weight (HCW) and is the REA a carcass should have to be “average” in muscling. These factors all contributed to a higher average YG and a greater percentage of YG 4’s. |
||
| Table 1. Fiscal year 2013, Summary by Quality Grade | ||

|
|
HCW |
% Steer |
Marbling |
REA |
Act-Req REA |
Fat |
YG 4 % |
Avg YG |
$/cwt |
$/head |
|
|
|
|
||||||||||
|
|
|
|
|
|
|
|
|
|
|
|
|
|
Prime |
853 |
39.3 |
Sl. Ab. 26 |
13.28 |
-0.76 |
0.62 |
29.38 |
3.16 |
$218.38 |
$1,862 |
|
|
CAB |
836 |
39.4 |
Modest 27 |
13.69 |
-0.15 |
0.56 |
16.99 |
2.77 |
$205.35 |
$1,718 |
|
|
Choice only |
837 |
39.6 |
Small 47 |
14.26 |
0.41 |
0.50 |
9.73 |
2.41 |
$202.82 |
$1,698 |
|
|
Select |
823 |
49.2 |
Slight 63 |
14.83 |
1.15 |
0.42 |
3.84 |
1.94 |
$191.85 |
$1,580 |
|
|
Standard |
794 |
35.7 |
Slight 75 |
14.81 |
1.47 |
0.38 |
5.07 |
1.82 |
$181.81 |
$1,446 |
|

|
What the Market is Saying About Prime... |
continued from page 1 |
BENCHMARK PERFORMANCE DATA TABLE |
||
|
But supplies also play a role in the Prime premium,” he adds. “Last year, for example, the production of Prime was up and the spreads were smaller as a result of that increased supply, not necessarily due to lower demand for the product. “Bottom line: There continues to be economic incentive to produce more Prime beef, but as more is produced we should not be surprised to see a slight deduction in the premiums,” Good says.♦ Did You Know... üIf you have delivery rights you do not plan on using in delivery year 2014, which ends August 30, and would like USPB to help you get them leased to other producers, please call our office at 866-877-2525.♦ USDA’s Choice/Select Holding Strong
|
Base Grid Cattle Harvested in KS Plants 5/04/14 to 5/31/14 |
|||
|
(Numbers in Percent) |
Base Grid |
|||
|
All |
Top 25% |
|||
|
Yield |
63.64 |
64.31 |
||
|
Prime |
2.31 |
4.29 |
||
|
CH & PR |
74.09 |
82.90 |
||
|
CAB |
26.63 |
34.89 |
||
|
BCP |
18.31 |
19.88 |
||
|
Ungraded |
0.61 |
0.43 |
||
|
Hard Bone |
0.20 |
0.04 |
||
|
YG1 |
5.79 |
4.27 |
||
|
YG2 |
32.20 |
28.19 |
||
|
YG3 |
46.17 |
49.20 |
||
|
YG4 |
14.56 |
16.82 |
||
|
YG5 |
1.28 |
1.52 |
||
|
Light Weight |
0.45 |
0.23 |
||
|
Heavy Weight |
0.73 |
0.72 |
||
|
Average Grid Premiums/Discounts ($/Head) |
||||
|
Quality Grade |
$31.55 |
$46.64 |
||
|
Yield Benefit |
$23.16 |
$43.30 |
||
|
Yield Grade |
-$6.66 |
-$8.59 |
||
|
Out Weight |
-$1.49 |
-$1.24 |
||
|
Natural |
$2.51 |
$5.97 |
||
|
Total Premium |
$49.07 |
$86.08 |
||

