Attached files
| file | filename |
|---|---|
| 8-K - 8-K - HILLMAN COMPANIES INC | d740740d8k.htm |
Exhibit 99.1
This summary highlights significant aspects of our business and this offering, but it is not complete and may not contain all of the information that may be important to you. You should read the entire offering memorandum carefully, including the historical financial statements and their related notes included elsewhere in this offering memorandum. Investing in the notes involves significant risks, as described in the “Risk Factors” section.
In this offering memorandum, unless otherwise indicated or the context otherwise requires, (i) references to the terms “Hillman,” “we,” “us,” “our” and the “Company” refer to The Hillman Group, Inc. and its subsidiaries, which are being acquired pursuant to the transactions described below, (ii) references to “Holdings” refer to The Hillman Companies, Inc., the indirect parent of The Hillman Group, Inc., (iii) references to the “issuer” are collective references (1) prior to the consummation of the Transactions (as defined herein), to HMAN Finance Sub Corp., and (2) after giving effect to the consummation of the Transactions, to The Hillman Group, Inc. as the surviving company and (iv) information identified as “pro forma” gives effect to the consummation of the Transactions, as described under “The Transactions” as if they had occurred, with respect to the unaudited pro forma condensed consolidated statements of comprehensive income (loss), on January 1, 2013 and, with respect to the unaudited pro forma condensed consolidated balance sheet information, on March 31, 2014.
Company Overview
We are a leading distributor of fasteners, key duplication systems, keys, engravable tags, letters, numbers and signs and threaded rod (collectively, our “core products”) primarily to the retail market in North America. We also distribute other hardware-related items and provide related support and solutions. We provide our customers with value-added solutions and product category management services for more than 130,000 stock keeping units (“SKUs”), including sourcing, logistics, merchandising displays, inventory level management and in-store sales and service support. We believe that our value-added solutions and product category management services are difficult to replicate, resulting in significant competitive advantages and deeply entrenched customer relationships.
We believe we hold the leading position in all of our core product categories and have a strong history of new product introductions. We have also grown our offerings by acquiring and integrating businesses offering complementary product lines that can be sold through our existing sales force. Our product mix encompasses high margin, low price-point consumable products that exhibit price-inelastic and recession-resistant characteristics that promote retail traffic and profitability for our customers. We sell these products to a diverse customer base of home improvement centers, franchise and independent (“F&I”) hardware stores, mass merchants, national and regional hardware stores, pet supply stores, and other retail outlets in the United States, Canada, Mexico, Latin America and the Caribbean. We provide our customers with support and solutions for managing SKU intensive, low price-point hardware product categories through our approximately 900 field service and sales representatives. We believe the size, tenure and experience of our sales and service team are key differentiators for us relative to our competition. For the twelve months ended March 31, 2014, we generated net sales of $712.5 million and Pro Forma Adjusted EBITDA of $135.7 million.
1
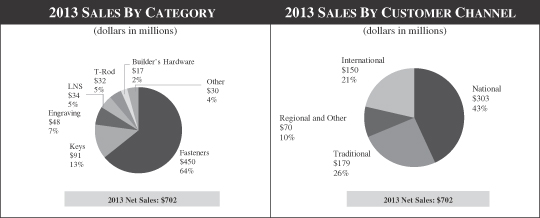
The following charts illustrate the contribution to our net sales by product category and customer type for the year ended December 31, 2013:
We have delivered strong financial results throughout economic cycles and have maintained leading margins and profitability among similar distribution industry participants. During the recessionary periods of 2001 through 2003 and 2008 through 2009, we generated significant free cash flow and exhibited relative stability in revenues, profitability and returns. For example, while our net sales declined 4.9% between 2008 and 2009, our Adjusted EBITDA grew from $77.4 million to $83.3 million during the same period. We have consistently grown our Adjusted EBITDA and maintained Adjusted EBITDA margins above 17% since 2000. Our profitability, combined with the low capital intensity of the business, has resulted in stable free cash flows and substantial deleveraging. In stronger economic periods, we have delivered solid growth in revenues and profitability and consistent Adjusted EBITDA margins while at the same time investing in technology, packaging and merchandising. Since 2012, we have invested in our engineering and technical staff and have introduced innovative products such as the FastKey 36 duplication system and the Quick-Tag International engraving system, which we believe further entrench our position within our customer base. We expect to continue to demonstrate strong operating and financial performance by offering inexpensive consumer products with demand characteristics not significantly affected by macroeconomic uncertainty. We believe our commitment to value-added merchandising services and category management has also increased our customers’ reliance on us, thereby enhancing the stability and predictability of our business model.
Products
Our products can be classified into the following six categories:
Fasteners: Fasteners remain the core of our business and the product line encompasses more than 105,000 SKUs, which we believe to be one of the largest selections among suppliers servicing the hardware retail segment. We serve a range of customers within our fastener programs including big box (defined as mass merchants, home centers, and large-format grocery/drug centers and referred to herein as “Big Box”), independent hardware, regional retailers, farm and fleet, and lumber part customers. The fastener line includes standard and specialty nuts, bolts, washers, screws, anchors, and picture hanging products. We offer zinc, chrome, and galvanized plated steel fasteners in addition to stainless steel, brass, and nylon fasteners in this vast line of products. In addition, we recently introduced a complete line of indoor and outdoor fasteners for use with drywall and deck construction, which provides consumers with value-added performance in exterior applications and incremental margins for retailers. In 2013, we launched a new mass merchant fastener program, which targets consumers visiting mass merchants, grocery, and department stores who desire to purchase their
2
hardware needs while shopping for grocery and general merchandise needs. Also in 2013, we continued to expand our fastener presence beyond retailers’ brick and mortar locations by entering into the e-commerce segment in partnership with our retail customers.
Keys and Key Accessories: We design and manufacture proprietary equipment which forms the cornerstone of our key duplication business. We employ a “razor / razor-blade” strategy by providing Hillman-owned machines to the merchants free of charge, with key blanks typically purchased from us at attractive margins. Our key duplication system is offered in various retail channels including mass merchants, home centers, automotive parts retailers, F&I hardware stores, and grocery/drug chains; it can also be found in many service-based businesses like parcel shipping outlets. We market multiple separate key duplication systems. The Axxess Precision Key Duplication SystemTM is marketed to national retailers requiring a key duplication program easily mastered by novice associates, while our Key Program targets the F&I hardware retailers, with a machine that works well in businesses with lower turnover and highly skilled employees. There are over 13,000 Axxess Programs placed in North American retailers. Retailers participating in the Axxess Program are required to purchase key blanks from Hillman. In 2013, we expanded the launch of the innovative FastKeyTM consumer-operated key duplication system to approximately 700 Walmart stores.
Engraving: Our engraving business provides consumer-operated vending systems that custom engrave and dispense pet identification tags, military-style I.D. tags, holiday ornaments and luggage tags. From the original Quick-TagTM consumer-operated vending system to the proprietary laser system of TagWorks, we continue to lead the industry with consumer-friendly engraving solutions. Quick-TagTM is a patented, consumer-operated vending system that custom engraves and dispenses pet identification tags, military-style I.D. tags, holiday ornaments, and luggage tags. We have placed over 2,700 Quick-TagTM machines in retail outlets throughout the U.S. and Canada. In 2013, we launched the next generation engraving platform with our new FIDO Jr.TM system. This new engraving program integrates a fun and attractive design with a user interface that provides new features for the consumer at lower cost than our original FIDOTM system introduced in 2010. We have placed approximately 1,100 FIDOTM systems in PETCO stores as of December 31, 2013 and expect to increase our installed base through FIDO Jr. TM.
Letters, Numbers and Signs (“LNS”): Our LNS product category includes product lines that target both the homeowner and commercial user. Product lines within this category include individual and/or packaged letters, numbers, signs, safety-related products (e.g., 911 signs), driveway markers, as well as sign accessories and frames. Through a series of strategic acquisitions, exclusive partnerships, and organic product developments, we have created an LNS program which gives retailers one of the largest product offerings available in this category. This SKU intensive product category is considered a staple for retail hardware departments and is typically merchandised in eight linear feet of retail space containing hundreds of SKUs. In addition to the core product program, we provide our customers with value-added retail support including custom plan-o-grams and merchandising solutions. Our LNS program can be found in Big Box retailers and pet supply accounts. In addition, we have product placement in F&I hardware retailers.
Threaded Rod: Our threaded rod product category includes hot and cold rolled rod, both weldable and plated, as well as a complete offering of All-Thread rod in galvanized steel, stainless steel, and brass. The SteelWorksTM program is carried by many top retailers and cooperatives. In addition, we are the primary supplier of metal shapes to many wholesalers throughout the country.
Builder’s Hardware: The builder’s hardware category includes a variety of common household items such as coat hooks, door stops, hinges, gate latches, hasps, and decorative hardware. We market our builder’s hardware products under the Hardware EssentialsTM brand and provide retailers with an innovative merchandising solution. The Hardware EssentialsTM program utilizes modular packaging, color coding, and integrated merchandising to simplify the shopping experience for consumers. Colorful signs, packaging and
3
installation instructions guide the consumer quickly and easily to the correct product location. Hardware EssentialsTM provides retailers and consumers decorative upgrade opportunities through the introduction of high-end finishes such as satin nickel, pewter, and antique bronze. In 2012, we expanded the placement of the Hardware EssentialsTM line in the F&I channel.
Customers
Over the course of our 50 year operating history, we have developed longstanding relationships with our customers, and we have approximately 26,000 active customers, ranging from small local and regional hardware stores to large retail outlets with national footprints and mass merchants. We have a successful track record of generating high levels of customer satisfaction as a result of our uniquely tailored sales and service approach for each of these customer segments. Our customers demand a high level of expertise in managing point of purchase data, item profitability, inventory turns, retail pricing, merchandising capability and display management and we successfully manage these objectives on a daily basis. A measure of our effectiveness in partnering with our customers is the breadth and duration of the relationships we maintain with many of the largest and most respected retailers in North America. These longstanding relationships were developed through considerable sales force effort that we believe cannot be easily replicated. We serve three main customer segments in the United States: large retail chains with a national presence, traditional hardware stores and smaller regional retail chains.
National: National accounts include such retailers as Lowe’s, Home Depot, Wal-Mart, Tractor Supply, Sears, Menards, PetSmart and PETCO. For the year ended December 31, 2013, Lowe’s was the single largest customer, representing 17.8% of net sales, Home Depot was the second largest at 15.5% and Wal-Mart was the third largest at 6.3% of net sales. Our sales representatives play critical roles in helping retailers manage store inventory of up to 5,000 SKUs by frequently updating physical inventory availability in their computer systems to ensure optimal SKU replenishment, best-in-class merchandising and display maintenance on all fastener, key, LNS and builder’s hardware categories, and providing technical service and support for all engraving and key duplicating machines. Our status as a national supplier to major national retailers has allowed us to develop a strong competitive position within our product categories.
Traditional: Our traditional accounts consist of approximately 15,000 F&I retail outlets, which are typically members of larger cooperatives such as True Value, Ace Hardware, and Do-It-Best. The customer segment is divided into two divisions: Store Direct and Warehouse. Through our Store Direct division, we supply our products directly to independent hardware stores and provide in-store inventory management, product display and price implementation services. Through our Warehouse division, we supply wholesalers, cooperatives and central warehouses such as True Value, Ace, and Do-It-Best that distribute to their member network and do not require our merchandising services. The Warehouse channel reduces logistics expenses for us while reducing central warehouse inventory and delivery costs for the cooperatives.
Regional: Our regional accounts are comprised of large multi-store chains that operate within regional marketing areas, such as Orchard Supply, Probuild, Westlake Hardware, Orscheln Farm, and Mills Fleet. These customers operate similarly to our national accounts and have centralized purchasing managers. In order to effectively compete against the national retailers, regional chains have been challenged to develop unique niches to maintain and build customer loyalty. We have responded to these challenges by successfully working with regional customers to develop unique merchandising and product assortments that meet targeted customer needs.
Distribution Network and Supply Chain
We employ a highly differentiated distribution service by providing a wide breadth of products and services to our large-scale national customers on a regional or national basis that smaller competitors are unable to match.
4
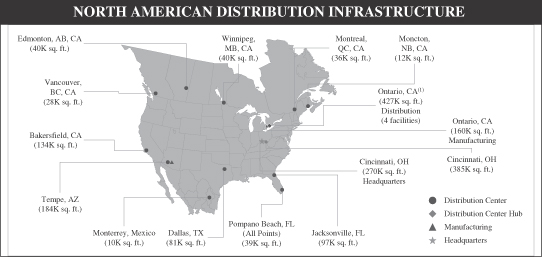
Our 385,000-square-foot distribution center in Forest Park, Ohio, is the core of our distribution network, augmented by 16 additional regional distribution centers located strategically throughout the United States, Canada, Mexico and Australia. Our customers are generally neither equipped to, nor have a desire to, handle the sourcing and merchandising of a vast number of low-priced SKUs without the benefit of the economies of scale that we enjoy. Our distribution network provides customers with on-demand supply of over 130,000 SKUs and the efficiency of over 97% fill rates (based on order shipment) within 48 hours of order receipt. Our focus on service levels has enabled us to reduce our network inbound and outbound cycle times significantly, demonstrating the capability to receive and allocate products within two hours and pick, pack and ship orders within four hours.
We purchase our products from approximately 640 vendors throughout the world. Our global sourcing strategy is focused on finding the highest quality products from reliable vendors at the lowest prices. This strategy has evolved into a highly efficient system comprised of multiple vendors supplying thousands of low-cost SKUs from multiple countries. Low-cost country sourcing, primarily from Taiwan, China, India and Malaysia, accounts for 46% of our total purchases, the vast majority of which is for our Fastener product category. We continue to evaluate the cost benefits of sourcing from low-cost countries versus sourcing domestically, and expect our sourcing from low-cost countries to increase, thereby creating opportunities for incremental margin improvement. Our vendor quality control procedures include on-site evaluations and frequent product testing, and we evaluate vendors based on delivery performance and the accuracy of their shipments. Our sourcing group is strategically aligned by product category to improve speed to market and to enhance category expertise.
Sales and Marketing
Our established customer relationships are a result of the multiple touch points that our representatives maintain with customers, and extend to purchasing managers, store management and senior executives. With approximately 900 dedicated national and regional sales and service representatives serving approximately 26,000 customers, we maintain close relationships with our customers across the country and provide the highest level of customer service available in the industry. Our representatives regularly visit customer store locations to provide merchandising services including in-store inventory management and in-store display and promotion development. The hands-on support and service offered by our representatives provide us with opportunities to sell additional products, allow us to monitor the effectiveness of our merchandising strategy and further enhance existing relationships.
5
Industry Overview
We operate in multiple channels of the retail marketplace such as hardware stores, regional and national home centers, and mass merchants across North America. These retail channels have experienced significant change as a result of the growth of the large national Big Box chains, which have taken market share from the regional home centers and independent hardware dealers and cooperatives. Given the diversity of channels in which we operate, we have developed sales, marketing, merchandising and service capabilities to specifically meet the needs of our retail customers, including the Big Box chains, which include Lowe’s, Home Depot and Wal-Mart. We believe that our market knowledge, merchandising skills, breadth of inventory, and value-added services, including support and fulfillment capabilities, will enable us to maintain our relationships across all of our channels.
While many of our products are used for repair and remodel applications, our industry, which serves the residential and non-residential construction sectors, was impacted by general economic conditions in North America and other international markets in recent years. Residential repair and remodeling (“R&R”) spending was significantly impacted by economic conditions in 2008 through 2010 and has since increased year-over-year. Market analysts forecast an increase in R&R spending of 7% in 2014, 6% in 2015 and 5% in 2016 fueled by pent-up demand from under-investment since the housing crisis, positive expectations about home prices and access to home equity financing and increased resale activity. We believe we are positioned to benefit from the recovery of these sectors, which are expected to see a continued rebound in the next several years from historical low levels. Furthermore, we estimate that sales to our three largest national customers will exceed their projected same store sales growth over the period from 2014 to 2016.
Additionally, while demand for our low-price products has been relatively consistent over time, our business and industry experiences some seasonal variations driven by weather conditions and daylight hours. In general, sales and operating results vary from quarter to quarter with the first calendar quarter often the weakest due to the effect of cold weather on home projects and the construction industry.
6
Competitive Strengths
We believe our key competitive strengths include:
Market Leader with Strong Positions in Attractive Growth Markets. We believe we are the market leader in served sales channels for all of our core product categories. Our strong growth over the last 19 years has helped solidify our leading position in each of our markets. We believe our leadership position has translated into significant economies of scale that provide a unique competitive advantage in areas such as sourcing, logistics, inventory management, merchandising, customer service and IT. We have expanded our geographic presence in Canada, Mexico and the Caribbean to complement our strong position in the United States. We believe we are well-positioned to establish ourselves as a leader in several new product categories by leveraging our existing customer base and distribution network.
| Core Product Categories |
Estimated Product Category Position |
2013 Revenue ($mm / % Total) |
Highlights | |||||
| Fasteners |
#1 | $ | 450 / 64 | % | • Core distribution business
• Very high SKU count; up to 8,000 for a single customer | |||
| Key Duplication |
#1 | $ | 91 / 13 | % | • Installed base of over 15,000 key duplication machines located at customers’ retail locations
• Includes Transponder Keys™, which contain a microchip programmed to individual cars for security, and remotes for hundreds of vehicles | |||
| Engraving |
#1 | $ | 48 / 7 | % | • Installed over 2,700 Quick-Tag systems in exchange for tag supply exclusivity and 1,100 Fido systems in pet retailers
• Recently expanded into theme parks, museums and specialty retail stores | |||
| Letters, Numbers & Signs (LNS) |
#1 | $ | 34 / 5 | % | • Typical retailers dedicate up to eight linear feet of space for LNS offerings
• Introduced high-end address plaques, custom create-a-sign and commercial signs | |||
| Threaded Rod |
#1 | $ | 32 / 5 | % | • Acquired product line in 2006 making Hillman the category leader | |||
Long-Term Customer Relationships Enhanced By Our Service-Oriented Business Model. We maintain longstanding relationships, with an average of 17 years for our top eight customers, with many of the largest and most respected retailers in North America. Our entrenched customer relationships provide revenue stability and a platform for sustainable growth, and are driven by our unique operating model, superior service capabilities and our sales force’s desire to be the preferred supplier and valued partner to our customers.
With approximately 900 dedicated national and regional sales and service representatives serving approximately 26,000 customers, we have established strong institutional relationships with our customers across the country while providing superior customer service. Our representatives regularly visit store locations to provide merchandising services, including highly valued in-store inventory management and in-store display and
7
promotion development. Because we believe our product categories are viewed as traffic drivers by our retail partners, the ability of our sales and service team to help them stay in-stock on our products is highly valued. The quality of our service force has been instrumental in developing our strong and long standing relationships with customers. Our sales representatives are one of the only factory service groups providing regular services in many national retailer’s stores. This hands-on service and support also offers opportunities to sell additional products and further solidify existing relationships. We believe such longstanding customer relationships are difficult to dislodge given the length of the relationships as well as the multiple touch points maintained with each customer. We are often the exclusive supplier of our product categories to the customer’s entire store footprint, creating additional efficiencies in distribution and management.
National Distribution Network and Supply Chain Efficiency. Our distribution infrastructure forms the centerpiece of our distinctive selling proposition and provides us with a significant competitive advantage. Our 17 strategically located distribution centers, covering over two million square feet of space, enable us to maintain a greater than 97% fill rate and ship orders to customers in less than 24 hours and deliver within 48 hours of order receipt. Our highly efficient and technologically advanced 385,000 square foot distribution center in Forest Park, Ohio, where the majority of our products are received, is the hub of our distribution network. This highly sophisticated network, which utilizes pick-to-light and radio frequency technologies, enables us to effectively manage the vast number of SKUs, a task our customers and competitors are unable to replicate efficiently. By managing multiple product sources in multiple countries and supplying products and services to thousands of retailers nationwide, we provide a highly differentiated value-added distribution service that benefits the retailer through substantial reduction of in-store labor costs and replenishment paperwork. Our distribution network and supply chain is supported by an integrated sales and operations planning (“S&OP”) group, organized by market channel to improve forecasting accuracy and to provide product level information by customer group. The S&OP group’s monthly reporting packages provide management with timely reports on key performance indicators and enable us to provide suppliers 26 weeks of demand forecasts and weekly shipping schedules.
Highly Diversified and Stable Product Categories. We believe we provide the most comprehensive selection of fastener and related hardware products to the retail channel with over 130,000 SKUs. The items within our product categories possess highly attractive end-user demand attributes and generate high margins for both us and our customers. We believe that end-user demand for our products exhibit price inelastic and recession-resistant characteristics: whether a small package of fasteners for a small repair project, a key requiring replacement or a tag for a new pet, macroeconomic conditions do not tend to materially influence the purchasing decision. This is illustrated by our strong operating performance during periods of economic weakness. Furthermore, we believe that the low price point for most of our products minimize end-user product price comparison or product substitution behavior, which helps maintain elevated gross margins for the merchant. Lastly, the depth and breadth of our product categories ensures a wide product selection for end-users, which enhances store foot traffic, minimizes lost or missed sales and improves merchant profitability.
Robust Sales and Operations Planning and Reporting. We have developed and implemented an integrated S&OP group through which our leadership team consistently achieves focus, alignment and synchronization among all functions of the organization. The S&OP group is organized by market channel to improve forecasting accuracy and create product level information by customer group. The integration and synchronization of customer purchasing needs to the manufacturing process in Asia provides suppliers with 26 weeks of demand forecasts with weekly shipping schedules. In addition, our dedicated internal monthly reporting packages provide our management with timely reports on key performance indicators, income and expense items and balance sheet metrics including snapshots of product and customer sales, margins and profits, working capital and detailed management discussion and analysis and management briefs on strategic initiatives. The reporting packages also provide information on budgeted financials compared to actual results by customer and product segments, which facilitate executive level monthly meetings to manage operations effectively.
8
Experienced and Proven Management Team. Our senior management team has a broad range of expertise with an average of over 14 years of experience in the hardware industry and 11 years at Hillman. Our senior management team represents a solid mix of tenured employees with long careers at Hillman, augmented by new management talent from large, well-respected organizations. Our current management team has driven Hillman’s highly effective business strategy over a long period, leading to our strong operating and financial performance over that time period.
Strong Equity Ownership. CCMP is a leading global private equity firm specializing in buyouts and growth equity investments in companies ranging from $250 million to more than $3 billion in size. CCMP’s founders have invested over $15 billion since 1984, which includes their activities at J.P. Morgan Partners, LLC (a private equity division of JPMorgan Chase & Co.) and its predecessor firms. CCMP was formed in August 2006 when the buyout and growth equity investment professionals of J.P. Morgan Partners, LLC separated from JPMorgan Chase & Co. to commence operations as an independent firm. The foundation of CCMP’s investment approach is to leverage the combined strengths of its deep industry expertise and proprietary global network of relationships by focusing on four targeted industries (Industrials; Consumer/Retail; Energy; and Healthcare). Following the consummation of the Transactions, affiliates of CCMP, together with certain co-investors, will control approximately 80% of the outstanding voting shares of the company. Oak Hill Capital Partners, along with certain co-investors, and certain current and former members of management will retain an ownership stake in the business.
Strategy
We intend to continue to expand our business, enhance our market position and increase our net sales and cash flow by focusing on the following key strategies:
Expanding Product Offerings for Existing Customers: Since 2010, we have more than doubled our SKU count from 60,000 units to over 130,000 units, and we believe meaningful additional opportunities exist to expand our current product offerings and bring new products to existing customers. We estimate the market opportunity for our core product categories to be approximately $1.5 billion, of which, based on our net sales for the year ended December 31, 2013, we comprise approximately 43%. For current product offerings, increased penetration of the fastener, key duplication, threaded rod, LNS and engraving product lines to some of our largest customers presents a significant growth opportunity. We plan to increase our product penetration by leveraging our existing supply chain with innovative sales and merchandising programs and a focused sales approach with existing customers.
Additionally, we have historically been successful in adding new products to our existing portfolio, both through organic initiatives as well as acquisitions, by seeking product expansion opportunities that are complementary to the existing portfolio and that can be marketed through our existing sales force. We estimate the market opportunity for this complementary product expansion to be approximately $1.8 billion. The success of our new product introductions is reflected in the evolution of our diverse product portfolio. For example, the revenue contribution of our non-Fastener product lines has increased from 5% of total revenues in 1996 to 36% in 2013. We introduced our Builder’s Hardware product line in 2007, the engraving product line in 2011, nail, deck & drywall in 2013 and also continue to roll out improvements to our key and engraving offerings such as FastKey 36, Quick-Tag International, FIDO Jr. and Phoenix in 2013. We believe additional opportunities exist for further growth in other categories, including plumbing and electrical, which we believe to be approximately a $2.2 billion market opportunity.
Enhancing Growth Through Footprint Expansion: We believe we have significant growth opportunities through footprint expansion by our major customers and our own geographic expansion. We are the exclusive provider of our core products to most of our customers and we believe we are well positioned to secure aisle space for such products when these customers open new stores both domestically and internationally. It is
9
anticipated that customers in our National and Regional customer segment will continue to open new stores in the coming years, providing us with a “built-in” organic growth opportunity. For example, The Home Depot’s entry into Mexico early in the 2000’s and its subsequent expansion to 100+ stores currently provides us with a strong growth platform in Mexico. Big Box store openings are expected to gain momentum should the retailing environment improve in step with a general economic recovery.
We have expanded into Canada, Mexico and Central America in recent years and believe we are well-positioned to expand even further into these and potentially into other international markets. In particular, we have dramatically increased our presence in Canada, which we believe provides significant growth opportunities given the fragmented market. In 2002, we opened Hillman Canada as a greenfield operation. In 2007, we were awarded major business wins in Lowes and Canadian Tire across various product categories. Our acquisition of H. Paulin & Co in February 2013 significantly expanded our presence in Canada, incrementally increasing net sales by approximately $130 million. Our distribution centers in Canada and Mexico provide crucial support to our international customers. We plan to continue to seek international expansion through new customers, increased penetration of existing customers, continued footprint expansion of current customers, and launch of new products.
Increasing Operating Efficiencies: We will continue to focus on enhancing our operating efficiency, including working capital management and effectively managing our cost structure. We believe we could meaningfully increase our sales within our current facility footprint and have identified potential for further capacity expansion through lean initiatives. We intend to expand our implementation of lean initiatives throughout the organization, providing potential for enhanced profitability and more efficient inventory management. Our focus will include improved sourcing capabilities and greater manufacturing efficiencies in selected facilities.
Proven Acquisition Strategy and Execution with an Active Pipeline: We have a strategic focus on growing our business through acquisitions. We have demonstrated a strong track record of successfully acquiring and integrating acquisitions, and plan to continue to selectively pursue tuck-in acquisitions. Since 2000, we have successfully completed 10 significant acquisitions, allowing us to expand our product portfolio with existing customers and enter new markets. Our long-tenured management team, which has participated in the integration of these acquisitions, is well versed in identifying and realizing synergies through effective integration. Most recently, we closed the Paulin Acquisition in 2013, which significantly expanded our footprint in Canada. The addition of Paulin also deepened our penetration into national accounts such as Home Depot and Wal-Mart.
The Transactions
The Acquisition
On May 16, 2014, Acquisition Corp, the direct parent of Holdings, entered into the Merger Agreement with certain affiliates of CCMP, including Purchaser and Merger Sub, pursuant to which the Purchaser will indirectly acquire 100% of the capital stock of Acquisition Corp in a reverse triangular merger pursuant to which Merger Sub will merge with and into Acquisition Corp, with Acquisition Corp continuing as the surviving corporation. Finance Sub was formed for the sole purpose of entering into the Senior Credit Facilities and issuing the notes offered hereby to finance the Acquisition and, immediately subsequent to the Acquisition, will be merged with and into the Company, which will be the surviving corporation and will assume the obligations of Finance Sub under the notes and the Senior Credit Facilities by operation of law. The issuance and sale of the notes are conditioned upon the concurrent consummation of the Acquisition, with the date thereof being referred to herein as the “Closing Date.”
10
Related Financing Transactions
Concurrently with the consummation of the Acquisition, the Purchaser expects to enter into the following financing transactions:
| • | We expect to enter into $680.0 million senior secured credit facilities, the Senior Credit Facilities, consisting of (i) a $610.0 million term loan facility (the “New Term Loan Facility”), all of which will be drawn on the Closing Date, and (ii) a $70.0 million revolving loan facility (the “New Revolving Credit Facility”), of which approximately $9.0 million is currently expected to be drawn on the Closing Date. See “Description of Other Indebtedness—New Senior Credit Facilities.” |
| • | We expect to issue $270.0 million aggregate principal amount of notes offered hereby. See “Description of Notes.” |
| • | Affiliates of CCMP, together with certain co-investors, have agreed to contribute up to $439.0 million in cash, while affiliates of Oak Hill, together with certain co-investors, have agreed to invest up to $92.0 million in roll-over equity. In addition, certain current and former members of management are expected to contribute $14.0 million in roll-over equity. |
In connection with the Acquisition, on the Closing Date, the Company will (i) repay all amounts outstanding under its existing senior secured credit facilities, $384.4 million of which was outstanding as of March 31, 2014, consisting of a term loan facility (the “Existing Term Loan”) and a revolving credit facility (the “Existing Revolver”), and (ii) issue an irrevocable notice of redemption for all of its $265.0 million aggregate principal amount of outstanding 10.875% senior notes due 2018 (the “10.875% Senior Notes”) and deposit with the trustee for the 10.875% Senior Notes funds sufficient to satisfy and discharge its obligations under the indenture governing the 10.875% Senior Notes.
Collectively, we refer to the Acquisition (including the Merger), the repayment of existing indebtedness, the financing transactions described above, and the payment of fees and expenses related to the foregoing as the “Transactions” in this offering memorandum.
Our Sponsors
CCMP is a leading global private equity firm specializing in buyouts and growth equity investments in companies ranging from $250 million to more than $3 billion in size. CCMP’s founders have invested over $15 billion since 1984, which includes their activities at J.P. Morgan Partners, LLC (a private equity division of JPMorgan Chase & Co.) and its predecessor firms. CCMP was formed in August 2006 when the buyout and growth equity investment professionals of J.P. Morgan Partners, LLC separated from JPMorgan Chase & Co. to commence operations as an independent firm. The foundation of CCMP’s investment approach is to leverage the combined strengths of its deep industry expertise and proprietary global network of relationships by focusing on four targeted industries (Industrials; Consumer/Retail; Energy; and Healthcare). Following the consummation of the Transactions, affiliates of CCMP, together with certain co-investors, will indirectly own approximately 80% of the Company. Oak Hill, together with certain co-investors, and certain current and former members of management will retain an ownership stake in the business. We refer to CCMP and Oak Hill collectively as the “Sponsors.”
11
Our Corporate Structure
The following chart illustrates our ownership structure and principal indebtedness after giving effect to the Transactions:
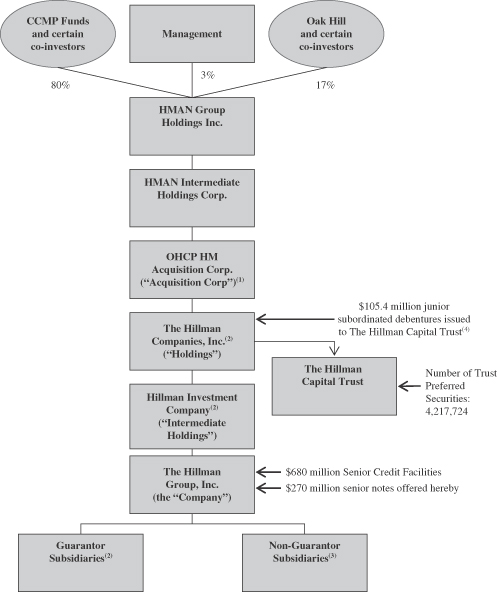
| (1) | Name will be changed to HMAN Intermediate II Holdings Corp. upon the consummation of the Acquisition. |
| (2) | Holdings, Intermediate Holdings and certain wholly-owned domestic subsidiaries will guarantee the notes offered hereby and the Senior Credit Facilities. |
| (3) | For the twelve months ended March 31, 2014, our non-guarantor subsidiaries represented approximately 21.3% of our net sales and 9.9% of our Adjusted EBITDA. In addition, after giving effect to the Transactions, these non-guarantor subsidiaries represented approximately 16.8% of our total assets and 2.8% of our total liabilities as of March 31, 2014. |
| (4) | The Company and its subsidiaries do not guarantee the obligations under the junior subordinated. |
12
ADDITIONAL INFORMATION
We were established in 1964 by Max W. Hillman, Sr. Our headquarters are located at 10590 Hamilton Avenue, Cincinnati, Ohio. Our telephone number is (513) 851-4900. We maintain a corporate website at www.hillmangroup.com. Our website, along with the information contained in it, is not part of this offering memorandum.
13
SUMMARY HISTORICAL AND UNAUDITED PRO FORMA CONDENSED CONSOLIDATED FINANCIAL DATA
The following tables set forth certain summary historical and unaudited pro forma condensed consolidated financial data, as of and for the periods indicated. We derived the summary historical condensed consolidated financial data for the years ended December 31, 2011, 2012 and 2013 and as of December 31, 2012 and December 31, 2013 from Holdings’ audited consolidated financial statements included elsewhere in this offering memorandum. We derived the summary historical condensed consolidated financial data for the three months ended March 31, 2013 and 2014 and as of March 31, 2014 from Holdings’ unaudited consolidated financial statements included elsewhere in this offering memorandum. We derived the summary historical condensed consolidated balance sheet data as of December 31, 2011 from Holdings’ audited consolidated financial statements not included in this offering memorandum. We derived the summary historical condensed consolidated balance sheet data as of March 31, 2013 from Holdings’ unaudited consolidated financial statements not included in this offering memorandum. We derived the summary historical condensed consolidated financial data for the twelve months ended March 31, 2014 by taking the summary historical condensed consolidated financial data for the year ended December 31, 2013, plus the summary historical condensed consolidated financial data for the three months ended March 31, 2014, less the summary historical consolidated financial data for the three months ended March 31, 2013.
The summary unaudited pro forma condensed consolidated financial data presented below has been derived from Holdings’ unaudited pro forma condensed consolidated financial statements included elsewhere in this offering memorandum and gives effect to the Transactions, using the acquisition method of accounting, as if they had occurred on March 31, 2014 for purposes of the unaudited pro forma condensed consolidated balance sheet data and as of January 1, 2013 for purposes of the unaudited pro forma condensed consolidated statements of income, as more fully described in the assumptions and adjustments set forth under the section entitled “Unaudited Pro Forma Condensed Consolidated Financial Statements.”
The unaudited pro forma condensed consolidated financial data is presented for informational purposes only, is based on currently available information and is not necessarily indicative of our financial position or results of operations that would have occurred had the Transactions taken place on the applicable dates, nor are they necessarily indicative of future results. The unaudited pro forma adjustments and allocation of the excess acquisition purchase price over the tangible and intangible net assets acquired to intangible assets and goodwill are preliminary and based on management’s best estimate of the fair value of intangible assets acquired. The final purchase price allocation is dependent on, among other things, the finalization of asset and liability valuations. As of the date of this offering memorandum, we have not completed the valuation studies necessary to estimate the fair values of the assets acquired and liabilities assumed and the related allocation of purchase price. We have allocated the total estimated purchase price, calculated as described in Note 1 under “Unaudited Pro Forma Condensed Consolidated Financial Statements” to the assets acquired and liabilities assumed based on preliminary estimates of their fair values. A final determination of these fair values will reflect our consideration of a final valuation prepared by third-party appraisers. This final valuation will be based on the actual net tangible and intangible assets that existed as of the closing date of the Transactions. Final adjustments will change the allocations of purchase price, which will affect the fair value assigned to certain assets acquired and liabilities assumed and will result in a change to the unaudited pro forma condensed consolidated financial statements, including a change to goodwill. Therefore, the actual adjustments will differ from the pro forma adjustments, and the differences may be material.
The summary historical and unaudited pro forma condensed consolidated financial data set forth below should be read in conjunction with “Basis of Financial Information,” “Use of Proceeds,” “Capitalization,” “Unaudited Pro Forma Condensed Consolidated Financial Statements,” “Selected Consolidated Financial Data,” “Management’s Discussion and Analysis of Financial Condition and Results of Operations” and our consolidated financial statements and the related notes thereto each of which is included elsewhere in this offering memorandum.
14
| Fiscal Year Ended December 31, | Three Months Ended March 31, |
Historical Twelve Months Ended March 31, 2014 |
Pro Forma Twelve Months Ended March 31, 2014 |
|||||||||||||||||||||||||
| 2011 | 2012 | 2013 | 2013 | 2014 | ||||||||||||||||||||||||
| (dollars in thousands) | ||||||||||||||||||||||||||||
| Statements of comprehensive loss: |
||||||||||||||||||||||||||||
| Net sales |
$ | 506,526 | $ | 555,465 | $ | 701,641 | $ | 143,919 | $ | 154,779 | $ | 712,501 | $ | 712,501 | ||||||||||||||
| Cost of sales (exclusive of depreciation and amortization shown separately below) |
252,491 | 275,016 | 359,326 | 73,646 | 79,415 | 365,095 | 365,095 | |||||||||||||||||||||
| Selling, general and administrative |
169,766 | 188,330 | 225,651 | 48,369 | 55,843 | 233,125 | 233,125 | |||||||||||||||||||||
| Acquisition and integration |
2,805 | 3,031 | 8,638 | 2,029 | — | 6,609 | 6,609 | |||||||||||||||||||||
| Depreciation |
21,333 | 22,009 | 24,796 | 5,542 | 6,868 | 26,122 | 26,122 | |||||||||||||||||||||
| Amortization |
20,717 | 21,752 | 22,112 | 5,446 | 5,544 | 22,210 | 31,700 | |||||||||||||||||||||
| Management and transaction fees to related party |
110 | 155 | 77 | — | — | 77 | 500 | |||||||||||||||||||||
| Other expense, net |
851 | 4,204 | 4,600 | 1,103 | (488 | ) | 3,009 | 3,009 | ||||||||||||||||||||
|
|
|
|
|
|
|
|
|
|
|
|
|
|
|
|||||||||||||||
| Income from operations |
38,453 | 40,968 | 56,441 | 7,784 | 7,597 | 56,254 | 46,341 | |||||||||||||||||||||
| Interest expense, net |
40,679 | 41,138 | 48,138 | 11,953 | 11,545 | 47,730 | 50,974 | |||||||||||||||||||||
| Interest expense on junior subordinated debentures |
12,610 | 12,610 | 12,610 | 3,152 | 3,152 | 12,610 | 12,610 | |||||||||||||||||||||
| Investment income on trust common securities |
(378 | ) | (378 | ) | (378 | ) | (94 | ) | (95 | ) | (379 | ) | (379 | ) | ||||||||||||||
|
|
|
|
|
|
|
|
|
|
|
|
|
|
|
|||||||||||||||
| Loss before income taxes |
(14,458 | ) | (12,402 | ) | (3,929 | ) | (7,227 | ) | (7,005 | ) | (3,707 | ) | (16,864 | ) | ||||||||||||||
| Income tax benefit |
(4,679 | ) | (5,168 | ) | (2,781 | ) | (2,642 | ) | (2,943 | ) | (3,082 | ) | (4,497 | ) | ||||||||||||||
| Net loss |
(9,779 | ) | (7,234 | ) | (1,148 | ) | (4,585 | ) | (4,062 | ) | (625 | ) | (12,367 | ) | ||||||||||||||
|
|
|
|
|
|
|
|
|
|
|
|
|
|
|
|||||||||||||||
| Other comprehensive (loss) income: |
||||||||||||||||||||||||||||
| Foreign currency translation adjustments |
(179 | ) | 1,051 | (5,742 | ) | (80 | ) | (4,047 | ) | (9,709 | ) | (9,709 | ) | |||||||||||||||
| Interest rate swap, net of tax |
624 | — | — | — | — | — | — | |||||||||||||||||||||
|
|
|
|
|
|
|
|
|
|
|
|
|
|
|
|||||||||||||||
| Total other comprehensive (loss) income |
445 | 1,051 | (5,742 | ) | (80 | ) | (4,047 | ) | (9,709 | ) | (9,709 | ) | ||||||||||||||||
|
|
|
|
|
|
|
|
|
|
|
|
|
|
|
|||||||||||||||
| Comprehensive loss |
$ | (9,334 | ) | $ | (6,183 | ) | $ | (6,890 | ) | $ | (4,665 | ) | $ | (8,109 | ) | $ | (10,334 | ) | $ | (22,076 | ) | |||||||
|
|
|
|
|
|
|
|
|
|
|
|
|
|
|
|||||||||||||||
| Statements of cash flow data: |
||||||||||||||||||||||||||||
| Net cash provided by operating activities |
$ | 24,461 | $ | 23,280 | $ | 41,525 | $ | (5,139 | ) | $ | 3,396 | $ | 50,060 | |||||||||||||||
| Net cash used in investing activities |
(73,521 | ) | (24,302 | ) | (140,655 | ) | (110,024 | ) | (6,925 | ) | (37,556 | ) | ||||||||||||||||
| Net cash used in financing activities |
53,758 | 54,413 | 69,010 | 73,604 | (559 | ) | (5,153 | ) | ||||||||||||||||||||
| Balance sheet data (at period end): |
||||||||||||||||||||||||||||
| Cash and cash equivalents |
$ | 12,027 | $ | 65,548 | $ | 34,969 | $ | 22,639 | $ | 26,630 | $ | 26,630 | $ | 2,000 | ||||||||||||||
| Net working capital(1) |
123,211 | 193,945 | 238,786 | 224,665 | 234,968 | 234,968 | 218,137 | |||||||||||||||||||||
| Total assets |
1,127,851 | 1,175,793 | 1,264,856 | 1,262,044 | 1,254,102 | 1,254,102 | 1,845,070 | |||||||||||||||||||||
| Total liabilities |
837,057 | 891,182 | 985,962 | 981,198 | 982,513 | 982,513 | 1,300,170 | |||||||||||||||||||||
| Total Company debt, including current portion(2) |
518,132 | 584,933 | 653,915 | 658,548 | 652,912 | 652,912 | 889,400 | |||||||||||||||||||||
| Total consolidated debt, including current portion(3) |
633,543 | 700,065 | 768,856 | 773,634 | 767,803 | 767,803 | 994,843 | |||||||||||||||||||||
| Selected supplemental data: |
||||||||||||||||||||||||||||
| Capital expenditures |
$ | 17,927 | $ | 24,305 | $ | 38,038 | $ | 6,608 | $ | 6,925 | $ | 38,355 | $ | 38,355 | ||||||||||||||
| Adjusted EBITDA(4) |
90,219 | 107,019 | 128,017 | 22,484 | 21,166 | 126,699 | 126,699 | |||||||||||||||||||||
| Pro Forma Adjusted EBITDA(4) |
|
135,749 | ||||||||||||||||||||||||||
| Pro forma Company cash interest expense(5) |
|
47,628 | ||||||||||||||||||||||||||
| Pro forma consolidated cash interest expense(6) |
|
60,238 | ||||||||||||||||||||||||||
| Ratio of consolidated secured debt to Pro Forma Adjusted EBITDA(7) |
|
4.6x | ||||||||||||||||||||||||||
| Ratio of Company net total debt to Pro Forma Adjusted EBITDA(8) |
|
6.5x | ||||||||||||||||||||||||||
| Ratio of Pro Forma Adjusted EBITDA to pro forma Company cash interest expense(9) |
|
2.9x | ||||||||||||||||||||||||||
| (1) | Net working capital is defined as current assets minus current liabilities. |
| (2) | Excludes Holdings’ $105.4 million junior subordinated debentures. The Company and its subsidiaries do not guarantee the obligations under the junior subordinated debentures. |
| (3) | Includes Holdings’ $105.4 million junior subordinated debentures. The Company and its subsidiaries do not guarantee the obligations under the junior subordinated debentures. |
| (4) | We present EBITDA, Adjusted EBITDA and Pro Forma Adjusted EBITDA as supplemental measures of our performance. See “Non-GAAP Financial Measures.” |
(footnotes continued on following page)
15
(footnotes continued from previous page)
The following table provides a reconciliation of our net loss to EBITDA, Adjusted EBITDA and Pro Forma Adjusted EBITDA for the periods presented:
| Fiscal Year Ended December 31, |
Three Months Ended March 31, |
Historical Twelve Months Ended March 31, 2014 |
Pro Forma Twelve Months Ended March 31, 2014 |
|||||||||||||||||||||||||
| 2011 | 2012 | 2013 | 2013 | 2014 | ||||||||||||||||||||||||
| (dollars in thousands) | ||||||||||||||||||||||||||||
| Net loss |
$ | (9,779 | ) | $ | (7,234 | ) | $ | (1,148 | ) | $ | (4,585 | ) | $ | (4,062 | ) | $ | (625 | ) | $ | (12,367 | ) | |||||||
| Income tax benefit |
(4,679 | ) | (5,168 | ) | (2,781 | ) | (2,642 | ) | (2,943 | ) | (3,082 | ) | (4,497 | ) | ||||||||||||||
| Interest expense, net |
40,679 | 41,138 | 48,138 | 11,953 | 11,545 | 47,730 | 50,974 | |||||||||||||||||||||
| Interest expense on junior subordinated debentures |
12,610 | 12,610 | 12,610 | 3,152 | 3,152 | 12,610 | 12,610 | |||||||||||||||||||||
| Investment income on trust common securities |
(378 | ) | (378 | ) | (378 | ) | (94 | ) | (95 | ) | (379 | ) | (379 | ) | ||||||||||||||
| Depreciation |
21,333 | 22,009 | 24,796 | 5,542 | 6,868 | 26,122 | 26,122 | |||||||||||||||||||||
| Amortization |
20,717 | 21,752 | 22,112 | 5,446 | 5,544 | 22,210 | 31,700 | |||||||||||||||||||||
|
|
|
|
|
|
|
|
|
|
|
|
|
|
|
|||||||||||||||
| EBITDA |
$ | 80,503 | $ | 84,729 | $ | 103,349 | $ | 18,772 | $ | 20,009 | $ | 104,586 | $ | 104,163 | ||||||||||||||
| Stock compensation expense(a) |
— | 714 | 9,006 | 261 | 508 | 9,253 | 9,253 | |||||||||||||||||||||
| Management fees(b) |
110 | 155 | 77 | — | — | 77 | 500 | |||||||||||||||||||||
| Foreign exchange gain/(loss)(c) |
446 | 1,171 | 2,252 | 1,163 | (25 | ) | 1,064 | 1,064 | ||||||||||||||||||||
| Merger-related expenses(d) |
2,805 | 3,031 | 8,638 | 2,029 | — | 6,609 | 6,609 | |||||||||||||||||||||
| Legal fees and settlement(e) |
2,120 | 11,295 | — | — | 200 | 200 | 200 | |||||||||||||||||||||
| Restructuring costs(f) |
2,113 | 3,684 | 4,382 | 241 | 35 | 4,176 | 4,176 | |||||||||||||||||||||
| Other adjustments(g) |
2,122 | 2,240 | 313 | 18 | 439 | 734 | 734 | |||||||||||||||||||||
|
|
|
|
|
|
|
|
|
|
|
|
|
|
|
|||||||||||||||
| Adjusted EBITDA |
$ | 90,219 | $ | 107,019 | $ | 128,017 | $ | 22,484 | $ | 21,166 | $ | 126,699 | $ | 126,699 | ||||||||||||||
|
|
|
|
|
|
|
|
|
|
|
|
|
|
|
|||||||||||||||
| Purchasing savings(h) |
|
8,050 | ||||||||||||||||||||||||||
| 2013 facilities closures(i) |
|
550 | ||||||||||||||||||||||||||
| Paulin Acquisition synergies(j) |
|
450 | ||||||||||||||||||||||||||
|
|
|
|||||||||||||||||||||||||||
| Pro Forma Adjusted EBITDA |
|
$ | 135,749 | |||||||||||||||||||||||||
|
|
|
|||||||||||||||||||||||||||
| (a) | For 2012 and 2013, represents non-cash compensation expensed in connection with our stock option plan. Compensation expense increased in 2013 in connection with the Paulin Acquisition. |
| (b) | Represents expenses reimbursed to Oak Hill. |
| (c) | Represents foreign exchange gains and losses associated with a foreign exchange swap loss in connection with the Paulin Acquisition, the timing of payments, and non-cash gains and losses on U.S. dollar-denominated intercompany debt to the Company’s Australian, Canadian and Mexican subsidiaries. |
| (d) | Includes professional fees related to acquisitions and costs to integrate acquisitions, as well as non-cash expenses in 2013 associated with purchase accounting resulting from the Paulin Acquisition. |
| (e) | Represents professional fees and settlements related to one-time, non-recurring legal matters, specifically, the Steelworks settlement in 2011 and the Hy-Ko Products Company (“Hy-Ko”) settlement in 2012. For additional information on these matters, see Note 17. Commitments and Contingencies to our audited consolidated financial statements for the three years ended December 31, 2013 contained elsewhere in this offering memorandum. |
| (f) | Includes historical facility closures and related severance costs paid to individuals in connection with completed acquisitions and distribution optimization as well as costs in 2012 and 2013 related to executive restructuring and transitioning of our Chief Executive Officer. |
| (g) | Reflects various non-recurring and non-cash items, including, among other items (i) for fiscal 2011, $0.7 million for a cash discount reserve and $1.1 million for an inventory repurchase resulting from a customer inventory shift, (ii) for fiscal 2012, $1.4 million in costs for a Canadian anti-dumping duty case which has been resolved and $0.5 million relating to the bankruptcy of a regional customer, (iii) for fiscal 2013, a $0.8 million loss on disposition of fixed assets which was offset by reversals of adjustments to EBITDA taken in 2012 and (iv) for the three months ended March 31, 2014, $0.4 million for long-term incentives for certain Paulin management. |
| (h) | Represents the pro forma impact of run-rate cost savings (net of amounts already realized) agreed with vendors in exchange for higher committed volumes, based on savings calculated against actual SKU volume, as part of a purchase savings program that began in 2012 and negotiations held during 2012 and 2013 with our top suppliers. Annual contracts were awarded that stipulated annual volume, price and service expectations, although no fixed volume commitments were made by the Company. |
| (i) | Represents pro forma impact of U.S. facilities closed during 2013, including savings related to senior management and other operating costs. |
| (j) | Represents run-rate cost savings and synergies for actions taken in connection with the Paulin Acquisition, including consolidation of legacy-held facility in Canada. |
(footnotes continued on following page)
16
(footnotes continued from previous page)
| (5) | Pro forma Company cash interest expense represents cash interest expense of the Company and its subsidiaries after giving effect to the Transactions had the pro forma capital structure been in place throughout the twelve months ended March 31, 2014. A 0.125% change in the assumed weighted average interest rate for the Senior Credit Facilities above the applicable LIBOR floor and the interest rate for the notes offered hereby would increase (or decrease) pro forma Company cash interest expense by approximately $0.8 million. |
| (6) | Pro forma consolidated cash interest expense represents cash interest expense of Holdings and its subsidiaries, including the Company, after giving effect to the Transactions had the pro forma capital structure been in place throughout the twelve months ended March 31, 2014. A 0.125% change in the assumed weighted average interest rate for the Senior Credit Facilities above the applicable LIBOR floor and the interest rate for the notes offered hereby would increase (or decrease) pro forma consolidated cash interest expense by approximately $0.8 million. |
| (7) | Ratio of consolidated secured debt to Pro Forma Adjusted EBITDA represents consolidated total debt of Holdings and its subsidiaries, including the Company, that is secured by a lien divided by Pro Forma Adjusted EBITDA. |
| (8) | Ratio of net total Company debt to Pro Forma Adjusted EBITDA represents consolidated total debt of the Company and its subsidiaries, less cash of the Company and its subsidiaries divided by Pro Forma Adjusted EBITDA. |
| (9) | Ratio of Pro Forma Adjusted EBITDA to pro forma Company cash interest expense represents Pro Forma Adjusted EBITDA divided by pro forma cash interest expense of the Company and its subsidiaries. Pro forma Company cash interest expense does not include cash interest expense for Holdings’ $105.4 million junior subordinated debentures. |
17
UNAUDITED PRO FORMA CONDENSED CONSOLIDATED FINANCIAL STATEMENTS
The following unaudited pro forma condensed consolidated financial statements have been derived by applying pro forma adjustments to Holdings’ historical consolidated financial statements included elsewhere in this offering memorandum. The unaudited pro forma condensed consolidated statements of comprehensive loss give effect to the Transactions as if they had occurred on January 1, 2013. The unaudited pro forma condensed consolidated balance sheet gives effect to the Transactions as if they had occurred on March 31, 2014. The unaudited pro forma condensed consolidated statement of comprehensive loss for the twelve months ended March 31, 2014 has been derived by taking the pro forma condensed consolidated statement of comprehensive income for the year ended December 31, 2013, plus the pro forma condensed consolidated statement of comprehensive income for the three months ended March 31, 2014, less the pro forma condensed consolidated statement of comprehensive income for the three months ended March 31, 2013. The pro forma condensed consolidated financial statements for the twelve months ended March 31, 2014 have been included in this offering memorandum in order to provide investors with historical and pro forma information for the latest practicable twelve month period.
The unaudited pro forma adjustments are based upon available information and certain assumptions that we believe are reasonable under the circumstances. The unaudited pro forma condensed consolidated financial statements are presented for informational purposes only. The unaudited pro forma condensed consolidated financial statements do not purport to represent what our actual consolidated results of operations or the consolidated financial condition would have been had the Transactions actually occurred on the dates indicated, nor does it purport to project our results of operations or financial condition for any future period or as of any future date. The unaudited pro forma condensed consolidated financial statements should be read in conjunction with the information contained in “Basis of Financial Information,” “Summary—Summary Historical and Unaudited Pro Forma Condensed Consolidated Financial Data,” “The Transactions,” “Selected Consolidated Financial Data,” “Management’s Discussion and Analysis of Financial Condition and Results of Operations” and the consolidated financial statements and the notes thereto included elsewhere in this offering memorandum. All pro forma adjustments and their underlying assumptions are described more fully in the notes to our unaudited pro forma condensed consolidated financial statements.
The unaudited pro forma condensed consolidated statements of comprehensive loss give effect to adjustments that are (i) directly attributable to the Transactions, (ii) factually supportable and (iii) expected to have a continuing impact. The unaudited pro forma consolidated balance sheet gives effect to adjustments that are (i) directly attributable to the Transactions and (ii) factually supportable, regardless of whether they have a continuing impact or are non-recurring. The unaudited pro forma condensed consolidated statements of comprehensive loss for the year ended December 31, 2013 and the three months ended March 31, 2013 do not give effect to the Paulin Acquisition as if it had occurred on January 1, 2013.
The Acquisition will be accounted for using the acquisition method of accounting. The pro forma information presented, including allocations of purchase price, is based on preliminary estimates of fair value of assets and liabilities, available information as of the date of this offering memorandum and management assumptions, and will be revised as additional information becomes available. The actual adjustments to our consolidated financial statements upon the closing of the Transactions will depend on a number of factors, including a final independent third-party valuation of assets and liabilities and the actual balance of our net assets on the Closing Date. Therefore, the actual adjustments will differ from the pro forma adjustments, and the differences may be material.
18
Unaudited Pro Forma Condensed Consolidated Balance Sheet
As of March 31, 2014
(dollars in thousands)
| Historical | Adjustments | Pro Forma |
||||||||||||||
| Assets |
||||||||||||||||
| Current assets: |
||||||||||||||||
| Cash and cash equivalents |
$ | 26,630 | $ | (24,630 | ) | (1 | ) | $ | 2,000 | |||||||
| Restricted investments |
227 | — | 227 | |||||||||||||
| Accounts receivable, net |
93,908 | — | 93,908 | |||||||||||||
| Inventories, net |
181,748 | — | 181,748 | |||||||||||||
| Deferred income taxes |
10,013 | — | 10,013 | |||||||||||||
| Other current assets |
8,696 | — | 8,696 | |||||||||||||
|
|
|
|
|
|
|
|||||||||||
| Total current assets |
321,222 | (24,630 | ) | 296,592 | ||||||||||||
| Property and equipment, net |
94,950 | — | 94,950 | |||||||||||||
| Goodwill |
465,741 | 376,694 | (2 | ) | 842,435 | |||||||||||
| Intangible assets, net |
356,069 | 216,431 | (2 | ) | 572,500 | |||||||||||
| Restricted investments |
1,561 | — | 1,561 | |||||||||||||
| Deferred financing fees |
9,035 | 22,483 | (3 | ) | 31,518 | |||||||||||
| Investment in trust common securities |
3,261 | — | 3,261 | |||||||||||||
| Other assets |
2,263 | (10 | ) | (4 | ) | 2,253 | ||||||||||
|
|
|
|
|
|
|
|||||||||||
| Total assets |
$ | 1,254,102 | $ | 590,968 | $ | 1,845,070 | ||||||||||
|
|
|
|
|
|
|
|||||||||||
| Liabilities and stockholders’ equity |
||||||||||||||||
| Current liabilities: |
||||||||||||||||
| Accounts payable |
$ | 47,215 | $ | — | $ | 47,215 | ||||||||||
| Current portion of senior term loans |
3,968 | 2,132 | (1 | ) | 6,100 | |||||||||||
| Current portion of capitalized lease and other obligations |
233 | (133 | ) | (1 | ) | 100 | ||||||||||
| Interest payable on junior subordinated debentures |
1,019 | — | 1,019 | |||||||||||||
| Accrued expenses: |
||||||||||||||||
| Salaries and wages |
6,031 | — | 6,031 | |||||||||||||
| Pricing allowances |
4,867 | — | 4,867 | |||||||||||||
| Income and other taxes |
3,192 | — | 3,192 | |||||||||||||
| Interest |
9,798 | (9,798 | ) | (1 | ) | — | ||||||||||
| Deferred compensation |
227 | — | 227 | |||||||||||||
| Other accrued expenses |
9,704 | — | 9,704 | |||||||||||||
|
|
|
|
|
|
|
|||||||||||
| Total current liabilities |
86,254 | (7,799 | ) | 78,455 | ||||||||||||
| Long-term senior term loans |
376,939 | 226,961 | (1 | ) | 603,900 | |||||||||||
| Bank revolving credit |
— | 9,000 | (1 | ) | 9,000 | |||||||||||
| Long-term capitalized lease and other obligations |
338 | (38 | ) | (1 | ) | 300 | ||||||||||
| Long-term senior notes |
271,434 | (1,434 | ) | (1 | ) | 270,000 | ||||||||||
| Junior subordinated debentures |
114,891 | 17,221 | (1 | ) | 132,112 | |||||||||||
| Deferred compensation |
1,561 | — | 1,561 | |||||||||||||
| Deferred income taxes |
115,580 | 83,542 | (5 | ) | 199,122 | |||||||||||
| Other non-current liabilities |
15,516 | (9,796 | ) | (4 | ) | 5,720 | ||||||||||
|
|
|
|
|
|
|
|||||||||||
| Total liabilities |
982,513 | 317,657 | 1,300,170 | |||||||||||||
| Common stock with put options: |
||||||||||||||||
| Common stock, $.01 par, 5,000 shares authorized, 160.9 issued and outstanding at March 31, 2014 |
16,975 | (16,975 | ) | (1 | ) | — | ||||||||||
| Commitments and contingencies |
||||||||||||||||
| Stockholders’ Equity: |
||||||||||||||||
| Preferred Stock: |
||||||||||||||||
| Preferred stock, $.01 par, 5,000 shares authorized, none issued or outstanding at March 31, 2014 |
— | — | — | |||||||||||||
| Common Stock: |
||||||||||||||||
| Common stock, $.01 par, 5,000 shares authorized, 4,839.1 issued and outstanding at March 31, 2014 |
— | — | — | |||||||||||||
| Additional paid-in capital |
293,793 | 251,107 | (1 | ) | 544,900 | |||||||||||
| Accumulated deficit |
(30,261 | ) | 30,261 | (1 | ) | — | ||||||||||
| Accumulated other comprehensive loss |
(8,918 | ) | 8,918 | (1 | ) | — | ||||||||||
|
|
|
|
|
|
|
|||||||||||
| Total stockholders’ equity |
254,614 | 290,286 | 544,900 | |||||||||||||
|
|
|
|
|
|
|
|||||||||||
| Total liabilities and stockholders’ equity |
$ | 1,254,102 | $ | 590,968 | $ | 1,845,070 | ||||||||||
|
|
|
|
|
|
|
|||||||||||
See accompanying notes.
19
Notes to Pro Forma Condensed Consolidated Balance Sheet
(Unaudited)
(dollars in thousands)
| (1) | Reflects cash activity outlined in “Use of Proceeds”, including the elimination of the existing capital structure and the new capital structure following the consummation of the Acquisition. The value of the junior subordinated debentures includes a premium of $23,408 based on the estimated fair market value as of March 31, 2014. |
| (2) | Represents adjustments to goodwill and intangibles based on estimates of the fair values of goodwill and identified intangibles. |
The following table sets forth the calculation and preliminary allocation of excess purchase price with respect to the Transactions:
| Proceeds to equity holders and to repay existing indebtedness |
$ | 1,538,000 | ||
|
|
|
|||
| Purchase price to be allocated |
||||
| Total current assets |
286,579 | |||
| Property and equipment, net |
94,950 | |||
| Deferred financing fees |
31,518 | |||
| Other non-current assets |
3,814 | |||
| Total current liabilities |
(72,355 | ) | ||
| Deferred income tax liability, net |
(189,109 | ) | ||
| Other accrued non-current liabilities |
(7,281 | ) | ||
| Increase to junior subordinated debentures |
(23,408 | )(a) | ||
| Trade names |
80,000 | (b) | ||
| Customer relationships |
450,000 | (b) | ||
| Non-compete agreements |
5,000 | (b) | ||
| Quick-Tag Royalty |
7,000 | (b) | ||
| Laser Key Royalty |
1,500 | (b) | ||
| Keyworks |
4,000 | (b) | ||
| Patents |
25,000 | (b) | ||
| Goodwill |
840,792 | |||
|
|
|
|||
| Total |
$ | 1,538,000 | ||
|
|
|
| (a) | Reflects the difference between liquidation value and the fair value of the junior subordinated debentures as of March 31, 2014. |
| Liquidation value |
$ | 108,704 | ||
| Estimated fair value |
132,113 | |||
|
|
|
|||
| $ | (23,409 | ) | ||
|
|
|
| (b) | For purposes of preparing the unaudited pro forma condensed consolidated financial statements, the estimated purchase price is allocated based on preliminary estimates of fair value of assets and liabilities. Final allocation of the Acquisition purchase price will be based on the actual values of assets acquired and liabilities assumed following the completion of the Acquisition. Accordingly, the value of the assets and liabilities included in the table above is preliminary and is subject to change, which may be material, pending additional information that may become known to us. |
| (3) | Represents the elimination of the existing deferred financing fees of $9,035 and the addition of financing fees on the New Term Loan Facility and the notes offered hereby in the Transactions of $31,518. |
| (4) | Reflects the elimination of asset for interest rate caps of $10 and liability for accrued stock compensation expense to be paid out at the closing of the Acquisition of $9,796. |
| (5) | Represents increase in the deferred tax liability on the estimated step up in intangible asset valuation. |
20
Unaudited Pro Forma Condensed Consolidated Statement of Loss
For the Year ended December 31, 2013
(dollars in thousands)
| Historical | Adjustments | Pro Forma | ||||||||||||||
| Net sales |
$ | 701,641 | $ | — | $ | 701,641 | ||||||||||
| Cost of sales (exclusive of depreciation and amortization shown separately below) |
359,326 | — | 359,326 | |||||||||||||
| Selling, general and administrative |
225,651 | — | 225,651 | |||||||||||||
| Acquisition and integration |
8,638 | — | 8,638 | |||||||||||||
| Depreciation |
24,796 | — | 24,796 | |||||||||||||
| Amortization |
22,112 | 9,588 | (1 | ) | 31,700 | |||||||||||
| Management and transaction fees to related party |
77 | 423 | (2 | ) | 500 | |||||||||||
| Other expense, net |
4,600 | — | 4,600 | |||||||||||||
|
|
|
|
|
|
|
|||||||||||
| Income from operations |
56,441 | (10,011 | ) | 46,430 | ||||||||||||
| Interest expense, net |
48,138 | 2,836 | (3 | ) | 50,974 | |||||||||||
| Interest expense on junior subordinated debentures |
12,610 | — | 12,610 | |||||||||||||
| Investment income on trust common securities |
(378 | ) | — | (378 | ) | |||||||||||
|
|
|
|
|
|
|
|||||||||||
| Loss before income taxes |
(3,929 | ) | (12,847 | ) | (16,776 | ) | ||||||||||
| Income tax benefit |
(2,781 | ) | (1,258 | ) | (4 | ) | (4,039 | ) | ||||||||
|
|
|
|
|
|
|
|||||||||||
| Net loss |
$ | (1,148 | ) | $ | (11,589 | ) | $ | (12,737 | ) | |||||||
|
|
|
|
|
|
|
|||||||||||
| Net loss (from above) |
$ | (1,148 | ) | $ | (11,589 | ) | $ | (12,737 | ) | |||||||
| Other comprehensive loss: |
||||||||||||||||
| Foreign currency translation adjustments |
(5,742 | ) | — | (5,742 | ) | |||||||||||
|
|
|
|
|
|
|
|||||||||||
| Total other comprehensive loss |
(5,742 | ) | — | (5,742 | ) | |||||||||||
|
|
|
|
|
|
|
|||||||||||
| Comprehensive loss |
$ | (6,890 | ) | $ | (11,589 | ) | $ | (18,479 | ) | |||||||
|
|
|
|
|
|
|
|||||||||||
See accompanying notes.
21
Unaudited Pro Forma Condensed Consolidated Statement of Comprehensive Loss
For the Three Months Ended March 31, 2014
(dollars in thousands)
| Historical | Adjustments | Pro Forma | ||||||||||||
| Net sales |
$ | 154,779 | $ | — | $ | 154,779 | ||||||||
| Cost of sales (exclusive of depreciation and amortization shown separately below) |
79,415 | — | 79,415 | |||||||||||
| Selling, general and administrative |
55,843 | — | 55,843 | |||||||||||
| Depreciation |
6,868 | — | 6,868 | |||||||||||
| Amortization |
5,544 | 2,381 | (1) | 7,925 | ||||||||||
| Management fees to related party |
— | 125 | (2) | 125 | ||||||||||
| Other (income) expense |
(488 | ) | — | (488 | ) | |||||||||
|
|
|
|
|
|
|
|||||||||
| Income from operations |
7,597 | (2,506 | ) | 5,091 | ||||||||||
| Interest expense, net |
11,545 | 1,114 | (3) | 12,659 | ||||||||||
| Interest expense on junior subordinated debentures |
3,152 | — | 3,152 | |||||||||||
| Investment income on trust common securities |
(95 | ) | — | (95 | ) | |||||||||
|
|
|
|
|
|
|
|||||||||
| Loss before income taxes |
(7,005 | ) | (3,620 | ) | (10,625 | ) | ||||||||
| Income tax benefit |
(2,943 | ) | (478 | ) | (4) | (3,421 | ) | |||||||
|
|
|
|
|
|
|
|||||||||
| Net loss |
$ | (4,062 | ) | $ | (3,142 | ) | $ | (7,204 | ) | |||||
|
|
|
|
|
|
|
|||||||||
| Net loss (from above) |
$ | (4,062 | ) | $ | (3,142 | ) | $ | (7,204 | ) | |||||
| Other comprehensive loss: |
||||||||||||||
| Foreign currency translation adjustments |
(4,047 | ) | — | (4,047 | ) | |||||||||
|
|
|
|
|
|
|
|||||||||
| Total other comprehensive loss |
(4,047 | ) | — | (4,047 | ) | |||||||||
|
|
|
|
|
|
|
|||||||||
| Comprehensive loss |
$ | (8,109 | ) | $ | (3,142 | ) | $ | (11,251 | ) | |||||
|
|
|
|
|
|
|
|||||||||
See accompanying notes.
22
Unaudited Pro Forma Condensed Consolidated Statement of Comprehensive Loss
For the Three Months Ended March 31, 2013
(dollars in thousands)
| Historical | Adjustments | Pro Forma | ||||||||||||||
| Net sales |
$ | 143,919 | $ | — | $ | 143,919 | ||||||||||
| Cost of sales (exclusive of depreciation and amortization shown separately below) |
73,646 | — | 73,646 | |||||||||||||
| Selling, general and administrative |
48,369 | — | 48,369 | |||||||||||||
| Acquisition and integration |
2,029 | — | 2,029 | |||||||||||||
| Depreciation |
5,542 | — | 5,542 | |||||||||||||
| Amortization |
5,446 | 2,479 | (1 | ) | 7,925 | |||||||||||
| Management fees to related party |
— | 125 | (2 | ) | 125 | |||||||||||
| Other (income) expense |
1,103 | — | 1,103 | |||||||||||||
|
|
|
|
|
|
|
|||||||||||
| Income from operations |
7,784 | (2,604 | ) | 5,180 | ||||||||||||
| Interest expense, net |
11,953 | 706 | (3 | ) | 12,659 | |||||||||||
| Interest expense on junior subordinated debentures |
3,152 | — | 3,152 | |||||||||||||
| Investment income on trust common securities |
(94 | ) | — | (94 | ) | |||||||||||
|
|
|
|
|
|
|
|||||||||||
| Loss before income taxes |
(7,227 | ) | (3,310 | ) | (10,537 | ) | ||||||||||
| Income tax benefit |
(2,642 | ) | (321 | ) | (4 | ) | (2,963 | ) | ||||||||
|
|
|
|
|
|
|
|||||||||||
| Net loss |
$ | (4,585 | ) | $ | (2,989 | ) | $ | (7,574 | ) | |||||||
|
|
|
|
|
|
|
|||||||||||
| Net loss (from above) |
$ | (4,585 | ) | $ | (2,989 | ) | $ | (7,574 | ) | |||||||
| Other comprehensive loss: |
||||||||||||||||
| Foreign currency translation adjustments |
(80 | ) | — | (80 | ) | |||||||||||
|
|
|
|
|
|
|
|||||||||||
| Total other comprehensive loss |
(80 | ) | — | (80 | ) | |||||||||||
|
|
|
|
|
|
|
|||||||||||
| Comprehensive loss |
$ | (4,665 | ) | $ | (2,989 | ) | $ | (7,654 | ) | |||||||
|
|
|
|
|
|
|
|||||||||||
See accompanying notes.
23
Unaudited Pro Forma Condensed Consolidated Statement of Comprehensive Loss
For the Twelve Months Ended March 31, 2014
(dollars in thousands)
| Historical | Adjustments | Pro Forma | ||||||||||||||
| Net sales |
$ | 712,501 | $ | — | $ | 712,501 | ||||||||||
| Cost of sales (exclusive of depreciation and amortization shown separately below) |
365,095 | — | 365,095 | |||||||||||||
| Selling, general and administrative |
233,125 | — | 233,125 | |||||||||||||
| Acquisition and integration |
6,609 | — | 6,609 | |||||||||||||
| Depreciation |
26,122 | — | 26,122 | |||||||||||||
| Amortization |
22,210 | 9,490 | (1 | ) | 31,700 | |||||||||||
| Management and transaction fees to related party |
77 | 423 | (2 | ) | 500 | |||||||||||
| Other expense |
3,009 | — | 3,009 | |||||||||||||
|
|
|
|
|
|
|
|||||||||||
| Income from operations |
56,254 | (9,913 | ) | 46,341 | ||||||||||||
| Interest expense, net |
47,730 | 3,244 | (3 | ) | 50,974 | |||||||||||
| Interest expense on junior subordinated debentures |
12,610 | — | 12,610 | |||||||||||||
| Investment income on trust common securities |
(379 | ) | — | (379 | ) | |||||||||||
|
|
|
|
|
|
|
|||||||||||
| Loss before income taxes |
(3,707 | ) | (13,157 | ) | (16,864 | ) | ||||||||||
| Income tax benefit |
(3,082 | ) | (1,415 | ) | (4 | ) | (4,497 | ) | ||||||||
|
|
|
|
|
|
|
|||||||||||
| Net loss |
$ | (625 | ) | $ | (11,742 | ) | $ | (12,367 | ) | |||||||
|
|
|
|
|
|
|
|||||||||||
| Net loss (from above) |
$ | (625 | ) | $ | (11,742 | ) | $ | (12,367 | ) | |||||||
| Other comprehensive loss: |
||||||||||||||||
| Foreign currency translation adjustments |
(9,709 | ) | — | (9,709 | ) | |||||||||||
|
|
|
|
|
|
|
|||||||||||
| Total other comprehensive loss |
(9,709 | ) | — | (9,709 | ) | |||||||||||
|
|
|
|
|
|
|
|||||||||||
| Comprehensive loss |
$ | (10,334 | ) | $ | (11,742 | ) | $ | (22,076 | ) | |||||||
|
|
|
|
|
|
|
|||||||||||
See accompanying notes.
24
Notes to Pro Forma Consolidated Statement of Comprehensive Loss
(Unaudited)
(dollars in thousands)
| (1) | Represents changes in amortization based upon estimates of fair values and useful lives of identified intangible assets as part of the preliminary purchase price allocation. |
| (2) | Represents elimination of management fees paid to Oak Hill and the addition of annual management fees of $500.0 to be paid to CCMP and Oak Hill after consummation of the Acquisition. |
| (3) | Reflects pro forma interest expense resulting from our new capital structure immediately subsequent to the consummation of the Transactions using applicable LIBOR rates as of March 31, 2014. |
| Year Ended December 31, 2013 |
Three Months Ended March 31, 2014 |
Twelve Months Ended March 31, 2014 |
||||||||||
| Pro forma cash interest expense(a) |
47,628 | 11,907 | 47,628 | |||||||||
| Deferred financing fees(b) |
4,328 | 998 | 4,328 | |||||||||
| Amortization of junior subordinated debenture premium(c) |
(982 | ) | (246 | ) | (982 | ) | ||||||
|
|
|
|
|
|
|
|||||||
| 50,974 | 12,659 | 50,974 | ||||||||||
| Less historical interest expense |
(48,138 | ) | (11,545 | ) | (47,730 | ) | ||||||
|
|
|
|
|
|
|
|||||||
| Net adjustment to interest expense |
2,836 | 1,114 | 3,244 | |||||||||
| (a) | The adjustment to interest expense, net represent increase in financing expense for debt issued in connection with the Transactions. Pro forma interest expense, net assumes a weighted average interest rate of 5.36%. A 0.125% change in the interest rate for the Senior Credit Facilities above the applicable LIBOR floor and the interest rate for the notes offered hereby would increase (or decrease) pro forma consolidated cash interest expense by approximately $760. |
| (b) | Represents amortization of deferred financing fees on the New Term Loan Facility and the notes. |
| (c) | Represents amortization of premium on junior subordinated debentures. |
| (4) | Reflects the income tax effect of the pro forma adjustments calculated using the respective statutory tax rates. |
25