Attached files
| file | filename |
|---|---|
| 8-K - 8-K - GETTY REALTY CORP /MD/ | d735044d8k.htm |
 GETTY REALTY CORP. PRESENTATION
REIT Week Presentation
June 2014
Exhibit 99.1 |
 Forward Looking Statements
1
Certain statements in this Presentation constitute “forward-looking statements” within
the meaning of the federal securities laws. Forward- looking statements are statements
that relate to management’s expectations or beliefs, future plans and strategies, future financial performance
and similar expressions concerning matters that are not historical facts. In some cases, you can
identify forward-looking statements by the use of forward-looking terminology such as
“may,” “will,” “should,” “expects,” “intends,” “plans,” “anticipates,” “believes,” “estimates,” “predicts,” or
“potential.” Such forward-looking statements reflect current views with respect to the
matters referred to and are based on certain assumptions and involve known and unknown risks,
uncertainties and other important factors, many of which are beyond the Company’s control, that could
cause the actual results, performance, or achievements of the Company to differ materially from any
future results, performance, or achievement implied by such forward-looking statements. While
forward-looking statements reflect the Company’s good faith beliefs, assumptions and expectations, they are not guarantees of future
performance. The Company does not undertake any obligation to publicly update or revise any
forward-looking statements to reflect changes in underlying assumptions or factors, new
information, data or methods, future events or other changes. For a further discussion of these and
other factors that could cause the Company’s future results to differ materially from any
forward-looking statements, see the Company’s Annual Report on Form 10-K for the
year ended December 31, 2013 and the Company’s Quarterly Report on Form 10-Q for the quarter ended March
31, 2014, including, in particular, the section entitled “Risk Factors” contained therein,
and its other filings with the SEC.
Unless otherwise noted in this Presentation, all reported financial data is presented as of the
quarter ended March 31, 2014, and all portfolio data is as of June 2, 2014. The information
contained herein has been prepared from public and non-public sources believed to be reliable. However, the Company has not
independently verified certain of the information contained herein, and does not make any
representation or warranty as to the accuracy or completeness of the information contained in
this Presentation. |
 Investment Highlights
2
1
National portfolio with focus on growing and densely populated,
high barrier to entry markets
2
Stable cash flows supported by long-term, triple-net leases
3
4
Proven platform to pursue internal and external growth
opportunities in a consolidating sector
5
At a positive inflection point in the Company’s evolution
6
Flexible balance sheet with low leverage
Upside opportunities created through rationalization of
transitional properties in existing portfolio |
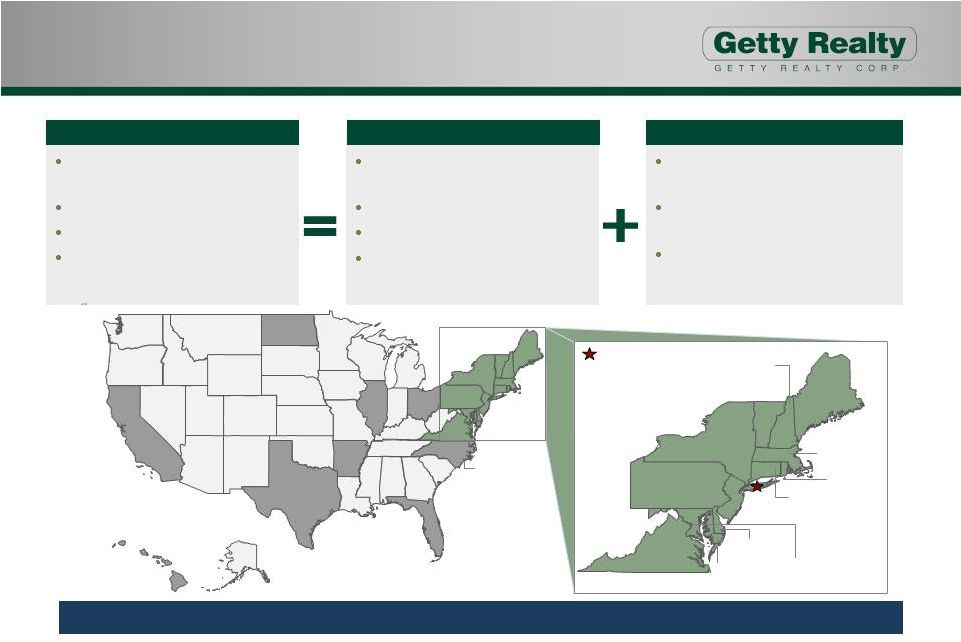 Leading National Portfolio with Future Upside
3
Hawaii
(10)
Florida
(6)
Texas
(17)
North Carolina
(5)
Ohio
(4)
California
(9)
Arkansas
(3)
North Dakota
(1)
Illinois
(1)
Headquarters
New York
(305)
New Hampshire
(50)
Maine
(10)
Massachusetts
(150)
Rhode Island
(13)
Connecticut
(97)
New Jersey
(76)
Delaware
(5)
Pennsylvania
(61)
Maryland
(43)
Virginia
(48)
Washington, DC
(2)
Long-term triple-net lease stability with future upside through transitional
properties 916 retail motor fuel/convenience store
properties
798 owned properties (87%)
118 leased properties (13%)
20 states plus Washington, D.C.
Current Portfolio
20 tenants (685 properties) under long-
term, triple-net leases
85 single tenant triple-net leases
84% of core leases expire after 2022
Sites branded Getty, BP, Exxon, Mobil,
Shell, Chevron, Valero and Aloha
770 Core Properties
Repositioned ~250 properties since
May 2012
Releasing program focused on
attractive long-term, triple-net leases
Proactively recycling capital from
property dispositions into accretive
investments
146 Transitional Properties |
 Significant Presence in Markets with
“High Barriers to Entry”
4
Limited Availability
of
Suitable
Land
Prime Locations in
High
Traffic
Areas
Increasingly
Restrictive
Zoning
Regulations
High replacement costs
Limited new development
Unique assets with ability to satisfy increased
demand for non-gas
uses
Mature and densely populated neighborhoods
High daily traffic counts
Optimal corners with high visibility and easy
access
Close proximity to highway entrances or exit
ramps
Lengthy permitting process
Difficult to obtain the necessary permits to
construct a similar use site
Leading national portfolio with concentrations in high barrier to entry markets
in the Northeast and Mid-Atlantic regions |
 Sustainable Cash Flows Supported by
Long-Term Leases
5
Only 3% of leases
mature in next 5 years
and 17% in next 10
years
High Quality Tenant Base
Diversified tenant base
Prominent national and regional suppliers
2012 repositioning added more than 10 new
quality tenants to the Company’s portfolio
Compelling unit level economics
Rent
coverage
generally
–
1.75x
to
2.25x
Majority of triple-net leases have 15 year initial terms
Provisions for rent increases during initial term
and renewal periods
Unit level visibility via station and tenant financial
performance
84% of core property leases expire after 2022
Highlights
Stable Long-Term Lease Structure
(1)
(1) Does not include single tenant triple-net leases or transitional properties
as their lease maturities vary. 0.7%
0.0%
0.0%
2.2%
0.0%
5.1%
3.3%
4.6%
0.0%
1.0%
0.0%
1.5%
9.1%
72.3%
2014
2015
2016
2017
2018
2019
2020
2021
2022
2023
2024
2025
2026
2027+ |
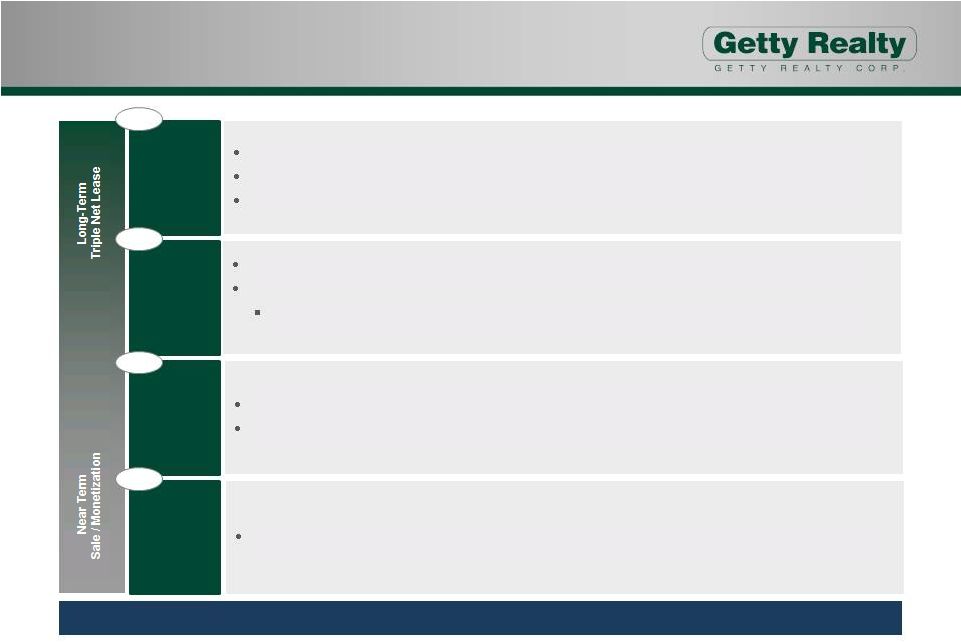 Incremental Upside in Transitional Properties
6
Proactive portfolio repositioning presents an opportunity to improve the cash flow
profile Near-Term
Lease
Expirations
Restructuring of original unitary lease entered into in May 2012
Ten locations are entangled in an ongoing eviction action in CT Supreme Court
Expect to enter into a restructuring of the NECG Lease at the conclusion of the
pending litigation NECG
Lease
Sites to
be Leased
Sites to
be Sold
83
25
31
7
Composed primarily of operating gas stations
Properties being re-let to national and regional fuel distributors
Locations
will
be
added
to
existing
leases
or
Company
will
enter
into
new
triple-net
leases
with
regional
distributors
75% of locations either under contract or have accepted offers
Remaining properties in multi-layer disposition process
Sites not leased on a triple-net basis with lease expirations over the next six
to eighteen months |
 Poised to Consolidate Fragmented Industry
7
More than 150,000 properties in the sector
(1)
Portfolio
dispositions
–
distributors,
MLP’s,
families
Consolidating
sector
–
approximately
60%
of
U.S.
stations individually owned
(1)
Debt
maturities
–
conduits,
majors,
banks
Little institutional capital
Mature, infill locations
Wide variety of formats
Convenience stores, repair bays, quick serve, quick
lube, etc.
Focus on fuel component to drive customer visits /
visibility
Gasoline, Diesel, Ethanol, CNG, LNG, other
Proven ability to source off-market
transactions not seen by others
Ability to integrate and assimilate
multi-unit portfolios
Capacity to operate in a
highly regulated industry
Established track-record of managing and
remediating environmental concerns
Actively seeking portfolio acquisitions through competitively priced and
innovatively structured capital allocation
Target Investments
Broad Market Opportunity
The Getty Competitive Advantage
(1)
Per NACS 2013 Retail Fuels Report. |
 Flexible Balance Sheet with Low Leverage
8
$175 million senior secured credit facility
Matures in 2015 (plus one year option)
L+ 250-300 bps
No amortization requirements
$100 million secured debt private placement
Matures in 2021
Fixed rate: 6%
No amortization requirements
Debt / EBITDA
(2)
Leverage / Total Market Capitalization
(2)
Debt Maturity Schedule
(1)
Debt Refinancing in February 2013
(1)
Low leverage and flexible balance sheet compared to REIT peers
(1)
Amounts outstanding are as of March 31, 2014. For additional information
regarding the Company’s financing agreements, see the Company’s Annual Report on Form 10-K for the year ended
December 31, 2013.
(2)
Source: Wall Street research report dated May 27, 2014.
$43.0
$100.0
2014
2015
2016
2017
2018
2020
2021
7.7x
6.1x
6.0x
5.9x
5.6x
4.8x
4.3x
3.1x
SRC
ARCP
WPC
LXP
O
EPR
NNN
GTY
53.1%
47.5%
44.6%
39.0%
35.0%
33.6%
32.6%
19.6%
ARCP
SRC
LXP
EPR
O
NNN
WPC
GTY |
 Investment Highlights
9
1
National portfolio with focus on growing and densely populated,
high barrier to entry markets
2
Stable cash flows supported by long-term, triple-net leases
3
4
Proven platform to pursue internal and external growth
opportunities in a consolidating sector
5
At a positive inflection point in the Company’s evolution
6
Flexible balance sheet with low leverage
Upside opportunities created through rationalization of
transitional properties in existing portfolio |