Attached files
| file | filename |
|---|---|
| 8-K - 8-K - ILG, LLC | a14-14462_18k.htm |
Exhibit 99.1
|
|
Investor Presentation JUNE 2014 |
|
|
2 Safe Harbor Statement This presentation may contain “forward-looking statements” within the meaning of the Private Securities Litigation Reform Act of 1995. These forward-looking statements include statements relating to the anticipated financial performance, business prospects, new developments, and similar matters of/relating to Interval Leisure Group, Inc. (“ILG”), and/or statements that use words such as “anticipates,” “estimates,” “expects,” “intends,” “plans,” “believes,” and similar expressions. These forward-looking statements are based on management’s current expectations and assumptions, which are inherently subject to uncertainties, risks, and changes in circumstances that are difficult to predict. Actual results could differ materially from those contained in the forward-looking statements included herein for a variety of reasons, including, among others: adverse trends in economic conditions generally or in the vacation ownership, vacation rental, and travel industries; adverse changes to, or interruptions in, relationships with third parties; lack of available financing for, or insolvency or consolidation of developers; decreased demand from prospective purchasers of vacation interests; travel-related health concerns; changes in our senior management; regulatory changes; our ability to compete effectively and successfully introduce new products and services; our ability to successfully manage and integrate acquisitions, impairments of assets, the restrictive covenants in our revolving credit facility, adverse trends in key vacation destinations; business interruptions in connection with our technology systems; ability of managed homeowners’ associations to collect sufficient maintenance fees; third parties not repaying loans or extensions of credit; failure to consummate a previously announced transaction; and our ability to expand successfully in international markets and manage risks related to international operations. Certain of these and other risks and uncertainties are discussed in ILG’s filings with the Securities and Exchange Commission, including in its reports on Form 10-K and Form 10-Q. Other unknown or unpredictable factors also could have a material adverse effect on ILG’s business, financial condition, and results of operations. In light of these risks and uncertainties, these forward-looking statements may not occur. Accordingly, you should not place undue reliance on these forward-looking statements, which only reflect the views of ILG management as of the date of this presentation. ILG does not undertake to update these forward-looking statements. The “Hyatt Residence Club” and “Hyatt Residential Group” trademarks are owned by Hyatt and are being used under license. |
|
|
3 Today’s Discussion Who We Are Strategic Initiatives Financials Investment Case Valuation Business Segments |
|
|
4 ILG: Who We Are Property management Rentals: Hotel & Resorts / Condos / Timeshare Condominium and Timeshare Home Owners’ Associations Membership & Exchange Management & Rentals Timeshare exchange Membership services Developer services |
|
|
5 ILG: Major Milestones and Ownership Over 35 Years 2008, ILG becomes standalone publicly-traded company 1976, ILG (1) is founded in Miami, Florida 1980, First international office is established in Paris 1995, Interval launches interactive website Note: (1) ILG, as used above before 2008, references predecessor companies of ILG 1987, Interval launches the industry’s first membership upgrade program 1990, Marriott affiliates its resort system with Interval’s exchange network 1994, Hyatt affiliates its vacation club with Interval 1991, Westgate Resorts affiliates with Interval 2000, Accor affiliates its Australian multi-resort vacation club with Interval 2007, Interval expands relationship with Accor to Asia 1999, Interval membership reaches record one-millionth consumer 2007, ILG acquires Aston (RQH) Founders LeagueStar PLC Willis Stein & Investment Group CUC IAC ILG 1976 1988 1997 2002 2008 1992 2010, ILG acquires TPI 2013 2012, ILG acquires VRI 2000, Starwood affiliates its multi-site vacation club with Interval 2013, VRI Europe joint venture 2013, acquires Aqua 2014 2014 Announces agreement to acquire Hyatt Residential Group Shared Ownership |
|
|
6 ILG: Operating Philosophy Focused on: Providing services to the Hospitality and Leisure Industry Delivering the best possible customer experience Emphasizing quality vacation destinations Majority of revenue derived from fee-for-service businesses Responsible allocation of capital Creating shareholder value |
|
|
7 Business Segments: Membership and Exchange |
|
|
8 M&E: The Vacation Ownership Experience Most people learn about timesharing by attending a resort tour sponsored by a developer. The salesperson explains the benefits of vacation ownership. Buyers can lock in the purchase price of the accommodations for a lifetime of vacations. It’s a fun and flexible way to enjoy home-like accommodations, premium amenities, and appealing destinations across the country and around the world. Membership in an exchange network provides flexibility, enriches the timeshare owner’s experience and reinforces satisfaction in the purchase decision. |
|
|
9 2013 U.S. Industry Metrics Sales Volume ($Bn) $7.6 Number of Vacation Ownership Intervals Sold 370,610 Intervals Owned 8.5 million Number of Resorts Number of Units excluding lock-offs Number of Units including lock-offs 1,540 192,420 243,760 Vacation Ownership: Market Highlights Source: State of the Vacation Timeshare Industry: United States Study, 2014 Edition, ARDA Industry Health: Year 2013 sales volume totaled $7.6 billion, increasing by 11% from 2012. Average occupancy was 77% in 2013. By comparison, hotel occupancy was 62% in 2013, according to Smith Travel Research. The number of intervals sold increased by 1% in 2013. |
|
|
10 M&E: Interval International Interval International offers exchange privileges that allow members to vacation at a different resort from their home property, or at a different time period. In addition to exchange, Interval International has developed a portfolio of value-added benefits, including: Getaways – affordable one-week resort stays Travel agency services Members-only publications Discounted shopping at IntervalWorld.com |
|
|
11 Interval International: Compelling Value Proposition Sources: Company Management Financial Performance of the U.S. Timeshare Industry, 2013 Edition, ARDA Shared Vacation Ownership Owners Report, 2012 Edition, ARDA Notes: (1) Excludes any exchange membership enrollment fees (2) Assumes weighted average price of U.S. timeshare week of $23,996 in 2012 and basic 1-year membership at point-of-sale ($69) Vacation Ownership Member Resort Developer HOA Interval’s exchange business provides programs and services designed to complement resort developer clients Product Cost Sales Commi-ssions Marketing Costs (1) G&A Uncollectible Sales Interval Member-ship(2) Pre-Tax Margin Total % of Originated Sales Value (U.S. 2012) HOA & Other |
|
|
12 Interval International: Exchange and Getaway Exchange Pool Inventory Getaway Pool Inventory Exchange Overflow Purchased Space Developer Bulk Deposits Individual Member Deposits 2013 Exchanges 796,011 Getaways* 129,740 Total Confirmations 925,751 Exchange Propensity 43.8% Getaway Propensity 7.1% Total Confirmation Propensity 51.0% Exchange Propensity 43.8% Getaway Propensity 7.1% Sources: Company Management. Data as of 12/31/2013 * Getaway transactions include approximately 3% of other Interval Network transactions characterized as special exchanges, including cruise exchanges |
|
|
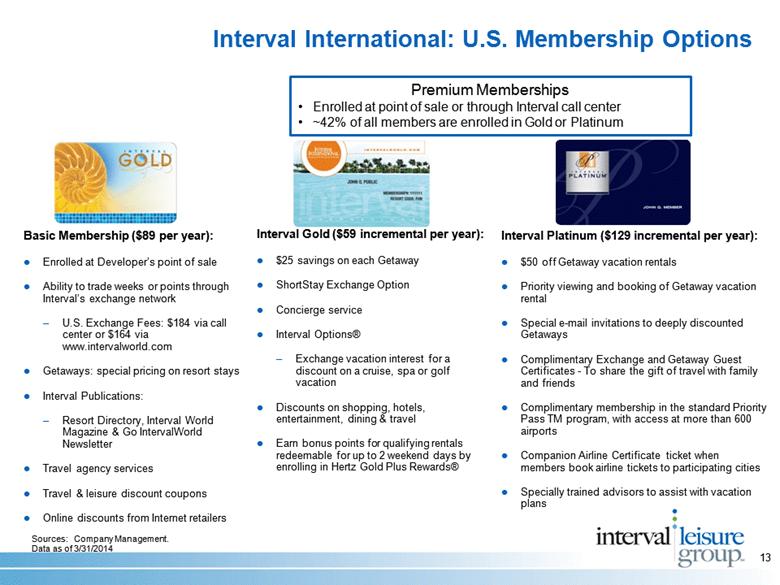
13 Interval International: U.S. Membership Options Basic Membership ($89 per year): Enrolled at Developer’s point of sale Ability to trade weeks or points through Interval’s exchange network U.S. Exchange Fees: $184 via call center or $164 via www.intervalworld.com Getaways: special pricing on resort stays Interval Publications: Resort Directory, Interval World Magazine & Go IntervalWorld Newsletter Travel agency services Travel & leisure discount coupons Online discounts from Internet retailers Interval Gold ($59 incremental per year): $25 savings on each Getaway ShortStay Exchange Option Concierge service Interval Options® Exchange vacation interest for a discount on a cruise, spa or golf vacation Discounts on shopping, hotels, entertainment, dining & travel Earn bonus points for qualifying rentals redeemable for up to 2 weekend days by enrolling in Hertz Gold Plus Rewards® Interval Platinum ($129 incremental per year): $50 off Getaway vacation rentals Priority viewing and booking of Getaway vacation rental Special e-mail invitations to deeply discounted Getaways Complimentary Exchange and Getaway Guest Certificates - To share the gift of travel with family and friends Complimentary membership in the standard Priority Pass TM program, with access at more than 600 airports Companion Airline Certificate ticket when members book airline tickets to participating cities Specially trained advisors to assist with vacation plans Premium Memberships Enrolled at point of sale or through Interval call center ~42% of all members are enrolled in Gold or Platinum Sources: Company Management. Data as of 3/31/2014 |
|
|
14 Shift in membership mix Note: (1) As of the end of each period (1) Interval International’s Clients |
|
|
15 Interval International’s Clients |
|
|
16 Interval International Summary A Leading Provider of Vacation Ownership Member Services Significant position in concentrated industry ~2 million members through various programs ~2,900 resorts in more than 80 nations participating in the Interval Network Offices in 16 countries worldwide Longstanding Relationships with Leading Resort Developers Strong relationships with quality-tier resort developers Independent and branded hospitality companies Top 30 new member generating affiliations have >7 year average contract term Premium Positioning Favorable membership demographics with ~ 90% retention rate Exclusive point of sale affiliation agreements with resort developers High quality vacation accommodations in premier leisure destinations Robust Business Model Sources: Company Management, as of 5/31/2014 Meaningful value proposition Low cap-ex, negative working capital Financial stability Fee-for-service, recurring revenue Healthy margins |
|
|
17 Business Segments: Management and Rental |
|
|
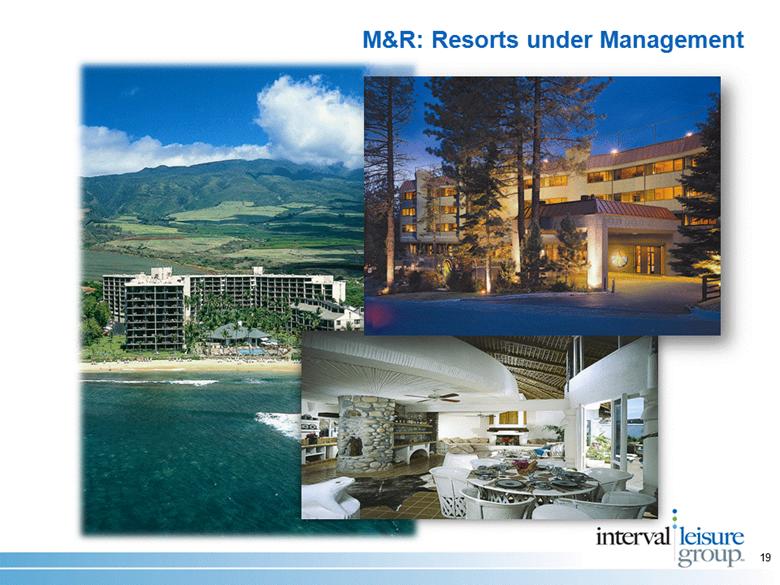
18 Management Aston & Aqua Unique balance of value and amenities Sales, marketing & revenue management Resorts under management: 55 VRI Europe, VRI & Trading Places Timeshare Home Owners’ Associations Shared ownership properties Resorts under management: 180 Vacation Rentals Hotel style service option Accounting services Purchasing support Interior decoration and renovation service Management and Rental |
|
|
19 M&R: Resorts under Management |
|
|
20 Strategic Initiatives |
|
|
21 ILG: Strategic Initiatives INITIATIVE: Grow Revenue, EBITDA, and Cash Flow Tactic: Invest in internal opportunities Tactic: Expand capabilities through strategic acquisitions INITIATIVE: Strategic Diversification Tactic: Acquire broad footprint in non-traditional lodging with a focus on shared ownership Tactic: Add proprietary branded club system including management, development, financing, sales and marketing INITIATIVE: Optimize Organizational Structure Tactic: Evaluate and implement efficiencies Drive long-term growth from a diverse foundation GOALS |
|
|
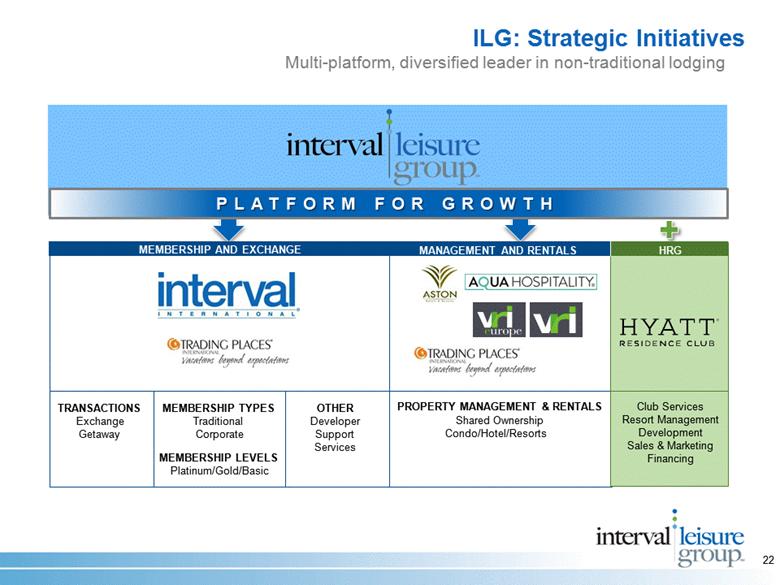
MEMBERSHIP TYPES Traditional Corporate MEMBERSHIP LEVELS Platinum/Gold/Basic 22 ILG: Strategic Initiatives Multi-platform, diversified leader in non-traditional lodging TRANSACTIONS Exchange Getaway MEMBERSHIP AND EXCHANGE PLATFORM FOR GROWTH MANAGEMENT AND RENTALS HRG PROPERTY MANAGEMENT & RENTALS Shared Ownership Condo/Hotel/Resorts Club Services Resort Management Development Sales & Marketing Financing OTHER Developer Support Services |
|
|
23 ILG: Strategic Initiatives Create an opportunity greater than the sum of its parts Development & Financing Sales & Marketing Property Management & Rentals Club Services & Management Exchange Developer Support Services THE VACATION SYSTEM |
|
|
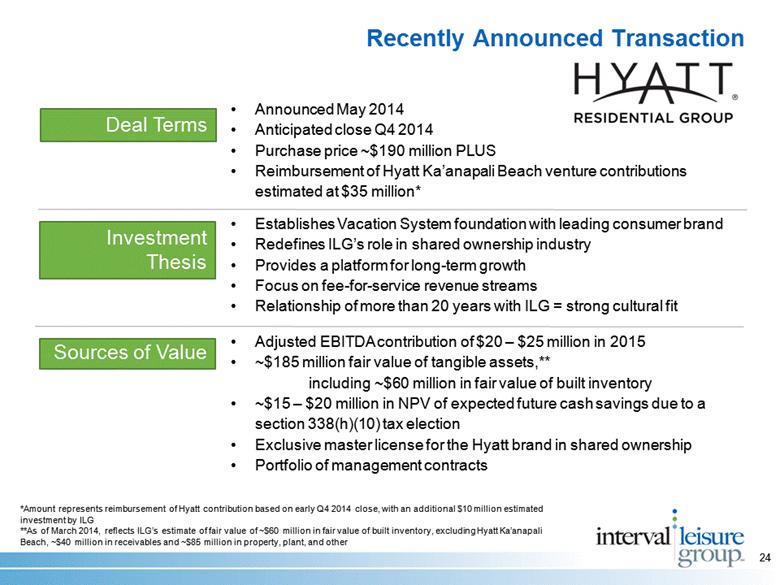
24 Announced May 2014 Anticipated close Q4 2014 Purchase price ~$190 million PLUS Reimbursement of Hyatt Ka’anapali Beach venture contributions estimated at $35 million* Recently Announced Transaction Establishes Vacation System foundation with leading consumer brand Redefines ILG’s role in shared ownership industry Provides a platform for long-term growth Focus on fee-for-service revenue streams Relationship of more than 20 years with ILG = strong cultural fit Benefit Deal Terms Investment Thesis Sources of Value Adjusted EBITDA contribution of $20 – $25 million in 2015 ~$185 million fair value of tangible assets,** including ~$60 million in fair value of built inventory ~$15 – $20 million in NPV of expected future cash savings due to a section 338(h)(10) tax election Exclusive master license for the Hyatt brand in shared ownership Portfolio of management contracts *Amount represents reimbursement of Hyatt contribution based on early Q4 2014 close, with an additional $10 million estimated investment by ILG **As of March 2014, reflects ILG’s estimate of fair value of ~$60 million in fair value of built inventory, excluding Hyatt Ka’anapali Beach, ~$40 million in receivables and ~$85 million in property, plant, and other |
|
|
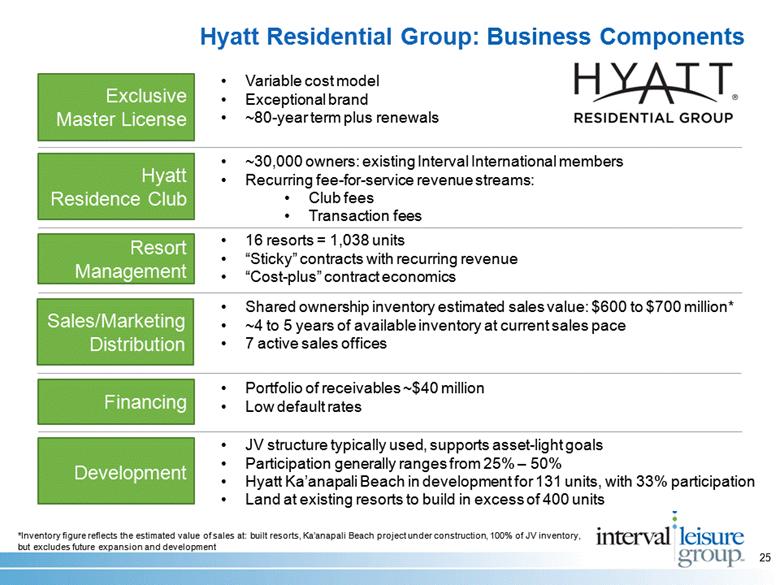
25 Hyatt Residence Club Sales/Marketing Distribution Development Variable cost model Exceptional brand ~80-year term plus renewals ~30,000 owners: existing Interval International members Recurring fee-for-service revenue streams: Club fees Transaction fees Shared ownership inventory estimated sales value: $600 to $700 million* ~4 to 5 years of available inventory at current sales pace 7 active sales offices 16 resorts = 1,038 units “Sticky” contracts with recurring revenue “Cost-plus” contract economics Exclusive Master License Financing Resort Management JV structure typically used, supports asset-light goals Participation generally ranges from 25% – 50% Hyatt Ka’anapali Beach in development for 131 units, with 33% participation Land at existing resorts to build in excess of 400 units Portfolio of receivables ~$40 million Low default rates Hyatt Residential Group: Business Components *Inventory figure reflects the estimated value of sales at: built resorts, Ka’anapali Beach project under construction, 100% of JV inventory, but excludes future expansion and development |
|
|
EXCLUSIVE MASTER LICENSE: Royalty-Fee Structure 26 Hyatt Residential Group: Business Components More than 40% of adjusted EBITDA is derived from recurring revenue ~24% ~17% ~33% ~26% % of applicable revenue VOI sales Club fees Rentals on Hyatt reservation system Resort management fees 1.5% 3.0% 5.0% 9.0% |
|
|
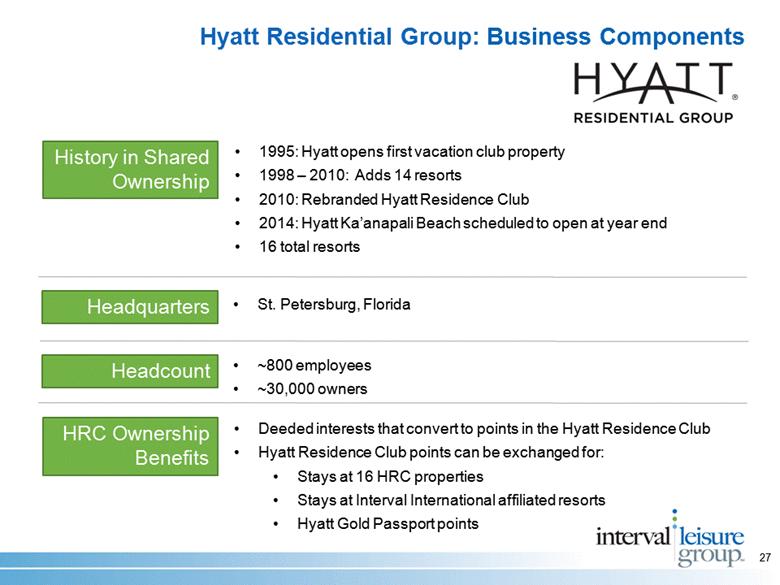
27 1995: Hyatt opens first vacation club property 1998 – 2010: Adds 14 resorts 2010: Rebranded Hyatt Residence Club 2014: Hyatt Ka’anapali Beach scheduled to open at year end 16 total resorts Hyatt Residential Group: Business Components Insert HRC ownership benefits History in Shared Ownership Headquarters Headcount HRC Ownership Benefits St. Petersburg, Florida ~800 employees ~30,000 owners Deeded interests that convert to points in the Hyatt Residence Club Hyatt Residence Club points can be exchanged for: Stays at 16 HRC properties Stays at Interval International affiliated resorts Hyatt Gold Passport points |
|
|
1 1 1 1 1 28 Hyatt Residence Club HYATT SUNSET HARBOR RESORT Key West, Florida 16 RESORTS HYATT PIÑON POINTE Sedona, Arizona 3 2 2 1 1 1 HIGHLANDS INN, A HYATT RESIDENCE CLUB RESORT Carmel, California HYATT KA’ANAPALI BEACH Maui, Hawaii 1 Arizona, California, Colorado, Florida, Hawaii, Puerto Rico, Texas HYATT COCONUT PLANTATION RESORT Bonita Springs, Florida HYATT GRAND ASPEN Aspen, Colorado |
|
|
29 ILG + HRG = Long-term Platform For Growth Add resorts to the system through joint ventures and tuck-in acquisitions, leading to fee-for-service revenue related to sales, marketing, and management services Expanded exchange and management opportunities Leverage Hyatt Residential Group sales and marketing expertise to recycle inventory through secondary sales |
|
|
30 Recent Transaction: VRI Europe Price: US ~$95 million 75.5% of joint-venture equity Closed November 2013 30 A track record of strategic and disciplined expansion Deal Terms Investment Thesis Expand fee-for-service business Broadening footprint internationally Added 21 resorts under management Capital Allocation Use of tax-trapped cash EBITDA accretive |
|
|
31 Recent Transaction: Aqua Hospitality Price: ~$38 million Closed December 2013 Deal Terms Investment Thesis Expand fee-for-service business Highly desirable destination Synergies with Aston Hotels & Resorts Doubled available room nights Capital Allocation Increase profitability by reducing costs across combined entity Portfolio of properties complements existing offerings EBITDA accretive A track record of strategic and disciplined expansion |
|
|
32 Financials |
|
|
Operating Metrics 33 Source: Company management Notes: (1) Refer to definitions contained in the Glossary of Terms Revenue and active members in millions Available room nights in thousands (2) RevPAR for Q4-2013 and Q1-2014 includes the contributions from Aqua Hospitality subsequent to our acquisition Standalone Aston RevPAR for Q4-2013 was $122.10 and for Q1-2014 was $167.89 (2) FY FY FY 1Q 2Q 3Q 4Q FY 1Q Key Metrics (1) Consolidated Revenue $ 409.4 $ 428.8 $ 473.3 $ 134.9 $ 125.0 $ 119.2 $ 122.2 $ 501.2 $ 157.0 Membership and Exchange Total Membership & Exchange Revenue $ 345.2 $ 349.4 $ 357.7 $ 102.1 $ 95.5 $ 86.6 $ 80.8 $ 365.0 $ 95.3 Transaction-Fee Revenue $ 191.0 $ 192.3 $ 198.4 $ 61.1 $ 50.2 $ 46.0 $ 41.6 $ 198.9 $ 56.1 Membership-Fee Revenue $ 129.8 $ 129.5 $ 130.8 $ 33.4 $ 36.8 $ 32.3 $ 32.7 $ 135.2 $ 31.8 Total Active Members 1.80 1.78 1.82 1.83 1.82 1.82 1.82 1.82 1.82 Average Revenue per Member $ 181.36 $ 182.71 $ 182.39 $ 52.79 $ 48.59 $ 44.06 $ 41.65 $ 187.13 $ 49.30 Management and Rental Total Management & Rental Revenue $ 64.2 $ 79.4 $ 115.6 $ 32.8 $ 29.5 $ 32.5 $ 41.4 $ 136.2 $ 61.7 Available Room Nights 1,613 1,537 1,497 349 364 381 442 1,537 736 RevPAR $ 95.79 $ 111.43 $ 130.28 $ 166.39 $ 129.17 $ 145.53 $ 119.48 $ 138.90 $ 141.45 Year-to-Year Change Consolidated Revenue 1.1% 4.7% 10.4% 6.4% 5.3% 1.7% 10.3% 5.9% 16.4% Membership and Exchange Total Membership & Exchange Revenue (0.2%) 1.2% 2.4% 1.2% 6.5% 0.6% (0.3%) 2.0% (6.6%) Transaction-Fee Revenue 0.6% 0.7% 3.2% 0.0% 2.2% (1.2%) (0.1%) 0.3% (8.2%) Membership-Fee Revenue (1.7%) (0.3%) 1.0% 2.3% 13.2% (0.7%) (1.2%) 3.4% (4.6%) Total Active Members (1.8%) (1.3%) 2.4% (0.6%) (2.1%) (2.2%) (0.6%) (0.6%) (0.5%) Average Revenue per Member 3.3% 0.7% (0.2%) 0.9% 7.7% 1.2% 0.8% 2.6% (6.6%) Management and Rental Total Management & Rental Revenue 8.8% 23.6% 45.7% 26.9% 1.8% 4.6% 39.3% 17.8% 88.2% Available Room Nights 2.0% (4.7%) (2.6%) (5.4%) (3.2%) 0.0% 19.1% 2.7% 110.9% RevPAR 4.7% 16.3% 16.9% 15.7% 9.9% 8.2% (4.9%) 6.6% (15.0%) 2010 2011 2012 2013 2014 |
|
|
34 First Quarter 2014 Financial Performance Notes: (1) As of April 8, 2014, maximum is 3.50x (2) As of April 8, 2014, minimum is 3.00x Q1 2013 Q1 2014 Change CONSOLIDATED REVENUE $134.9 $157.0 16.4% Membership and Exchange 102.1 95.3 (6.6%) Management and Rental 32.8 61.7 88.2% CONSOLIDATED ADJUSTED EBITDA $51.8 $50.3 (2.9%) Membership and Exchange 45.8 38.5 (15.9%) Management and Rental 6.0 11.8 97.6% SELECTED DATA AS OF MARCH 31 2013 2014 Cash $132.5 $64.9 $240.0 $248.0 Consolidated Total Leverage Ratio (1) 1.35x 1.27x Consolidated Interest Coverage Ratio (2) 9.95x 32.56x ($MM) Debt |
|
|
35 2013 Financial Performance Notes: (1) As of December 31, 2013, maximum is 3.50x (2) As of December 31, 2013, minimum is 3.00x FY2012 FY2013 Change CONSOLIDATED REVENUE $473.3 $501.2 5.9% Membership and Exchange 357.7 365.0 2.0% Management and Rental 115.6 136.2 17.8% CONSOLIDATED ADJUSTED EBITDA $157.1 $166.2 5.8% Membership and Exchange 142.7 146.9 3.0% Management and Rental 14.4 19.3 34.2% SELECTED DATA AS OF DECEMBER 31 2012 2013 Cash $101.2 $48.5 Debt $260.0 $253.0 Consolidated Total Leverage Ratio (1) 1.51x 1.25x Consolidated Interest Coverage Ratio (2) 6.97x 31.37x ($MM) |
|
|
6 36 2009 – 2013 CAGR 5.5% Source: Company management Notes: (1) Refer to non–GAAP reconciliation in the Glossary of Terms (2) Free cash flow calculated as net cash provided by operating activities less CapEx; refer to the Glossary of Terms ($MM) ($MM) CapEx ($MM) Free Cash Flow (2) ($MM) 2009 – 2013 CAGR 2.9% Revenue Adjusted EBITDA(1) Historical Financial Data 2009 2010 2011 2012 2013 |
|
|
37 Non–GAAP Reconciliation (Q1) ($MM) Membership and Exchange Management and Rental Consolidated Membership and Exchange Management and Rental Consolidated Adjusted EBITDA $45.8 $6.0 $51.8 $38.5 $11.8 $50.3 Non cash compensation expense (2.3) (0.3) (2.6) (2.6) (0.3) (2.8) Other non operating income (expense), net (0.3) (0.2) (0.5) - (0.2) (0.1) Acquisition-related and restructuring costs (0.2) (0.5) (0.8) (0.4) (0.9) (1.2) EBITDA 43.0 5.0 47.9 35.6 10.5 46.1 Amortization expense of intangibles (0.3) (1.7) (2.0) (0.3) (2.6) (3.0) Depreciation expense (3.3) (0.3) (3.7) (3.3) (0.5) (3.8) Less: net income attributable to noncontrolling interest - - - - 1.0 1.0 Less: other non operating income (expense), net 0.3 0.2 0.5 - 0.2 0.1 Operating income $39.7 $3.1 42.8 $31.9 $8.5 40.4 Interest income 0.2 - Interest expense (1.7) (1.3) . Other non operating expense, net (0.5) (0.1) Income tax provision (15.8) (14.3) Net income 25.0 24.7 Net income attributable to noncontrolling interest - (1.0) Net income attributable to common stockholders $25.0 $23.7 Three Months Ended March 31 2013 2014 |
|
|
38 Non-GAAP Reconciliation (Annual) (1) (2) (2) (2) (3) Notes: 1. As filed with the SEC in our 2011 Form 10-K, recast to include Acquisition Related and Restructuring Costs as per the definition of Adjusted EBITDA in the Glossary of Terms. 2. As filed with the SEC in our 2013 Form 10-K. $ 95.2 $ 65.4 $ 82.9 $ 75.0 $ 72.2 Free Cash Flow (14.7) (15.0) (13.0) (16.4) (15.2) Less: Capital Expenditures $ 109.9 $ 80.4 $ 95.9 $ 91.4 $ 87.3 Net cash provided by operating activities $ 81.2 $ 40.7 $ 41.1 $ 42.4 $ 37.8 Net income attributable to common stockholders (0.6) - - (0.0) (0.0) Net loss (income) attributable to noncontrolling interest 81.8 40.7 41.1 42.4 37.8 Net income (45.4) (24.3) (24.9) (26.5) (25.8) Income tax provision - (18.5) - - - Loss on extinguishment of debt 0.3 (2.5) 1.6 (0.3) (1.3) Other non-operating income (expense), net (6.2) (25.6) (35.6) (35.8) (37.3) Interest expense 0.4 1.8 1.3 0.4 1.0 Interest income 132.7 109.8 98.8 104.5 101.2 Operating income - 18.5 - - - Less: Loss on extinguishment of debt (0.3) 2.5 (1.6) 0.3 1.3 Less: Other non-operating income (expense), net 0.6 0.0 - (0.0) (0.0) Less: Net loss (income) attributable to noncontrolling interest (14.5) (13.4) (13.3) (10.5) (9.9) Depreciation expense (8.1) (23.0) (27.3) (26.4) (26.0) Amortization expense of intangibles 155.1 125.3 140.9 141.1 135.8 EBITDA - (18.5) - - - Loss on extinguishment of debt - - - - - Goodwill impairment (4.5) 0.1 (1.4) (0.9) (0.6) Acquisition related and restructuring costs 3.5 - - - - Prior period item 0.3 (2.5) 1.6 (0.3) (1.3) Other non-operating income (expense), net (10.4) (10.9) (11.6) (10.1) (10.6) Non-cash compensation expense $ 166.2 $ 157.1 $ 152.3 $ 152.4 $ 148.2 Adjusted EBITDA 2013 2 2012 2 2011 2 2010 1 2009 1 ($MM) |
|
|
39 Investment Case |

|
|
40 Creating an innovative model in non-traditional lodging ILG: Investment Case Concentration on fee-for-service, cash-generative, and asset-light businesses UNIQUE, RESILIENT BUSINESS MODEL ~2 million members ~2,900 resorts in Interval Network Top-tier developer relationships ~250 resorts under management Global presence LEADING INDUSTRY POSITION STRONG BALANCE SHEET AND CASH FLOW Capital allocation priorities designed to drive shareholder value and cash generation STRATEGIC CAPITAL ALLOCATION More than 125 years of combined senior management experience with the company Demonstrated ability to perform through prior economic downturns HIGHLY EXPERIENCED MANAGEMENT TEAM Strong recurring revenue component Multi-faceted, diversified structure Low CapEx Healthy margins 2009 2010 2011 2012 2013 Net Debt/Adjusted EBITDA 1.59x 1.16x 0.95x 1.01x 1.23x Interest Expense Ratio 3.97x 4.26x 4.28x 6.13x 26.94x Return on Invested Capital 6.60% 7.30% 7.00% 2.30% 9.90% Return on Assets 3.90% 4.30% 4.20% 4.50% 7.90% Free Cash Flow (in $ Millions) $72.2 $75.0 $82.9 $65.4 $95.2 All terms are defined in the Glossary of Terms |
|
|
41 Valuation |
|
|
42 FY 2014E EV/EBITDA 8.2x 12.1x 8.0x 11.1x 13.0x FY 2015E EV/EBITDA 8.4x 10.9x 7.5x 10.4x 11.9x Source: Thomson ONE FirstCall mean EBITDA estimates; enterprise value calculated as of 05/23/14 Valuation: Peer Comparison Business Components IILG VAC DRII WYN HOT Exchange Membership Hotel Management Shared Ownership Management Shared Ownership Upper Upscale Brand Development Sales & Marketing Consumer Financing |
|
|
43 |

|
|
44 Glossary Of Terms Acquisition-related and restructuring costs: Represents transaction fees, costs incurred in connection with performing due diligence, subsequent adjustments to our initial estimate of contingent consideration obligations associated with business acquisitions, and other direct costs related to acquisition activities. Additionally, this item includes certain restructuring charges primarily related to workforce reductions and estimated costs of exiting contractual commitments. Adjusted EBITDA: EBITDA, excluding, if applicable: (1) non-cash compensation expense, (2) goodwill and asset impairments, (3) acquisition related and restructuring costs, (4) other non-operating income and expense (including loss on extinguishment of debt), and (5) the impact of correcting prior period items. The company’s presentation of adjusted EBITDA may not be comparable to similarly titled measures used by other companies. Ancillary member revenue: Other Interval Network member-related revenue including insurance and travel-related services. Available room nights: Number of nights available for rental by Aston and Aqua at managed vacation properties during the period, which excludes all rooms under renovation. Average revenue per member: Membership fee revenue, transaction revenue and ancillary member revenue for the Interval Network for the applicable period, divided by the monthly weighted average number of Interval Network active members during the applicable period. Consolidated interest coverage ratio: Calculated as consolidated EBITDA over consolidated interest expense, as defined in our amended credit agreement. Consolidated total leverage ratio: Calculated as consolidated debt, less credit given for a portion of foreign cash, over consolidated EBITDA, as defined in our amended credit agreement at such date. EBITDA: Net income attributable to common stockholders excluding, if applicable: (1) interest income and interest expense, (2) income taxes, (3) depreciation expense, and (4) amortization expense of intangibles. Free cash flow: Cash provided by operating activities less capital expenditures. |
|
|
45 Glossary Of Terms Gross lodging revenue: Total room revenue collected from all Aston- and Aqua-managed occupied rooms during the period. Aqua occupied rooms are included only from the acquisition date. Interest expense ratio: Calculated as interest expense, net of capitalized interest, over adjusted EBITDA Management fee and rental revenue: Represents revenue earned by our Management and Rental segment exclusive of pass-through revenue. Membership-fee revenue: Represents fees paid for membership in the Interval Network. Net debt/adjusted EBITDA: Calculated as total debt, less cash and cash equivalents, over adjusted EBITDA. Pass-through revenue: Represents the compensation and other employee-related costs directly associated with management of the properties and homeowners’ associations that are included in both revenue and cost of sales and that are passed on to the property owners and homeowners’ associations without mark-up. Management believes presenting gross margin without these expenses provides management and investors a relevant period-over-period comparison. Return on assets: Calculated as net income attributable to common stockholders over total assets. Return on invested capital: Calculated as net income attributable to common stockholders less cash dividends paid, over total debt plus total equity. RevPAR: Gross lodging revenue divided by available room nights during the period for Aston and Aqua. Total active members: Active members of the Interval Network as of the end of the period. Active members are members in good standing who have paid membership fees and any other applicable charges in full as of the end of the period, or are within the allowed grace period. Transaction revenue: Interval Network transactional and service fees paid primarily for exchanges, Getaways, and reservation servicing. |