Attached files
| file | filename |
|---|---|
| 8-K - 8-K - Approach Resources Inc | d729623d8k.htm |
 DUG PERMIAN BASIN
J. ROSS CRAFT
PRESIDENT & CHIEF EXECUTIVE OFFICER
Building Momentum: Multi-Bench and Pad
Development in the Southern Midland Basin
Exhibit 99.1 |
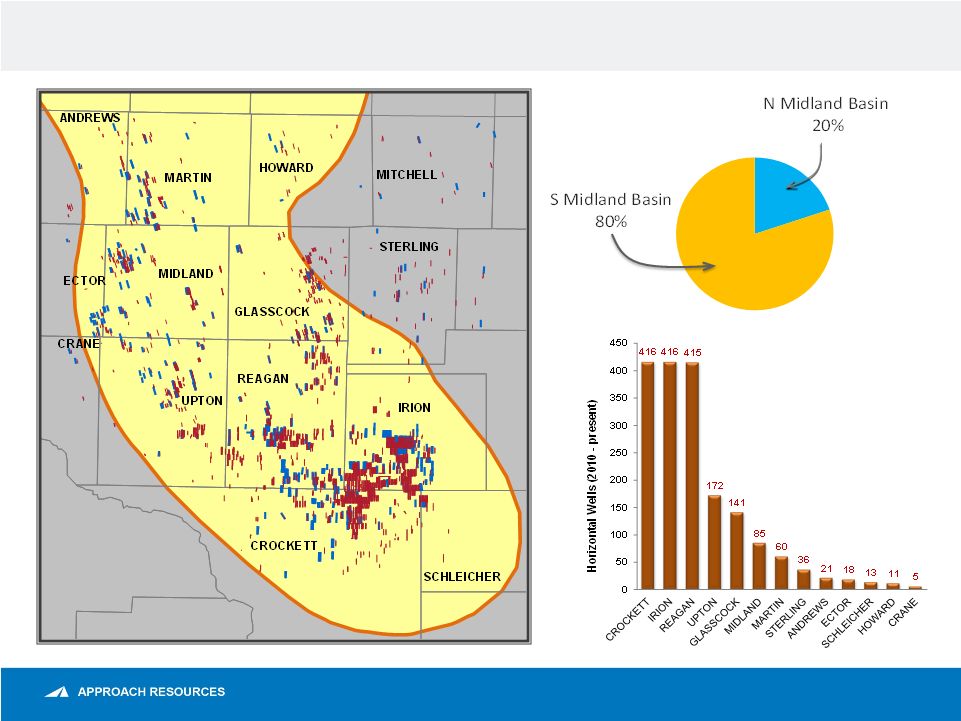 Wolfcamp oil shale play –
activity overview
2
N = 1,809
Note:
Data
sourced
from
company
news
releases/IR
presentations,
public
databases,
DrillingInfo
and
IHS. |
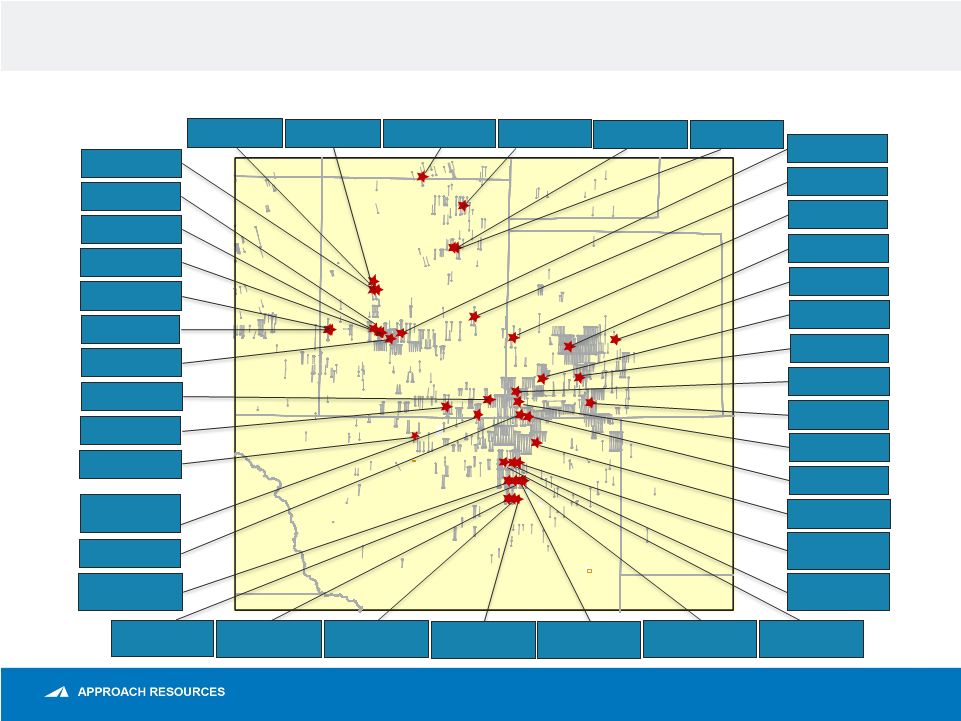 Wolfcamp oil shale play –
S Midland Basin
3
Ham 1801H
1,202 Boe/d (B)
Rocker B-N 74H
1,338 Boe/d (B)
University 2-20 12
3,176 Boe/d (B)
University 901H
1,561 Boe/d (B)
Rocker B 9H
1,022 Boe/d (B)
University 2-20 14
1,852 Boe/d (C)
University 1804H
1,803 Boe/d (C)
University 905H
1,302 Boe/d (B)
University 10-1 2H
1,311 Boe/d (B)
University 906H
1,277 Boe/d (A)
Scott Sugg 5051 1H
1,255 Boe/d (B)
Halcomb 3304H
1,037 Boe/d (B)
Munson 1005H
1,295 Boe/d (B)
Bennie 4342 2H
1,260 Boe/d (B)
Linthicum M 2H
1,294 Boe/d (B)
University 48-7 1H
1,448 Boe/d (C)
University 43 902H
1,256 Boe/d (B)
University 40-1309H
2,005 Boe/d (B)
University E 4108CH
1,021 Boe/d (B)
University 49 1H
1,561 Boe/d (B)
University 47-48
2301H
1,398 Boe/d (B)
Pangea West 6533HA
843 Boe/d (A)
University 45 803HB
1,044 Boe/d (B)
University 45 2216HB
1,042 Boe/d (B)
Baker B 207HB
1,003 Boe/d (B)
University 45 2304HB
1,111 Boe/d (B)
University 45 2302HB
1,136 Boe/d (B)
University 45 2301HB
1, 310 Boe/d (B)
University 45 905HA 1,027
Boe/d (A)
Baker B 256HB
1,334 Boe/d (B)
Clinch 4238 1H
1,260 Boe/d (A)
Lane Trust C/E 42 2HL
2,147 Boe/d (C)
Sugg C 271HU
1,112 Boe/d (C)
Sugg C 273HU
1,221 Boe/d (A)
Sugg A 143 4HU
1,904 Boe/d (A)
Ham 1825H
1,780 Boe/d (C)
Ham 1802H
1,338 Boe/d (B)
Wolfcamp HZ Oil Shale Play was discovered in the S Midland Basin
Well
IPs
range
from
several
hundred
Boe
to
>3,000
Boe/d
and
EURs
range
from
350
to
>750
MBoe
Note:
Data
sourced
from
company
news
releases/IR
presentations,
public
databases,
DrillingInfo
and
IHS.
Baker B 234 HC
970 Boe/d (C)
University 45 713HC
879 Boe/d (B)
University 43-22 H
1,192 Boe/d (B)
Reagan
Upton
Crockett
Sutton
Schleicher
Tom
Green
Sterling
Irion |
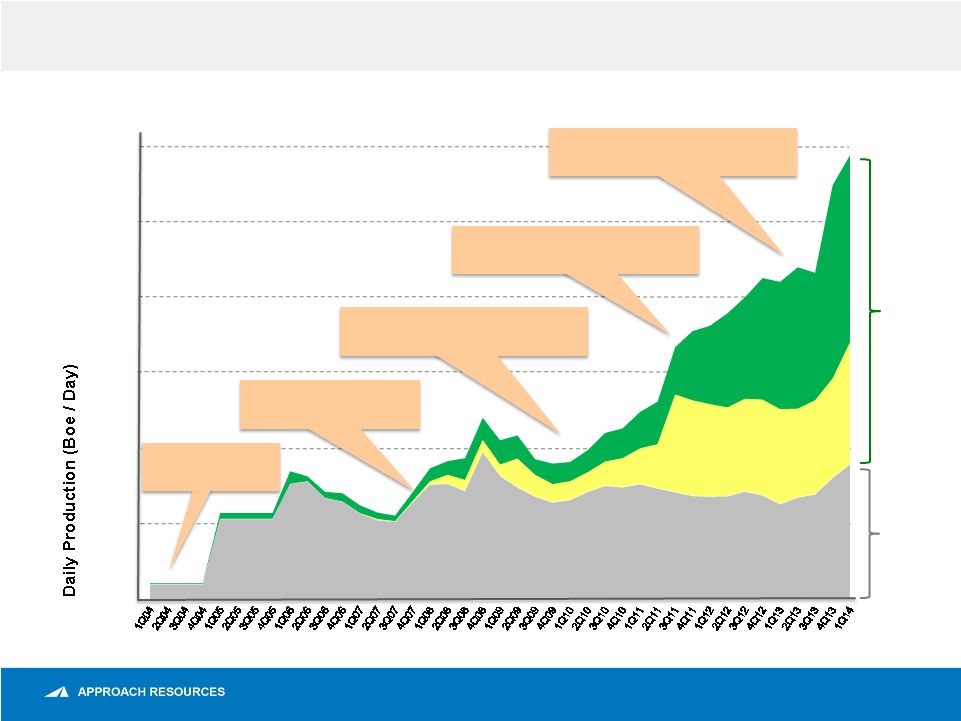 1
st
Producing
Asset
Beginning Large Scale Development of
Wolfcamp Oil Shale Play
Launching IPO
Announcing
Wolfcamp Oil Shale Discovery
Commercializing
Wolfcamp Oil Shale Discovery
Successful transition to an oil and liquids-rich Permian producer –
Approach’s story
4
Oil
NGL
Gas
0
2,000
4,000
6,000
8,000
10,000
12,000
30
%
70
% |
 Company overview
AREX OVERVIEW
ASSET OVERVIEW
Enterprise value $1.1 BN
High-quality reserve base
115 MMBoe proved reserves
$1.1 BN proved PV-10
99% Permian Basin
Permian core operating area
162,000 gross (144,000 net) acres
~1+ BnBoe gross, unrisked resource potential
~2,000+ Identified HZ drilling locations targeting
Wolfcamp A/B/C
2014 Capital program of $400 MM
Running 3 HZ rigs in the Wolfcamp shale play to drill
70 wells during 2014
Notes:
Proved
reserves
and
acreage
as
of
12/31/2013
and
3/31/2014,
respectively.
All
Boe
and
Mcfe
calculations
are
based
on
a
6
to
1
conversion
ratio.
Enterprise
value
is
equal
to
market
capitalization
using
the
closing
share
price
of
$20.70
per
share
on
5/2/2014,
plus
net
debt
as
of
3/31/2014.
See
“PV-10
(unaudited)”
slide.
5 |
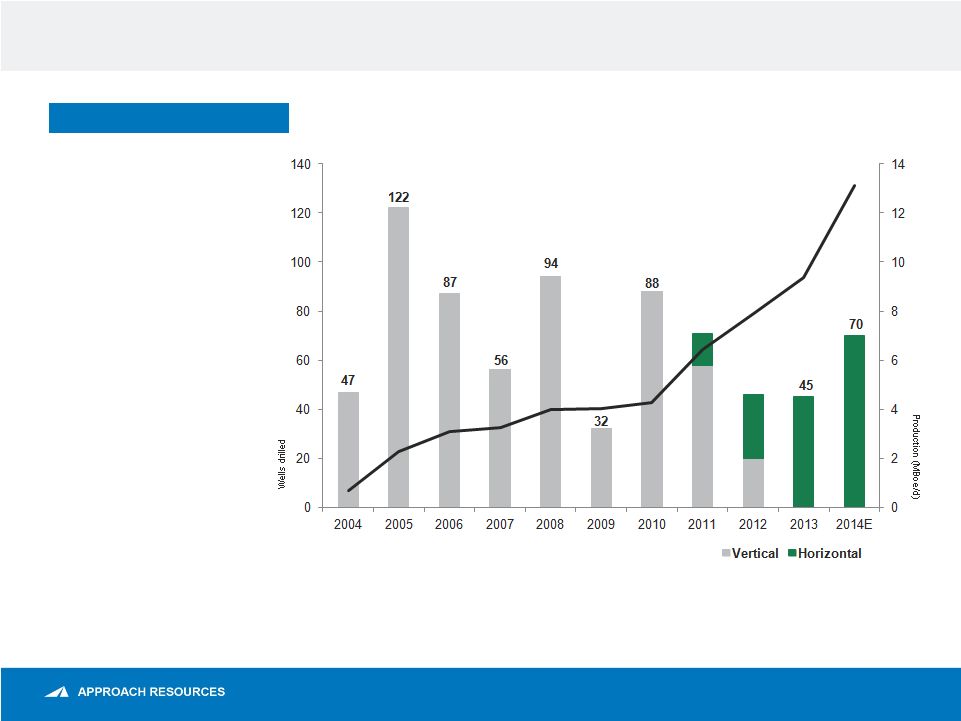 Long history of operating in Midland Basin
6
WELLS DRILLED TO DATE
•
Drilled more than 750 wells
in Midland Basin since
2004
•
One of the first-movers in
the HZ Wolfcamp play with
longest production history
and track record of full-
scale development
•
Well data, core data, 3-D
seismic and micro-seismic
reduces future
development risk
69
46 |
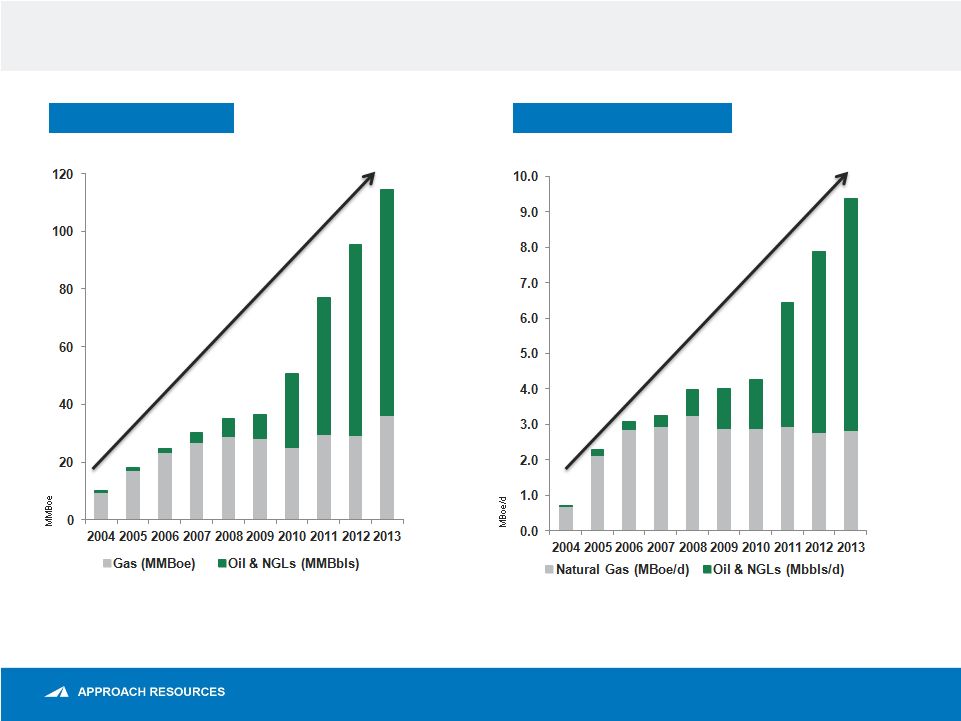 Strong track record of reserve and production growth
7
RESERVE GROWTH
CAGR 31%
PRODUCTION GROWTH
CAGR 34% |
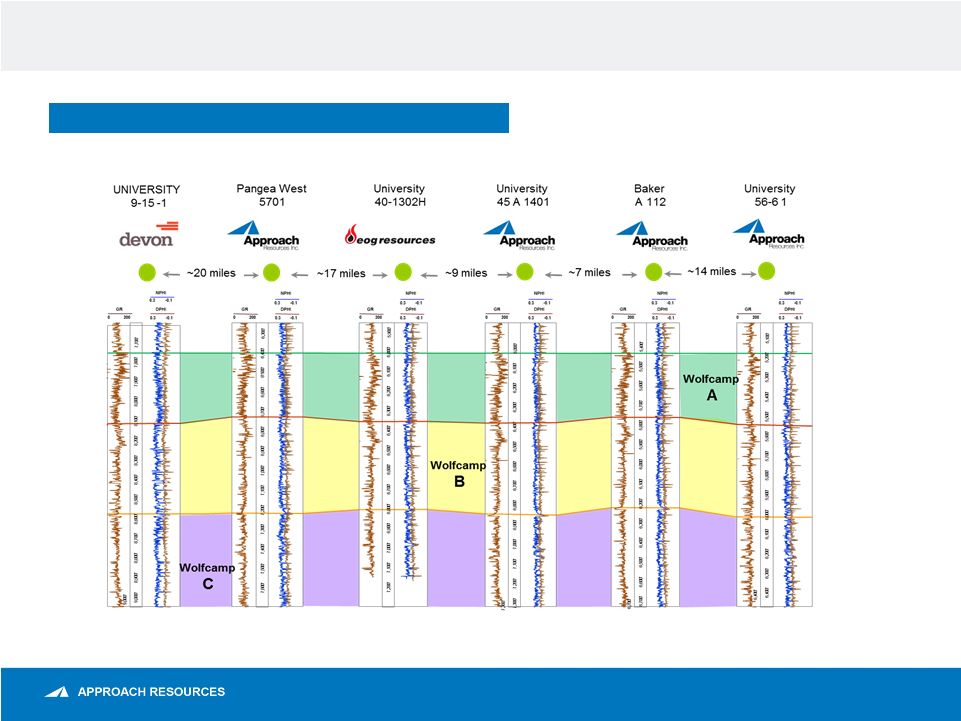 Wolfcamp shale oil play
8
WIDESPREAD, THICK, CONSISTENT & REPEATABLE |
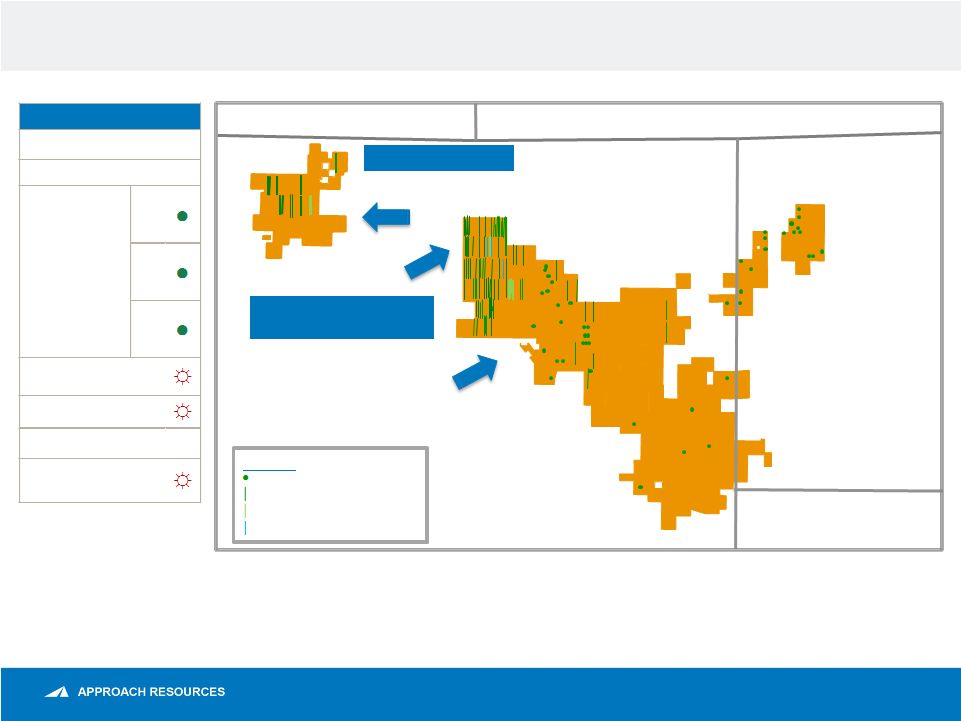 AREX Wolfcamp activity
9
Note: Acreage as of 3/31/2014.
STRATIGRAPHIC UNIT
Clearfork/Spraberry
Dean
Wolfcamp
A
B
C
Canyon
Strawn
Ellenburger
NORTH &
CENTRAL PANGEA
PANGEA WEST
•
1Q14 Activity included:
Stacked A/C completion
Schleicher
Crockett
Irion
Reagan
Sutton
•
1Q14 Activity included:
Stand-alone B-zone
completions and stacked B/C
completions in North &
Central Pangea
Legend
Vertical Producer
HZ Producer
HZ –
Waiting on Completion
HZ –
Drilling |
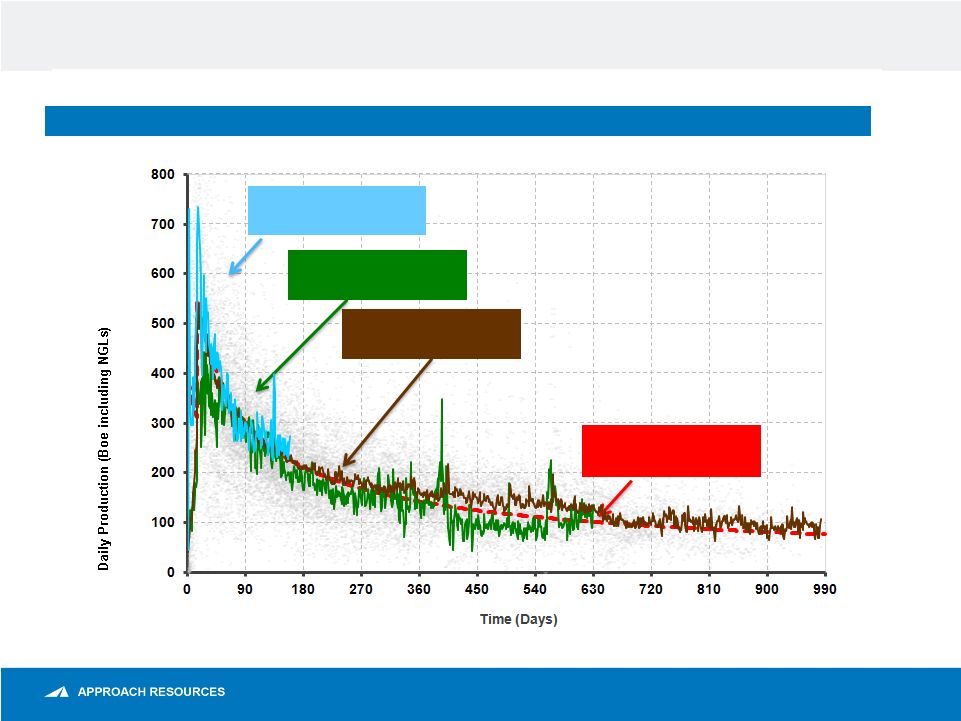 AREX HZ Wolfcamp well performance
10
AREX HZ WOLFCAMP (BOE/D)
Note: Daily production normalized for operational downtime.
Production Data from
AREX C Bench Wells (4)
Production Data from
AREX A Bench Wells (8)
Production Data from
AREX B Bench Wells (63)
450 MBoe Type Curve
Wolfcamp Shale Oil |
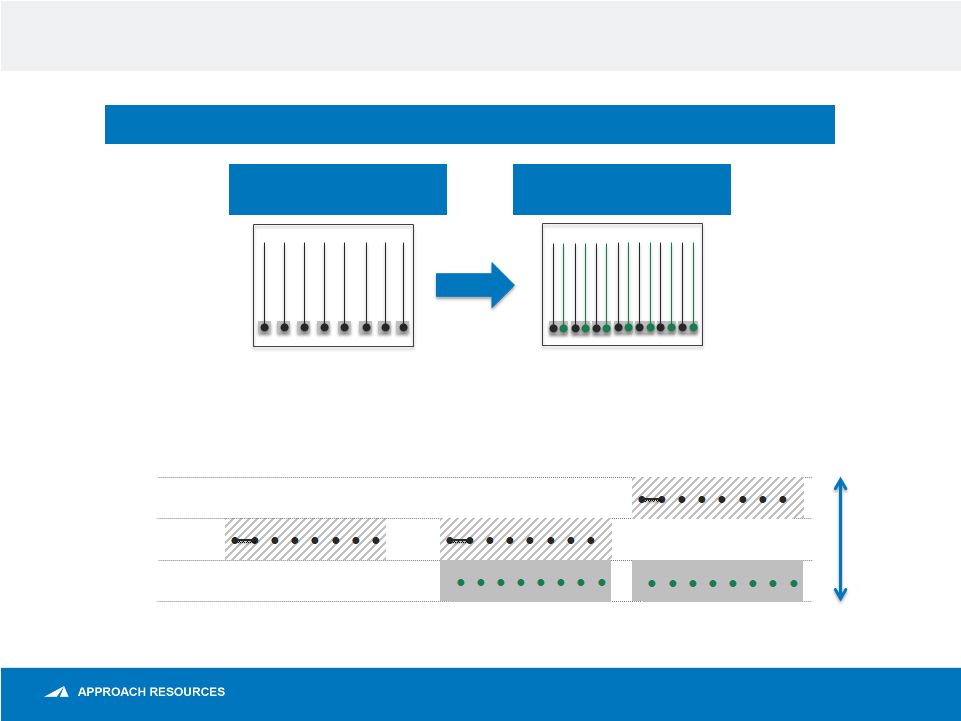 Efficiency-driven transition to two-bench pad development
11
•
Reduces time between spud to
first sales
•
7 to 8 wells per section
•
Reduces surface footprint
•
Reduces rig mobilization costs
•
Completion optimization from
zipper fracs and frac cost savings
•
14 to 16 wells per section
2011 –
2013: SINGLE-BENCH
DEVELOPMENT
CURRENT: TWO-BENCH
DEVELOPMENT
TRANSITION FROM SINGLE-BENCH TO TWO-BENCH DEVELOPMENT
660’
A
B
C
Map view
X-Section
view
~1200’
thick
660’
Note: Target zones in X-Section view are illustrative.
660’
OR |
 Evaluating water infrastructure
12
Key factors for Approach in determining to install large-scale water
infrastructure system:
Large, primarily contiguous acreage position
Delineation of Wolfcamp shale across acreage position and
transition to large-scale development phase
How efficiently can we source and transport water from A to B?
Responsible operatorship
Water infrastructure and equipment projects are key to large-scale
field development and to reducing D&C and LOE costs
|
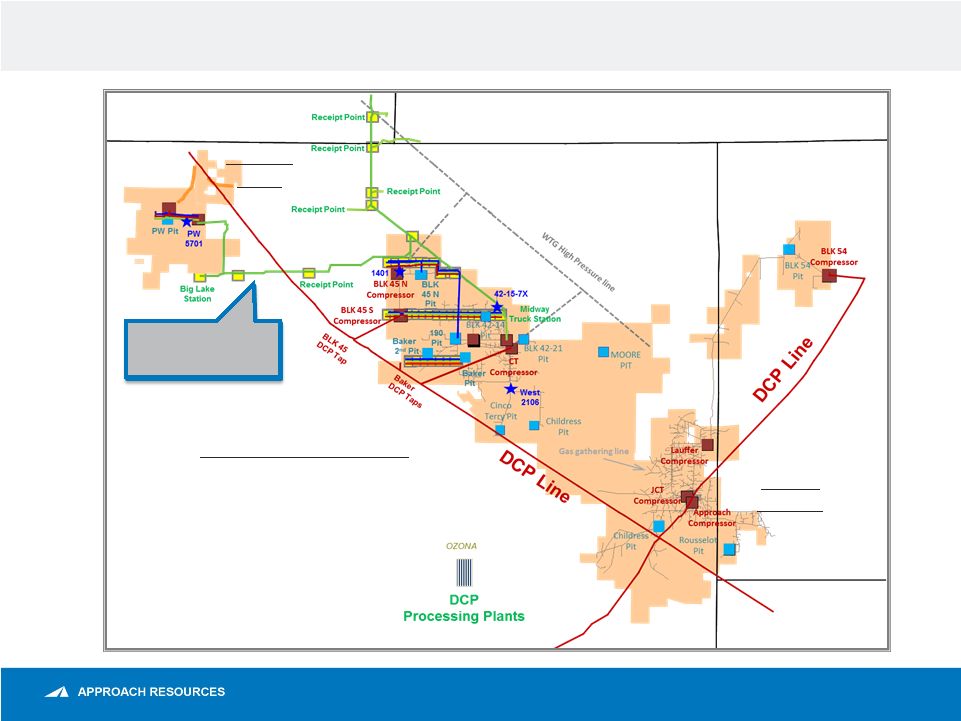 Infrastructure for large-scale development
13
•
Reducing D&C cost
•
Reducing LOE
•
Increasing project profit margin
•
Minimizing truck traffic and surface
disturbance
Pangea
West
North
&
Central
Pangea
South
Pangea
Schleicher
Crockett
Irion
Reagan
Sutton
50-Mile Oil Pipeline
100,000 Bbls/d
Capacity |
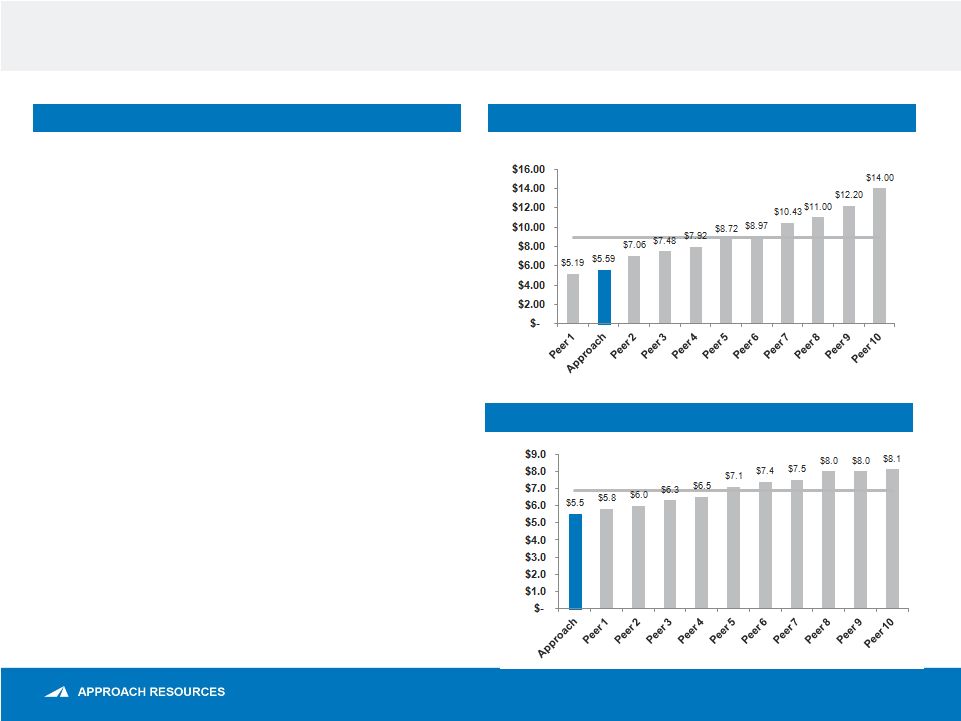 Low cost operator
14
Expect to drill ~20 to 24 HZ wells per rig in
2014 vs. prior estimate of 10 to 12 HZ
wells per rig
3 HZ rigs currently running in Project
Pangea / Pangea West
Recently drilled wells in 10 to 11 days
(~7,500’
lateral)
Compressing spud-to-sales times
Focusing activity around field infrastructure systems
COMPETITIVE LOE (FY13 LOE/Boe)
OPERATIONAL EFFICIENCY
BEST-IN-CLASS HZ D&C ($MM/Well)
Avg. $6.9 MM
Avg. $8.96/Boe
Note: Peers include APA, ATHL, CPE, DVN, FANG, EGN, EPE, LPI, PXD and RSPP.
Data sourced from SEC filings and company news releases/IR
presentations. |
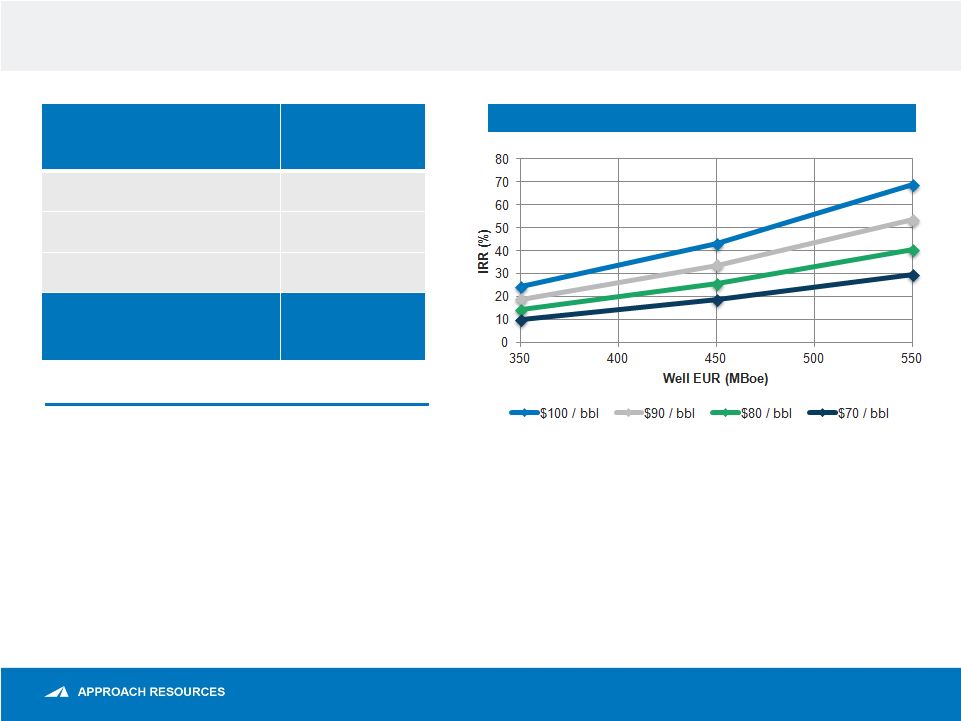 AREX HZ Wolfcamp economics
15
Notes: Identified locations based on multi-bench development and 120-acre
spacing for HZ Wolfcamp. No locations assigned to south
Project
Pangea.
HZ
Wolfcamp
economics
assume
NYMEX
–
Henry
Hub
strip
and
NGL
price
based
on
40%
of
WTI.
Play Type
Horizontal
Wolfcamp
Avg. EUR (gross)
450 MBoe
Targeted Well Cost
$5.5 MM
Potential Locations
~2,000
Gross Resource
Potential
~1 Bn
Boe
BTAX IRR SENSITIVITIES
•
Horizontal drilling improves recoveries and
returns
•
Targeting Wolfcamp A / B / C
•
7,000’+ lateral length
•
~80% of EUR made up of oil and NGLs |
 Key takeaways
•
Wolfcamp HZ oil shale play has expanded to more than 10 counties
since discovered in Crockett and Irion Counties in 2010
•
More than 1,800 HZ Wolfcamp wells have been drilled across the
Midland Basin
•
Nearly 80% of the horizontal wells have been drilled in S Midland Basin
•
Crockett, Irion and Reagan Counties account for most activity
•
S Midland Basin is shallower–
lower cost of drilling
•
N Midland Basin is deeper –
higher cost of drilling
•
Contiguous acreage, infrastructure and operational efficiency –
lower
cost of completion and operations
16 |
 Appendix |
 PV-10 (unaudited)
18
PV-10 (UNAUDITED)
(in millions)
December 31, 2013
PV-10
$
1,132
Less income taxes:
Undiscounted future income taxes
(919)
10% discount factor
463
Future discounted income taxes
(456)
Standardized measure of discounted future net cash flows
$
676
The
present
value
of
our
proved
reserves,
discounted
at
10%
(“PV-10”),
was
estimated
at
$1.1
billion
at
December
31,
2013,
and
was
calculated
based
on
the
first-of-the-month,
twelve-month
average
prices
for
oil,
NGLs
and
gas,
of
$97.28
per
Bbl
of
oil,
$30.16
per
Bbl
of
NGLs
and
$3.66
per
MMBtu
of
natural
gas.
PV-10
is
our
estimate
of
the
present
value
of
future
net
revenues
from
proved
oil
and
gas
reserves
after
deducting
estimated
production
and
ad
valorem
taxes,
future
capital
costs
and
operating
expenses,
but
before
deducting
any
estimates
of
future
income
taxes.
The
estimated
future
net
revenues
are
discounted
at
an
annual
rate
of
10%
to
determine
their
“present
value.”
We
believe
PV-10
to
be
an
important
measure
for
evaluating
the
relative
significance
of
our
oil
and
gas
properties
and
that
the
presentation
of
the
non-GAAP
financial
measure
of
PV-10
provides
useful
information
to
investors
because
it
is
widely
used
by
professional
analysts
and
investors
in
evaluating
oil
and
gas
companies.
Because
there
are
many
unique
factors
that
can
impact
an
individual
company
when
estimating
the
amount
of
future
income
taxes
to
be
paid,
we
believe
the
use
of
a
pre-tax
measure
is
valuable
for
evaluating
the
Company.
We
believe
that
PV-10
is
a
financial
measure
routinely
used
and
calculated
similarly
by
other
companies
in
the
oil
and
gas
industry.
The
following
table
reconciles
PV-10
to
our
standardized
measure
of
discounted
future
net
cash
flows,
the
most
directly
comparable
measure
calculated
and
presented
in
accordance
with
GAAP.
PV-10
should
not
be
considered
as
an
alternative
to
the
standardized
measure
as
computed
under
GAAP. |
 Forward-looking statements
19
The
Securities
and
Exchange
Commission
(“SEC”)
permits
oil
and
gas
companies,
in
their
filings
with
the
SEC,
to
disclose
only
proved,
probable
and
possible
reserves
that
meet
the
SEC’s
definitions
for
such
terms,
and
price
and
cost
sensitivities
for
such
reserves,
and
prohibits
disclosure
of
resources
that
do
not
constitute
such
reserves.
The
Company
uses
the
terms
“estimated
ultimate
recovery”
or
“EUR,”
reserve
or
resource
“potential,”
and
other
descriptions
of
volumes
of
reserves
potentially
recoverable
through
additional
drilling
or
recovery
techniques
that
the
SEC’s
rules
may
prohibit
the
Company
from
including
in
filings
with
the
SEC.
These
estimates
are
by
their
nature
more
speculative
than
estimates
of
proved,
probable
and
possible
reserves
and
accordingly
are
subject
to
substantially
greater
risk
of
being
actually
realized
by
the
Company.
EUR
estimates,
identified
drilling
locations
and
resource
potential
estimates
have
not
been
risked
by
the
Company.
Actual
locations
drilled
and
quantities
that
may
be
ultimately
recovered
from
the
Company’s
interest
may
differ
substantially
from
the
Company’s
estimates.
There
is
no
commitment
by
the
Company
to
drill
all
of
the
drilling
locations
that
have
been
attributed
these
quantities.
Factors
affecting
ultimate
recovery
include
the
scope
of
the
Company’s
ongoing
drilling
program,
which
will
be
directly
affected
by
the
availability
of
capital,
drilling
and
production
costs,
availability
of
drilling
and
completion
services
and
equipment,
drilling
results,
lease
expirations,
regulatory
approval
and
actual
drilling
results,
as
well
as
geological
and
mechanical
factors
Estimates
of
unproved
reserves,
type/decline
curves,
per
well
EUR
and
resource
potential
may
change
significantly
as
development
of
the
Company’s
oil
and
gas
assets
provides
additional
data.
Type/decline
curves,
estimated
EURs,
resource
potential,
recovery
factors
and
well
costs
represent
Company
estimates
based
on
evaluation
of
petrophysical
analysis,
core
data
and
well
logs,
well
performance
from
limited
drilling
and
recompletion
results
and
seismic
data,
and
have
not
been
reviewed
by
independent
engineers.
These
are
presented
as
hypothetical
recoveries
if
assumptions
and
estimates
regarding
recoverable
hydrocarbons,
recovery
factors
and
costs
prove
correct.
The
Company
has
very
limited
production
experience
with
these
projects,
and
accordingly,
such
estimates
may
change
significantly
as
results
from
more
wells
are
evaluated.
Estimates
of
resource
potential
and
EURs
do
not
constitute
reserves,
but
constitute
estimates
of
contingent
resources
which
the
SEC
has
determined
are
too
speculative
to
include
in
SEC
filings.
Unless
otherwise
noted,
IRR
estimates
are
before
taxes
and
assume
NYMEX
forward-curve
oil
and
gas
pricing
and
Company-generated
EUR
and
decline
curve
estimates
based
on
Company
drilling
and
completion
cost
estimates
that
do
not
include
land,
seismic
or
G&A
costs.
Cautionary statements regarding oil & gas quantities
This
presentation
contains
forward-looking
statements
within
the
meaning
of
Section
27A
of
the
Securities
Act
of
1933
and
Section
21E
of
the
Securities
Exchange
Act
of
1934.
All
statements,
other
than
statements
of
historical
facts,
included
in
this
presentation
that
address
activities,
events
or
developments
that
the
Company
expects,
believes
or
anticipates
will
or
may
occur
in
the
future
are
forward-looking
statements.
Without
limiting
the
generality
of
the
foregoing,
forward-looking
statements
contained
in
this
presentation
specifically
include
the
expectations
of
management
regarding
plans,
strategies,
objectives,
anticipated
financial
and
operating
results
of
the
Company,
including
as
to
the
Company’s
Wolfcamp
shale
resource
play,
estimated
resource
potential
and
recoverability
of
the
oil
and
gas,
estimated
reserves
and
drilling
locations,
capital
expenditures,
typical
well
results
and
well
profiles,
type
curve,
and
production
and
operating
expenses
guidance
included
in
the
presentation.
These
statements
are
based
on
certain
assumptions
made
by
the
Company
based
on
management's
experience
and
technical
analyses,
current
conditions,
anticipated
future
developments
and
other
factors
believed
to
be
appropriate
and
believed
to
be
reasonable
by
management.
When
used
in
this
presentation,
the
words
“will,”
“potential,”
“believe,”
“intend,”
“expect,”
“may,”
“should,”
“anticipate,”
“could,”
“estimate,”
“plan,”
“predict,”
“project,”
“target,”
“profile,”
“model”
or
their
negatives,
other
similar
expressions
or
the
statements
that
include
those
words,
are
intended
to
identify
forward-looking
statements,
although
not
all
forward-looking
statements
contain
such
identifying
words.
Such
statements
are
subject
to
a
number
of
assumptions,
risks
and
uncertainties,
many
of
which
are
beyond
the
control
of
the
Company,
which
may
cause
actual
results
to
differ
materially
from
those
implied
or
expressed
by
the
forward-looking
statements.
In
particular,
careful
consideration
should
be
given
to
the
cautionary
statements
and
risk
factors
described
in
the
Company's
most
recent
Annual
Report
on
Form
10-K
and
Quarterly
Reports
on
Form
10-Q.
Any
forward-looking
statement
speaks
only
as
of
the
date
on
which
such
statement
is
made
and
the
Company
undertakes
no
obligation
to
correct
or
update
any
forward-looking
statement,
whether
as
a
result
of
new
information,
future
events
or
otherwise,
except
as
required
by
applicable
law. |
 Thank you |