Attached files
| file | filename |
|---|---|
| 8-K - U. S. Premium Beef, LLC | es8k.htm |

|
It’s not just related to beta-agonists What’s Causing Carcass Composition Changes? By Brian Bertelsen, VP, Field Operations If you were able to attend the USPB Annual Meeting, you may remember that we looked at a recent trend of changes in carcass composition. Yield Grade (YG) has been increasing over the last six months. The factors involved in determining YG are fat thickness, ribeye area and carcass weight. In recent months, ribeye area has been the factor changing the most. The table below shows grid performance of all USPB cattle harvested in Kansas so far this delivery year and the same time period a year ago (September through early May). The sections highlighted in gray pertain to YG. So far this year, USPB carcasses have more YG 4 and 5’s. Average YG has increased more than a third of a grade. USPB KS PLANTS BENCHMARK DATA |
Net income for quarter is lower than same period last year Company Files First Quarter Results U.S. Premium Beef has closed its first quarter of fiscal year 2014 and has filed the results with the Securities and Exchange Commission. For the quarter, which ended March 29, 2014, USPB incurred a loss of $5.1 million compared to $4.2 million for the same period a year ago. The loss was due to USPB’s share of the loss at National Beef Packing Company (National Beef), which primarily occurred as a result of lower gross margins and severance costs related to the Brawley, CA, facility closure. Partially offsetting the loss from National Beef were lower expenses at USPB. National Beef’s profitability is impacted by the ratio of the USDA comprehensive boxed beef cutout (a weekly reported measure of the total value of all USDA inspected beef primal cuts, grind and trim produced from fed cattle) to the USDA 5-area weekly average slaughter cattle price. The ratio during the first quarter of 2014 was largely unchanged from the comparable 2013 period.s USPB, Kansas City Steak Co. Host KLA Young Stockmen’s Group
U.S. Premium Beef and Kansas City Steak Co. had an opportunity to
host the Kansas Livestock Association’s 2014 Young Stockmen’s Academy class,
which is a group of ranchers in their 20’s and 30’s from across Kansas. The
group toured several company’s facilities in the Kansas City area from May
13-15 to learn more about beef industry allied industries to prepare them to
become spokespersons and leaders in the industry. “This was an excellent opportunity for us to share information about our company with these young producers who are the beef industry’s future leaders,” Tracy Thomas, USPB vice- president of Marketing noted.s
Did You Know... üIf you have delivery year 2014 delivery rights you would like USPB to help you get leased to other producers, please call our office at 866-877-2525 to put them on our lease list. üUSPB currently has unitholder delivery rights available to lease. If you want to market additional cattle through USPB, please call our office. üUSPB has posted a new video on our web site featuring Tracy Thomas, USPB’s vice-president of Marketing. It is designed to help producers better understand how to get started delivering cattle to USPB.s |
|||
|
September through |
DY 2013 | DY 2014 | ||
|
In weight, lb. |
739 |
749 |
||
|
Days Fed |
155 |
149 |
||
|
Live Weight, lb. |
1,297 |
1,296 |
||
|
Carcass Weight, lb. |
843 |
830 |
||
|
Yield, % |
65.09 |
64.10 |
||
|
Yield Difference |
1.35 |
0.80 |
||
|
Choice/Prime, % |
70.63 |
76.29 |
||
|
CAB, % |
22.61 |
26.34 |
||
|
Ungraded, % |
1.08 |
0.85 |
||
|
YG1, % |
15.08 |
6.38 |
||
|
YG2, % |
39.82 |
30.52 |
||
|
YG3, % |
35.68 |
44.68 |
||
|
YG4, % |
8.65 |
16.51 |
||
|
YG5, % |
0.75 |
1.90 |
||
|
Average YG |
2.40 |
2.77 |
||
|
Fat Thickness, in. |
0.50 |
0.52 |
||
|
Ribeye Area, sq. in. |
14.41 |
13.77 |
||
|
REA:HCW ratio |
1.71 |
1.66 |
||
|
Light Weight, % |
0.29 |
0.31 |
||
|
Heavy Weight, % |
2.12 |
1.33 |
||
|
Quality Grade, $/head |
$30.01 |
$30.66 |
||
|
Yield, $/head |
$37.31 |
$25.33 |
||
|
Yield Grade, $/head |
-$2.29 |
-$6.74 |
||
| Out Weight, $/head |
-$3.29 |
-$2.18 |
||
| Subtotal Prem., $/head |
$61.74 |
$47.07 |
||
| Black-Hided, % |
74.65 |
77.08 |
||
| Steer, % |
38.24 |
32.95 |
||
|
Breaking it down into its components, fat thickness has increased slightly. Although this is a small numeric change, remember that fat thickness is the primary determinant of YG. Therefore, a small numeric change in fat thickness still has a significant effect on YG. Ribeye Area (REA) and hot carcass weight (HCW) have both decreased. However, the YG equation looks at REA in relation to HCW. A larger carcass would require a bigger ...continued on page 2 |
||||

Reproduction of any part of this newsletter is
expressly forbidden without written permission of U.S. Premium Beef.
|
What’s Causing Carcass Composition. |
continued from page 1 |
To make an “apples to apples” comparison, I went through our database and selected producers who have started shipping calf-feds in the last few months. I restricted my data sort to producers who also shipped the same kind of cattle during the same time a year ago, but did NOT feed Zilmax. I ended up with over 22,000 individual carcass data records to analyze. The bottom line is that these cattle are running about 0.60 square inches less REA in relation to carcass weight and are about .03 inches fatter than a year ago. While that may not sound so different, the change in REA alone is increasing YG by about 0.2 and the fat is increasing it almost an additional 0.1. A total of 0.3 of a YG means that every carcass with a YG of 3.7 to 3.9 last year, is now a YG 4. Within our database, about eight percent of the total population has a YG of 3.7 to 3.9 during the last two years. Referring back to the table on page 1, that also just happens to be the amount of increase compared to a year ago. So small differences in fat and REA can make big differences in the YG 4 percentage. The next question from producers seeing an increase in YG is “what would cause this?” Invariably, their first thought is genetics. My analysis was restricted to cattle with “the same genetics”, so I don’t think we can attribute any changes to genetics. Instead, phenotypic changes are often due to environment. This past winter was unusually cold. Some feedlots have also told me that they really struggled with the variability from extreme cold to normal temperatures then back to extreme cold again. Another factor could certainly be drought. Many of these calves were raised in areas that were at least moderately affected by drought over the last two to three years. This would include the time they were nursing and also when they were gestating in the cow. So, not only could forage quality and quantity be a factor while they were growing, but fetal programming could also have an impact as well. Just to put things into perspective, heritability is a measurement of the percentage of variation of a trait, or phenotype, which can be attributed to genetics. While carcass traits are highly heritable, those heritability values are in the range of 0.30 to 0.35. That means only about a third of the variation is due to genetics and most of the remainder is attributed to environment. The bottom line is that lately, carcasses have been a little fatter and significantly lighter muscled. Part of that is due to the absence of Zilmax, but there appears to be a distinct environmental component as well. Please call me at 866-877-2525 if you have questions about your grid performance.s
|
|
|
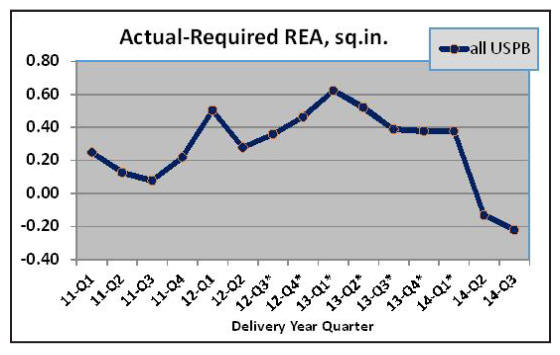
ribeye area to maintain the same YG. Insufficient REA in relation to HCW will increase the YG. That ratio is smaller this year, meaning the cattle are lighter muscled in relation to their carcass weight. In order to maintain the same REA:HCW ratio in this year’s cattle, the REA would need to be 0.42 square inches larger. One reason why composition was different a year ago would be that the beta-agonist Zilmax® was still being used. The use of that product significantly increases HCW and REA while also decreasing fat thickness. During this time a year ago, slightly more than half of all USPB cattle were fed Zilmax. However, in tracking those that were not fed Zilmax, a change in composition is still present. Not only are they slightly fatter, but they are also lighter muscled. The chart below shows the relationship between REA and carcass weight for all USPB Kansas cattle. One way to evaluate this is to compare the actual REA to the required REA. Required REA is derived from a formula that is driven solely by HCW. It’s the REA that is required to have no impact on YG. It is what “average” should be for any given HCW. So when the actual is below the required (a negative value), then lack of muscling is increasing the YG. |
|||
|
|
|||
|
The delivery year quarters in the chart that included Zilmax cattle are marked with an asterisk. The last data point on the chart for the third quarter of delivery year 2014 runs through May 10th which is about three weeks short of an entire quarter. In the most recent two quarters, REA has decreased by about 0.60 square inches in relation to HCW. That’s enough to increase YG by 0.2 units. Obviously, part of the change is due to not feeding Zilmax. However, if you compare the most recent two quarters with the same period a year earlier for cattle NOT fed Zilmax, their REA has decreased 0.25 square inches. But, this is comparing all USPB cattle to a subset. I’ve been getting a few calls lately from cattle feeders who are seeing some pretty large increases in YG 4’s on their home-raised calf-feds compared to a year ago. Some of those are seeing REA in relation to HCW that is up to two square inches smaller than a year ago. |
|||