Exhibit 99.1

Profile:
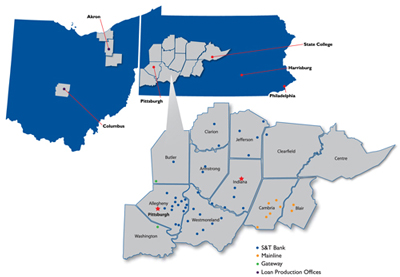
S&T Bancorp, Inc. is a $4.7 billion financial holding company headquartered in Indiana, PA, located about 55 miles northeast of Pittsburgh, PA.
Founded in 1902 with a single location in Indiana, PA, S&T Bancorp, Inc. has grown to 54 branch offices that provide a full range of financial services to
individuals and businesses in Allegheny, Armstrong, Blair, Butler, Cambria, Centre, Clarion, Clearfield, Indiana, Jefferson, Washington and Westmoreland counties. Additionally, S&T has loan production offices in northeast Ohio and central Ohio.
Investment Thesis:
| • |
|
Stable Western PA economy |
| • |
|
Long-term Marcellus Shale benefit |
| • |
|
Opportunistic & effective acquisitions/expansions |
| • |
|
Excellent asset quality |
| • |
|
Demonstrated expense discipline and efficiency |
| • |
|
Historically high performer |
| • |
|
Undervalued compared to peer |
Recent Mergers and Expansions:
March 3, 2014
S&T Bank hires 2 local
community bankers in State College, PA to service central Pennsylvania.
January 21, 2014
S&T Bank loan production office opens to service central Ohio.
August 27, 2012
S&T Bank loan production
office opens to service northeast Ohio.
August 13, 2012
S&T Bank acquired Gateway Bank of PA adding 2 offices in Cranberry Township and McMurray. Gateway had approximately $99
million in loans and $105 million in deposits.
March 9, 2012
S&T Bank acquired Mainline Bancorp adding 8 offices in Blair and Cambria County. Mainline Bancorp had approximately $130
million in loans and $206 million in deposits.
 MEMBER FDIC
Key Statistics:
|
|
|
|
|
|
|
|
|
|
|
| (Data as of 03.31.14) |
|
|
|
|
|
(Data as of 03.31.14) |
|
|
|
|
| Total Assets (in $ millions) |
|
$ |
4,707 |
|
|
Stock Price |
|
$ |
23.70 |
|
| Common BV/Share |
|
$ |
19.64 |
|
|
Market Cap (in $ millions) |
|
$ |
704 |
|
| Tangible BV/Share |
|
$ |
13.65 |
|
|
Dividend Yield (annualized) |
|
|
2.70 |
% |
|
|
|
|
|
|
Price/Earnings (LTM) |
|
|
13.5 |
|
54 Branches in 12 Western Pennsylvania Counties & 2 Loan Production Offices in Ohio
Total Annualized Shareholder Return
Includes reinvested dividends
(Data as of 03.31.14)
|
|
|
|
|
|
|
|
|
|
|
|
|
|
|
|
|
| |
|
1 YR |
|
|
3 YR |
|
|
5 YR |
|
|
10 YR |
|
| STBA |
|
|
31.14 |
% |
|
|
6.39 |
% |
|
|
5.41 |
% |
|
|
0.94 |
% |
| NASDAQ Bank |
|
|
30.42 |
% |
|
|
15.93 |
% |
|
|
14.56 |
% |
|
|
1.42 |
% |
| KRX-Dow Jones KBW Regional Bank |
|
|
31.28 |
% |
|
|
16.37 |
% |
|
|
17.60 |
% |
|
|
NA |
|
| S&P 500 |
|
|
21.65 |
% |
|
|
14.61 |
% |
|
|
21.19 |
% |
|
|
7.41 |
% |
Source: Bloomberg
Senior Management:
Todd D. Brice
President and Chief Executive Officer
Mark Kochvar
Senior Executive Vice President, Chief
Financial Officer
David G. Antolik
Senior Executive
Vice President, Chief Lending Officer
David P. Ruddock
Senior Executive Vice President, Chief Operating Officer
Investor Relations Contact:
Mark Kochvar
S&T Bancorp, Inc.,
800 Philadelphia Street
Indiana, PA 15701
724.465.4826
mark.kochvar@stbank.net
For more information visit
stbancorp.com.
Common stock traded on the NASDAQ under the symbol STBA
Analyst Coverage:
The following analysts published
research about S&T Bancorp, Inc. in 2014.
Boenning & Scattergood
Matthew Schultheis — 610.832.5290
mschultheis@boenninginc.com
Guggenheim Partners
Taylor Brodarick — 615.208.1222
taylor.brodarick@guggenheimpartners.com
Keefe,
Bruyette & Woods
Collyn Gilbert — 973.549.4092
collyn.gilbert@kbw.com
Raymond James
William Wallace — 301.657.1548 william.wallace@raymondjames.com
RBC Capital Markets
Jake Civiello — 617.725.2152
jake.civiello@rbccm.com
Sterne Agee
Matthew Breese — 207.699.5800
mbreese@sterneagee.com
Financial Highlights:
|
|
|
|
|
|
|
|
|
|
|
|
|
| |
|
1Q14 |
|
|
2013 |
|
|
2012 |
|
| |
|
|
|
|
Full Year |
|
|
Full Year |
|
| Net Income (in $ thousands) |
|
$ |
14,033 |
|
|
$ |
50,539 |
|
|
$ |
34,200 |
|
| Diluted Earnings per Share |
|
$ |
0.47 |
|
|
$ |
1.70 |
|
|
$ |
1.18 |
|
| Dividends Declared per Share |
|
$ |
0.16 |
|
|
$ |
0.61 |
|
|
$ |
0.60 |
|
|
|
|
|
| Total Assets (in $ millions) |
|
$ |
4,707 |
|
|
$ |
4,533 |
|
|
$ |
4,527 |
|
| Total Loans (in $ millions) |
|
$ |
3,629 |
|
|
$ |
3,568 |
|
|
$ |
3,369 |
|
| Total Deposits (in $ millions) |
|
$ |
3,868 |
|
|
$ |
3,672 |
|
|
$ |
3,638 |
|
|
|
|
|
| Return on Average Assets (annualized) |
|
|
1.23 |
% |
|
|
1.12 |
% |
|
|
0.79 |
% |
| Return on Average Equity (annualized) |
|
|
9.83 |
% |
|
|
9.21 |
% |
|
|
6.62 |
% |
| Net Interest Margin (FTE) |
|
|
3.51 |
% |
|
|
3.50 |
% |
|
|
3.57 |
% |
|
|
|
|
| Nonperforming Assets/Loans + OREO |
|
|
0.59 |
% |
|
|
0.64 |
% |
|
|
1.66 |
% |
| Allowance for Loan Losses/Total Loans |
|
|
1.28 |
% |
|
|
1.30 |
% |
|
|
1.38 |
% |
| Net Loan Charge-offs (annualized) / Average Loans |
|
|
–0.01 |
% |
|
|
0.25 |
% |
|
|
0.78 |
% |
|
|
|
|
| Risk-based Capital - Total |
|
|
14.41 |
% |
|
|
14.36 |
% |
|
|
15.39 |
% |
| Tangible Common Equity/Tangible Assets |
|
|
8.96 |
% |
|
|
9.00 |
% |
|
|
8.20 |
% |
Our Reputation Speaks for Itself…
| • |
|
Named to the prestigous Sandler O’Neill Sm-All Stars Class of 2013. |
| • |
|
Superior Customer Service |
Consistently
ranked high in customer satisfaction.
| • |
|
American Heart Association |
S&T honored
recognized as a Gold Level Fit-Friendly Worksite in 2014.
S&T voted one of the best
employers for workers over 50 years old.

|
| This document may contain “forward-looking statements” within the meaning of the Private Securities Litigation Reform Act of
1995. Such statements involve risks and uncertainties that could cause actual results to differ materially from the results discussed in these statements. These risks are detailed in the company’s latest form 10-Q and 10-K filed with the
Securities and Exchange Commission. This document also contains or references,
certain non-GAAP financial measures, such as net interest margin (FTE). Although S&T believes that these measures enhance investors’ understanding of S&T’s business and performance, these non-GAAP financial measures should not be
considered an alternative to GAAP, and should be read in conjunction with the audited financial statements and analysis as presented in the Annual Report on Form 10-K as well as the unaudited financial statements and analyses as presented in the
respective Quarterly Reports on Forms 10-Q for S&T Bancorp, Inc. and subsidiaries. |