Attached files
| file | filename |
|---|---|
| EX-31.2 - EX-31.2 - HARVEST NATURAL RESOURCES, INC. | d716026dex312.htm |
| EX-31.1 - EX-31.1 - HARVEST NATURAL RESOURCES, INC. | d716026dex311.htm |
Table of Contents
UNITED STATES
SECURITIES AND EXCHANGE COMMISSION
WASHINGTON, DC 20549
FORM 10-K/A
Amendment No. 1
(Mark One)
| x | ANNUAL REPORT PURSUANT TO SECTION 13 OR 15(d) OF THE SECURITIES EXCHANGE ACT OF 1934 |
For the fiscal year ended December 31, 2013
or
| ¨ | TRANSITION REPORT PURSUANT TO SECTION 13 OR 15(d) OF THE SECURITIES EXCHANGE ACT OF 1934 |
Commission File No.: 1-10762
HARVEST NATURAL RESOURCES, INC.
(Exact name of registrant as specified in its charter)
| Delaware | 77-0196707 | |
| (State or other jurisdiction of incorporation or organization) |
(I.R.S. Employer Identification Number) | |
| 1177 Enclave Parkway, Suite 300 | ||
| Houston, Texas | 77077 | |
| (Address of principal executive offices) | (Zip Code) | |
Registrant’s telephone number, including area code: (281) 899-5700
Securities registered pursuant to Section 12(b) of the Act:
| Title of each class |
Name of each exchange on which registered | |
| Common Stock, $.01 Par Value | NYSE |
Securities registered pursuant to Section 12(g) of the Act: Preferred Share Purchase Rights
Indicate by check mark whether the registrant is a well-known seasoned issuer, as defined in Rule 405 of the Securities Act. Yes ¨ No x
Indicate by check mark whether the registrant is not required to file reports pursuant to Section 13 or Section 15(d) of the Act. Yes ¨ No x
Indicate by check mark whether the registrant (1) has filed all reports required to be filed by Section 13 or 15(d) of the Securities Exchange Act of 1934 during the preceding 12 months (or for such shorter period that the registrant was required to file such reports), and (2) has been subject to such filing requirements for the past 90 days. Yes x No ¨
Indicate by check mark whether the registrant has submitted electronically and posted on its corporate website, if any, every Interactive Data File required to be submitted and posted pursuant to Rule 405 of Regulation S-T during the preceding 12 months (or for such shorter period that the registrant was required to submit and post such files). Yes x No ¨
Indicate by check mark if disclosure of delinquent filers pursuant to Item 405 of Regulation S-K is not contained herein, and will not be contained, to the best of registrant’s knowledge, in definitive proxy or information statements incorporated by reference in Part III of this Form 10-K or any amendment to this Form 10-K. x
Indicate by check mark whether the registrant is a large accelerated filer, an accelerated filer, a non-accelerated filer, or a smaller reporting company. See the definitions of “large accelerated filer,” “accelerated filer” and “smaller reporting company” in Rule 12b-2 of the Exchange Act.
| Large Accelerated Filer | ¨ | Accelerated Filer | x | |||
| Non-Accelerated Filer | ¨ | Smaller Reporting Company | ¨ | |||
Indicate by check mark whether the registrant is a shell company (as defined in Rule 12b-2 of the Exchange Act). Yes ¨ No x
The aggregate market value of the registrant’s voting and non-voting common equity held by non-affiliates computed by reference to the price at which the common equity was last sold, or the average bid and asked price of such common equity, as of June 28, 2013 was: $122,116,759.
Indicate the number of shares outstanding of each of the registrant’s classes of common stock, as of the latest practical date. Class: Common Stock, par value $0.01 per share, on March 7, 2014, shares outstanding: 42,104,038.
DOCUMENTS INCORPORATED BY REFERENCE
None.
Table of Contents
HARVEST NATURAL RESOURCES, INC.
FORM 10-K/A
| Page | ||||
| Part III | ||||
| Item 10. Directors, Executive Officers and Corporate Governance |
1 | |||
| 7 | ||||
| 28 | ||||
| Item 13. Certain Relationships and Related Transactions, and Director Independence |
32 | |||
| 33 | ||||
| Part IV | ||||
| 33 | ||||
Table of Contents
EXPLANATORY NOTE
The purpose of this Amendment No. 1 on Form 10-K/A (“Amended Report”) is to amend Part III, Items 10 through 14 of our Annual Report on Form 10-K for the fiscal year ended December 31, 2013, which was filed with the Securities and Exchange Commission (the “SEC”) on March 17, 2014 (the “2013 10-K”), to include information previously omitted from the 2013 10-K in reliance on General Instruction G to Form 10-K, which provides that registrants may incorporate by reference certain information from a definitive proxy statement filed with the SEC within 120 days after the end of the fiscal year. The Company’s definitive proxy statement will not be filed within 120 days after the end of the Company’s 2013 fiscal year.
As required by Rule 12b-15 under the Securities Exchange Act of 1934, as amended (the “Exchange Act”), new certifications by our principal executive officer and principal financial officer are filed as exhibits to this Annual Report on Form 10-K/A under Item 15 of Part IV hereof.
Except as stated herein, the Company has not modified or updated disclosures presented in the 2013 10-K in this Amended Report. Accordingly, this Amended Report does not reflect events occurring after the filing of our 2013 10-K or modify or update those disclosures, including the exhibits to the 2013 10-K, affected by subsequent events. As such, our 2013 10-K continues to speak as of March 17, 2014 (the date it was filed with the SEC). Accordingly, this Amended Report should be read in conjunction with the 2013 10-K and our other reports filed with the SEC subsequent to the filing of our 2013 10-K, including any amendments to those filings.
Item 10. Directors, Executive Officers and Corporate Governance
BOARD OF DIRECTORS
Our Board is comprised of seven members:
| Stephen D. Chesebro’ Appointed Director in October 2000 Age 72 |
Mr. Chesebro’ has served as the Chairman of the Board of Harvest Natural Resources, Inc. since 2001. From December 1998 until he retired in 1999, he served as President and Chief Executive Officer of PennzEnergy, the independent oil and gas exploration and production company that was formerly a business unit of Pennzoil Company. From February 1997 to December 1997, Mr. Chesebro’ served as Group Vice President – Oil and Gas and from December 1997 until December 1998 he served as President and Chief Operating Officer of Pennzoil Company, an integrated oil and gas company. From 1993 to 1996, Mr. Chesebro’ was Chairman and Chief Executive Officer of Tenneco Energy. Tenneco Energy was part of Tenneco, Inc., a worldwide corporation that owned diversified holdings in six major industries. Mr. Chesebro’ is an advisory director to Preng & Associates, an executive search consulting firm. In 1964, Mr. Chesebro’ graduated from the Colorado School of Mines. He was awarded the school’s Distinguished Achievement Medal in 1991 and received his honorary doctorate from the institution in 1998. He currently serves on the school’s visiting committee for petroleum engineering, and is a member of the Colorado School of Mines Foundation Board of Governors. In 1994, Mr. Chesebro’ was the first American awarded the H. E. Jones London Medal by the Institution of Gas Engineers, a British professional association. From December 2005 until March 2014, he served as the President of the Chesebro’ Foundation, Inc., a private charitable foundation incorporated in Delaware. |
1
Table of Contents
| James A. Edmiston Elected Director in May 2005 Age 54 |
Mr. Edmiston was elected President and Chief Executive Officer of Harvest Natural Resources, Inc. on October 1, 2005. He joined the Company as Executive Vice President and Chief Operating Officer on September 1, 2004. Prior to joining Harvest, Mr. Edmiston was with Conoco and ConocoPhillips for 22 years in various management positions including President, Dubai Petroleum Company (2002-2004), a ConocoPhillips affiliate company in the United Arab Emirates and General Manager, Petrozuata, C.A., in Puerto La Cruz, Venezuela (1999-2001). Prior to 1999, Mr. Edmiston also served as Vice President and General Manager of Conoco Russia and then as Asset Manager of Conoco’s South Texas Lobo Trend gas operations. On March 27, 2014, Mr. Edmiston was appointed to the board of Sonde Resources Corp. He earned a Bachelor of Science degree in Petroleum Engineering from the Texas Tech University and a Masters of Business Administration from the Fuqua School of Business at Duke University. Mr. Edmiston was inducted into the Petroleum Engineering Academy and was recognized as a Distinguished Engineer by the Texas Tech College of Engineering in 2009. Mr. Edmiston is a Member of the Society of Petroleum Engineers. | |
| Dr. Igor Effimoff Appointed Director in February 2008 Age 68 |
Dr. Igor Effimoff is founder and principal of a firm which provides upstream and midstream consulting services since 2005. From 2002 until 2005 he was Chief Operating Officer for Teton Petroleum Company. Between 1996 and 2001, he was President of Pennzoil Caspian Corporation, managing their interests in the Caspian Region. Between 1994 and 1996 he was the Chief Executive Officer of Larmag Energy, NV, a privately held Dutch oil and gas production company with its primary assets in the Caspian Sea. He has served in senior executive roles with Ashland Exploration Inc., Zilkha Energy Company and Kriti Exploration, Inc. Dr. Effimoff has authored numerous technical and business articles. He is a member of American Association of Petroleum Geology, the Society of Petroleum Engineers, the Society of Exploration Geophysicists and the Geological Society of America. Dr. Effimoff served on the audit and compensation committees of TrueStar Petroleum Corporation in 2007. He currently serves on the board of IPC Oil and Gas Holdings Ltd. He has a Doctorate in Geology from the University of Cincinnati and completed the Harvard Advanced Management Program. | |
| H. H. Hardee Appointed Director in October 2000 Age 59 |
Mr. Hardee is a Senior Vice President—Financial Advisor with RBC Wealth Management, since 1994. From 1991 through 1994, Mr. Hardee was a Senior Vice President with Kidder Peabody. From 1977 through 1991, Mr. Hardee was a Senior Vice President at Rotan Mosle/Paine Webber Inc. Mr. Hardee was named as one of America’s best financial advisors for 2009, 2010, 2011 and 2012 by Barron’s financial newspaper and by Reuters AdvicePoint. Furthermore, Mr. Hardee has been recognized by NABCAP, the National Association of Board Certified Advisory Practices, as a Premier Wealth Advisor. He currently advises/manages over $400 million in assets. Mr. Hardee’s expertise is advising high net worth individuals and small to mid-sized corporations. Mr. Hardee is a former director of the Bank of Almeda and Gamma Biologicals. He is also a former limited partner and advisory director of the Houston Rockets of the National Basketball Association. Mr. Hardee has a finance degree from the McCombs School of Business at the University of Texas. He has earned an Accredited Wealth Management designation through the Estate and Wealth Strategies Institute of Michigan State University. Mr. Hardee is a National Association of Corporate Directors (NACD) Board Leadership Fellow. He has demonstrated his commitment to boardroom excellence by completing NACD’s comprehensive program of study for corporate directors. He supplements his skill sets through ongoing engagement with the director community and access to leading practices. | |
2
Table of Contents
| Robert E. Irelan Appointed Director in February 2008 Age 67 |
Mr. Irelan has over 37 years of experience in the oil and gas industry. He retired from Occidental Petroleum as Executive Vice President of Worldwide Operations in April 2004, having started there in 1998. Prior to Occidental Petroleum, Mr. Irelan held various positions at Conoco, Inc., from 1967 until 1998. Upon his retirement he opened his own company, Naleri Investments LLC. He also partnered in several entrepreneurial ventures including Rapid Retail Solutions LLC, BISS Product Development LLC and All About Baby LLC. Mr. Irelan earned his Professional Engineering degree in Petroleum Engineering from Colorado School of Mines. He also has advanced studies in Mineral Economics. He was awarded the Distinguished Achievement Award from the school in 1998. | |
| Patrick M. Murray Appointed Director in October 2000 Age 71 |
In 2007, Mr. Murray retired from Dresser, Inc. He had been the Chairman of the Board and Chief Executive Officer since 2004. Dresser, Inc. is an energy infrastructure and oilfield products and services company. From 2000 until becoming Chairman of the Board, Mr. Murray served as President and Chief Executive Officer of Dresser, Inc. Mr. Murray was President of Halliburton Company’s Dresser Equipment Group, Inc.; Vice President, Strategic Initiatives of Dresser Industries, Inc.; and Vice President, Operations of Dresser, Inc. from 1996 to 2000. Mr. Murray has also served as the President of Sperry-Sun Drilling Services from 1988 through 1996. Mr. Murray joined NL Industries in 1973 as a Systems Application Consultant and served in a variety of increasingly senior management positions. Mr. Murray currently serves on the board and audit committee of Precision Drilling Corporation, a publicly-held contract drilling company. Mr. Murray is also on the board of the World Affairs Council of Dallas Fort Worth. He is on the board of advisors for White Deer Energy, the Maguire Energy Institute at the Edwin L. Cox School of Business, Southern Methodist University, and a member of the Board of Regents of Seton Hall University. Mr. Murray holds a B.S. degree in Accounting and a Master of Business Administration from Seton Hall University. He served for two years in the U.S. Army as a commissioned officer. | |
| J. Michael Stinson Appointed Director in November 2005 Age 70 |
From September 2006 to December 2011, Mr. Stinson was Chairman of TORP Terminal LP, the U.S. unit of a Norwegian LNG technology company. From 2004 until November of 2009, he served as a director of Enventure Global Technology, Inc., an oil equipment company, most recently as the Chairman of their Audit and Finance Committee. From January 2005 until November 2009, he was Chairman of the Board of Paulsson Geophysical Services, Inc., a vertical seismic profiling technology company. From February through August 2004, Mr. Stinson served with the U.S. Department of Defense and the Coalition Provisional Authority as Senior Advisor to the Iraqi Ministry of Oil. From 1965 to 2003, Mr. Stinson was with Conoco and ConocoPhillips in a number of assignments in operations and management. His last position at ConocoPhillips was as Senior Vice President, Government Affairs in which he was responsible for government relations with particular emphasis on developing and facilitating international business development opportunities in various countries. Previous positions | |
3
Table of Contents
| included Senior Vice President – Business Development, Vice President – Exploration and Production, Chairman and Managing Director of Conoco (UK) Limited, Vice President/General Manager of International Production for Europe, Africa and the Far East, and President and Managing Director of Conoco Norway, Inc. Mr. Stinson earned a Bachelor of Science degree in Industrial Engineering from Texas Tech University and a Masters of Business Administration from Arizona State University. He is a member of the Society of Petroleum Engineers and the American Association of Petroleum Geologists. | ||
4
Table of Contents
EXECUTIVE OFFICERS
The following table provides information regarding each of our executive officers.
| Name |
Age | Position | ||
| James A. Edmiston * | 54 | President and Chief Executive Officer | ||
| Stephen C. Haynes | 57 | Vice President, Finance, Chief Financial Officer and Treasurer | ||
| Keith L. Head | 56 | Vice President, General Counsel and Corporate Secretary | ||
| Karl L. Nesselrode | 56 | Vice President, Engineering & Business Development | ||
| Robert Speirs | 58 | Senior Vice President, Eastern Operations | ||
| * | See Mr. Edmiston’s biography beginning on page 2. |
Stephen C. Haynes has served as our Vice President, Chief Financial Officer and Treasurer since May 19, 2008. Mr. Haynes performed various financial consulting engagements from January 1, 2008 until his appointment with Harvest. Previously, he served as Chief Financial Officer for Cygnus Oil and Gas Corporation for the period February 1, 2006 through December 31, 2007. Before joining Cygnus, Mr. Haynes was the Corporate Controller with Carrizo Oil and Gas for the period January 1, 2005 through January 31, 2006. Mr. Haynes served as an independent consultant from March 2001 through end of 2004. From March 1990 through December 2000, Mr. Haynes served in a series of increasing responsibilities in international managerial and executive positions with British Gas, culminating in his appointments as Vice President-Finance of Atlantic LNG, a joint venture of British Gas and several industry partners in Trinidad and Tobago. Mr. Haynes is a Certified Public Accountant, holds a Master of Business Administration degree with a concentration in Finance from the University of Houston and a Bachelor of Business Administration degree in Accounting from Sam Houston State University. He also attended the Executive Development Program at Harvard University.
Keith L. Head has served as our Vice President, General Counsel and Corporate Secretary since May 7, 2007. He joined Texas Eastern upon graduation from law school and remained with the same organization through mergers with Panhandle Eastern, Duke Energy Corporation and Cinergy Corp. Mr. Head held various business development positions with Duke Energy Corporation from 1995 to 2001. His corporate development work included the identification, evaluation and negotiation of acquisitions in Latin America, North America and the United Kingdom. Mr. Head was Senior Vice President and General Counsel at Duke Energy North America from 2001 to 2004 and Associate General Counsel of Duke Energy Corporation from 2004 through December 2006. After leaving Duke Energy, Mr. Head joined Harvest in May 2007. He currently serves on the non-profit board of MentorCONNECT and formerly served as president of the board for the Texas Accountants and Lawyers for the Arts. He is also a board member of the Houston chapter of The General Counsel Forum. Mr. Head holds a Bachelor of Science degree in Business Administration from the University of North Carolina. He received both a Juris Doctorate and Masters in Business Administration from the University of Texas in 1983.
Karl L. Nesselrode has served as Vice President, Engineering and Business Development of the Company since November 17, 2003. From August 9, 2007 to August 2, 2010, he accepted a long-term secondment to Petrodelta as its Operations and Technical Manager while remaining an officer of Harvest. From February 2002 until November 2003, Mr. Nesselrode was President of Reserve Insights, LLC, a strategy and management consulting company for oil and gas. He was employed with Anadarko Petroleum Corporation as Manager Minerals and Special Projects from July 2000 to February 2002. Mr. Nesselrode served in various managerial positions with Union Pacific Resources Company from August 1979 to July 2000. Mr. Nesselrode earned a Bachelor of Science in Petroleum Engineering from the University of Tulsa in 1979 and completed Harvard Business School Program for Management Development in 1995.
Robert Speirs has served as Senior Vice President, Eastern Operations since July of 2011. Prior to his promotion, his title had been Vice President, Eastern Operations since December 6, 2007. He joined Harvest in June 2006 as President and General Manager, Russia. Previously Mr. Speirs was President of Marathon Petroleum Russia and General Director of their wholly-owned subsidiary, KhantyMansciskNefte Gas Geologia from March 2004 through May 2006. Prior to joining Marathon, Mr. Speirs was Executive Vice President of YUKOS EP responsible for
5
Table of Contents
engineering and construction from June 2001. During both these periods, Mr. Speirs spent considerable time in West Siberia where he oversaw substantial increases in production at both companies. From November 1997 until March 2001, Mr. Speirs resided in Jakarta where he served as President of Premier Oil Indonesia. During this period, Premier was active in all phases of the Upstream business, culminating in the commissioning of the West Natuna Gas Project. Prior to 1997, Mr. Speirs was with Conoco for 21 years in various leadership positions in the US, UK, Russia, Indonesia, Singapore and Dubai, UAE. Mr. Speirs earned a Bachelor of Science degree with Honors in Engineering Science from the University of Edinburgh. He also attended the Executive Management Program at INSEAD.
CORPORATE GOVERNANCE
Audit Committee
Our board of directors has established a standing audit committee (the “Audit Committee”). The Audit Committee operates pursuant to a written charter. The charter is accessible in the Corporate Governance section of our website (http://www.harvestnr.com). Our audit committee is currently, and was during 2013, composed of Patrick M. Murray, Chairman, Igor Effimoff, H.H. Hardee and J. Michael Stinson. The Audit Committee assists the Board in its oversight of our accounting and financial reporting policies and practices; the integrity of our financial statements; the independent registered public accounting firm’s qualifications, independence and objectivity; the performance of our internal audit function and our independent registered public accounting firm; and our compliance with legal and regulatory requirements.
The Audit Committee acts as a liaison between our independent registered public accounting firm and the Board, and it has the sole authority to appoint or replace the independent registered public accounting firm and to approve any non-audit relationship with the independent registered public accounting firm. Our internal auditor and the independent registered public accounting firm report directly to the Audit Committee.
Our Audit Committee has established procedures for our employees or consultants to make a confidential, anonymous complaint or raise a concern over accounting, internal accounting controls or auditing matters concerning us or any of our companies and is responsible for the proper implementation of such procedures. The Audit Committee is also responsible for understanding and assessing our processes and policies for communications with stockholders, institutional investors, analysts and brokers.
The Audit Committee has access to our records and employees, and has the sole authority to retain independent legal, accounting or other advisors for committee matters. We will provide appropriate funding for the payment of the independent registered public accounting firm and any advisors employed by the Audit Committee.
The Audit Committee makes regular reports to the Board. Each year the Audit Committee assesses the adequacy of its charter and conducts a self-assessment review to determine its effectiveness.
The Board has determined that each member of the Audit Committee meets the independence standards of the Securities and Exchange Commission’s (“SEC”) requirements, the rules of the New York Stock Exchange and the Company Guidelines for Corporate Governance. No member of the Audit Committee serves on the audit committee of more than three public companies. The Board has further determined that each member of the Audit Committee is financially literate and that Mr. Murray qualifies as an audit committee financial expert, as defined in Item 407(d)(5) of SEC Regulation S-K. Information on the relevant experience of Mr. Murray is set forth in “Board of Directors” above.
Section 16(a) Beneficial Ownership Reporting Compliance
Section 16(a) of the Securities Exchange Act of 1934, as amended, (“Section 16(a)”) requires our directors, executive officers and beneficial holders of more than 10 percent of our common stock to file reports with the SEC regarding their ownership and changes in ownership of our stock. Based solely upon our review of SEC Forms 3, 4 and 5 and any amendments thereto furnished to us, to our knowledge, during fiscal year 2013, our officers, directors and 10 percent stockholders complied with all Section 16(a) filing requirements. In making this statement, we have relied upon the written representations of our directors and officers.
6
Table of Contents
Code of Ethics
The Board has adopted a Code of Business Conduct and Ethics, which applies to all of our directors, officers and employees. The Board last amended the Code of Business Conduct and Ethics in December 2010. The Board has not granted any waivers to the Code of Business Conduct and Ethics.
The Guidelines for Corporate Governance, the Code of Business Conduct and Ethics and the charters of all the Board committees are accessible on our website under the Corporate Governance section at http://www.harvestnr.com. Any amendments to or waivers of the Code of Conduct and Business Ethics will also be posted on our website.
Item 11. Executive Compensation
COMPENSATION DISCUSSION AND ANALYSIS
Introduction
Harvest’s Compensation Discussion and Analysis explains the key elements of our executive compensation program for our President and CEO and our other named executive officers whose 2013 compensation is in the Executive Compensation Tables starting on page 20.
| • | James A. Edmiston, President and Chief Executive Officer (CEO); |
| • | Stephen C. Haynes, Vice President and Chief Financial Officer; |
| • | Robert Speirs, Senior Vice President – Eastern Operations; |
| • | Karl L. Nesselrode, Vice President – Engineering and Business Development; and |
| • | Keith L. Head, Vice President and General Counsel. |
Executive Summary
As a Company, our focus is on acquiring exploration, development, and producing properties in proven and active hydrocarbon systems. We operate from our Houston, Texas headquarters with regional/technical offices in Singapore and field offices in Jakarta, Indonesia, and Port Gentil, Gabon.
Performance Highlights
2013 was a challenging year for the Company with a number of key accomplishments and results:
| • | We announced an oil discovery in Gabon of approximately 42 feet of pay in the Gamba formation and 123 feet of pay in the Dentale formation. |
| • | We acquired an additional 7.1 percent interest in the Budong-Budong production sharing contract and became operator in March 2013 in Indonesia. |
| • | Following the termination of a Share Purchase Agreement with PT Pertamina due to the transaction not being approved by the Government of Indonesia earlier in the year, we entered into a Share Purchase agreement with Petroandina Resources and Pluspetrol Resources to sell all of our Venezuelan interests through a sale of our equity interests in Harvest Holdings. |
| • | The sale of the first closing shares occurred with the signing of the Share Purchase Agreement. At that time, HNR Energia sold to Petroandina, for a cash purchase price of $125 million, a 29 percent equity interest in Harvest Holding, which represents an indirect 11.6 percent equity interest in Petrodelta. |
7
Table of Contents
| • | Contingent on shareholder approval at a special meeting in May 2014 and approval by the Venezuelan government, the second closing will be for the sale of the remaining 51 percent of HNR Energia for a cash purchase price of $275 million. |
| • | In January 2014, we used a portion of the $125 million from the first closing to redeem all of our 11% senior notes due in 2014. The notes were redeemed for $80.0 million, including principal and accrued and unpaid interest. |
| • | We discontinued operations in Oman and closed our Muscat, Oman office. We also closed our technical services office in the United Kingdom and consolidated this function with our Houston Headquarters. |
| • | Our Venezuelan operations increased production by 10.7% over 2012. |
| • | Total shareholder return for the year was down by 50.2% due primarily to the termination of the sale to PT Pertamina. |
Compensation Highlights
| • | We increased base salaries for the CEO and other named executive officers 3.0% across the board effective March 2014. This compares to an average 4.0% increase for executives in the exploration and production industry in 2013 and 2014. |
| • | Annual cash incentive awards were paid in March 2014. The CEO and other named executive officers received 70% of their target incentive. This reflects, in part, the decline in total shareholder return. |
| • | Long-term incentive awards were granted with approximately 20 percent restricted stock and 80 percent stock options/SARs valued at the closing stock price on July 18, 2013. |
8
Table of Contents
The following graphs highlight the Company results for 2013:
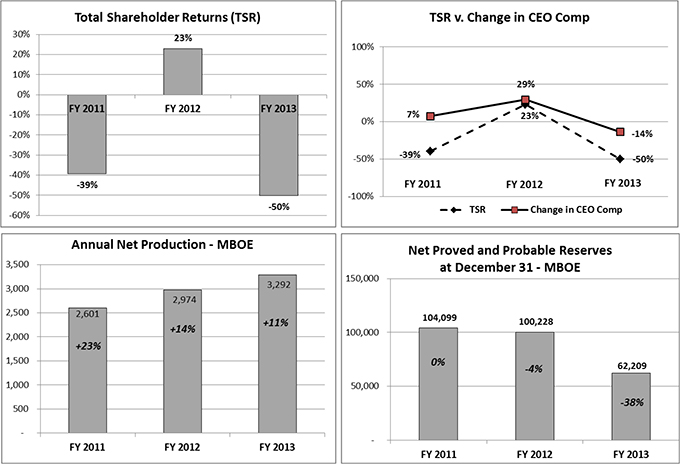
Note: Net proved and probable reserves on December 31, 2013 reflect the sale on December 16, 2013 to Petroandina Resources of 11.6% of our 32.0% interest in Petrodelta, resulting in a year-end interest of 20.4%.
The Human Resources Committee (“Committee”) of the Board of Directors has the discretion to exercise their judgment in weighing the achievement of specific performance measures. For 2013, it considered total shareholder return, reserves, social responsibility/governance and safety as well as strategic individual objectives for the named executive officers. Total shareholder return was down 50.2%. Proved and probable reserves were down 38% from the prior year, which reflects the sale on December 16, 2013 to Petroandina Resources of 11.6% of our 32.0% interest in Petrodelta. We calculate TSR as year-end share price minus beginning year share price divided by beginning year share price. Annual net production in 2013 was up approximately 10.7% over the prior year. There were no Foreign Corrupt Practices Act (FCPA) incidents in 2013, and the Company was accident free in 2013.
Compensation Philosophy
Our compensation philosophy is to offer a competitive total compensation package to enable us to attract, motivate and retain key executives. Our compensation objectives include:
| • | Offering total compensation that is competitive with the select peer group of globally-focused oil and gas companies with which we compete for executive talent; |
| • | Providing annual cash incentive awards that take into account performance factors weighted by both corporate and individual goals; |
| • | Aligning the interest of executive officers and directors with stockholder value creation by providing significant equity based long-term incentives. |
9
Table of Contents
The Committee oversees the development and execution of our compensation program. The Committee annually reviews our compensation philosophy and tests its ability to promote meeting the objectives stated above. The Committee recommends compensation for the named executive officers, short-term cash bonuses, long-term cash and non-cash compensation, and submits its recommendations to the Board of Directors for approval. Three independent directors comprise the Committee. The Committee meets as needed, but no less than quarterly to review compensation and benefit programs with management. It subsequently approves any changes. Our Human Resources, Accounting and Legal Department employees handle the day-to-day design and administration of employee compensation and benefit programs available to our employees.
Say-on-Pay Results
We hold our Say-on-Pay vote every other year. At our June 27, 2013 annual stockholders meeting, Harvest received strong support for the 2013 compensation program from over 95% of the stockholders who voted.
Setting Executive Compensation
Our compensation program consists of several forms of compensation: base salary, annual performance based incentive awards, long-term incentives and personal benefits. Base salary and annual performance based incentive awards are generally cash-based. Long-term incentives typically consist of stock options, stock appreciation rights, restricted stock units and/or restricted stock awards. The Committee reviews the compensation recommendations from the CEO and our independent consultants’ advice on competitive trends regarding base salary, annual incentive awards and long-term incentives. The Committee exercises its collective judgment in establishing executive compensation based on performance, compensation history and market information. The recommendations are then made to the full Board of Directors for its approval.
The Role of the Compensation Consultant —Compensation Consultant Independence
In 2013, the Committee again engaged Frost Human Resource Consulting, as the Committee’s independent compensation consultant, to benchmark our executive officer compensation levels with similar positions in our industry peer group. The Committee reviews the relationship annually for any conflicts of interest. To ensure Frost HR Consulting’s independence:
| • | The Committee directly retained and has the authority to terminate Frost HR Consulting. |
| • | Frost HR Consulting reports directly to the Committee and its Chairperson. |
| • | Frost HR Consulting meets regularly in executive sessions with the Committee. |
| • | Frost HR Consulting has direct access to all members of the Committee during and between meetings. |
| • | Interactions between Frost HR Consulting and management generally are limited to data gathering and discussions regarding information which has or will be presented to the Committee. |
| • | Frost HR Consulting has procedures in place to prevent conflicts of interest. |
| • | Frost HR Consulting does not have any business or personal relationship with any member of management or the committee. |
| • | Frost HR Consulting consultants do not own any of our company stock. |
Peer Group and Compensation Surveys
The Committee considers market information from compensation surveys and peer company proxy statements when determining compensation for each of the executive officers. In February 2013, the Committee reviewed proxy statement data from a peer group of companies. The surveys used for benchmarking included:
10
Table of Contents
| • | Towers Watson 2012 Top Management Compensation Survey |
| • | William M. Mercer 2012 Energy Industry Compensation Survey |
| • | Effective Compensation Inc.’s (“ECI”) 2012 Oil and Gas Industry Compensation Survey |
Each year, the Committee reviews the composition of the peer group and the compensation paid at these companies, as well as their corporate performance and other comparative factors in determining the appropriate compensation levels for our executives. No company in our peer group shares our unique risk profile, which is a function of our portfolio of producing assets and exploratory prospects as well as the regulatory and political environments in which we operate. Therefore the Committee uses its judgment and business experience in addition to the peer group data in determining executive compensation.
The Committee selects peer companies for their shared similarities, including a common industry oil exploration focus, assets, market capitalization and enterprise value, among other factors. Revenue at the peer companies ranges from $36.6 million to $423.6 million for 2013 versus approximately $280 million for Harvest which is our interest of net revenue from oil sales in our unconsolidated affiliate, Petrodelta, S.A. Our peer companies typically compete with us for executive talent. Our current industry peer group consists of the following companies:
| • BPZ Resources, Inc. |
• Gulfport Energy, Corp. | |
| • Carrizo Oil and Gas Inc. |
• Halcón Resources, LLC | |
| • Contango Oil & Gas Co. |
• PDC Energy Inc. | |
| • Endeavour International Corp. |
• PetroQuest Energy, Inc. | |
| • EPL Oil & Gas Inc. |
• VAALCO Energy, Inc. | |
| • FX Energy, Inc. |
• ZaZa Energy Corp. | |
| • Gastar Exploration Ltd. |
||
For 2013, Frost HR Consulting benchmarked the 25th, 50th and 75th percentiles for the data sources mentioned above to provide the Committee with an understanding of competitive pay practices. These surveys, equally weighted with the proxy data, consider each element of compensation and are collectively referred to as the “market data” throughout this Compensation Discussion and Analysis. Frost HR Consulting also provides the Committee with advice on equity incentive compensation trends, including types and value of awards being used by other public companies.
The Role of the Executives in Human Resources Committee Meetings
The Committee invites our CEO, Vice President, Administration and Human Resources and Vice President, General Counsel and Corporate Secretary to attend their meetings. The Vice President, Administration and Human Resources acts as the Committee Secretary and provides reports on plan administration and human resources policies and programs. The Vice President, General Counsel and Corporate Secretary provides legal advice on human resource matters. The CEO makes recommendations with respect to specific compensation decisions. The Committee, without management present, regularly meets in executive session and with its compensation consultant to review executive compensation matters including market data as well as peer group information.
The CEO makes detailed recommendations to the Committee on performance evaluations, base salary changes, and both equity and annual incentive based compensation for executive officers and senior management (other than the CEO). From time to time, the CEO and members of management are invited to participate in Committee meetings to provide information regarding our strategic objectives, financial performance and recommendations regarding compensation plans. Management may be asked to prepare information for any Committee meeting. Depending on the agenda for a particular meeting, these materials may include:
11
Table of Contents
| • | Reports on our strategic objectives; |
| • | Financial reports; |
| • | Reports on achievement of individual and corporate performance objectives; |
| • | Information regarding compensation programs and compensation levels for executive officers, directors and other employees at peer companies; |
| • | Information on the total compensation of the executive officers, including base salary, cash incentives, equity awards, and other compensation, and any amounts payable to the executive officers upon voluntary or involuntary termination, or following a severance with or without a change in control; and |
| • | Information regarding all annual and equity incentive based compensation, and health and welfare plans. |
12
Table of Contents
Executive Compensation Components
Our compensation program components are designed to reward executive officers’ contributions, while considering our specific operating situation and how they manage this situation consistent with our strategy. Factors considered in compensating our executives include individual experience, skill sets that are required for multi-national oil and gas operations and their proven record of performance. It is essential that we recruit and retain executives that understand the risk and complexity of global operations and our unique business strategy. All of our executive officers are mid-to-late career executives, who have worked for larger energy companies and have alternatives, only they decided to join the Company for the challenge and potential reward of working for a small, entrepreneurial organization.
The principal components of compensation and their purpose for executive officers in are:
| Element |
Form of Compensation |
Purpose | ||
| Base salary | Cash | Provide competitive, fixed compensation to attract and retain executive talent | ||
| Annual performance based incentive awards | Cash | Create strong financial incentive for achieving financial and strategic successes | ||
| Long-term incentive compensation | Stock Options, Stock Appreciation Rights (SARs), Restricted Stock Units (RSU) and Restricted Stock Grants | Provides alignment between executive and shareholder interests by rewarding executives for performance based on appreciation in the Company’s share price and for retaining executives | ||
| Personal benefits | Eligibility to participate in plans extends to all employees | Broad-based employee benefits for health and welfare and retirement |
Base Salary
We pay base salaries to our executive officers to compensate them for specific job responsibilities during the calendar year. In determining base salaries for our executive officers, the Committee considers market and competitive benchmark data for the executive’s level of responsibility targeting between the 50th and 75th percentile of executive officers in comparable companies, with variation based on individual executive skill sets. Compared to 2012 market data, our base salaries were between 89.5% and 99.8% of the target market median.
In March 2014, the CEO and the other named executive officers received an annualized salary increase of 3.0%.
| Base Salary-Annualized |
Edmiston | Speirs | Haynes | Nesselrode | Head | |||||||||||||||
| 2013 |
$ | 570,000 | $ | 360,000 | $ | 305,000 | $ | 280,000 | $ | 275,000 | ||||||||||
| 2014 |
$ | 588,000 | $ | 370,000 | $ | 314,000 | $ | 289,000 | $ | 283,000 | ||||||||||
Annual Performance-Based Incentive Awards (Bonus)
Each year, in addition to individual performance objectives, the Committee establishes Company performance measures for determining annual incentive awards as follows:
| • | Total Shareholder Return (weight 60%) |
| • | Reserve Additions/Production/Estimated Market Value (EMV) (weight 30%) |
| • | Social Responsibility and Governance (including safety) (weight 10%) |
13
Table of Contents
These measures and their weightings are reviewed and modified, if appropriate, in light of changing Company priorities and strategic objectives. The corporate targets and weightings are recommended by the CEO and reviewed and approved by the Human Resources Committee. The Committee focuses on these corporate goals in evaluating Company performance for the purpose of compensation. Individual performance results of the named executive officers are measured and assessed by the CEO.
Among these corporate goals, total shareholder return was weighted at 60%. The Company realized a total shareholder return of negative 50.2%, due primarily to the termination of the sale of Venezuela to PT Pertamina.
Reserves/Production/Estimated Market Value (EMV) was weighted at 30%. The primary measurement for this target is year over year 2P reserve additions; although 3P and contingent resources are also taken into consideration. Proved and probable reserves declined by approximately 3%, excluding the effects of the sale to Petroandina. However, production increased by approximately 10.7% over 2012 at Petrodelta, our Venezuela affiliate.
Social Responsibility and Governance was weighted at 10% and is used at the discretion of the Committee in deciding the final corporate rating. As expected, there were no violations of our FCPA and Ethics and Business Conduct policies and the Company was accident free in 2013.
Individual performance and operational results were combined with the Company performance results and weighted equally to determine each executive’s final annual incentive award. Target award levels for annual incentives are set at 100 percent of base salary for the CEO and 60 percent of base salary for the other named executive officers. For 2013 performance, awarded in February 2014, the CEO and the other named executive officer’s individual awards were 70% of their bonus targets.
We believe the Company should have the ability to recover compensation paid to executive officers and key employees under certain circumstances. On May 20, 2010, our stockholders approved the 2010 Long-Term Incentive Plan (the “2010 Plan”). This 2010 Plan allows us to recover any award which the Company deems was not warranted after any restatement of corporate performance.
Long-Term Incentive Compensation
Long-term incentive awards have been granted under our 2001, 2004, 2006 and 2010 Long Term Incentive Plans (“LTIPs”) and the awards are granted to our executive officers to align their personal financial interests with our stockholders. The LTIPs include provisions for stock options, stock appreciation rights, restricted stock, restricted stock units and cash awards.
Our policy on stock awards is focused on determining the right mix of retention and ownership requirements to drive and motivate our executive officers’ behavior consistent with long-term interests of stockholders. The Committee is the administrator of our LTIPs and, subject to Board of Director approval, has full power to determine the size of awards to our executives, to determine the terms and conditions of grants in a manner consistent with the LTIPs, and to amend the terms and conditions of any outstanding award.
The CEO presents individual stock award recommendations for executive officers to the Committee, and after review and discussion the Committee submits their recommendation to the Board of Directors for approval. The Committee’s policy is to grant awards on the date the Board of Directors approves them. Stock options and restricted stock will be granted once each calendar year on a predetermined date or at the effective date of a new hire or promotion, but not within six months of a previous award to the same individual. The price of options and the value of a restricted stock award issued to a new employee will be set at the closing price on the employee’s effective start date. The price of options and the value of a restricted stock award issued to an employee as a result of a promotion will be set at the closing price on the effective date of that promotion. Under no circumstances will a grant date be set retroactively.
14
Table of Contents
The Board of Directors has adopted stock retention guidelines as an additional means to promote ownership of stock by executive officers and directors. The guidelines apply to any award of restricted stock or options to purchase our stock granted to executive officers and directors after February 2004. Under these guidelines, an executive officer or director must retain at least 50 percent of the shares of restricted stock for at least three years after the restriction lapses. Consequences for failure to adhere to these guidelines shall be determined by the Committee in its discretion including, without limitation, actions with respect to future compensation, and future grants of stock options or restricted stock and performance measures. Under our Insider Trading Policy, executive officers and directors are strictly prohibited from speculative trading including short sales and buying or selling puts or calls on the Company’s securities.
The long-term incentive awards for 2013 included stock options, stock appreciation rights (SARs) which can be settled as cash or equity and restricted stock units which can be settled as cash or equity. This mix provides upside potential with the stock options/SARs and a more stable award in the form of restricted stock units. Of the total award value 80 percent was allocated to options/SARs and 20 percent to restricted shares.
As of April 30, 2014, the total shares available for grant as options under the LTIPs approved by our stockholders are as follows:
| Total available for grant as options |
686,000 | |||
|
|
|
|||
| Total available for grants as restricted stock |
16,000 | |||
|
|
|
Personal Benefits
Our executive officers are covered under the same health and welfare and retirement plans, including our 401(k) plan, as all employees. The executive officers also receive supplemental life insurance to cover the risks of extensive travel required in conducting our global business. We pay 100 percent of all premiums for the following benefits for employees and their eligible dependents:
| • | All employees are entitled to a medical benefit with unlimited maximum lifetime benefits, with an annual out-of-pocket deductible of $3,000 per individual and $9,000 per family. |
| • | Life and accidental death and dismemberment (“AD&D”) insurance equal to two times annual salary with a minimum of $200,000 and a cap of $300,000 (or $400,000 with evidence of insurability), and additional coverage equal to five times annual salary ($1.0 million maximum) while traveling outside their home country on Company business. |
| • | Long-term disability benefits provide a monthly benefit of 60 percent of base salary up to a maximum of $10,000 per month. |
| • | Participation in our Statutory Profit Sharing Plan 401(k). Eligibility is effective the first day of the month following the date of hire. We use a safe harbor matching formula for Company contributions (dollar for dollar match up to 3 percent of pay, $0.50 for every dollar on the next 2 percent of pay subject to the statutory maximum salary limits). Participant and Company contributions are 100 percent vested from the date of contribution. At termination of employment, employees are eligible to receive their account balance in a lump sum. |
| • | All employees and their dependents receive annual dental and vision care benefits of $1,500 and $250, respectively, per employee and dependent. |
We do not offer a pension plan or a non-qualified deferred compensation plan for executive officers or employees. In 2013, we did not offer perquisites to executive officers or other employees. We offer relocation and foreign service premiums to employees serving in an international location. The amount of the premium will vary depending upon the living conditions, political situation and general safety conditions of the international location. Expatriate employees are also provided housing and utilities allowances where applicable. They also receive a cost of living allowance to cover the differential between normal living expenses in the host and home countries, and will continue to participate in the employee benefit plans available to home country employees.
15
Table of Contents
Total Direct Compensation
Executive Compensation Compared to Market Data
Compared to 2012 market data, total direct compensation ranged between 58% and 86% of the target market median for all named executive officers. In 2013, their compensation (after their March 2013 base salary increases) fell at the following percentiles:
| 2013 Actual Compensation in Relationship to 2012 |
CEO |
Other Named Executive Officers | ||
| Base Salary | 47th Percentile | 45th to 50th percentile | ||
| Actual Total Cash | 58th Percentile | 47th to 61st percentile | ||
| Actual Total Direct Compensation | 57th Percentile | 49sth to 57th percentile |
Executive Compensation Mix
The general mix of compensation for target-level performances in the annual incentive plan, plus the net annualized present value of long-term compensation grants, can range as follows, depending upon the executive officer. The Committee considered the following general percentage mix in establishing the total compensation for the Company’s executive officers for 2013 target performance. It is important to note that the influences on Company financial performance and stock price performance could significantly change the basic mix of compensation components as a percentage of actual total compensation:
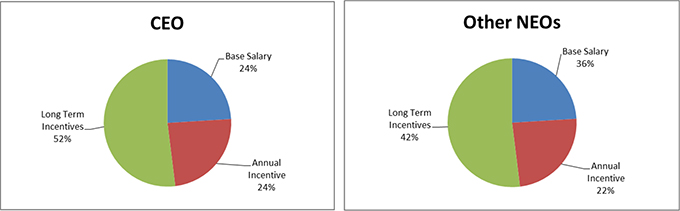
For the CEO, 76 percent of his total direct compensation is considered “at-risk”. The other named executive officers have 63.8 percent of their total direct compensation at risk.
Tax and Accounting Implications of Executive Compensation
Deductibility of Executive Compensation
As part of its role, the Committee reviews and considers the deductibility of executive compensation under Section 162(m) of the Internal Revenue Code of 1986 which imposes a limit of $1.0 million on the amount that a publicly-held corporation may deduct in any year for the compensation paid or accrued with respect to its named executive officers unless the compensation is performance based. None of our executive officers currently receives compensation exceeding the limits imposed by Section 162(m). While we cannot predict with certainty how executive compensation might be affected in the future by Section 162(m) or applicable tax regulations issued, we may attempt to preserve the tax deductibility of all executive compensation while maintaining our executive compensation program as described in this discussion and analysis.
16
Table of Contents
Employment Agreements
We have entered into Executive Employment Agreements with our current named executive officers; Messrs. Edmiston, Haynes, Speirs, Nesselrode and Head. The contracts have an initial term, which automatically extends for one year upon each anniversary unless a one-year notice not to extend is given by the executive. The current term of the employment agreements is through May 31, 2014.
| Entitlements based on Terms in Executive Agreements if we terminate the employment |
Edmiston |
Haynes |
Speirs |
Nesselrode |
Head | |||||
| A lump sum amount equal to a certain multiple of base salary | 3 times | 2 times | 2 times | 2 times | 2 times | |||||
| An amount equal to a certain number of years times the maximum annual employer contributions made under out 401(k) plan | 3 years | 2 years | 2 years | 2 years | 2 years | |||||
| Vesting of all stock options and SARs | Yes | Yes | Yes | Yes | Yes | |||||
| Vesting of all restricted stock awards and RSUs | Yes | Yes | Yes | Yes | Yes | |||||
| Reimbursement of Outplacement Services | Yes | Yes | Yes | Yes | Yes | |||||
| Restrictions on ability to compete with our company after termination of employment | 2 years | 2 years | 2 years | 2 years | 2 years | |||||
See the table titled “Potential Payments under Termination or Change of Control” for details on the above information.
The Committee believes the termination payment included in these employment agreements is needed to attract and retain the executives necessary to achieve our business objectives. However, the Committee also believes termination payments should not be guaranteed. Accordingly, a termination payment will not be paid if a termination occurs after notice and lapse of the notice period to terminate the employment agreement. Also, a termination payment will not be made if the executive officer resigns other than for good reason. Good reason under the employment contracts includes: (1) a material breach of the employment agreement by the Company; (2) failure to maintain or reelect the executive officer to his position; (3) a significant reduction of the executive officer’s duties, position or responsibilities; (4) a substantial reduction, without good business reasons, of the facilities and perquisites available to the executive officer; (5) a reduction by the Company of the executive officer’s monthly base salary; (6) failure of the Company to continue the executive officer’s participation in any bonus, incentive, profit sharing, performance, savings, retirement or pension policy, plan, program or arrangement on substantially the same or better basis relative to other participants; or (7) the relocation of the executive officer more than fifty miles from the location of the Company’s principal office.
17
Table of Contents
Change of Control
Since it is in our best interest to retain executive officers during uncertain times who will act in the best interests of the stockholders without concern for personal outcome, our Executive Employment Agreements provide benefits in the event of loss of employment for employees in good standing due to a change of control. Change of control is defined as the acquisition of 50 percent or more of our voting stock, the cessation of the incumbent board of directors to constitute a majority of the board of directors, or, in certain circumstances, the reorganization, merger, or sale or disposition of at least 50 percent of our assets. Change of control severance benefits apply to terminations taking place between 240 days before a change of control and 730 days after a change of control.
| Entitlements based on Terms in Executive Agreements if we terminate the employment |
Edmiston |
Haynes |
Speirs |
Nesselrode |
Head | |||||
| A lump sum amount equal to a certain multiple of base salary | 3 times | 2 times | 2 times | 2 times | 2 times | |||||
| A lump sum amount equal to a certain multiple of the highest annual bonus over the past 3 years or target bonus, whichever is higher | 3 times | 2 times | 2 times | 2 times | 2 times | |||||
| An amount equal to a certain number of years times the maximum annual employer contributions made under out 401(k) plan | 3 years | 2 years | 2 years | 2 years | 2 years | |||||
| Continuation of accident, life, disability, dental and health benefits for a certain number of years | 3 years | 2 years | 2 years | 2 years | 2 years | |||||
| Excise tax reimbursement and gross up on the reimbursement | Yes | Yes | Yes | Yes | Yes | |||||
| Vesting of all stock options and SARs | Yes | Yes | Yes | Yes | Yes | |||||
| Vesting of all restricted stock awards and RSUs | Yes | Yes | Yes | Yes | Yes | |||||
| Reimbursement of Outplacement Services | Yes | Yes | Yes | Yes | Yes | |||||
| Restrictions on ability to compete with our company after termination of employment | 2 years | 2 years | 2 years | 2 years | 2 years | |||||
The change of control benefits in the employment agreements contain a double trigger in that both a change of control must occur and the executive officer must be terminated without cause or resign for good reason within a specified period of time after the change of control. The Committee believes that the double trigger avoids unnecessarily rewarding an executive officer when a change of control occurs and the executive officer’s status is not changed as a result. However, because of the significant uncertainty that can arise during a period of a potential or actual change of control, the Committee has provided greater benefits to the executive officer in the event of a termination resulting from a change of control. Change of control benefits are detailed in the “Potential Payments under Termination or Change of Control” table in the Compensation of Executive Officers section.
18
Table of Contents
HUMAN RESOURCES COMMITTEE REPORT
The Human Resources Committee has reviewed and discussed with management the Compensation Discussion and Analysis filed in this document. Based on such review and discussions, the Human Resources Committee recommended to the Board of Directors that the Compensation Discussion and Analysis be included in this report on Form 10-K/A.
R. E. Irelan, Committee Chairman
Igor Effimoff
J. Michael Stinson
19
Table of Contents
COMPENSATION OF EXECUTIVE OFFICERS
Summary Compensation Table
The following table summarizes the compensation of the Company’s named executive officers for the three most recently completed fiscal years ended December 31, 2013, 2012 and 2011.
| Name & Principal Position |
Year | Salary | Bonus (1) |
Stock Awards ($) (2) |
Option Awards ($) (2) |
Non-Equity Incentive Plan Compensation (3) |
All Other Compensation ($) (4) |
Total | ||||||||||||||||||||||||
| James A. Edmiston |
2013 | $ | 566,154 | $ | 399,000 | 115,200 | $ | 1,117,719 | $ | 125,580 | $ | 18,149 | $ | 2,341,802 | ||||||||||||||||||
| 2012 | 548,077 | 750,750 | — | 349,175 | 1,052,982 | 17,965 | 2,718,949 | |||||||||||||||||||||||||
| 2011 | 507,000 | 413,100 | 326,748 | 637,382 | — | 217,835 | 2,102,065 | |||||||||||||||||||||||||
| Stephen C. Haynes |
2013 | 303,077 | 128,100 | 33,600 | 320,633 | 35,490 | 18,923 | 839,823 | ||||||||||||||||||||||||
| 2012 | 292,885 | 241,605 | — | 99,380 | 298,393 | 18,331 | 950,594 | |||||||||||||||||||||||||
| 2011 | 278,077 | 120,700 | 146,589 | 285,203 | — | 14,148 | 844,717 | |||||||||||||||||||||||||
| Robert Speirs |
2013 | 357,500 | 151,200 | 38,400 | 377,567 | 43,680 | 385,363 | 1,353,710 | ||||||||||||||||||||||||
| 2012 | 343,333 | 296,010 | — | 115,496 | 351,446 | 365,319 | 1,471,604 | |||||||||||||||||||||||||
| 2011 | 326,667 | 149,494 | 189,111 | 370,039 | — | 350,128 | 1,385,439 | |||||||||||||||||||||||||
| Karl L. Nesselrode |
2013 | 278,077 | 117,600 | 33,600 | 293,663 | 32,760 | 17,898 | 773,598 | ||||||||||||||||||||||||
| 2012 | 267,692 | 221,130 | — | 91,323 | 273,347 | 17,714 | 871,206 | |||||||||||||||||||||||||
| 2011 | 254,615 | 115,133 | 135,399 | 264,553 | — | 214,791 | 984,491 | |||||||||||||||||||||||||
| Keith L. Head |
2013 | 273,077 | 115,500 | 33,600 | 287,670 | 32,760 | 20,368 | 762,975 | ||||||||||||||||||||||||
| 2012 | 262,115 | 206,700 | — | 91,323 | 265,944 | 20,184 | 846,266 | |||||||||||||||||||||||||
| 2011 | 246,192 | 106,250 | 87,282 | 170,229 | — | 40,083 | 650,036 | |||||||||||||||||||||||||
Notes:
| (1) | Harvest pays bonuses one year in arrears but reflects the bonus in the table above in the year to which it related. Bonuses related to 2011 were paid February 24, 2012 and are reflected in the schedule above as 2011 bonuses. Bonuses related to 2012 were paid March 1, 2013 and are reflected in the schedule above as 2012 bonuses. Bonuses related to 2013 were paid February 28, 2014 and are reflected in the schedule above as 2013 bonuses. |
| (2) | Harvest uses the Black-Scholes option pricing model to determine the value of each option grant on the date of grant. Harvest does not advocate or necessarily agree that the Black-Scholes option pricing model can properly determine the value of an option. The 2013 calculations for the named officers are based on a weighted average expected life of five years, expected volatility of 79.42%, risk free interest rate of 1.345%, expected dividend yield of 0% and expected annual forfeitures of 1.15% for stock options and 0% for restricted stock. |
| (3) | In May 2012, Harvest issued stock appreciation rights (“SAR”) and restricted stock units (“RSU”) as long-term incentive compensation. In July 2013, Harvest issued additional SAR’s for long-term incentive compensation. These instruments can be settled in cash or equity. Currently, no plan has been approved by the shareholders for equity settlement and Harvest is recording the liability and expense associated with the awards based on the fair market value of the stock. |
20
Table of Contents
4. Detail of all other compensation paid:
| Name and Principal |
Year | Group Term Life |
Company 401(K) Match |
Other Non-Cash |
Special Accomplishment Bonus |
Severance | Foreign Housing and Living Expense |
Cost of Living Adjustment |
Vacation Allowance |
Transportation Allowance |
Foreign Service Premium |
Foreign Taxes |
Total ($) | |||||||||||||||||||||||||||||||||||||
| James A. Edmiston |
2013 | $ | 7,949 | $ | 10,200 | $ | — | $ | — | $ | — | $ | — | $ | — | $ | — | $ | 18,149 | |||||||||||||||||||||||||||||||
| 2012 | $ | 7,965 | $ | 10,000 | $ | — | $ | — | $ | — | $ | — | $ | — | $ | — | $ | 17,965 | ||||||||||||||||||||||||||||||||
| 2011 | $ | 8,035 | $ | 9,800 | $ | — | $ | 200,000 | $ | — | $ | — | $ | — | $ | — | $ | — | $ | — | $ | 217,835 | ||||||||||||||||||||||||||||
| Stephen C. Haynes |
2013 | $ | 8,723 | $ | 10,200 | $ | — | $ | — | $ | — | $ | — | $ | — | $ | — | $ | 18,923 | |||||||||||||||||||||||||||||||
| 2012 | $ | 8,331 | $ | 10,000 | $ | — | $ | — | $ | — | $ | — | $ | — | $ | — | $ | 18,331 | ||||||||||||||||||||||||||||||||
| 2011 | $ | 4,348 | $ | 9,800 | $ | — | $ | — | $ | — | $ | — | $ | — | $ | — | $ | — | $ | — | $ | 14,148 | ||||||||||||||||||||||||||||
| Robert Speirs |
2013 | $ | 1,290 | $ | 175,242 | $ | 93,894 | $ | 48,276 | $ | 34,000 | $ | 28,500 | $ | 4,161 | $ | 385,363 | |||||||||||||||||||||||||||||||||
| 2012 | $ | 1,290 | $ | 157,699 | $ | 81,041 | $ | 43,795 | $ | 34,000 | $ | 28,500 | $ | 18,994 | $ | 365,319 | ||||||||||||||||||||||||||||||||||
| 2011 | $ | 1,376 | $ | — | $ | — | $ | — | $ | 173,308 | $ | 81,699 | $ | 40,450 | $ | 34,000 | $ | 28,500 | $ | (9,205 | ) | $ | 350,128 | |||||||||||||||||||||||||||
| Karl L. Nesselrode |
2013 | $ | 7,698 | $ | 10,200 | $ | — | $ | — | $ | — | $ | — | $ | — | $ | — | $ | 17,898 | |||||||||||||||||||||||||||||||
| 2012 | $ | 7,714 | $ | 10,000 | $ | — | $ | — | $ | — | $ | — | $ | — | $ | — | $ | 17,714 | ||||||||||||||||||||||||||||||||
| 2011 | $ | 4,037 | $ | 9,800 | $ | — | $ | 100,000 | $ | — | $ | — | $ | — | $ | — | $ | — | $ | 100,954 | $ | 214,791 | ||||||||||||||||||||||||||||
| Keith L. Head |
2013 | $ | 10,168 | $ | 10,200 | $ | — | $ | — | $ | — | $ | — | $ | — | $ | — | $ | 20,368 | |||||||||||||||||||||||||||||||
| 2012 | $ | 10,184 | $ | 10,000 | $ | — | $ | — | $ | — | $ | — | $ | — | $ | — | $ | 20,184 | ||||||||||||||||||||||||||||||||
| 2011 | $ | 5,283 | $ | 9,800 | $ | — | $ | 25,000 | $ | — | $ | — | $ | — | $ | — | $ | — | $ | — | $ | 40,083 | ||||||||||||||||||||||||||||
Grants of Plan-Based Awards
The following table shows information concerning options to purchase Common Stock granted to each of the named executive officers during 2013.
| Name |
Grant Date |
All Other Stock Awards: Number of Shares of Stock or Units |
All Other Option Awards: Number of Securities Underlying Options(1) |
Exercise or Base Price of Option Awards |
Fair Value of Stock Based Awards |
|||||||||||||||
| (#) | (#) | ($/Sh) | ($)(2) | |||||||||||||||||
| James A. Edmiston |
|
07/18/2013 07/18/2013 |
|
24,000 | 373,000 | $ | 4.80 |
|
1,117,719 115,200 |
| ||||||||||
| Stephen C. Haynes |
|
07/18/2013 07/18/2013 |
|
7,000 | 107,000 | $ | 4.80 |
|
320,633 33,600 |
| ||||||||||
| Robert Speirs |
|
07/18/2013 07/18/2013 |
|
8,000 | 126,000 | $ | 4.80 |
|
377,567 38,400 |
| ||||||||||
| Karl L. Nesselrode |
|
07/18/2013 07/18/2013 |
|
7,000 | 98,000 | $ | 4.80 |
|
293,663 33,600 |
| ||||||||||
| Keith L. Head |
|
07/18/2013 07/18/2013 |
|
7,000 | 96,000 | $ | 4.80 |
|
287,670 33,600 |
| ||||||||||
Notes:
| (1) | Options granted July 18, 2013 vest 1/3 each year over a three year period. |
| (2) | Harvest granted options representing 920,004 shares to employees in 2013. |
21
Table of Contents
Outstanding Equity Awards at Fiscal Year End
The following table shows information concerning outstanding equity awards as of December 31, 2013 held by the named executive officers.
| Name |
Option Awards | Stock Awards | ||||||||||||||||||||||||||||||||
| Number of Securities Underlying Unexercised Options (#) |
Equity Incentive Plan Number of Securities Underlying Unexercised Unearned Options |
Option Exercise Price |
Option Expiration |
Number of Shares Or Units of Stock That Have Not Vested |
Market Value of Shares or Units of Stock That Have Not Vested (1) |
Equity Incentive Plan Awards: Number of Unearned Shares, Units or Other Rights That Have Not Vested |
Equity Incentive Plan Awards: Market or Payout Value of Unearned Shares, Units Or Other Rights That Have Not Vested | |||||||||||||||||||||||||||
| Exercisable | Not Exercisable |
(#) | ($) | (Date) | (#) | ($) | (#) | ($) | ||||||||||||||||||||||||||
| James A. Edmiston |
100,000 | $ | 13.585 | 9/1/2014 | ||||||||||||||||||||||||||||||
| 75,000 | $ | 12.795 | 3/4/2015 | |||||||||||||||||||||||||||||||
| 85,000 | $ | 10.800 | 9/15/2015 | |||||||||||||||||||||||||||||||
| 165,000 | $ | 10.800 | 9/15/2015 | |||||||||||||||||||||||||||||||
| 250,000 | (2) | |||||||||||||||||||||||||||||||||
| 17,000 | $ | 9.605 | 3/2/2016 | |||||||||||||||||||||||||||||||
| 24,334 | $ | 9.605 | 3/2/2016 | |||||||||||||||||||||||||||||||
| 250,000 | $ | 9.625 | 2/27/2014 | |||||||||||||||||||||||||||||||
| 120,000 | — | $ | 10.175 | 5/15/2015 | ||||||||||||||||||||||||||||||
| 65,000 | — | $ | 4.595 | 6/18/2016 | ||||||||||||||||||||||||||||||
| 160,900 | — | $ | 7.100 | 5/20/2015 | ||||||||||||||||||||||||||||||
| 76,134 | 38,066 | $ | 11.190 | 5/20/2016 | 29,200 | 130,086 | ||||||||||||||||||||||||||||
| 43,332 | 86,668 | $ | 5.120 | 5/17/2017 | ||||||||||||||||||||||||||||||
| 373,000 | $ | 4.800 | 7/17/2018 | 24,000 | 106,920 | |||||||||||||||||||||||||||||
| Stephen C. Haynes |
50,000 | — | $ | 10.245 | 5/19/2015 | |||||||||||||||||||||||||||||
| 12,000 | — | $ | 4.595 | 6/18/2016 | ||||||||||||||||||||||||||||||
| 35,900 | — | $ | 7.100 | 5/20/2015 | ||||||||||||||||||||||||||||||
| 34,067 | 17,033 | $ | 11.190 | 5/20/2016 | 13,100 | 58,361 | ||||||||||||||||||||||||||||
| 12,333 | 24,667 | $ | 5.120 | 5/17/2017 | ||||||||||||||||||||||||||||||
| 107,000 | $ | 4.800 | 7/17/2018 | 7,000 | 31,185 | |||||||||||||||||||||||||||||
| Robert Speirs |
80,000 | — | $ | 13.690 | 6/1/2016 | |||||||||||||||||||||||||||||
| 80,000 | — | $ | 9.625 | 2/27/2014 | ||||||||||||||||||||||||||||||
| 40,000 | — | $ | 10.175 | 5/15/2015 | ||||||||||||||||||||||||||||||
| 12,500 | — | $ | 4.595 | 6/18/2016 | ||||||||||||||||||||||||||||||
| 47,800 | — | $ | 7.100 | 5/20/2015 | ||||||||||||||||||||||||||||||
| 44,200 | 22,100 | $ | 11.190 | 5/20/2016 | 16,900 | 75,290 | ||||||||||||||||||||||||||||
| 14,333 | 28,667 | $ | 5.120 | 5/17/2017 | ||||||||||||||||||||||||||||||
| 126,000 | $ | 4.800 | 7/17/2018 | 8,000 | 35,640 | |||||||||||||||||||||||||||||
| Karl L. Nesselrode |
8,000 | $ | 13.010 | 5/26/2014 | ||||||||||||||||||||||||||||||
| 20,000 | — | $ | 12.795 | 3/4/2015 | ||||||||||||||||||||||||||||||
| 13,334 | — | $ | 9.605 | 3/2/2016 | ||||||||||||||||||||||||||||||
| 70,000 | — | $ | 9.625 | 2/27/2014 | ||||||||||||||||||||||||||||||
| 40,000 | — | $ | 10.175 | 5/15/2015 | ||||||||||||||||||||||||||||||
| 29,900 | — | $ | 7.100 | 5/20/2015 | ||||||||||||||||||||||||||||||
| 31,600 | 15,800 | $ | 11.190 | 5/20/2016 | 12,100 | 53,906 | ||||||||||||||||||||||||||||
| 11,333 | 22,667 | $ | 5.120 | 5/17/2017 | ||||||||||||||||||||||||||||||
| 98,000 | $ | 4.800 | 7/17/2018 | 7,000 | 31,185 | |||||||||||||||||||||||||||||
| Keith L. Head |
50,000 | — | $ | 10.065 | 5/7/2014 | |||||||||||||||||||||||||||||
| 20,000 | — | $ | 10.175 | 5/15/2015 | ||||||||||||||||||||||||||||||
| 18,000 | — | $ | 7.100 | 5/20/2015 | ||||||||||||||||||||||||||||||
| 20,333 | 10,167 | $ | 11.190 | 5/20/2016 | 7,800 | 34,749 | ||||||||||||||||||||||||||||
| 11,333 | 22,667 | $ | 5.120 | 5/17/2017 | ||||||||||||||||||||||||||||||
| 96,000 | $ | 4.800 | 7/17/2018 | 7,000 | 31,185 | |||||||||||||||||||||||||||||
| (1) | The market value of shares is $4.455 per share, based upon the average of the high and low market prices on December 31, 2013. |
| (2) | This stock unit is a right to receive, after vesting, a cash amount equal to the difference between the closing price of the stock on September 15, 2005 and the price of the stock on the date the payment is distributed. Vesting is 1/3 on the last to occur of September 15, 2006 and the date on which the average of the stock price for 10 consecutive trading days is greater than $25 per share. Vesting of 1/3 on September 2007 and 2008 is subject to the same $25 per share condition. |
22
Table of Contents
Options Exercised and Stock Vested
The following table provides information regarding the exercise of stock options and restricted stock vested during 2013 by the named executive officers.
| Name |
Option Awards | Stock Awards | ||||||||||||||
| Number of Shares Acquired on Exercise |
Value Realized on Exercise |
Number of Shares Acquired on Vesting |
Value Realized on Vesting |
|||||||||||||
| James A. Edmiston |
— | — | 46,900 | $ | 142,107 | |||||||||||
| Stephen Haynes |
— | — | 13,200 | $ | 39,996 | |||||||||||
| Robert Speirs |
— | — | 17,500 | $ | 124,250 | |||||||||||
| Karl L. Nesselrode |
— | — | 11,000 | $ | 33,330 | |||||||||||
| Keith L. Head |
— | — | 6,600 | $ | 19,998 | |||||||||||
23
Table of Contents
Potential Payments under Termination or Change of Control
The tables below reflect the additional compensation to the named executive officers of the Company under the terms of their Executive Employment Agreements in the event of termination without cause or without proper notice, termination following change of control, or termination for disability or death. (See Compensation Discussion and Analysis — Employment Agreements and Change of Control above for a description of the terms of the Executive Employment Agreements.) The amounts shown in the tables assume that such termination was effective as of December 31, 2013, and thus include estimated amounts earned through that date that would be paid out to the named executive officers. The actual amounts can only be determined at the time of separation from the Company. Accelerated vesting of stock awards is based on a December 31, 2013 stock price of $4.52.
| Executive Compensation and Benefits- |
Voluntary Termination on 12/31/2013 |
Termination for Good Reason or Involuntary Termination without Cause or Notice on 12/31/2013 |
Termination due to Change in Control on 12/31/2013 |
For Cause Termination on 12/31/2013 |
Death on 12/31/2013 |
Disability on 12/31/2013 |
||||||||||||||||||
| $570,000 |
||||||||||||||||||||||||
| Compensation: |
||||||||||||||||||||||||
| Base Salary |
— | $ | 1,710,000 | $ | 1,710,000 | — | $ | 1,710,000 | $ | 1,710,000 | ||||||||||||||
| Short-term Incentive |
$ | 0 | $ | 0 | $ | 2,252,250 | — | $ | 0 | $ | 0 | |||||||||||||
| Long-term Incentives |
||||||||||||||||||||||||
| Stock Options/SARs (Intrinsic Value) |
— | $ | 0 | $ | 0 | — | $ | 0 | $ | 0 | ||||||||||||||
| Restricted Shares/RSUs |
— | $ | 627,679 | $ | 627,679 | — | $ | 627,679 | $ | 627,679 | ||||||||||||||
| Benefits and Perquisites: |
||||||||||||||||||||||||
| Outplacement |
— | $ | 20,000 | $ | 20,000 | — | — | — | ||||||||||||||||
| Life Insurance Proceeds |
— | — | — | — | $ | 300,000 | — | |||||||||||||||||
| Excise Tax Gross Up |
— | — | $ | 1,573,094 | — | — | — | |||||||||||||||||
| Disability Benefits per year * |
— | — | — | — | — | $ | 120,000 | |||||||||||||||||
| Medical, Dental, Life, Disability and Accident Insurance |
— | — | $ | 96,381 | — | — | — | |||||||||||||||||
| 401(k) employer match |
— | $ | 30,600 | $ | 30,600 | — | $ | 30,600 | $ | 30,600 | ||||||||||||||
|
|
|
|
|
|
|
|
|
|
|
|
|
|||||||||||||
| Total |
$ | 0 | $ | 2,388,279 | $ | 6,310,004 | $ | 0 | $ | 2,668,279 | $ | 2,488,279 | ||||||||||||
|
|
|
|
|
|
|
|
|
|
|
|
|
|||||||||||||
|
* until no longer disabled or Social Security Retirement Age |
|
|||||||||||||||||||||||
| Executive Compensation and Benefits- |
Voluntary Termination on 12/31/2013 |
Termination for Good Reason or Involuntary Termination without Cause or Notice on 12/31/2013 |
Termination due to Change in Control on 12/31/2013 |
For Cause Termination on 12/31/2013 |
Death on 12/31/2013 |
Disability on 12/31/2013 |
||||||||||||||||||
| $305,000 |
||||||||||||||||||||||||
| Compensation: |
||||||||||||||||||||||||
| Base Salary |
— | $ | 610,000 | $ | 610,000 | — | $ | 610,000 | $ | 610,000 | ||||||||||||||
| Short-term Incentive |
— | $ | 0 | $ | 483,210 | — | — | — | ||||||||||||||||
| Long-term Incentives |
||||||||||||||||||||||||
| Stock Options/SARs (Intrinsic Value) |
— | $ | 0 | $ | 0 | — | $ | 0 | $ | 0 | ||||||||||||||
| Restricted Shares/RSUs |
— | $ | 209,882 | $ | 209,882 | — | $ | 209,882 | $ | 209,882 | ||||||||||||||
| Benefits and Perquisites: |
||||||||||||||||||||||||
| Outplacement |
— | $ | 20,000 | $ | 20,000 | — | — | — | ||||||||||||||||
| Life Insurance Proceeds |
— | — | — | — | $ | 300,000 | — | |||||||||||||||||
| Excise Tax Gross Up |
— | — | $ | 0 | — | — | — | |||||||||||||||||
| Disability Benefits per year * |
— | — | — | — | — | $ | 120,000 | |||||||||||||||||
| Medical, Dental, Life, Disability and Accident Insurance |
— | — | $ | 58,876 | — | — | — | |||||||||||||||||
| 401(k) employer match |
— | $ | 20,400 | $ | 20,400 | — | $ | 20,400 | $ | 20,400 | ||||||||||||||
|
|
|
|
|
|
|
|
|
|
|
|
|
|||||||||||||
| Total |
$ | 0 | $ | 860,282 | $ | 1,402,368 | $ | 0 | $ | 1,140,282 | $ | 960,282 | ||||||||||||
|
|
|
|
|
|
|
|
|
|
|
|
|
|||||||||||||
|
* until no longer disabled or Social Security Retirement Age |
|
|||||||||||||||||||||||
24
Table of Contents
| Executive Compensation and Benefits- |
Voluntary Termination on 12/31/2013 |
Termination for Good Reason or Involuntary Termination without Cause or Notice on 12/31/2013 |
Termination due to Change in Control on 12/31/2013 |
For Cause Termination on 12/31/2013 |
Death on 12/31/2013 |
Disability on 12/31/2013 |
||||||||||||||||||
| $360,000 |
||||||||||||||||||||||||
| Compensation: |
||||||||||||||||||||||||
| Base Salary |
— | $ | 720,000 | $ | 720,000 | — | $ | 720,000 | $ | 720,000 | ||||||||||||||
| Short-term Incentive |
— | $ | 0 | $ | 592,020 | — | — | — | ||||||||||||||||
| Long-term Incentives |
||||||||||||||||||||||||
| Stock Options/SARs (Intrinsic Value) |
— | $ | 0 | $ | 0 | — | $ | 0 | $ | 0 | ||||||||||||||
| Restricted Shares/RSUs |
— | $ | 254,178 | $ | 254,178 | — | $ | 254,178 | $ | 254,178 | ||||||||||||||
| Benefits and Perquisites: |
||||||||||||||||||||||||
| Outplacement |
— | $ | 20,000 | $ | 20,000 | — | — | — | ||||||||||||||||
| Life Insurance Proceeds |
— | — | — | — | $ | 300,000 | — | |||||||||||||||||
| Excise Tax Gross Up |
— | — | $ | 0 | — | — | — | |||||||||||||||||
| Disability Benefits per year * |
— | — | — | — | — | $ | 120,000 | |||||||||||||||||
| Medical, Dental, Life, Disability and Accident Insurance |
— | — | $ | 53,568 | — | — | — | |||||||||||||||||
| 401(k) employer match |
— | — | — | — | — | — | ||||||||||||||||||
|
|
|
|
|
|
|
|
|
|
|
|
|
|||||||||||||
| Total |
$ | 0 | $ | 994,178 | $ | 1,639,766 | $ | 0 | $ | 1,274,178 | $ | 1,094,178 | ||||||||||||
|
|
|
|
|
|
|
|
|
|
|
|
|
|||||||||||||
| * | until no longer disabled or Social Security Retirement Age |
| Executive Compensation and Benefits-Karl |
Voluntary Termination on 12/31/2013 |
Termination for Good Reason or Involuntary Termination without Cause or Notice on 12/31/2013 |
Termination due to Change in Control on 12/31/2013 |
For Cause Termination on 12/31/2013 |
Death on 12/31/2013 |
Disability on 12/31/2013 |
||||||||||||||||||
| $280,000 |
||||||||||||||||||||||||
| Compensation: |
||||||||||||||||||||||||
| Base Salary |
— | $ | 560,000 | $ | 560,000 | — | $ | 560,000 | $ | 560,000 | ||||||||||||||
| Short-term Incentive |
— | $ | 0 | $ | 442,260 | — | — | — | ||||||||||||||||
| Long-term Incentives |
||||||||||||||||||||||||
| Stock Options/SARs (Intrinsic Value) |
— | $ | 0 | $ | 0 | — | $ | 0 | $ | 0 | ||||||||||||||
| Restricted Shares/RSUs |
— | $ | 211,387 | $ | 211,387 | — | $ | 211,387 | $ | 211,387 | ||||||||||||||
| Benefits and Perquisites: |
||||||||||||||||||||||||
| Outplacement |
— | $ | 20,000 | $ | 20,000 | — | — | — | ||||||||||||||||
| Life Insurance Proceeds |
— | — | — | — | $ | 300,000 | — | |||||||||||||||||
| Excise Tax Gross Up |
— | — | $ | 0 | — | — | — | |||||||||||||||||
| Disability Benefits per year * |
— | — | — | — | — | $ | 120,000 | |||||||||||||||||
| Medical, Dental, Life, Disability and Accident Insurance |
— | — | $ | 61,492 | — | — | — | |||||||||||||||||
| 401(k) employer match |
— | $ | 20,400 | $ | 20,400 | — | $ | 20,400 | $ | 20,400 | ||||||||||||||
|
|
|
|
|
|
|
|
|
|
|
|
|
|||||||||||||
| Total |
$ | 0 | $ | 811,787 | $ | 1,315,539 | $ | 0 | $ | 1,091,787 | $ | 911,787 | ||||||||||||
|
|
|
|
|
|
|
|
|
|
|
|
|
|||||||||||||
| * | until no longer disabled or Social Security Retirement Age |
25
Table of Contents
| Executive Compensation and Benefits-Keith Head |
Voluntary Termination on 12/31/2013 |
Termination for Good Reason or Involuntary Termination without Cause or Notice on 12/31/2013 |
Termination due to Change in Control on 12/31/2013 |
For Cause Termination on 12/31/2013 |
Death on 12/31/2013 |
Disability on 12/31/2013 |
||||||||||||||||||
| $275,000 |
||||||||||||||||||||||||
| Compensation: |
||||||||||||||||||||||||
| Base Salary |
— | $ | 550,000 | $ | 550,000 | — | $ | 550,000 | $ | 550,000 | ||||||||||||||
| Short-term Incentive |
— | $ | 0 | $ | 413,400 | — | — | — | ||||||||||||||||
| Long-term Incentives |
||||||||||||||||||||||||
| Stock Options/SARs (Intrinsic Value) |
— | $ | 0 | $ | 0 | — | $ | 0 | $ | 0 | ||||||||||||||
| Restricted Shares/RSUs |
— | $ | 199,486 | $ | 199,486 | — | $ | 199,486 | $ | 199,486 | ||||||||||||||
| Benefits and Perquisites: |
||||||||||||||||||||||||
| Outplacement |
— | $ | 20,000 | $ | 20,000 | — | — | — | ||||||||||||||||
| Life Insurance Proceeds |
— | — | — | — | $ | 300,000 | — | |||||||||||||||||
| Excise Tax Gross Up |
— | — | $ | 0 | — | — | — | |||||||||||||||||
| Disability Benefits per year * |
— | — | — | — | — | $ | 120,000 | |||||||||||||||||
| Medical, Dental, Life, Disability and Accident Insurance |
— | — | $ | 52,876 | — | — | — | |||||||||||||||||
| 401(k) employer match |
— | $ | 20,400 | $ | 20,400 | — | $ | 20,400 | $ | 20,400 | ||||||||||||||
|
|
|
|
|
|
|
|
|
|
|
|
|
|||||||||||||
| Total |
$ | 0 | $ | 789,886 | $ | 1,256,162 | $ | 0 | $ | 1,069,886 | $ | 889,886 | ||||||||||||
|
|
|
|
|
|
|
|
|
|
|
|
|
|||||||||||||
| * | until no longer disabled or Social Security Retirement Age |
DIRECTOR COMPENSATION
Our philosophy in determining director compensation is to align compensation with the long-term interests of the stockholders, adequately compensate the directors for their time and effort and establish an overall compensation package that will attract and retain qualified directors. In determining overall director compensation, we seek to strike the right balance between the cash and stock components of director compensation. The Board’s policy is that the directors should hold equity ownership in the Company and that a portion of the director fees should consist of Company equity in the form of restricted stock and stock grants. The Board also believes that directors should develop a meaningful equity position over time and has adopted stock retention guidelines applicable to all directors. These guidelines state directors must retain (i) at least 50 percent of the shares of restricted stock granted to them for at least three years after the restriction lapses and (ii) at least 50 percent of the net shares of stock received through the exercise of an option or stock appreciation right must be retained by a director for at least three years after the exercise date.
Our retainer and meeting fee schedule was changed in June 2013. Each non-employee director of the Company received cash compensation as follows:
| • | An annual Board retainer of $80,000, plus travel and related expenses; |
| • | An annual committee retainer of $20,000 for serving as committee chair of the Audit Committee, $15,000 for serving as committee chair of the Human Resources Committee and $10,000 for serving as committee chair of the Nominating and Corporate Governance Committee; and |
| • | A fee of $1,500 per day for attending extraordinary meetings or for additional business, as determined by the Nominating and Corporate Governance Committee. |
Our director compensation includes additional compensation for the non-executive Chairman of the Board in recognition of the significant added responsibilities and time commitments of that position. In addition to his compensation as a director, he receives a retainer of $120,000 a year; this 2013 retainer remained the same as the retainer in 2012, 2011 and 2010.
Under the Harvest Natural Resources 2010 Long Term Incentive Plan, directors are eligible to receive restricted stock, restricted stock units (RSU), stock options and stock appreciation rights (SAR) grants. In July 2013, the Board approved a restricted stock award valued at $80,002 for each director.
26
Table of Contents
The following table sets forth the cash and other compensation paid to the non-employee members of our Board of Directors in 2013.
| Name |
Fees Earned or Paid in Cash ($) |
Stock Awards ($)(5) |
Total ($) | |||||||||
| Stephen D. Chesebro’ |
$ | 234,000 | (1) | $ | 80,002 | $ | 314,002 | |||||
| Igor Effimoff |
107,750 | (2) | 80,002 | 187,752 | ||||||||
| H. H. Hardee |
107,000 | 80,002 | 187,002 | |||||||||
| Robert E. Irelan |
111,500 | (3) | 80,002 | 191,502 | ||||||||
| Patrick M. Murray |
134,500 | (4) | 80,002 | 214,502 | ||||||||
| J. Michael Stinson |
107,000 | 80,002 | 187,002 | |||||||||
| (1) | Includes $4,500 in business meeting fees and $9,000 for travel days. |
| (2) | Includes $750 for business meeting fees. |
| (3) | Includes $1,500 in business meeting fees and $4,500 for travel days. |
| (4) | Includes $1,500 in business meeting fees and $6,000 for travel days. |
| (5) | The amounts included in this column represent the aggregate grant date fair value of the grant of 16,667 deferred shares granted to each of our non-employee directors on July 18, 2013. As of December 31, 2013, each of the non-employee directors had aggregate outstanding deferred shares as follows: Mr. Chesebro’ — 16,667; Dr. Effimoff — 16,667; Mr. Hardee — 16,667; Mr. Irelan — 16,667; Mr. Murray — 16,667; and Mr. Stinson — 16,667. |
HUMAN RESOURCES COMMITTEE INTERLOCKS AND INSIDER PARTICIPATION
None of the members of the Board’s Human Resources Committee is or has been an officer or employee of the Company or has a relationship requiring disclosure under Item 404(a) of SEC Regulation S-K. No executive officer of the Company serves on the compensation committee or serves as a director of another entity where an executive officer of that entity also serves on the Human Resources Committee or on the Board.
27
Table of Contents
Item 12. Security Ownership of Certain Beneficial Owners and Management and Related Stockholder Matters
STOCK OWNERSHIP
Directors and Named Executive Officers
The following table shows the amount of our common stock beneficially owned (unless otherwise indicated) by our directors, each named executive officer and our directors and named executive officers as a group. Except as otherwise indicated, all information is as of April 7, 2014.
The number of shares of our common stock beneficially owned by each director or named executive officer is determined under rules of the SEC, and the information is not necessarily indicative of beneficial ownership for any other purpose. Under such rules, beneficial ownership includes any shares as to which the individual has the sole or shared voting power or investment power and also any shares which the individual has the right to acquire within 60 days after April 7, 2014 through the exercise of stock options or other rights. Unless otherwise indicated, each person has sole investment and voting power (or shares such powers with his spouse) with respect to the shares set forth in the following table.
| Amount and Nature of Beneficial Ownership |
||||||||||||||||
| Name of Beneficial Owner |
Number of Shares Beneficially Owned(1) |
Shares Acquirable Within 60 Days |
Total Beneficial Ownership |
Percent of Shares Outstanding(2)(3) |
||||||||||||
| James A. Edmiston |
367,766 | 969,099 | (4) | 1,336,865 | 2.45 | % | ||||||||||
| Stephen C. Haynes |
71,647 | 225,667 | 297,314 | * | ||||||||||||
| Keith L. Head |
49,293 | 190,666 | 239,959 | * | ||||||||||||
| Karl L. Nesselrode |
69,478 | 237,300 | 306,778 | * | ||||||||||||
| Robert Speirs |
225,483 | 336,600 | 562,083 | 1.10 | % | |||||||||||
| Stephen D. Chesebro’ |
449,521 | 15,000 | 464,521 | 1.10 | % | |||||||||||
| Igor Effimoff |
60,667 | 10,000 | 70,667 | * | ||||||||||||
| H. H. Hardee |
216,450 | 15,000 | 231,450 | * | ||||||||||||
| Robert E. Irelan |
72,667 | 10,000 | 82,667 | * | ||||||||||||
| Patrick M. Murray |
237,521 | 15,000 | 252,521 | * | ||||||||||||
| J. Michael Stinson |
129,667 | 15,000 | 144,667 | * | ||||||||||||
|
|
|
|
|
|
|
|
|
|||||||||
| All current directors and executive officers as a group of eleven persons |
1,950,160 | 1,418,666 | 3,368,826 | 7.74 | % | |||||||||||
| * | Represents less than one percent of our outstanding common stock. |
| (1) | This number does not include common stock that our directors or officers have a right to acquire within 60 days of April 7, 2014. |
| (2) | Percentages are based upon 42,104,038 shares of common stock outstanding on April 7, 2014. |
| (3) | Percentages have been calculated assuming that the vested options have been exercised by the individual for which the percent is being calculated. |
| (4) | Excludes options to purchase 250,000 shares that vest if the average closing price of the common stock equals or exceeds $20 per share for 10 consecutive trading days. |
28
Table of Contents
Certain Beneficial Owners
The following table shows the beneficial owners of more than five percent of the Company’s common stock as of April 7, 2014 based on information available as of that date:
| Name & Address |
Aggregate Number of Shares Beneficially Owned(1) |
Percent of Shares Outstanding(2) |
Report Date |
Source | ||||||||||||
| Glenhill Advisors LLC 600 Fifth Avenue, 11th Floor New York, NY 10020 |
4,364,130 | (3) | 10.37 | % | 2/14/2014 | Sch. 13G/A | (3) | |||||||||
| MSDC Management LP 645 Fifth Avenue, 21st Floor New York, New York 10022 |
4,120,112 | (4) | 9.29 | % | 2/14/2014 | Sch. 13G/A | (4) | |||||||||
| Dimensional Fund Advisors, Inc. Palisades West, Building One 6300 Bee Cave Road Austin, Texas 78746 |
3,146,396 | (5) | 7.47 | % | 2/10/2014 | Sch. 13G/A | ||||||||||
| Caisse de dépôt et placement du Québec 1000 place Jean-Paul Riopelle Montreal (Quebec), H2Z 2B3 |
2,500,000 | 5.94 | % | 2/13/2014 | Sch. 13G/A | |||||||||||
| (1) | The stockholder has sole voting and dispositive power over the shares indicated unless otherwise disclosed. |
| (2) | The Company’s outstanding common shares as of April 7, 2014 were 42,104,038. |
| (3) | In its Schedule 13G/A, Glenhill Advisors LLC and its affiliates reported sole voting power with respect to 3,838,161 shares, shared voting power with respect to 525,969 shares and sole dispositive power with respect to all shares. |
| (4) | In its Schedule 13G/A, MSDC Management LP and its affiliates reported shared voting and dispositive power with respect to all shares. Includes 2,260,877 shares issuable upon the exercise of warrants. |
| (5) | In its Schedule 13G/A, Dimensional Fund Advisors, Inc. and its affiliates reported sole voting power with respect to 3,092,733 shares and sole dispositive power with respect to all shares. |
29
Table of Contents
EQUITY COMPENSATION PLAN INFORMATION
As of December 31, 2013
| Column (a) | Column (b) | Column (c) | Column (d) | |||||||||||||
| # Of Securities To Be Issued Upon Exercise Of Outstanding Options And Rights |
Weighted Average Exercise Price Of Outstanding Options and Rights(3) |
Weighted Average Remaining Life |
# Of Securities Remaining Available For Future Issuance Under Equity Compensation Plans (Excluding Securities Reflected In Column (a)(4) |
|||||||||||||
| Equity compensation plans approved by Security Holders |
4,619,303 | $ | 8.71 | 2.2 | 52,333 | |||||||||||
| Equity compensation plans not approved by Security Holders(1) |
113,333 | $ | 9.78 | 0.9 | — | |||||||||||
| Stock Appreciation Right (SAR)(2) |
1,127,198 | $ | 4.95 | 3.3 | — | |||||||||||
|
|
|
|
|
|||||||||||||
| TOTAL |
5,859,834 | 52,333 | ||||||||||||||
A description of our equity compensation plans is included in our Form 10-K filed March 17, 2014, Part IV, Item 15, Notes to the Consolidated Financial Statements, Note 15 – Stock-Based Compensation and Stock Purchase Plans.
(1) Options were issued to new hire employees as employment inducement grants under a New York Stock Exchange (“NYSE”) exception. These options were granted from 2007 through 2012 between $5.85 and $10.25 and vest ratably over three years from the grant date. At December 31, 2013, a total of 113,333 options were issued and outstanding as inducement grants, which are included in the table above, and all of these options were exercisable. This compensation plan was not approved by security holders.
(2) A SAR is a right to receive on the Exercise Date, after vesting thereof, for each share of stock underlying the SAR with respect to which the SAR is exercised, an amount equal to the excess of (a) the Fair Market Value of one share of the stock on the Exercise Date over (b) 100 percent of the Fair Market Value of one share of the stock determined as of the Grant Date (the SAR Exercise Price). The grant date for the 2009 SARS was June 18, 2009 and the exercise price is $4.595 per share. The 2009 SARs vest one-third each year beginning on June 18, 2012 and expire after seven years on June 18, 2016. The grant date for the 2012 SARS was May 17, 2012 and the exercise price is $5.12 per share. The 2012 SARs vest one-third each year beginning on May 17, 2013 and expire after five years on May 17, 2017. The grant date for the 2013 SARs was July 18, 2013 and the exercise price is $4.80 per share. The 2013 SARs vest one-third each year beginning on July 18, 2014, and expire after five years on July 18, 2018. At the sole discretion of the Company, a SAR may be settled in cash or with shares of the underlying stock from an approved plan that allows the payment of a SAR in the medium of stock. This compensation plan was not approved by security holders.
| (3) | This reflects the weighted average exercise of the stock options and SARs listed in column (a). |
30
Table of Contents
| (4) | Securities remaining available for future issuances from the following plans are: |
| 2001 Long-Term Incentive Plan | 36,000 | Issuable only as Options | ||
| 2004 Long-Term Incentive Plan | 3,000 | Issuable only as Options | ||
| 2010 Long-Term Incentive Plan | 13,383 | Issuable as Options or Full Value Award | ||
|
|
||||
| 52,333 |
In addition to the outstanding options and SARs listed above, there are a total of 314,152 unvested shares of restricted stock awards that were granted under all plans that are outstanding as of December 31, 2013. Of these full value awards, 311,152 shares were granted under equity plans approved by security holders. There were 3,000 unvested shares awarded as inducement grants and not approved by security holders.
A “ stock unit “ is a right to receive on the Payment Date, after vesting thereof, a cash amount equal to the Fair Market Value of one share of the stock on the Payment Date. At December 31, 2013, the Company had 322,338 stock units outstanding. Stock units were granted on June 18, 2009 and vest one-third each year beginning June 18, 2012. Stock units were also granted to employees on May 17, 2012 and vest on May 17, 2015. At the sole discretion of the Company, a stock unit may be settled in cash or with shares of the underlying stock from an approved plan that allows the payment of the stock unit in the medium of stock. This compensation plan was not approved by security holders.
31
Table of Contents
Item 13. Certain Relationships and Related Transactions, and Director Independence
CERTAIN RELATIONSHIPS AND RELATED TRANSACTIONS
Our Code of Business Conduct and Ethics (the “Code”) applies to all of our directors, officers and employees. Under the Code, individuals subject to the Code and their family members must knowingly avoid owning any interest (other than nominal amounts of stock in publicly-traded companies) in any supplier or customer; consulting with, or being an employee of, any customer, lessor, lessee, contractor, supplier or competitor; purchasing from, or selling to us, assets, goods or services; or serving on the board of directors of any customer, lessor, lessee, contractor, supplier or competitor, except where full disclosure of all facts is made known to us in advance to permit us to protect our interests. Each year we require our executive officers to certify their compliance with the Code. Our Audit Committee has oversight compliance responsibilities for the Code. Exceptions to the Code are reported to the Audit Committee. Waivers of the Code for officers and directors may only be granted by the Board and waivers for employees may only be granted by the CEO and reported to the Audit Committee. No waivers of the Code were granted in 2013. In addition to the Code, each year we require our directors and executive officers to disclose in writing certain transactions and relationships and this information is used in preparing this report and the proxy statement and in making independence determinations for directors.
For the purposes of this report, the Company has no transactions to describe pursuant to SEC Regulation S-K Item 404(a).
DIRECTOR INDEPENDENCE
Of our seven directors, six have been affirmatively determined by the Board to be independent, including our non-executive Chairman of the Board. The directors our Board has determined to be independent are Stephen D. Chesebro’, Dr. Igor Effimoff, H. H. Hardee, Robert E. Irelan, Patrick M. Murray and J. Michael Stinson. The Board’s determination of independence is based upon the standards set forth in its Guidelines for Corporate Governance, which may be found under the Corporate Governance section on our website at http://www.harvestnr.com. The Guidelines for Corporate Governance include the New York Stock Exchange independence standards. In making its determination of independence, the Board took into account responses of the directors to questions concerning their employment history, compensation, affiliations and family and other relationships.
32
Table of Contents
Item 14. Principal Accountant Fees and Services
INDEPENDENT REGISTERED PUBLIC ACCOUNTING FIRM
In 2013, UHY LLP (“UHY”) became our independent registered public accounting firm and provided certain tax and consulting services to us. Prior to 2013, PricewaterhouseCoopers LLP (“PricewaterhouseCoopers”) served as our independent registered public accounting firm.
The following is a summary of the fees for professional services rendered by UHY and PricewaterhouseCoopers for each of the years ended December 31, 2013 and December 31, 2012.
Audit Fees. The aggregate fees billed by UHY and PricewaterhouseCoopers for each of the last two fiscal years for professional services rendered in connection with the audit of our annual financial statements and review of financial statements included in our quarterly reports and services that are normally provided by it in connection with statutory and regulatory filings or engagements for the year ending on December 31 were as follows:
| 2013 | 2012 | |||||||||||
| Fees |
UHY | PricewaterhouseCoopers | PricewaterhouseCoopers | |||||||||
| Audit |
$ | 1,219,714 | $ | 345,000 | $ | 3,327,212 | ||||||
| Audit Related |
$ | 162,562 | $ | 155,304 | — | |||||||
| Tax |
$ | 50,834 | — | 32,274 | ||||||||
| All Other |
— | $ | 3,838 | — | ||||||||
| Total |
$ | 1,433,110 | $ | 504,142 | $ | 3,359,486 | ||||||
All of the foregoing fees were approved by the Audit Committee.
Audit Committee Pre-Approval Policies and Procedures. The Audit Committee’s Charter provides that our independent registered public accounting firm may provide only those services pre-approved by the Audit Committee, subject to de minimis exceptions for non-audit services described in the rules and regulations of the SEC, which are subsequently ratified by the Audit Committee prior to completion of the audit. The Audit Committee annually reviews and pre-approves the audit, review, attestation and permitted non-audit services to be provided during the next audit cycle by the independent registered public accounting firm. To the extent practicable, at the same meeting the Audit Committee also reviews and approves a budget for each of such services.
The Audit Committee may delegate to a member(s) the authority to grant pre-approvals under its policy with respect to audit and permitted non-audit services, provided that any such grant of pre-approval shall be reported to the full Audit Committee no later than its next scheduled meeting.
The Audit Committee has concluded that the provision of non-audit services is compatible with maintaining the registered public accounting firm’s independence.
Item 15. Exhibits and Financial Statement Schedules
| (b) | Exhibits. |
| 31.1 | Certification pursuant to Rule 13a-14(a)/15d-14(a) executed by James A. Edmiston, President and Chief Executive Officer. | |
| 31.2 | Certification pursuant to Rule 13a-14(a)/15d-14(a) executed by Stephen C. Haynes, Vice President, Chief Financial Officer and Treasurer. | |
33
Table of Contents
SIGNATURES
Pursuant to the requirements of Section 13 or 15(d) of the Securities Exchange Act of 1934, the registrant has duly caused this Report to be signed on its behalf by the undersigned, thereunto duly authorized.
| HARVEST NATURAL RESOURCES, INC. (Registrant) | ||||||
| Date: April 30, 2014 | By: | /s/ Keith L. Head | ||||
| Keith L. Head | ||||||
| Vice President and General Counsel | ||||||
34