Attached files
| file | filename |
|---|---|
| 8-K - 8-K - IDEX CORP /DE/ | iex-20140423x8k.htm |
| EX-99.2 - EX99.2 - IDEX CORP /DE/ | iex-20140423xex992.htm |
First Quarter Earnings APRIL 23, 2014
AGENDA IDEX Outlook Q1 2014 Financial Performance Q1 2014 Segment Performance • Fluid & Metering • Health & Science • Fire & Safety / Diversified Guidance Update Q&A 1
REPLAY INFORMATION Dial toll–free: 855.859.2056 International: 404.537.3406 Conference ID: #30411379 Log on to: www.idexcorp.com 2
Cautionary Statement Under the Private Securities Litigation Reform Act This presentation and discussion will include forward-looking statements. Our actual performance may differ materially from that indicated or suggested by any such statements. There are a number of factors that could cause those differences, including those presented in our most recent annual report and other company filings with the SEC. 3
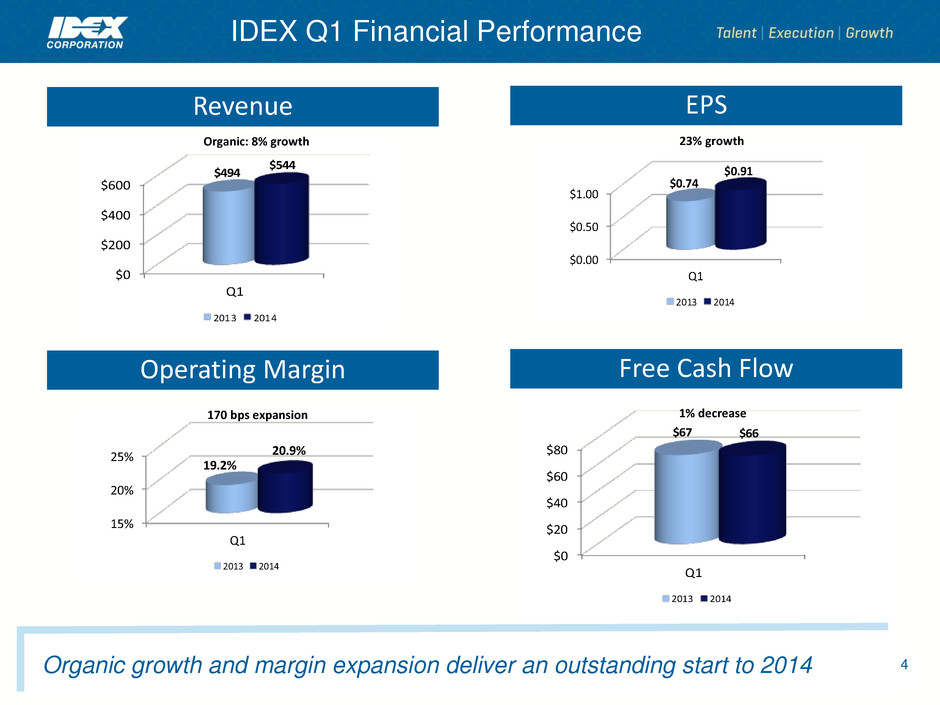
$0 $20 $40 $60 $80 Q1 $67 $66 2013 2014 15% 20% 25% Q1 19.2% 20.9% 2013 2014 $ .00 $ .50 $1.00 Q1 $0.74 $0.91 2013 2014 $0 $200 $400 $600 Q1 $494 $544 2013 2014 Revenue Organic: 8% growth 170 bps expansion EPS Operating Margin Free Cash Flow Organic growth and margin expansion deliver an outstanding start to 2014 23% growth 1% decrease IDEX Q1 Financial Performance 4
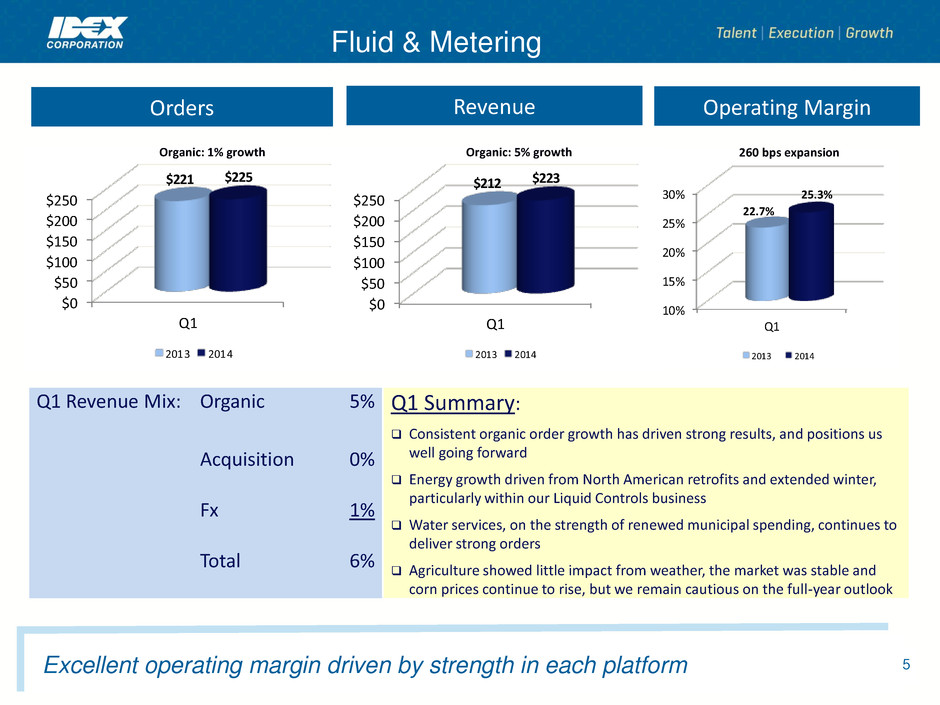
$0 $50 $100 $150 $200 $250 Q1 $221 $225 2013 2014 $0 $50 $100 $150 $200 $250 Q1 $212 $223 2013 2014 10% 15% 20% 25% 30% Q1 22.7% 25.3% 2013 2014 Orders Revenue Q1 Revenue Mix: Organic 5% Acquisition 0% Fx 1% Total 6% Q1 Summary: Consistent organic order growth has driven strong results, and positions us well going forward Energy growth driven from North American retrofits and extended winter, particularly within our Liquid Controls business Water services, on the strength of renewed municipal spending, continues to deliver strong orders Agriculture showed little impact from weather, the market was stable and corn prices continue to rise, but we remain cautious on the full-year outlook 260 bps expansion Operating Margin Organic: 1% growth Organic: 5% growth Fluid & Metering 5 Excellent operating margin driven by strength in each platform
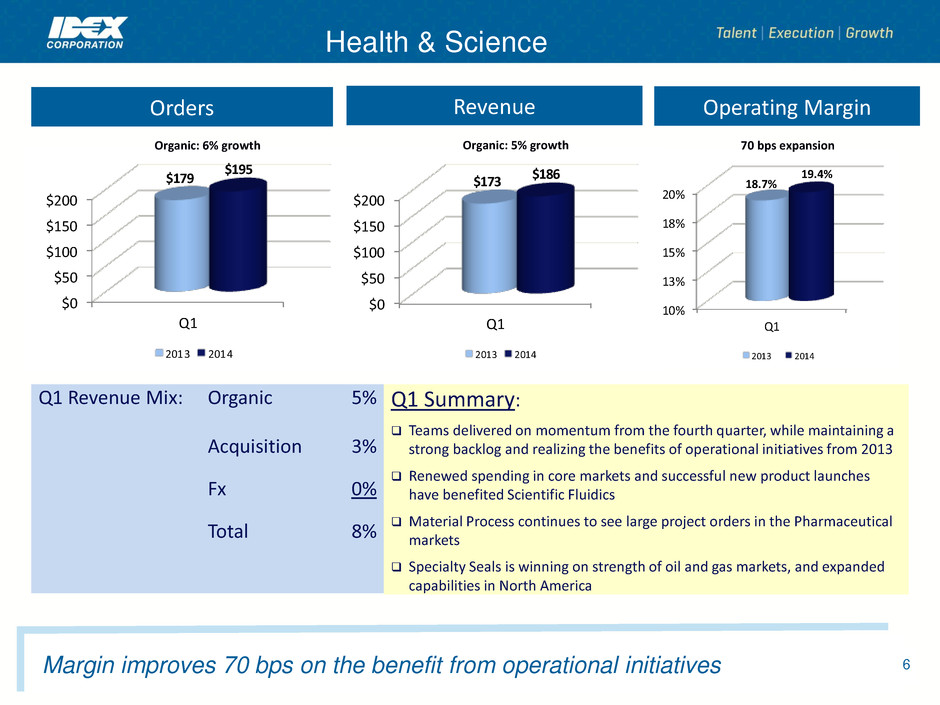
$0 $50 $100 $150 $200 Q1 $179 $195 2013 2014 $0 $50 $100 $150 $200 Q1 $173 $186 2013 2014 10% 13% 15% 18% 20% Q1 18.7% 19.4% 2013 2014 Health & Science Orders Revenue Operating Margin Q1 Revenue Mix: Organic 5% Acquisition 3% Fx 0% Total 8% Q1 Summary: Teams delivered on momentum from the fourth quarter, while maintaining a strong backlog and realizing the benefits of operational initiatives from 2013 Renewed spending in core markets and successful new product launches have benefited Scientific Fluidics Material Process continues to see large project orders in the Pharmaceutical markets Specialty Seals is winning on strength of oil and gas markets, and expanded capabilities in North America Organic: 6% growth Organic: 5% growth 70 bps expansion 6 Margin improves 70 bps on the benefit from operational initiatives
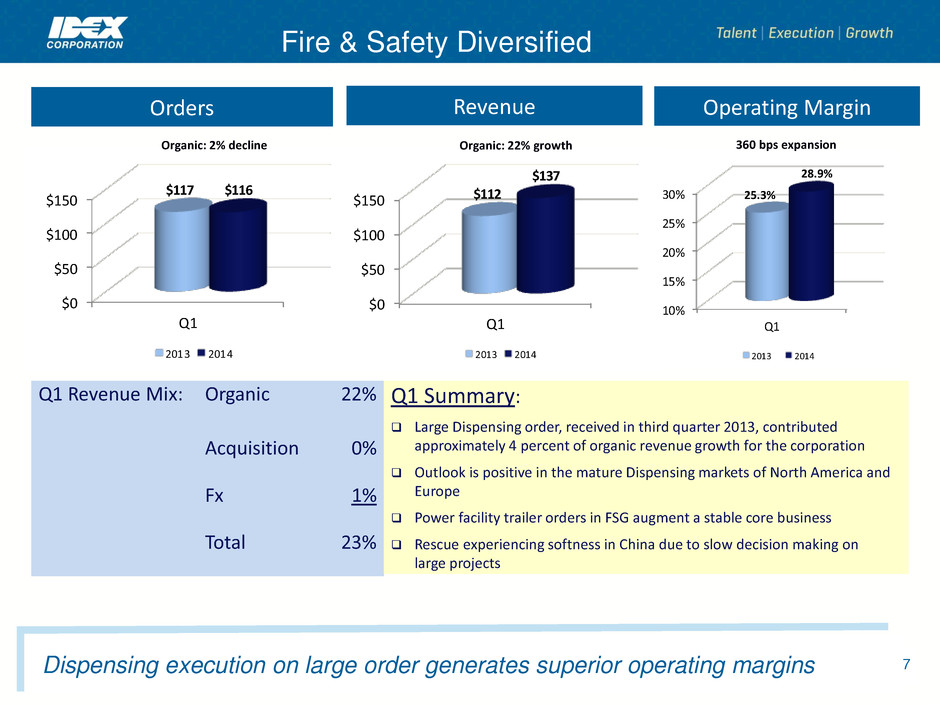
$0 $50 $100 $150 Q1 $117 $116 2013 2014 $0 $50 $100 $150 Q1 $112 $137 2013 2014 10% 15% 20% 25% 30% Q1 25.3% 28.9% 2013 2014 Orders Revenue 360 bps expansion Organic: 2% decline Operating Margin Q1 Revenue Mix: Organic 22% Acquisition 0% Fx 1% Total 23% Q1 Summary: Large Dispensing order, received in third quarter 2013, contributed approximately 4 percent of organic revenue growth for the corporation Outlook is positive in the mature Dispensing markets of North America and Europe Power facility trailer orders in FSG augment a stable core business Rescue experiencing softness in China due to slow decision making on large projects Organic: 22% growth Fire & Safety Diversified 7 Dispensing execution on large order generates superior operating margins

Q2 2014 EPS estimate range: $0.85 – $0.87 Organic revenue growth: ~ 4% Operating margin: ~ 20% Tax rate: ~ 30.0% FY 2014 EPS estimate range: $3.38 – $3.45 Organic revenue growth: ~ 4% – 5% Operating margin: > 20% Minimal FX impact Other modeling items • Tax rate: ~ 29.0% – 29.5% • Cap Ex: ~ $40M - $45M • Free Cash Flow will be 120% – 125% of net income • Continued share repurchases: ~ net 1% reduction • EPS estimate excludes future acquisitions and associated costs and charges 8 Outlook: 2014 Guidance Summary

Q&A 9
