Attached files
| file | filename |
|---|---|
| 8-K - 8-K - ARMSTRONG WORLD INDUSTRIES INC | d713925d8k.htm |
| EX-99.1 - EX-99.1 - ARMSTRONG WORLD INDUSTRIES INC | d713925dex991.htm |
 Earnings Call Presentation
1
st
Quarter 2014
April 28, 2014
Exhibit 99.2 |
 Safe
Harbor Statement Our
disclosures
in
this
presentation,
including
without
limitation,
those
relating
to
future
financial
results
guidance,
and
in
our
other
public
documents
and
comments
contain
forward-looking
statements
within
the
meaning
of
the
Private
Securities
Litigation
Reform
Act.
Those
statements
provide
our
future
expectations
or
forecasts
and
can
be
identified
by
our
use
of
words
such
as
"anticipate,"
"estimate,"
"expect,"
"project,"
"intend,"
"plan,"
"believe,"
"outlook,"
"target,"
"predict,"
"may,"
"will,"
"would,"
"could,"
"should,"
"seek,"
and
other
words
or
phrases
of
similar
meaning
in
connection
with
any
discussion
of
future
operating
or
financial
performance.
Forward-looking
statements,
by
their
nature,
address
matters
that
are
uncertain
and
involve
risks
because
they
relate
to
events
and
depend
on
circumstances
that
may
or
may
not
occur
in
the
future.
As
a
result,
our
actual
results
may
differ
materially
from
our
expected
results
and
from
those
expressed
in
our
forward-looking
statements.
A
more
detailed
discussion
of
the
risks
and
uncertainties
that
may
affect
our
ability
to
achieve
the
projected
performance
is
included
in
the
“Risk
Factors”
and
“Management’s
Discussion
and
Analysis”
sections
of
our
reports
on
Forms
10-K
and
10-Q
filed
with
the
SEC.
Forward-looking
statements
speak
only
as
of
the
date
they
are
made.
We
undertake
no
obligation
to
update
any
forward-looking
statements
beyond
what
is
required
under
applicable
securities
law.
In
addition,
we
will
be
referring
to
non-GAAP
financial
measures
within
the
meaning
of
SEC
Regulation
G.
A
reconciliation
of
the
differences
between
these
measures
with
the
most
directly
comparable
financial
measures
calculated
in
accordance
with
GAAP
are
included
within
this
presentation
and
available
on
the
Investor
Relations
page
of
our
website
at
www.armstrong.com.
The
guidance
in
this
presentation
is
only
effective
as
of
the
date
given,
April
28,
2014,
and
will
not
be
updated
or
affirmed
unless
and
until
we
publicly
announce
updated
or
affirmed
guidance.
2 |
 All
figures
throughout
the
presentation
are
in
$
millions
unless
otherwise
noted.
Figures
may
not
add
due
to
rounding.
Basis of Presentation Explanation
When
reporting
our
financial
results
within
this
presentation,
we
make
several
adjustments.
Management
uses
the
non-GAAP
measures
below
in
managing
the
business
and
believes
the
adjustments
provide
meaningful
comparisons
of
operating
performance
between
periods.
As
reported
results
will
be
footnoted
throughout
the
presentation.
3
•
We
report
in
comparable
dollars
to
remove
the
effects
of
currency
translation
on
the
P&L.
The
budgeted
exchange
rate
for
2014
is
used
for
all
currency
translations
in
2014
and
prior
years.
Guidance
is
presented
using
the
2014
budgeted
exchange
rate
for
the
year.
•
We
remove
the
impact
of
discrete
expenses
and
income.
Examples
include
plant
closures,
restructuring
actions,
and
other
large
unusual
items.
•
Taxes
for
normalized
Net
Income
and
EPS
are
calculated
using
a
constant
39%
for
2014
results
and
guidance,
and
2013
results,
which
are
based
on
the
expected
full
year
historical
tax
rate.
Comparable
Dollars
Other
Adjustments
Net Sales
Yes
No
Gross Profit
Yes
Yes
SG&A Expense
Yes
Yes
Equity Earnings
Yes
Yes
Operating Income
Yes
Yes
Net Income
Yes
Yes
Cash Flow
No
No
Return on Capital
Yes
Yes
EBITDA
Yes
Yes
What Items Are Adjusted |
 (1)
As
reported
Net
Sales:
$634
million
in
2014
and
$622
million
in
2013
(2)
As
reported
Operating
Income:
$53
million
in
2014
and
$47
million
in
2013
(3)
As
reported
EPS:
$0.30
in
2014
and
$0.05
in
2013
(4)
Unadjusted
Key
Metrics
–
First
Quarter
2014
2014
2013
Variance
Net Sales
(1)
$631
$614
2.8%
Operating Income
(2)
54
53
2.4%
% of Sales
8.5%
8.5%
0 bps
EBITDA
83
78
7.0%
% of Sales
13.2%
12.7%
50 bps
Earnings Per Share
(3)
$0.42
$0.21
99%
Free Cash Flow
(55)
(51)
(6.8%)
Net Debt
977
792
185
ROIC
(4)
8.0%
10%
(200 bps)
4 |
 2014
2013
V
EBITDA–
Adjusted
$83
$78
$5
Depreciation and Amortization
(29)
(25)
(4)
Operating
Income
–
Adjusted
$54
$53
$1
Foreign Exchange Movements
-
-
-
Cost Reduction Initiatives
1
6
(5)
Operating
Income
–
As
Reported
$53
$47
$6
Interest/Other (Expense)
(17)
(32)
15
EBT
$36
$15
$21
Tax (Expense)
(19)
(12)
(7)
Net Income
$17
$3
$14
First
Quarter
2014
vs.
PY–
Adjusted
EBITDA
to
Reported
Net
Income
5 |
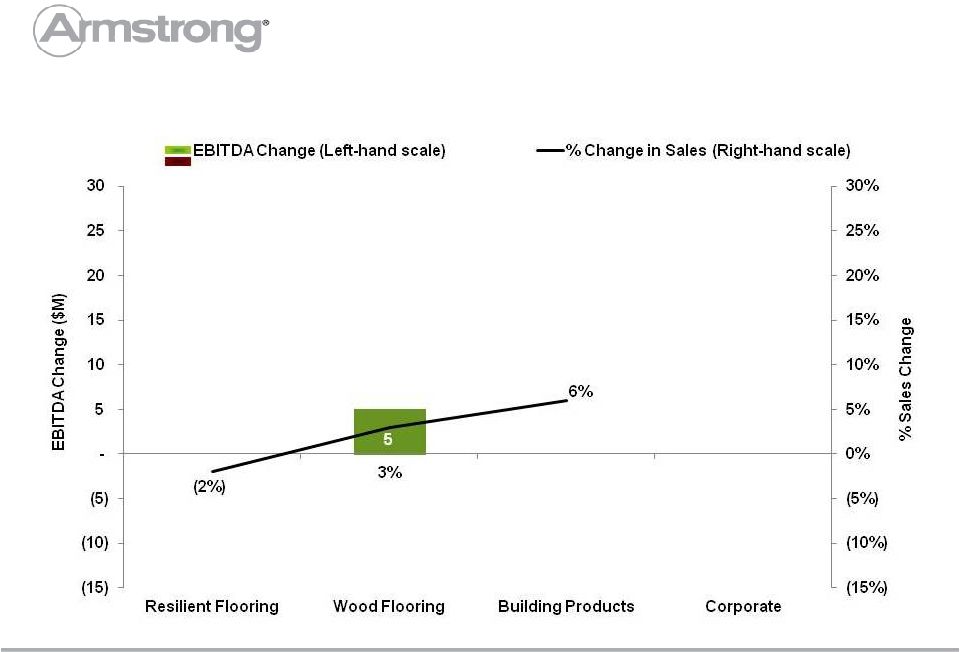 First
Quarter
Sales
and
EBITDA
by
Segment
–
2014
vs.
PY
6 |
 EBITDA
Bridge
–
First
Quarter
2014
vs.
Prior
Year
7 |
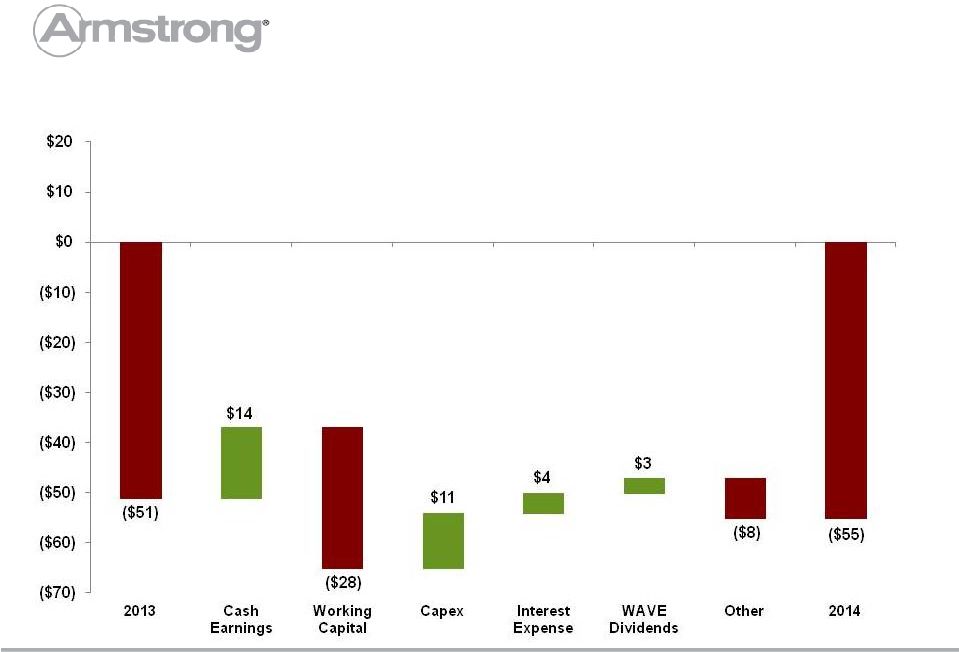 Free
Cash
Flow
–
First
Quarter
2014
vs.
Prior
Year
8 |
 2014
Estimate Range (1)
2013
(2)
Variance
Net Sales
(3)
2,800
to
2,900
2,700
4%
to
7%
Operating Income
(4)
275
to
300
257
7%
to
17%
EBITDA
400
to
430
366
9%
to
17%
Earnings Per Share
(5)
$2.55
to
$2.80
$1.98
29%
to
41%
Free Cash Flow
45
to
85
68
(34)%
to
25%
(1)
Guidance is presented using 2014 budgeted foreign exchange rates
(2)
2013 results are presented using 2014 budgeted foreign exchange rates
(3)
2014 and 2013 net sales include the impact of foreign exchange
(4)
As reported Operating Income: $270 -
$295 million in 2014 and $239 million 2013
(5)
As reported earnings per share: $2.10 -
$2.35 in 2014 and $1.71 in 2013
Key Metrics –
Guidance 2014
9 |
 2014 Financial Outlook
$30 -
$40 million vs. 2013
Adjusted Gross Margin 100 to 150 bps vs. 2013
16.3% to 16.8% of sales
$0 -
$5 million vs. 2013
$30 -
$40 million; Adjusted long-term ETR of ~39%
(2)
Sales
(1)
$710–
$750 million; EBITDA $90 –
$110 million
$195 -
$215 million
< $5 million
Raw Material & Energy Inflation*
Manufacturing Productivity
Earnings from WAVE
Cash Taxes/ETR
Q2
Capital Spending*
Exclusions from EBITDA
10
(1)
Net sales include foreign exchange impact
(2)
As reported ETR of 49% for 2014
* Changed from February Outlook
SG&A |
 Appendix
11 |
 2014 Estimate Range
Adjusted Operating Income
275
to
300
D&A
125
to
130
Adjusted EBITDA
400
to
430
Changes in Working Capital
(50)
to
(60)
Capex
(195)
to
(215)
Interest Expense
(45)
to
(50)
Cash Taxes
(30)
to
(40)
Other, including cash payments for restructuring and
one-time items
(5)
Free Cash Flow
45
to
85
Adjusted Operating Income to Free Cash Flow
12 |
 First Quarter
2014
Reported
Comparability
(1)
Adjustments
FX
(2)
Adj
2014
Adjusted
2013
Reported
Comparability
(1)
Adjustments
FX
(2)
Adj
2013
Adjusted
Net Sales
634
-
(3)
631
622
-
(8)
614
Operating
Income
53
1
-
54
47
6
-
53
EPS
$0.30
$0.12
-
$0.42
$0.05
$0.16
-
$0.21
(1)
See earnings press release and 10-Q for additional detail on comparability
adjustments (2)
Eliminates impact of foreign exchange movements
Consolidated Results
13 |
 First Quarter
2014
Reported
Comparability
(1)
Adjustments
2014
Adjusted
2013
Reported
Comparability
(1)
Adjustments
2013
Adjusted
Building Products
58
-
58
59
-
59
Resilient Flooring
9
1
10
6
6
12
Wood Flooring
5
-
5
1
-
1
Unallocated Corporate
(Expense) Income
(20)
-
(20)
(19)
-
(19)
Segment Operating Income (Loss)
14
(1)
Eliminates impact of foreign exchange movements and non-recurring items; see
earnings press release and 10-Q for additional detail. |
 First Quarter
($ millions)
2014
2013
Net cash (used for) operations
($33)
($14)
Net cash (used for) investing
(22)
(37)
Free Cash Flow
($55)
($51)
Cash Flow
15 |