Attached files
| file | filename |
|---|---|
| 8-K - 8-K - US BANCORP \DE\ | d708974d8k.htm |
| EX-99.1 - EX-99.1 - US BANCORP \DE\ | d708974dex991.htm |
 U.S.
Bancorp 1Q14 Earnings
Conference Call
U.S. Bancorp
1Q14 Earnings
Conference Call
April 16, 2014
Richard K. Davis
Chairman, President and CEO
Andy Cecere
Vice Chairman and CFO
Exhibit 99.2 |
 2
Forward-looking Statements and Additional Information
The following information appears in accordance with the Private Securities Litigation Reform Act of
1995: This presentation contains forward-looking statements about U.S. Bancorp. Statements that
are not historical or current facts, including statements about beliefs and expectations, are
forward-looking statements and are based on the information available to, and assumptions and estimates
made by, management as of the date made. These forward-looking statements cover, among other
things, anticipated future revenue and expenses and the future plans and prospects of U.S.
Bancorp. Forward-looking statements involve inherent risks and uncertainties, and important
factors could cause actual results to differ materially from those anticipated. A reversal or
slowing of the current moderate economic recovery or another severe contraction could adversely
affect U.S. Bancorp’s revenues and the values of its assets and liabilities. Global financial markets
could experience a recurrence of significant turbulence, which could reduce the availability of
funding to certain financial institutions and lead to a tightening of credit, a reduction of
business activity, and increased market volatility. Continued stress in the commercial real estate markets, as
well as a delay or failure of recovery in the residential real estate markets, could cause additional
credit losses and deterioration in asset values. In addition, U.S. Bancorp’s business
and financial performance is likely to be negatively impacted by recently enacted and future legislation and
regulation. U.S. Bancorp’s results could also be adversely affected by deterioration in
general business and economic conditions; changes in interest rates; deterioration in the
credit quality of its loan portfolios or in the value of the collateral securing those loans; deterioration in the value
of securities held in its investment securities portfolio; legal and regulatory developments;
increased competition from both banks and non-banks; changes in customer behavior and
preferences; effects of mergers and acquisitions and related integration; effects of critical accounting policies
and judgments; and management’s ability to effectively manage credit risk, residual value risk,
market risk, operational risk, interest rate risk and liquidity risk. For discussion of these and other risks that may cause actual results to differ from expectations,
refer to U.S. Bancorp’s Annual Report on Form
10-K for the year ended December 31, 2013, on file with the Securities and Exchange Commission, including the sections entitled “Risk
Factors” and “Corporate Risk Profile” contained in Exhibit 13, and all subsequent
filings with the Securities and Exchange Commission under Sections 13(a), 13(c), 14 or 15(d) of
the Securities Exchange Act of 1934. Forward-looking statements speak only as of the date they are made,
and U.S. Bancorp undertakes no obligation to update them in light of new information or future events. This presentation includes non-GAAP financial
measures to describe U.S. Bancorp’s performance. The reconciliations of those measures to
GAAP measures are provided within or in the appendix of the presentation. These disclosures
should not be viewed as a substitute for operating results determined in accordance with GAAP,
nor are they necessarily comparable to non-GAAP performance measures that may be presented
by other companies. |
 3
1Q14 Earnings
Conference Call
1Q14 Highlights
Net income of $1.4 billion; $0.73 per diluted common share
Average loan growth of 6.0% vs. 1Q13 and average loan growth of 1.3%
vs. 4Q13
Average deposit growth of 5.1% vs. 1Q13 and 0.2% vs. 4Q13
Net charge-offs declined 21.2% vs. 1Q13
Nonperforming assets decreased 1.0% vs. 4Q13 and 11.6% vs. 1Q13 (excluding
covered assets)
Capital generation continues to reinforce capital position
•
Common equity tier 1 capital ratio of 9.0% estimated for the Basel III fully
implemented standardized approach
•
Common
equity
tier
1
capital
ratio
of
9.7%;
Tier
1
capital
ratio
of
11.4%
Returned 67% of earnings to shareholders in 1Q14
•
Repurchased 12 million shares of common stock during the quarter
|
 4
1Q14 Earnings
Conference Call
Performance Ratios
Return on Average Common Equity
and Return on Average Assets
Efficiency Ratio and
Net Interest Margin
Return on Avg Common Equity
Return on Avg Assets
Efficiency Ratio
Net Interest Margin
Efficiency ratio computed as noninterest expense divided by the sum of net interest
income on a taxable-equivalent basis
and
noninterest
income
excluding
securities
gains
(losses)
net
16.0%
16.1%
15.8%
15.4%
14.6%
1.65%
1.70%
1.65%
1.62%
1.56%
1.0%
1.5%
2.0%
2.5%
3.0%
8%
11%
14%
17%
20%
1Q13
2Q13
3Q13
4Q13
1Q14
50.7%
51.7%
52.4%
54.9%
52.9%
3.48%
3.43%
3.43%
3.40%
3.35%
2.0%
2.5%
3.0%
3.5%
4.0%
45%
50%
55%
60%
65%
1Q13
2Q13
3Q13
4Q13
1Q14 |
 1Q14 Earnings
Conference Call
Taxable-equivalent basis
Year-Over-Year Change
(1.1%)
(2.4%)
(5.6%)
(4.4%)
(1.2%)
$ in millions
$4,874
$4,948
$4,891
$4,889
$4,814
3,500
4,000
4,500
5,000
5,500
1Q13
2Q13
3Q13
4Q13
1Q14
Revenue Growth
5 |
 6
1Q14 Earnings
Conference Call
Loan and Deposit Growth
Average Balances
Year-Over-Year Growth
$ in billions
5.7%
$232.8
6.0%
$235.9
5.8%
$222.4
5.2%
$225.2
5.7%
$229.4
5.4%
$256.9
5.1%
$257.5
7.3%
$245.0
7.0%
$247.4
5.5%
$252.4
180.0
200.0
220.0
240.0
260.0
1Q13
2Q13
3Q13
4Q13
1Q14
Loans
Deposits |
 7
1Q14 Earnings
Conference Call
Credit Quality
* Excluding Covered Assets (assets subject to loss sharing agreements with
FDIC) Net Charge-offs
Nonperforming Assets*
$ in millions
Net Charge-offs (Left Scale)
NCOs to Avg Loans (Right Scale)
Nonperforming Assets (Left Scale)
NPAs to Loans plus ORE (Right Scale)
$433
$392
$328
$312
$341
0.79%
0.70%
0.57%
0.53%
0.59%
0.00%
0.75%
1.50%
2.25%
3.00%
0
150
300
450
600
1Q13
2Q13
3Q13
4Q13
1Q14
$2,029
$1,921
$1,880
$1,813
$1,794
0.95%
0.88%
0.85%
0.80%
0.78%
0.00%
0.75%
1.50%
2.25%
3.00%
0
800
1,600
2,400
3,200
1Q13
2Q13
3Q13
4Q13
1Q14 |
 8
1Q14 Earnings
Conference Call
Earnings Summary
$ in millions, except per-share data
Taxable-equivalent basis
1Q14
4Q13
1Q13
vs 4Q13
vs 1Q13
Net Interest Income
2,706
$
2,733
$
2,709
$
(1.0)
(0.1)
Noninterest Income
2,108
2,156
2,165
(2.2)
(2.6)
Total Revenue
4,814
4,889
4,874
(1.5)
(1.2)
Noninterest Expense
2,544
2,682
2,470
5.1
(3.0)
Operating Income
2,270
2,207
2,404
2.9
(5.6)
Net Charge-offs
341
312
433
(9.3)
21.2
Excess Provision
(35)
(35)
(30)
16.7
Income before Taxes
1,964
1,930
2,001
1.8
(1.8)
Applicable Income Taxes
552
459
614
(20.3)
10.1
Noncontrolling Interests
(15)
(15)
41
nm
Net Income
1,397
1,456
1,428
(4.1)
(2.2)
Preferred Dividends/Other
66
67
70
1.5
5.7
NI to Common
1,331
$
1,389
$
1,358
$
(4.2)
(2.0)
Diluted EPS
0.73
$
0.76
$
0.73
$
(3.9)
Average Diluted Shares
1,828
1,832
1,867
0.2
2.1
% B/(W) |
 9
1Q14 Earnings
Conference Call
1Q14 Results -
Key Drivers
vs. 1Q13
Net Revenue decline of 1.2%
•
Net
interest
income
flat;
net
interest
margin
of
3.35%
vs.
3.48%
in
1Q13
•
Noninterest income decline of 2.6%
Noninterest expense increase of 3.0%
Provision for credit losses lower by $97 million
•
Net charge-offs lower by $92 million, or 21.2%
•
Provision lower than NCOs by $35 million vs. $30 million in 1Q13
vs. 4Q13
Net Revenue decline of 1.5%
•
Net interest income decline of 1.0%; net interest margin of 3.35% vs. 3.40% in
4Q13 •
Noninterest income decline of 2.2%
Noninterest expense decrease of 5.1%
Provision for credit losses higher by $29 million
•
Net charge-offs increased by $29 million
•
Provision lower than NCOs by $35 million vs. $35 million in 4Q13
|
 10
1Q14 Earnings
Conference Call
Capital Position
$ in billions
RWA = risk-weighted assets
(a) March 31, 2014, based on the Basel III transitional standardized approach, all
prior periods under Basel I (b) The Basel III regulatory requirements for
March 31, 2013, were based on the proposed rules for the Basel III fully implemented standardized
approach
released
June
2012,
all
other
periods
were
based
on
the
final
rules for the Basel III fully implemented standardized approach
1Q14
4Q13
3Q13
2Q13
1Q13
Total U.S. Bancorp shareholders' equity
42.1
$
41.1
$
40.1
$
39.7
$
39.5
$
Basel III transitional standardized approach/Basel I (a)
Common equity tier 1 capital
29.5
27.9
27.3
26.8
26.3
Tier 1 capital
34.6
33.4
32.7
32.2
31.8
Total risk-based capital
40.7
39.3
38.9
38.4
38.1
Common equity tier 1 capital ratio
9.7%
9.4%
9.3%
9.2%
9.1%
Tier 1 capital ratio
11.4%
11.2%
11.2%
11.1%
11.0%
Total risk-based capital ratio
13.5%
13.2%
13.3%
13.3%
13.2%
Leverage ratio
9.7%
9.6%
9.6%
9.5%
9.3%
Common equity tier 1 capital to RWA estimated for the
Basel III fully implemented standardized approach (b)
9.0%
8.8%
8.6%
8.6%
8.2%
Tangible common equity ratio
7.8%
7.7%
7.4%
7.5%
7.4%
Tangible common equity as a % of RWA
9.3%
9.1%
8.9%
8.9%
8.8% |
 1Q14 Earnings
Conference Call
11
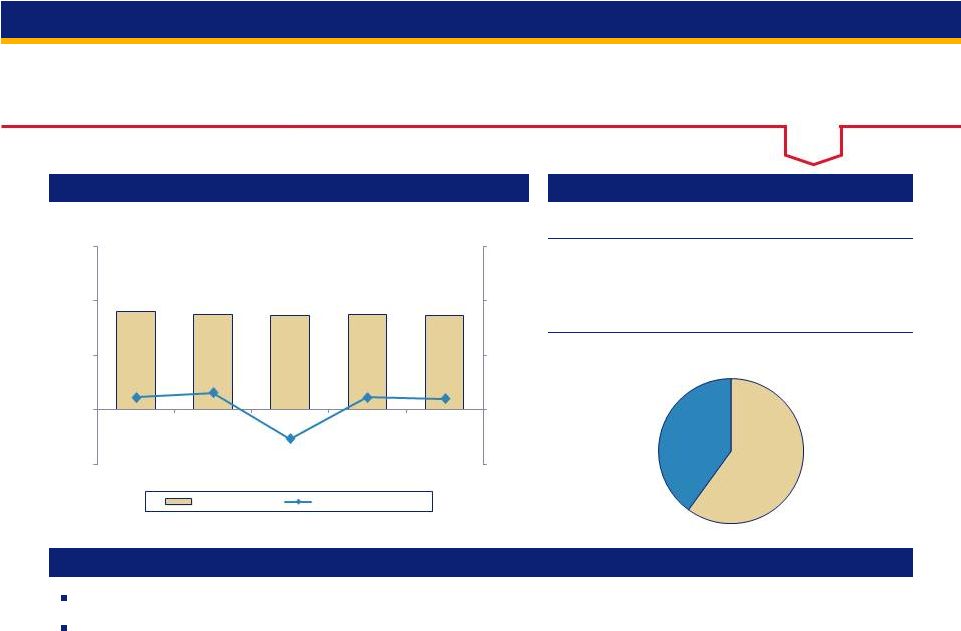
Capital Actions
Share repurchase authorization and expected dividend increase announced
March 26
th
•
Expect to increase annual dividend from $0.92 to $0.98, a 6.5% increase, effective
2Q14 •
One year authorization to repurchase up to $2.3 billion of outstanding stock
effective April 1, 2014 Returned 67% of earnings to shareholders during
1Q14 Reinvest and
Acquisitions
Dividends
Share
Repurchases
20 -
40%
Targets:
30 -
40%
30 -
40%
33%
1Q14
Actual:
36%
31%
Earnings Distribution |
 12
1Q14 Earnings
Conference Call |
 13
1Q14 Earnings
Conference Call
Appendix |
 14
1Q14 Earnings
Conference Call
Covered
Commercial
CRE
Res Mtg
Credit
Card
Retail
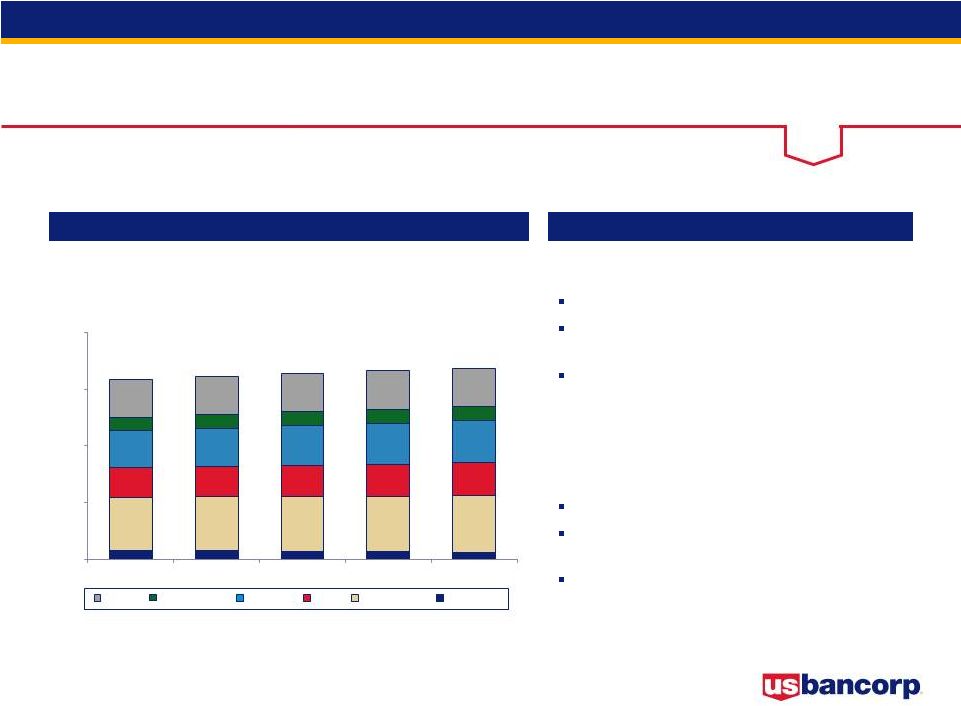
Average Loans
Average Loans
Key Points
$ in billions
vs. 1Q13
Average total loans grew by $13.5 billion, or 6.0%
Average total loans, excluding covered loans,
were higher by 7.6%
Average total commercial loans increased $5.5
billion, or 8.5%; average commercial real estate
loans increased $2.8 billion, or 7.6%; average
residential mortgage loans increased $6.5 billion,
or 14.4%
vs. 4Q13
Average total loans grew by $3.1 billion, or 1.3%
Average total loans, excluding covered loans,
were higher by 1.7%
Average total commercial loans increased $1.9
billion, or 2.8%; average commercial real estate
loans increased $0.7 billion, or 1.9%; average
residential mortgage loans increased $0.9 billion,
or 1.7%
Year-Over-Year Growth
5.8%
5.2%
5.7%
5.7%
6.0%
Covered
Commercial
CRE
Res Mtg
Retail
Credit Card
$222.4
$225.2
$229.4
$232.8
$235.9
0
70
140
210
280
1Q13
2Q13
4Q13
1Q14
(1.4%)
14.3%
3.4%
19.2%
(1.5%)
11.2%
3.7%
19.7%
(1.7%)
(2.2%)
9.4%
5.1%
19.9%
2.3%
(2.1%)
3Q13
7.8%
6.7%
17.6%
4.7%
(1.1%)
8.5%
14.4%
5.3%
0.9%
7.6% |
 15
1Q14 Earnings
Conference Call
Time
Money
Market
Checking
& Savings
Noninterest
-bearing
Average Deposits
Average Deposits
Key Points
$ in billions
vs. 1Q13
Average total deposits increased by $12.5
billion, or 5.1%
Average low cost deposits (NIB, interest
checking, money market and savings)
increased by $15.3 billion, or 7.7%
vs. 4Q13
Average total deposits increased by $0.6
billion, or 0.2%
Average low cost deposits increased by $0.2
billion, or 0.1%
Year-Over-Year Growth
7.3%
7.0%
5.5%
5.4%
5.1%
Time
Money Market
Checking and Savings
Noninterest-bearing
$245.0
$247.4
$252.4
$256.9
$257.5
0
80
160
240
320
1Q13
2Q13
3Q13
4Q13
1Q14
7.6%
15.6%
4.6%
4.4%
(4.3%)
24.5%
6.4%
3.6%
(5.7%)
17.8%
10.1%
0.2%
(8.0%)
16.2%
9.2%
2.5%
(6.1%)
11.6%
5.9%
6.7% |
 16
1Q14 Earnings
Conference Call
Net Interest Income
Net Interest Income
Key Points
$ in millions
Taxable-equivalent basis
vs. 1Q13
Average earning assets grew by $12.2 billion,
or 3.9%
Net interest margin lower by 13 bps (3.35%
vs. 3.48%) driven by:
•
Lower rates on investment securities and growth in
the portfolio
•
Partially offset by lower rates on deposits and
short-term borrowings and a reduction in higher
cost long-term debt
vs. 4Q13
Average earning assets grew by $6.7 billion,
or 2.1%
Net interest margin lower by 5 bps (3.35% vs.
3.40%) driven by:
•
Growth in lower rate investment securities
•
Loan mix / loan fees
Year-Over-Year Growth
0.7%
(1.5%)
(2.5%)
(1.8%)
(0.1%)
$2,709
$2,672
$2,714
$2,733
$2,706
3.48%
3.43%
3.43%
3.40%
3.35%
0.0%
2.0%
4.0%
6.0%
8.0%
0
1,000
2,000
3,000
4,000
1Q13
2Q13
3Q13
4Q13
1Q14
Net Interest Income
Net Interest Margin |
 17
1Q14 Earnings
Conference Call
Noninterest Income
Noninterest Income
Key Points
$ in millions
Payments = credit and debit card revenue, corporate payment products revenue and
merchant processing; Service charges = deposit service charges,
treasury management fees and ATM processing services vs. 1Q13
Noninterest income declined by $57 million, or
2.6%, driven by:
•
Mortgage banking revenue decline of $165 million
•
Higher credit and debit card revenue (11.7% increase) due to
higher transaction volumes; higher merchant processing revenue
(2.6% increase) due to an increase in product fees and higher
volumes, partially offset by lower rates
•
Higher trust and investment management fees (9.4% increase)
due to account growth, improved market conditions and
business expansion
•
Higher commercial products revenue (2.5% increase) due to
higher syndication fees on tax-advantaged products
•
Higher other income, due to higher equity investment revenue
vs. 4Q13
Noninterest income declined by $48 million, or 2.2%,
driven by:
•
Lower credit and debit card revenue (9.1% decrease) due to
seasonally lower transaction volumes
•
Lower deposit service charges (11.3% decrease) due to
seasonality
•
Lower commercial products revenue (15.6% decrease) due to
lower wholesale transaction activity and seasonally lower tax-
advantaged project-related revenue
•
Higher corporate payments revenue (4.2% increase) primarily due
to seasonally higher government-related transaction volumes
•
Higher trust and investment management revenues (2.4%
increase) due to improved market conditions, account growth
and business expansion
•
Higher other income, primarily due to higher equity investment
and retail leasing revenue
Year-Over-Year Growth
(3.3%)
(3.4%)
(9.1%)
(7.4%)
(2.6%)
$2,165
$2,276
$2,177
$2,156
$2,108
Trust and
Inv Mgmt
Service
Charges
All Other
Mortgage
Payments
12.5%
(41.1%)
(0.3%)
9.4%
4.8%
0
600
1,200
1,800
2,400
1Q13
2Q13
3Q13
4Q13
1Q14
All Other
Mortgage
Service Charges
Trust and Inv Mgmt
Payments |
 18
1Q14 Earnings
Conference Call
Noninterest Expense
Noninterest Expense
Key Points
$ in millions
vs. 1Q13
Noninterest expense was higher by $74 million, or
3.0%, driven by:
•
Higher compensation expense (3.0% increase) due to growth in
staffing for business initiatives and merit increases
•
Higher net occupancy and equipment expenses (6.0% increase)
due to business initiatives, higher rent expense and
maintenance costs
•
Higher other expense mainly driven by insurance-related
recoveries in the prior year, partially offset by lower tax-
advantaged project costs and lower costs related to other real
estate owned
•
Lower employee benefits expense (6.8% decrease) driven by
lower pension costs
vs. 4Q13
Noninterest expense was lower by $138 million, or
5.1%, driven by:
•
Lower professional services expense (29.7% decrease) due to
seasonally lower costs; lower marketing and business
development expense (23.3% decrease) due to the timing of
marketing and business development programs
•
Lower other expense mainly due to lower costs related to
investments in tax-advantaged projects
•
Higher compensation expense (1.1% increase) due to merit
increases; higher employee benefits expense (5.1% increase)
due to seasonally higher payroll taxes, partially offset by lower
pension expense
Year-Over-Year Change
(3.5%)
(1.7%)
(1.7%)
(0.1%)
3.0%
$2,470
$2,557
$2,565
$2,682
$2,544
Occupancy
and Equipment
Prof Services,
Marketing
and PPS
All Other
Tech and Comm
Compensation
and Benefits
0
800
1,600
2,400
3,200
1Q13
2Q13
3Q13
4Q13
1Q14
7.9%
0.0%
7.0%
6.0%
0.9%
All Other
Tech and Communications
Prof Svcs, Marketing and PPS
Occupancy and Equipment
Compensation and Benefits |
 19
1Q14 Earnings
Conference Call
Credit
Quality
-
Commercial
Loans
Average Loans and Net Charge-offs Ratios
Key Statistics
Comments
Strong
new
lending
activity
with
3.0%
linked
quarter
loan
growth
and
9.6%
year-over-year
growth;
utilization rates remained at historically low levels
Net charge-offs continued to be modest
Nonperforming loans increased moderately but remained at low levels
1Q13
4Q13
1Q14
Average Loans
$59,921
$63,714
$65,645
30-89 Delinquencies
0.20%
0.33%
0.25%
90+ Delinquencies
0.10%
0.08%
0.07%
Nonperforming Loans
0.14%
0.19%
0.25%
$ in millions
$59,921
$61,507
$62,856
$63,714
$65,645
0.22%
0.22%
0.11%
0.21%
0.21%
0.0%
1.0%
2.0%
3.0%
4.0%
0
20,000
40,000
60,000
80,000
1Q13
2Q13
3Q13
4Q13
1Q14
Average Loans
Net Charge-offs Ratio
20%
25%
30%
35%
40%
Revolving Line Utilization Trend |
 20
1Q14 Earnings
Conference Call
Credit Quality
-
Commercial Leases
Average Loans and Net Charge-offs Ratios
Key Statistics
Comments
Net charge-offs remained at low levels and declined slightly from 4Q13
Nonperforming loans and delinquencies continued at modest levels
1Q13
4Q13
1Q14
Average Loans
$5,378
$5,210
$5,189
30-89 Delinquencies
0.82%
0.85%
0.74%
90+ Delinquencies
0.00%
0.00%
0.00%
Nonperforming Loans
0.30%
0.23%
0.27%
$ in millions
$5,378
$5,255
$5,208
$5,210
$5,189
0.23%
0.31%
-0.53%
0.23%
0.16%
-1.0%
0.0%
1.0%
2.0%
3.0%
0
3,000
6,000
9,000
1Q13
2Q13
3Q13
4Q13
1Q14
Average Loans
Net Charge-offs Ratio
Small Ticket
$3,113
Equipment
Finance
$2,076
Commercial Leases |
 21
1Q14 Earnings
Conference Call
Credit Quality
-
Commercial Real Estate
Average Loans and Net Charge-offs Ratios
Key Statistics
Comments
Average loans increased 1.9% on a linked quarter basis and 7.6%
year-over-year Net recovery ratio of 0.03% marked the fourth
consecutive quarter of net recoveries Nonperforming loans of 0.67% continued
its downward trend 1Q13
4Q13
1Q14
Average Loans
$37,218
$39,318
$40,050
30-89 Delinquencies
0.22%
0.24%
0.14%
90+ Delinquencies
0.02%
0.07%
0.06%
Nonperforming Loans
1.36%
0.76%
0.67%
Performing TDRs*
$526
$390
$359
$ in millions
Investor
$20,868
Multi-family
$2,615
Retail
$515
Residential
Construction
$1,790
A&D
Construction
$549
Office
$742
Other
$1,790
* TDR = troubled debt restructuring
$37,218
$37,884
$38,501
$39,318
$40,050
0.21%
-0.18%
-0.06%
-0.29%
-0.03%
-0.5%
0.0%
0.5%
1.0%
1.5%
-20,000
0
20,000
40,000
60,000
1Q13
2Q13
3Q13
4Q13
1Q14
Average Loans
CRE Mortgage
CRE Construction
Owner
Occupied
$11,181
Net Charge-offs Ratio |
 22
1Q14 Earnings
Conference Call
Credit Quality
-
Residential Mortgage
Average Loans and Net Charge-offs Ratios
Key Statistics
Comments
Modest growth in high quality originations (weighted average FICO 759, weighted
average LTV 70%), as average loans increased 1.7% over 4Q13
Over 78% of the balances have been originated since the beginning of 2009, the
origination quality metrics and performance to date have significantly
outperformed prior vintages with similar seasoning 1Q13
4Q13
1Q14
Average Loans
$45,109
$50,732
$51,584
30-89 Delinquencies
0.71%
0.70%
0.59%
90+ Delinquencies
0.54%
0.65%
0.64%
Nonperforming Loans
1.46%
1.51%
1.50%
$ in millions
** Excludes GNMA loans, whose repayments are insured by the FHA or guaranteed by
the Department of VA ($2,716 million 1Q14) $45,109
$46,873
$49,139
$50,732
$51,584
0.83%
0.63%
0.46%
0.38%
0.45%
0.0%
1.0%
2.0%
3.0%
4.0%
0
15,000
30,000
45,000
60,000
1Q13
2Q13
3Q13
4Q13
1Q14
Average Loans
Net Charge-offs Ratio
$2,035
$2,084
$2,030
$1,997
$1,962
0
1,000
2,000
3,000
4,000
1Q13
2Q13
3Q13
4Q13
1Q14
Residential Mortgage Performing TDRs** |
 23
1Q14 Earnings
Conference Call
1Q13
4Q13
1Q14
Average Loans
$16,528
$17,366
$17,407
30-89 Delinquencies
1.24%
1.25%
1.19%
90+ Delinquencies
1.26%
1.17%
1.21%
Nonperforming Loans
0.78%
0.43%
0.38%
Credit Quality -
Credit Card
Average Loans and Net Charge-offs Ratios
Key Statistics
Comments
Average loans flat on a linked quarter basis; up 5.3% year over year
Delinquencies have stabilized near historically low levels
Nonperforming loans continued to decline
$ in millions
$16,528
$16,416
$16,931
$17,366
$17,407
3.93%
4.23%
3.75%
3.72%
3.96%
0.0%
2.5%
5.0%
7.5%
10.0%
0
5,000
10,000
15,000
20,000
1Q13
2Q13
3Q13
4Q13
1Q14
Average Loans
Net Charge-offs Ratio
$127
$109
$94
$78
$65
0.78%
0.65%
0.55%
0.43%
0.38%
0.0%
0.6%
1.2%
1.8%
2.4%
0
40
80
120
160
1Q13
2Q13
3Q13
4Q13
1Q14
Credit Card Nonperforming Loans |
 24
1Q14 Earnings
Conference Call
Credit Quality -
Home Equity
High-quality originations (weighted average FICO on commitments was 765,
weighted average CLTV
70%)
originated
primarily
through
the
retail
branch
network
to
existing
bank
customers
on
their primary residence
Net charge-offs ratio continued to decline on a linked quarter basis
1Q13
4Q13
1Q14
Average Loans
$16,434
$15,488
$15,366
30-89 Delinquencies
0.70%
0.66%
0.57%
90+ Delinquencies
0.27%
0.32%
0.33%
Nonperforming Loans
1.25%
1.08%
1.09%
Subprime: 2%
Wtd Avg LTV**: 89%
NCO: 4.46%
$ in millions
Prime: 95%
Wtd Avg LTV**: 72%
NCO: 0.75%
** LTV at origination
Other: 3%
Wtd Avg LTV**: 72%
NCO: 0.83%
Average Loans and Net Charge-offs Ratios
Key Statistics
Comments
$16,434
$15,989
$15,648
$15,488
$15,366
1.80%
1.45%
1.09%
0.95%
0.82%
0.0%
1.5%
3.0%
4.5%
6.0%
0
6,000
12,000
18,000
24,000
1Q13
2Q13
3Q13
4Q13
1Q14
Average Loans
Net Charge-offs Ratio
Home Equity |
 25
1Q14 Earnings
Conference Call
Credit Quality -
Retail Leasing
Average Loans and Net Charge-offs Ratios
Key Statistics
Comments
Strong year-over-year growth (9.7%), driven by high-quality
originations (weighted average FICO 772) Delinquencies remained relatively
stable at very low levels Strong used auto values continued to contribute to
historically low net charge-offs 1Q13
4Q13
1Q14
Average Loans
$5,448
$5,847
$5,979
30-89 Delinquencies
0.12%
0.18%
0.16%
90+ Delinquencies
0.02%
0.00%
0.02%
Nonperforming Loans
0.02%
0.02%
0.02%
$ in millions
*
Manheim
Used
Vehicle
Value
Index
source:
www.manheimconsulting.com,
January
1995
=
100,
quarter
value
=
average
monthly
ending
value
$5,448
$5,653
$5,664
$5,847
$5,979
0.07%
-0.07%
0.07%
0.00%
0.00%
-
0.5%
0.0%
0.5%
1.0%
1.5%
0
3,000
6,000
9,000
1Q13
2Q13
3Q13
4Q13
1Q14
Average Loans
Net Charge-offs Ratio
90
100
110
120
130
Manheim Used Vehicle Index* |
 26
1Q14 Earnings
Conference Call
Credit Quality -
Other Retail
Average Loans and Net Charge-offs Ratios
Key Statistics
Comments
Auto
loan
growth
continued
to
offset
declines
in
student
lending
loan
balances
Net charge-offs and delinquencies remain low with declines on a linked quarter
basis reflecting seasonality
1Q13
4Q13
1Q14
Average Loans
$25,364
$26,059
$26,312
30-89 Delinquencies
0.48%
0.50%
0.40%
90+ Delinquencies
0.16%
0.14%
0.13%
Nonperforming Loans
0.10%
0.09%
0.08%
Revolving
Credit
$3,255
Student
Lending
$3,526
$ in millions
$25,364
$25,224
$25,682
$26,059
$26,312
0.83%
0.76%
0.83%
0.79%
0.69%
0.0%
1.0%
2.0%
3.0%
4.0%
0
10,000
20,000
30,000
40,000
1Q13
2Q13
3Q13
4Q13
1Q14
Average Loans
Net Charge-offs Ratio
Other Retail
Installment
$5,716
Auto Loans
$13,815 |
 27
1Q14 Earnings
Conference Call
Credit Quality -
Auto Loans
Average Loans and Net Charge-offs Ratios
Key Statistics
Comments
Continued growth in auto loans driven by high-quality originations in the
Indirect Channel (weighted average FICO 751)
Low net charge-offs and delinquencies declined on a linked quarter basis
reflecting seasonality and continued used vehicle value strength
1Q13
4Q13
1Q14
Average Loans
$12,519
$13,409
$13,815
30-89 Delinquencies
0.30%
0.34%
0.26%
90+ Delinquencies
0.03%
0.04%
0.03%
Nonperforming Loans
0.02%
0.02%
0.02%
$ in millions
Auto Loans are included in Other Retail category
Direct: 7%
Wtd Avg FICO: 748
NCO: 0.10%
Indirect: 93%
Wtd Avg FICO: 764
NCO: 0.08%
$12,519
$12,575
$12,946
$13,409
$13,815
0.16%
0.00%
0.09%
0.12%
0.09%
0.0%
0.2%
0.4%
0.6%
0.8%
0
4,000
8,000
12,000
16,000
1Q13
2Q13
3Q13
4Q13
1Q14
Average Loans
Indirect and Direct Channel
Net Charge-offs Ratio |
 28
1Q14 Earnings
Conference Call
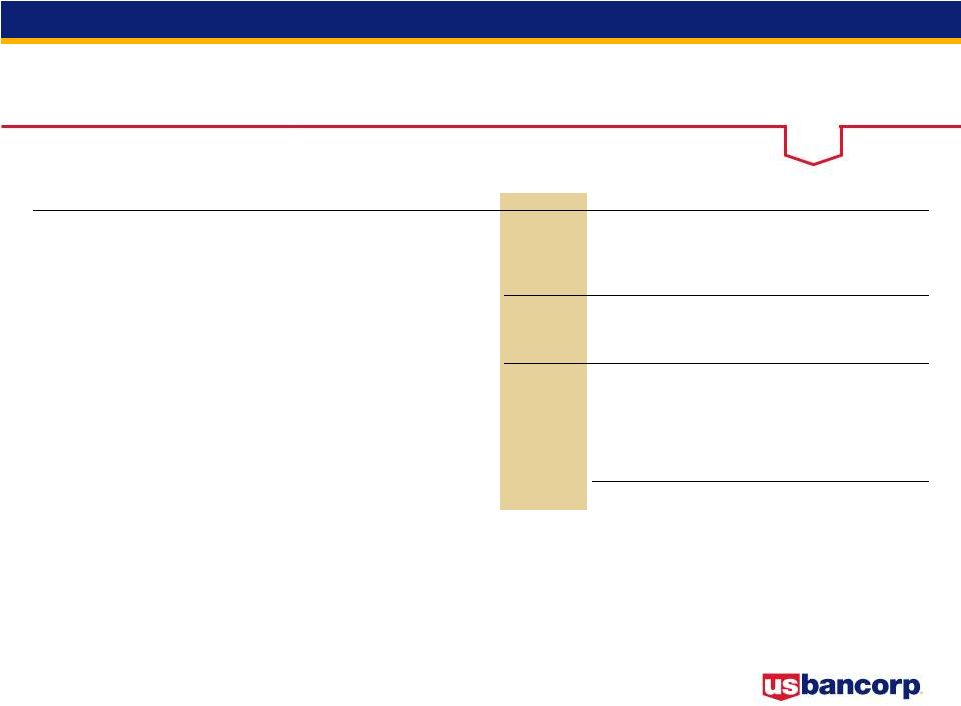
Mortgage Repurchase
Mortgages Repurchased and Make-whole Payments
Mortgage Representation and Warranties Reserve
$ in millions
1Q14
4Q13
3Q13
2Q13
1Q13
Beginning Reserve
$83
$176
$190
$233
$240
Net Realized Losses
(10)
(63)
(13)
(16)
(23)
Change in Reserve
2
(30)
(1)
(27)
16
Ending Reserve
$75
$83
$176
$190
$233
Mortgages
repurchased
and make-whole
payments
$36
$32
$42
$41
$79
Repurchase activity lower than
peers due to:
•
Conservative credit and
underwriting culture
•
Disciplined origination process -
primarily conforming
loans
(
95% sold to GSEs)
Do not participate in private
placement securitization market
Outstanding repurchase and
make-whole requests balance
= $44 million |
 29
1Q14 Earnings
Conference Call
Non-GAAP Financial Measures
$ in millions
1Q14
4Q13
3Q13
2Q13
1Q13
Total equity
42,743
$
41,807
$
41,552
$
41,050
$
40,847
$
Preferred stock
(4,756)
(4,756)
(4,756)
(4,756)
(4,769)
Noncontrolling interests
(689)
(694)
(1,420)
(1,367)
(1,316)
Goodwill (net of deferred tax liability) (1)
(8,352)
(8,343)
(8,319)
(8,317)
(8,333)
Intangible assets, other than mortgage servicing rights
(804)
(849)
(878)
(910)
(963)
Tangible common equity (a)
28,142
27,165
26,179
25,700
25,466
Tangible common equity (as calculated above)
28,142
27,165
26,179
25,700
25,466
Adjustments (2)
239
224
258
195
81
Common equity tier 1 capital estimated for the Basel III fully
implemented standardized approach (b)
28,381
27,389
26,437
25,895
25,547
Tier 1 capital, determined in accordance with prescribed
regulatory requirements using Basel I definition
33,386
32,707
32,219
31,774
Preferred stock
(4,756)
(4,756)
(4,756)
(4,769)
Noncontrolling interests, less preferred stock not eligible for Tier 1 capital
(688)
(686)
(685)
(684)
Tier 1 common equity using Basel I definition (c)
27,942
27,265
26,778
26,321
Note: The Basel III regulatory requirements for March 31, 2013, were based on the proposed rules for
the Basel III fully implemented standardized approach released June 2012, all other periods were
based on the final rules for the Basel III fully implemented standardized approach. (1) Includes
goodwill related to certain investments in unconsolidated financial institutions per prescribed regulatory requirements beginning March 31, 2014.
(2) Includes net losses on cash flow hedges included in accumulated other comprehensive income and
other adjustments. March 31, 2013, also includes a deduction
for disallowed mortgage servicing rights.
(3) Includes higher risk-weighting for unfunded loan commitments, investment securities, mortgage
servicing rights and other adjustments. March 31, 2013, also includes
higher risk-weighting for residential mortgages.
|
 30
1Q14 Earnings
Conference Call
Non-GAAP Financial Measures
$ in millions
1Q14
4Q13
3Q13
2Q13
1Q13
Total assets
371,289
$
364,021
$
360,681
$
353,415
$
355,447
$
Goodwill (net of deferred tax liability) (1)
(8,352)
(8,343)
(8,319)
(8,317)
(8,333)
Intangible assets, other than mortgage servicing rights
(804)
(849)
(878)
(910)
(963)
Tangible assets (d)
362,133
354,829
351,484
344,188
346,151
Risk-weighted assets, determined in accordance with prescribed
regulatory requirements (e)
302,841
*
297,919
293,155
289,613
289,672
Adjustments (3)
13,238
*
13,712
13,473
12,476
21,021
Risk-weighted assets estimated for the Basel III fully implemented
standardized approach (f)
316,079
*
311,631
306,628
302,089
310,693
Ratios *
Tangible common equity to tangible assets (a)/(d)
7.8%
7.7%
7.4%
7.5%
7.4%
Tangible common equity to risk-weighted assets (a)/(e)
9.3%
9.1%
8.9%
8.9%
8.8%
Tier 1 common equity to risk-weighted assets using Basel I definition (c)/(e)
9.4%
9.3%
9.2%
9.1%
Common equity tier 1 capital to risk-weighted assets estimated for the
Basel III fully implemented standardized approach (b)/(f)
9.0%
8.8%
8.6%
8.6%
8.2%
* Preliminary data. Subject to change prior to filings with applicable regulatory
agencies. Note: The Basel III regulatory requirements for March 31, 2013, were based on the
proposed rules for the Basel III fully implemented standardized approach released June 2012, all
other periods were based on the final rules for the Basel III fully implemented standardized approach.
(1) Includes goodwill related to certain investments in unconsolidated financial institutions per
prescribed regulatory requirements beginning March 31, 2014. (2) Includes net losses on cash
flow hedges included in accumulated other comprehensive income and other adjustments. March 31, 2013, also includes a deduction
for disallowed mortgage servicing rights.
(3) Includes higher risk-weighting for unfunded loan commitments, investment securities, mortgage
servicing rights and other adjustments. March 31, 2013, also includes
higher risk-weighting for residential mortgages.
|
 U.S.
Bancorp 1Q14 Earnings
Conference Call
U.S. Bancorp
1Q14 Earnings
Conference Call
April 16, 2014 |