Attached files
| file | filename |
|---|---|
| 8-K - 8-K - OLD DOMINION ELECTRIC COOPERATIVE | d703088d8k.htm |
 Year
End 2013 Investor Briefing
March 27, 2014
Exhibit 99.1 |
 Management Participants
Year End 2013 Investor Briefing
Jack Reasor
Chief Executive Officer
Bob Kees
Senior Vice President and
Chief Financial Officer
Rick Beam
Senior Vice President of Power Supply
Todd Brickhouse
Vice President –
Treasurer
Lynn Maloney
Vice President –
Financial Reporting
and Investor Relations
Page 2 |
 Note Regarding
Forward Looking and Other Statements The
information
contained
herein,
and
presented
by
representatives
of
Old
Dominion
Electric
Cooperative
(ODEC
or
we
or
our),
include,
or
are
based
upon,
forward
looking
statements
and
assumptions
regarding
matters
that
could
have
an
impact
on
our
business,
financial
condition,
and
future
operations.
These
statements
and
assumptions,
based
on
our
expectations
and
estimates,
are
not
guarantees
of
future
performance,
and
are
subject
to
risks,
uncertainties,
and
other
factors
that
could
cause
our
actual
results
to
differ
materially
from
those
described
herein.
These
risks,
uncertainties
and
other
factors
include,
but
are
not
limited
to,
general
business
conditions,
federal
and
state
legislative
and
regulatory
actions,
and
general
credit
and
capital
market
conditions.
Any
forward
looking
statement
or
assumption
speaks
only
as
of
the
date
on
which
the
statement
or
assumption
is
made,
and
we
undertake
no
obligation
to
update
any
forward
looking
statements
or
assumptions
to
reflect
events
or
circumstances
after
this
date,
even
if
new
information
becomes
available
or
other
events
occur
after
the
date
of
this presentation.
These
presentation
materials
highlight
some
of
the
information
contained
in
our
SEC
filings
and
is
qualified
in
its
entirety
by
the
detailed
information
contained
in
our
SEC
filings
and
elsewhere
in
this
presentation.
This
presentation
may
not
contain
all
the
information
that
is
important
to
you.
You
should
read
this
information
in
conjunction
with
the
detailed
information
contained
elsewhere
in
our
SEC
filings.
Year End 2013 Investor Briefing
Page 3 |
 OVERVIEW |
 ODEC
Overview Our Business
•
Not-for-profit tax-exempt
power supply cooperative
•
Provide power to 11
distribution cooperatives
(Members) in VA, DE, and
MD who are our owners
•
Own 2,021 MW of primarily
nuclear, coal, and natural
gas generation
•
PJM RTO member
•
FERC regulated
•
SEC registrant
•
Non-RUS borrower
Our Members
•
Purchase ODEC power
under all-requirements,
take-or-pay wholesale
power contracts through
at least 2053
•
Providers of power to
over 550,000 customers
(1.2 million people)
•
VA and MD Members’
distribution rates
regulated by state
commissions
Our 2013 Results
•
Continued growth and
strong financial performance
•
Peak demand = 2,555 MW
•
Energy sales = 12,983 GWh
•
Revenues = $842 million
•
Total assets = $1.5 billion
•
Equity ratio = 32% *
Our Credit Ratings
•
S&P –
A (secured and issuer), stable outlook
•
Moody’s –
A2 (secured), stable outlook
•
Fitch –
A (secured and implied unsecured), stable outlook
*
Equity ratio equals patronage capital divided by the sum of our long-term debt,
long-term debt due within one year, revolving credit facilities, and
patronage capital.
Year End 2013 Investor Briefing
Page 5 |
 Highlights
Year End 2013 Investor Briefing
Page 6
Wildcat Point
Generation Facility
•
Pursuing construction of natural gas-fueled combined
cycle facility in Rock Springs, Maryland
•
1,000 MW approximate size
•
Mid-2017 anticipated in-service
FERC Formula
Revision
•
Revised formula to better align cost recovery with PJM
cost allocation methodologies
•
Formula continues to collect all costs and expenses
plus net margin
Debt Portfolio
Changes
•
Optionally redeemed $60 million of tax-exempt debt
with weighted interest rate of approximately 5.3%
•
Issued $100 million of taxable debt with weighted
interest rate of approximately 4.3%
•
Extended $500 million revolver until March 2019
Credit Rating
Upgrade
•
Moody’s senior secured debt ratings increased from
“A3”
to “A2” |
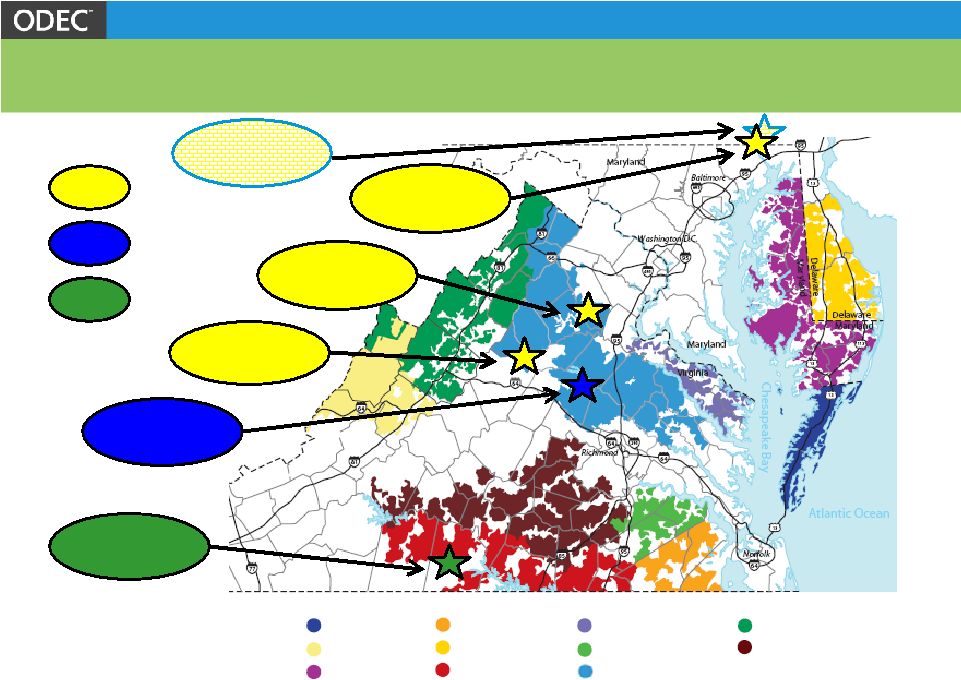 Rock
Springs 336 MW
Marsh Run
504 MW
Louisa
504 MW
Clover
437 MW
North Anna
220 MW
Natural
Gas
Nuclear
Coal
A&N
BARC
Choptank
Community
Delaware
Mecklenburg
Northern Neck
Prince George
Rappahannock
Shenandoah Valley
Southside
Members’
Service Territories
Year End 2013 Investor Briefing
Page 7
Wildcat Point
1,000 MW |
 Wholesale Power Contracts (WPCs)
WPCs, which extend through at least 2053, obligate ODEC to
deliver,
and
the
Members
to
purchase,
all
of
the
Members’
power
requirements with the following exceptions:
•
ODEC’s mainland Virginia Members can purchase hydroelectric
power from the Southeastern Power Administration (SEPA)
Approximately 1.5% of Members’
2013 energy requirements
•
Members can receive up to the greater of 5% or 5 MW of their power
requirements from owned generation or other suppliers, and in limited
circumstances, additional amounts if so approved by ODEC’s Board
During 2013, Members received 6.7 MW under these exceptions
During 2014, we currently anticipate Members will receive approximately
69 MW under these exceptions
Year End 2013 Investor Briefing
Page 8 |
 Members
ODEC’s load is diversified across 11 Members, with our largest
member, Rappahannock Electric Cooperative, accounting for 34%
of our 2013 revenues from sales to Members
Member
Revenues
(in millions)
(%)
Rappahannock
$275.9
34.0
Shenandoah Valley
150.4
18.6
Delaware
94.7
11.7
Choptank
72.1
8.9
Southside
64.5
8.0
A&N
47.8
5.9
Mecklenburg
39.7
4.9
Prince George
21.6
2.7
Northern Neck
19.5
2.4
Community
13.9
1.7
BARC
10.0
1.2
$810.1
100.0%
Year End 2013 Investor Briefing
Page 9 |
 Members
continue
to
experience
growth
–
from
2008
through
2013,
compound
annual
growth
rates
*
were:
•
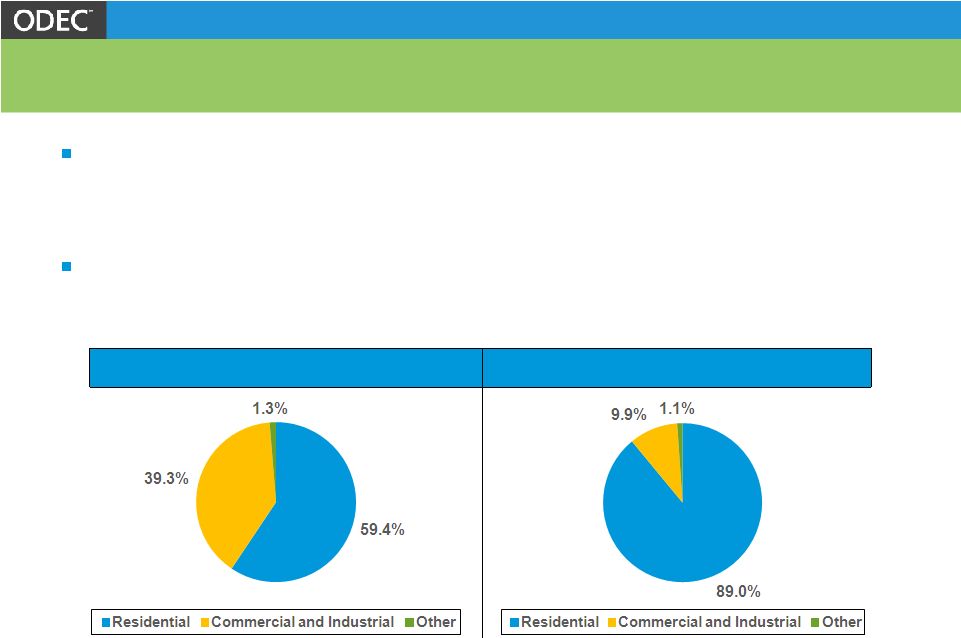
0.4% in total number of customers
No individual retail customer constituted more than 3.2% of ODEC’s
2013 total revenues from sales to Members
*
Excludes 2010 Potomac Edison acquisition and West Virginia disposition; growth
includng these events equals 4.8% and 7.3% in total number
of
customers
and
total
energy
sales
volume,
respectively.
Also,
excludes
Northern
Virginia
Electric
Cooperative
(NOVEC)
which withdrew as a Member January 1, 2009.
Year End 2013 Investor Briefing
Page 10
•
1.3% in total energy sales volume
2013 Percentage of MWh Sales
2013 Percentage of Customers |
 RATES
AND
POWER SUPPLY |
 Rate
Regulation Entity
Regulator
Changes that Require
Approval
Changes that Do Not Require
Approval
Virginia Members
VSCC
Members’
distribution rates
ODEC’s energy and demand rates
Maryland Member
MPSC
Member’s distribution rates
ODEC’s energy and demand rates
Delaware Member
None
N/A
ODEC’s energy and demand rates
ODEC
FERC
Formula rate components
ODEC’s energy and demand rates
ODEC’s cost-based FERC formula rate allows us to collect
revenues to meet all costs, expenses, and financial obligations
plus additional board-approved equity contributions, and to
change rates in accordance with the formula without seeking
FERC approval
•
Exceptions are decommissioning costs (currently $0), changes to
depreciation rates, and changes to account classifications or the
addition of accounts to the formula
Year End 2013 Investor Briefing
Page 12 |
 FERC
Formula Rate September 30, 2013 –
ODEC filed revised rate schedule at FERC to more
closely align our cost recovery from our Members with methodologies used
by PJM to allocate costs
•
Major revision –
demand rate, previously one rate, became three rates:
Transmission
service
rate
–
Designed
to
collect
transmission-related
and
distribution-
related
costs
RTO
capacity
service
rate
–
Proxy
rate
based
on
capacity
prices
in
PJM
which
PJM
allocates
to
ODEC
and
all
other
RTO
members
Remaining
owned
capacity
service
rate
–
Recovers
all
remaining
demand
costs
not
billed
and/or
recovered
under
other
two
rates
•
Formula continues to collect all costs and expenses plus net margin
December 2, 2013 –
FERC accepted revised rate schedule, subject to
refund, and established hearing and settlement procedures in response to
intervention by Bear Island Paper WB LLC
•
January 1, 2014 –
Revised rate schedule became effective
•
Settlement discussions with Bear Island are on-going and the outcome cannot
currently be determined
Year End 2013 Investor Briefing
Page 13 |
 2013
Resource Mix Energy
(MWh)
2013 Peak Demand = 2,555 MW (January)
2013 Energy Sales = 12,982,861 MWh
Capacity
(MW)
Year End 2013 Investor Briefing
Page 14
*
We sell renewable energy credits related to these purchases to our Members and
non-members. North
Anna
(nuclear)
Clover
(coal)
North
Anna
(nuclear)
45%
|
 Owned
Generation Statistics – December 31, 2013
Facilities
1
Clover
North Anna
CTs
2
Primary Fuel Type
coal
nuclear
natural gas
Operator
VA Power
VA Power
ODEC/EP
2
Net Utility Plant in Service (w/o CWIP)
$323 million
$151 million
3
$387 million
Net Capacity Entitlement
437 MW
220 MW
1,344 MW
Net Capital Investment
$739/KW
$686/KW
$288/KW
Average Operational Availability
96.3%
88.8%
96.8%
Average Capacity Factor
78.0%
90.6%
-
1
ODEC also owns 10 diesel units (20 MW), primarily to enhance system
reliability. 2
ODEC
owns
three
combustion
turbine
facilities.
We
operate
our
two
facilities
in
Virginia;
Essential
Power
Operating
Co.,
LLC
(EP)
operates
our Rock Springs, Maryland units.
3
Excludes decommissioning and nuclear fuel.
Year End 2013 Investor Briefing
Page 15 |
 Wildcat Point Generation Facility
Size –
Approximately 1,000 MW
Type –
Natural gas-fueled combined
cycle (2X1)
Composition:
•
2 Mitsubishi combustion turbines
•
2 Alstom heat recovery steam
generators
•
1 Alstom steam turbine generator
Location –
Existing Rock Springs
Generation Facility, Cecil County
Maryland
•
Rock Springs owned 50/50 with
Essential Power, LLC
•
Wildcat Point will be owned 100% by
ODEC
Costs –
Preliminary estimated overnight
costs of $675 million (excludes certain
owners costs and financing costs)
Photo simulation of proposed plant at existing Rock Springs CT site.
Year End 2013 Investor Briefing
Page 16 |
 Wildcat Point Generation Facility
Year End 2013 Investor Briefing
Page 17
Major Milestones
to Date
•
April 23, 2013
–
ODEC announced plans to construct
Wildcat Point
•
May 20, 2013
–
ODEC applied to the Maryland Public
Service Commission (MPSC) for a Certificate of Public
Convenience and Necessity (CPCN) to construct facility
•
March 24, 2014
–
MPSC issued a Proposed Order granting
the CPCN
Future
Anticipated
Milestones
•
April 8, 2014
–
Proposed Order becomes a Final Order
•
Mid-2014
–
Approval of engineering, procurement and
construction (EPC) contractor by ODEC Board
•
Late 2014
–
Construction commencement
•
Mid-2017
–
Commercial operation |
 Capital Expenditures (including nuclear fuel and capitalized
interest) Projected =
$878.5 million
Actual
=
$110.6 million
Wildcat Point
-----
-----
6.0
98.7
455.8
185.4
Existing Assets
46.1
32.4
26.1
51.9
46.5
40.2
Total
46.1
32.4
32.1
150.6
502.3
225.6
Year End 2013 Investor Briefing
Page 18 |
 FINANCE |
 9%
3 %
4%
11%
4 %
2%
9%
1 %
2%
Sales and Revenues
Factors affecting results:
2011
•
First full year with
Potomac Edison
acquisition load
•
Milder temperatures
2012
•
Decrease in energy rate
•
Decrease in demand
costs
2013
•
Net decrease in energy
rate
•
Wildcat Point
preconstruction costs
Revenues from Non-members
37.6
15.9
31.9
Demand Revenues from Members
312.7
299.3
305.3
Energy Revenues from Members
541.2
527.5
504.9
MWh Sales to Members (right axis)
12.2
12.1
12.4
Year End 2013 Investor Briefing
Page 20 |
 Income Statement Analysis
2013 % change
2012 % change
2011
Energy Sales to Members
12,356,005 MWh
2.1%
12,096,230 MWh
(0.9%)
12,205,602 MWh
Energy Sales to Non-members
626,856 MWh
23.3%
508,443 MWh
(46.0%)
941,908 MWh
Total Energy Sales
12,982,861 MWh
3.0%
12,604,673 MWh
(4.1%)
13,147,510 MWh
Demand Sales to Members
24,589 MW
2.3%
24,027 MW
(0.6%)
24,166 MW
Revenues from Sales to Members
$810.1 million
(2.0%)
$826.8 million
(3.2%)
$853.9 million
Total Operating Revenues
$842.1 million
(0.1%)
$842.7 million
(5.5%)
$891.5 million
Total Operating Expenses
$789.5 million
0.8%
$783.5 million
(5.5%)
$828.9 million
Net Margin attributable to ODEC
$9.6 million
(3.7%)
$9.9 million
(8.0%)
$10.8 million
Margin Stabilization Refund
$9.8 million
$15.0 million
$14.9 million
Average Total Cost to Members
$65.57/MWh
(4.1%)
$68.35/MWh
(2.3%)
$69.96/MWh
Margins for Interest (MFI) Ratio *
1.21
1.21
1.22
*
Per
the
Indenture
we
must
establish
and
collect
rates
which
are
reasonably
expected
to
yield
an
MFI
ratio
of
at
least
1.10.
MFI
ratio
is
calculated
by
dividing
margins
for
interest
by
interest
charges,
as
those
terms
are
defined
in
the
Indenture.
For
further
description
of
these
terms and calculation, see ITEM 6. SELECTED FINANCIAL DATA in ODEC’s 2013
Annual Report on Form 10-K. Year End 2013 Investor Briefing
Page 21 |
 Balance Sheet Analysis
2013 %
change 2012
% change 2011
Net Electric Plant
$965.4 million
(2.6%)
$991.3 million
(2.1%)
$1,012.9 million
Total Investments
256.0 million
(2.7%)
263.0 million
11.8%
235.2 million
Other Assets
309.2 million
6.9%
289.2 million
(11.3%)
325.9 million
Total Assets
$1,530.6 million
(0.8%)
$1,543.5 million
(1.9%)
$1,574.0 million
Patronage Capital
$370.0 million
2.7%
$360.4 million
2.8%
$350.5 million
Non-controlling Interest
5.7 million
(57.1%)
13.3 million
1.3%
13.1 million
Long-term Debt
749.3 million
1.6%
737.8 million
(3.7%)
766.1 million
Long-term Debt due w/in One Year
28.3 million
-
28.3 million
-
28.3 million
Revolving Credit Facilities
-
-
-
-
-
Total Capitalization and
Short-term Debt
$1,153.3 million
1.2%
$1,139.8 million
(1.6%)
$1,158.0 million
Equity Ratio *
32.2%
32.0%
30.6%
Deferred Energy
$37.2 million
(33.6%)
$56.0 million
61.4%
$34.7 million
*
Equity ratio equals patronage capital divided by the sum of our
long-term debt, long-term debt due within one year, revolving credit facilities,
and patronage capital.
Year End 2013 Investor Briefing
Page 22 |
 Debt
Portfolio Changes June 1, 2013
–
Optionally redeemed $60.2 million of tax-exempt debt
•
$27,755,000 2002 Series A Bonds at 5.000%
•
$32,455,000 2002 Series A Bonds at 5.625%
June 28, 2013
–
Issued $100 million in a private placement
•
$50 million First Mortgage Bonds, 2013 Series A due 2043 at 4.21%,
•
$50 million First Mortgage Bonds, 2013 Series B due 2053 at 4.36%
March 12, 2014
–
Extended $500 million syndicated revolving credit
facility to March 5, 2019
Year End 2013 Investor Briefing
Page 23 |
 Summary
Year End 2013 Investor Briefing
Page 24
•
Economically stable, highly residential service territory
•
Long-term all-requirements wholesale power contracts
•
Favorable regulatory environment
•
Diversified portfolio of power supply resources
•
Wildcat Point to reduce reliance on purchased power
•
Consistently strong financial performance
•
SEC registrant and Sarbanes-Oxley compliant
•
Proven ability to secure liquidity and access capital
•
“A”
(stable outlook) and “A2”
(stable outlook) credit ratings |
 Additional Information
Year End 2013 Investor Briefing
Name
Title
E-mail Address
Phone Number
Bob Kees
SVP and Chief Financial Officer
bkees@odec.com
804-968-4034
Todd Brickhouse
VP –
Treasurer
tbrickhouse@odec.com
804-968-4012
Lynn Maloney
VP –
Financial Reporting and
Investor Relations
lmaloney@odec.com
804-968-4065
Page 25
A link to this presentation will be posted on ODEC’s website
www.odec.com
ODEC’s SEC filings, including Forms 10-K, 10-Q and 8-K, are also
available on our website
For additional information please refer to the contacts below
|