Attached files
| file | filename |
|---|---|
| EX-31.1 - EX-31.1 - Sierra Income Corp | d683812dex311.htm |
| EX-32.1 - EX-32.1 - Sierra Income Corp | d683812dex321.htm |
| EX-31.2 - EX-31.2 - Sierra Income Corp | d683812dex312.htm |
Table of Contents
UNITED STATES
SECURITIES AND EXCHANGE COMMISSION
WASHINGTON, DC 20549
Form 10-K
(Mark One)
| x | ANNUAL REPORT PURSUANT TO SECTION 13 OR 15(d) OF THE SECURITIES EXCHANGE ACT OF 1934 |
For the fiscal year ended December 31, 2013
or
| ¨ | TRANSITION REPORT PURSUANT TO SECTION 13 OR 15(d) OF THE SECURITIES EXCHANGE ACT OF 1934 |
For the transition period from to
Commission file number: 814-00924
Sierra Income Corporation
(Exact Name of Registrant as Specified in its Charter)
| Maryland | 45-2544432 | |
| (State or Other Jurisdiction of Incorporation or Organization) |
(I.R.S. Employer Identification No.) | |
| 375 Park Avenue, 33rd Floor, New York, NY 10152 | 10152 | |
| (Address of Principal Executive Offices) | (Zip Code) | |
(212) 759-0777
(Registrant’s Telephone Number, Including Area Code)
Securities registered pursuant to Section 12(b) of the Act:
Common Stock, par value $0.001 per share
Securities registered pursuant to Section 12(g) of the Act:
None
Indicate by check mark if the registrant is a well-known seasoned issuer, as defined in Rule 405 of the Securities
Act. Yes ¨ No x
Indicate by check mark if the registrant is not required to file reports pursuant to Section 13 or 15(d) of the
Act. Yes ¨ No x
Indicate by check mark whether the registrant: (1) has filed all reports required to be filed by Section 13 or 15(d) of the Securities Exchange Act of 1934 during the preceding 12 months (or for such shorter period that the registrant was required to file such reports), and (2) has been subject to such filing requirements for the past 90 days. Yes x No ¨
Indicate by check mark if disclosure of delinquent filers pursuant to Item 405 of Regulation S-K is not contained herein, and will not be contained, to the best of the registrant’s knowledge, in definitive proxy or information statements incorporated by reference in Part III of this Form 10-K or any amendment to this Form 10-K. ¨
Indicate by check mark whether the registrant has submitted electronically and posted on its corporate Web site, if any, every Interactive Data File required to be submitted and posted pursuant to Rule 405 of Regulation S-T (§232.405 of this chapter) during the preceding 12 months (or for such shorter period that the registrant was required to submit and post such files). Yes ¨ No ¨
Indicate by check mark whether the registrant is a large accelerated filer, an accelerated filer, a non-accelerated filer or a smaller reporting company. See definitions of “large accelerated filer”, “accelerated filer” and “smaller reporting company” in Rule 12b-2 of the Exchange Act. (Check one):
| Large accelerated filer | ¨ | Accelerated filer | ¨ | |||
| Non-accelerated filer | x | Smaller reporting company | ¨ | |||
Indicate by check mark whether the registrant is a shell company (as defined in Rule 12b-2 of the Securities Exchange Act of 1934). Yes ¨ No x
There is no established market for the Registrant’s shares of common stock. The Registrant is currently conducting an ongoing public offering of its shares of common stock pursuant to a Registration Statement on Form N-2, which shares are being sold at a price of $10.20 per share, with discounts available for certain categories of purchasers, or at a price necessary to ensure that shares are not sold at a price per share, after deduction of selling commissions and dealer manager fees, that is below net asset value per share.
As of March 13, 2014, the Registrant had 22,542,683 shares of common stock, $0.001 par value, outstanding.
DOCUMENTS INCORPORATED BY REFERENCE
Portions of the registrant’s proxy statement to be filed with the Securities and Exchange Commission pursuant to Regulation 14A in connection with the registrant’s 2013 Annual Meeting of Stockholders, which will be filed subsequent to the date hereof, are incorporated by reference into Part III of this Form 10-K. Such proxy statement will be filed with the Securities and Exchange Commission not later than 120 days following the end of the Registrant’s fiscal year ended December 31, 2013.
Table of Contents
SIERRA INCOME CORPORATION
2
Table of Contents
In this annual report on Form 10-K, except as otherwise indicated, the terms:
| • | “we”, “us”, “our”, “Sierra” and the “Company” refer to Sierra Income Corporation, a Maryland corporation. |
| • | “SIC Advisors” and the “Advisor” refer to SIC Advisors LLC, our investment advisor; and |
| • | “Medley” refers, collectively, to the activities and operations of Medley Capital LLC, Medley, LLC, associated investment funds and their respective affiliates. |
| Item 1. | Business |
GENERAL
Sierra Income Corporation is a non-diversified closed-end management investment company incorporated in Maryland that has elected to be treated and is regulated as a business development company (“BDC”) under the Investment Company Act of 1940, as amended (the “1940 Act”). The Company has elected and to intends to qualify to be treated for U.S. federal income tax purposes as a regulated investment company (“RIC”) under subchapter M of the Internal Revenue Code of 1986, as amended (the “Code”) commencing with its taxable year ended December 31, 2012, and intends to qualify annual thereafter. We are externally managed and advised by our investment adviser, SIC Advisors LLC (“SIC Advisors”) pursuant to an investment advisory agreement.
Our investment objective is to generate current income, and to a lesser extent, long-term capital appreciation. We intend to meet our investment objective by investing primarily in the debt of privately owned U.S. companies with a focus on senior secured debt, second lien debt and, to a lesser extent, subordinated debt. We will originate transactions sourced through our existing SIC Advisors’ network, and expect to acquire debt securities through the secondary market. We may make equity investments in companies that we believe will generate appropriate risk adjusted returns, although we do not expect this to be a substantial portion of our portfolio.
Our Advisor
Our investment activities are managed by our investment adviser, SIC Advisors, which is a registered investment adviser under the Investment Advisers Act of 1940, as amended, or the Advisers Act, and a majority owned subsidiary of Medley, LLC. SIC Advisors is responsible for sourcing potential investments, conducting due diligence on prospective investments, analyzing investment opportunities, structuring investments and monitoring our portfolio on an ongoing basis.
Seth Taube, Robert Comizio, Brook Taube and Jeff Tonkel serve as principals of the Advisor and bring an average of more than 20 years of experience in principal finance, investment sourcing, credit analysis, transaction structuring, due diligence and investing.
Medley serves as our administrator and provides us with office space, equipment and other office services. The responsibilities of our administrator include overseeing our financial records, preparing reports to our stockholders and reports filed with the Securities and Exchange Commission (the “SEC”) and generally monitoring the payment of our expenses and the performance of administrative and professional services rendered to us by others.
Formation
Sierra Income Corporation was incorporated under the general corporation laws of the State of Maryland on June 13, 2011.
3
Table of Contents
On April 17, 2012, we successfully reached our minimum escrow requirement and officially commenced our operations by receiving gross proceeds of $10,000,000 in exchange for 1,108,033 shares of common stock sold to SIC Advisors. Our offering period was initially scheduled to terminate two years after the initial offering date or, April 16, 2014, unless extended. At a meeting held on March 12, 2014, our board of directors approved an extension of our offering for an additional year. Since commencing operations, we have sold a total of 16,663,500 shares of common stock for total gross proceeds of $160.9 million. The proceeds from the issuance of common stock as presented in our consolidated statements of changes in net assets and consolidated statements of cash flows are presented net of selling commissions and dealer manager fees.
Investment Process Overview
We have a disciplined and repeatable process for executing, monitoring, structuring and exiting investments.
Identification and Sourcing. The Advisor’s investment team’s experience and reputation have allowed it to generate a substantial and continuous flow of attractive investment opportunities. The principals of SIC Advisors maintain a strong and diverse network which results in sustained and high quality deal flow. We believe that SIC Advisors’ breadth and depth of experience across strategies and asset classes, coupled with its significant relationships built over the last 20 years, make it particularly qualified to uncover, evaluate and aggressively pursue attractive investment opportunities. Leveraging its deal-flow network, the principals of SIC Advisors have compiled a robust current pipeline of transactions ready for possible inclusion in our portfolio.
Analysis and Due Diligence. The Advisor’s investment team believes that its expertise in underwriting, financial analysis and enterprise valuation enables it to identify compelling transactions among the numerous opportunities in the private market. Typically, a principal of the Advisor will lead a transaction and work closely with other SIC Advisors’ investment professionals on the various aspects of the due diligence process.
SIC Advisors maintains a rigorous due diligence process. Prior to making each investment, SIC Advisors subjects each potential portfolio company to an extensive credit review process, including analysis of market and operational dynamics as well as both historical and projected financial analysis. Liquidity, margin trend, leverage, free cash flow and fixed charge coverage statistics as well as their relation to industry metrics are closely scrutinized. Sensitivity analysis is performed on borrower projections with a focus on downside scenarios involving liquidations and asset sales. Areas of additional focus include management or sponsor experience, management compensation, competitive landscape, regulatory threats, pricing power, defensibility of market share and tangible asset values. As the Advisor deems necessary, background checks and tax compliance checks may be conducted on portfolio company management teams and key employees. When appropriate, our investment team personally contacts customers, suppliers and competitors and performs on-site, primary and in-depth due diligence to prove or disprove its investment theses.
For secondary purchases of investments, SIC Advisors generally seeks to perform the same level of analysis and due diligence as it performs for newly originated investments, except to the extent not feasible given the nature of these investments.
SIC Advisors routinely uses third parties to corroborate valuation, audit and industry specific diligence. Reputable and experienced legal counsel is engaged to evaluate and mitigate any security, regulatory, insurance, tax or other company-specific risk. In reviewing each investment, one or more of the employees of the Advisor may conduct site visits to portfolio companies and their various assets. The principals of the Advisor’s will also analyze corporate documents and review any and all relevant contracts. Finally, multiple investment committee approvals, each requiring a unanimous decision, are necessary to close and fund a transaction. All reimbursements to SIC Advisors for any third-party consulting agreements shall be subject to the limitations set forth in “Discussion of Expected Operating Plans — Reimbursement of Medley for Administrative Services.”
Structuring. For newly originated investments, SIC Advisors strives to negotiate an optimal combination of current and deferred interest payments, equity participation and prepayment penalties, along with suitable
4
Table of Contents
covenants and creditor rights which will generally be greater than the rights normally obtained by institutional investors in comparable transactions and may include such provisions as: specific rights to consult with and advise management, the right to inspect company books, records or facilities, as well as the right to review balance sheets and/or statements of income and cash flows of the company. SIC Advisors determines whether the investment structure, particularly the amount of debt, is appropriate for the portfolio company’s business, sometimes reassessing the investment’s risk/return profile and adjusting pricing and other terms as necessary. The Advisor’s investment team has in-depth restructuring, liquidation and bankruptcy experience, which is vital to success as a lender over market cycles.
For secondary purchases of investments, SIC Advisors reviews the legal documentation relating to the investments to ensure that they contain appropriate covenants and creditors’ rights and that we can maintain adequate control over the investments through the exercise of voting and approval rights.
Investment Approval. After SIC Advisors completes its final due diligence, each proposed investment is presented to its investment committee and subjected to extensive discussion and follow-up analysis, if necessary. A formal memorandum for each investment opportunity, which includes the results of business due diligence, multi-scenario financial analysis, risk-management assessment, results of third-party consulting work, background checks and structuring proposals is prepared for the investment committee.
Investment Monitoring and Exit. SIC Advisors believes in an active approach to asset management. Investment professionals, each with deep restructuring and workout experience, will support SIC Advisors portfolio-monitoring effort. The monitoring process includes frequent interaction with management, attending board of directors’ meetings, consulting with industry experts, working with third-party consultants and developing portfolio company strategy with equity investors. SIC Advisors’ investment team also evaluates financial reporting packages from portfolio companies that detail operational and financial performance. Data is entered into SIC Advisors’ proprietary, centralized electronic database. Additionally, this information is reviewed monthly as part of our portfolio monitoring process. To further support this process, SIC Advisors’ investment team conducts regular third-party valuation analyses and continually monitors future liquidity, covenant compliance and leading industry or economic indicators to maintain a proactive rather than reactive approach to asset management. We believe this hands-on approach helps in the early identification of any potential problems.
Each transaction is presented to the investment committee in a formal written report. All of our new investments and the exit or sale of an existing investment must be approved unanimously by the investment committee. In certain instances, our board of directors may also determine that its approval is required prior to the making of an investment.
Investment Structure
For newly originated investments, SIC Advisors strives to negotiate an optimal combination of current and deferred interest payments, equity participation and prepayment penalties, along with suitable covenants and creditor rights which will generally be greater than the rights normally obtained by institutional investors in comparable transactions and may include such provisions as: specific rights to consult with and advise management, the right to inspect company books, records or facilities, as well as the right to review balance sheets and/or statements of income and cash flows of the company. SIC Advisors determines whether the investment structure, particularly the amount of debt, is appropriate for the portfolio company’s business, sometimes reassessing the investment’s risk/return profile and adjusting pricing and other terms as necessary. The Advisor’s investment team has in-depth restructuring, liquidation and bankruptcy experience which is vital to success as a lender over market cycles.
Investment Committee
The purpose of the investment committee is to evaluate and approve all investments by SIC Advisors. The investment committee is comprised of Seth Taube, Robert Comizio, Brook Taube and Jeff Tonkel. Approval of
5
Table of Contents
an investment requires a unanimous vote of the investment committee. The committee process is intended to bring the diverse experience and perspectives of the committee members to the analysis and consideration of every investment. The investment committee also serves to provide consistency and adherence to SIC Advisors’ investment philosophies and policies. The investment committee also determines appropriate investment sizing and suggests ongoing monitoring requirements.
In addition to reviewing investments, investment committee meetings serve as a forum to discuss credit views and outlooks. Potential transactions and deal flow are also reviewed on a regular basis. Members of the investment committee are encouraged to share information and views on credits with the investment committee early in their analysis. This process improves the quality of the analysis and assists the deal team members to work more efficiently.
Managerial Assistance
As a BDC, we will offer, and must provide upon request, managerial assistance to certain of our portfolio companies. This assistance could involve, among other things, monitoring the operations of our portfolio companies, participating in board and management meetings, consulting with and advising officers of portfolio companies and providing other organizational and financial guidance. We may receive fees for these services and will reimburse Medley, as our administrator, for its allocated costs in providing such assistance subject to review and approval by our board of directors. Medley will provide such managerial assistance on our behalf to portfolio companies that request this assistance.
Competition
Our primary competitors to provide financing to private and middle-market companies are public and private funds, commercial and investment banks, commercial finance companies, other BDCs, small business investment companies (“SBIC”) and private equity and hedge funds. Some competitors may have access to funding sources that are not available to us. In addition, some of our competitors may have higher risk tolerances or different risk assessments, which could allow them to consider a wider variety of investments and establish more relationships than us. Furthermore, many of our competitors are not subject to the regulatory restrictions that the 1940 Act imposes on us as a BDC or to the distribution and other requirements we must satisfy to maintain our favorable RIC tax status.
Staffing
We do not currently have any employees and do not expect to have any employees. Services necessary for our business are provided by individuals who are employees of SIC Advisors and Medley, pursuant to the terms of the investment advisory agreement and the administration agreement. Our day-to-day investment operations are managed by our Advisor. In addition, we reimburse Medley for our allocable portion of expenses incurred by it in performing its obligations under the administration agreement, including our allocable portion of the cost of our officers and their respective staffs.
Administration
We entered into an administration agreement with Medley Capital LLC (the “Administration Agreement”) pursuant to which Medley Capital LLC furnishes us with administrative services necessary to conduct our day-to-day operations. Medley Capital LLC is reimbursed for administrative expenses it incurs on the Company’s behalf in performing its obligations. Such costs are reasonably allocated to us on the basis of assets, revenues, time records or other reasonable methods. We do not reimburse Medley Capital LLC for any services for which it receives a separate fee or for rent, depreciation, utilities, capital equipment or other administrative items allocated to a controlling person of Medley Capital LLC. Medley Capital LLC is an affiliate of SIC Advisors.
6
Table of Contents
Information Available
We maintain a website at http://www.sierraincomecorp.com . We make available, free of charge, on our website, our annual report on Form 10-K, quarterly reports on Form 10-Q, current reports on Form 8-K and amendments to those reports as soon as reasonably practicable after we electronically file such material with, or furnish it to, the SEC. Information contained on our website is not incorporated by reference into this annual report on Form 10-K and you should not consider information contained on our website to be part of this annual report on Form 10-K or any other report we file with the SEC.
INVESTMENTS
We have built a diverse portfolio that includes senior secured first lien term loans, senior secured second lien term loans, senior secured notes and warrants.
The following table shows the investment portfolio composition by industry grouping at fair value at December 31, 2013, exclusive of the underlying total return swap portfolio:
| Fair Value | Percentage | |||||||
| Oil and Gas |
$ | 18,862,779 | 13.7 | % | ||||
| Telecommunications |
17,073,865 | 12.4 | % | |||||
| Retail Stores |
16,995,844 | 12.3 | % | |||||
| Electronics |
13,996,099 | 10.2 | % | |||||
| Healthcare, Education, and Childcare |
12,307,691 | 8.9 | % | |||||
| Chemicals, Plastics, and Rubber |
9,810,000 | 7.1 | % | |||||
| Personal and Nondurable Consumer Products (Manufacturing Only) |
9,154,092 | 6.7 | % | |||||
| Finance |
6,808,098 | 4.9 | % | |||||
| Automobile |
6,119,250 | 4.4 | % | |||||
| Beverage, Food, and Tobacco |
5,755,736 | 4.2 | % | |||||
| Cargo Transport |
5,677,727 | 4.1 | % | |||||
| Hotels, Motels, Inns, and Gaming |
3,056,250 | 2.2 | % | |||||
| Diversified/Conglomerate Service |
2,511,528 | 1.8 | % | |||||
| Mining, Steel, Iron, and Nonprecious Metals |
2,396,489 | 1.7 | % | |||||
| Broadcasting and Entertainment |
2,300,535 | 1.7 | % | |||||
| Aerospace and Defense |
2,016,472 | 1.5 | % | |||||
| Leisure, Amusement, Motion Pictures, and Entertainment |
2,007,080 | 1.5 | % | |||||
| Grocery |
952,002 | 0.7 | % | |||||
|
|
|
|
|
|||||
| Total |
$ | 137,801,537 | 100.0 | % | ||||
|
|
|
|
|
|||||
7
Table of Contents
The following table sets forth certain information as of December 31, 2013 for each portfolio company in which we had an investment. Other than these portfolio investments, our only formal relationships with our portfolio companies are the managerial assistance that we provide upon request and the board observer or participation rights we may receive in connection with our investment portfolio.
| Company (1) |
Industry |
Type of Investment |
Maturity |
Par |
Cost |
Fair Value |
% of Net |
|||||||||||||||||
| Non-controlled/non-affiliated |
||||||||||||||||||||||||
| Access Media 3, Inc. |
Telecommunications | Senior Secured First Lien Term Loans 10.00%(3) | 10/22/2018 | $ | 7,000,000 | $ | 7,000,000 | $ | 7,000,000 | 4.6 | % | |||||||||||||
|
|
|
|
|
|
|
|||||||||||||||||||
| 7,000,000 | 7,000,000 | 7,000,000 | ||||||||||||||||||||||
| Aderant North America, Inc. |
Electronics |
Senior Secured Second Lien Term Loans LIBOR + 8.750%, 1.250% Floor(3) | 6/20/2019 | 450,000 | 450,000 | 453,861 | 0.3 | % | ||||||||||||||||
|
|
|
|
|
|
|
|||||||||||||||||||
| 450,000 | 450,000 | 453,861 | ||||||||||||||||||||||
| Alcatel – Lucent USA, Inc. |
Telecommunications |
Senior Secured First Lien Term Loans LIBOR + 6.000%, 1.250% Floor | 1/30/2019 | 990,000 | 985,662 | 993,712 | 0.6 | % | ||||||||||||||||
|
|
|
|
|
|
|
|||||||||||||||||||
| 990,000 | 985,662 | 993,712 | ||||||||||||||||||||||
| ALG USA Holdings, Inc. |
Leisure, Amusement, Motion Pictures, and Entertainment |
Senior Secured Second Lien Term Loans LIBOR + 9.000%, 1.250% Floor | 2/28/2020 | 2,000,000 | 1,963,092 | 2,007,080 | 1.3 | % | ||||||||||||||||
|
|
|
|
|
|
|
|||||||||||||||||||
| 2,000,000 | 1,963,092 | 2,007,080 | ||||||||||||||||||||||
| Allen Edmonds Corp. |
Retail Stores |
Senior Secured Second Lien Term Loans LIBOR + 9.00%, 1.00% Floor(3) | 5/27/2019 | 7,000,000 | 7,000,000 | 7,000,000 | 4.6 | % | ||||||||||||||||
|
|
|
|
|
|
|
|||||||||||||||||||
| 7,000,000 | 7,000,000 | 7,000,000 | ||||||||||||||||||||||
| American Apparel, Inc. |
Retail Stores |
Senior Secured First Lien Notes 13.000%(3) (4) |
4/15/2020 | 2,500,000 | 2,459,496 | 2,300,000 | 1.5 | % | ||||||||||||||||
|
|
|
|
|
|
|
|||||||||||||||||||
| 2,500,000 | 2,459,496 | 2,300,000 | ||||||||||||||||||||||
| Ascensus, Inc. |
Finance | Senior Secured Second Lien Term Loans LIBOR + 8.00%, 1.00% Floor | 12/2/2020 | 4,000,000 | 3,940,522 | 3,940,522 | 2.6 | % | ||||||||||||||||
|
|
|
|
|
|
|
|||||||||||||||||||
| 4,000,000 | 3,940,522 | 3,940,522 | ||||||||||||||||||||||
| Associated Asphalt Partners LLC |
Chemicals, Plastics, and Rubber |
Senior Secured First Lien Notes 8.500%(4) | 2/15/2018 | 5,000,000 | 5,036,563 | 5,130,000 | 3.3 | % | ||||||||||||||||
|
|
|
|
|
|
|
|||||||||||||||||||
| 5,000,000 | 5,036,563 | 5,130,000 | ||||||||||||||||||||||
| Bennu Oil & Gas, LLC |
Oil and Gas |
Senior Secured Second Lien Term Loans LIBOR + 9.00%, 1.25% Floor | 11/1/2018 | 1,122,857 | 1,113,148 | 1,113,148 | 0.7 | % | ||||||||||||||||
|
|
|
|
|
|
|
|||||||||||||||||||
| 1,122,857 | 1,113,148 | 1,113,148 | ||||||||||||||||||||||
| Bon-Ton Stores, Inc. |
Retail Stores |
Senior Secured Second Lien Notes 10.625%(4) | 7/15/2017 | 1,698,000 | 1,622,374 | 1,695,844 | 1.1 | % | ||||||||||||||||
|
|
|
|
|
|
|
|||||||||||||||||||
| 1,698,000 | 1,622,374 | 1,695,844 | ||||||||||||||||||||||
| Caesars Entertainment Operating Co., Inc. |
Hotels, Motels, Inns, and Gaming |
Senior Secured First Lien Notes 11.250%(6) | 6/1/2017 | 3,000,000 | 3,153,543 | 3,056,250 | 2.0 | % | ||||||||||||||||
|
|
|
|
|
|
|
|||||||||||||||||||
| 3,000,000 | 3,153,543 | 3,056,250 | ||||||||||||||||||||||
8
Table of Contents
| Company (1) |
Industry |
Type of Investment |
Maturity |
Par |
Cost |
Fair Value |
% of Net |
|||||||||||||||||
| Charming Charlie, Inc. |
Retail Stores |
Senior Secured First Lien Term Loans LIBOR + 8.00%, 1.00% Floor | 1/9/2019 | 6,000,000 | 6,000,000 | 6,000,000 | 3.9 | % | ||||||||||||||||
|
|
|
|
|
|
|
|||||||||||||||||||
| 6,000,000 | 6,000,000 | 6,000,000 | ||||||||||||||||||||||
| Checkers Drive-In Restaurants, Inc. |
Beverage, Food, and Tobacco |
Senior Secured First Lien Notes 11.000%(4) |
12/1/2017 | 1,500,000 | 1,504,143 | 1,614,675 | 1.1 | % | ||||||||||||||||
|
|
|
|
|
|
|
|||||||||||||||||||
| 1,500,000 | 1,504,143 | 1,614,675 | ||||||||||||||||||||||
| Cornerstone Chemical Company |
Chemicals, Plastics, and Rubber |
Senior Secured First Lien Notes 9.375% | 3/15/2018 | 2,000,000 | 2,000,000 | 2,080,000 | 1.4 | % | ||||||||||||||||
|
|
|
|
|
|
|
|||||||||||||||||||
| Senior Secured First Lien Notes 9.375%(4) | 3/15/2018 | 2,500,000 | 2,611,122 | 2,600,000 | 1.7 | % | ||||||||||||||||||
|
|
|
|
|
|
|
|||||||||||||||||||
| 4,500,000 | 4,611,122 | 4,680,000 | ||||||||||||||||||||||
| Deltek, Inc. |
Electronics | Senior Secured Second Lien Term Loans LIBOR + 8.750%, 1.250% Floor | 10/10/2019 | $ | 3,000,000 | $ | 2,978,006 | $ | 3,034,560 | 2.0 | % | |||||||||||||
|
|
|
|
|
|
|
|||||||||||||||||||
| 3,000,000 | 2,978,006 | 3,034,560 | ||||||||||||||||||||||
| Dispensing Dynamics International, Inc. |
Personal and Nondurable Consumer Products (Manufacturing Only) |
Senior Secured First Lien Notes 12.500%(4) | 1/1/2018 | 2,200,000 | 2,179,668 | 2,223,342 | 1.4 | % | ||||||||||||||||
|
|
|
|
|
|
|
|||||||||||||||||||
| 2,200,000 | 2,179,668 | 2,223,342 | ||||||||||||||||||||||
| Drew Marine Partners LP |
Cargo Transport |
Senior Secured Second Lien Term Loans LIBOR + 7.00%, 1.00% Floor | 5/19/2021 | 3,000,000 | 2,992,638 | 2,992,638 | 2.0 | % | ||||||||||||||||
|
|
|
|
|
|
|
|||||||||||||||||||
| 3,000,000 | 2,992,638 | 2,992,638 | ||||||||||||||||||||||
| EarthLink, Inc. |
Telecommunications | Senior Secured First Lien Notes 7.375%(4) (6) |
6/1/2020 | 2,450,000 | 2,437,636 | 2,453,062 | 1.6 | % | ||||||||||||||||
|
|
|
|
|
|
|
|||||||||||||||||||
| 2,450,000 | 2,437,636 | 2,453,062 | ||||||||||||||||||||||
| Erickson Air-Crane, Inc. |
Aerospace and Defense |
Senior Secured Second Lien Notes 8.250%(4) | 5/1/2020 | 1,953,000 | 1,966,979 | 2,016,472 | 1.3 | % | ||||||||||||||||
|
|
|
|
|
|
|
|||||||||||||||||||
| 1,953,000 | 1,966,979 | 2,016,472 | ||||||||||||||||||||||
| Gastar Exploration USA, Inc. |
Oil and Gas |
Senior Secured First Lien Notes 8.625%(4) | 5/15/2018 | 3,000,000 | 3,000,000 | 2,958,750 | 1.9 | % | ||||||||||||||||
|
|
|
|
|
|
|
|||||||||||||||||||
| 3,000,000 | 3,000,000 | 2,958,750 | ||||||||||||||||||||||
| Gibson Brands, Inc. |
Personal and Nondurable Consumer Products (Manufacturing Only) |
Senior Secured First Lien Notes 8.875%(4) | 8/1/2018 | 3,000,000 | 3,056,289 | 3,069,270 | 2.0 | % | ||||||||||||||||
|
|
|
|
|
|
|
|||||||||||||||||||
| 3,000,000 | 3,056,289 | 3,069,270 | ||||||||||||||||||||||
| Great Atlantic & Pacific Tea Company |
Grocery |
Senior Secured First Lien Term Loans LIBOR + 9.000%, 2.000% Floor(3) | 3/13/2017 | 932,467 | 948,787 | 952,002 | 0.6 | % | ||||||||||||||||
|
|
|
|
|
|
|
|||||||||||||||||||
| 932,467 | 948,787 | 952,002 | ||||||||||||||||||||||
| Green Field Energy Services, Inc. |
Oil and Gas |
Senior Secured First Lien Notes 13.000%(3) (4) |
11/15/2016 | 766,616 | 755,914 | 322,744 | 0.2 | % | ||||||||||||||||
|
|
|
|
|
|
|
|||||||||||||||||||
| 766,616 | 755,914 | 322,744 | ||||||||||||||||||||||
9
Table of Contents
| Company (1) |
Industry |
Type of Investment |
Maturity |
Par |
Cost |
Fair Value |
% of Net |
|||||||||||||||||
| Green Field Energy Services, Inc., Warrants, expires 11/15/21 |
Oil and Gas | Warrants/Equity (3) (7) | 709 | 29,000 | — | 0.0 | % | |||||||||||||||||
|
|
|
|
|
|
|
|||||||||||||||||||
| 709 | 29,000 | — | ||||||||||||||||||||||
| Greenway Medical Technologies, Inc.(8) |
Healthcare, |
Senior Secured Second Lien Term Loans LIBOR + 8.25%, 1.00% Floor | 11/4/2021 | 1,000,000 | 985,218 | 985,218 | 0.6 | % | ||||||||||||||||
|
|
|
|
|
|
|
|||||||||||||||||||
| 1,000,000 | 985,218 | 985,218 | ||||||||||||||||||||||
| Healogics, Inc. |
Healthcare, Education, and Childcare |
Senior Secured Second Lien Term Loans LIBOR + 8.000%, 1.250% Floor | 2/5/2020 | 2,000,000 | 1,996,440 | 2,040,000 | 1.3 | % | ||||||||||||||||
|
|
|
|
|
|
|
|||||||||||||||||||
| 2,000,000 | 1,996,440 | 2,040,000 | ||||||||||||||||||||||
| Holland Acquisition Corp. |
Oil and Gas |
Senior Secured First Lien Term Loans LIBOR + 9.000%, 1.000% Floor | 5/29/2018 | 5,000,000 | 4,904,352 | 4,917,000 | 3.2 | % | ||||||||||||||||
|
|
|
|
|
|
|
|||||||||||||||||||
| 5,000,000 | 4,904,352 | 4,917,000 | ||||||||||||||||||||||
| IDQ Holdings, Inc. |
Automobile |
Senior Secured First Lien Notes 11.500%(4) | 4/1/2017 | 1,000,000 | 1,035,523 | 1,066,250 | 0.7 | % | ||||||||||||||||
|
|
|
|
|
|
|
|||||||||||||||||||
| 1,000,000 | 1,035,523 | 1,066,250 | ||||||||||||||||||||||
| Integra Telecom, Inc. |
Telecommunications |
Senior Secured Second Lien Term Loans LIBOR + 8.500%, 1.250% Floor(3) | 2/22/2020 | 1,618,000 | 1,607,900 | 1,650,360 | 1.1 | % | ||||||||||||||||
|
|
|
|
|
|
|
|||||||||||||||||||
| 1,618,000 | 1,607,900 | 1,650,360 | ||||||||||||||||||||||
| Interface Security Systems, Inc. |
Electronics |
Senior Secured First Lien Notes 9.250%(3) (4) | 1/15/2018 | $ | 3,417,000 | $ | 3,476,530 | $ | 3,492,550 | 2.3 | % | |||||||||||||
|
|
|
|
|
|
|
|||||||||||||||||||
| 3,417,000 | 3,476,530 | 3,492,550 | ||||||||||||||||||||||
| IronGate Energy Services LLC |
Oil and Gas |
Senior Secured First Lien Notes 11.000%(4) | 7/1/2018 | 3,000,000 | 2,948,441 | 3,029,850 | 2.0 | % | ||||||||||||||||
|
|
|
|
|
|
|
|||||||||||||||||||
| 3,000,000 | 2,948,441 | 3,029,850 | ||||||||||||||||||||||
| Keystone Automotive Operations, Inc. |
Automobile |
Senior Secured Second Lien Term Loans LIBOR + 10.750%, 1.250% Floor | 8/15/2020 | 5,000,000 | 5,000,000 | 5,053,000 | 3.3 | % | ||||||||||||||||
|
|
|
|
|
|
|
|||||||||||||||||||
| 5,000,000 | 5,000,000 | 5,053,000 | ||||||||||||||||||||||
| Kik Custom Products, Inc. |
Healthcare, |
Senior Secured Second Lien Term Loans LIBOR + 8.25%, 1.25% Floor | 12/31/2019 | 3,000,000 | 2,970,000 | 2,970,000 | 1.9 | % | ||||||||||||||||
|
|
|
|
|
|
|
|||||||||||||||||||
| 3,000,000 | 2,970,000 | 2,970,000 | ||||||||||||||||||||||
| Linc Energy Finance (USA), Inc. |
Oil and Gas |
Senior Secured First Lien Notes 12.500%(3) (4) |
10/31/2017 | 500,000 | 498,368 | 545,925 | 0.4 | % | ||||||||||||||||
|
|
|
|
|
|
|
|||||||||||||||||||
| Senior Secured First Lien Notes 12.500%(3) | 10/31/2017 | 500,000 | 485,222 | 545,925 | 0.4 | % | ||||||||||||||||||
|
|
|
|
|
|
|
|||||||||||||||||||
| 1,000,000 | 983,590 | 1,091,850 | ||||||||||||||||||||||
| Liquidnet Holdings, Inc. |
Finance |
Senior Secured First Lien Term Loans LIBOR + 8.000%, 1.250% Floor | 5/7/2017 | 2,887,500 | 2,862,362 | 2,867,576 | 1.9 | % | ||||||||||||||||
|
|
|
|
|
|
|
|||||||||||||||||||
| 2,887,500 | 2,862,362 | 2,867,576 | ||||||||||||||||||||||
10
Table of Contents
| Company (1) |
Industry |
Type of Investment |
Maturity |
Par |
Cost |
Fair Value |
% of Net |
|||||||||||||||||
| Livingston International, Inc.(8) |
Cargo Transport |
Senior Secured Second Lien Term Loans LIBOR + 7.750%, 1.250% Floor(6) | 4/18/2020 | 2,658,504 | 2,653,733 | 2,685,089 | 1.8 | % | ||||||||||||||||
|
|
|
|
|
|
|
|||||||||||||||||||
| 2,658,504 | 2,653,733 | 2,685,089 | ||||||||||||||||||||||
| Maxim Crane Works Holdings, Inc.(8) |
Oil and Gas |
Senior Secured Second Lien Notes 12.250%(4) | 4/15/2015 | 1,500,000 | 1,519,124 | 1,542,360 | 1.0 | % | ||||||||||||||||
|
|
|
|
|
|
|
|||||||||||||||||||
| 1,500,000 | 1,519,124 | 1,542,360 | ||||||||||||||||||||||
| Michael Baker International, Inc. |
Diversified/Conglomerate Service |
Senior Secured First Lien Notes 8.25%(4) | 10/15/2018 | 2,500,000 | 2,500,000 | 2,511,528 | 1.6 | % | ||||||||||||||||
|
|
|
|
|
|
|
|||||||||||||||||||
| 2,500,000 | 2,500,000 | 2,511,528 | ||||||||||||||||||||||
| Omnitracs, Inc. |
Electronics | Senior Secured Second Lien Term Loans LIBOR + 7.75%, 1.00% Floor | 4/29/2020 | 7,000,000 | 7,015,128 | 7,015,128 | 4.6 | % | ||||||||||||||||
|
|
|
|
|
|
|
|||||||||||||||||||
| 7,000,000 | 7,015,128 | 7,015,128 | ||||||||||||||||||||||
| Prince Minerals Holding Corp. |
Mining, Steel, |
Senior Secured First Lien Notes 11.500%(3) (4) |
12/15/2019 | 1,200,000 | 1,187,246 | 1,310,568 | 0.9 | % | ||||||||||||||||
|
|
|
|
|
|
|
|||||||||||||||||||
| 1,200,000 | 1,187,246 | 1,310,568 | ||||||||||||||||||||||
| Reddy Ice Group, Inc. |
Beverage, Food, |
Senior Secured Second Lien Term Loans LIBOR + 9.500%, 1.250% Floor(3) | 10/1/2019 | 2,000,000 | 2,000,000 | 1,942,460 | 1.3 | % | ||||||||||||||||
|
|
|
|
|
|
|
|||||||||||||||||||
| 2,000,000 | 2,000,000 | 1,942,460 | ||||||||||||||||||||||
| Renaissance Learning, Inc. |
Healthcare, |
Senior Secured Second Lien Term Loans LIBOR + 7.75%, 1.00% Floor | 5/14/2021 | 3,500,000 | 3,447,888 | 3,447,888 | 2.3 | % | ||||||||||||||||
|
|
|
|
|
|
|
|||||||||||||||||||
| 3,500,000 | 3,447,888 | 3,447,888 | ||||||||||||||||||||||
| School Specialty, Inc. |
Healthcare, Education, and Childcare |
Senior Secured First Lien Term Loans LIBOR + 8.500%, 1.000% Floor | 6/11/2019 | 2,985,000 | 2,936,006 | 2,864,585 | 1.9 | % | ||||||||||||||||
|
|
|
|
|
|
|
|||||||||||||||||||
| 2,985,000 | 2,936,006 | 2,864,585 | ||||||||||||||||||||||
| Securus Technologies, Inc. |
Telecommunications |
Senior Secured Second Lien Term Loans LIBOR + 9.000%, 1.750% Floor | 4/30/2021 | $ | 2,000,000 | $ | 1,981,227 | $ | 1,988,280 | 1.3 | % | |||||||||||||
|
|
|
|
|
|
|
|||||||||||||||||||
| 2,000,000 | 1,981,227 | 1,988,280 | ||||||||||||||||||||||
| Sesac Holdco II, Inc. |
Broadcasting and Entertainment | Senior Secured Second Lien Term Loans LIBOR + 8.750%, 1.250% Floor(3) | 7/12/2019 | 2,250,000 | 2,294,369 | 2,300,535 | 1.5 | % | ||||||||||||||||
|
|
|
|
|
|
|
|||||||||||||||||||
| 2,250,000 | 2,294,369 | 2,300,535 | ||||||||||||||||||||||
| Sizzling Platter, LLC |
Beverage, Food, and Tobacco | Senior Secured First Lien Notes 12.250%(3) (4) |
4/15/2016 | 2,063,000 | 2,124,725 | 2,198,601 | 1.4 | % | ||||||||||||||||
|
|
|
|
|
|
|
|||||||||||||||||||
| 2,063,000 | 2,124,725 | 2,198,601 | ||||||||||||||||||||||
| Sorenson Communications |
Telecommunications |
Senior Secured First Lien Term Loans LIBOR + 8.250%, 1.250% Floor | 10/31/2014 | 2,979,987 | 2,979,987 | 2,988,451 | 2.0 | % | ||||||||||||||||
|
|
|
|
|
|
|
|||||||||||||||||||
| 2,979,987 | 2,979,987 | 2,988,451 | ||||||||||||||||||||||
11
Table of Contents
| Company (1) |
Industry |
Type of Investment |
Maturity |
Par |
Cost |
Fair Value |
% of Net |
|||||||||||||||||
| Tempel Steel Company |
Mining, Steel, Iron, and Nonprecious Metals |
Senior Secured First Lien Notes 12.000%(3) (4) |
8/15/2016 | 1,115,000 | 1,105,791 | 1,085,921 | 0.7 | % | ||||||||||||||||
|
|
|
|
|
|
|
|||||||||||||||||||
| 1,115,000 | 1,105,791 | 1,085,921 | ||||||||||||||||||||||
| True Religion Apparel, Inc. |
Personal and Nondurable Consumer Products (Manufacturing Only) | Senior Secured Second Lien Term Loans LIBOR + 10.000%, 1.000% Floor | 1/30/2020 | 4,000,000 | 3,835,240 | 3,861,480 | 2.5 | % | ||||||||||||||||
|
|
|
|
|
|
|
|||||||||||||||||||
| 4,000,000 | 3,835,240 | 3,861,480 | ||||||||||||||||||||||
| U.S. Well Services, LLC |
Oil and Gas |
Senior Secured First Lien Notes 14.500%(3) (4) |
2/15/2017 | 3,816,605 | 3,796,701 | 3,832,100 | 2.5 | % | ||||||||||||||||
|
|
|
|
|
|
|
|||||||||||||||||||
| 3,816,605 | 3,796,701 | 3,832,100 | ||||||||||||||||||||||
| U.S. Well Services, LLC, Warrants, expires 2/15/19 |
Oil and Gas |
Warrants/Equity (3) (7) | 1,731 | 173 | 54,977 | 0.0 | % | |||||||||||||||||
|
|
|
|
|
|
|
|||||||||||||||||||
| 1,731 | 173 | 54,977 | ||||||||||||||||||||||
| Total non-controlled/non-affiliated investments |
$ | 137,332,276 | $ | 137,801,537 | 90.1 | % | ||||||||||||||||||
|
|
|
|
|
|||||||||||||||||||||
| Derivative Instrument - Long Exposure |
|
Notional Amount |
Unrealized Gain (Loss) |
|||||||||||||||||||||
| Total return |
Total Return Swap | $ | 24,855,700 | $ | 351,396 | |||||||||||||||||||
|
|
|
|
|
|||||||||||||||||||||
| $ | 24,855,700 | $ | 351,396 | |||||||||||||||||||||
|
|
|
|
|
|||||||||||||||||||||
| (1) | All of our investments are domiciled in the United States except for Livingston International, Inc. which is domiciled in Canada. |
| (2) | Percentage is based on net assets of $153,002,273 as of December 31, 2013. |
| (3) | An affiliated fund that is managed by an affiliate of SIC Advisors LLC also holds an investment in this security. |
| (4) | Securities are exempt from registration under Rule 144A of the Securities Act of 1933. These securities represent $45,303,968 and 29.6% of net assets as of December 31, 2013 and are considered restricted. |
| (5) | The investment is not a qualifying asset under Section 55 of the Investment Company Act of 1940, as amended. Non-qualifying assets represent 11.5% of the Company’s portfolio at fair value. |
| (6) | Security is non-income producing. |
| (7) | Security is also held in the underlying portfolio of the total return swap with Citibank, N.A. (see Note 5). Our total commitment to Greenway Medical Technologies, Inc., Livingston International, Inc. and Maxim Crane Works Holdings, Inc. is $2,470,218 or 1.6%, $4,654,532 or 3.0% and $2,034,860 or 1.3%, respectively, of Net Assets as of December 31, 2013. |
As of December 31, 2013, the weighted average yield based upon original cost on our portfolio investments was approximately 9.9%, and 56.7% of our income-bearing investment portfolio bore interest based on floating rates, such as LIBOR, and 43.3% bore interest at fixed rates. The weighted average yield on income producing investments is computed based upon a combination of the cash flows to date and the contractual interest payments, principal amortization and fee notes due at maturity without giving effect to closing fees received, base management fees, incentive fees or general fund related expenses. Each floating rate loan uses LIBOR as its floating rate index. For each floating rate loan, the projected fixed-rate equivalent coupon rate used to forecast the interest cash flows was calculated by adding the interest rate spread specified in the relevant loan document to the fixed-rate equivalent LIBOR rate, duration-matched to the specific loan, adjusted by the LIBOR floor and/or cap in place on that loan.
12
Table of Contents
Overview of Portfolio Companies
Set forth below is a brief description of the business of our portfolio companies as of December 31, 2013.
| Portfolio Company |
Brief Description of Portfolio Company |
| Access Media 3 Inc. |
AM3 Pinnacle Corporation which dba Access Media 3, Inc., headquartered in Oak Brook, IL, is a rapidly growing triple-play provider of digital satellite television, high speed internet and voice services to the residential multi-dwelling unit (“MDU”) market in the United States and is one of the largest private cable operators in the country. Access Media 3, Inc. provides services to residential MDUs in 20 different markets across the United States via single-play, double-play and triple-play service options. |
| Aderant North America, Inc. |
Aderant, Inc. is a provider of enterprise software solutions to law firms and other professional services organizations globally. Aderant’s software is tailored to address the industry-specific requirements of law firms and professional services organizations, with solutions spanning financial management, time and billing, practice management, rules based calendar, matter management systems, customer relationship management, business intelligence and performance management functions. |
| Alcatel-Lucent USA, Inc. |
Formed in 2006, Alcatel-Lucent USA, Inc. is a leading innovator in the field of networking and communications technology, products and services. Alcatel-Lucent USA, Inc. is home to Bell Labs, one of the world’s foremost research centers, responsible for breakthroughs that have shaped the networking and communications industry. |
| ALG USA Holdings, Inc. |
Apple Leisure Group USA Holdings, LLC is a leading vertically-integrated travel company that provides all-inclusive (AIC) vacation experiences to Mexico and the Caribbean. |
| Allen Edmonds Corporation |
Allen Edmonds Corporation, founded in 1922 and headquartered in Port Washington, WI manufactures men’s footwear, apparel and accessories that are distributed throughout the United States and internationally. |
| American Apparel, Inc. |
American Apparel is a vertically integrated manufacturer, distributor, and retailer of branded fashion and basic apparel and accessories for women, men, children, and babies. Based in Los Angeles, American Apparel has approximately 10,000 employees and operates 251 retail stores in 20 countries. American Apparel distributes its products through three primary channels: brick and mortar retail, wholesale to distributors, and online to consumers. |
| Ascensus Inc. |
Ascensus, Inc., founded in 1980 and based in Dresher, PA, is the nation’s largest independent provider of outsourced retirement plan and administration services covering over 43,000 defined contribution plans and 1.5 million IRAs and HSAs. |
| Associated Asphalt Partners LLC |
Associated Asphalt Partners, LLC is one of the largest independent asphalt resellers in the United States. Associated Asphalt Partners, LLC stores, blends, transports and sells a diverse mix of performance grade asphalt. |
13
Table of Contents
| Portfolio Company |
Brief Description of Portfolio Company |
| Bennu Oil & Gas, LLC |
Bennu Oil & Gas, LLC is a privately-held E&P company engaged in the production, development, acquisition and exploitation of crude oil and natural gas assets in the Gulf of Mexico (“GoM”). Bennu Oil & Gas, LLC was formed in September 2013 to acquire key producing properties and certain exploratory blocks in the deepwater and shelf GoM from the ATP Oil & Gas Corporation (“ATP”) estate. The assets were owned by the former DIP Lenders of ATP following a credit bid of ~$691M. |
| Bon-Ton Stores, Inc. |
The Bon-Ton Stores, Inc. is a regional department store company operating 272 stores in 23 states throughout the northern United States. The stores, carrying its namesake nameplate, serve the Mid-Atlantic and New England regions of the United States, extending to upstate New York and throughout Pennsylvania. Other chains operated by The Bon-Ton Stores, Inc. include Bergner’s, Boston Store, Carson Pirie Scott, Elder-Beerman, Herberger’s, Parisian (Detroit-area only) and Younkers. |
| Caesars Entertainment Operating Co., Inc. |
Caesars Entertainment, formerly Harrah’s Entertainment, currently owns, operates, and manages 53 casino properties globally with over 50,000 employees. In addition to owned properties, Caesars Entertainment provides management services to 27 properties with approximately 26,000 guest rooms and more than two million square feet of casino space. Caesars Entertainment’s key brands include: Caesars Palace, Harrah’s, Horseshoe, Flamingo, Bally’s, Paris and the World Series of Poker. |
| Charming Charlie Inc. |
Charming Charlie is a destination retailer of fashion jewelry and accessories targeting women between the ages of 22 to 54. Charming Charlie offers a broad and constantly changing assortment of on-trend fashion jewelry and accessories, shoes, handbags, and apparel at value prices under the Charming Charlie label. |
| Checkers Drive-In Restaurants, Inc. |
Checkers Drive-In Restaurants, Inc. is an operator of drive-thru hamburger quick service restaurants. Checkers operates a unique drive-in format with no dining rooms to minimize rent expense. Most restaurants are located in high density areas and near other fast food chains such as McDonalds, Wendy’s and Burger King. |
| Cornerstone Chemical Company |
Cornerstone Chemical Company is a market-leading, North American producer of critical intermediate and specialty chemicals including AN and melamine, which are marketed globally, and is a leading producer of sulfuric acid for the merchant market in the Gulf of Mexico region. |
| Deltek, Inc. |
Deltek, Inc. is a leading provider of project focused enterprise software and information solutions. Deltek’s software is a comprehensive solution in the service resource planning marketplace, providing end-to-end management of business development and project lifecycles. |
14
Table of Contents
| Portfolio Company |
Brief Description of Portfolio Company |
| Dispensing Dynamics International, Inc. |
Dispensing Dynamics International, Inc. is a leading designer and manufacturer of paper towel, bath tissue, soap and odor dispensing systems utilized in commercial Away-From-Home (“AFH”) washroom settings. Dispensing Dynamics International has the #1 market share in the North America value-added paper dispensing industry, including electronic, mechanical hands free, center pull dispensers and hybrid roll paper towel dispensers. Products are primarily located in high-traffic AFH washrooms found in airports, stadiums, office buildings, restaurants, schools and universities and general retail environments. |
| Drew Marine Partners LP |
Drew Marine, founded in 1928 and headquartered in Whippany, NJ, provides vessel performance products and fire, safety and rescue solutions products to maritime transportation vessels and offshore oil rigs, and serves over 5,000 customers in nearly every port worldwide through its direct delivery capability and extensive distributor network. |
| EarthLink, Inc. |
EarthLink, Inc. provides IT, network and communication services to individual and business consumers. In late 2010, EarthLink acquired ITC DeltaCom and One Communication and gained ownership or indefeasible rights of use to about 28,000 route miles of long haul or metro fiber, and in the process transformed itself into a competitive local exchange carrier that generates most of its revenue from selling to business customers. |
| Erickson Air-Crane, Inc. |
Clondalkin Industries B.V. is a leading international producer of a wide range of high-value added packaging products in the specialist packaging and flexible packaging markets. Clondalkin, headquartered in the Netherlands, has approximately 4,000 employees globally and manufactures and distributes its products from 35 facilities located in eight countries across North America and Europe. |
| Gastar Exploration USA, Inc. |
Gastar Exploration, founded in 1987 and based in Houston, TX, is an independent oil and gas exploration and production company with operations in Appalachia and Texas. Gastar Exploration operates in the Marcellus Shale play in northern West Virginia and central Pennsylvania. |
| Gibson Brands, Inc. |
Gibson Brands, Inc. operates in the global music products industry, which consists of fretted and percussion instruments, brasswinds, woodwinds, pianos, keyboards and organs and other related products. This industry also includes professional audio equipment, which consists of speaker enclosures, mixers, power amplifiers and microphones and other recording devices/products.. |
| Great Atlantic & Pacific Tea Company |
The Great Atlantic & Pacific Tea Company, Inc. (“A&P”), was the first national food chain in the United States and is now a leading food retailer in the Northeastern United States. A&P holds a leading market share in the New York metro region, and in other regions in New York, New Jersey and Pennsylvania. |
15
Table of Contents
| Portfolio Company |
Brief Description of Portfolio Company |
| Green Field Energy Services, Inc. |
Green Field Energy Services, Inc. is an independent oilfield services company that provides a wide range of services to oil and natural gas drilling and production companies to help develop and enhance the production of hydrocarbons. Green Field Energy Service’s services include hydraulic fracturing, cementing, coiled tubing, pressure pumping, acidizing and other pumping services. |
| Greenway Medical Technologies, Inc. |
Greenway Medical Technologies is a leading provider of integrated information technology systems, including electronic medical records, revenue cycle management, practice management and medical billing services to the ambulatory market. |
| Healogics, Inc. |
Healogics, Inc. is the leading provider of advanced wound care services and equipment to the U.S. market. |
| Holland Acquisition Corp. |
Founded in 1985, Holland Acquisition Corp. is a leading provider of land services to blue-chip clients throughout the United States. Holland is headquartered in Fort Worth, Texas, with satellite offices in Houston, Texas and Washington, Pennsylvania. Holland Acquisition Corp. offers a full-suite of land services in all three stages of the energy production cycle: upstream, midstream and downstream. |
| IDQ Holdings, Inc. |
IDQ Holdings, Inc. is a provider of high-quality and easy-to-use air conditioning (“A/C”) maintenance and repair solutions for the do-it-yourself automotive aftermarket in North America. IDQ Holdings offers 650 SKUs over two product categories: value added products and complimentary products. Value added products include all-in-one A/C recharge kits and refrigerant blends with performance enhancing additives. Complimentary products include straight refrigerants, specialty chemicals, HVAC solutions, and commercial products and accessories. |
| Integra Telecom, Inc. |
Integra Telecom, Inc. is a regional fiber-based local exchange carrier that provides integrated communication services across 35 metropolitan areas in 11 states of the Western United States. Integra owns (directly or under indefeasible rights of use) a fiber optic network with over 8,000 route miles of fiber, consisting of 3,000 route miles of metro fiber and 5,000 route miles of long haul fiber. Within its metro network, Integra has direct fiber connection to approximately 1,847 locations. |
| Interface Security Systems, Inc. |
Interface Security Systems, Inc., founded in 1995 and based in Missouri, is a national provider of physical security and secured managed network services to primarily large, commercial multi-site customers and provides the most comprehensive IP technology-enabled managed security solution in the market. |
| IronGate Energy Services LLC |
IronGate Energy Services, LLC is an independent provider of rental and tubular services to Oil and Gas drilling operators in the U.S. and Mexico. |
16
Table of Contents
| Portfolio Company |
Brief Description of Portfolio Company |
| Keystone Automotive Holdings, Inc. |
Founded in 1971 and headquartered in Exeter, PA, Keystone Automotive Holdings, Inc. serves approximately 20,000 specialty automotive aftermarket retailers and installers through its extensive footprint of over 25 distribution centers and cross-docks nationwide. |
| Kik Custom Products Inc. |
KIK Custom Products is one of North America’s largest manufacturers of consumer packaged goods (“CPG”) with a client list that includes 80% of North America’s major retailers and some of the world’s leading CPG companies. |
| Linc Energy Finance (USA), Inc. |
Linc Energy Finance (USA), Inc. was formed for the purpose of acquiring crude oil and gas producing properties in the United States. Linc Energy Finance is now engaged in the production, development and exploitation of crude oil and gas in Texas, Louisiana, Wyoming and Alaska. |
| Liquidnet Holdings, Inc. |
Liquidnet Holdings, Inc. operates a global institutional equities trading network that many of the world’s top asset managers trust to execute their block trades with maximum anonymity and minimal price impact. |
Launched in 2001, Liquidnet brings together institutional buyers and sellers of large blocks of equity securities, enabling them to trade with each other directly and anonymously on its electronic trading platform.
| Livingston International, Inc. |
Livingston International, Inc. is North America’s largest pure-play, non-asset-based customs broker. Livingston utilizes its proprietary transaction-processing platform to provide services at virtually every major point of entry into Canada and the U.S. |
| Maxim Crane Holdings, Inc. |
Maxim Crane Holdings, Inc. is a leading U.S. provider of crane services that support maintenance and expansion needs of energy-related infrastructure, industrial and building construction markets. |
| Michael Baker Intl Inc. |
Michael Baker International, LLC is a leading provider of high-end engineering, development, intelligence and technology solutions with global reach and mobility. |
| Omnitracs Inc. |
Omnitracs, Inc. is one of the largest providers of satellite and terrestrial-based connectivity and location solutions to transportation and logistics companies. |
| Prince Mineral Holding Corporation |
Prince Mineral Holding Corporation is a global distributor of specialty mineral products and niche industrial additives. Prince Mineral sources, processes and distributes its products for use in brick, glass, agriculture, foundry, refractory and steel, oil and gas and coal end markets. |
| Reddy Ice Group, Inc. |
Reddy Ice is the largest producer and distributor of packaged ice in the US, with #1 or #2 market share in the majority of its footprint, which spans 34 states, including Washington DC. |
17
Table of Contents
| Portfolio Company |
Brief Description of Portfolio Company |
| Renaissance Learning Inc. |
Renaissance Learning, Inc., founded in 1986 and headquartered in Wisconsin, provides technology based student assessment and school improvement programs, focused on reading, math and writing for K-12 students. |
| School Specialty, Inc. |
School Specialty, Inc. is the largest national distributor of K-12 educational products and solutions. It offers the industry’s most diverse and comprehensive product portfolio. School’s educational resources segment offers the broadest range and deepest assortment of general supplies, supplemental learning products, classroom equipment and furniture available from a single source supplier. |
| Securus Technologies, Inc. |
Securus Technologies, Inc. is an independent provider of inmate telecommunications in North America, delivering turnkey solutions to over 850,000 inmates at roughly 2,200 correctional facilities across 44 states in the United States, the District of Columbia and Canada. |
| Sesac Holdco II, Inc. |
SESAC Holdings, Inc., founded in 1930 and headquartered in Nashville, TN, is one of only three Performance Rights Organizations (“PROs”) in the United States. PROs protect the interests of individual songwriters and publishers (“Affiliates”) of music by acting as intermediary licensing organizations to ensure Affiliates are compensated for the public performance and retransmission of their copyrighted works. |
| Sizzling Platter, LLC |
Sizzling Platter LLC is a restaurant management company that operates 146 Little Caesars locations, 23 Sizzler locations and 13 other limited service restaurants in the Western United States as a franchisee. Sizzling Platter is the largest franchisee of Little Ceasars locations in the United States. |
| Sorenson Communications |
Sorenson Communications is a leading provider of Video Relay Services (“VRS”) to the deaf and hard-of-hearing market since 2003. Sorenson is a leader in the VRS market in the US providing services through a proprietary phone that’s free of charge to the end user. |
| Tempel Steel Company |
Tempel Steel Company is an independent manufacturer of magnetic steel laminations used in the production of motors and transformers. Tempel Steel has manufacturing operations in the United States, Mexico, China and India, a distribution and steel services center in Canada and distribution centers in Pennsylvania and California. |
| True Religion Apparel, Inc. |
True Religion Apparel, Inc. is a global, design-based jeans and sportswear brand, based in Vernon, California. True Religion Apparel, Inc. designs, manufactures, and markets True Religion Apparel products, which includes its premium True Religion Brand Jeans. |
| U.S. Well Services LLC |
U.S. Well Services LLC is a Houston, Texas-based oilfield service provider currently contracted to engage in pressure pumping and related services, including high-pressure hydraulic fracturing in unconventional oil and natural gas basins. |
18
Table of Contents
INVESTMENT ADVISORY AGREEMENT AND FEES
Investment Advisory Fees
We pay SIC Advisors a fee for its services under the Investment Advisory Agreement consisting of two components: a management fee and an incentive fee. We believe that this fee structure benefits stockholders by aligning the compensation of our Advisor with our overall investment performance. The cost of both the management fee and the incentive fee are ultimately borne by our stockholders.
Base Management Fee
The base management fee calculated at an annual rate of 1.75% of our gross assets payable quarterly in arrears. For purposes of calculating the base management fee, the term “gross assets” includes any assets acquired with the proceeds of leverage. The Advisor benefits when we incur debt or use leverage. For the first quarter of our operations, the base management fee was calculated based on the initial value of our gross assets. Subsequently, the base management fee is calculated based on our gross assets at the end of each completed calendar quarter. Base management fees for any partial quarter are appropriately prorated.
Incentive Fee
The incentive fee is divided into two parts: (i) a subordinated incentive fee on income and (ii) an incentive fee on capital gains. Each part of the incentive fee is outlined below.
The subordinated incentive fee on income is earned on pre-incentive fee net investment income and is determined and payable in arrears as of the end of each calendar quarter during which the Investment Advisory Agreement is in effect. If the Investment Advisory Agreement is terminated, the fee will also become payable as of the effective date of the termination.
The subordinated incentive fee on income for each quarter is calculated as follows:
| • | No subordinated incentive fee on income is payable in any calendar quarter in which the pre-incentive fee net investment income does not exceed a quarterly return to investors of 1.75% per quarter on our net assets at the end of the immediately preceding fiscal quarter. We refer to this as the quarterly preferred return. |
| • | All of our pre-incentive fee net investment income, if any, that exceeds the quarterly preferred return, but is less than or equal to 2.1875% on our net assets at the end of the immediately preceding fiscal quarter in any quarter, is payable to the Advisor. We refer to this portion of our subordinated incentive fee on income as the catch up. It is intended to provide an incentive fee of 20% on all of our pre-incentive fee net investment income when our pre-incentive fee net investment income exceeds 2.1875% on our net assets at the end of the immediately preceding fiscal quarter in any quarter. |
| • | For any quarter in which our pre-incentive fee net investment income exceeds 2.1875% on our net assets at the end of the immediately preceding fiscal quarter, the subordinated incentive fee on income equals 20% of the amount of our pre-incentive fee net investment income, because the preferred return and catch up will have been achieved. |
| • | Pre-incentive fee net investment income is defined as interest income, dividend income and any other income accrued during the calendar quarter, minus our operating expenses for the quarter, including the base management fee, expenses payable under the Administration Agreement, any interest expense and dividends paid on any issued and outstanding preferred stock, but excluding the incentive fee. Pre-incentive fee net investment income does not include any realized capital gains, realized capital losses or unrealized capital appreciation or depreciation. |
19
Table of Contents
The following is a graphical representation of the calculation of the quarterly subordinated incentive fee on income:
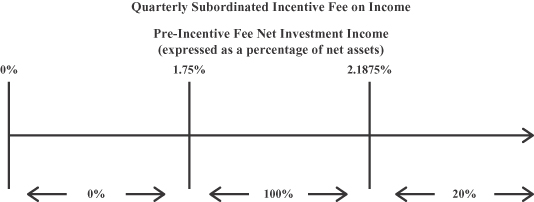
Percentage of Pre-Incentive Fee Net Investment Income Allocated to Quarterly Incentive Fee
The incentive fee on capital gains is earned on investments sold and is determined and payable in arrears as of the end of each calendar year during which the Investment Advisory Agreement is in effect. In the case the Investment Advisory Agreement is terminated, the fee will also become payable as of the effective date of such termination. The fee equals 20% of our realized capital gains, less the aggregate amount of any previously paid incentive fee on capital gains. Incentive fee on capital gains is equal to our realized capital gains on a cumulative basis from inception, computed net of all realized capital losses and unrealized capital depreciation on a cumulative basis. In order to provide an incentive for our Advisor to successfully execute a merger transaction involving us that is financially accretive and/or otherwise beneficial to our stockholders even if our Advisor will not act as an investment adviser to the surviving entity in the merger, we may seek exemptive relief from the SEC to allow us to pay our Advisor an incentive fee on capital gains in connection with our merger with and into another entity. Absent the receipt of such relief, our Advisor will not be entitled to an incentive fee on capital gains or any other incentive fee in connection with any such merger transaction.
Because of the structure of the subordinated incentive fee on income and the incentive fee on capital gains, it is possible that we may pay such fees in a quarter where we incur a net loss. For example, if we receive pre-incentive fee net investment income in excess of the 1.75% on our net assets at the end of the immediately preceding fiscal quarter for a quarter, we will pay the applicable incentive fee even if we have incurred a net loss in the quarter due to a realized or unrealized capital loss. Our Advisor will not be under any obligation to reimburse us for any part of the incentive fee it receives that is based on prior period accrued income that we never receive as a result of a subsequent decline in the value of our portfolio.
The fees that are payable under the Investment Advisory Agreement for any partial period will be appropriately prorated. The fees will also be calculated using a detailed policy and procedure approved by our Advisor and our board of directors, including a majority of the independent directors, and such policy and procedure will be consistent with the description of the calculation of the fees set forth above.
Our Advisor may elect to defer or waive all or a portion of the fees that would otherwise be paid to it in its sole discretion.
Reimbursements
In accordance with the terms of the Investment Advisory Agreement, SIC Advisors is responsible for paying all other organization and offering expenses incurred by us until such time that we have raised $300 million in gross proceeds from the offering of shares of our common stock in its public offering or one or more private
20
Table of Contents
offerings. After such time, we will be responsible for paying such expenses on its own behalf. In addition, we have agreed to reimburse SIC Advisors for other organization and offering expenses incurred by SIC Advisors on behalf of us in an amount equal to 1.25% of the gross proceeds raised in such offerings. Consequently, if we raise less than $300 million in gross proceeds from the offering of shares of our common stock, pursuant to our prospectus or one or more private offerings, we will reimburse SIC Advisors in an amount equal to 1.25% of the gross proceeds from such offerings and, as a result, only be required to pay other organization and offering expenses in an amount equal to such amount.
After the $300 million threshold has been surpassed, we will be responsible for paying all future other organization and offering expenses incurred by us and will continue to reimburse SIC Advisors for any other organization and offering expenses that it previously incurred on our behalf and for which it has not yet been reimbursed by us, at a rate of 1.25% of the gross proceeds from the offering of shares of our common stock in its public offering or one or more private offerings until the earlier of (a) the end of the offering period, or (b) such time that SIC Advisors has been repaid in full. We are targeting other organization and offering expense ratio of 1.25% over the course of the offering period for the offering of shares of our common stock in its public offering, which was initially scheduled to terminate two years from the initial public offering date, or April 14, 2014. At a meeting held on March 12, 2014, our board of directors approved an extension of our offering for an additional year.
Advisory Services
Under the terms of the Investment Advisory Agreement, our Advisor is responsible for the following:
| • | determining the composition and allocation of our portfolio, the nature and timing of the changes to our portfolio and the manner of implementing such changes; |
| • | identifying, evaluating, negotiating and structuring the investments we make; |
| • | performing due diligence on prospective portfolio companies; |
| • | executing, closing, servicing and monitoring the investments we make; |
| • | determining the securities and other assets that we will purchase, retain or sell; and |
| • | providing us with such other investment advisory, research and related services as we may, from time to time, reasonably require for the investment of our capital. |
Under the Investment Advisory Agreement, SIC Advisors has a fiduciary responsibility for the safeguarding and use of all of our funds and assets. SIC Advisors is also subject to liability under both the 1940 Act and the Advisors Act for a breach of these fiduciary duties.
SIC Advisors is primarily responsible for initially identifying, evaluating, negotiating and structuring our investments. These activities are carried out by its investment team and subject to the oversight of SIC Advisors’ senior investment personnel. Each investment that we make will require the unanimous approval of the investment committee before the investment may be made. Certain affiliated co-investment transactions may require the additional approval of our independent directors.
SIC Advisors’ services under the Investment Advisory Agreement are not exclusive, and it is free to furnish similar services to other entities so long as its services to us are not impaired.
Indemnification of Our Advisor
The Investment Advisory Agreement provides that the Advisor and its officers, directors, persons associated with SIC Advisors, stockholders (and owners of the stockholders), controlling persons and agents are entitled to indemnification from us for any damages, liabilities, costs and expenses (including reasonable attorneys’ fees and amounts reasonably paid in settlement) incurred by them in or by reason of any pending, threatened or completed action, suit, investigation or other proceedings arising out of or otherwise based on the performance of any of
21
Table of Contents
SIC Advisors’ duties or obligations under the Investment Advisory Agreement, as applicable, or otherwise as our investment adviser, (i) to the extent such damages, liabilities, cost and expenses (A) are not fully reimbursed by insurance and (B) do not arise by reason of misfeasance, bad faith, or negligence in SIC Advisors’ performance of such duties or obligations, or SIC Advisors’ reckless disregard of such duties or obligations, and (ii) otherwise to the fullest extent such indemnification is consistent with the provisions of our articles of incorporation, the 1940 Act, the laws of the State of Maryland and other applicable law.
Term; Effective Date
The Investment Advisory Agreement was [initially] approved by our board of directors on April 5, 2012 and, [pursuant to the 1940 Act, remained] in effect for a period of two years. [Unless earlier terminated as described below, the Investment Advisory Agreement] will remain in effect from year-to-year thereafter if approved annually [at on in person meeting of our board of directors] by a majority of our directors who are not interested persons, or [by] the holders of a majority of our outstanding voting securities.
Our board of directors held an in-person meeting on March 12, 2014, in order to consider and approve the annual continuance of the Investment Advisory Agreement. In its consideration of the Investment Advisory Agreement, the board of directors focused on information it had received relating to, among other things: (a) the nature, quality and extent of the advisory and other services to be provided to us by our investment adviser, SIC Advisors; (b) comparative data with respect to advisory fees or similar expenses paid by other business development companies with similar investment objectives; (c) our projected operating expenses and expense ratio compared to business development companies with similar investment objectives; (d) any existing and potential sources of indirect income to SIC Advisors from its relationships with us and the profitability of those relationships; (e) information about the services to be performed and the personnel performing such services under the investment management agreement; (f) the organizational capability and financial condition of SIC Advisors and its affiliates; and (g) various other factors.
Based on the information reviewed and the discussions, the board of directors, including a majority of the non-interested directors, concluded that the investment management fee rates and terms are reasonable in relation to the services to be provided and approved the Investment Advisory Agreement for a period of one additional year.
REGULATION
General
We have elected to be regulated as a BDC under the 1940 Act. A BDC is a special category of investment company under the 1940 Act that was added by Congress to facilitate the flow of capital to private companies and small public companies that do not have efficient or cost-effective access to public capital markets or other conventional forms of corporate financing. BDCs make investments in private or thinly-traded public companies in the form of long-term debt and/or equity capital, with the goal of generating current income or capital growth.
BDCs are closed-end funds that elect to be regulated as BDCs under the 1940 Act. As such, BDCs are subject to only certain provisions of the 1940 Act, as well as the Securities Act and the Exchange Act. BDCs are provided greater flexibility under the 1940 Act than are other investment companies in dealing with their portfolio companies, issuing securities, and compensating their managers. BDCs can be internally or externally managed and may qualify to elect to be taxed as RICs for federal tax purposes. The 1940 Act contains prohibitions and restrictions relating to transactions between BDCs and their affiliates, principal underwriters, and affiliates of those affiliates or underwriters. The 1940 Act requires that a majority of a BDC’s directors be persons other than “interested persons,” as that term is defined in the 1940 Act. In addition, the 1940 Act provides that we may not change the nature of our business so as to cease to be, or withdraw our election as a BDC unless approved by a majority of our outstanding voting securities.
22
Table of Contents
The 1940 Act defines “a majority of the outstanding voting securities” as the lesser of: (1) 67% or more of the voting securities present at a meeting if the holders of more than 50% of our outstanding voting securities are present or represented by proxy or (2) 50% of our voting securities.
We will generally not be able to issue and sell our common stock at a price below net asset value per share. We may, however, sell our common stock, or warrants, options, or rights to acquire our common stock, at a price below the then-current net asset value of our common stock if our board of directors determines that such sale is in our best interests and the best interests of our stockholders, and our stockholders approve such sale. In addition, we may generally issue new shares of our common stock at a price below net asset value in rights offerings to existing stockholders, in payment of dividends, and in certain other limited circumstances.
Generally, BDCs are prohibited under the 1940 Act from knowingly participating in certain transactions with its affiliates without the prior approval of its board of directors who are not interested persons and, in some cases, prior approval by the SEC. The SEC has interpreted the prohibition on transactions with affiliates to prohibit “ joint transactions” among entities that share a common investment adviser. The staff of the SEC has granted no-action relief permitting purchases of a single class of privately placed securities, provided that the adviser negotiates no term other than price and certain other conditions are met. However, on November 25, 2013, we received an exemptive order (the “Exemptive Order”) from the SEC that permits us to participate in negotiated co-investment transactions with certain affiliates, including Medley Capital Corporation, a publicly traded business development company, each of whose investment adviser is Medley, LLC or an investment adviser controlled by Medley, LLC, in a manner consistent with our investment objective, strategies and restrictions, as well as regulatory requirements and other pertinent factors. Co-investment under the Exemptive Order is subject to certain conditions therein, including the condition that, in the case of each co-investment transaction, our board of directors determines that it would be advantageous for us to co-invest in a manner described in the Exemptive Order.
In situations where co-investment with other funds managed by SIC Advisors or its affiliates is not permitted or appropriate, such as when there is an opportunity to invest in different securities of the same issuer or where the different investments could be expected to result in a conflict between our interests and those of other clients of SIC Advisors or its affiliates, SIC Advisors or its affiliates will need to decide which client will proceed with the investment. SIC Advisors and/or its affiliates will make these determinations based on their policies and procedures, which generally require that such opportunities be offered to eligible accounts on an alternating basis that will be fair and equitable over time. Moreover, except in certain circumstances, we will be unable to invest in any issuer in which a fund managed by SIC Advisors or its affiliates has previously invested. Similar restrictions limit our ability to transact business with our officers or directors or their affiliates.
Under the terms of the Exemptive Order pernitting us to co-invest with other funds managed by SIC Advisors or its affiliates, a “required majority” (as defined in Section 57(o) of the 1940 Act) of our independent directors must make certain conclusions in connection with a co-investment transaction, including that (1) the terms of the proposed transaction are reasonable and fair to us and our stockholders and do not involve overreaching of us or our stockholders on the part of any person concerned and (2) the transaction is consistent with the interests of our stockholders and is consistent with our investment strategies and policies.
Business Development Company Regulation: Qualifying Assets
Under the 1940 Act, a BDC may not acquire any asset other than assets of the type listed in Section 55(a) of the 1940 Act, which are referred to as qualifying assets, unless, at the time the acquisition is made, qualifying assets represent at least 70% of the company’s total assets. As discussed in greater detail below, the 1940 Act defines qualifying assets as principally including certain investments by a BDC in eligible portfolio companies. An eligible portfolio company is defined under the 1940 Act as any issuer which:
| 1. | is organized under the laws of, and has its principal place of business in, the United States; |
23
Table of Contents
| 2. | is not an investment company (other than a small business investment company wholly owned by the BDC) or a company that would be an investment company but for certain exclusions under the 1940 Act; and |
| 3. | satisfies any of the following: |
| a. | does not have any class of securities that is traded on a national securities exchange; |
| b. | has a class of securities listed on a national securities exchange, but has an aggregate market value of outstanding voting and non-voting common equity of less than $250 million; |
| c. | is controlled by a BDC, either alone or as part of a group acting together, and the BDC has an affiliated person who is a director of the eligible portfolio company; or |
| d. | is a small and solvent company having total assets of not more than $4 million and capital and surplus of not less than $2 million. |
As relevant to our proposed business, the principal categories of qualifying assets under the 1940 Act are the following:
| 1. | Securities purchased in transactions not involving any public offering from the issuer of such securities, which issuer (subject to certain limited exceptions) is an eligible portfolio company, or from any person who is, or has been during the preceding 13 months, an affiliated person of an eligible portfolio company, or from any other person, subject to such rules as may be prescribed by the SEC. |
| 2. | Securities of any eligible portfolio company that we control. |
| 3. | Securities purchased in a private transaction from a U.S. issuer that is not an investment company or from an affiliated person of the issuer, or in transactions incident thereto, if the issuer is in bankruptcy and subject to reorganization or if the issuer, immediately prior to the purchase of its securities was unable to meet its obligations as they came due without material assistance other than conventional lending or financing arrangements. |
| 4. | Securities of an eligible portfolio company purchased from any person in a private transaction if there is no ready market for such securities and we already own 60% of the outstanding equity of the eligible portfolio company. |
| 5. | Securities received in exchange for or distributed on or with respect to securities described in (1) through (4) above, or pursuant to the exercise of warrants or rights relating to such securities. |
| 6. | Cash, cash equivalents, U.S. government securities, or high-quality debt securities maturing in one year or less from the time of investment. |
In addition, a BDC must have been organized and have its principal place of business in the United States and be operated for the purpose of making investments in the types of securities described in (1), (2) or (3) above.
For purposes of Section 55(a) under the 1940 Act, we will treat each asset underlying the TRS as a qualifying asset if the obligor on such asset is an eligible portfolio company and as a non-qualifying asset if the obligor is not an eligible portfolio company. We may, however, accord different treatment to the TRS in the future in accordance with any applicable new rules or interpretations adopted by the staff of the SEC.
Business Development Company Regulation: Control and Managerial Assistance to Portfolio Companies
In order to count portfolio securities as qualifying assets for the purpose of the 70% test, we must either control the issuer of the securities or make available to the issuer of the securities significant managerial assistance without the issuer having to request such assistance. Where we purchase such securities in conjunction
24
Table of Contents
with one or more other persons acting together, one of the other persons in the group may make available such managerial assistance. Making available managerial assistance includes any arrangement whereby the BDC, through its directors, officers, or employees, offers to provide, and, if accepted, does so provide, significant guidance and counsel concerning the management, operations or business objectives and policies of a portfolio company.
Temporary Investments
Pending investment in other types of “qualifying assets,” as described above, our investments may consist of cash, cash equivalents, U.S. government securities, or high-quality debt securities maturing in one year or less from the time of investment so that 70% of our total assets are qualifying assets. Typically, we intend to invest in U.S. Treasury bills or in repurchase agreements, provided that such agreements are fully collateralized by cash or securities issued by the U.S. government or its agencies. A repurchase agreement involves the purchase by an investor, such as us, of a specified security and the simultaneous agreement by the seller to repurchase it at an agreed-upon future date and at a price that is greater than the purchase price by an amount that reflects an agreed-upon interest rate. There is no percentage restriction on the proportion of our assets that may be invested in such repurchase agreements. However, if more than 25% of our total assets constitute repurchase agreements from a single counterparty, we may not meet the diversification requirements in order to qualify as a RIC for federal income tax purposes. Thus, we do not intend to enter into repurchase agreements with a single counterparty in excess of this limit. We expect that our Advisor will monitor the creditworthiness of the counterparties with which we enter into repurchase agreement transactions.
Senior Securities
We are permitted, under specified conditions, to issue multiple classes of debt and one class of stock senior to our common stock if our asset coverage, as defined in the 1940 Act, is at least equal to 200% immediately after each such issuance. In addition, while any senior securities remain outstanding, we must prohibit any distribution to our stockholders or the repurchase of such securities or shares unless we meet the applicable asset coverage ratios at the time of the distribution or repurchase. We may also borrow amounts up to 5% of the value of our total assets for temporary or emergency purposes without regard to asset coverage.
For purposes of the asset coverage ratio test applicable to us as a BDC, we will treat the outstanding notional amount of the TRS, less the initial amount of any cash collateral required to be posted by Arbor under the TRS, as a senior security for the life of that instrument. We may, however, accord different treatment to the TRS in the future in accordance with any applicable new rules or interpretations adopted by the staff of the SEC.
Code of Ethics
We have adopted a code of ethics pursuant to Rule 17j-1 under the 1940 Act that establishes procedures for personal investments and restricts certain personal securities transactions. Persons subject to these codes may invest in securities for their personal investment accounts, including securities that may be purchased or held by us, so long as such investments are made in accordance with the code’s requirements. We have attached our code of ethics as an exhibit to the registration statement. You may also read and copy our code of ethics at the SEC’s Public Reference Room located at 100 F Street, NE, Washington, DC 20549. You may obtain information on the operation of the Public Reference Room by calling the SEC at 1-800-SEC-0330. In addition, our code of ethics is available on the EDGAR Database on the SEC’s Internet site at http://www.sec.gov. You may also obtain copies of our code of ethics, after paying a duplicating fee, by electronic request at the following e-mail address: publicinfo@sec.gov, or by writing the SEC’s Public Reference Section, 100 F Street, NE, Washington, DC 20549.
25
Table of Contents
Compliance Policies and Procedures
We and our Advisor have each adopted and implemented written compliance policies and procedures reasonably designed to prevent violation of the federal securities laws and are required to review these compliance policies and procedures annually for their adequacy and the effectiveness of their implementation. Our chief compliance officer is responsible for administering our compliance policies and procedures and our Advisor’s chief compliance officer is responsible for administering the compliance policies and procedures for the Advisor.
Proxy Voting Policies and Procedures
We have delegated our proxy voting responsibility to SIC Advisors. SIC Advisors will vote proxies according to our proxy voting policies and procedures which are set forth below. These guidelines are reviewed periodically by the Advisor as well as our board of directors, and, accordingly, are subject to change.
As an investment advisor registered under the 1940 Act, SIC Advisors has a fiduciary duty to act solely in the best interests of its clients. As part of this duty, it recognizes that it must vote client securities in a timely manner free of conflicts of interest and in the best interests of its clients. These policies and procedures for voting proxies for the investment advisory clients of SIC Advisors are intended to comply with Section 206 of, and Rule 206(4)-6 under, the 1940 Act.
Proxy Policies
SIC Advisors will vote proxies relating to our securities in a manner that it believes, in its discretion, to be in the best interest of our stockholders. It will review on a case-by-case basis each proposal submitted for a stockholder vote taking into account relevant factors, including: (1) the impact on the value of the securities; (2) the anticipated costs and benefits associated with the proposal; (3) the effect on liquidity; and (4) customary industry and business practices. Although SIC Advisors will generally vote against proposals that may have a negative impact on its clients’ portfolio securities, it may vote for such a proposal if there exists compelling long-term reasons to do so.
The proxy voting decisions of SIC Advisors are made by its portfolio managers and investment professionals under the supervision of SIC Advisors legal/compliance department. To ensure that its vote is not the product of a conflict of interest, it will require that: (a) the recommended vote be approved by a member of SIC Advisors legal/compliance department prior to being submitted to the custodian; (b) associates involved in the decision making process or vote administration are prohibited from revealing how SIC Advisors intends to vote on a proposal in order to reduce any attempted influence from interested parties; and (c) where a material conflict of interest exists, the chief compliance officer designate an individual or group who can impartially help decide how to resolve such conflict.
Proxy Voting Records
You may obtain information, without charge, regarding how SIC Advisors voted proxies with respect to our portfolio securities by making a written request for proxy voting information to: Chief Compliance Officer, c/o Sierra Income Corporation at 375 Park Ave, 33rd Floor, New York, NY 10152.
Securities Exchange Act and Sarbanes-Oxley Act
We are subject to the reporting and disclosure requirements of the Exchange Act, including the filing of quarterly, annual and current reports, proxy statements and other required items. In addition, we are subject to the Sarbanes-Oxley Act of 2002, which imposes a wide variety of regulatory requirements on publicly-held companies and their insiders. Many of these requirements will affect us. For example:
| • | pursuant to Rule 13a-14 of the Exchange Act, our chief executive officer and chief financial officer are required to certify the accuracy of the financial statements contained in our periodic reports; |
26
Table of Contents
| • | pursuant to Item 307 of Regulation S-K, our periodic reports are required to disclose our conclusions about the effectiveness of our disclosure controls and procedures; and |
| • | pursuant to Rule 13a-15 of the Exchange Act, our management is required to prepare a report regarding its assessment of our internal control over financial reporting. |
The Sarbanes-Oxley Act requires us to review our policies and procedures to determine whether we comply with the Sarbanes-Oxley Act and its regulations. We intend to monitor our compliance with all regulations that are adopted under the Sarbanes-Oxley Act and will take actions necessary to ensure that we are in compliance.
Other
We are required to provide and maintain a bond issued by a reputable fidelity insurance company to protect us against larceny and embezzlement.
Election to Be Taxed as a RIC
We have elected to be treated as a RIC under Subchapter M of the Code. As a RIC, we generally do not have to pay corporate-level federal income taxes on any income that we distribute to our stockholders from our tax earnings and profits. To maintain our qualification as a RIC, we must, among other things, meet certain source-of-income and asset diversification requirements (as described below). In addition, in order to obtain and maintain RIC tax treatment, we must distribute to our stockholders, for each taxable year, at least 90% of our “investment company taxable income,” which is generally our net ordinary income plus the excess, if any, of realized net short-term capital gains over realized net long-term capital losses, or the Annual Distribution Requirement.
Taxation as a Regulated Investment Company
If we:
| • | maintain our qualification as a RIC; and |
| • | satisfy the Annual Distribution Requirement, |
then we will not be subject to federal income tax on the portion of our income we distribute (or are deemed to distribute) to stockholders. We will be subject to U.S. federal income tax at the regular corporate rates on any income or capital gains not distributed (or deemed distributed) to our stockholders.
We will be subject to a 4% nondeductible federal excise tax on certain undistributed income unless we distribute in a timely manner an amount at least equal to the sum of (1) 98% of our net ordinary income for each calendar year, (2) 98.2% of our capital gain net income for the one-year period ending October 31 in that calendar year and (3) any income recognized, but not distributed, in preceding years and on which we paid no federal income tax, or the Excise Tax Avoidance Requirement. We generally will endeavor in each taxable year to avoid any U.S. federal excise tax on our earnings.
In order to maintain our qualification as a RIC for federal income tax purposes, we must, among other things:
| • | continue to qualify as a BDC under the 1940 Act at all times during each taxable year; |
| • | derive in each taxable year at least 90% of our gross income from dividends, interest, payments with respect to certain securities, loans, gains from the sale of stock or other securities, net income from certain “qualified publicly traded partnerships,” or other income derived with respect to our business of investing in such stock or securities, or the 90% Income Test; and |
27
Table of Contents
| • | diversify our holdings so that at the end of each quarter of the taxable year: |
| • | at least 50% of the value of our assets consists of cash, cash equivalents, U.S. Government securities, securities of other RICs, and other securities if such other securities of any one issuer do not represent more than 5% of the value of our assets or more than 10% of the outstanding voting securities of the issuer; and |
| • | no more than 25% of the value of our assets is invested in the securities, other than U.S. government securities or securities of other RICs, of one issuer, of two or more issuers that are controlled, as determined under applicable Code rules, by us and that are engaged in the same or similar or related trades or businesses or of certain “qualified publicly traded partnerships,” or the Diversification Tests. |
For federal income tax purposes, we may be required to recognize taxable income in circumstances in which we do not receive a corresponding payment in cash. For example, if we hold debt obligations that are treated under applicable tax rules as having original issue discount (such as debt instruments with PIK interest or, in certain cases, increasing interest rates or debt instruments that were issued with warrants), we must include in income each year a portion of the original issue discount that accrues over the life of the obligation, regardless of whether cash representing such income is received by us in the same taxable year. We may also have to include in income other amounts that we have not yet received in cash, such as deferred loan origination fees that are paid after origination of the loan or are paid in non-cash compensation such as warrants or stock. We anticipate that a portion of our income may constitute original issue discount or other income required to be included in taxable income prior to receipt of cash.
Because any original issue discount or other amounts accrued will be included in our investment company taxable income for the year of the accrual, we may be required to make a distribution to our stockholders in order to satisfy the Annual Distribution Requirement, even though we will not have received any corresponding cash amount. As a result, we may have difficulty meeting the annual distribution requirement necessary to obtain and maintain RIC tax treatment under the Code. We may have to sell some of our investments at times and/or at prices we would not consider advantageous, raise additional debt or equity capital or forgo new investment opportunities for this purpose. If we are not able to obtain cash from other sources, we may fail to qualify for RIC tax treatment and thus become subject to corporate-level income tax. Our ability to dispose of assets to meet our distribution requirements may be limited by (1) the illiquid nature of our portfolio and/or (2) other requirements relating to our status as a RIC, including the Diversification Tests. If we dispose of assets in order to meet the Annual Distribution Requirement or the Excise Tax Avoidance Requirement, we may make such dispositions at times that, from an investment standpoint, are not advantageous.
Under the 1940 Act, we are not permitted to make distributions to our stockholders while our debt obligations and other senior securities are outstanding unless certain “asset coverage” tests are met. See “Regulation — Senior Securities.” As a result, we may be prohibited from making distributions necessary to satisfy the Annual Distribution Requirement. Even if we are not prohibited from making distributions, our ability to raise additional capital to satisfy the Annual Distribution Requirement may be limited. If we are not able to make sufficient distributions to satisfy the Annual Distribution Requirement, we may fail to qualify for RIC tax treatment and thus become subject to corporate-level income tax.
Certain of our investment practices may be subject to special and complex federal income tax provisions that may, among other things, (1) treat dividends that would otherwise constitute qualified dividend income as non-qualified dividend income, (2) disallow, suspend or otherwise limit the allowance of certain losses or deductions, (3) convert lower-taxed long-term capital gain into higher-taxed short-term capital gain or ordinary income, (4) convert an ordinary loss or a deduction into a capital loss (the deductibility of which is more limited), (5) cause us to recognize income or gain without receipt of a corresponding distribution of cash, (6) adversely affect the time as to when a purchase or sale of stock or securities is deemed to occur, (7) adversely alter the characterization of certain complex financial transactions and (8) produce income that will not be qualifying income for purposes of the 90% Income Test. We intend to monitor its transactions and may make certain tax
28
Table of Contents
elections to mitigate the potential adverse effect of these provisions, but there can be no assurance that any adverse effects of these provisions will be mitigated.
If we purchase shares in a “passive foreign investment company” (a “PFIC”), we may be subject to federal income tax on its allocable share of a portion of any “excess distribution” received on, or any gain from the disposition of, such shares even if our allocable share of such income is distributed as a taxable dividend to its stockholders. Additional charges in the nature of interest generally will be imposed on us in respect of deferred taxes arising from any such excess distribution or gain. If we invest in a PFIC and elects to treat the PFIC as a “qualified electing fund” under the Code (a “QEF”), in lieu of the foregoing requirements, we will be required to include in income each year our proportionate share of the ordinary earnings and net capital gain of the QEF, even if such income is not distributed by the QEF. Alternatively, we may be able to elect to mark-to-market at the end of each taxable year its shares in a PFIC; in this case, we will recognize as ordinary income our allocable share of any increase in the value of such shares, and as ordinary loss our allocable share of any decrease in such value to the extent that any such decrease does not exceed prior increases included in its income. Under either election, we may be required to recognize in a year income in excess of distributions from PFICs and proceeds from dispositions of PFIC stock during that year, and such income will nevertheless be subject to the Annual Distribution Requirement and will be taken into account for purposes of the 4% excise tax.
Failure to Maintain Our Qualification as a RIC
If we fail to satisfy the 90% Income Test or the Diversification Tests for any taxable year, we may nevertheless continue to qualify as a RIC for such year if certain relief provisions are applicable (which may, among other things, require us to pay certain corporate-level federal taxes or to dispose of certain assets).
If we were unable to qualify for treatment as a RIC and the foregoing relief provisions are not applicable, we would be subject to tax on all of our taxable income at regular corporate rates, regardless of whether we make any distributions to our stockholders. Distributions would not be required, and any distributions made in taxable years beginning on or before December 31, 2012 would be taxable to our stockholders as ordinary dividend income that, subject to certain limitations, may be eligible for the 15% maximum rate to the extent of our current and accumulated earnings and profits provided certain holding period and other requirements were met. Subject to certain limitations under the Code, corporate distributees would be eligible for the dividends-received deduction. Distributions in excess of our current and accumulated earnings and profits would be treated first as a return of capital to the extent of the stockholder’s tax basis, and any remaining distributions would be treated as a capital gain. To requalify as a RIC in a subsequent taxable year, we would be required to satisfy the RIC qualification requirements for that year and dispose of any earnings and profits from any year in which we failed to qualify as a RIC. Subject to a limited exception applicable to RICs that qualified as such under Subchapter M of the Code for at least one year prior to disqualification and that requalify as a RIC no later than the second year following the nonqualifying year, we could be subject to tax on any unrealized net built-in gains in the assets held by us during the period in which we failed to qualify as a RIC that are recognized within the subsequent 10 years, unless we made a special election to pay corporate-level tax on such built-in gain at the time of our requalification as a RIC
Foreign Account Tax Compliance Act
Legislation was enacted on March 18, 2010 that will impose a 30% U.S. withholding tax on dividends paid by U.S. issuers to a foreign financial institution after December 31, 2013 and on the gross proceeds from the disposition of stock paid to a foreign financial institution after December 31, 2016, unless such institution enters into an agreement with the U.S. Treasury Department (“Treasury”) to collect and provide to Treasury substantial information regarding U.S. account holders, including certain account holders that are foreign entities with U.S. owners, with such institution. The legislation also generally imposes a withholding tax of 30% on dividends paid by U.S. issuers and on the gross proceeds from the disposition of stock paid to a non-financial foreign entity unless such entity provides the withholding agent with a certification that it does not have any substantial U.S. owners or a certification identifying the direct and indirect substantial U.S. owners of the entity. Under
29
Table of Contents
certain circumstances, a holder may be eligible for refunds or credits of such taxes. Investors are urged to consult with their own tax advisors regarding the possible implications of this recently enacted legislation on their investment in shares of our common stock.
RISK FACTORS
Investing in our common stock involves a number of significant risks. In addition to the other information contained in this annual report on Form 10-K, you should consider carefully the following information before making an investment in our common stock. The risks below are not the only risks we face. Additional risks and uncertainties not presently known to us or not presently deemed material by us may also impair our operations and performance. If any of the following events occur, our business, financial condition and results of operations could be materially and adversely affected. In such case, the net asset value of our common stock could decline, and you may lose all or part of your investment.
Risks Relating to Our Business and Structure
We are a relatively new company and have limited operating history.
We were formed on June 14, 2011, and commenced operations on April 17, 2012, after successfully meeting our minimum offering requirement of selling, in aggregate, $2,000,000 in common stock from our public offering or one or more private offerings. We are subject to all of the business risks and uncertainties associated with any new business, including the risk that we will not achieve our investment objective and that the value of our common stock could decline substantially.
Economic activity in the United States was impacted by the global financial crisis of 2008 and has yet to fully recover.
Beginning in the third quarter of 2007, global credit and other financial markets suffered substantial stress, volatility, illiquidity and disruption. These forces reached extraordinary levels in late 2008, resulting in the bankruptcy of, the acquisition of, or government intervention in the affairs of several major domestic and international financial institutions. In particular, the financial services sector was negatively impacted by significant write-offs as the value of the assets held by financial firms declined, impairing their capital positions and abilities to lend and invest. We believe that such value declines were exacerbated by widespread forced liquidations as leveraged holders of financial assets, faced with declining prices, were compelled to sell to meet margin requirements and maintain compliance with applicable capital standards. Such forced liquidations also impaired or eliminated many investors and investment vehicles, leading to a decline in the supply of capital for investment and depressed pricing levels for many assets. These events significantly diminished overall confidence in the debt and equity markets, engendered unprecedented declines in the values of certain assets, and caused extreme economic uncertainty.
As a result of current economic conditions, corporate interest rate risk premiums, otherwise known as credit spreads, remain above historical averages, particularly in the debt market. Further increase in credit spreads could negatively impact our ability to obtain financing, particularly in the debt markets.
The downgrade of the U.S. credit rating and the economic crisis in Europe could negatively impact our liquidity, financial condition and earnings.
Recent U.S. debt ceiling and budget deficit concerns, together with signs of deteriorating sovereign debt conditions in Europe, have increased the possibility of additional credit-rating downgrades and economic slowdowns. Standard & Poor’s Ratings Services lowered its long-term sovereign credit rating on the United States, or the US, from “AAA” to “AA+” in August 2011. The impact of this or any further downgrades
30
Table of Contents
to the U.S. government’s sovereign credit rating, or its perceived creditworthiness, and the impact of the current crisis in Europe with respect to the ability of certain European Union countries to continue to service their sovereign debt obligations is inherently unpredictable and could adversely affect the U.S. and global financial markets and economic conditions. There can be no assurance that governmental or other measures to aid economic recovery will be effective. These developments and the government’s credit concerns in general, could cause interest rates and borrowing costs to rise, which may negatively impact our ability to access the debt markets on favorable terms. In addition, the decreased credit rating could create broader financial turmoil and uncertainty, which may exert downward pressure on the price of our common stock. Continued adverse economic conditions could have a material adverse effect on our business, financial condition and results of operations.
It is unclear how increased regulatory oversight and changes in the method for determining LIBOR may affect the value of the financial obligations to be held or issued by us that are linked to LIBOR, or how such changes could affect our results of operations or financial condition.
As a result of concerns about the accuracy of the calculation of LIBOR, a number of British Bankers’ Association, or BBA, member banks entered into settlements with certain regulators and law enforcement agencies with respect to the alleged manipulation of LIBOR, and there are ongoing investigations by regulators and governmental authorities in various jurisdictions. Following a review of LIBOR conducted at the request of the U.K. government, on September 28, 2012, recommendations for reforming the setting and governing of LIBOR were released, which are referred to as the Wheatley Review. The Wheatley Review made a number of recommendations for changes with respect to LIBOR, including the introduction of S-5 statutory regulation of LIBOR, the transfer of responsibility for LIBOR from the BBA to an independent administrator, changes to the method of the compilation of lending rates and new regulatory oversight and enforcement mechanisms for ratesetting and a reduction in the number of currencies and tenors for which LIBOR is published. Based on the Wheatley Review and on a subsequent public and governmental consultation process, on March 25, 2013, the U.K. Financial Services Authority published final rules for the U.K. Financial Conduct Authority’s regulation and supervision of LIBOR, which are referred to as the FCA Rules. In particular, the FCA Rules include requirements that (1) an independent LIBOR administrator monitor and survey LIBOR submissions to identify breaches of practice standards and/or potentially manipulative behavior, and (2) firms submitting data to LIBOR establish and maintain a clear conflicts of interest policy and appropriate systems and controls. The FCA Rules took effect on April 2, 2013. It is uncertain what additional regulatory changes or what changes, if any, in the method of determining LIBOR may be required or made by the U.K. government or other governmental or regulatory authorities. Accordingly, uncertainty as to the nature of such changes may adversely affect the market for or value of any LIBOR-linked securities, loans, derivatives and other financial obligations or extensions of credit held by or due to us or on our overall financial condition or results of operations. In addition, any further changes or reforms to the determination or supervision of LIBOR may result in a sudden or prolonged increase or decrease in reported LIBOR, which could have an adverse impact on the market for or value of any LIBOR-linked securities, loans, derivatives and other financial obligations or extensions of credit held by or due to us or on our overall financial condition or results of operations.
Price declines in the corporate leveraged loan market may adversely affect the fair value of our portfolio, reducing our net asset value through increased net unrealized depreciation.
Prior to the onset of the financial crisis that began in 2007, securitized investment vehicles, hedge funds and other highly leveraged non-bank financial institutions comprised the majority of the market for purchasing and holding senior and subordinated debt. As the trading price of the loans underlying these portfolios began to deteriorate beginning in the first quarter of 2007, we believe that many institutions were forced to raise cash by selling their interests in performing assets in order to satisfy margin requirements or the equivalent of margin requirements imposed by their lenders. This resulted in a forced deleveraging cycle of price declines, compulsory sales, and further price declines, with falling underlying credit values, widespread redemption requests, and other constraints resulting from the credit crisis generating further selling pressure.
31
Table of Contents
Conditions in the medium- and large-sized U.S. corporate debt market may experience similar or worse disruption or deterioration in the future, which may cause pricing levels to similarly decline or be volatile. As a result, our net asset value could decline through an increase in unrealized depreciation and incurrence of realized losses in connection with the sale of our investments, which could have a material adverse impact on our business, financial condition and results of operations.
Our ability to achieve our investment objective depends on our Advisor’s ability to manage and support our investment process. If the Advisor was to lose a significant number of its key professionals, our ability to achieve our investment objective could be significantly harmed.
We have no internal management capacity or employees other than our appointed executive officers and are dependent upon the investment expertise, skill and network of business contacts of our Advisor to achieve our investment objective. Our Advisor will evaluate, negotiate, structure, execute, monitor, and service our investments. Our future success depends to a significant extent on the continued service and coordination of our Advisor, including its key professionals. The departure of a significant number of our Advisor’s key professionals could have a material adverse effect on our ability to achieve our investment objective.
Our ability to achieve our investment objective also depends on the ability of our Advisor to identify, analyze, invest in, finance, and monitor companies that meet our investment criteria. Our Advisor’s capabilities in structuring the investment process, providing competent, attentive and efficient services to us, and facilitating access to financing on acceptable terms depend on the involvement of investment professionals in an adequate number and of adequate sophistication to match the corresponding flow of transactions. To achieve our investment objective, our Advisor may need to retain, hire, train, supervise, and manage new investment professionals to participate in our investment selection and monitoring process. Our Advisor may not be able to find qualified investment professionals in a timely manner or at all. Any failure to do so could have a material adverse effect on our business, financial condition and results of operations.
In addition, the Investment Advisory Agreement has termination provisions that allow the agreement to be terminated by us on 60 days’ notice or by SIC Advisors on 120 days’ notice without penalty.
The amount of any distributions we pay is uncertain. We may not be able to pay you distributions or be able to sustain them and our distributions may not grow over time.
We began declaring semi-monthly distributions to our stockholders beginning in July 2012 and intend to continue making semi-monthly distributions to stockholders, to the extent that we have assets legally available for distribution. We cannot assure you that we will achieve investment results that will allow us to make a targeted level of cash distributions or year-to-year increases in cash distributions. All distributions that we make will be at the discretion of our board of directors and will depend on our earnings, our financial condition, maintenance of our RIC status and other factors as our board of directors may deem to be relevant. Our ability to pay distributions might be adversely affected by the impact of the risks described in this annual report on Form 10-K. In addition, the inability to satisfy the asset coverage test applicable to us as a BDC may limit our ability to pay distributions. As a result, we cannot assure you that we will pay distributions to our stockholders in the future.
Our distribution proceeds may exceed our earnings, particularly during the period before we have substantially invested the net proceeds from our offering. We have not established any limit on the extent to which we may use borrowings, if any, or proceeds from our offerings to fund distributions, which may reduce the amount of capital we ultimately invest in assets.
The distributions we pay to our stockholders may exceed earnings, particularly during the period before we have substantially invested the net proceeds from our offerings. In the event that we encounter delays in locating suitable investment opportunities, we may pay our distributions from the proceeds of our offerings or from borrowings in anticipation of future cash flow, which may constitute a return of your capital and will lower your
32
Table of Contents
tax basis in your shares. Distributions from the proceeds of our offerings or from borrowings also could reduce the amount of capital we ultimately invest in portfolio companies. Accordingly, stockholders who receive the payment of a dividend or other distribution from us should not assume that such dividend or other distribution is the result of a net profit earned by us.
You will have limited opportunities to sell your shares and, to the extent you are able to sell your shares under our share repurchase program, you may not be able to recover the amount of your investment in our shares.
Our share repurchase program will include numerous restrictions that will limit your ability to sell your shares. Unless our board of directors determines otherwise, we will limit the number of shares to be repurchased during any calendar year to the number of shares we can repurchase with the proceeds we receive from the issuance of shares of our common stock under our distribution reinvestment plan. At the discretion of our board of directors, we may also use cash on hand, cash available from borrowings and cash from the sale of our investments as of the end of the applicable quarter to repurchase shares. We will limit repurchases in each quarter to 2.5% of the weighted average number of shares of our common stock outstanding in the prior four calendar quarters. To the extent that the number of shares put to us for repurchase exceeds the number of shares that we are able to purchase, we will repurchase shares on a pro rata basis, not on a first-come, first-served basis. Further, we will have no obligation to repurchase shares if the repurchase would violate the restrictions on distributions under federal law or Maryland law, which prohibits distributions that would cause a corporation to fail to meet statutory tests of solvency. These limits may prevent us from accommodating all repurchase requests made in any year. In addition, our board of directors may suspend or terminate the share repurchase program. We will notify you of such developments: (i) in our periodic or current reports or (ii) by means of a separate mailing to you. In addition, we will have discretion to suspend or terminate the program, and to cease repurchases. Further, the program may have many limitations and should not be relied upon as a method to sell shares promptly and at a desired price.
Because our business model depends to a significant extent upon relationships with corporations, financial institutions and investment firms, the inability of the Advisor to maintain or develop these relationships, or the failure of these relationships to generate investment opportunities, could adversely affect our business.
We expect that SIC Advisors will depend on its relationships with corporations, financial institutions and investment firms, and we will rely indirectly to a significant extent upon these relationships to provide us with potential investment opportunities. If SIC Advisors fails to maintain its existing relationships or develop new relationships or sources of investment opportunities, we may not be able to grow our investment portfolio. In addition, individuals with whom SIC Advisors have relationships are not obligated to provide us with investment opportunities, and, therefore, there is no assurance that such relationships will generate investment opportunities for us.
A significant portion of our investment portfolio will be recorded at fair value as determined in good faith by our board of directors and, as a result, there will be uncertainty as to the value of our portfolio investments.
Under the 1940 Act, we are required to carry our portfolio investments at market value or, if there is no readily available market value, at fair value as determined by our board of directors. There is not a public market or active secondary market for many of the securities of the privately held companies in which we intend to invest. The majority of our investments will not be publicly traded or actively traded on a secondary market but, instead, may be traded on a privately negotiated over-the-counter secondary market for institutional investors. As a result, we will value these securities quarterly at fair value as determined in good faith by our board of directors.
The determination of fair value, and thus the amount of unrealized losses we may incur in any year, is to a degree subjective, and our Advisor has a conflict of interest in making the determination. We will value these securities quarterly at fair value as determined in good faith by our board of directors based on input from our
33
Table of Contents
Advisor and our audit committee. Our board of directors may utilize the services of an independent third-party valuation firm to aid it in determining the fair value of any securities. The types of factors that may be considered in determining the fair values of our investments include the nature and realizable value of any collateral, the portfolio company’s ability to make payments and its earnings, the markets in which the portfolio company does business, comparison to publicly traded companies, discounted cash flow, current market interest rates and other relevant factors. Because such valuations, and particularly valuations of private securities and private companies, are inherently uncertain, the valuations may fluctuate significantly over short periods of time due to changes in current market conditions. The determinations of fair value by our board of directors may differ materially from the values that would have been used if an active market and market quotations existed for these investments. Our net asset value could be adversely affected if the determinations regarding the fair value of our investments were materially higher than the values that we ultimately realize upon the disposal of such investments.
Our board of directors may change our operating policies and strategies without prior notice or stockholder approval, the effects of which may be adverse to our stockholders.
Our board of directors has the authority to modify or waive our current operating policies, investment criteria and strategies without prior notice and without stockholder approval. We cannot predict the effect any changes to our current operating policies, investment criteria and strategies would have on our business, net asset value, operating results and the value of our common stock. However, the effects might be adverse, which could negatively impact our ability to pay you distributions and cause you to lose all or part of your investment. Moreover, we will have significant flexibility in investing the net proceeds of our offering and may use the net proceeds from our offering in ways with which investors may not agree.
We may experience fluctuations in our quarterly results.
We could experience fluctuations in our quarterly operating results due to a number of factors, including our ability or inability to make investments in companies that meet our investment criteria, the interest rate payable and default rates on the debt securities we acquire, the level of our expenses, variations in and the timing of the recognition of realized and unrealized gains or losses, the degree to which we encounter competition in our markets, and general economic conditions. As a result of these factors, results for any previous period should not be relied upon as indicative of performance in future periods. These occurrences could have a material adverse effect on our results of operations, the value of your investment in us and our ability to pay distributions to you and our other stockholders.
Any unrealized losses we experience on our portfolio may be an indication of future realized losses, which could reduce our income available for distribution.
As a BDC, we are required to carry our investments at market value or, if no market value is ascertainable, at the fair value as determined in good faith by our board of directors. Decreases in the market values or fair values of our investments will be recorded as unrealized depreciation. Any unrealized losses in our portfolio could be an indication of a portfolio company’s inability to meet its repayment obligations to us with respect to the affected investments. This could result in realized losses in the future and ultimately in reductions of our income available for distribution in future periods. In addition, decreases in the market value or fair value of our investments will reduce our net asset value.
We are uncertain of our sources for funding our future capital needs. If we cannot obtain debt or equity financing on acceptable terms, our ability to acquire investments and to expand our operations will be adversely affected.
The net proceeds from the sale of shares will be used for our investment opportunities, operating expenses and for payment of various fees and expenses such as management fees, incentive fees and other fees. Any working capital reserves we maintain may not be sufficient for investment purposes, and we may require debt or
34
Table of Contents
equity financing to operate. In addition, we are required to distribute at least 90% of our net ordinary income and net short-term capital gains in excess of net long-term capital losses, if any, to our stockholders to maintain our RIC status. Accordingly, in the event that we need additional capital in the future for investments or for any other reason we may need to borrow from financial institutions in order to obtain such additional capital. These sources of funding may not be available to us due to unfavorable economic conditions, which could increase our funding costs, limit our access to the capital markets or result in a decision by lenders not to extend credit to us. Consequently, if we cannot obtain debt or equity financing on acceptable terms, our ability to acquire investments and to expand our operations will be adversely affected. As a result, we would be less able to achieve portfolio diversification and our investment objective, which may negatively impact our results of operations and reduce our ability to make distributions to our stockholders.
We are a non-diversified investment company within the meaning of the 1940 Act, and therefore we are not limited with respect to the proportion of our assets that may be invested in securities of a single issuer.
We are classified as a non-diversified investment company within the meaning of the 1940 Act, which means that we are not limited by the 1940 Act with respect to the proportion of our assets that we may invest in securities of a single issuer. To the extent that we assume large positions in the securities of a small number of issuers, or within a particular industry, our net asset value may fluctuate to a greater extent than that of a diversified investment company as a result of changes in the financial condition or the market’s assessment of the issuer. We may also be more susceptible to any single economic or regulatory occurrence than a diversified investment company. However, we will be subject to the diversification requirements applicable to RICs under Subchapter M of the Code. See “Tax Matters.”
If we internalize our management functions, your interest in us could be diluted, we could incur other significant costs associated with being self-managed and may not be able to retain or replace key personnel, and we may have increased exposure to litigation as a result of internalizing our management functions.
We may internalize management functions provided by our Advisor. Our board of directors may decide in the future to acquire assets and personnel from our Advisor or its affiliates for consideration that would be negotiated at that time. There can be no assurances that we would be successful in retaining our Advisor’s key personnel in the event of a management internalization transaction. In the event we were to acquire our Advisor we cannot be sure of the form or amount of consideration or other terms relating to any such acquisition, which could take many forms, including cash payments, promissory notes and/or shares of our stock. The payment of such consideration could reduce our net investment income.
We cannot reasonably estimate the amount of fees to our Advisor we would avoid paying, and the costs we would incur, if we acquired our Advisor, or acquired assets and personnel from it. If the expenses we assume as a result of management internalization are higher than the expenses we avoid paying to our Advisor, our net investment income would be lower than it otherwise would have been had we not acquired these entities, or acquired assets and personnel from these entities.
Additionally, if we internalize our management functions, we could have difficulty integrating these functions. Currently, the officers and associates of Medley perform general and administrative functions, including accounting and financial reporting. We may fail to properly identify the appropriate mix of personnel and capital needs to operate as a stand-alone entity. An inability to manage an internalization transaction effectively could result in our incurring additional costs and divert our management’s attention from effectively managing our portfolio or our operations.
In recent years, management internalization transactions have been the subject of stockholder litigation. Stockholder litigation can be costly and time-consuming, and there can be no assurance that any litigation expenses we might incur would not be significant or that the outcome of litigation would be favorable to us. Any amounts we are required to expend defending any such litigation will reduce our net investment income.
35
Table of Contents
Risks Related to SIC Advisors and its Respective Affiliates
Our dealer manager may face conflicts of interest as a result of a compensation arrangement between one of its affiliates and SIC Advisors.
In exchange for the provision of certain non-investment advisory services to SIC Advisors, and pursuant to a written agreement, an affiliate of the dealer manager, Strategic Capital, is entitled to receive up to 20% of the gross cash proceeds received by SIC Advisors from the management and incentive fees payable by us to SIC Advisors in its capacity as our investment adviser. The purpose of this arrangement is to permit our Advisor to capitalize upon the expertise of the executives of Strategic Capital and its affiliates in providing administrative and operational services with respect to non-exchange traded investment vehicles similar to us. Strategic Capital holds a non-voting interest in SIC Advisors which entitles it to 20% of the net proceeds received in connection with the sale or other strategic transaction involving SIC Advisors.
As a result of this compensation arrangement, our dealer manager has a financial interest in the performance of the assets recommended by SIC Advisors. The dealer manager may face conflicts of interest as a result and may have an incentive to influence our Advisor to select investments that may not be in our best interest.
SIC Advisors has limited experience managing a BDC or a RIC.
While the principals of SIC Advisors consists of the same personnel that formed MCC Advisors LLC, the investment adviser to Medley Capital Corporation, a publicly-traded BDC, SIC Advisors is a newly-formed entity with no prior experience managing a BDC or a RIC. As a result, an investment in our shares of common stock may entail more risk than the shares of common stock of a comparable company with a substantial operating history.
The 1940 Act and the Code impose numerous constraints on the operations of BDC and RICs that do not apply to the other types of investment vehicles that compete with us. For example, under the 1940 Act, BDCs are required to invest at least 70% of their total assets primarily in securities of qualifying U.S. private or thinly traded companies. Moreover, qualification for RIC tax treatment under Subchapter M of the Code requires satisfaction of source-of-income, diversification and other requirements. The failure to comply with these provisions in a timely manner could prevent us from qualifying as a BDC or RIC or could force us to pay unexpected taxes and penalties, which could be material. SIC Advisors’ limited experience in managing a portfolio of assets under such constraints may hinder its ability to take advantage of attractive investment opportunities and, as a result, achieve our investment objective.
SIC Advisors and its affiliates, including our officers and some of our directors, face conflicts of interest caused by compensation arrangements with us, which could result in actions that are not in the best interests of our stockholders.
SIC Advisors and its affiliates receive substantial fees from us in return for their services, and these fees could influence the advice provided to us. Among other matters, because the base management fee that we will pay to SIC Advisors is based on our gross assets, SIC Advisors may benefit if we incur indebtedness.
The time and resources that individuals associated with SIC Advisors devote to us may be diverted, and we may face additional competition due to the fact that SIC Advisors is not prohibited from raising money for or managing another entity that makes the same types of investments that we target.
SIC Advisors is not prohibited from raising money for and managing future investment entities that make the same types of investments as those we target. The time and resources that our Advisor devotes to us may be diverted, and during times of intense activity in other programs it may devote less time and resources to our business than is necessary or appropriate. As a result of these competing demands on their time and the fact that they may engage in other business activities on behalf of themselves and others, these individuals face conflicts
36
Table of Contents
of interest in allocating their time. These conflicts of interest could result in declines in the returns on our investments and the value of your investment. In addition, we may compete with any such investment entity for the same investors and investment opportunities. While we may co-invest with such investment entities to the extent permitted by the 1940 Act and the rules and regulations thereunder, the 1940 Act imposes significant limits on co-investment. In this regard, the Exemptive Order allows us additional latitude to co-invest with certain affiliates. Nevertheless, the Exemptive Order requires us to meet certain conditions in order to invest in certain portfolio companies in which our affiliates are investing or are invested. Affiliates of SIC Advisors, whose primary business includes the origination of investments, engage in investment advisory businesses with accounts that compete with us.
We may be obligated to pay our Advisor incentive compensation even if we incur a net loss due to a decline in the value of our portfolio.
Our Investment Advisory Agreement entitles SIC Advisors to receive an incentive fee based on our net investment income regardless of any capital losses. In such case, we may be required to pay SIC Advisors an incentive fee for a fiscal quarter even if there is a decline in the value of our portfolio or if we incur a net loss for that quarter.
Any incentive fee payable by us that relates to our net investment income may be computed and paid on income that may include interest that has been accrued but not yet received. If a portfolio company defaults on a loan that is structured to provide accrued interest, it is possible that accrued interest previously included in the calculation of the incentive fee will become uncollectible. SIC Advisors is not obligated to reimburse us for any part of the incentive fee it received that was based on accrued income that we never received as a result of a subsequent default, and such circumstances would result in our paying an incentive fee on income we never receive.
For federal income tax purposes, we are required to recognize taxable income in some circumstances in which we do not receive a corresponding payment in cash (such as deferred interest that is accrued as original issue discount) and to make distributions with respect to such income to maintain our status as a RIC. Under such circumstances, we may have difficulty meeting the annual distribution requirement necessary to obtain and maintain RIC tax treatment under the Code. This difficulty in making the required distribution may be amplified to the extent that we are required to pay an incentive fee with respect to such accrued income. As a result, we may have to sell some of our investments at times and/or at prices we would not consider advantageous, raise additional debt or equity capital, or forgo new investment opportunities for this purpose. If we are not able to obtain cash from other sources, we may fail to qualify for RIC tax treatment and thus become subject to corporate-level income tax. For additional discussion regarding the tax implications of being a RIC, see “Tax Matters.”
The management and incentive fees we pay to our Advisor may induce our Advisor to make speculative investments.
The incentive fee payable by us to SIC Advisors may create an incentive for SIC Advisors to make investments on our behalf that are risky or more speculative than would be the case in the absence of such compensation arrangements. The way in which the incentive fee is determined may encourage SIC Advisors to use leverage to increase the return on our investments. In addition, the fact that our management fee is payable based upon our gross assets, which would include any borrowings for investment purposes, may encourage SIC Advisors to use leverage to make additional investments. Under certain circumstances, the use of leverage may increase the likelihood of default, which would disfavor holders of our common stock. Such a practice could result in our investing in more speculative securities than would otherwise be the case, which could result in higher investment losses, particularly during cyclical economic downturns.
37
Table of Contents
There are certain risks relating to the investment that SIC Advisors made in us.
SIC Advisors purchased 1,108,033.24 shares of our common stock for aggregate gross proceeds to us of $10,000,000. The issuance of shares to SIC Advisors was made immediately after our registration statement was declared effective by the SEC. Thus, SIC Advisors, or any person or entity to which such shares may be transferred, will be a significant stockholder for a period of time until we are able to raise substantial proceeds in our offering. As a result and given the fact that SIC Advisors is our investment advisor and certain of its principals serve as our executive officers and members of our board of directors, SIC Advisors will be able to exert significant influence over our management and policies. As a result, SIC Advisors, or any person or entity to which such shares may be transferred, may ultimately have the ability to take actions with respect to their voting of such shares that may not be in our or our stockholders’ best interest.
Our ability to enter into transactions with our affiliates will be restricted.
We are prohibited under the 1940 Act from participating in certain transactions with our affiliates without the prior approval of our independent directors and, in some cases, of the SEC. Any person that owns, directly or indirectly, five percent or more of our outstanding voting securities will be our affiliate for purposes of the 1940 Act, and we are generally prohibited from buying or selling any security from or to such affiliate, absent the prior approval of our independent directors. The 1940 Act also prohibits certain “joint” transactions with certain of our affiliates, which could include investments in the same portfolio company, without prior approval of our independent directors and, in some cases, of the SEC. We are prohibited from buying or selling any security from or to any person who owns more than 25% of our voting securities or certain of that person’s affiliates, or entering into prohibited joint transactions with such persons, absent the prior approval of the SEC. As a result of these restrictions, we may be prohibited from buying or selling any security (other than any security of which we are the issuer) from or to any portfolio company of a private equity fund managed by our investment adviser or its affiliates without the prior approval of the SEC, which may limit the scope of investment opportunities that would otherwise be available to us.
We may, however, co-invest with our investment adviser and its affiliates’ other clients in certain circumstances where doing so is consistent with applicable law and SEC staff interpretations. For example, we may co-invest with such accounts consistent with guidance promulgated by the SEC staff permitting us and such other accounts to purchase interests in a single class of privately placed securities so long as certain conditions are met, including that our investment adviser, acting on our behalf and on behalf of other clients, negotiates no term other than price. We may also co-invest with our investment adviser’s other clients as otherwise permissible under regulatory guidance, applicable regulations and SIC Advisors’ allocation policy. Under this allocation policy, a fixed percentage of each opportunity, which may vary based on asset class and from time to time, will be offered to us and similar eligible accounts, as periodically determined by SIC Advisors and approved by our board of directors, including our independent directors. The allocation policy further provides that allocations among us and these other accounts will generally be made pro rata based on each account’s capital available for investment, as determined, in our case, by our board of directors. It is our policy to base our determinations as to the amount of capital available for investment based on such factors as the amount of cash on-hand, existing commitments and reserves, if any, the targeted leverage level, the targeted asset mix and diversification requirements and other investment policies and restrictions set by our board of directors or imposed by applicable laws, rules, regulations or interpretations. We expect that these determinations will be made similarly for other accounts. However, we can offer no assurance that investment opportunities will be allocated to us fairly or equitably in the short-term or over time.
In addition, we have received an order from the SEC that permits us to negotiate the terms of co-investments with other funds managed by SIC Advisors or its affiliates subject to the conditions included therein. In situations where co-investment with other funds managed by SIC Advisors or its affiliates is not permitted or appropriate, such as when there is an opportunity to invest in different securities of the same issuer or where the different investments could be expected to result in a conflict between our interests and those of other SIC Advisors clients, SIC Advisors will need to decide which client will proceed with the investment. SIC Advisors
38
Table of Contents
will make these determinations based on its policies and procedures, which generally require that such opportunities be offered to eligible accounts on an alternating basis that will be fair and equitable over time. Moreover, except in certain circumstances, we will be unable to invest in any issuer in which a fund managed by SIC Advisors or its affiliates has previously invested. Similar restrictions limit our ability to transact business with our officers or directors or their affiliates.
We may make investments that could give rise to a conflict of interest.
We do not expect to invest in, or hold securities of, companies that are controlled by our Advisor’s affiliates’ clients. However, our Advisor’s affiliates’ clients may invest in, and gain control over, one of our portfolio companies. If our Advisor’s affiliates’ client, or clients, gains control over one of our portfolio companies, it may create conflicts of interest and may subject us to certain restrictions under the 1940 Act. As a result of these conflicts and restrictions, our Advisor may be unable to implement our investment strategy as effectively as they could have in the absence of such conflicts or restrictions. For example, as a result of a conflict or restriction, our Advisor may be unable to engage in certain transactions that they would otherwise pursue. In order to avoid these conflicts and restrictions, our Advisor may choose to exit these investments prematurely and, as a result, we would forego any positive returns associated with such investments. In addition, to the extent that another client holds a different class of securities than us as a result of such transactions, our interests may not be aligned.
Risks Related to BDCs
We may face increasing competition for investment opportunities, which could delay deployment of our capital, reduce returns and result in losses.
We compete for investments with other BDCs and investment funds (including registered investment companies, private equity funds and mezzanine funds), as well as traditional financial services companies such as commercial banks and other sources of funding. Moreover, alternative investment vehicles, such as hedge funds, have begun to invest in areas in which they have not traditionally invested, including making investments in our target market of privately owned U.S. companies. As a result of these new entrants, competition for investment opportunities in privately owned U.S. companies may intensify. Many of our competitors are substantially larger and have considerably greater financial, technical, and marketing resources than we do. For example, some competitors may have a lower cost of capital and access to funding sources that are not available to us. In addition, some of our competitors may have higher risk tolerances or different risk assessments than we have. These characteristics could allow our competitors to consider a wider variety of investments, establish more relationships and offer better pricing and more flexible structuring than we are able to do.
We may lose investment opportunities if we do not match our competitors’ pricing, terms, and structure criteria. If we are forced to match these criteria to make investments, we may not be able to achieve acceptable returns on our investments or may bear substantial risk of capital loss. A significant increase in the number and/or the size of our competitors in this target market could force us to accept less attractive investment terms. Furthermore, many of our competitors are not subject to the regulatory restrictions that the 1940 Act imposes on us as a BDC or the source of income, asset diversification and distribution requirements we must satisfy to maintain our RIC status. The competitive pressures we face may have a material adverse effect on our business, financial condition, results of operations, and cash flows. As a result of this competition, we may not be able to take advantage of attractive investment opportunities from time to time. Also we may not be able to identify and make investments that are consistent with our investment objective.
The requirement that we invest a sufficient portion of our assets in qualifying assets could preclude us from investing in accordance with our current business strategy; conversely, the failure to invest a sufficient portion of our assets in qualifying assets could result in our failure to maintain our status as a BDC.
As a BDC, the 1940 Act prohibits us from acquiring any assets other than certain qualifying assets unless, at the time of and after giving effect to such acquisition, at least 70% of our total assets are qualifying assets.
39
Table of Contents
Therefore, we may be precluded from investing in what we believe are attractive investments if such investments are not qualifying assets. Conversely, if we fail to invest a sufficient portion of our assets in qualifying assets, we could lose our status as a BDC, which would have a material adverse effect on our business, financial condition, and result of operations. Similarly, these rules could prevent us from making additional investments in existing portfolio companies, which could result in the dilution of our position.
Failure to maintain our status as a BDC would reduce our operating flexibility.
If we do not remain a BDC, we might be regulated as a registered closed-end investment company under the 1940 Act, which would subject us to substantially more regulatory restrictions and correspondingly decrease our operating flexibility.
Changes in laws or regulations governing our operations may adversely affect our business or cause us to alter our business strategy.
We and our portfolio companies will be subject to regulation at the local, state, and federal level. Changes to the laws and regulations governing our permitted investments may require a change to our investment strategy. Such changes could differ materially from our strategies and plans as set forth in this annual report on Form 10-K and may shift our investment focus from the areas of expertise of our Advisor. Thus, any such changes, if they occur, could have a material adverse effect on our results of operations and the value of your investment.
Regulations governing our operation as a BDC and RIC will affect our ability to raise capital and the way in which we raise additional capital or borrow for investment purposes, which may have a negative effect on our growth. As a BDC, the necessity of raising additional capital may expose us to risks, including the typical risks associated with leverage.
As a result of the annual distribution requirement to qualify as a RIC, we may need to access the capital markets periodically to raise cash to fund new investments. We may issue “senior securities,” including borrowing money from banks or other financial institutions only in amounts such that our asset coverage, as defined in the 1940 Act, equals at least 200% after such incurrence or issuance. If we issue senior securities, we will be exposed to typical risks associated with leverage, including an increased risk of loss. Our ability to issue different types of securities is also limited. Compliance with these requirements may unfavorably limit our investment opportunities and reduce our ability in comparison to other companies to profit from favorable spreads between the rates at which we can borrow and the rates at which we can lend. As a BDC, therefore, we intend to issue equity continuously at a rate more frequent than our privately owned competitors, which may lead to greater stockholder dilution.
We may borrow for investment purposes. If the value of our assets declines, we may be unable to satisfy the asset coverage test, which would prohibit us from paying distributions and could prevent us from qualifying as a RIC, which would generally result in a corporate-level tax on any income and net gains. If we cannot satisfy the asset coverage test, we may be required to sell a portion of our investments and, depending on the nature of our debt financing, repay a portion of our indebtedness at a time when such sales may be disadvantageous. Also, any amounts that we use to service our indebtedness would not be available for distributions to our common stockholders.
In addition, we anticipate that as market conditions permit, we may securitize our loans to generate cash for funding new investments. To securitize loans, we may create a wholly owned subsidiary, contribute a pool of loans to the subsidiary and have the subsidiary issue primarily investment grade debt securities to purchasers who we would expect to be willing to accept a substantially lower interest rate than the loans earn. We would retain all or a portion of the equity in the securitized pool of loans. Our retained equity would be exposed to any losses on the portfolio of loans before any of the debt securities would be exposed to such losses. Accordingly, if the pool of loans experienced a low level of losses due to defaults, we would earn an incremental amount of income on our retained equity but we would be exposed, up to the amount of equity we retained, to that proportion of any losses we would have experienced if we had continued to hold the loans in our portfolio. We would not treat the debt issued by such a subsidiary as senior securities.
40
Table of Contents
Risks Related to our Investments
Our investments in prospective portfolio companies may be risky, and we could lose all or part of our investment.
We intend to pursue a strategy focused on investing primarily in the debt of privately owned U.S. companies with a focus on transactions sourced through the network of SIC Advisors.
| • | Senior Secured Debt and Second Lien Secured Debt. When we invest in senior secured term debt and second lien secured debt, we will generally take a security interest in the available assets of these portfolio companies, including the equity interests of their subsidiaries. There is a risk that the collateral securing our investments may decrease in value over time or lose its entire value, may be difficult to sell in a timely manner, may be difficult to appraise and may fluctuate in value based upon the success of the business and market conditions, including as a result of the inability of the portfolio company to raise additional capital. Also, in some circumstances, our security interest could be subordinated to claims of other creditors. In addition, deterioration in a portfolio company’s financial condition and prospects, including its inability to raise additional capital, may be accompanied by deterioration in the value of the collateral for the debt security. Consequently, the fact that debt is secured does not guarantee that we will receive principal and interest payments according to the investment terms, or at all, or that we will be able to collect on the investment should we be forced to enforce our remedies. |
| • | Subordinated Debt. Our subordinated debt investments will generally be subordinated to senior debt and will generally be unsecured. This may result in a heightened level of risk and volatility or a loss of principal, which could lead to the loss of the entire investment. These investments may involve additional risks that could adversely affect our investment returns. To the extent interest payments associated with such debt are deferred, such debt may be subject to greater fluctuations in valuations, and such debt could subject us and our stockholders to non-cash income. Since we will not receive any principal repayments prior to the maturity of some of our subordinated debt investments, such investments will be of greater risk than amortizing loans. |
| • | Equity Investments. We expect to make selected equity investments. In addition, when we invest in senior and subordinated debt, we may acquire warrants or options to purchase equity securities or benefit from other types of equity participation. Our goal is ultimately to dispose of these equity interests and realize gains upon our disposition of such interests. However, the equity interests we receive may not appreciate in value and, in fact, may decline in value. Accordingly, we may not be able to realize gains from our equity interests, and any gains that we do realize on the disposition of any equity interests may not be sufficient to offset any other losses we experience. |
Most loans in which we invest will not be rated by any rating agency and, if they were rated, they would be rated as below investment grade quality. Loans rated below investment grade quality are generally regarded as having predominantly speculative characteristics and may carry a greater risk with respect to a borrower’s capacity to pay interest and repay principal.
To the extent original issue discount constitutes a portion of our income, we will be exposed to risks associated with the deferred receipt of cash representing such income.
Our investments may include original issue discount instruments. To the extent original issue discount constitutes a portion of our income, we will be exposed to typical risks associated with such income being required to be included in taxable and accounting income prior to receipt of cash, including the following:
| • | Original issue discount instruments may have unreliable valuations because the accruals require judgments about collectability. |
| • | Original issue discount instruments may create heightened credit risks because the inducement to trade higher rates for the deferral of cash payments typically represents, to some extent, speculation on the part of the borrower. |
41
Table of Contents
| • | For accounting purposes, cash distributions to stockholders representing original issue discount income do not come from paid-in capital, although they may be paid from the offering proceeds. Thus, although a distribution of original issue discount income comes from the cash invested by the stockholders, the 1940 Act does not require that stockholders be given notice of this fact. |
| • | In the case of payment-in-kind, or PIK, “toggle” debt, the PIK election has the simultaneous effects of increasing the assets under management, thus increasing the base management fee, and increasing the investment income, thus increasing the incentive fee. |
| • | Original issue discount creates risk of non-refundable cash payments to the Advisor based on non-cash accruals that may never be realized. |
Our portfolio companies may incur debt that ranks equally with, or senior to, our investments in such companies.
We intend to pursue a strategy focused on investing primarily in the debt of privately owned U.S. companies with a focus on transactions sourced through the network of SIC Advisors. Our portfolio companies may have, or may be permitted to incur, other debt that ranks equally with, or senior to, the debt in which we invest. By their terms, such debt instruments may entitle the holders to receive payment of interest or principal on or before the dates on which we are entitled to receive payments with respect to the debt instruments in which we invest. Also, in the event of insolvency, liquidation, dissolution, reorganization or bankruptcy of a portfolio company, holders of debt instruments ranking senior to our investment in that portfolio company would typically be entitled to receive payment in full before we receive any distribution. After repaying such senior creditors, such portfolio company may not have any remaining assets to use for repaying its obligation to us. In the case of debt ranking equally with debt instruments in which we invest, we would have to share on an equal basis any distributions with other creditors holding such debt in the event of an insolvency, liquidation, dissolution, reorganization or bankruptcy of the relevant portfolio company.
Subordinated liens on collateral securing debt that we will make to our portfolio companies may be subject to control by senior creditors with first priority liens. If there is a default, the value of the collateral may not be sufficient to repay in full both the first priority creditors and us.
Certain debt investments that we will make in portfolio companies will be secured on a second priority basis by the same collateral securing senior secured debt of such companies. The first priority liens on the collateral will secure the portfolio company’s obligations under any outstanding senior debt and may secure certain other future debt that may be permitted to be incurred by the company under the agreements governing the debt. The holders of obligations secured by the first priority liens on the collateral will generally control the liquidation of and be entitled to receive proceeds from any realization of the collateral to repay their obligations in full before us. In addition, the value of the collateral in the event of liquidation will depend on market and economic conditions, the availability of buyers and other factors. There can be no assurance that the proceeds, if any, from the sale or sales of all of the collateral would be sufficient to satisfy the debt obligations secured by the second priority liens after payment in full of all obligations secured by the first priority liens on the collateral. If such proceeds are not sufficient to repay amounts outstanding under the debt obligations secured by the second priority liens, then we, to the extent not repaid from the proceeds of the sale of the collateral, will only have an unsecured claim against the company’s remaining assets, if any.
We may also make unsecured debt investments in portfolio companies, meaning that such investments will not benefit from any interest in collateral of such companies. Liens on such portfolio companies’ collateral, if any, will secure the portfolio company’s obligations under its outstanding secured debt and may secure certain future debt that is permitted to be incurred by the portfolio company under its secured debt agreements. The holders of obligations secured by such liens will generally control the liquidation of, and be entitled to receive proceeds from, any realization of such collateral to repay their obligations in full before us. In addition, the value of such collateral in the event of liquidation will depend on market and economic conditions, the availability of buyers and other
42
Table of Contents
factors. There can be no assurance that the proceeds, if any, from sales of such collateral would be sufficient to satisfy our unsecured debt obligations after payment in full of all secured debt obligations. If such proceeds were not sufficient to repay the outstanding secured debt obligations, then our unsecured claims would rank equally with the unpaid portion of such secured creditors’ claims against the portfolio company’s remaining assets, if any.
The rights we may have with respect to the collateral securing the debt investments we make in our portfolio companies with senior debt outstanding may also be limited pursuant to the terms of one or more inter-creditor agreements that we enter into with the holders of senior debt. Under such an inter-creditor agreement, at any time that obligations that have the benefit of the first priority liens are outstanding, any of the following actions that may be taken in respect of the collateral will be at the direction of the holders of the obligations secured by the first priority liens: the ability to cause the commencement of enforcement proceedings against the collateral; the ability to control the conduct of such proceedings; the approval of amendments to collateral documents; releases of liens on the collateral; and waivers of past defaults under collateral documents. We may not have the ability to control or direct such actions, even if our rights are adversely affected.
There may be circumstances where our debt investments could be subordinated to claims of other creditors or we could be subject to lender liability claims.
If one of our portfolio companies were to go bankrupt, depending on the facts and circumstances, including the extent to which we actually provided managerial assistance to that portfolio company or a representative of us or SIC Advisors sat on the board of directors of such portfolio company, a bankruptcy court might re-characterize our debt investment and subordinate all or a portion of our claim to that of other creditors. In situations where a bankruptcy carries a high degree of political significance, our legal rights may be subordinated to other creditors.
In addition, lenders in certain cases can be subject to lender liability claims for actions taken by them when they become too involved in the borrower’s business or exercise control over a borrower. It is possible that we could become subject to a lender’s liability claim, including as a result of actions taken if we render significant managerial assistance to, or exercise control or influence over the board of directors of, the borrower.
We generally will not control the business operations of our portfolio companies and, due to the illiquid nature of our holdings in our portfolio companies, may not be able to dispose of our interest in our portfolio companies.
We do not expect to control most of our portfolio companies, even though we may have board representation or board observation rights, and our debt agreements may impose certain restrictive covenants on our borrowers. As a result, we are subject to the risk that a portfolio company in which we invest may make business decisions with which we disagree and the management of such company, as representatives of the holders of their common equity, may take risks or otherwise act in ways that do not serve our interests as debt investors. Due to the lack of liquidity for our investments in private companies, we may not be able to dispose of our interests in our portfolio companies as readily as we would like or at an appropriate valuation. As a result, a portfolio company may make decisions that could decrease the value of our portfolio holdings.
We may acquire various structured financial instruments for purposes of “hedging” or reducing our risks, which may be costly and ineffective and could reduce our cash available for distribution to our stockholders.
We may seek to hedge against interest rate and currency exchange rate fluctuations and credit risk by using structured financial instruments such as futures, options, swaps and forward contracts, subject to the requirements of the 1940 Act. Use of structured financial instruments for hedging purposes may present significant risks, including the risk of loss of the amounts invested. Defaults by the other party to a hedging transaction can result in losses in the hedging transaction. Hedging activities also involve the risk of an imperfect correlation between the hedging instrument and the asset being hedged, which could result in losses both on the hedging transaction and on the instrument being hedged. Use of hedging activities may not prevent significant
43
Table of Contents
losses and could increase our losses. Further, hedging transactions may reduce cash available to pay distributions to our stockholders.
Economic recessions or downturns could impair our portfolio companies and harm our operating results.
Many of our portfolio companies are susceptible to economic slowdowns or recessions and may be unable to repay our debt investments during these periods. Therefore, our non-performing assets are likely to increase, and the value of our portfolio is likely to decrease during these periods. Adverse economic conditions may also decrease the value of any collateral securing our senior secured or second lien secured debt. A severe recession may further decrease the value of such collateral and result in losses of value in our portfolio and a decrease in our revenues, net income, assets and net worth. Unfavorable economic conditions also could increase our funding costs, limit our access to the capital markets or result in a decision by lenders not to extend credit to us on terms we deem acceptable. These events could prevent us from increasing investments and harm our operating results.
A covenant breach by our portfolio companies may harm our operating results.
A portfolio company’s failure to satisfy financial or operating covenants imposed by us or other lenders could lead to defaults and, potentially, termination of its debt and foreclosure on its secured assets, which could trigger cross-defaults under other agreements and jeopardize a portfolio company’s ability to meet its obligations under the debt or equity securities that we hold. We may incur expenses to the extent necessary to seek recovery upon default or to negotiate new terms, which may include the waiver of certain financial covenants, with a defaulting portfolio company.
An investment strategy focused primarily on privately held companies presents certain challenges, including the lack of available information about these companies.
We intend to invest primarily in privately held companies. Investments in private companies pose certain incremental risks as compared to investments in public companies including that they:
| • | have reduced access to the capital markets, resulting in diminished capital resources and ability to withstand financial distress; |
| • | may have limited financial resources and may be unable to meet their obligations under their debt securities that we hold, which may be accompanied by a deterioration in the value of any collateral and a reduction in the likelihood of us realizing any guarantees we may have obtained in connection with our investment; |
| • | may have shorter operating histories, narrower product lines and smaller market shares than larger businesses, which tend to render them more vulnerable to competitors’ actions and changing market conditions, as well as general economic downturns; |
| • | are more likely to depend on the management talents and efforts of a small group of persons; therefore, the death, disability, resignation or termination of one or more of these persons could have a material adverse impact on our portfolio company and, in turn, on us; and |
| • | generally have less predictable operating results, may from time to time be parties to litigation, may be engaged in rapidly changing businesses with products subject to a substantial risk of obsolescence, and may require substantial additional capital to support their operations, finance expansion or maintain their competitive position. In addition, our executive officers, directors and members of the Advisor’s management may, in the ordinary course of business, be named as defendants in litigation arising from our investments in the portfolio companies. |
In addition, investments in private companies tend to be less liquid. The securities of private companies are not publicly traded or actively traded on the secondary market and are, instead, traded on a privately negotiated over-the-countersecondary market for institutional investors. These privately negotiated over-the-counter secondary markets may be inactive during an economic downturn or a credit crisis. In addition, the securities in these companies will be subject to legal and other restrictions on resale or will otherwise be less liquid than publicly traded securities. Also, under the 1940 Act, if there is no readily available market for these
44
Table of Contents
investments, we are required to carry these investments at fair value as determined by our board of directors. As a result if we are required to liquidate all or a portion of our portfolio quickly, we may realize significantly less than the value at which we had previously recorded these investments. We may also face other restrictions on our ability to liquidate an investment in a portfolio company to the extent that we, SIC Advisors or any of their respective affiliates have material nonpublic information regarding such portfolio company or where the sale would be an impermissible joint transaction. The reduced liquidity of our investments may make it difficult for us to dispose of them at a favorable price, and, as a result, we may suffer losses.
Finally, little public information generally exists about private companies and these companies may not have third-party debt ratings or audited financial statements. We must therefore rely on the ability of SIC Advisors to obtain adequate information through due diligence to evaluate the creditworthiness and potential returns from investing in these companies. Additionally, these companies and their financial information will not generally be subject to the Sarbanes-Oxley Act and other rules that govern public companies. If we are unable to uncover all material information about these companies, we may not make a fully informed investment decision, and we may lose money on our investments.
We may not have the funds or ability to make additional investments in our portfolio companies.
After our initial investment in a portfolio company, we may be called upon from time to time to provide additional funds to such company or have the opportunity to increase our investment through the exercise of a warrant or other right to purchase common stock. There is no assurance that we will make, or will have sufficient funds to make, follow-on investments. Even if we have sufficient capital to make a desired follow-on investment, we may elect not to make a follow-on investment because we may not want to increase our level of risk, we prefer other opportunities, we are limited in our ability to do so by compliance with BDC requirements or maintaining our RIC status. Our ability to make follow-on investments may also be limited by SIC Advisors’ allocation policies. Any decisions not to make a follow-on investment or any inability on our part to make such an investment may have a negative impact on a portfolio company in need of such an investment, may result in a missed opportunity for us to increase our participation in a successful operation or may reduce the expected return on the investment.
Prepayments of our debt investments by our portfolio companies could adversely impact our results of operations and reduce our return on equity.
We are subject to the risk that the investments we make in our portfolio companies may be repaid prior to maturity. When this occurs, we will generally reinvest these proceeds in temporary investments, pending their future investment in new portfolio companies. These temporary investments will typically have substantially lower yields than the debt being prepaid and we could experience significant delays in reinvesting these amounts. Any future investment in a new portfolio company may also be at lower yields than the debt that was repaid. As a result, our results of operations could be materially adversely affected if one or more of our portfolio companies elect to prepay amounts owed to us. Additionally, prepayments, net of prepayment fees, could negatively impact our return on equity.
We may enter into total return swap agreements or other derivative transactions which expose us to certain risks, including market risk, liquidity risk and other risks similar to those associated with the use of leverage.
Our wholly-owned, special purpose financing subsidiary, Arbor, has entered into a TRS for a portfolio of senior secured assets with Citibank, N.A., or Citibank. See “Management’s Discussion and Analysis of Financial Condition and Results of Operations — Financial Condition, Liquidity and Capital Resources — Total Return Swap” for a more detailed discussion of the terms of the TRS between Arbor and Citibank.
A TRS is a contract in which one party agrees to make periodic payments to another party based on the change in the market value of the assets underlying the TRS, which may include a specified security, basket of
45
Table of Contents
securities or securities indices during the specified period, in return for periodic payments based on a fixed or variable interest rate. A TRS effectively adds leverage to a portfolio by providing investment exposure to a security or market without owning or taking physical custody of such security or investing directly in such market. Because of the unique structure of a TRS, a TRS often offers lower financing costs than are offered through more traditional borrowing arrangements.
The TRS with Citibank enables us, through our ownership of Arbor, to obtain the economic benefit of owning the assets subject to the TRS, despite the fact that such assets will not be directly held or otherwise owned by us or Arbor, in return for an interest-type payment to Citibank. Accordingly, the TRS is analogous to us borrowing funds to acquire assets and incurring interest expense to a lender.
The TRS is subject to market risk, liquidity risk and risk of imperfect correlation between the value of the TRS and the assets underlying the TRS. In addition, we may incur certain costs in connection with the TRS that could, in the aggregate, be significant.
A TRS is also subject to the risk that a counterparty will default on its payment obligations thereunder or that we will not be able to meet our obligations to the counterparty. In the case of the TRS with Citibank, Arbor is required to post cash collateral amounts to secure its obligations to Citibank under the TRS. Citibank, however, is not required to collateralize any of its obligations to Arbor under the TRS. Arbor bears the risk of depreciation with respect to the value of the assets underlying the TRS and is required, under the terms of the TRS, to post additional collateral on a dollar-for-dollar basis in the event of depreciation in the value of the underlying assets after such value decreases below a specified amount. The amount of collateral required to be posted by Arbor is determined primarily on the basis of the aggregate value of the underlying assets.
Arbor is required to initially cash collateralize a specified percentage of each asset (generally 25% of the market value of such asset) included under the TRS in accordance with margin requirements described in the TRS Agreement. The limit on the additional collateral that Arbor may be required to post pursuant to the TRS is equal to the difference between the full notional amount of the assets underlying the TRS and the amount of cash collateral already posted by Arbor (determined without consideration of the initial cash collateral posted for each asset included in the TRS). Arbor’s maximum liability under the TRS is the amount of any decline in the aggregate value of the assets subject to the TRS, less the amount of the cash collateral previously posted by Arbor. Therefore, the absolute risk of loss with respect to the TRS is the notional amount of the TRS.
In addition to customary events of default and termination events, the agreements governing the TRS with Citibank, which are collectively referred to herein as the TRS Agreement, contain the following termination events: (a) a failure to satisfy the portfolio criteria for at least 30 days; (b) a failure to post initial cash collateral or additional collateral as required by the TRS Agreement; (c) a default by Arbor or us with respect to indebtedness in an amount equal to or greater than the lesser of $10.0 million and 2% of our net asset value at such time; (d) a merger of Arbor or us meeting certain criteria; (e) either us or Arbor amending its constituent documents to alter our investment strategy in a manner that has or could reasonably be expected to have a material adverse effect; (f) SIC Advisors ceasing to be the investment manager of Arbor or having authority to enter into transactions under the TRS Agreement on behalf of Arbor, and not being replaced by an entity reasonably acceptable to Citibank; (g) SIC Advisors ceasing to be our investment adviser; (h) Arbor failing to comply with its investment strategies or restrictions to the extent such non-compliance has or could reasonably be expected to have a material adverse effect; (i) Arbor becoming liable in respect of any obligation for borrowed money, other than arising under the TRS Agreement; (j) we dissolve or liquidate; (k) there occurs, without the prior consent of Citibank, any material change to or departure from our policies or the policies of Arbor that may not be changed without the vote of our stockholders and that relates to Arbor’s performance of its obligations under the TRS Agreement; and (l) we violate certain provisions of the 1940 Act or our election to be regulated as a BDC is revoked or withdrawn.
In addition to the rights of Citibank to terminate the TRS following an event of default or termination event as described above, Citibank may terminate the TRS on or after the second anniversary of the effective date of
46
Table of Contents
the TRS. SIC Advisors may terminate the TRS on behalf of Arbor at any time upon providing 10 days prior notice to Citibank. Any termination by SIC Advisors on behalf of Arbor prior to the second anniversary of the effective date of the TRS will result in payment of an early termination fee to Citibank. Under the terms of the TRS, the early termination fee will equal the present value of the following two cash flows: (a) interest payments at a rate equal to 1.30% based on 70% of the maximum notional amount of $100,000,000, payable from the later of the first anniversary of the effective date of the TRS or the termination date until the second anniversary of the effective date of the TRS and (b) interest payments at a rate equal to 0.15% based on the maximum notional amount of $100,000,000, payable from the later of the first anniversary of the effective date of the TRS or the termination date until the second anniversary of the effective date of the TRS.
Other than during the first 365 days and the last 60 days of the term of the TRS, Arbor is required to pay a minimum usage fee of 1.00% on the amount equal to 85% of the average daily unused portion of the maximum amount permitted under the TRS. Arbor will also pay Citibank customary fees in connection with the establishment and maintenance of the TRS.
Upon any termination of the TRS, Arbor will be required to pay Citibank the amount of any decline in the aggregate value of the assets subject to the TRS or, alternatively, will be entitled to receive the amount of any appreciation in the aggregate value of such assets. In the event that Citibank chooses to exercise its termination rights, it is possible that Arbor will owe more to Citibank or, alternatively, will be entitled to receive less from Citibank than it would have if Arbor controlled the timing of such termination due to the existence of adverse market conditions at the time of such termination.
In addition, because a TRS is a form of synthetic leverage, such arrangements are subject to risks similar to those associated with the use of leverage. See “Risks Related to Debt Financing” below.
Risks Relating to Debt Financing
At December 31, 2013, we had approximately $16.0 million of outstanding indebtedness under the syndicated revolving credit facility with ING Capital LLC.
Illustration. The following table illustrates the effect of leverage on returns from an investment in our common stock assuming various annual returns, net of expenses. The calculations in the table below are hypothetical and actual returns may be higher or lower than those appearing below. The calculation assumes (i) $186.2 million in total assets, (ii) a weighted average cost of funds of 3.1875%, (iii) $16.0 million in debt outstanding and (iv) $153.0 million in stockholders’ equity. In order to compute the “Corresponding return to stockholders,” the “Assumed Return on Our Portfolio (net of expenses)” is multiplied by the assumed total assets to obtain an assumed return to us. From this amount, the interest expense is calculated by multiplying the assumed weighted average cost of funds times the assumed debt outstanding, and the product is subtracted from the assumed return to us in order to determine the return available to stockholders. The return available to stockholders is then divided by our stockholders’ equity to determine the “Corresponding return to stockholders.” Actual interest payments may be different.
| Assumed Return on Our Portfolio (net of expenses) |
(10)% | (5)% | —% | 5% | 10% | |||||||||||||||
| Corresponding return to stockholders(1) |
(12.5 | )% | (6.4 | )% | (0.3 | )% | 5.8 | % | 11.8 | % | ||||||||||
| (1) | In order for us to cover our annual interest payments on indebtedness, we must achieve annual returns on our December 31, 2013 total assets of at least 0.3%. |
In addition, as of August 27, 2013, we have entered into a total return swap with Citi which provides us with exposure to a portfolio of loans with a maximum aggregate market value of $100 million. See “Risk Factors —Risks Related to Our Investments — We may enter into total return swap agreements or other derivative transactions which expose us to certain risks, including market risk, liquidity risk and other risks similar to those associated with the use of leverage.”
47
Table of Contents
Because we use borrowed funds to make investments or fund our business operations, we are exposed to risks typically associated with leverage which increase the risk of investing in us.
We intend to borrow funds through draws from our Revolving Credit Facility to leverage our capital structure, which is generally considered a speculative investment technique. As a result:
| • | our common shares may be exposed to an increased risk of loss because a decrease in the value of our investments may have a greater negative impact on the value of our common shares than if we did not use leverage; |
| • | if we do not appropriately match the assets and liabilities of our business, adverse changes in interest rates could reduce or eliminate the incremental income we make with the proceeds of any leverage; |
| • | our ability to pay dividends on our common stock may be restricted if our asset coverage ratio, as provided in the 1940 Act, is not at least 200% and any amounts used to service indebtedness or preferred stock would not be available for such dividends; |
| • | the Revolving Credit Facility is subject to periodic renewal by our lenders, whose continued participation cannot be guaranteed; |
| • | the Revolving Credit Facility contains covenants restricting our operating flexibility; and |
| • | we, and indirectly our stockholders, bear the cost of issuing and paying interest or dividends on such securities. |
Covenants in the Revolving Credit Facility may restrict our financial and operating flexibility.
We maintain the Revolving Credit Facility with certain lenders party thereto from time to time and ING Capital LLC, as administrative agent. The Revolving Credit Facility is secured by substantially all of our assets, subject to certain exclusions. Availability of loans under the Revolving Credit Facility is linked to the valuation of the collateral pursuant to a borrowing base mechanism. Borrowings under the Revolving Credit Facility are subject to, among other things, a minimum borrowing/collateral base. Substantially all of our assets are pledged as collateral under the Revolving Credit Facility. The Revolving Credit Facility require us to, among other things (i) make representations and warranties regarding the collateral as well as our business and operations, (ii) agree to certain indemnification obligations, and (iii) agree to comply with various affirmative and negative covenants. The documents for each of the Facilities also include default provisions such as the failure to make timely payments under the Revolving Credit Facility, as the case may be, the occurrence of a change in control, and our failure to materially perform under the operative agreements governing the Revolving Credit Facility, which, if not complied with, could accelerate repayment under the Facilities, thereby materially and adversely affecting our liquidity, financial condition and results of operations.
As a result of such covenants and restrictions in the Revolving Credit Facility, we will be limited in how we conduct our business and we may be unable to raise additional debt or equity financing to take advantage of new business opportunities. In addition, our ability to satisfy the financial requirements required by the Facilities can be affected by events beyond our control and we cannot assure you that we will meet these requirements. We cannot assure you that we will be able to maintain compliance with these covenants in the future and, if we fail to do so, we may be in default under the Facilities, and we may be prohibited from undertaking actions that are necessary or desirable to maintain and expand our business.
Default under the Revolving Credit Facility could allow the lender(s) to declare all amounts outstanding to be immediately due and payable. If the lender(s) declare amounts outstanding under the Revolving Credit Facility to be due, the lender(s) could proceed against the assets pledged to secure the debt under the Revolving Credit Facility. Any event of default, therefore, could have a material adverse effect on our business if the lender(s) determine to exercise their rights.
48
Table of Contents
Because we use debt to finance our investments, changes in interest rates will affect our cost of capital and net investment income.
Because we borrow money to make investments, our net investment income will depend, in part, upon the difference between the rate at which we borrow funds and the rate at which we invest those funds. As a result, we can offer no assurance that a significant change in market interest rates will not have a material adverse effect on our net investment income in the event we use our existing debt to finance our investments. In periods of rising interest rates, our cost of funds will increase to the extent we access the Revolving Credit Facility, since the interest rate on the Revolving Credit Facility is floating, which could reduce our net investment income to the extent any debt investments have fixed interest rates. We expect that our long-term fixed-rate investments will be financed primarily with issuances of equity and long-term debt securities. We may use interest rate risk management techniques in an effort to limit our exposure to interest rate fluctuations. Such techniques may include various interest rate hedging activities to the extent permitted by the 1940 Act.
You should also be aware that a rise in the general level of interest rates typically leads to higher interest rates applicable to our debt investments. Accordingly, an increase in interest rates may result in an increase of the amount of incentive fees payable to SIC Advisors.
If we borrow money, the potential for gain or loss on amounts invested in us will be magnified and may increase the risk of investing in us. Borrowed money may also adversely affect the return on our assets, reduce cash available for distribution to our stockholders, and result in losses.
The use of borrowings, also known as leverage, increases the volatility of investments by magnifying the potential for gain or loss on invested equity capital. If we use leverage to partially finance our investments, through borrowing from banks and other lenders, you will experience increased risks of investing in our common stock. If the value of our assets decreases, leveraging would cause net asset value to decline more sharply than it otherwise would have had we not leveraged. Similarly, any decrease in our income would cause net income to decline more sharply than it would have had we not borrowed. Such a decline could negatively affect our ability to make distributions to our stockholders. In addition, our stockholders will bear the burden of any increase in our expenses as a result of our use of leverage, including interest expenses and any increase in the management or incentive fees payable to the Advisor.
We may use leverage to finance our investments. The amount of leverage that we employ will depend on our Advisor and our board of directors’ assessment of market and other factors at the time of any proposed borrowing. There can be no assurance that leveraged financing will be available to us on favorable terms or at all. However, to the extent that we use leverage to finance our assets, our financing costs will reduce cash available for distributions to stockholders. Moreover, we may not be able to meet our financing obligations and, to the extent that we cannot, we risk the loss of some or all of our assets to liquidation or sale to satisfy the obligations. In such an event, we may be forced to sell assets at significantly depressed prices due to market conditions or otherwise, which may result in losses.
As a BDC, we generally are required to meet a coverage ratio of total assets to total borrowings and other senior securities, which include all of our borrowings and any preferred stock that we may issue in the future, of at least 200%. If this ratio declines below 200%, we cannot incur additional debt and could be required to sell a portion of our investments to repay some debt when it is disadvantageous to do so. This could have a material adverse effect on our operations, and we may not be able to make distributions. The amount of leverage that we employ will depend on our Advisor’s and our board of directors’ assessment of market and other factors at the time of any proposed borrowing. The amount of leverage that we will employ will be subject to oversight by our board of directors, a majority of whom will be independent directors with no material interests in such transactions.
49
Table of Contents
We will be exposed to risks associated with changes in interest rates.
We are subject to financial market risks, including changes in interest rates. Since we may use debt to finance investments, our net investment income will depend, in part, upon the difference between the rate at which we borrow funds and the rate at which we invest those funds. As a result, we can offer no assurance that a significant change in market interest rates will not have a material adverse effect on our net investment income. In periods of rising interest rates when we have debt outstanding, our cost of funds will increase, which could reduce our net investment income.
In addition, due to the continuing effects of the prolonged economic crisis and recession that began in 2007, interest rates have recently been at or near historic lows. In the event of a significant rising interest rate environment, our portfolio companies with adjustable-rate debt could see their payments increase and there may be a significant increase in the number of our portfolio companies who are unable or unwilling to repay their debt. Investments in companies with adjustable-rate debt may also decline in value in response to rising interest rates if the rates at which they pay interest do not rise as much, or as quickly, as market interest rates in general. Similarly, during periods of rising interest rates, our investments with fixed rates may decline in value because they are locked in at below market yield.
We may use interest rate risk management techniques in an effort to limit our exposure to interest rate fluctuations. These techniques may include various interest rate hedging activities to the extent such activities are not prohibited by the 1940 Act. These activities may limit our ability to participate in the benefits of lower interest rates with respect to the hedged portfolio. Adverse developments resulting from changes in interest rates or hedging transactions could have a material adverse effect on our business, financial condition and results of operations.
Risks Related to an Investment in our Common Stock
The success of our offering is dependent, in part, on the ability of the dealer manager to implement its business strategy, to hire and retain key employees and to successfully establish, operate and maintain a network of broker-dealers. Our dealer manager also serves as the dealer manager for the distribution of securities of other issuers and may experience conflicts of interest as a result.
The success of our offering and our ability to implement our business strategy is dependent upon the ability of our dealer manager to hire and retain key employees, establish, operate and maintain a network of licensed securities broker-dealers and other agents and implement its business strategy. If the dealer manager is unable to hire qualified employees, build a sufficient network of broker-dealers and implement its business strategy, we may not be able to raise adequate proceeds through our offering to implement our investment strategy.
In addition, the dealer manager serves as the dealer manager for or participates in the distribution of the securities of other issuers. As a result, the dealer manager may experience conflicts of interest in allocating its time between our offering and such other issuers, which could adversely affect our ability to raise adequate proceeds through our offering and implement our investment strategy. Further, the participating broker-dealers retained by the dealer manager may have numerous competing investment products, some with similar or identical investment strategies and areas of focus as us, which they may elect to emphasize to their retail clients.
Investors will not know the purchase price per share at the time they submit their subscription agreements and could receive fewer shares of common stock than anticipated if our board of directors determines to increase the offering price to comply with the requirement that we avoid selling shares below net asset value.
The purchase price at which you purchase shares will be determined at each weekly closing date to ensure that the sales price is equal to or greater than the net asset value of our shares, after deducting selling commissions and dealer manager fees. As a result, your purchase price may be higher than the prior subscription closing price per share, and therefore you may receive a smaller number of shares than if you had subscribed at the prior subscription closing price.
50
Table of Contents
their subscription agreements and could pay a premium for their shares of common stock if our board of directors does not decrease the offering price in the event of a decline to our net asset value per share.
The purchase price at which you purchase shares will be determined at each weekly closing date to ensure that the sales price is equal to or greater than the net asset value of our shares, after deducting selling commissions and dealer manager fees. In the event of a decrease to our net asset value per share, you could pay a premium of more than 2.5% for your shares of common stock if our board of directors does not decrease the offering price. A decline in our net asset value per share to an amount more than 2.5% below our current offering price, net of selling commissions and dealer manager fees, creates a rebuttable presumption that there has been a material change in the value of our assets such that a reduction in the offering price per share is warranted. This presumption may only be rebutted if our board of directors, in consultation with our management, reasonably and in good faith determines that the decline in net asset value per share is the result of a temporary movement in the credit markets or the value of our assets, rather than a more fundamental shift in the valuation of our portfolio. In the event that (i) net asset value per share decreases to more than 5% below our current net offering price and (ii) our board of directors believes that such decrease in net asset value per share is the result of a non-temporary movement in the credit markets or the value of our assets, our board of directors will undertake to establish a new net offering price that is not more than 2.5% above our net asset value per share. If our board of directors determines that the decline in our net asset value per share is the result of a temporary movement in the credit markets or the value of our assets, investors will purchase shares at an offering price per share, net of selling commissions and dealer manager fees, which represents a premium to the net asset value per share of greater than 2.5%.
If we are unable to raise substantial funds in our ongoing, continuous “best efforts” offering, we will be limited in the number and type of investments we may make, and the value of your investment in us may be reduced in the event our assets under-perform.
Our continuous offering is being made on a best efforts basis, whereby our dealer manager and participating broker-dealers are only required to use their best efforts to sell our shares and have no firm commitment or obligation to purchase any of the shares. To the extent that less than the maximum number of shares is subscribed for, the opportunity for diversification of our investments may be decreased and the returns achieved on those investments may be reduced as a result of allocating all of our expenses among a smaller capital base.
Our shares are not listed on an exchange or quoted through a quotation system and will not be listed for the foreseeable future, if ever. Therefore, our stockholders will have limited liquidity and may not receive a full return of invested capital upon selling their shares.
Our shares are illiquid investments for which there is not a secondary market nor is it expected that any will develop in the future. A future liquidity event could include: (i) a listing of our shares on a national securities exchange; (ii) a merger or another transaction approved by our board of directors in which our stockholders will receive cash or shares of a listed company; or (iii) a sale of all or substantially all of our assets either on a complete portfolio basis or individually followed by a liquidation. Certain types of liquidity events, such as a listing, would allow us to retain our investment portfolio intact while providing our stockholders with access to a trading market for their securities.
There can be no assurance that a suitable transaction will be available or that market conditions will be favorable during that timeframe. Prior to a liquidity event, our share repurchase program may provide a limited opportunity for you to have your shares of common stock repurchased, subject to certain restrictions and limitations, at a price which may reflect a discount from the purchase price you paid for the shares being repurchased.
Also, since a portion of the public offering price from the sale of shares in our offering will be used to pay expenses and fees, the full offering price paid by the stockholders will not be invested in portfolio companies. As a result, you may not receive a return of all of your invested capital. If we do not successfully complete a liquidity event, liquidity for an investor’s shares will be limited to participation in our share repurchase program.
51
Table of Contents
If our shares are listed on a national securities exchange or quoted through a quotation system, we cannot assure you a public trading market will develop or, if one develops, that such trading market can be sustained. Shares of companies offered in an initial public offering often trade at a discount to the initial offering price due to underwriting discounts and related offering expenses. Also, shares of closed-end investment companies, including BDCs, frequently trade at a discount from their net asset value. This characteristic of closed-end investment companies is separate and distinct from the risk that our net asset value per share of common stock may decline. We cannot predict whether our common stock, if listed, will trade at, above or below net asset value.
Our ability to conduct our continuous offering successfully is dependent, in part, on the ability of our dealer manager to successfully establish, operate and maintain relationships with a network of broker-dealers, which will in turn sell a sufficient number of shares of our common stock for us to achieve our investment objective.
Our dealer manager may not be able to sell a sufficient number of shares to allow us to have adequate funds to purchase a diversified portfolio of investments and generate income sufficient to cover our expenses.
The success of our public offering, and correspondingly our ability to implement our business strategy, is dependent upon the ability of our dealer manager to establish and maintain relationships with a network of licensed securities broker-dealers and other agents to sell our shares. If our dealer manager fails to perform, we may not be able to raise adequate proceeds through our public offering to implement our investment strategy. If we are unsuccessful in implementing our investment strategy, you could lose all or a part of your investment.
We are not obligated to complete a liquidity event; therefore, it will be difficult for an investor to sell his or her shares.
There can be no assurance that we will complete a liquidity event. If we do not successfully complete a liquidity event, liquidity for an investor’s shares will be limited to our share repurchase program, which we have no obligation to maintain.
The timing of our repurchase offers pursuant to our share repurchase program may be at a time that is disadvantageous to our stockholders.
When we make quarterly repurchase offers pursuant to the share repurchase program, we may offer to repurchase shares at a price that is lower than the price that investors paid for shares in our offering. As a result, to the extent investors paid an offering price that includes the related sales load and to the extent investors have the ability to sell their shares pursuant to our share repurchase program, then the price at which an investor may sell shares, which will be at a price equal to our most recently disclosed net asset value per share immediately prior to the date of repurchase, may be lower than what an investor paid in connection with the purchase of shares in our offering.
We may be unable to invest a significant portion of the net proceeds of our offering on acceptable terms in an acceptable timeframe.
Delays in investing the net proceeds of our offering may impair our performance. We cannot assure you we will be able to identify any investments that meet our investment objective or that any investment that we make will produce a positive return. We may be unable to invest the net proceeds of our offering on acceptable terms within the time period that we anticipate or at all, which could harm our financial condition and operating results.
Before making investments, we will invest the net proceeds of our public offering primarily in cash, cash equivalents, U.S. government securities, repurchase agreements, and other high-quality debt instruments maturing in one year or less from the time of investment. This will produce returns that are significantly lower
52
Table of Contents
than the returns, which we expect to achieve when our portfolio is fully invested in securities meeting our investment objective. As a result, any distributions that we pay while our portfolio is not fully invested in securities meeting our investment objective may be lower than the distributions that we may be able to pay when our portfolio is fully invested in securities meeting our investment objective.
A stockholder’s interest in us will be diluted if we issue additional shares, which could reduce the overall value of an investment in us.
Our investors do not have preemptive rights to any shares we issue in the future. Our articles of incorporation authorizes us to issue up to 250,000,000 shares of common stock. Pursuant to our articles of incorporation, a majority of our entire board of directors may amend our articles of incorporation to increase the number of authorized shares of stock without stockholder approval. After an investor purchases shares, our board may elect to sell additional shares in the future, issue equity interests in private offerings, or issue share-based awards to our independent directors or persons associated with the Advisor. To the extent we issue additional equity interests at or below net asset value, after an investor purchases our shares, an investor’s percentage ownership interest in us will be diluted. In addition, depending upon the terms and pricing of any additional offerings and the value of our investments, an investor may also experience dilution in the net asset and fair value of his or her shares.
Under the 1940 Act, we generally are prohibited from issuing or selling our common stock at a price below net asset value per share, which may be a disadvantage as compared with certain public companies. We may, however, sell our common stock, or warrants, options, or rights to acquire our common stock, at a price below the current net asset value of our common stock if our board of directors and independent directors determine that such sale is in our best interests and the best interests of our stockholders, and our stockholders, including a majority of those stockholders that are not affiliated with us, approve such sale. In any such case, the price at which our securities are to be issued and sold may not be less than a price that, in the determination of our board of directors, closely approximates the fair value of such securities (less any distributing commission or discount). If we raise additional funds by issuing common stock or senior securities convertible into, or exchangeable for, our common stock, then the percentage ownership of our stockholders at that time will decrease and you will experience dilution.
Preferred stock could be issued with rights and preferences that would adversely affect holders of our common stock.
As of the date of this annual report on Form 10-K, we have not offered any preferred stock. However, under the terms of our articles of incorporation, our board of directors is authorized to issue shares of preferred stock in one or more series without stockholder approval, which could potentially adversely affect the interests of existing stockholders. In the event we issue preferred stock, we will supplement our prospectus accordingly; however, doing so would not require a stockholder vote, unless we seek to issue preferred stock that is convertible into our common stock.
Certain provisions of the Maryland Corporation Law and the Investment Advisory Agreement could deter takeover attempts.
Our bylaws exempt us from the Maryland Control Share Acquisition Act, which significantly restricts the voting rights of control shares of a Maryland corporation acquired in a control share acquisition. If our board of directors were to amend our bylaws to repeal this exemption from the Maryland Control Share Acquisition Act, that statute may make it more difficult for a third party to obtain control of us and increase the difficulty of consummating such a transaction. Although we do not presently intend to adopt such an amendment to our bylaws, there can be no assurance that we will not so amend our bylaws at some time in the future. We will not, however, amend our bylaws to make us subject to the Maryland Control Share Acquisition Act without our board of directors determining that doing so would not conflict with the 1940 Act and obtaining confirmation from the SEC that it does not object to that determination.
53
Table of Contents
Additionally, our board of directors may, without stockholder action, authorize the issuance of shares of stock in one or more classes or series, including preferred stock. Our board of directors may also, without stockholder action, amend our articles of incorporation to increase the number of shares of stock of any class or series that we have authority to issue. These anti-takeover provisions may inhibit a change of control in circumstances that could give the holders of our common stock the opportunity to realize a premium over the value of our common stock.
Investing in our common stock involves a high degree of risk.
The investments we make in accordance with our investment objective may result in a higher amount of risk and volatility or loss of principal than alternative investment options. Our investments in portfolio companies may be highly speculative and aggressive and, therefore, an investment in our common stock may not be suitable for someone with lower risk tolerance.
The net asset value of our common stock may fluctuate significantly.
The net asset value and liquidity, if any, of the market for shares of our common stock may be significantly affected by numerous factors, some of which are beyond our control and may not be directly related to our operating performance. These factors include:
| • | changes in regulatory policies or tax guidelines, particularly with respect to RICs or BDCs; |
| • | loss of RIC or BDC status; |
| • | changes in earnings or variations in operating results; |
| • | changes in the value of our portfolio of investments; |
| • | changes in accounting guidelines governing valuation of our investments; |
| • | any shortfall in revenue or net income or any increase in losses from levels expected by investors; |
| • | departure of either of SIC Advisors or certain of its respective key personnel; |
| • | general economic trends and other external factors; and |
| • | loss of a major funding source. |
The price which you pay for our shares may not reflect our current net asset value at the time of your subscription.
In the event of a material decline in our net asset value per share, which we consider to be a 2.5% decrease below our current net offering price, and subject to certain conditions, we will reduce our offering price accordingly. Also we will file a supplement to our prospectus with the SEC, or amend our registration statement if our net asset value per share: (i) declines more than 10% from the net asset value per share as of the effective date of this registration statement or (ii) increases to an amount that is greater than the net proceeds per share as stated in our prospectus. Therefore, the net proceeds per share, net of all sales load, from a new investor may be in excess of the then current net asset value per share.
Federal Income Tax Risks
We will be subject to corporate-level income tax if we are unable to qualify as a RIC under Subchapter M of the Code or to satisfy RIC distribution requirements.
To maintain RIC tax treatment under the Code, we must meet the following minimum annual distribution, income source and asset diversification requirements.
54
Table of Contents
The minimum annual distribution requirement for a RIC will be satisfied if we distribute to our stockholders on an annual basis at least 90% of our net ordinary taxable income and realized net short-term capital gains in excess of realized net long-term capital losses, if any. We would also be taxed on any retained income and/or gains, including any short-term capital gains or long-term capital gains. We must also satisfy an additional annual distribution requirement during each calendar year in order to avoid a 4% excise tax on the amount of the under-distribution. Because we may use debt financing, we are subject to an asset coverage ratio requirement under the 1940 Act and may in the future become subject to certain financial covenants under loan and credit agreements that could, under certain circumstances, restrict us from making distributions necessary to satisfy the distribution requirements. If we are unable to obtain cash from other sources, we could fail to qualify for RIC tax treatment, or could be required to retain a portion of our income or gains, and thus become subject to corporate-level income tax.
The income source requirement will be satisfied if we obtain at least 90% of our income for each year from dividends, interest, gains from the sale of stock or securities, or similar sources.
The asset diversification requirement will be satisfied if we meet certain asset diversification requirements at the end of each quarter of our taxable year. To satisfy this requirement, at least 50% of the value of our assets must consist of cash, cash equivalents, U.S. Government securities, securities of other RICs, and other acceptable securities; and no more than 25% of the value of our assets can be invested in the securities, other than U.S. government securities or securities of other RICs, of one issuer, of two or more issuers that are controlled, as determined under applicable Code rules, by us and that are engaged in the same or similar or related trades or businesses or of certain “qualified publicly traded partnerships.” Failure to meet these requirements may result in our having to dispose of certain investments quickly in order to prevent the loss of RIC status. Because most of our investments will be in private companies, and therefore will be relatively illiquid, any such dispositions could be made at disadvantageous prices and could result in substantial losses.
If we fail to qualify for or maintain RIC tax treatment for any reason and are subject to corporate income tax, the resulting corporate taxes could substantially reduce our net assets, the amount of income available for distribution, and the amount of our distributions.
If we do not qualify as a “publicly offered regulated investment company,” as defined in the Code, you will be taxed as though you received a distribution of some of our expenses.
A “publicly offered regulated investment company” is a RIC whose shares are either (i) continuously offered pursuant to a public offering, (ii) regularly traded on an established securities market or (iii) held by at least 500 persons at all times during the taxable year. If we are not a publicly offered RIC for any period, a non-corporate stockholder’s allocable portion of our affected expenses, including our management fees, will be treated as an additional distribution to the stockholder and will be deductible by such stockholder only to the extent permitted under the limitations described below. For non-corporate stockholders, including individuals, trusts, and estates, significant limitations generally apply to the deductibility of certain expenses of a non-publicly offered RIC, including advisory fees. In particular, these expenses, referred to as miscellaneous itemized deductions, are deductible to an individual only to the extent they exceed 2% of such a stockholder’s adjusted gross income, and are not deductible for alternative minimum tax purposes. While we anticipate that we will constitute a publicly offered RIC after our first tax year, there can be no assurance that we will in fact so qualify for any of our taxable years.
We may have difficulty paying our required distributions if we recognize income before or without receiving cash representing such income.
For federal income tax purposes, we may be required to recognize taxable income in circumstances in which we do not receive a corresponding payment in cash. For example, if we hold debt obligations that are treated under applicable tax rules as having original issue discount (such as debt instruments with PIK, interest or, in
55
Table of Contents
certain cases, increasing interest rates or debt instruments that were issued with warrants), we must include in income each year a portion of the original issue discount that accrues over the life of the obligation, regardless of whether cash representing such income is received by us in the same taxable year. We may also have to include in income other amounts that we have not yet received in cash, such as deferred loan origination fees that are paid after origination of the loan or are paid in non-cash compensation such as warrants or stock. Furthermore, we may invest in non-U.S. corporations (or other non-U.S. entities treated as corporations for U.S. federal income tax purposes) that could be treated under the Code and U.S. Treasury regulations as “passive foreign investment companies” and/or “controlled foreign corporations.” The rules relating to investment in these types of non-U.S.entities are designed to ensure that U.S. taxpayers are either, in effect, taxed currently (or on an accelerated basis with respect to corporate level events) or taxed at increased tax rates at distribution or disposition. In certain circumstances this could require us to recognize income where we do not receive a corresponding payment in cash.
We anticipate that a portion of our income may constitute original issue discount or other income required to be included in taxable income prior to receipt of cash. Further, we may elect to amortize market discounts and include such amounts in our taxable income in the current year, instead of upon disposition, as an election not to do so would limit our ability to deduct interest expenses for tax purposes.
Because any original issue discount or other amounts accrued will be included in our investment company taxable income for the year of the accrual, we may be required to make a distribution to our stockholders in order to satisfy the annual distribution requirement, even if we will not have received any corresponding cash amount. As a result, we may have difficulty meeting the annual distribution requirement necessary to obtain and maintain RIC tax treatment under the Code. We may have to sell some of our investments at times and/or at prices we would not consider advantageous, raise additional debt or equity capital, make a partial share distribution, or forgo new investment opportunities for this purpose. If we are not able to obtain cash from other sources, and choose not to make a qualifying share distribution, we may fail to qualify for RIC tax treatment and thus become subject to corporate-level income tax.
| Item 1B. | Unresolved Staff Comments |
None.
| Item 2. | Properties |
We do not own any real estate or other physical properties materially important to our operation. Our headquarters are currently located at 375 Park Avenue, 33rd Floor, New York, NY 10152. Our administrator furnishes us office space and we reimburse it for such costs on an allocated basis.
| Item 3. | Legal Proceedings |
Neither we nor SIC Advisors are currently subject to any material legal proceedings.
| Item 4. | Mine Safety Disclosures |
Not Applicable
| Item 5. | Market for Registrant’s Common Equity, Related Stockholder Matters and Issuer Purchases of Equity Securities. |
Market Information
There is currently no market for our common stock, and we do not expect that a market for our shares will develop in the foreseeable future. No shares of our common stock have been authorized for issuance under any equity compensation plans. Under Maryland law, our stockholders generally will not be personally liable for our debts or obligations.
56
Table of Contents
We are offering our shares on a continuous basis at a current offering price of $10.20 per share; however, to the extent that our net asset value increases, we intend to sell at a price necessary to ensure that shares are not sold at a price per share, after deduction of selling commissions and dealer manager fees, that is below our net asset value per share. In the event of a material decline in our net asset value per share, which we consider to be a 2.5% decrease below our current net offering price, and subject to certain conditions, we will reduce our offering price accordingly. Therefore, persons who tender subscriptions for our shares in our offering must submit subscriptions for a certain dollar amount, rather than a number of our shares and, as a result, may receive fractional shares.
In connection with each closing on the sale of shares offered in our continuous public offering, our board of directors or a committee thereof is required, within 48 hours of the time that each closing and sale is made, to make the determination that we are not selling shares at a price per share which, after deducting selling commissions and dealer manager fees, is below our then current net asset value per share. Our board of directors will consider the following factors, among others, in making such determination:
| • | the net asset value per share of our shares disclosed in the most recent periodic report we filed with the SEC; |
| • | our management’s assessment of whether any material change in the net asset value per share has occurred (including through the realization of net gains on the sale of our portfolio investments) from the period beginning on the date of the most recently disclosed net asset value per share to the period ending two days prior to the date of the closing on and sale of our shares; and |
| • | the magnitude of the difference between the net asset value per share disclosed in the most recent periodic report we filed with the SEC and our management’s assessment of any material change in the net asset value per share since the date of the most recently disclosed net asset value per share, and the offering price of our shares at the date of closing. |
Importantly, this determination does not require that we calculate net asset value in connection with each closing and sale of our shares, but instead it involves the determination by our board of directors or a committee thereof that we are not selling our shares at a price which, after deducting selling commissions and dealer manager fees, is below the then current net asset value per share at the time at which the closing and sale is made.
Moreover, to the extent that there is even a remote possibility that we may (i) issue our shares at a price which, after deducting selling commissions and dealer manager fees, is below the then current net asset value per share of our shares at the time at which the closing and sale is made or (ii) trigger the undertaking (which we provided to the SEC in our registration statement) to suspend the offering of our shares pursuant to our continuous public offering if the net asset value per share fluctuates by certain amounts in certain circumstances until our prospectus is amended, our board of directors or a committee thereof will elect, in the case of clause (i) above, either to postpone the closing until such time that there is no longer the possibility of the occurrence of such event or to undertake to determine net asset value within two days prior to any such sale to ensure that such sale will not be at a price which, after deducting selling commissions and dealer manager fees, is below our then current net asset value per share, and, in the case of clause (ii) above, to comply with such undertaking or to undertake to determine net asset value to ensure that such undertaking has not been triggered.
In addition, a decline in our net asset value per share to an amount more than 2.5% below our current offering price, net of selling commissions and dealer manager fees, creates a rebuttable presumption that there has been a material change in the value of our assets such that a reduction in the offering price per share is warranted. This presumption may only be rebutted if our board of directors, in consultation with our management, reasonably and in good faith determines that the decline in net asset value per share is the result of a temporary movement in the credit markets or the value of our assets, rather than a more fundamental shift in the valuation of our portfolio. In the event that (i) net asset value per share decreases to more than 2.5% below our current net offering price and (ii) our board of directors believes that such decrease in the net asset value per
57
Table of Contents
share is the result of a non-temporary movement in the credit markets or the value of our assets, our board of directors will undertake to establish a new net offering price that is not more than 5% above our net asset value per share. If our board of directors determines that the decline in our net asset value per share is the result of a temporary movement in the credit markets or the value of our assets, investors will purchase shares at an offering price per share, net of selling commissions and dealer manager fees, which represents a premium to the net asset value per share of greater than 2.5%.
Set forth below is a chart describing the classes of our securities outstanding as of March 13, 2014:
| Title of Class |
Amount Authorized |
Amount Held by Us or for Our Account |
Amount Outstanding |
|||||||||
| Common Stock |
250,000,000 | — | 22,542,683 | |||||||||
As of March 13, 2014, we had 6,606 record holders of our common stock.
Distributions
Our dividends, if any, are determined by the board of directors. We have elected to be treated as a RIC under Subchapter M of the Code. To maintain RIC qualification, we must distribute at least 90% of our net ordinary income and net short-term capital gains in excess of our net long-term capital losses, if any. We will be subject to a 4% nondeductible federal excise tax on our undistributed income unless we distribute in a timely manner an amount at least equal to the sum of (1) 98% of our ordinary income for each calendar year, (2) 98.2% of our capital gain net income (both long-term and short-term) for the one-year period ending October 31 in that calendar year and (3) any income realized, but not distributed in the preceding year.
Our board of directors declared a series of semi-monthly distributions during 2013. These distributions represent an annualized yield of 7.84% based on our March 13, 2014 offering price of $10.20 per share:
| Record Date |
Payment Date | Amount Per Share | ||||
| July 13 and 31, 2012 |
August 1, 2012 | $ | 0.03333 | |||
| August 15 and 31, 2012 |
September 4, 2012 | 0.03333 | ||||
| September 14 and 28, 2012 |
October 1, 2012 | 0.03333 | ||||
| October 15 and 30, 2012 |
October 31, 2012 | 0.03333 | ||||
| November 15 and 29, 2012 |
November 30, 2012 | 0.03333 | ||||
| December 14 and 28, 2012 |
December 31, 2012 | 0.03333 | ||||
| January 15 and 31, 2013 |
January 31, 2013 | 0.03333 | ||||
| February 15 and 28, 2013 |
February 28, 2013 | 0.03333 | ||||
| March 15 and 29, 2013 |
March 29, 2013 | 0.03333 | ||||
| April 15 and 30, 2013 |
April 30, 2013 | 0.03333 | ||||
| May 15 and 31, 2013 |
May 31, 2013 | 0.03333 | ||||
| June 14 and 28, 2013 |
June 28, 2013 | 0.03333 | ||||
| July 15 and 31, 2013 |
July 31, 2013 | 0.03333 | ||||
| August 15 and 30, 2013 |
August 30, 2013 | 0.03333 | ||||
| September 13 and 30, 2013 |
September 30, 2013 | 0.03333 | ||||
| October 15 and 31, 2013 |
October 31, 2013 | 0.03333 | ||||
| November 15 and 29, 2013 |
November 29, 2013 | 0.03333 | ||||
| December 13 and 31, 2013 |
December 31, 2013 | 0.03333 | ||||
| January 15 and 31, 2014 |
January 31, 2014 | 0.03333 | ||||
58
Table of Contents
| Record Date |
Payment Date | Amount Per Share | ||||
| February 14 and 28, 2014 |
February 28, 2014 | 0.03333 | ||||
| March 14 and 31, 2014 |
March 31, 2014 | 0.03333 | ||||
| April 15 and 30, 2014 |
April 30, 2014 | 0.03333 | ||||
| May 15 and 30, 2014 |
May 30, 2014 | 0.03333 | ||||
| June 13 and 30, 2014 |
June 30, 2014 | 0.03333 | ||||
We may fund our cash distributions to stockholders from any sources of funds available to us, including offering proceeds, borrowings, net investment income from operations, capital gains proceeds from the sale of assets, non-capital gains proceeds from the sale of assets, dividends or other distributions paid to us on account of preferred and common equity investments in portfolio companies and expense reimbursements from SIC Advisors. The following table reflects, for tax purposes, the sources of the cash distributions that we have paid on our common stock during the years ended December 31, 2013 and 2012:
| As of December 31, 2013 |
As of December 31, 2012 |
|||||||
| Capital in excess of par value |
$ | — | $ | (328,132 | ) | |||
| Accumulated undistributed net investment income (loss) |
236,207 | 328,132 | ||||||
| Accumulated undistributed/(distributions in excess of) net realized gain (loss) from investments |
(236,207 | ) | — | |||||
The following table reflects, for tax purposes, the sources of the cash distributions that the Company has paid on its common stock during the years ended December 31, 2013 and 2012:
| Year ended December
31, 2013 |
Year Ended December
31, 2012 |
|||||||||||||||
| Source of Distribution |
Distribution Amount(1) |
Percentage | Distribution Amount |
Percentage | ||||||||||||
| Return of capital from offering proceeds |
$ | — | — | % | $ | — | — | % | ||||||||
| Return of capital from borrowings |
$ | 0 | — | % | $ | — | — | % | ||||||||
| Net investment income |
$ | 6,032,061 | 100.0 | % | $ | 637,330 | 100.0 | % | ||||||||
| Return of capital (other) |
$ | — | — | % | $ | — | — | % | ||||||||
|
|
|
|
|
|
|
|
|
|||||||||
| Distributions on a tax basis: |
$ | 6,032,061 | 100.0 | % | $ | 637,330 | 100.0 | % | ||||||||
|
|
|
|
|
|
|
|
|
|||||||||
| (1) | The Distribution Amount and Percentage reflected for December 31, 2013 are estimated figures. The actual source of distributions for the fiscal year ending 2013 will be calculated in connection with the Company’s year-end procedures. |
59
Table of Contents
| Item 6. | Selected Financial Data |
We have derived the selected financial data below from our audited financial statements for the fiscal year ended December 31, 2013 respectively, which has been audited by Ernst & Young LLP, our independent registered public accounting firm.
| At and for the Year Ended December 31, 2013 |
At and for the Year Ended December 31, 2012 |
|||||||
| Statement of Operations data: |
||||||||
| Total investment income |
$ | 8,007,002 | $ | 1,235,116 | ||||
| Base management fees |
1,906,386 | 319,530 | ||||||
| Incentive fee |
182,989 | 628 | ||||||
| All other expenses |
574,082 | 424,926 | ||||||
| Net investment income |
5,343,545 | 490,032 | ||||||
| Unrealized appreciation/depreciation on total investments |
839,817 | (19,160 | ) | |||||
| Net realized gain/loss on total investments |
97,424 | 22,298 | ||||||
| Net increase in net assets resulting from operations |
6,280,786 | 493,170 | ||||||
| Per share data: |
||||||||
| Net asset value per common share at year end |
$ | 9.18 | $ | 8.96 | ||||
| Net investment income |
0.72 | 0.21 | ||||||
| Net realized gains/(losses) on total investments |
0.01 | 0.01 | ||||||
| Net unrealized appreciation/(depreciation) on total investments |
0.12 | (0.01 | ) | |||||
| Net increase in net assets resulting from operations |
0.85 | 0.48 | ||||||
| Dividends declared |
0.80 | 0.40 | ||||||
| Issuance of common stock above net asset value |
0.17 | — | ||||||
| Balance Sheet data at year end: |
||||||||
| Total investment portfolio at fair value |
$ | 137,801,537 | $ | 30,580,211 | ||||
| Cash collateral on total return swap |
6,706,159 | — | ||||||
| Total investments |
144,507,696 | 30,580,211 | ||||||
| Cash and cash equivalents |
34,939,948 | 6,651,767 | ||||||
| Other assets |
6,759,194 | 1,608,400 | ||||||
| Total assets |
186,206,838 | 38,840,378 | ||||||
| Total liabilities |
33,204,565 | 18,217,396 | ||||||
| Total net assets |
153,002,273 | 20,622,982 | ||||||
| Other data: |
||||||||
| Weighted average yield on total investments (1) |
10.0 | % | 11.0 | % | ||||
| Number of investments in investment portfolio at year end |
49 | 34 | ||||||
| (1) | The weighted average yield is based upon original cost on our debt investments. |
| Item 7. | Management’s Discussion and Analysis of Financial Condition and Results of Operations. |
Some of the statements in this annual report on Form 10-K constitute forward-looking statements, which relate to future events or our performance or financial condition. The forward-looking statements contained in this annual report on Form 10-K involve risks and uncertainties, including, but not limited to, statements as to:
| • | our future operating results; |
| • | our business prospects and the prospects of our portfolio companies; |
| • | changes in the economy; |
| • | risk associated with possible disruptions in our operations or the economy generally; |
| • | the effect of investments that we expect to make; |
| • | our contractual arrangements and relationships with third parties; |
60
Table of Contents
| • | actual and potential conflicts of interest with SIC Advisors and its affiliates; |
| • | the dependence of our future success on the general economy and its effect on the industries in which we invest; |
| • | the ability of our portfolio companies to achieve their objectives; |
| • | the use of borrowed money to finance a portion of our investments; |
| • | the adequacy of our financing sources and working capital; |
| • | the timing of cash flows, if any, from the operations of our portfolio companies; |
| • | the ability of SIC Advisors to locate suitable investments for us and to monitor and administer our investments; |
| • | the ability of SIC Advisors and its affiliates to attract and retain highly talented professionals; |
| • | our ability to maintain our qualification as a RIC and as a BDC; and |
| • | the effect of changes in laws or regulations affecting our operations or to tax legislation and our tax position. |
Such forward-looking statements may include statements preceded by, followed by or that otherwise include the words “trend,” “opportunity,” “pipeline,” “believe,” “comfortable,” “expect,” “anticipate,” “current,” “intention,” “estimate,” “position,” “assume,” “potential,” “outlook,” “continue,” “remain,” “maintain,” “sustain,” “seek,” “achieve,” and similar expressions, or future or conditional verbs such as “will,” “would,” “should,” “could,” “may,” or similar expressions. The forward looking statements contained in this annual report involve risks and uncertainties. Our actual results could differ materially from those implied or expressed in the forward-looking statements for any reason, including the factors set forth as “Risk Factors” in this annual report on Form 10-K.
We have based the forward-looking statements included in this report on information available to us on the date of this report, and we assume no obligation to update any such forward-looking statements. Actual results could differ materially from those anticipated in our forward-looking statements, and future results could differ materially from historical performance. Although we undertake no obligation to revise or update any forward-looking statements, whether as a result of new information, future events or otherwise, you are advised to consult any additional disclosures that we may make directly to you or through reports that we have filed or in the future may file with the SEC, including quarterly reports on Form 10-Q, annual reports on Form 10-K, and current reports on Form 8-K.
Overview
We are an externally managed non-diversified closed-end management investment company that has elected to be treated as a BDC under the 1940 Act. We are externally managed by SIC Advisors which is a registered investment adviser under the Advisers Act. SIC Advisors is responsible for sourcing potential investments, conducting due diligence on prospective investments, analyzing investment opportunities, structuring investments and monitoring our portfolio on an ongoing basis. In addition, we have elected and intend to qualify to be treated, for U.S. federal income tax purposes, as a RIC under subchapter M of the Code.
On April 17, 2012 we successfully reached the minimum escrow requirement and officially commenced operations by receiving gross proceeds of $10 million in exchange for 1,108,033.24 shares of our common stock sold to SIC Advisors. As of December 31, 2013, we have combined proceeds, as well as a modest amount of leverage through a revolving credit facility with ING Capital LLC to invest $137.3 million across 49 transactions.
61
Table of Contents
Under our Investment Advisory Agreement, we pay SIC Advisors an annual management fee as well as an incentive fee based on our investment performance. Also, under the Administration Agreement, we reimburse Medley for the allocable portion of overhead and other expenses incurred by Medley Capital LLC in performing its obligations under the Administration Agreement, including our allocable portion of the costs of compensation and related expenses of our chief compliance officer, chief financial officer and their respective staffs.
Our investment objective is generate current income and, to a lesser extent, long-term capital appreciation. We intend to meet our investment objective by investing primarily in the debt of privately owned U.S. companies with a focus on senior secured debt, second lien debt and, to a lesser extent, subordinated debt. We will originate transactions sourced through SIC Advisors’ network, and expect to acquire debt securities through the secondary market. Our debt investments may take the form of corporate loans or bonds, may be secured or unsecured and may, in some cases, be accompanied by warrants, options or other forms of equity participation. We may separately purchase common or preferred equity interests in transactions.
The level of our investment activity depends on many factors, including the amount of debt and equity capital available to prospective portfolio companies, the level of merger, acquisition and refinancing activity for such companies, the availability of credit to finance transactions, the general economic environment and the competitive environment for the types of investments we make. Based on prevailing market conditions, we anticipate that we will invest the proceeds from each subscription closing generally within 30-90 days. The precise timing will depend on the availability of investment opportunities that are consistent with our investment objective and strategies. Any distributions we make during such period may be substantially lower than the distributions that we expect to pay when our portfolio is fully invested.
As a BDC, we are required to comply with certain regulatory requirements. For instance, we generally have to invest at least 70% of our total assets in “qualifying assets,” including securities of private or thinly traded public U.S. companies, cash, cash equivalents, U.S. government securities and high-quality debt investments that mature in one year or less. In addition, we are only allowed to borrow money such that our asset coverage, as defined in the 1940 Act, equals at least 200% after such borrowing, with certain limited exceptions. To obtain and maintain our RIC status, we must meet specified source-of-income and asset diversification requirements. To be eligible for tax treatment under Subchapter M for U.S. federal income tax purposes, we must distribute at least 90% of our net ordinary income and realized net short-term capital gains in excess of realized net long-term capital losses, if any, for the taxable year.
Revenues
We generate revenue in the form of interest on the debt securities that we hold and distributions and capital gains on other interests that we acquire in our portfolio companies. We expect that the senior debt we invest in will generally have stated terms of three to ten years and that the subordinated debt we invest in will generally have stated terms of five to ten years. Our senior and subordinated debt investments bear interest at a fixed or floating rate. Interest on debt securities is generally payable monthly, quarterly or semiannually. In addition, some of our investments provide for deferred interest payments or PIK interest. The principal amount of the debt securities and any accrued but unpaid interest generally will become due at the maturity date. In addition, we may generate revenue in the form of commitment and other fees in connection with transactions. Original issue discounts and market discounts or premiums will be capitalized, and we will accrete or amortize such amounts as interest income. We will record prepayment premiums on loans and debt securities as interest income. Dividend income, if any, will be recognized on an accrual basis to the extent that we expect to collect such amounts.
62
Table of Contents
Expenses
Our primary annual operating expenses consist of the payment of advisory fees and the reimbursement of expenses under our Investment Advisory Agreement with SIC Advisors and our Administration Agreement with Medley Capital LLC. We bear other expenses, which include, among other things:
| • | corporate, organizational and offering expenses relating to offerings of our common stock, subject to limitations included in our Investment Advisory Agreement; |
| • | the cost of calculating our net asset value, including the related fees and cost of any third-party valuation services; |
| • | the cost of effecting sales and repurchases of shares of our common stock and other securities; |
| • | fees payable to third parties relating to, or associated with, monitoring our financial and legal affairs, making investments, and valuing investments, including fees and expenses associated with performing due diligence reviews of prospective investments; |
| • | interest payable on debt, if any, incurred to finance our investments; |
| • | transfer agent and custodial fees; |
| • | fees and expenses associated with marketing efforts subject to limitations included in the Investment Advisory Agreement; |
| • | federal and state registration fees and any stock exchange listing fees; |
| • | federal, state and local taxes; |
| • | independent directors’ fees and expenses, including travel expenses; |
| • | costs of director and stockholder meetings, proxy statements, stockholders’ reports and notices; |
| • | costs of fidelity bonds, directors and officers/errors and omissions liability insurance and other types of insurance; |
| • | direct costs, including those relating to printing of stockholder reports and advertising or sales materials, mailing, long distance telephone and staff subject to limitations included in the Investment Advisory Agreement; |
| • | fees and expenses associated with independent audits and outside legal costs, including compliance with the Sarbanes-Oxley Act of 2002, the 1940 Act and applicable federal and state securities laws; |
| • | brokerage commissions for our investments; |
| • | all other expenses incurred by us or the Advisor in connection with administering our investment portfolio, including expenses incurred by our Advisor in performing certain of its obligations under the Investment Advisory Agreement; and |
| • | the reimbursement of the compensation of our chief financial officer and chief compliance officer, whose salary is paid by Medley, to the extent that each such reimbursement amount is annually approved by our independent director committee and subject to the limitations included in our Administration Agreement. |
Reimbursement of Medley for Administrative Services
We reimburse Medley Capital LLC for the administrative expenses necessary for its performance of services to us. However, such reimbursement is made at an amount equal to the lower of Medley Capital LLC’s actual costs or the amount that we would be required to pay for comparable administrative services in the same geographic location. Also, such costs will be reasonably allocated to us on the basis of assets, revenues, time records or other reasonable methods. We will not reimburse Medley Capital LLC for any services for which it receives a separate fee or for rent, depreciation, utilities, capital equipment or other administrative items allocated to a controlling person of Medley Capital LLC.
63
Table of Contents
Portfolio and Investment Activity
As of December 31, 2013, our investment portfolio consisted of investments in 49 portfolio companies with a fair value of $137.8 million, and was comprised of 20.8% Senior Secured first lien term loans, 41.0% Senior Secured second lien term loans, 34.4% Senior Secured first lien notes, 3.8% Senior Secured second lien notes and 0.0% warrants.
As of December 31, 2012, our investment portfolio consisted of investments in 31 portfolio companies with a fair value of $30.6 million, and was comprised of 6.4% Senior Secured first lien term loans, 9.6% Senior Secured second lien term loans, and 84.0% senior secured notes.
As of December 31, 2013, our income-bearing investment portfolio, which represented 99.9% of our total portfolio, had a weighted average yield based upon the cost of our investment portfolio of approximately 9.9%, and 43.3% of our income-bearing portfolio bore interest based on fixed rates, and 56.7% of our income-bearing portfolio bore interest on floating rates, such as LIBOR.
As of December 31, 2012, our income-bearing investment portfolio, which represented 100.0% of our total portfolio, had a weighted average yield based upon the cost of our investment portfolio of approximately 11.0%, and 84.0% of our income-bearing portfolio bore interest based on fixed rates, and 16.0% of our income-bearing portfolio bore interest on floating rates, such as LIBOR.
As of December 31, 2013, our average portfolio company investment and our largest portfolio company investment at amortized cost and fair value was approximately $2.6 million and $2.7 million, and $7.0 million and $1.7 million, respectively, and we had approximately $34.9 million of cash and cash equivalents. As of December 31, 2012, our average portfolio company investment and our largest portfolio company investment at amortized cost and fair value was approximately $0.9 million and $0.9 million, and $1.7 million and $1.7 million, respectively, and we had approximately $6.6 million of cash and cash equivalents.
The following table summarizes the amortized cost and the fair value of our investment portfolio not including cash and cash equivalents as of December 31, 2013:
| Amortized Cost |
Percentage | Fair Value | Percentage | |||||||||||||
| Senior secured first lien term loans |
$ | 28,617,156 | 20.9 | % | $ | 28,583,326 | 20.8 | % | ||||||||
| Senior secured first lien notes |
47,352,921 | 34.5 | 47,427,311 | 34.4 | ||||||||||||
| Senior secured second lien term loans |
56,224,549 | 40.9 | 56,481,247 | 41.0 | ||||||||||||
| Senior secured second lien notes |
5,108,477 | 3.7 | 5,254,676 | 3.8 | ||||||||||||
| Warrants/Equity |
29,173 | — | 54,977 | — | ||||||||||||
|
|
|
|
|
|
|
|
|
|||||||||
| Total |
$ | 137,332,276 | 100.0 | % | $ | 137,801,537 | 100.0 | % | ||||||||
|
|
|
|
|
|
|
|
|
|||||||||
The following table summarizes the amortized cost and the fair value of investments, not including cash and cash equivalents as of December 31, 2012:
| Amortized Cost |
Percentage of Total |
Fair Value | Percentage of Total |
|||||||||||||
| Senior Secured First Lien Term Loans |
$ | 1,692,630 | 6.4 | % | $ | 1,962,630 | 6.4 | % | ||||||||
| Senior Secured Second Lien Term Loans |
2,903,898 | 9.5 | 2,928,247 | 9.6 | ||||||||||||
| Senior Secured Notes(1) |
25,712,669 | 84.0 | 25,674,219 | 84.0 | ||||||||||||
| Equity/Warrants |
20,152 | 0.1 | 15,115 | 0.0 | ||||||||||||
|
|
|
|
|
|
|
|
|
|||||||||
| Total |
$ | 30,599,349 | 100.0 | % | $ | 30,580,211 | 100.0 | % | ||||||||
|
|
|
|
|
|
|
|
|
|||||||||
| (1) | As of December 31, 2012, all of our Senior secured notes are either first or second lien positions. |
64
Table of Contents
Our weighted average total investments including the value of cash collateral on total return swap, at December 31, 2013 was as follows:
| Percentage of Total Investments |
Weighted Average Current Yield for Total Investments |
|||||||
| Senior Secured First Lien Term Loans |
19.8 | % | 9.5 | % | ||||
| Senior Secured First Lien Notes |
32.8 | 10.2 | ||||||
| Senior Secured Second Lien Term Loans |
39.2 | 9.7 | ||||||
| Senior Secured Second Lien Notes |
3.6 | 9.2 | ||||||
| Equity/Warrants |
4.6 | 14.7 | ||||||
|
|
|
|
|
|||||
| Total |
100.0 | % | 10.0 | % | ||||
|
|
|
|
|
|||||
65
Table of Contents
The following table shows the portfolio composition by industry grouping, including the TRS underlying loans, based on fair value at December 31, 2013:
| Investments at Fair Value(1) |
Percentage of Total Portfolio(1) |
Value of TRS Underlying Loans |
Percentage of TRS Underlying Loans |
Total Investments at Fair Value including the value of TRS Underlying Loans |
Percentage of Total Portfolio Including the value of TRS Underlying Loans |
|||||||||||||||||||
| Electronics |
$ | 13,996,099 | 10.2 | % | $ | 6,581,250 | 26.2 | % | $ | 20,577,349 | 12.6 | % | ||||||||||||
| Oil and Gas |
18,862,779 | 13.7 | % | 1,020,000 | 4.1 | % | 19,882,779 | 12.2 | % | |||||||||||||||
| Telecommunications |
17,073,865 | 12.4 | % | — | — | 17,073,865 | 10.5 | % | ||||||||||||||||
| Retail Stores |
16,995,844 | 12.3 | % | — | — | 16,995,844 | 10.4 | % | ||||||||||||||||
| Healthcare, Education, and Childcare |
12,307,691 | 8.9 | % | 3,521,562 | 14.0 | % | 15,829,253 | 9.7 | % | |||||||||||||||
| Chemicals, Plastics, and Rubber |
9,810,000 | 7.1 | % | — | — | 9,810,000 | 6.0 | % | ||||||||||||||||
| Personal and Nondurable Consumer Products (Manufacturing Only) |
9,154,092 | 6.6 | % | — | — | 9,154,092 | 5.6 | % | ||||||||||||||||
| Diversified/Conglomerate Service |
2,511,528 | 1.8 | % | 4,521,250 | 18.0 | % | 7,032,778 | 4.3 | % | |||||||||||||||
| Finance |
6,808,098 | 4.9 | % | — | — | 6,808,098 | 4.2 | % | ||||||||||||||||
| Automobile |
6,119,250 | 4.4 | % | — | — | 6,119,250 | 3.8 | % | ||||||||||||||||
| Beverage, Food and Tobacco |
5,755,736 | 4.2 | % | — | — | 5,755,736 | 3.5 | % | ||||||||||||||||
| Cargo Transport |
5,677,727 | 4.1 | % | — | — | 5,677,727 | 3.5 | % | ||||||||||||||||
| Broadcasting and Entertainment. |
2,300,535 | 1.7 | % | 2,988,703 | 11.9 | % | 5,289,238 | 3.2 | % | |||||||||||||||
| Hotels, Motels, Inns, and Gaming |
3,056,250 | 2.2 | % | 2,028,760 | 8.1 | % | 5,085,010 | 3.1 | % | |||||||||||||||
| Mining, Steel, Iron and Nonprecious Metals |
2,396,489 | 1.7 | % | — | — | 2,396,489 | 1.5 | % | ||||||||||||||||
| Aerospace and Defense |
2,016,472 | 1.5 | % | — | — | 2,016,472 | 1.2 | % | ||||||||||||||||
| Leisure, Amusement, Motion Pictures, Entertainment |
2,007,080 | 1.5 | % | — | — | 2,007,080 | 1.2 | % | ||||||||||||||||
| Diversified/Conglomerate Manufacturing |
— | — | 1,976,813 | 7.9 | % | 1,976,813 | 1.2 | % | ||||||||||||||||
| Personal, Food, and Miscellaneous Services |
— | — | 1,507,500 | 6.0 | % | 1,507,500 | 0.9 | % | ||||||||||||||||
| Containers, Packaging, and Glass |
— | — | 1,004,380 | 4.0 | % | 1,004,380 | 0.6 | % | ||||||||||||||||
| Grocery |
952,002 | 0.7 | % | — | — | 952,002 | 0.6 | % | ||||||||||||||||
|
|
|
|
|
|
|
|
|
|
|
|
|
|||||||||||||
| Total |
$ | 137,801,537 | 100.0 | % | $ | 25,150,218 | 100 | % | $ | 162,951,755 | 100.0 | % | ||||||||||||
|
|
|
|
|
|
|
|
|
|
|
|
|
|||||||||||||
| (1) | Does not include TRS underlying loans |
66
Table of Contents
SIC Advisors regularly assesses the risk profile of each of our portfolio investments and rates each of them based on the following categories, which we refer to as SIC Advisors’ investment credit rating:
| Credit Rating |
Definition | |
| 1 | Investments that are performing above expectations. | |
| 2 | Investments that are performing within expectations, with risks that are neutral or favorable compared to risks at the time of origination or purchase. | |
| All new loans are rated ‘2’. | ||
| 3 | Investments that are performing below expectations and that require closer monitoring, but where no loss of interest, dividend or principal is expected. | |
| Companies rated ‘3’ may be out of compliance with financial covenants, however, loan payments are generally not past due. | ||
| 4 | Investments that are performing below expectations and for which risk has increased materially since origination or purchase. | |
| Some loss of interest or dividend is expected, but no loss of principal. | ||
| In addition to the borrower being generally out of compliance with debt covenants, loan payments may be past due (but generally not more than 180 days past due). | ||
| 5 | Investments that are performing substantially below expectations and whose risks have increased substantially since origination or purchase. | |
| Most or all of the debt covenants are out of compliance and payments are substantially delinquent. | ||
| Some loss of principal is expected. |
The following table shows the distribution of our investment portfolio, not including cash and cash equivalents, on the 1 to 5 investment performance rating scale at fair value as of:
| December 31, 2013 | December 31, 2012 | |||||||||||||||
| Investment Performance Rating |
Investments at Fair Value |
Percentage | Investments at Fair Value |
Percentage | ||||||||||||
| 1 |
$ | 2,198,601 | 1.6 | % | $ | — | — | % | ||||||||
| 2 |
99,713,280 | 98.2 | 29,517,711 | 96.5 | ||||||||||||
| 3 |
— | — | 1,062,500 | 3.5 | ||||||||||||
| 4 |
— | — | — | — | ||||||||||||
| 5 |
322,745 | 0.2 | — | — | ||||||||||||
|
|
|
|
|
|
|
|
|
|||||||||
| Total |
$ | 137,801,537 | 100.0 | % | $ | 30,580,211 | 100.0 | % | ||||||||
|
|
|
|
|
|
|
|
|
|||||||||
Results of Operations
Operating results for the years ended December 31, 2013 and 2012 are as follows:
| For the year ended December 31, 2013 |
For the period ended December 31, 2012 |
|||||||
| Total investment income |
$ | 8,007,002 | $ | 1,235,116 | ||||
| Total expenses, net |
2,663,457 | 745,084 | ||||||
| Net investment income |
5,343,545 | 490,032 | ||||||
| Net realized gains (losses) on total investments |
97,424 | 22,298 | ||||||
| Net unrealized gains (losses) on total investments |
839,817 | (19,160 | ) | |||||
|
|
|
|
|
|||||
| Net increase in net assets resulting from operations |
$ | 6,280,786 | $ | 493,170 | ||||
|
|
|
|
|
|||||
67
Table of Contents
Investment Income
For the year ended December 31, 2013, investment income totaled $8,007,002, of which $7,386,700 was attributable to portfolio interest, $619,861 was attributable to other fee income, and $441 to interest from cash and cash equivalents.
For the year ended December 31, 2012, investment income totaled $1,235,116, of which $1,228,076 was attributable to portfolio interest, $6,750 was attributable to other fee income, and $290 to interest from cash and cash equivalents.
Operating Expenses
Operating expenses for the year and period ended December 31, 2013 and 2012, respectively, were as follows:
| For the year ended December 31, 2013 |
For the year ended December 31, 2012 |
|||||||
| Base management fees |
$ | 1,906,386 | $ | 319,530 | ||||
| Organizational and offering costs reimbursed to an affiliate |
1,761,943 | 328,132 | ||||||
| Professional fees |
956,114 | 630,021 | ||||||
| General and administrative |
701,778 | 362,616 | ||||||
| Administrator expenses |
592,585 | 375,677 | ||||||
| Incentive fees |
182,989 | 628 | ||||||
| Interest and financing expenses |
215,059 | 47,529 | ||||||
| Directors fees |
154,084 | 146,861 | ||||||
| Insurance expenses |
131,770 | — | ||||||
|
|
|
|
|
|||||
| Expenses before expense reimbursement |
$ | 6,602,708 | $ | 2,210,994 | ||||
|
|
|
|
|
|||||
For the year ended December 31, 2013, total expense reimbursement from SIC Advisors pursuant to the Expense Support and Reimbursement Agreement was $3,939,251. Net expenses after taking into account the expense reimbursement from SIC Advisors, were $2,663,457 for the year ended December 31, 2013.
For the year ended December 31, 2012, total expense reimbursement from SIC Advisors pursuant to the Expense Support and Reimbursement Agreement was $1,465,910. Net expenses after taking into account the expense reimbursement from SIC Advisors, were $745,084 for the year ended December 31, 2012.
Expense Support and Reimbursement Agreement
On June 29, 2012, we entered into an Expense Support and Reimbursement Agreement (the “Expense Support Agreement”) with SIC Advisors. Pursuant to the Expense Support Agreement, SIC Advisors has agreed to reimburse us for operating expenses in an amount equal to the difference between our distributions paid to stockholders in each month, less the sum of our net investment income, our net realized capital gains and dividends paid to us from our portfolio companies during such period. The terms of the Expense Support Agreement commenced as of the date that our registration statement was declared effective by the SEC and continued monthly thereafter until December 31, 2012. Subsequently, the board of directors approved amendments to the Expense Support Agreement that extended the term from December 31, 2012 to June 30, 2014.
Pursuant to the Expense Support Agreement, we have a conditional obligation to reimburse SIC Advisors for any amounts funded by SIC Advisors under the Expense Support Agreement if (and only to the extent that), during any fiscal quarter occurring within three years of the date on which SIC Advisors incurred a liability for such amount, the sum of our net investment income, net capital gains and the amount of any dividends and other
68
Table of Contents
distributions paid to us from our portfolio companies (to the extent not included in net investment income or net capital gains for tax purposes) exceeds the distributions paid by us to stockholders. The purpose of the Expense Support Agreement is to cover distributions to stockholders so as to ensure that the distributions do not constitute a return of capital for GAAP purposes and to reduce operating expenses until we have raised sufficient capital to be able to absorb such expenses.
Pursuant to the Expense Support Agreement, we will reimburse SIC Advisors for expense support payments it previously made following any calendar quarter in which we received net investment income, net capital gains and dividends from our portfolio companies in excess of the distributions paid to stockholders during such calendar quarter (the “Excess Operating Funds”). Any such reimbursement will be made within three years of the date that the expense support payment obligation was incurred by SIC Advisors, subject to the conditions described below. The amount of the reimbursement during any calendar quarter will equal the lesser of (i) the Excess Operating Funds received during the quarter and (ii) the aggregate amount of all expense payments made by SIC Advisors that have not yet been reimbursed. In addition, we will only make reimbursement payments if our “operating expense ratio” is equal to or less than our operating expense ratio at the time the corresponding expense payment was incurred and if the annualized rate of our regular cash distributions to stockholders is equal to or greater than the annualized rate of our regular cash distributions to stockholders at the time the corresponding expense payment was incurred.
As of December 31, 2013, we recorded $2,592,989 in our consolidated statement of assets and liabilities as due from affiliate relating to the Expense Support and Reimbursement Agreement. For the year ended December 31, 2013, we recorded an expense reimbursement of 3,939,251 on the consolidated statement of operations. Expense reimbursements to SIC Advisors will be accrued as they become probable and estimable. For the year ended December 31, 2013, we did not record any Expense Repayments to SIC Advisors.
As of December 31, 2012, we recorded $814,814 in our statement of assets and liabilities as due from affiliate relating to the Expense Support and Reimbursement Agreement. For the year ended December 31, 2012, we recorded an expense reimbursement of $1,465,910 on the statement of operations. Expense reimbursements to SIC Advisors will be accrued as they become probable and estimable. For the year ended December 31, 2012, we did not record any Expense Repayments to SIC Advisors.
Net Realized Gains/Losses from Investments
We measure realized gains or losses by the difference between the net proceeds from the disposition and the amortized cost basis of an investment, without regard to unrealized gains or losses previously recognized.
During the year ended December 31, 2013 we recognized $97,424 in net realized gains on total investments. During the period ended December 31, 2012, we recognized $22,298 of net realized gains on our portfolio investments.
Net Unrealized Appreciation/Depreciation on Investments
Net change in unrealized appreciation on investments reflects the net change in the fair value of our total investments. For the year ended December 31, 2013, we had unrealized appreciation of $839,817 on total investments. For the year ended December 31, 2012, we had unrealized depreciation of $19,160 on our portfolio investments.
Changes in Net Assets from Operations
For the year ended December 31, 2013, we recorded a net increase in net assets resulting from operations of $6,280,786 versus a net increase in net assets resulting from operations of $493,170 for the year ended December 31, 2012. Based on 7,426,660 and 1,031,621 weighted average common shares outstanding for the
69
Table of Contents
years ended December 31, 2013 and 2012, respectively, our per share net increase in net assets resulting from operations was $0.85 for the year ended December 31, 2013 versus a per share net increase in net assets from operations of $0.48 for the year ended December 31, 2012.
Financial Condition, Liquidity and Capital Resources
As a BDC, we distribute substantially all of our net income to our stockholders and have an ongoing need to raise additional capital for investment purposes. To fund growth, we have a number of alternatives available to increase capital; including raising equity, increasing debt, and funding from operational cash flow.
Our liquidity and capital resources have been generated primarily from the net proceeds of our public offering of common stock.
As of December 31, 2013, we had $34.9 million in cash and cash equivalents. As of December 31, 2012, we had $6.7 million in cash and cash equivalents. In the future, we may generate cash from future offerings of securities, future borrowings and cash flows from operations, including interest earned from the temporary investment of cash in U.S. government securities and other high-quality debt investments that mature in one year or less. Our primary use of funds is investments in our targeted asset classes, cash distributions to our stockholders, and other general corporate purposes.
In order to satisfy the Code requirements applicable to a RIC, we intend to distribute to our stockholders substantially all of our taxable income, but we may also elect to periodically spillover certain excess undistributed taxable income from one tax year into the next tax year. In addition, as a BDC, we generally are required to meet a coverage ratio of total assets to total senior securities, which include borrowings and any preferred stock we may issue in the future, of at least 200%. This requirement limits the amount that we may borrow.
On April 24, 2012, we entered into a prime brokerage services agreement (“PBSA”) with Barclays Capital Inc. (“Barclays”) whereby Barclays provides financing for some portion of our secured bond investments. Under the terms of the PBSA, we are required to post a specified amount of collateral, in accordance with the margin requirements described in the agreement, generally between 20% and 50% of the market value of each secured bond investment as determined by Barclays. To secure the performance of our obligations under the PBSA, Barclays has been granted a first priority security interest and lien on all of the assets covered by the PBSA. Neither the cash collateral posted as margin nor our other assets covered by the PBSA are available to pay our debts. As of December 31, 2012, our borrowings under the Margin Facility totaled $17,345,794 and were recorded as due to prime broker on our statement of assets and liabilities. Our average outstanding borrowings for the period from April 17, 2012 (commencement of operations) to December 31, 2012 was $9,573,696. The prime brokerage account and margin borrowing facility with Barclays was closed on December 4, 2013 and, as of December 31, 2013 had no balance.
On December 4, 2013, we entered into a three-year senior secured syndicated revolving credit facility with a one-year term out period (the “ING Facility”) pursuant to a Senior Secured Revolving Credit Agreement (the “Revolving Credit Agreement”) with certain lenders party thereto from time to time and ING Capital LLC, as administrative agent. The ING Facility matures on December 4, 2017 and is secured by substantially all of our assets, subject to certain exclusions as further set forth in a Guarantee, Pledge and Security Agreement (the “Security Agreement”) entered into in connection with the Revolving Credit Agreement, among us, the Subsidiary Guarantors party thereto, ING Capital LLC, as Administrative Agent, each Financial Agent and Designated Indebtedness Holder party thereto and ING Capital LLC, as Collateral Agent. The ING Facility also includes usual and customary representations, covenants and events of default for senior secured revolving credit facilities of this nature. As of December 31, 2013, our borrowings under the ING Facility totaled $16,000,000 and were recorded as revolving credit facility payable on our consolidated statement of assets and liabilities.
70
Table of Contents
Contractual Obligations and Off-Balance Sheet Arrangements
We have entered into certain contracts under which we have material future commitments. On April 5, 2012, we entered into the Investment Advisory Agreement with SIC Advisors in accordance with the 1940 Act. The Investment Advisory Agreement became effective as of April 17, 2012, the date that we met the minimum offering requirement. SIC Advisors serves as our investment advisor in accordance with the terms of the Investment Advisory Agreement. Payments under our Investment Advisory Agreement in each reporting period consist of (i) a management fee equal to a percentage of the value of our gross assets and (ii) an incentive fee based on our performance.
On April 5, 2012, we entered into the administration agreement with Medley Capital LLC pursuant to which Medley Capital LLC furnishes us with administrative services necessary to conduct our day-to-day operations. Medley Capital LLC is reimbursed for administrative expenses it incurs on our behalf in performing its obligations. Such costs are reasonably allocated to us on the basis of assets, revenues, time records or other reasonable methods. We do not reimburse Medley Capital LLC for any services for which it receives a separate fee or for rent, depreciation, utilities, capital equipment or other administrative items allocated to a controlling person of Medley Capital LLC.
If any of our contractual obligations discussed above are terminated, our costs may increase under any new agreements that we enter into as replacements. We would also likely incur expenses in locating alternative parties to provide the services we expect to receive under the investment advisory agreement and administration agreement. Any new investment advisory agreement would also be subject to approval by our stockholders.
Off-Balance Sheet Arrangements
On August 27, 2013, Arbor Funding LLC (“Arbor”), a newly-formed, wholly-owned financing subsidiary of the Company, entered into a total return swap (“TRS”) with Citibank, N.A. (“Citibank”).
The TRS with Citibank enables Arbor to obtain the economic benefit of the loans underlying the TRS, despite the fact that such loans will not be directly held or otherwise owned by Arbor, in return for an interest-type payment to Citibank. Accordingly, the TRS is analogous to Arbor utilizing leverage to acquire loans and incurring an interest expense to a lender.
SIC Advisors acts as the investment manager of Arbor and has discretion over the composition of the basket of loans underlying the TRS. The terms of the TRS are governed by an ISDA 2002 Master Agreement, the Schedule thereto and Credit Support Annex to such Schedule, and the Confirmation exchanged thereunder, between Arbor and Citibank, which collectively establish the TRS, and are collectively referred to herein as the “TRS Agreement”.
Our maximum derivative risk exposure as of December 31, 2013 is $6,706,159, which is recorded on the consolidated statement of assets and liabilities as cash collateral on total return swap. Our derivative asset due from Citibank, net of amounts available for offset under a master netting agreement as of December 31, 2013 was $155,317, which is recorded on the consolidated statement of assets and liabilities as receivable due on total return swap. We do not offset collateral posted in relation to the TRS with any unrealized appreciation or depreciation outstanding in the consolidated statement of assets and liabilities as of December 31, 2013. Transactions in total return swap contracts during the year ended December 31, 2013 were $155,317 in realized gains and $351,396 in unrealized gains, which is recorded on the consolidated statement of operations. For the year ended December 31, 2013, the average notional par amount of total return swap contracts was $13,545,525.
Distributions
We have elected and intend to qualify to be treated, for U.S. federal income tax purposes, as a RIC under subchapter M of the Code. To obtain and maintain RIC tax treatment, we must, among others things, distribute at
71
Table of Contents
least 90% of our net ordinary income and net short-term capital gains in excess of net long-term capital losses, if any, to our stockholders. In order to avoid certain excise taxes imposed on RICs, we must distribute during each calendar year an amount at least equal to the sum of: (i) 98% of our ordinary income for the calendar year, (ii) 98.2% of our capital gains in excess of capital losses for the one-year period generally ending on October 31 of the calendar year (unless an election is made by us to use our taxable year) and (iii) any ordinary income and net capital gains for preceding years that were not distributed during such years and on which we paid no federal income tax.
While we intend to distribute any income and capital gains in the manner necessary to minimize imposition of the 4% U.S. federal excise tax, sufficient amounts of our taxable income and capital gains may not be distributed to avoid entirely the imposition of the tax. In that event, we will be liable for the tax only on the amount by which we do not meet the foregoing distribution requirement.
We currently intend to distribute net capital gains (i.e., net long-term capital gains in excess of net short-term capital losses), if any, at least annually out of the assets legally available for such distributions. However, we may decide in the future to retain such capital gains for investment and elect to treat such gains as deemed distributions to you. If this happens, you will be treated for U.S. federal income tax purposes as if you had received an actual distribution of the capital gains that we retain and reinvested the net after tax proceeds in us. In this situation, you would be eligible to claim a tax credit (or, in certain circumstances, a tax refund) equal to your allocable share of the tax we paid on the capital gains deemed distributed to you. We can offer no assurance that we will continue to achieve results that will permit the payment of any cash distributions and, if we issue senior securities, we may be prohibited from making distributions if doing so causes us to fail to maintain the asset coverage ratios stipulated by the 1940 Act or if distributions are limited by the terms of any of our borrowings.
Subject to our board of directors’ discretion and applicable legal restrictions, we expect to authorize and pay monthly distributions to our stockholders. Any distributions to our stockholders will be declared out of assets legally available for distribution. We expect to continue making monthly distributions unless our results of operations, our general financial condition, general economic conditions, or other factors prohibit us from doing so. From time to time, but not less than quarterly, we will review our accounts to determine whether distributions to our stockholders are appropriate. We have not established limits on the amount of funds we may use from available sources to make distributions. We expect that for a significant time after the commencement of our offering, substantially all of our distributions will result from expense support payments made by SIC Advisors that may be subject to repayment by us within three years. The purpose of this arrangement is to avoid such distributions being characterized as returns of capital for GAAP purposes. We may still have distributions which could be characterized as a return of capital for tax purposes. Such distributions are not based on our investment performance and can only be sustained if we achieve positive investment performance in future periods and/or SIC Advisors continues to make Expense Support Payments under the Expense Support Agreement. Any future reimbursements to SIC Advisors will reduce the distributions that may otherwise be available for distribution to stockholders. There can be no assurance that we will achieve the performance necessary to sustain our distributions or that we will be able to pay distributions at all. SIC Advisors has no obligation to make Expense Support Payments pursuant to the Expense Support Agreement after June 30, 2014, unless the Expense Support Agreement is extended. For the years ended December 31, 2013 and 2012, if Expense Support Payments of $3,939,251 and $1,465,910 were not made by SIC Advisors, 65.3% and 100% of the distributions would have been a return of capital, respectively.
Our distributions may exceed our earnings, which we refer to as a return of capital, especially during the period before we have invested substantially all of the proceeds of our offering. As a result, a portion of the distributions we make may represent a return of capital for tax purposes. Our use of the term “return of capital” merely means distributions in excess of our earnings and as such may constitute a return on your individual investments and does not mean a return on capital. Therefore stockholders are advised that they should be aware of the differences with our use of the term “return of capital” and “return on capital.”
72
Table of Contents
The following table reflects the cash distributions per share that we declared or paid to our stockholders since we commenced operations in April 2012. These distributions represent an annualized yield of 7.84% based on our current offering price of $10.20 per share. The determination of the tax attributes (i.e., paid from ordinary income, paid from net capital gains on the sale of securities, and/or a return of paid-in-capital surplus which is a nontaxable distribution) of distributions is made annually as of the end of our fiscal year based upon our taxable income for the full year and distributions paid for the full year. Stockholders of record as of each respective record date will be entitled to receive the distribution. Below are the details for each respective distribution;
| Record Date |
Payment Date | Amount per share |
||||
| July 13 and 31, 2012 |
August 1, 2012 | $ | 0.03333 | |||
| August 15 and 31, 2012 |
September 4, 2012 | 0.03333 | ||||
| September 14 and 28, 2012 |
October 1, 2012 | 0.03333 | ||||
| October 15 and 30, 2012 |
October 31, 2012 | 0.03333 | ||||
| November 15 and 29, 2012 |
November 30, 2012 | 0.03333 | ||||
| December 14 and 28, 2012 |
December 31, 2012 | 0.03333 | ||||
| January 15 and 31, 2013 |
January 31, 2013 | 0.03333 | ||||
| February 15 and 28, 2013 |
February 28, 2013 | 0.03333 | ||||
| March 15 and 29, 2013 |
March 29, 2013 | 0.03333 | ||||
| April 15 and 30, 2013 |
April 30, 2013 | 0.03333 | ||||
| May 15 and 31, 2013 |
May 31, 2013 | 0.03333 | ||||
| June 14 and 28, 2013 |
June 28, 2013 | 0.03333 | ||||
| July 15 and 31, 2013 |
July 31, 2013 | 0.03333 | ||||
| August 15 and 30, 2013 |
August 30, 2013 | 0.03333 | ||||
| September 13 and 30, 2013 |
September 30, 2013 | 0.03333 | ||||
| October 15 and 31, 2013 |
October 31, 2013 | 0.03333 | ||||
| November 15 and 29, 2013 |
November 29, 2013 | 0.03333 | ||||
| December 13 and 31, 2013 |
December 31, 2013 | 0.03333 | ||||
| January 15 and 31, 2014 |
January 31, 2014 | 0.03333 | ||||
| February 14 and 28, 2014 |
February 28, 2014 | 0.03333 | ||||
| March 14 and 31, 2014 |
March 31, 2014 | 0.03333 | ||||
| April 15 and 30, 2014 |
April 30, 2014 | 0.03333 | ||||
| May 15 and 30, 2014 |
May 30, 2014 | 0.03333 | ||||
| June 13 and 30, 2014 |
June 30, 2014 | 0.03333 | ||||
We have adopted an “opt in” distribution reinvestment plan pursuant to which our common stockholders may elect to have the full amount of any cash distributions reinvested in additional shares of our common stock. As a result, if we declare a cash distribution, stockholders that have “opted in” to our distribution reinvestment plan will have their distribution automatically reinvested in additional shares of our common stock rather than receiving cash dividends. Stockholders who receive distributions in the form of shares of common stock will be subject to the same federal, state and local tax consequences as if they received cash distributions.
Each year a statement on Internal Revenue Service Form 1099-DIV (or such successor form) identifying the source of the distribution (i.e., paid from ordinary income, paid from net capital gain on the sale of securities, or a return of capital) will be mailed to our stockholders. The tax basis of shares must be reduced by the amount of any return of capital distributions, which will result in an increase in the amount of any taxable gain (or a reduction in any deductible loss) on the sale of shares.
Related Party Transactions
On October 19, 2011, SIC Advisors entered into a subscription agreement to purchase 110.80 shares of common stock for cash consideration of $1,000. The consideration represents $9.025 per share.
73
Table of Contents
On April 17, 2012, SIC Advisors purchased 1,108,033.24 shares of our common stock for aggregate gross proceeds of $10,000,000. The consideration represents $9.025 per share.
We have entered into an Investment Advisory Agreement and Expense Support and Reimbursement Agreement with SIC Advisors in which our senior management holds equity interest. Members of our senior management also serve as principals of other investment managers affiliated with SIC Advisors that do and may in the future manage investment funds, accounts or other investment vehicles with investment objectives similar to ours.
We have entered into a dealer manager agreement with SC Distributors, LLC and pay them a dealer manager fee of up to 2.75% of gross proceeds raised in the offering. An affiliated entity of SC Distributors, LLC owns an equity interest in SIC Advisors, which provides the right to receive a fixed percentage of the management fees received by SIC Advisors.
We have entered into a license agreement with SIC Advisors under which SIC Advisors has agreed to grant us a non-exclusive, royalty-free license to use the name “Sierra” for specified purposes in our business. Under this agreement, we will have a right to use the “Sierra” name, subject to certain conditions, for so long as SIC Advisors or one of its affiliates remains our investment advisor. Other than with respect to this limited license, we will have no legal right to the “Sierra” name.
Management Fee
We pay SIC Advisors a fee for its services under the Investment Advisory Agreement. The fee consists of two components: a base management fee and an incentive fee.
The base management fee is calculated at an annual rate of 1.75% of our gross assets and is payable quarterly in arrears. The incentive fee consists of :
| • | An incentive fee on net investment income (“subordinated incentive fee on income”) is calculated and payable quarterly in arrears and is based upon pre-incentive fee net investment income for the immediately preceding quarter. No subordinated incentive fee on income is payable in any calendar quarter in which pre-incentive fee net investment income does not exceed a quarterly return to stockholders of 1.75% per quarter on the Company’s net assets at the end of the immediately preceding fiscal quarter, or the preferred quarterly return. All pre-incentive fee net investment income, if any, that exceeds the quarterly preferred return, but is less than or equal to 2.1875% of net assets at the end of the immediately preceding fiscal quarter in any quarter, will be payable to SIC Advisors. The Company refers to this portion of its subordinated incentive fee on income as the catch up. It is intended to provide an incentive fee of 20% on pre-incentive fee net investment income when pre-incentive fee net investment income exceeds 2.1875% of net assets at the end of the immediately preceding quarter in any quarter. For any quarter in which the Company’s pre-incentive fee net investment income exceeds 2.1875% of net assets at the end of the immediately preceding quarter, the subordinated incentive fee on income shall equal 20% of the amount of pre-incentive fee net investment income, because the preferred return and catch up will have been achieved. |
| • | A capital gains incentive fee will be earned on realized investments and shall be payable in arrears as of the end of each calendar year during which the IAA is in effect. If the IAA is terminated, the fee will become payable as of the effective date of such termination. The capital gains incentive fee is based on our realized capital gains on a cumulative basis from inception, computed net of all realized capital losses and unrealized capital depreciation on a cumulative basis, which we refer to as “net realized capital gains.” The capital gains incentive fee equals’ 20% of net realized capital gains, less the aggregate amount of any previously paid capital gains incentive fee. |
74
Table of Contents
Under the terms of the investment advisory agreement, SIC Advisors bears all organization and offering expenses on our behalf. Upon such time that we have raised $300 million in gross proceeds in connection with the sale of shares of our common stock, SIC Advisors shall no longer be obligated to bear, pay or otherwise be responsible for any ongoing organization and offering expenses on our behalf, and we will be responsible for paying or otherwise incurring all such organization and offering expenses. Pursuant to the terms of the Investment Advisory Agreement, we have agreed to reimburse SIC Advisors for any such organizational and offering expenses incurred by SIC Advisors not to exceed 1.25% of the gross subscriptions raised by us over the course of the offering period, which was initially scheduled to terminate two years from the initial offering date, unless extended. At a meeting held on March 12, 2014, our board of directors approved an extension of our offering for an additional year. Notwithstanding the foregoing, in the event that organizational and offering expenses, together with sales commissions, the dealer manager fee and any discounts paid to members of the Financial Industry Regulatory Authority, exceed 15% of the gross proceeds from the sale of shares of our common stock pursuant to our registration statement or otherwise at the time of the completion of our offering, then SIC Advisors shall be required to pay or, if already paid by us, reimburse us for amounts exceeding such 15% limit.
Critical Accounting Policies
This discussion of our expected operating plans is based upon our expected consolidated financial statements, which will be prepared in accordance with accounting principles generally accepted in the United States, or GAAP. The preparation of these consolidated financial statements will require our management to make estimates and assumptions that affect the reported amounts of assets, liabilities, revenues and expenses. Changes in the economic environment, financial markets and any other parameters used in determining such estimates could cause actual results to differ. In addition to the discussion below, we will describe our critical accounting policies in the notes to our future consolidated financial statements.
Valuation of Investments
The Company applies fair value accounting to all of its financial instruments in accordance with the 1940 Act and ASC Topic 820 — Fair Value Measurements and Disclosures (“ASC 820”). ASC 820 defines fair value, establishes a framework used to measure fair value and requires disclosures for fair value measurements. In accordance with ASC 820, the Company has categorized its financial instruments carried at fair value, based on the priority of the valuation technique, into a three-level fair value hierarchy as identified below and discussed in Note 4.
| • | Level 1 — Quoted prices are available in active markets for identical investments as of the reporting date. Publicly listed equities and publicly listed derivatives will be included in Level 1. In addition, securities sold, but not yet purchased and call options will be included in Level 1. We will not adjust the quoted price for these investments, even in situations where we hold a large position and a sale could reasonably affect the quoted price. |
| • | Level 2 — Pricing inputs are other than quoted prices in active markets, which are either directly or indirectly observable as of the reporting date, and fair value is determined through the use of models or other valuation methodologies. In certain cases, debt and equity securities are valued on the basis of prices from an orderly transaction between market participants provided by reputable dealers or pricing services. In determining the value of a particular investment, pricing services may use certain information with respect to transactions in such investments, quotations from dealers, pricing matrices, market transactions in comparable investments, and various relationships between investments. Investments which are generally expected to be included in this category include corporate bonds and loans, convertible debt indexed to publicly listed securities, and certain over-the-counter derivatives. |
| • | Level 3 — Pricing inputs are unobservable for the investment and include situations where there is little, if any, market activity for the investment. The inputs into the determination of fair value require significant judgment or estimation. Investments that are expected to be included in this category are our private portfolio companies. |
75
Table of Contents
Fair value is a market-based measure considered from the perspective of the market participant who holds the financial instrument rather than an entity specific measure. Therefore, when market assumptions are not readily available, the Company’s own assumptions are set to reflect those that management believes market participants would use in pricing the financial instrument at the measurement date.
Investments for which market quotations are readily available are valued at such market quotations, which are generally obtained from an independent pricing service or multiple broker-dealers or market makers. We weight the use of third-party broker quotes, if any, in determining fair value based on our understanding of the level of actual transactions used by the broker to develop the quote and whether the quote was an indicative price or binding offer. However, debt investments with remaining maturities within 60 days that are not credit impaired are valued at cost plus accreted discount, or minus amortized premium, which approximates fair value. Investments for which market quotations are not readily available are valued at fair value as determined by the Company’s board of directors based upon input from management and third party valuation firms. Because these investments are illiquid and because there may not be any directly comparable companies whose financial instruments have observable market values, these loans are valued using a fundamental valuation methodology, consistent with traditional asset pricing standards, that is objective and consistently applied across all loans and through time.
The Company uses third-party valuation firms to assist the board of directors in the valuation of its portfolio investments. The valuation reports generated by the third-party valuation firms consider the evaluation of financing and sale transactions with third parties, expected cash flows and market based information, including comparable transactions, performance multiples, and movement in yields of debt instruments, among other factors. Based on market data obtained from the third-party valuation firms, the Company uses a combined market yield analysis and an enterprise model of valuation. In applying the market yield analysis, the value of the Company’s loans is determined based upon inputs such as the coupon rate, current market yield, interest rate spreads of similar securities, the stated value of the loan, and the length to maturity. In applying the enterprise model, the Company uses a waterfall analysis which takes into account the specific capital structure of the borrower and the related seniority of the instruments within the borrower’s capital structure into consideration. To estimate the enterprise value of the portfolio company, we weigh some or all of the traditional market valuation methods and factors based on the individual circumstances of the portfolio company in order to estimate the enterprise value. The methodologies for performing investments may be based on, among other things: valuations of comparable public companies, recent sales of private and public comparable companies, discounting the forecasted cash flows of the portfolio company, third party valuations of the portfolio company, considering offers from third parties to buy the company, estimating the value to potential strategic buyers and considering the value of recent investments in the equity securities of the portfolio company. For non-performing investments, we may estimate the liquidation or collateral value of the portfolio company’s assets and liabilities using an expected recovery model. We may estimate the fair value of warrants based on a model such as the Black-Scholes model or simulation models or a combination thereof.
The Company undertakes a multi-step valuation process each quarter when valuing investments for which market quotations are not readily available, as described below:
| • | the Company’s quarterly valuation process begins with each portfolio investment being initially valued by the investment professionals responsible for monitoring the portfolio investment; |
| • | conclusions are then documented and discussed with senior management; and |
| • | an independent valuation firm engaged by the Company’s board of directors prepares an independent valuation report for approximately one third of the portfolio investments each quarter on a rotating quarterly basis on non fiscal year-end quarters, such that each of these investments will be valued by an independent valuation firm at least twice per annum when combined with the fiscal year-end review of all the investments by independent valuation firms, exclusive of TRS underlying portfolio. |
76
Table of Contents
In addition, all of the Company’s investments are subject to the following valuation process:
| • | management reviews preliminary valuations and their own independent assessment; |
| • | the audit committee of the Company’s board of directors reviews the preliminary valuations of senior management and independent valuation firms; and |
| • | the Company’s board of directors discusses valuations and determines the fair value of each investment in the Company’s portfolio in good faith based on the input of SIC Advisors, the respective independent valuation firms and the audit committee. |
Due to the inherent uncertainty of determining the fair value of investments that do not have a readily available market value, the fair value of the Company’s investments may differ significantly from the values that would have been used had a readily available market value existed for such investments, and the differences could be material.
We will value the TRS in accordance with the TRS Agreement. Pursuant to the TRS Agreement, the value of the TRS will be based on the increase or decrease in the value of the assets underlying the TRS, together with accrued interest income, interest expense and certain other expenses incurred under the TRS. The assets underlying the TRS will be valued by Citibank. Citibank will base its valuation on the indicative bid prices provided by an independent third-party pricing service. Bid prices reflect the highest price that market participants may be willing to pay. These valuations will be sent to us for review and testing. Our board of directors will review and approve the value of the TRS, as well as the value of the assets underlying the TRS, on a quarterly basis as part of their quarterly determination of net asset value. To the extent our board of directors has any questions or concerns regarding the valuation of the assets underlying the TRS, such valuation will be discussed or challenged pursuant to the terms of the TRS. For additional disclosures on the TRS, see “— Financial Condition, Liquidity and Capital Resources — Total Return Swap.”
Revenue Recognition
We record interest income on an accrual basis to the extent that we expect to collect such amounts. For loans and debt securities with contractual PIK interest, which represents contractual interest accrued and added to the principal balance, we generally will not accrue PIK interest for accounting purposes if the portfolio company valuation indicates that such PIK interest is not collectible. We do not accrue as a receivable interest on loans and debt securities or accounting purposes if we have reason to doubt our ability to collect such interest. Original issue discounts, market discounts or premiums are accreted or amortized using the effective interest method as interest income. We record prepayment premiums on loans and debt securities as interest income. Dividend income, if any, is recognized on an accrual basis to the extent that we expect to collect such amount.
Net Realized Gains or Losses and Net Change in Unrealized Appreciation or Depreciation
We measure net realized gains or losses by the difference between the net proceeds from the repayment or sale and the amortized cost basis of the investment, without regard to unrealized appreciation or depreciation previously recognized, but considering unamortized upfront fees and prepayment penalties. Net change in unrealized appreciation or depreciation reflects the change in portfolio investment values during the reporting period, including any reversal of previously recorded unrealized appreciation or depreciation, when gains or losses are realized.
Payment-in-Kind Interest
We have investments in our portfolio that contain a PIK interest provision. Any PIK interest is added to the principal balance of such investments and is recorded as income, if the portfolio company valuation indicates that such PIK interest is collectible. In order to maintain our status as a RIC, substantially all of this income must be paid out to stockholders in the form of dividends, even if we have not collected any cash.
77
Table of Contents
Organization and Offering Expenses
Organization and offering expenses are expensed by SIC Advisors, and we may be required to reimburse SIC Advisors for such expenses subject to the terms of the Investment Advisory Agreement. Until such time that we raise $300 million in gross proceeds in connection with the sale of shares of our common stock, continuous offering expenses will be expensed by SIC Advisors. After such time, continuous offering expenses, excluding sales load, will be capitalized on our balance sheet as deferred offering expenses and expensed to our statement of operations in the period incurred.
Federal Income Taxes
We have elected to be treated for federal income tax purposes, and intend to qualify annually thereafter, as a RIC under Subchapter M of the Code. As a RIC, we generally will not have to pay corporate-level federal income taxes on any ordinary income or capital gains that we distribute to our stockholders from our tax earnings and profits. To obtain and maintain our RIC tax treatment, we must, among other things, meet specified source-of-income and asset diversification requirements and distribute annually at least 90% of our ordinary income and realized net short-term capital gains in excess of realized net long-term capital losses, if any.
Recent Developments
On December 4, 2013, we entered into the Revolving Credit Facility led by ING Capital LLC. The Revolving Credit Facility is a three-year senior secured syndicated revolving credit facility with a one-year term out period that matures on December 4, 2017 and is secured by substantially all of our assets, subject to certain exclusions as further set forth in a Guarantee, Pledge and Security Agreement. The Revolving Credit Facility also includes usual and customary representations, covenants and events of default for senior secured revolving credit facilities of this nature.
On March 7, 2014, Mr. Fentress resigned from his position as a principal SIC Advisors, which resignation was accepted and effective as of the same date. As a result, effective as of March 7, 2014, Mr. Fentress will no longer be a member of SIC Advisors’ investment committee. The investment committee is now comprised of Seth Taube, Robert Comizio, Brook Taube and Jeff Tonkel.
Mr. Fentress’ decision to resign from his position as a principal of the Adviser was not due to any dispute or disagreement with the Company or the Adviser, or on any matter relating to the Company’s or the Adviser’s operations, policies or practices.
| Item 7A: | Quantitative and Qualitative Disclosures About Market Risk |
We are subject to financial market risks, including changes in interest rates. Pursuant to the PBSA, we post a specified amount of collateral, in accordance with the margin requirements described in the agreement, generally between 20% and 50% of the market value of each secured bond investment as determined by Barclays, in exchange for Barclays agreeing to provide financing for some portion of our secured bond investments. In addition, under the terms of the TRS between Arbor and Citibank, Arbor will pay fees to Citibank at a floating rate based on LIBOR in exchange for the right to receive the economic benefit of a portfolio of assets having a maximum notional amount of $100,000,000. We expect any future credit facilities, total return swap agreements or other financing arrangements that we or any of our subsidiaries may enter into will also be based on a floating interest rate. As a result, we are subject to risks relating to changes in market interest rates. In periods of rising interest rates, when we or our subsidiaries have debt outstanding or swap agreements in effect, our cost of funds would increase, which could reduce our net investment income, especially to the extent we hold fixed rate investments.
In addition, any investments we make that are denominated in a foreign currency will be subject to risks associated with changes in currency exchange rates. These risks include the possibility of significant fluctuations
78
Table of Contents
in the foreign currency markets, the imposition or modification of foreign exchange controls and potential illiquidity in the secondary market. These risks will vary depending upon the currency or currencies involved.
We may hedge against interest rate and currency exchange rate fluctuations by using standard hedging instruments such as futures, options and forward contracts subject to the requirements of the 1940 Act. While hedging activities may insulate us against adverse changes in interest rates, they may also limit our ability to participate in benefits of lower interest rates with respect to our portfolio of investments with fixed interest rates.
As of December 31, 2013 and 2012, 56.7% and 13.3% of our income-bearing investment portfolio bore interest based on floating rates, respectively. The composition of our floating rate debt investments by cash interest rate floor as of December 31, 2013 was as follows:
| December 31, 2013 | December 31, 2012 | |||||||||||||||
| Fair Value | % of Floating Rate Portfolio |
Fair Value | % of Floating Rate Portfolio |
|||||||||||||
| Under 1% |
$ | — | 0.0 | % | $ | — | 0.0 | % | ||||||||
| 1% to under 2% |
77,112,571 | 98.8 | 2,928,247 | 59.9 | ||||||||||||
| 2% to under 3% |
952,002 | 1.2 | 1,962,630 | 40.1 | ||||||||||||
|
|
|
|
|
|
|
|
|
|||||||||
| Total |
$ | 78,064,573 | 100.0 | % | $ | 4,890,877 | 100.0 | % | ||||||||
|
|
|
|
|
|
|
|
|
|||||||||
Based on our consolidated Statement of Assets and Liabilities as of December 31, 2013, the following table shows the approximate increase (decrease) in components of net assets resulting from operations of hypothetical base rate changes in interest rates, assuming no changes in our investment and capital structure:
| Basis point increase |
Interest Income |
Interest Expense |
Net Increase (Decrease) |
|||||||||
| 100 |
$ | 780,646 | $ | (160,000 | ) | $ | 620,646 | |||||
| 200 |
1,561,291 | (320,000 | ) | 1,241,291 | ||||||||
| 300 |
2,341,937 | (480,000 | ) | 1,861,937 | ||||||||
| 400 |
3,122,583 | (640,000 | ) | 2,482,583 | ||||||||
| 500 |
3,903,229 | (800,000 | ) | 3,103,229 | ||||||||
Based on our Statement of Assets and Liabilities as of December 31, 2012, the following table shows the approximate increase (decrease) in components of net assets resulting from operations of hypothetical base rate changes in interest rates, assuming no changes in our investment and capital structure:
| Basis point increase |
Interest Income |
Interest Expense |
Net Increase (Decrease) |
|||||||||
| 100 |
$ | 367,634 | $ | (173,458 | ) | $ | 194,176 | |||||
| 200 |
735,268 | (346,916 | ) | 388,352 | ||||||||
| 300 |
1,102,901 | (520,374 | ) | 582,527 | ||||||||
| 400 |
1,470,535 | (693,832 | ) | 776,703 | ||||||||
| 500 |
1,838,169 | (867,290 | ) | 970,879 | ||||||||
| Item 8: | Financial Statements and Supplementary Data. |
79
Table of Contents
INDEX TO FINANCIAL STATEMENTS
Table of Contents
Management’s Report on Internal Control Over Financial Reporting
Our management is responsible for establishing and maintaining adequate internal control over financial reporting. In connection with the preparation of our annual financial statements, management has conducted an assessment of the effectiveness of our internal control over financial reporting based on the framework set forth in Internal Control—Integrated Framework issued by the Committee of Sponsoring Organizations of the Treadway Commission in 1992 (“COSO”). Management’s assessment included an evaluation of the design of our internal control over financial reporting and testing of the operational effectiveness of those controls. Based on this evaluation, we have concluded that, as of December 31, 2013, our internal control over financial reporting was effective to provide reasonable assurance regarding the reliability of financial reporting and the preparation of financial statements for external purposes in accordance with U.S. generally accepted accounting principles.
F-1
Table of Contents
Report of Independent Registered Public Accounting Firm
To the Shareholders and Board of Directors of Sierra Income Corporation
We have audited the accompanying consolidated statements of assets and liabilities of Sierra Income Corporation (the “Company”), including the consolidated schedule of investments, as of December 31, 2013 and 2012, and the related consolidated statements of operations, changes in net assets, and cash flows for the two years in the period ended December 31, 2013, and for the period from June 13, 2011 (date of inception) to December 31, 2011. These financial statements are the responsibility of the Company’s management. Our responsibility is to express an opinion on these financial statements based on our audits.
We conducted our audits in accordance with the standards of the Public Company Accounting Oversight Board (United States). Those standards require that we plan and perform the audit to obtain reasonable assurance about whether the financial statements are free of material misstatement. Our audits included consideration of internal control over financial reporting as a basis for designing audit procedures that are appropriate in the circumstances, but not for the purpose of expressing an opinion on the effectiveness of the Company’s internal control over financial reporting. Accordingly, we express no such opinion. An audit includes examining, on a test basis, evidence supporting the amounts and disclosures in the financial statements, assessing the accounting principles used and significant estimates made by management, and evaluating the overall financial statement presentation. Our procedures included confirmation of securities owned as of December 31, 2013 by correspondence with the custodian, counterparties and management of the portfolio companies or by other appropriate audit procedures. We believe that our audits provide a reasonable basis for our opinion.
In our opinion, the financial statements referred to above present fairly, in all material respects, the consolidated financial position of Sierra Income Corporation at December 31, 2013 and 2012, and the consolidated results of its operations, changes in its net assets, and its cash flows, for the two years in the period ended December 31, 2013, and for the period from June 13, 2011 (date of inception) to December 31, 2011, in conformity with U.S. generally accepted accounting principles.
/s/ Ernst & Young LLP
New York, New York
March 13, 2014
F-2
Table of Contents
Part I. Financial Information
Item 1. Financial Statements
Sierra Income Corporation
Consolidated Statements of Assets and Liabilities
| As of | ||||||||
| December 31, 2013 | December 31, 2012 | |||||||
| ASSETS |
||||||||
| Non-controlled/non-affiliated investments, at fair value (amortized cost of $137,332,276 and $30,599,349, respectively) |
$ | 137,801,537 | $ | 30,580,211 | ||||
| Cash and cash equivalents |
34,939,948 | 6,651,767 | ||||||
| Cash collateral on total return swap (Note 5) |
6,706,159 | — | ||||||
| Due from affiliate (Note 7) |
2,592,989 | 814,814 | ||||||
| Interest receivable |
1,989,128 | 784,637 | ||||||
| Deferred financing costs |
1,150,139 | — | ||||||
| Prepaid expenses and other assets |
23,975 | 8,949 | ||||||
| Unrealized appreciation on total return swap (Note 5) |
351,396 | — | ||||||
| Unsettled trades receivable |
496,250 | — | ||||||
| Receivable due on total return swap (Note 5) |
155,317 | — | ||||||
|
|
|
|
|
|||||
| Total assets |
$ | 186,206,838 | $ | 38,840,378 | ||||
|
|
|
|
|
|||||
| LIABILITIES |
||||||||
| Revolving credit facility payable |
$ | 16,000,000 | $ | — | ||||
| Due to prime broker |
— | 17,345,794 | ||||||
| Unsettled trades payable |
15,492,500 | — | ||||||
| Management fee |
814,655 | 171,317 | ||||||
| Accounts payable and accrued expenses |
495,893 | 464,361 | ||||||
| Incentive fee |
182,989 | 628 | ||||||
| Administrator fees |
152,162 | 128,459 | ||||||
| Due to affiliate |
33,311 | 55,927 | ||||||
| Interest payable |
33,055 | 10,829 | ||||||
| Directors fees |
— | 40,081 | ||||||
|
|
|
|
|
|||||
| Total liabilities |
$ | 33,204,565 | $ | 18,217,396 | ||||
|
|
|
|
|
|||||
| Commitments and contingencies (Note 11) |
||||||||
| NET ASSETS |
||||||||
| Common shares, par value $.001 per share, 250,000,000 common shares authorized, 16,663,500 and 2,300,573 common shares issued and outstanding, respectively |
$ | 16,664 | $ | 2,301 | ||||
| Capital in excess of par value |
152,552,912 | 20,436,709 | ||||||
| Accumulated undistributed/(distributions in excess of) net realized gain/(loss) from investments and total return swap |
(138,783 | ) | — | |||||
| Accumulated undistributed/(distributions in excess of) net investment income |
(249,177 | ) | 203,132 | |||||
| Net unrealized appreciation/(depreciation) on investments and total return swap |
820,657 | (19,160 | ) | |||||
|
|
|
|
|
|||||
| Total net assets |
153,002,273 | 20,622,982 | ||||||
|
|
|
|
|
|||||
| Total liabilities and net assets |
$ | 186,206,838 | $ | 38,840,378 | ||||
|
|
|
|
|
|||||
| NET ASSET VALUE PER SHARE |
$ | 9.18 | $ | 8.96 | ||||
|
|
|
|
|
|||||
See accompanying notes to the consolidated financial statements.
F-3
Table of Contents
Sierra Income Corporation
Consolidated Statements of Operations
| For the year ended December 31, | For the period from June 13, 2011 (inception) through December 31, 2011 |
|||||||||||
| 2013 | 2012 | |||||||||||
| INVESTMENT INCOME |
||||||||||||
| Interest from non-controlled/non-affiliated investments |
$ | 7,386,700 | $ | 1,228,076 | $ | — | ||||||
| Other fee income |
619,861 | 6,750 | — | |||||||||
| Interest from cash and cash equivalents |
441 | 290 | — | |||||||||
|
|
|
|
|
|
|
|||||||
| Total investment income |
8,007,002 | 1,235,116 | — | |||||||||
|
|
|
|
|
|
|
|||||||
| EXPENSES |
||||||||||||
| Base management fee |
1,906,386 | 319,530 | — | |||||||||
| Organizational and offering costs reimbursed to SIC Advisors (Note 7) |
1,761,943 | 328,132 | — | |||||||||
| Professional fees |
956,114 | 630,021 | — | |||||||||
| General and administrative expenses |
701,778 | 362,616 | — | |||||||||
| Administrator expenses |
592,585 | 375,677 | — | |||||||||
| Incentive fee |
182,989 | 628 | — | |||||||||
| Interest and financing expenses |
215,059 | 47,529 | — | |||||||||
| Directors fees |
154,084 | 146,861 | — | |||||||||
| Insurance expenses |
131,770 | — | — | |||||||||
|
|
|
|
|
|
|
|||||||
| Total gross expenses |
6,602,708 | 2,210,994 | — | |||||||||
| Expense support reimbursement (Note 7) |
(3,939,251 | ) | (1,465,910 | ) | — | |||||||
|
|
|
|
|
|
|
|||||||
| Net expenses |
2,663,457 | 745,084 | — | |||||||||
|
|
|
|
|
|
|
|||||||
| NET INVESTMENT INCOME |
5,343,545 | 490,032 | — | |||||||||
|
|
|
|
|
|
|
|||||||
| Net realized gain/(loss) from investments |
(57,893 | ) | 22,298 | — | ||||||||
| Net realized gain on total return swap (Note 5) |
155,317 | — | — | |||||||||
| Net change in unrealized appreciation/(depreciation) on investments |
488,421 | (19,160 | ) | — | ||||||||
| Net change in unrealized appreciation/(depreciation) on total return swap (Note 5) |
351,396 | — | — | |||||||||
|
|
|
|
|
|
|
|||||||
| Net gain/(loss) on investments and total return swap |
937,241 | 3,138 | — | |||||||||
|
|
|
|
|
|
|
|||||||
| NET INCREASE IN NET ASSETS RESULTING FROM OPERATIONS |
$ | 6,280,786 | $ | 493,170 | $ | — | ||||||
|
|
|
|
|
|
|
|||||||
| WEIGHTED AVERAGE - BASIC AND DILUTED EARNINGS PER COMMON SHARE |
$ | 0.85 | $ | 0.48 | $ | — | ||||||
| WEIGHTED AVERAGE - BASIC AND DILUTED NET INVESTMENT INCOME PER COMMON SHARE |
$ | 0.72 | $ | 0.48 | $ | — | ||||||
| WEIGHTED AVERAGE COMMON STOCK OUTSTANDING - BASIC AND DILUTED (Note 10) |
7,426,660 | 1,031,621 | 111 | |||||||||
See accompanying notes to the consolidated financial statements.
F-4
Table of Contents
Sierra Income Corporation
Consolidated Statements of Changes in Net Assets
| For the year ended December 31, | For the period from June 13, 2011 (inception) through December 31, 2011 |
|||||||||||
| 2013 | 2012 | |||||||||||
| INCREASE FROM OPERATIONS |
||||||||||||
| Net investment income |
$ | 5,343,545 | $ | 490,032 | $ | — | ||||||
| Net realized gain/(loss) on investments |
(57,893 | ) | 22,298 | — | ||||||||
| Net realized gain on total return swap (Note 5) |
155,317 | — | — | |||||||||
| Net change in unrealized appreciation/(depreciation) on investments |
488,421 | (19,160 | ) | — | ||||||||
| Net change in unrealized appreciation/(depreciation) on total return swap (Note 5) |
351,396 | — | — | |||||||||
|
|
|
|
|
|
|
|||||||
| Net increase in net assets resulting from operations |
6,280,786 | 493,170 | — | |||||||||
|
|
|
|
|
|
|
|||||||
| SHAREHOLDER DISTRIBUTIONS |
||||||||||||
| Distributions from net realized gains |
— | (22,298 | ) | — | ||||||||
| Distributions from net investment income (Note 2) |
(6,032,061 | ) | (615,032 | ) | — | |||||||
|
|
|
|
|
|
|
|||||||
| Net decrease in net assets from shareholder distributions |
(6,032,061 | ) | (637,330 | ) | — | |||||||
|
|
|
|
|
|
|
|||||||
| COMMON SHARE TRANSACTIONS |
||||||||||||
| Issuance of common shares, net of underwriting costs |
130,100,012 | 20,766,142 | 1,000 | |||||||||
| Issuance of common shares pursuant to distribution reinvestment plan |
2,117,061 | — | — | |||||||||
| Repurchase of common shares |
(86,507 | ) | — | — | ||||||||
|
|
|
|
|
|
|
|||||||
| Net increase in net assets resulting from common share transactions |
132,130,566 | 20,766,142 | 1,000 | |||||||||
|
|
|
|
|
|
|
|||||||
| Total increase in net assets |
132,379,291 | 20,621,982 | 1,000 | |||||||||
| Net assets at beginning of year/period |
20,622,982 | 1,000 | — | |||||||||
| Net assets at end of year/period (including accumulated undistributed/(distributions in excess of) net investment income of $(249,177) and $203,132, respectively) |
$ | 153,002,273 | $ | 20,622,982 | $ | 1,000 | ||||||
|
|
|
|
|
|
|
|||||||
| Net asset value per common share |
$ | 9.18 | $ | 8.96 | $ | 9.03 | ||||||
| Common shares outstanding, beginning of year/period |
2,300,573 | — | — | |||||||||
| Issuance of common shares |
14,141,784 | 2,300,573 | 111 | |||||||||
| Issuance of common shares pursuant to distribution reinvestment plan |
230,611 | — | — | |||||||||
| Repurchase of common shares |
(9,468 | ) | — | — | ||||||||
|
|
|
|
|
|
|
|||||||
| Common shares outstanding, end of year/period |
16,663,500 | 2,300,573 | 111 | |||||||||
|
|
|
|
|
|
|
|||||||
| DIVIDENDS DECLARED PER COMMON SHARE |
$ | 0.80 | $ | 0.40 | $ | — | ||||||
See accompanying notes to the consolidated financial statements.
F-5
Table of Contents
Sierra Income Corporation
Consolidated Statements of Cash Flows
| For the year ended December 31, | For the period from June 13, 2011 (inception) through December 31, 2011 |
|||||||||||
| 2013 | 2012 | |||||||||||
| Cash flows from operating activities |
||||||||||||
| NET INCREASE IN NET ASSETS RESULTING FROM OPERATIONS |
$ | 6,280,786 | $ | 493,170 | $ | — | ||||||
| ADJUSTMENT TO RECONCILE NET INCREASE/(DECREASE) IN NET ASSETS FROM OPERATIONS TO NET CASH PROVIDED BY/(USED IN) OPERATING ACTIVITIES |
||||||||||||
| Paid-in-kind interest income |
(580 | ) | (3,911 | ) | — | |||||||
| Net amortization of premium on investments |
35,451 | 52,416 | — | |||||||||
| Net realized (gain)/loss on investments |
57,893 | (22,298 | ) | — | ||||||||
| Net change in unrealized appreciation/(depreciation) on investments |
(488,421 | ) | 19,160 | — | ||||||||
| Net change in unrealized appreciation/(depreciation) on total return swap (Note 5) |
(351,396 | ) | — | — | ||||||||
| Purchases of investments |
(145,799,374 | ) | (39,612,584 | ) | — | |||||||
| Proceeds from sale investments and principal repayments |
38,973,705 | 8,987,006 | — | |||||||||
| (Increase)/decrease in operating assets: |
||||||||||||
| Interest receivable |
(1,204,491 | ) | (784,637 | ) | — | |||||||
| Unsettled trades receivable |
(496,250 | ) | — | — | ||||||||
| Prepaid expenses and other assets |
(15,026 | ) | (8,949 | ) | — | |||||||
| Deferred financing costs |
(1,150,139 | ) | — | — | ||||||||
| Due from affiliate |
(1,778,175 | ) | (814,814 | ) | — | |||||||
| Cash collateral on total return swap (Note 5) |
(6,706,159 | ) | — | — | ||||||||
| Decrease (increase) in receivable due on total return swap (Note 5) |
(155,317 | ) | — | — | ||||||||
| Increase/(decrease) in operating liabilities: |
||||||||||||
| Unsettled trades payable |
15,492,500 | — | — | |||||||||
| Management fee |
643,338 | 171,317 | — | |||||||||
| Interest payable |
22,226 | 10,829 | — | |||||||||
| Accounts payable and accrued expenses |
31,532 | 464,361 | — | |||||||||
| Administrator fees |
23,703 | 128,459 | — | |||||||||
| Due to affiliate |
(22,616 | ) | 55,927 | — | ||||||||
| Incentive fee |
182,361 | 628 | — | |||||||||
| Directors fee |
(40,081 | ) | 40,081 | — | ||||||||
|
|
|
|
|
|
|
|||||||
| NET CASH PROVIDED BY/(USED IN) OPERATING ACTIVITIES |
(96,464,530 | ) | (30,823,839 | ) | — | |||||||
|
|
|
|
|
|
|
|||||||
| Cash flows from financing activities |
||||||||||||
| Borrowings under revolving credit facility |
16,000,000 | — | — | |||||||||
| Borrowings under prime broker margin account |
(17,345,794 | ) | 17,345,794 | — | ||||||||
| Proceeds from issuance of common stock, net of underwriting costs |
130,100,012 | 20,685,944 | 1,000 | |||||||||
| Payment of cash dividends |
(3,915,000 | ) | (557,132 | ) | — | |||||||
| Repurchase of common shares |
(86,507 | ) | — | — | ||||||||
|
|
|
|
|
|
|
|||||||
| NET CASH PROVIDED BY FINANCING ACTIVITIES |
124,752,711 | 37,474,606 | 1,000 | |||||||||
|
|
|
|
|
|
|
|||||||
| TOTAL INCREASE/(DECREASE) IN CASH AND CASH EQUIVALENTS |
28,288,181 | 6,650,767 | 1,000 | |||||||||
| CASH AND CASH EQUIVALENTS AT BEGINNING OF YEAR/PERIOD |
6,651,767 | 1,000 | — | |||||||||
|
|
|
|
|
|
|
|||||||
| CASH AND CASH EQUIVALENTS AT END OF YEAR/PERIOD |
$ | 34,939,948 | $ | 6,651,767 | $ | 1,000 | ||||||
|
|
|
|
|
|
|
|||||||
| Supplemental Information |
||||||||||||
| Cash paid during the year/period for interest |
$ | 157,279 | $ | 47,529 | $ | — | ||||||
| Supplemental non-cash information |
||||||||||||
| Paid-in-kind interest income |
$ | 580 | $ | 3,911 | $ | — | ||||||
| Net amortization of premium on investments |
$ | (35,451 | ) | $ | 52,416 | $ | — | |||||
| Issuance of common shares in connection with distribution reinvestment plan |
$ | 2,117,061 | $ | 80,198 | $ | — | ||||||
See accompanying notes to the consolidated financial statements.
F-6
Table of Contents
Sierra Income Corporation
Consolidated Schedule of Investments
As of December 31, 2013
| Company (1) |
Industry |
Type of Investment |
Maturity | Par Amount |
Cost | Fair Value |
% of Net Assets (2) |
|||||||||||||||||
| Non-controlled/non-affiliated investments – 90.1% |
||||||||||||||||||||||||
| Access Media 3, Inc. |
Telecommunications |
Senior Secured First Lien Term Loans 10.00%(3) | 10/22/2018 | $ | 7,000,000 | $ | 7,000,000 | $ | 7,000,000 | 4.6 | % | |||||||||||||
|
|
|
|
|
|
|
|||||||||||||||||||
| 7,000,000 | 7,000,000 | 7,000,000 | ||||||||||||||||||||||
| Aderant North America, Inc. |
Electronics |
Senior Secured Second Lien Term Loans LIBOR + 8.750%, 1.250% Floor(3) | 6/20/2019 | 450,000 | 450,000 | 453,861 | 0.3 | % | ||||||||||||||||
|
|
|
|
|
|
|
|||||||||||||||||||
| 450,000 | 450,000 | 453,861 | ||||||||||||||||||||||
| Alcatel - Lucent USA, Inc. |
Telecommunications |
Senior Secured First Lien Term Loans LIBOR + 4.750%, 1.000% Floor | 1/30/2019 | 990,000 | 985,662 | 993,712 | 0.6 | % | ||||||||||||||||
|
|
|
|
|
|
|
|||||||||||||||||||
| 990,000 | 985,662 | 993,712 | ||||||||||||||||||||||
| ALG USA Holdings, Inc. |
Leisure, Amusement, Motion Pictures, and Entertainment |
Senior Secured Second Lien Term Loans LIBOR + 9.000%, 1.250% Floor | 2/28/2020 | 2,000,000 | 1,963,092 | 2,007,080 | 1.3 | % | ||||||||||||||||
|
|
|
|
|
|
|
|||||||||||||||||||
| 2,000,000 | 1,963,092 | 2,007,080 | ||||||||||||||||||||||
| Allen Edmonds Corp. |
Retail Stores |
Senior Secured Second Lien Term Loans LIBOR + 9.00%, 1.00% Floor(3) | 5/27/2019 | 7,000,000 | 7,000,000 | 7,000,000 | 4.6 | % | ||||||||||||||||
|
|
|
|
|
|
|
|||||||||||||||||||
| 7,000,000 | 7,000,000 | 7,000,000 | ||||||||||||||||||||||
| American Apparel, Inc. |
Retail Stores |
Senior Secured First Lien Notes 13.000%(3)(4) | 4/15/2020 | 2,500,000 | 2,459,496 | 2,300,000 | 1.5 | % | ||||||||||||||||
|
|
|
|
|
|
|
|||||||||||||||||||
| 2,500,000 | 2,459,496 | 2,300,000 | ||||||||||||||||||||||
| Ascensus, Inc. |
Finance | Senior Secured Second Lien Term Loans LIBOR + 8.00%, 1.00% Floor | 12/2/2020 | 4,000,000 | 3,940,522 | 3,940,522 | 2.6 | % | ||||||||||||||||
|
|
|
|
|
|
|
|||||||||||||||||||
| 4,000,000 | 3,940,522 | 3,940,522 | ||||||||||||||||||||||
| Associated Asphalt Partners LLC |
Chemicals, Plastics, and Rubber |
Senior Secured First Lien Notes 8.500%(4) | 2/15/2018 | 5,000,000 | 5,036,563 | 5,130,000 | 3.3 | % | ||||||||||||||||
|
|
|
|
|
|
|
|||||||||||||||||||
| 5,000,000 | 5,036,563 | 5,130,000 | ||||||||||||||||||||||
| Bennu Oil & Gas, LLC |
Oil and Gas |
Senior Secured Second Lien Term Loans LIBOR + 9.00%, 1.25% Floor | 11/1/2018 | 1,122,857 | 1,113,148 | 1,113,148 | 0.7 | % | ||||||||||||||||
|
|
|
|
|
|
|
|||||||||||||||||||
| 1,122,857 | 1,113,148 | 1,113,148 | ||||||||||||||||||||||
| Bon-Ton Stores, Inc. (5) |
Retail Stores |
Senior Secured Second Lien Notes 10.625% | 7/15/2017 | 1,698,000 | 1,622,374 | 1,695,844 | 1.1 | % | ||||||||||||||||
|
|
|
|
|
|
|
|||||||||||||||||||
| 1,698,000 | 1,622,374 | 1,695,844 | ||||||||||||||||||||||
| Caesars Entertainment Operating Co., Inc. |
Hotels, Motels, Inns, and Gaming |
Senior Secured First Lien Notes 11.250%(5) | 6/1/2017 | 3,000,000 | 3,153,543 | 3,056,250 | 2.0 | % | ||||||||||||||||
|
|
|
|
|
|
|
|||||||||||||||||||
| 3,000,000 | 3,153,543 | 3,056,250 | ||||||||||||||||||||||
F-7
Table of Contents
| Company(1) |
Industry |
Type of Investment |
Maturity | Par Amount |
Cost | Fair Value |
% of Net Assets(2) |
|||||||||||||||||
| Charming Charlie, Inc. |
Retail Stores |
Senior Secured First Lien Term Loans LIBOR + 8.00%, 1.00% Floor | 1/9/2019 | 6,000,000 | 6,000,000 | 6,000,000 | 3.9 | % | ||||||||||||||||
|
|
|
|
|
|
|
|||||||||||||||||||
| 6,000,000 | 6,000,000 | 6,000,000 | ||||||||||||||||||||||
| Checkers Drive-In Restaurants, Inc. |
Beverage, Food, and Tobacco |
Senior Secured First Lien Notes 11.000%(4) | 12/1/2017 | 1,500,000 | 1,504,143 | 1,614,675 | 1.1 | % | ||||||||||||||||
|
|
|
|
|
|
|
|||||||||||||||||||
| 1,500,000 | 1,504,143 | 1,614,675 | ||||||||||||||||||||||
| Cornerstone Chemical Company |
Chemicals, Plastics, and Rubber |
Senior Secured First Lien Notes 9.375% | 3/15/2018 | 2,000,000 | 2,000,000 | 2,080,000 | 1.4 | % | ||||||||||||||||
| Senior Secured First Lien Notes 9.375%(4) | 3/15/2018 | 2,500,000 | 2,611,122 | 2,600,000 | 1.7 | % | ||||||||||||||||||
|
|
|
|
|
|
|
|||||||||||||||||||
| 4,500,000 | 4,611,122 | 4,680,000 | ||||||||||||||||||||||
| Deltek, Inc. |
Electronics | Senior Secured Second Lien Term Loans LIBOR + 8.750%, 1.250% Floor | 10/10/2019 | $ | 3,000,000 | $ | 2,978,006 | $ | 3,034,560 | 2.0 | % | |||||||||||||
|
|
|
|
|
|
|
|||||||||||||||||||
| 3,000,000 | 2,978,006 | 3,034,560 | ||||||||||||||||||||||
| Dispensing Dynamics International, Inc. |
Personal and Nondurable Consumer Products (Manufacturing Only) |
Senior Secured First Lien Notes 12.500%(4) | 1/1/2018 | 2,200,000 | 2,179,668 | 2,223,342 | 1.4 | % | ||||||||||||||||
|
|
|
|
|
|
|
|||||||||||||||||||
| 2,200,000 | 2,179,668 | 2,223,342 | ||||||||||||||||||||||
| Drew Marine Partners LP |
Cargo Transport |
Senior Secured Second Lien Term Loans LIBOR + 7.00%, 1.00% Floor | 5/19/2021 | 3,000,000 | 2,992,638 | 2,992,638 | 2.0 | % | ||||||||||||||||
|
|
|
|
|
|
|
|||||||||||||||||||
| 3,000,000 | 2,992,638 | 2,992,638 | ||||||||||||||||||||||
| EarthLink, Inc. |
Telecommunications | Senior Secured First Lien Notes 7.375%(4)(5) | 6/1/2020 | 2,450,000 | 2,437,636 | 2,453,062 | 1.6 | % | ||||||||||||||||
|
|
|
|
|
|
|
|||||||||||||||||||
| 2,450,000 | 2,437,636 | 2,453,062 | ||||||||||||||||||||||
| Erickson Air-Crane, Inc. (5) |
Aerospace and Defense |
Senior Secured Second Lien Notes 8.250%(4) | 5/1/2020 | 1,953,000 | 1,966,979 | 2,016,472 | 1.3 | % | ||||||||||||||||
|
|
|
|
|
|
|
|||||||||||||||||||
| 1,953,000 | 1,966,979 | 2,016,472 | ||||||||||||||||||||||
| Gastar Exploration USA, Inc. (5) |
Oil and Gas |
Senior Secured First Lien Notes 8.625%(4) | 5/15/2018 | 3,000,000 | 3,000,000 | 2,958,750 | 1.9 | % | ||||||||||||||||
|
|
|
|
|
|
|
|||||||||||||||||||
| 3,000,000 | 3,000,000 | 2,958,750 | ||||||||||||||||||||||
| Gibson Brands, Inc. |
Personal and Nondurable Consumer Products (Manufacturing Only) |
Senior Secured First Lien Notes 8.875%(4) | 8/1/2018 | 3,000,000 | 3,056,289 | 3,069,270 | 2.0 | % | ||||||||||||||||
|
|
|
|
|
|
|
|||||||||||||||||||
| 3,000,000 | 3,056,289 | 3,069,270 | ||||||||||||||||||||||
| Great Atlantic & Pacific Tea Company |
Grocery |
Senior Secured First Lien Term Loans LIBOR + 9.000%, 2.000% Floor(3) | 3/13/2017 | 932,467 | 948,787 | 952,002 | 0.6 | % | ||||||||||||||||
|
|
|
|
|
|
|
|||||||||||||||||||
| 932,467 | 948,787 | 952,002 | ||||||||||||||||||||||
| Green Field Energy Services, Inc. |
Oil and Gas |
Senior Secured First Lien Notes 13.000%(3)(4) | 11/15/2016 | 766,616 | 755,914 | 322,744 | 0.2 | % | ||||||||||||||||
|
|
|
|
|
|
|
|||||||||||||||||||
| 766,616 | 755,914 | 322,744 | ||||||||||||||||||||||
F-8
Table of Contents
| Company(1) |
Industry |
Type of Investment |
Maturity | Par Amount |
Cost | Fair Value |
% of Net Assets(2) |
|||||||||||||||||
| Green Field Energy Services, Inc., Warrants, expires 11/15/21 |
Oil and Gas |
Warrants/Equity (3) (6) | 709 | 29,000 | — | 0.0 | % | |||||||||||||||||
|
|
|
|
|
|
|
|||||||||||||||||||
| 709 | 29,000 | — | ||||||||||||||||||||||
| Greenway Medical Technologies, Inc.(7) |
Healthcare, Education, and Childcare |
Senior Secured Second Lien Term Loans LIBOR + 8.25%, 1.00% Floor | 11/4/2021 | 1,000,000 | 985,218 | 985,218 | 0.6 | % | ||||||||||||||||
|
|
|
|
|
|
|
|||||||||||||||||||
| 1,000,000 | 985,218 | 985,218 | ||||||||||||||||||||||
| Healogics, Inc. |
Healthcare, Education, and Childcare | Senior Secured Second Lien Term Loans LIBOR + 8.000%, 1.250% Floor | 2/5/2020 | 2,000,000 | 1,996,440 | 2,040,000 | 1.3 | % | ||||||||||||||||
|
|
|
|
|
|
|
|||||||||||||||||||
| 2,000,000 | 1,996,440 | 2,040,000 | ||||||||||||||||||||||
| Holland Acquisition Corp. |
Oil and Gas |
Senior Secured First Lien Term Loans LIBOR + 9.000%, 1.000% Floor | 5/29/2018 | 5,000,000 | 4,904,352 | 4,917,000 | 3.2 | % | ||||||||||||||||
|
|
|
|
|
|
|
|||||||||||||||||||
| 5,000,000 | 4,904,352 | 4,917,000 | ||||||||||||||||||||||
| IDQ Holdings, Inc. |
Automobile |
Senior Secured First Lien Notes 11.500%(4) | 4/1/2017 | 1,000,000 | 1,035,523 | 1,066,250 | 0.7 | % | ||||||||||||||||
|
|
|
|
|
|
|
|||||||||||||||||||
| 1,000,000 | 1,035,523 | 1,066,250 | ||||||||||||||||||||||
| Integra Telecom, Inc. |
Telecommunications |
Senior Secured Second Lien Term Loans LIBOR + 8.500%, 1.250% Floor(3) | 2/22/2020 | 1,618,000 | 1,607,900 | 1,650,360 | 1.1 | % | ||||||||||||||||
|
|
|
|
|
|
|
|||||||||||||||||||
| 1,618,000 | 1,607,900 | 1,650,360 | ||||||||||||||||||||||
| Interface Security Systems, Inc. |
Electronics |
Senior Secured First Lien Notes 9.250%(3) (4) | 1/15/2018 | $ | 3,417,000 | $ | 3,476,530 | $ | 3,492,550 | 2.3 | % | |||||||||||||
|
|
|
|
|
|
|
|||||||||||||||||||
| 3,417,000 | 3,476,530 | 3,492,550 | ||||||||||||||||||||||
| IronGate Energy Services LLC |
Oil and Gas |
Senior Secured First Lien Notes 11.000%(4) | 7/1/2018 | 3,000,000 | 2,948,441 | 3,029,850 | 2.0 | % | ||||||||||||||||
|
|
|
|
|
|
|
|||||||||||||||||||
| 3,000,000 | 2,948,441 | 3,029,850 | ||||||||||||||||||||||
| Keystone Automotive Operations, Inc. |
Automobile |
Senior Secured Second Lien Term Loans LIBOR + 9.500%, 1.250% Floor | 8/15/2020 | 5,000,000 | 5,000,000 | 5,053,000 | 3.3 | % | ||||||||||||||||
|
|
|
|
|
|
|
|||||||||||||||||||
| 5,000,000 | 5,000,000 | 5,053,000 | ||||||||||||||||||||||
| Kik Custom Products, Inc. |
Healthcare, Education, and Childcare |
Senior Secured Second Lien Term Loans LIBOR + 8.25%, 1.25% Floor | 10/29/2019 | 3,000,000 | 2,970,000 | 2,970,000 | 1.9 | % | ||||||||||||||||
|
|
|
|
|
|
|
|||||||||||||||||||
| 3,000,000 | 2,970,000 | 2,970,000 | ||||||||||||||||||||||
| Linc Energy Finance (USA), Inc. |
Oil and Gas |
Senior Secured First Lien Notes 12.500%(3) (4) | 10/31/2017 | 500,000 | 498,368 | 545,925 | 0.4 | % | ||||||||||||||||
|
|
|
|
|
|
|
|||||||||||||||||||
| Senior Secured First Lien Notes 12.500%(3) | 10/31/2017 | 500,000 | 485,222 | 545,925 | 0.4 | % | ||||||||||||||||||
|
|
|
|
|
|
|
|||||||||||||||||||
| 1,000,000 | 983,590 | 1,091,850 | ||||||||||||||||||||||
F-9
Table of Contents
| Company(1) |
Industry |
Type of Investment |
Maturity | Par Amount |
Cost | Fair Value |
% of Net Assets(2) |
|||||||||||||||||
| Liquidnet Holdings, Inc. |
Finance |
Senior Secured First Lien Term Loans LIBOR + 8.000%, 1.250% Floor | 5/7/2017 | 2,887,500 | 2,862,362 | 2,867,576 | 1.9 | % | ||||||||||||||||
|
|
|
|
|
|
|
|||||||||||||||||||
| 2,887,500 | 2,862,362 | 2,867,576 | ||||||||||||||||||||||
| Livingston International, Inc.(7) |
Cargo Transport |
Senior Secured Second Lien Term Loans LIBOR + 7.750%, 1.250% Floor(5) | 4/18/2020 | 2,658,504 | 2,653,733 | 2,685,089 | 1.8 | % | ||||||||||||||||
|
|
|
|
|
|
|
|||||||||||||||||||
| 2,658,504 | 2,653,733 | 2,685,089 | ||||||||||||||||||||||
| Maxim Crane Works Holdings, Inc.(7) |
Oil and Gas |
Senior Secured Second Lien Notes 12.250%(4) | 4/15/2015 | 1,500,000 | 1,519,124 | 1,542,360 | 1.0 | % | ||||||||||||||||
|
|
|
|
|
|
|
|||||||||||||||||||
| 1,500,000 | 1,519,124 | 1,542,360 | ||||||||||||||||||||||
| Michael Baker International, Inc. |
Diversified/Conglomerate Service |
Senior Secured First Lien Notes 8.25%(4) | 10/15/2018 | 2,500,000 | 2,500,000 | 2,511,528 | 1.6 | % | ||||||||||||||||
|
|
|
|
|
|
|
|||||||||||||||||||
| 2,500,000 | 2,500,000 | 2,511,528 | ||||||||||||||||||||||
| Omnitracs, Inc. |
Electronics | Senior Secured Second Lien Term Loans LIBOR + 7.75%, 1.00% Floor | 4/29/2020 | 7,000,000 | 7,015,128 | 7,015,128 | 4.6 | % | ||||||||||||||||
|
|
|
|
|
|
|
|||||||||||||||||||
| 7,000,000 | 7,015,128 | 7,015,128 | ||||||||||||||||||||||
| Prince Minerals Holding Corp. |
Mining, Steel, Iron, and Nonprecious Metals |
Senior Secured First Lien Notes 11.500%(3) (4) | 12/15/2019 | 1,200,000 | 1,187,246 | 1,310,568 | 0.9 | % | ||||||||||||||||
|
|
|
|
|
|
|
|||||||||||||||||||
| 1,200,000 | 1,187,246 | 1,310,568 | ||||||||||||||||||||||
| Reddy Ice Group, Inc. |
Beverage, Food, and Tobacco |
Senior Secured Second Lien Term Loans LIBOR + 9.500%, 1.250% Floor(3) | 10/1/2019 | 2,000,000 | 2,000,000 | 1,942,460 | 1.3 | % | ||||||||||||||||
|
|
|
|
|
|
|
|||||||||||||||||||
| 2,000,000 | 2,000,000 | 1,942,460 | ||||||||||||||||||||||
| Renaissance Learning, Inc. |
Healthcare, Education, and Childcare |
Senior Secured Second Lien Term Loans LIBOR + 7.75%, 1.00% Floor | 5/14/2021 | 3,500,000 | 3,447,888 | 3,447,888 | 2.3 | % | ||||||||||||||||
|
|
|
|
|
|
|
|||||||||||||||||||
| 3,500,000 | 3,447,888 | 3,447,888 | ||||||||||||||||||||||
| School Specialty, Inc. |
Healthcare, Education, and Childcare |
Senior Secured First Lien Term Loans LIBOR + 8.500%, 1.000% Floor | 6/11/2019 | 2,985,000 | 2,936,006 | 2,864,585 | 1.9 | % | ||||||||||||||||
|
|
|
|
|
|
|
|||||||||||||||||||
| 2,985,000 | 2,936,006 | 2,864,585 | ||||||||||||||||||||||
| Securus Technologies, Inc. |
Telecommunications |
Senior Secured Second Lien Term Loans LIBOR + 7.750%, 1.250% Floor | 4/30/2021 | $ | 2,000,000 | $ | 1,981,227 | $ | 1,988,280 | 1.3 | % | |||||||||||||
|
|
|
|
|
|
|
|||||||||||||||||||
| 2,000,000 | 1,981,227 | 1,988,280 | ||||||||||||||||||||||
| Sesac Holdco II, Inc. |
Broadcasting and Entertainment |
Senior Secured Second Lien Term Loans LIBOR + 8.750%, 1.250% Floor(3) | 7/12/2019 | 2,250,000 | 2,294,369 | 2,300,535 | 1.5 | % | ||||||||||||||||
|
|
|
|
|
|
|
|||||||||||||||||||
| 2,250,000 | 2,294,369 | 2,300,535 | ||||||||||||||||||||||
| Sizzling Platter, LLC |
Beverage, Food, and Tobacco |
Senior Secured First Lien Notes 12.250%(3) (4) | 4/15/2016 | 2,063,000 | 2,124,725 | 2,198,601 | 1.4 | % | ||||||||||||||||
|
|
|
|
|
|
|
|||||||||||||||||||
| 2,063,000 | 2,124,725 | 2,198,601 | ||||||||||||||||||||||
F-10
Table of Contents
| Company(1) |
Industry |
Type of Investment |
Maturity | Par Amount/ Quantity |
Cost | Fair Value |
% of Net Assets(2) |
|||||||||||||||||
| Sorenson Communications |
Telecommunications |
Senior Secured First Lien Term Loans LIBOR + 8.250%, 1.250% Floor | 10/31/2014 | 2,979,987 | 2,979,987 | 2,988,451 | 2.0 | % | ||||||||||||||||
|
|
|
|
|
|
|
|||||||||||||||||||
| 2,979,987 | 2,979,987 | 2,988,451 | ||||||||||||||||||||||
| Tempel Steel Company |
Mining, Steel, Iron, and Nonprecious Metals |
Senior Secured First Lien Notes 12.000%(3) (4) | 8/15/2016 | 1,115,000 | 1,105,791 | 1,085,921 | 0.7 | % | ||||||||||||||||
|
|
|
|
|
|
|
|||||||||||||||||||
| 1,115,000 | 1,105,791 | 1,085,921 | ||||||||||||||||||||||
| True Religion Apparel, Inc. |
Personal and Nondurable Consumer Products (Manufacturing Only) |
Senior Secured Second Lien Term Loans LIBOR + 10.000%, 1.000% Floor | 1/30/2020 | 4,000,000 | 3,835,240 | 3,861,480 | 2.5 | % | ||||||||||||||||
|
|
|
|
|
|
|
|||||||||||||||||||
| 4,000,000 | 3,835,240 | 3,861,480 | ||||||||||||||||||||||
| U.S. Well Services, LLC(5) |
Oil and Gas | Senior Secured First Lien Notes 14.500%(3) (4) | 2/15/2017 | 3,816,605 | 3,796,701 | 3,832,100 | 2.5 | % | ||||||||||||||||
|
|
|
|
|
|
|
|||||||||||||||||||
| 3,816,605 | 3,796,701 | 3,832,100 | ||||||||||||||||||||||
| U.S. Well Services, LLC, Warrants, expires 2/15/19 |
Oil and Gas | Warrants/Equity (3) (6) | 1,731 | 173 | 54,977 | 0.0 | % | |||||||||||||||||
|
|
|
|
|
|
|
|||||||||||||||||||
| 1,731 | 173 | 54,977 | ||||||||||||||||||||||
| Total non-controlled/non-affiliated investments |
$ | 137,332,276 | $ | 137,801,537 | 90.1 | % | ||||||||||||||||||
|
|
|
|
|
|||||||||||||||||||||
| Derivative Instrument - Long Exposure |
Notional Amount |
Unrealized Gain (Loss) |
||||||||||||||||||||||
| Total return swap with Citibank, N.A. (Note 5) |
Total Return Swap | $ | 24,855,700 | $ | 351,396 | |||||||||||||||||||
|
|
|
|
|
|||||||||||||||||||||
| $ | 24,855,700 | $ | 351,396 | |||||||||||||||||||||
|
|
|
|
|
|||||||||||||||||||||
| (1) | All of our investments are domiciled in the United States except for Livingston International, Inc. which is domiciled in Canada. |
| (2) | Percentage is based on net assets of $153,002,273 as of December 31, 2013. |
| (3) | An affiliated fund that is managed by an affiliate of SIC Advisors LLC also holds an investment in this security. |
| (4) | Securities are exempt from registration under Rule 144A of the Securities Act of 1933. These securities represent a fair value of $45,303,968 and 29.6% of net assets as of December 31, 2013 and are considered restricted. |
| (5) | The investment is not a qualifying asset under Section 55 of the Investment Company Act of 1940, as amended. Non-qualifying assets represent 11.5% of the Company’s portfolio at fair value. |
| (6) | Security is non-income producing. |
| (7) | Security is also held in the underlying portfolio of the total return swap with Citibank, N.A. (see Note 5). The Company’s total commitment to Greenway Medical Technologies, Inc., Livingston International, Inc. and Maxim Crane Works Holdings, Inc. is $2,470,218 or 1.6%, $4,654,532 or 3.0% and $2,034,860 or 1.3%, respectively, of Net Assets as of December 31, 2013. |
F-11
Table of Contents
Sierra Income Corporation
Schedule of Investments
December 31, 2012(6)
| Company(1) |
Industry |
Type of Investment |
Maturity | Par Amount/ Quantity |
Cost | Fair Value |
%
of Net Assets(2) |
|||||||||||||||||
| Non-Controlled/non-affiliated investments - 148.3% |
||||||||||||||||||||||||
| Aderant North America, Inc. |
Electronics |
Senior Secured Loans - Second Lien LIBOR + 8.75%, 1.25% Floor(3) | 6/20/2019 | $ | 450,000 | $ | 450,000 | $ | 450,000 | 2.2 | % | |||||||||||||
|
|
|
|
|
|
|
|||||||||||||||||||
| 450,000 | 450,000 | 450,000 | ||||||||||||||||||||||
| Atkore International, Inc. |
Mining, Steel, Iron, and Nonprecious Metals |
Senior Secured Notes 9.875%(3)(4)(5) | 1/1/2018 | 750,000 | 733,129 | 801,600 | 3.9 | % | ||||||||||||||||
|
|
|
|
|
|
|
|||||||||||||||||||
| 750,000 | 733,129 | 801,600 | ||||||||||||||||||||||
| Bon-Ton Stores, Inc. |
Retail Stores |
Senior Secured Notes 10.625%(4)(5) | 7/15/2017 | 1,000,000 | 914,795 | 951,200 | 4.6 | % | ||||||||||||||||
|
|
|
|
|
|
|
|||||||||||||||||||
| 1,000,000 | 914,795 | 951,200 | ||||||||||||||||||||||
| Camp Systems International, Inc. |
Aerospace & Defense |
Senior Secured Loans - Second Lien LIBOR + 8.75%, 1.25% Floor | 11/30/2019 | 500,000 | 490,523 | 505,000 | 2.4 | % | ||||||||||||||||
|
|
|
|
|
|
|
|||||||||||||||||||
| 500,000 | 490,523 | 505,000 | ||||||||||||||||||||||
| Cengage Learning, Inc. |
Healthcare, Education, and Childcare |
Senior Secured Notes 11.500%(4)(5) | 4/15/2020 | 1,250,000 | 1,348,108 | 1,062,500 | 5.2 | % | ||||||||||||||||
|
|
|
|
|
|
|
|||||||||||||||||||
| 1,250,000 | 1,348,108 | 1,062,500 | ||||||||||||||||||||||
| Checkers Drive-In Restaurants, Inc. |
Restaurant & Franchise |
Senior Secured Notes 11.000%(4)(5) | 12/1/2017 | 1,500,000 | 1,504,956 | 1,504,956 | 7.3 | % | ||||||||||||||||
|
|
|
|
|
|
|
|||||||||||||||||||
| 1,500,000 | 1,504,956 | 1,504,956 | ||||||||||||||||||||||
| Deltek, Inc. |
Software | Senior Secured Loans - Second Lien LIBOR + 8.75%, 1.25% Floor(3) | 10/31/2019 | 1,000,000 | 985,343 | 985,343 | 4.8 | % | ||||||||||||||||
|
|
|
|
|
|
|
|||||||||||||||||||
| 1,000,000 | 985,343 | 985,343 | ||||||||||||||||||||||
| Dispensing Dynamics International, Inc. |
Personal and Nondurable Consumer Products (Manufacturing Only) |
Senior Secured Notes 12.500%(3)(4)(5) | 1/1/2018 | 1,200,000 | 1,176,009 | 1,176,009 | 5.7 | % | ||||||||||||||||
|
|
|
|
|
|
|
|||||||||||||||||||
| 1,200,000 | 1,176,009 | 1,176,009 | ||||||||||||||||||||||
| EarthLink, Inc. |
Telecommunications | Senior Secured Notes 10.500%(4)(5)(7) | 4/1/2016 | 900,000 | 950,574 | 957,420 | 4.6 | % | ||||||||||||||||
|
|
|
|
|
|
|
|||||||||||||||||||
| 900,000 | 950,574 | 957,420 | ||||||||||||||||||||||
| Exide Technologies |
Machinery (Nonagriculture, Nonconstruction, Nonelectric) |
Senior Secured Notes 8.625%(3)(4)(5)(7) | 2/1/2018 | 1,600,000 | 1,336,979 | 1,364,001 | 6.6 | % | ||||||||||||||||
|
|
|
|
|
|
|
|||||||||||||||||||
| 1,600,000 | 1,336,979 | 1,364,001 | ||||||||||||||||||||||
| Fifth and Pacific Companies, Inc. |
Retail Stores |
Senior Secured Notes 10.500%(4)(5)(7) | 4/15/2019 | 500,000 | 557,130 | 557,130 | 2.7 | % | ||||||||||||||||
|
|
|
|
|
|
|
|||||||||||||||||||
| 500,000 | 557,130 | 557,130 | ||||||||||||||||||||||
| Great Atlantic & Pacific Tea Company |
Grocery |
Senior Secured Loans - First Lien LIBOR + 9%, 2% Floor(3) | 3/13/2017 | 942,875 | 964,535 | 964,535 | 4.7 | % | ||||||||||||||||
|
|
|
|
|
|
|
|||||||||||||||||||
| 942,875 | 964,535 | 964,535 | ||||||||||||||||||||||
| Green Field Energy Services, Inc. |
Oil and Gas |
Senior Secured Notes 13.000%(4)(5) | 11/15/2016 | 512,000 | 494,791 | 494,791 | 2.4 | % | ||||||||||||||||
| Warrants/Equity |
20,000 | 20,000 | 15,115 | 0.1 | % | |||||||||||||||||||
|
|
|
|
|
|
|
|||||||||||||||||||
| 532,000 | 514,791 | 509,906 | ||||||||||||||||||||||
F-12
Table of Contents
| Company(1) |
Industry |
Type of Investment |
Maturity | Par Amount/ Quantity |
Cost | Fair Value |
%
of Net Assets(2) |
|||||||||||||||||
| IDQ Holdings, Inc. |
Automobile | Senior Secured Notes 11.500%(4)(5) | 4/1/2017 | 1,000,000 | 1,044,468 | 1,078,200 | 5.2 | % | ||||||||||||||||
|
|
|
|
|
|
|
|||||||||||||||||||
| 1,000,000 | 1,044,468 | 1,078,200 | ||||||||||||||||||||||
| Ineos Finance PLC |
Chemicals | Senior Secured Notes 7.500%(4)(5) | 5/1/2020 | 1,250,000 | 1,285,207 | 1,285,207 | 6.2 | % | ||||||||||||||||
|
|
|
|
|
|
|
|||||||||||||||||||
| 1,250,000 | 1,285,207 | 1,285,207 | ||||||||||||||||||||||
| Innovation Ventures, Inc. |
Retail |
Senior Secured Notes 9.500%(4)(5) | 8/1/2019 | 1,250,000 | 1,224,724 | 1,179,375 | 5.7 | % | ||||||||||||||||
|
|
|
|
|
|
|
|||||||||||||||||||
| 1,250,000 | 1,224,724 | 1,179,375 | ||||||||||||||||||||||
| Integra Telecom, Inc. |
Telecommunications | Senior Secured Notes 10.750%(3)(4)(5) | 4/15/2016 | 750,000 | 722,600 | 757,500 | 3.7 | % | ||||||||||||||||
|
|
|
|
|
|
|
|||||||||||||||||||
| 750,000 | 722,600 | 757,500 | ||||||||||||||||||||||
| Linc Energy Finance (USA), Inc. |
Oil and Gas |
Senior Secured Notes 12.500%(3)(4)(5)(7) | 10/31/2017 | 1,000,000 | 980,715 | 980,715 | 4.8 | % | ||||||||||||||||
|
|
|
|
|
|
|
|||||||||||||||||||
| 1,000,000 | 980,715 | 980,715 | ||||||||||||||||||||||
| Maxim Crane Works Holdings, Inc. |
Industrial |
Senior Secured Notes 12.250%(4)(5) | 4/15/2015 | 1,000,000 | 1,010,037 | 1,029,400 | 5.0 | % | ||||||||||||||||
|
|
|
|
|
|
|
|||||||||||||||||||
| 1,000,000 | 1,010,037 | 1,029,400 | ||||||||||||||||||||||
| Mohegan Tribal Gaming Authority |
Gaming |
Senior Secured Notes 11.500%(4)(5) | 11/1/2017 | 1,000,000 | 1,045,312 | 1,045,312 | 5.1 | % | ||||||||||||||||
|
|
|
|
|
|
|
|||||||||||||||||||
| 1,000,000 | 1,045,312 | 1,045,312 | ||||||||||||||||||||||
| Pittsburgh Glass Works, LLC |
Automobile |
Senior Secured Notes 8.500%(4)(5) | 4/15/2016 | 1,425,000 | 1,325,728 | 1,311,000 | 6.4 | % | ||||||||||||||||
|
|
|
|
|
|
|
|||||||||||||||||||
| 1,425,000 | 1,325,728 | 1,311,000 | ||||||||||||||||||||||
| Prince Minerals Holding Corp. |
Mining, Steel, Iron, and Nonprecious Metals |
Senior Secured Notes 11.500%(3)(4)(5) | 12/15/2019 | 1,200,000 | 1,186,001 | 1,248,000 | 6.1 | % | ||||||||||||||||
|
|
|
|
|
|
|
|||||||||||||||||||
| 1,200,000 | 1,186,001 | 1,248,000 | ||||||||||||||||||||||
| Satmex Mexicanos, S.A. de C.V. |
Telecommunications |
Senior Secured Notes 9.500%(4)(5)(7) | 5/15/2017 | 1,000,000 | 1,035,564 | 1,035,564 | 5.0 | % | ||||||||||||||||
|
|
|
|
|
|
|
|||||||||||||||||||
| 1,000,000 | 1,035,564 | 1,035,564 | ||||||||||||||||||||||
| Securus Technologies, Inc. |
Telecommunications |
Senior Secured Loans - Second Lien LIBOR + 9.00%, 1.75% Floor | 5/31/2018 | 500,000 | 490,854 | 490,854 | 2.4 | % | ||||||||||||||||
|
|
|
|
|
|
|
|||||||||||||||||||
| 500,000 | 490,854 | 490,854 | ||||||||||||||||||||||
| Shale-Inland Holdings, Inc. |
Energy |
Senior Secured Notes 8.750%(4)(5) | 11/15/2019 | 1,000,000 | 993,624 | 1,010,000 | 4.9 | % | ||||||||||||||||
|
|
|
|
|
|
|
|||||||||||||||||||
| 1,000,000 | 993,624 | 1,010,000 | ||||||||||||||||||||||
| Sizzling Platter, LLC |
Restaurant & Franchise | Senior Secured Notes 12.250%(3)(4)(5) | 4/15/2016 | 1,652,000 | 1,715,987 | 1,715,987 | 8.3 | % | ||||||||||||||||
|
|
|
|
|
|
|
|||||||||||||||||||
| 1,652,000 | 1,715,987 | 1,715,987 | ||||||||||||||||||||||
| Tempel Steel Company |
Mining, Steel, Iron, and Nonprecious Metals |
Senior Secured Notes 12.000%(3)(4)(5) | 8/15/2016 | 1,115,000 | 1,102,986 | 1,090,024 | 5.3 | % | ||||||||||||||||
|
|
|
|
|
|
|
|||||||||||||||||||
| 1,115,000 | 1,102,986 | 1,090,024 | ||||||||||||||||||||||
| Tower International, Inc. |
Automobile |
Senior Secured Notes 10.625%(3)(4)(5) | 9/1/2017 | 500,000 | 518,324 | 534,500 | 2.6 | % | ||||||||||||||||
|
|
|
|
|
|
|
|||||||||||||||||||
| 500,000 | 518,324 | 534,500 | ||||||||||||||||||||||
| Travelport LLC |
Business Services | Senior Secured Loans - Second Lien LIBOR + 9.5%, 1.5% Floor | 11/22/2015 | 500,000 | 487,178 | 497,050 | 2.4 | % | ||||||||||||||||
|
|
|
|
|
|
|
|||||||||||||||||||
| 500,000 | 487,178 | 497,050 | ||||||||||||||||||||||
| US Well Services, Inc. |
Oil and Gas |
Senior Secured Notes 14.500%(3)(4)(5) | 2/15/2017 | 1,518,405 | 1,504,921 | 1,503,828 | 7.3 | % | ||||||||||||||||
| Warrants/Equity(3) | 1,518 | 152 | — | 0.0 | % | |||||||||||||||||||
|
|
|
|
|
|
|
|||||||||||||||||||
| 1,519,923 | 1,505,073 | 1,503,828 | ||||||||||||||||||||||
F-13
Table of Contents
| Company(1) |
Industry |
Type of Investment |
Maturity | Par Amount/ Quantity |
Cost | Fair Value |
%
of Net Assets(2) |
|||||||||||||||||
| WeLocalize, Inc. |
Business Services | Senior Secured Loans - First Lien LIBOR + 8%, 2% Floor(3) | 11/19/2015 | 459,478 | 459,478 | 459,478 | 2.2 | % | ||||||||||||||||
| Senior Secured Loans - First Lien LIBOR + 9%, 2% Floor, 1.25% PIK(3) | 11/19/2015 | 538,617 | 538,617 | 538,617 | 2.6 | % | ||||||||||||||||||
|
|
|
|
|
|
|
|||||||||||||||||||
| 998,095 | 998,095 | 998,095 | ||||||||||||||||||||||
| Total non-controlled/ |
30,599,349 | 30,580,211 | 148.3 | % | ||||||||||||||||||||
|
|
|
|
|
|||||||||||||||||||||
| US Government |
||||||||||||||||||||||||
| US Treasury Bill |
Government Securities 1.375% | 1/15/2013 | 6,000,000.00 | 6,003,022 | 6,003,000 | 29.1 | % | |||||||||||||||||
|
|
|
|
|
|
|
|||||||||||||||||||
| Total Investments and |
$ | 36,602,371 | $ | 36,583,211 | 177.4 | % | ||||||||||||||||||
|
|
|
|
|
|||||||||||||||||||||
| (1) | All of our portfolio investments are domiciled in the United States except for Satmex Mexicanos S.A. de C.V., which is domiciled in Mexico. |
| (2) | Percentage is based on net assets of $20,622,982 as of December 31, 2012. |
| (3) | An affiliated fund that is managed by an affiliate of SIC Advisors LLC also holds an investment in this security. |
| (4) | Securities are exempt from registration under Rule 144A of the Securities Act of 1933. These securities represent $25,674,219 and 124.6% of net assets as of December 31, 2012 and are considered restricted. |
| (5) | Positions are held as collateral for margin borrowings from our prime broker. The fair value for collateral held at December 31, 2012 is $25,674,219. |
| (6) | The December 31, 2012 presentation has been revised to conform to the current period presentation. |
| (7) | The investment is not a qualifying asset under Section 55 of the Investment Company Act of 1940, as amended. Non-qualifying assets represent 12.6% of the Company’s portfolio investments at fair value as of December 31, 2012. |
F-14
Table of Contents
SIERRA INCOME CORPORATION
Notes to Consolidated Financial Statements
December 31, 2013
Note 1. Organization
Sierra Income Corporation (the “Company”) was incorporated under the general corporation laws of the State of Maryland on June 13, 2011 and formally commenced operations on April 17, 2012. The Company is an externally managed, non-diversified closed-end management investment company that has elected to be treated as a business development company (“BDC”) under the Investment Company Act of 1940, as amended (the “1940 Act”). The Company is externally managed by SIC Advisors LLC (“SIC Advisors”), a registered investment adviser under the Investment Advisers Act of 1940, as amended (the “Advisers Act”). The Company has elected and intends to qualify to be treated for U.S. federal income tax purposes as a regulated investment company (“RIC”) under subchapter M of the Internal Revenue Code of 1986, as amended (the “Code”), commencing with its taxable year ended December 31, 2012, and intends to so qualify annually thereafter. The Company’s fiscal year-end is December 31st.
On April 17, 2012, the Company successfully reached its minimum escrow requirement and officially commenced operations by issuing 1,108,033 shares of common stock to SIC Advisors for gross proceeds of $10,000,000. The Company’s offering period is currently scheduled to terminate on April 16, 2015, unless extended. Since commencing its operations, the Company has sold a total of 16,663,500 shares of common stock, which includes shares issued as part of the distribution reinvestment plan (see Note 12), for total proceeds of $160.9 million, which includes the shares sold to SIC Advisors. The proceeds from the issuance of common stock are presented in the Company’s consolidated statements of changes in net assets and consolidated statements of cash flows and are presented net of selling commissions and dealer manager fees.
On August 15, 2013, the Company formed Arbor Funding LLC, a wholly-owned financing subsidiary.
The Company’s investment objective is to generate current income, and to a lesser extent, long-term capital appreciation. The Company intends to meet its investment objective by investing primarily in the debt of privately owned U.S. companies with a focus on senior secured debt, second lien debt and, to a lesser extent, subordinated debt. The Company will originate transactions sourced through SIC Advisors’ direct origination network, and also expects to acquire debt securities through the secondary market. The Company may make equity investments in companies that it believes will generate appropriate risk adjusted returns, although it does not expect this to be a substantial portion of the portfolio.
Note 2. Significant Accounting Policies
Basis of Presentation
The accompanying consolidated financial statements have been prepared on the accrual basis of accounting in conformity with U.S. generally accepted accounting principles (“GAAP”). Additionally, the accompanying consolidated financial statements of the Company and related financial information have been prepared pursuant to the requirements for reporting on Form 10-K and Regulation S-X. In the opinion of management, the financial results included herein all adjustments and reclassifications that are necessary for the fair presentation of financial statements for the periods included herein. The consolidated financial statements include the accounts of the Company and its wholly owned subsidiaries. All intercompany balances and transactions have been eliminated in consolidation.
Cash and Cash Equivalents
The Company considers cash equivalents to be highly liquid investments or investments with original maturities of three months or less. Cash and cash equivalents include deposits in a money market account. The
F-15
Table of Contents
Company deposits its cash in a financial institution which, at times, may be in excess of the Federal Deposit Insurance Corporation insurance limits.
Offering Costs
Offering costs incurred directly by the Company will be recorded in the period incurred. See Note 7 regarding offering costs paid for by SIC Advisors.
Use of Estimates in the Preparation of Financial Statements
The preparation of financial statements in conformity with GAAP requires management to make estimates and assumptions that affect the reported amounts of assets and liabilities, and disclosure of contingent assets and liabilities at the date of the financial statements and the reported amounts of revenues and expenses during the reporting period. Actual results could differ from those estimates.
Deferred Financing Costs
Financing costs, incurred in connection with our credit facility, are deferred and amortized over the life of the facility.
Indemnification
In the normal course of business, the Company enters into contractual agreements that provide general indemnifications against losses, costs, claims and liabilities arising from the performance of individual obligations under such agreements. The Company has had no prior claims or payments pursuant to such agreements. The Company’s individual maximum exposure under these arrangements is unknown, as this would involve future claims that may be made against the Company that have not yet occurred. However, based on management’s experience, the Company expects the risk of loss to be remote.
New Accounting Pronouncements
In June 2013, the FASB issued Accounting Standards Update 2013-08 “Financial Services-Investment Companies (Topic 946) Amendments to the Scope, Measurement, and Disclosure Requirements” (“ASU 2013-08”). ASU 2013-08 more closely aligns US GAAP with International Financial Reporting Standards by clarifying the characteristics of an investment company and requiring certain new disclosures. The new disclosures required include information about the following items: (i) the type and amount of financial support provided to investee companies, including situations in which the Company assisted an investee in obtaining financial support, (ii) the primary reasons for providing the financial support, (iii) the type and amount of financial support the Company is contractually required to provide to an investee, but has not yet provided, and (iv) the primary reasons for the contractual requirement to provide the financial support. ASU 2013-08 is effective for reporting periods that begin after December 15, 2013, and early application is prohibited.
Revenue Recognition
Interest income, adjusted for amortization of premiums and accretion of discounts, is recorded on an accrual basis. We record amortized or accreted discounts or premiums as interest income using the effective interest method. Dividend income, if any, is recognized on an accrual basis to the extent that the Company expects to collect such amount.
Origination/closing, amendment and transaction break-up fees associated with investments in portfolio companies are recognized as income in the period that we become entitled to such fees. Other fees are capitalized as deferred revenue and recorded into income over the respective period. Other fee income for the years ended December 31, 2013 and 2012 was $619,861 and $6,750, respectively.
F-16
Table of Contents
Prepayment penalties received by the Company for debt instruments paid back to the Company prior to the maturity date are recorded as income upon receipt.
The Company holds debt investments in its portfolio that contain a payment-in-kind (“PIK”) interest provision. PIK interest, which represents contractually deferred interest added to the investment balance that is generally due at maturity, is recorded on the accrual basis to the extent such amounts are expected to be collected. PIK interest is not accrued if the Company does not expect the issuer to be able to pay all principal and interest when due. For the years ended December 31, 2013 and 2012 the Company earned $580 and $3,911 in PIK interest, respectively.
Investment transactions are accounted for on a trade-date basis. Realized gains or losses on investments are measured by the difference between the net proceeds from the disposition and the amortized cost basis of investment, without regard to unrealized gains or losses previously recognized. The Company reports changes in fair value of investments that are measured at fair value as a component of the net change in unrealized appreciation (depreciation) on investments in the consolidated statements of operations. For total return swap transactions, periodic payments are received or made at the end of each settlement period, but prior to settlement are recorded as realized gains or losses on total return swap in the consolidated statements of operations.
Management reviews all loans that become 90 days or more past due on principal and interest or when there is reasonable doubt that principal or interest will be collected for possible placement on non-accrual status. Accrued interest is generally reserved when a loan is placed on non-accrual status. Interest payments received on non-accrual loans may be recognized as income or applied to principal depending upon management’s judgment regarding collectability. Non-accrual loans are restored to accrual status when past due principal and interest is paid and, in management’s judgment, are likely to remain current, although the Company may make exceptions to this general rule if the loan has sufficient collateral value and is in the process of collection.
Investment Classification
The Company classifies its investments in accordance with the requirements of the 1940 Act. Under the 1940 Act, it would be deemed to “control” a portfolio company if it owns more than 25% of its outstanding voting securities and/or had the power to exercise control over the management or policies of such portfolio company. The Company refers to such investments in portfolio companies that it “controls” as “Control Investments.” Under the 1940 Act, the Company would be deemed to be an “Affiliated Person” of a portfolio company if it owns between 5% and 25% of the portfolio company’s outstanding voting securities or if it is under common control with such portfolio company. The Company refers to such investments in Affiliated Persons as “Affiliated Investments.” As of December 31, 2013, the Company has no Controlled Investments or Affiliated Investments.
Valuation of Investments
The Company applies fair value accounting to all of its financial instruments in accordance with the 1940 Act and ASC Topic 820 - Fair Value Measurements and Disclosures (“ASC 820”). ASC 820 defines fair value, establishes a framework used to measure fair value and requires disclosures for fair value measurements. In accordance with ASC 820, the Company has categorized its financial instruments carried at fair value, based on the priority of the valuation technique, into a three-level fair value hierarchy as discussed in Note 4. Fair value is a market-based measure considered from the perspective of the market participant who holds the financial instrument rather than an entity specific measure. Therefore, when market assumptions are not readily available, the Company’s own assumptions are set to reflect those that management believes market participants would use in pricing the financial instrument at the measurement date.
Investments for which market quotations are readily available are valued at such market quotations, which are generally obtained from an independent pricing service or multiple broker-dealers or market makers. The Company weighs the use of third-party broker quotes, if any, in determining fair value based on our understanding of the level of actual transactions used by the broker to develop the quote and whether the quote was an indicative price or binding offer. However, debt investments with remaining maturities within 60 days
F-17
Table of Contents
that are not credit impaired are valued at cost plus accreted discount, or minus amortized premium, which approximates fair value. Investments for which market quotations are not readily available are valued at fair value as determined by the Company’s board of directors based upon input from management and third party valuation firms. Because these investments are illiquid and because there may not be any directly comparable companies whose financial instruments have observable market values, these loans are valued using a fundamental valuation methodology, consistent with traditional asset pricing standards, that is objective and consistently applied across all loans and through time.
The Company uses third-party valuation firms to assist the board of directors in the valuation of its portfolio investments. The valuation reports generated by the third-party valuation firms consider the evaluation of financing and sale transactions with third parties, expected cash flows and market based information, including comparable transactions, performance multiples, and movement in yields of debt instruments, among other factors. Based on market data obtained from the third-party valuation firms, the Company uses a combined market yield analysis and an enterprise model of valuation. In applying the market yield analysis, the value of the Company’s loans is determined based upon inputs such as the coupon rate, current market yield, interest rate spreads of similar securities, the stated value of the loan, and the length to maturity. In applying the enterprise model, the Company uses a waterfall analysis which takes into account the specific capital structure of the borrower and the related seniority of the instruments within the borrower’s capital structure into consideration. To estimate the enterprise value of the portfolio company, the Company weighs some or all of the traditional market valuation methods and factors based on the individual circumstances of the portfolio company in order to estimate the enterprise value. The methodologies for performing investments may be based on, among other things: valuations of comparable public companies, recent sales of private and public comparable companies, discounting the forecasted cash flows of the portfolio company, third party valuations of the portfolio company, considering offers from third parties to buy the company, estimating the value to potential strategic buyers and considering the value of recent investments in the equity securities of the portfolio company. For non-performing investments, we may estimate the liquidation or collateral value of the portfolio company’s assets and liabilities using an expected recovery model. We may estimate the fair value of warrants based on a model such as the Black-Scholes model or simulation models or a combination thereof.
Over-the-counter (OTC) derivative contracts, such as total return swaps (discussed in Note 5) are fair valued using models that measure the change in fair value of reference assets underlying the swaps offset against any fees payable to the swap counterparty. The fair values of the reference assets underlying the swap are determined using similar methods as described above for debt and equity investments where the Company also invests directly in such assets.
The Company undertakes a multi-step valuation process each quarter when valuing investments for which market quotations are not readily available, as described below:
| • | the Company’s quarterly valuation process begins with each portfolio investment being initially valued by the investment professionals responsible for monitoring the portfolio investment; |
| • | conclusions are then documented and discussed with senior management; and |
| • | an independent valuation firm engaged by the Company’s board of directors prepares an independent valuation report for approximately one third of the portfolio investments each quarter on a rotating quarterly basis on non fiscal year-end quarters, such that each of these investments will be valued by an independent valuation firm at least twice per annum when combined with the fiscal year-end review of all the investments by independent valuation firms. |
In addition, all of the Company’s investments are subject to the following valuation process:
| • | management reviews preliminary valuations and their own independent assessment; |
| • | the audit committee of the Company’s board of directors reviews the preliminary valuations of senior management and independent valuation firms; and |
F-18
Table of Contents
| • | the Company’s board of directors discusses valuations and determines the fair value of each investment in the Company’s portfolio in good faith based on the input of SIC Advisors, the respective independent valuation firms and the audit committee. |
Due to the inherent uncertainty of determining the fair value of investments that do not have a readily available market value, the fair value of the Company’s investments may differ significantly from the values that would have been used had a readily available market value existed for such investments, and the differences could be material.
Fair Value of Financial Instruments
The carrying amounts of certain of the Company’s financial instruments, including cash and cash equivalents, accounts payable and accrued expenses, approximate fair value due to their short-term nature.
Federal Income Taxes
The Company has elected to be treated as a RIC under subchapter M of the Code and operate in a manner so as to qualify for the tax treatment applicable to RICs. In order to qualify as a RIC, among other things, the Company is required to meet certain source of income and asset diversification requirements and timely distribute to its stockholders at least 90% of the sum of its investment company taxable income (“ICTI”) including PIK, as defined by the Code, and net tax exempt interest income (which is the excess of the Company’s gross tax exempt interest income over certain disallowed deductions) for each taxable year in order to be eligible for tax treatment under subchapter M of the Code. Depending on the level of ICTI earned in a tax year, the Company may choose to carry forward ICTI in excess of current year dividend distributions into the next tax year. Any such carryover ICTI must be distributed before the end of that next tax year through a dividend declared prior to filing the final tax return related to the year which generated such ICTI.
The Company will be subject to a nondeductible U.S. federal excise tax of 4% on undistributed income if it does not distribute at least 98% of its ordinary income in any calendar year and 98.2% of its capital gain net income for each one-year period ending on October 31 of such calendar year. To the extent that the Company determines that its estimated current year annual taxable income will be in excess of estimated current year dividend distributions for excise tax purposes, the Company accrues excise tax, if any, on estimated excess taxable income as taxable income is earned.
ICTI generally differs from net investment income for financial reporting purposes due to temporary and permanent differences in the recognition of income and expenses. The Company may be required to recognize ICTI in certain circumstances in which it does not receive cash. For example, if the Company holds debt obligations that are treated under applicable tax rules as having original issue discount, the Company must include in ICTI each year a portion of the original issue discount that accrues over the life of the obligation, regardless of whether cash representing such income is received by the Company in the same taxable year. The Company may also have to include in ICTI other amounts that it has not yet received in cash, such as 1) PIK interest income and 2) interest income from investments that have been classified as non-accrual for financial reporting purposes. Interest income on non-accrual investments is not recognized for financial reporting purposes, but generally is recognized in ICTI. Because any original issue discount or other amounts accrued will be included in the Company’s ICTI for the year of accrual, the Company may be required to make a distribution to its stockholders in order to satisfy the minimum distribution requirements, even though the Company will not have received and may not ever receive any corresponding cash amount. ICTI also excludes net unrealized appreciation or depreciation, as investment gains or losses are not included in taxable income until they are realized.
Although we file federal and state tax returns, our major tax jurisdiction is federal. The Company’s federal tax returns from inception-to-date remain subject to examination by the Internal Revenue Service.
F-19
Table of Contents
The Company accounts for income taxes in conformity with ASC Topic 740—Income Taxes (“ASC 740”). ASC 740 provides guidelines for how uncertain tax positions should be recognized, measured, presented and disclosed in financial statements. ASC 740 requires the evaluation of tax positions taken or expected to be taken in the course of preparing the Company’s tax returns to determine whether the tax positions are “more-likely-than-not” of being sustained by the applicable tax authority. Tax positions deemed to meet a “more-likely-than-not” threshold would be recorded as a tax benefit or expense in the current period. The Company recognizes interest and penalties, if any, related to unrecognized tax benefits as income tax expense in the consolidated statements of operations. There were no material uncertain income tax positions at December 31, 2013.
Permanent differences between ICTI and net investment income for financial reporting purposes are reclassified among capital accounts in the consolidated financial statements to reflect their tax character. Differences in classification may also result from the treatment of short-term gains as ordinary income for tax purposes. During the years ended December 31, 2013 and 2012, the Company reclassified for book purposes amounts arising from permanent book/tax differences related to the different tax treatment of realized gain/(loss) on swaps, defaulted bonds, return of capital distributions and certain fee income as follows:
| As of December 31, 2013 |
As of December 31, 2012 |
|||||||
| Capital in excess of par value |
$ | — | $ | (328,132 | ) | |||
| Accumulated undistributed net investment income (loss) |
236,207 | 328,132 | ||||||
| Accumulated undistributed/(distributions in excess of) net realized gain (loss) from investments |
(236,207 | ) | — | |||||
The following table reflects, for tax purposes, the sources of the cash distributions that the Company has paid on its common stock during the years ended December 31, 2013 and 2012:
| Year ended December 31, 2013 | Year Ended December 31, 2012 | |||||||||||||||
| Source of Distribution |
Distribution Amount(1) | Percentage | Distribution Amount | Percentage | ||||||||||||
| Return of capital from offering proceeds |
$ | — | — | % | $ | — | — | % | ||||||||
| Return of capital from borrowings |
— | — | — | — | ||||||||||||
| Net investment income |
6,032,061 | 100.0 | 637,330 | 100.0 | ||||||||||||
| Return of capital (other) |
— | — | — | — | ||||||||||||
|
|
|
|
|
|
|
|
|
|||||||||
| Distributions on a tax basis: |
$ | 6,032,061 | 100.0 | % | $ | 637,330 | 100.0 | % | ||||||||
|
|
|
|
|
|
|
|
|
|||||||||
(1) The Distribution Amount and Percentage reflected for December 31, 2013 are estimated figures. The actual source of distributions for the fiscal year ending 2013 will be calculated in connection with the Company’s year-end procedures.
For federal income tax purposes, the cost of portfolio investments owned at December 31, 2013 and 2012 was $137,344,332 and $36,595,644, respectively. For the year ended December 31, 2013, gross unrealized appreciation and depreciation for federal income tax purposes were $1,379,930 and $922,725, respectively, resulting in net unrealized appreciation of $457,205. For the year ended December 31, 2012, gross unrealized appreciation and depreciation for federal income tax purposes were $352,398 and $364,831, respectively, resulting in net unrealized depreciation of $12,433.
F-20
Table of Contents
At December 31, 2013 and 2012, the components of distributable earnings on a tax basis detailed below differ from the amounts reflected in the Company’s Consolidated Statement of Assets and Liabilities by temporary and other book/tax differences, primarily relating to the tax treatment of dividends payable, defaulted bonds and unamortized upfront fees, as follows:
| As of December 31, 2013 |
As of December 31, 2012 |
|||||||
| Undistributed net investment income |
$ | 110,912 | $ | 196,405 | ||||
| Accumulated capital gains (losses) |
— | — | ||||||
| Other temporary differences |
3,363 | 6,727 | ||||||
| Capital loss carryover |
(138,783 | ) | — | |||||
| Unrealized appreciation (depreciation) |
457,205 | (19,160 | ) | |||||
|
|
|
|
|
|||||
| Components of tax distributable earnings at year end |
$ | 432,697 | $ | 183,972 | ||||
|
|
|
|
|
|||||
Segments
The Company invests in various industries. The Company separately evaluates the performance of each of its investment relationships. However, because each of these investment relationships has similar business and economic characteristics, they have been aggregated into a single investment segment. All applicable segment disclosures are included in or can be derived from the Company’s consolidated financial statements. See Note 3 for further information.
Company Investment Risk, Concentration of Credit Risk, and Liquidity Risk
SIC Advisors has broad discretion in making investments for the Company. Investments generally consist of debt instruments that may be affected by business, financial market or legal uncertainties. Prices of investments may be volatile, and a variety of factors that are inherently difficult to predict, such as domestic or international economic and political developments, may significantly affect the results of the Company’s activities and the value of its investments. In addition, the value of the Company’s portfolio may fluctuate as the general level of interest rates fluctuates.
The value of the Company’s investments in loans and bonds may be detrimentally affected to the extent, among other things, that a borrower defaults on its obligations, there is insufficient collateral and/or there are extensive legal and other costs incurred in collecting on a defaulted loan, observable secondary or primary market yields for similar instruments issued by comparable companies increase materially or risk premiums required in the market between smaller companies, such as the Company’s borrowers, and those for which market yields are observable increase materially. SIC Advisors may attempt to minimize these risks by maintaining low loan-to-liquidation values with each loan and the collateral underlying the loan.
The Company’s assets may, at any time, include securities and other financial instruments or obligations that are illiquid or thinly traded, making purchase or sale of such securities and financial instruments at desired prices or in desired quantities difficult. Furthermore, the sale of any such investments may be possible only at substantial discounts, and it may be extremely difficult to value any such investments accurately.
F-21
Table of Contents
Note 3. Investments
The following table shows the composition of the Company’s portfolio investments by industry classification at fair value at December 31, 2013:
| Fair Value | Percentage | |||||||
| Oil and Gas |
$ | 18,862,779 | 13.7 | % | ||||
| Telecommunications |
17,073,865 | 12.4 | % | |||||
| Retail Stores |
16,995,844 | 12.3 | % | |||||
| Electronics |
13,996,099 | 10.2 | % | |||||
| Healthcare, Education, and Childcare |
12,307,691 | 8.9 | % | |||||
| Chemicals, Plastics, and Rubber |
9,810,000 | 7.1 | % | |||||
| Personal and Nondurable Consumer Products (Manufacturing Only) |
9,154,092 | 6.7 | % | |||||
| Finance |
6,808,098 | 4.9 | % | |||||
| Automobile |
6,119,250 | 4.4 | % | |||||
| Beverage, Food, and Tobacco |
5,755,736 | 4.2 | % | |||||
| Cargo Transport |
5,677,727 | 4.1 | % | |||||
| Hotels, Motels, Inns, and Gaming |
3,056,250 | 2.2 | % | |||||
| Diversified/Conglomerate Service |
2,511,528 | 1.8 | % | |||||
| Mining, Steel, Iron, and Nonprecious Metals |
2,396,489 | 1.7 | % | |||||
| Broadcasting and Entertainment |
2,300,535 | 1.7 | % | |||||
| Aerospace and Defense |
2,016,472 | 1.5 | % | |||||
| Leisure, Amusement, Motion Pictures, and Entertainment |
2,007,080 | 1.5 | % | |||||
| Grocery |
952,002 | 0.7 | % | |||||
|
|
|
|
|
|||||
| Total |
$ | 137,801,537 | 100.0 | % | ||||
|
|
|
|
|
|||||
See Note 5 for industry classifications of the underlying TRS reference assets as of December 31, 2013.
The following table shows the composition of the Company’s portfolio investments by industry classification at fair value at December 31, 2012:
| Fair Value | Percentage | |||||||
| Telecommunications |
3,241,338 | 10.5 | % | |||||
| Restaurant & Franchise |
3,220,943 | 10.4 | % | |||||
| Mining, Steel, Iron, and Nonprecious Metals |
3,139,624 | 10.3 | % | |||||
| Oil and Gas |
2,994,449 | 9.8 | % | |||||
| Automobile |
2,923,700 | 9.6 | % | |||||
| Retail Stores |
1,508,330 | 4.9 | % | |||||
| Business Services |
1,495,145 | 4.9 | % | |||||
| Machinery (Nonagriculture, Nonconstruction, Nonelectric) |
1,364,001 | 4.5 | % | |||||
| Chemicals |
1,285,207 | 4.2 | % | |||||
| Retail |
1,179,375 | 3.9 | % | |||||
| Personal and Nondurable Consumer Products (Manufacturing Only) |
1,176,009 | 3.8 | % | |||||
| Healthcare, Education, and Childcare |
1,062,500 | 3.5 | % | |||||
| Gaming |
1,045,312 | 3.4 | % | |||||
| Industrial |
1,029,400 | 3.4 | % | |||||
| Energy |
1,010,000 | 3.3 | % | |||||
| Software |
985,343 | 3.2 | % | |||||
| Grocery |
964,535 | 3.2 | % | |||||
| Aerospace & Defense |
505,000 | 1.7 | % | |||||
| Electronics |
450,000 | 1.5 | % | |||||
|
|
|
|
|
|||||
| Total |
$ | 30,580,211 | 100.0 | % | ||||
|
|
|
|
|
|||||
F-22
Table of Contents
The following table summarizes the amortized cost and the fair value of the Company’s portfolio investments as of December 31, 2013:
| Amortized Cost |
Percentage | Fair Value | Percentage | |||||||||||||
| Senior secured first lien term loans |
$ | 28,617,156 | 20.9 | $ | 28,583,326 | 20.8 | % | |||||||||
| Senior secured first lien notes |
47,352,921 | 34.5 | 47,427,311 | 34.4 | ||||||||||||
| Senior secured second lien term loans |
56,224,549 | 40.9 | 56,481,247 | 41.0 | ||||||||||||
| Senior secured second lien notes |
5,108,477 | 3.7 | 5,254,676 | 3.8 | ||||||||||||
| Warrants/Equity |
29,173 | — | 54,977 | — | ||||||||||||
|
|
|
|
|
|
|
|
|
|||||||||
| Total |
$ | 137,332,276 | 100.0 | % | $ | 137,801,537 | 100.0 | % | ||||||||
|
|
|
|
|
|
|
|
|
|||||||||
The following table summarizes the amortized cost and the fair value of the Company’s portfolio in debt and equity investments as of December 31, 2012:
| Amortized Cost |
Percentage | Fair Value | Percentage | |||||||||||||
| Senior secured first lien term loans |
$ | 1,962,630 | 6.4 | % | $ | 1,962,630 | 6.4 | % | ||||||||
| Senior secured second lien term loans |
2,903,898 | 9.5 | 2,928,247 | 9.6 | ||||||||||||
| Senior secured notes |
25,712,669 | 84.0 | 25,674,219 | 84.0 | ||||||||||||
| Warrants/Equity |
20,152 | 0.1 | 15,115 | 0.0 | ||||||||||||
|
|
|
|
|
|
|
|
|
|||||||||
| Total |
$ | 30,599,349 | 100.0 | % | $ | 30,580,211 | 100.0 | % | ||||||||
|
|
|
|
|
|
|
|
|
|||||||||
The following table shows the composition of the Company’s portfolio investments by geography classification at fair value at December 31, 2013:
| Geography |
Fair Value | Percentage | ||||||
| United States |
$ | 135,116,448 | 98.1 | % | ||||
| Canada |
2,685,089 | 1.9 | ||||||
|
|
|
|
|
|||||
| Total |
$ | 137,801,537 | 100.0 | % | ||||
|
|
|
|
|
|||||
The following table shows the composition of the Company’s portfolio investments by geography classification at fair value at December 31, 2012:
| Geography |
Fair Value | Percentage | ||||||
| United States |
$ | 29,544,647 | 96.6 | % | ||||
| Mexico |
1,035,564 | 3.4 | ||||||
|
|
|
|
|
|||||
| Total |
$ | 30,580,211 | 100.0 | % | ||||
|
|
|
|
|
|||||
Opportunities for co-investments may arise when SIC Advisors or an affiliated adviser becomes aware of investment opportunities that may be appropriate for the Company and other clients, or affiliated funds. As a BDC, the Company was substantially limited in its ability to co-invest in privately negotiated transactions with affiliated funds until it obtained an exemptive order from the SEC on November 25, 2013 (the “Exemptive Order”). The Exemptive Order permits the Company to participate in negotiated co-investment transactions with certain affiliates, each of whose investment adviser is Medley, LLC, the parent company of Medley Capital LLC and SIC Advisors, or an investment adviser controlled by Medley, LLC in a manner consistent with its investment objective, strategies and restrictions, as well as regulatory requirements and other pertinent factors. Co-investment under the Exemptive Order is subject to certain conditions therein, including the condition that, in the case of each co-investment transaction, the Company’s board of directors determines that it would be advantageous for the Company to co-invest in a manner described in the Exemptive Order. Before receiving the Exemptive Order, the Company only participated in co-investments that were allowed under existing regulatory
F-23
Table of Contents
guidance, such as syndicated loan transactions where price was the only negotiated term, which limited the types of investments that the Company could make. Please refer to footnote 3 to the Schedule of Investments as of December 31, 2013 for disclosures regarding securities also held by affiliated funds.
Note 4. Fair Value Measurements
The Company follows ASC 820 for measuring the fair value of portfolio investments. Fair value is the price that would be received in the sale of an asset or paid to transfer a liability in an orderly transaction between market participants at the measurement date. Where available, fair value is based on observable market prices or parameters, or derived from such prices or parameters. Where observable prices or inputs are not available, valuation models are applied. These valuation models involve some level of management estimation and judgment, the degree of which is dependent on the price transparency for the instruments or market and the instruments’ complexity. The Company’s fair value analysis includes an analysis of the value of any unfunded loan commitments. Financial investments recorded at fair value in the consolidated financial statements are categorized for disclosure purposes based upon the level of judgment associated with the inputs used to measure their value. The valuation hierarchical levels are based upon the transparency of the inputs to the valuation of the investment as of the measurement date. The three levels are defined as follows:
| • | Level 1—Valuations based on quoted prices in active markets for identical assets or liabilities at the measurement date. |
| • | Level 2—Valuations based on inputs other than quoted prices in active markets included in Level 1, which are either directly or indirectly observable at the measurement date. This category includes quoted prices for similar assets or liabilities in active markets, quoted prices for identical or similar assets or liabilities in non-active markets including actionable bids from third parties for privately held assets or liabilities, and observable inputs other than quoted prices such as yield curves and forward currency rates that are entered directly into valuation models to determine the value of derivatives or other assets or liabilities. |
| • | Level 3—Valuations based on inputs that are unobservable and where there is little, if any, market activity at the measurement date. The inputs for the determination of fair value may require significant management judgment or estimation and is based upon management’s assessment of the assumptions that market participants would use in pricing the assets or liabilities. These investments include debt and equity investments in private companies or assets valued using the market or income approach and may involve pricing models whose inputs require significant judgment or estimation because of the absence of any meaningful current market data for identical or similar investments. The inputs in these valuations may include, but are not limited to, capitalization and discount rates, beta and EBITDA multiples. The information may also include pricing information or broker quotes which include a disclaimer that the broker would not be held to such a price in an actual transaction. The non-binding nature of consensus pricing and/or quotes accompanied by disclaimer would result in classification as Level 3 information, assuming no additional corroborating evidence. |
In addition to using the above inputs in investment valuations, the Company employs the valuation policy approved by the board of directors that is consistent with ASC 820 (see Note 2). Consistent with the Company’s valuation policy, the Company evaluates the source of inputs, including any markets in which the Company’s investments are trading, in determining fair value.
F-24
Table of Contents
The following table presents the fair value measurements of the Company’s total investments, by major class according to the fair value hierarchy, as of December 31, 2013:
| Type of Investment |
Level 1 | Level 2 | Level 3 | Total | ||||||||||||
| Senior secured first lien term loans |
$ | — | $ | — | $ | 28,583,326 | $ | 28,583,326 | ||||||||
| Senior secured first lien notes |
— | 5,509,312 | 41,917,999 | 47,427,311 | ||||||||||||
| Senior secured second lien term loans |
— | — | 56,481,247 | 56,481,247 | ||||||||||||
| Senior secured second lien notes |
— | — | 5,254,676 | 5,254,676 | ||||||||||||
| Warrants/Equity |
— | — | 54,977 | 54,977 | ||||||||||||
|
|
|
|
|
|
|
|
|
|||||||||
| Total |
$ | — | $ | 5,509,312 | $ | 132,292,225 | $ | 137,801,537 | ||||||||
|
|
|
|
|
|
|
|
|
|||||||||
| Derivative Instrument - Long Exposure |
Level 1 | Level 2 | Level 3 | Total | ||||||||||||
| Asset |
||||||||||||||||
| Total return swap with Citibank, N.A. |
$ | — | $ | — | $ | 351,396 | $ | 351,396 | ||||||||
|
|
|
|
|
|
|
|
|
|||||||||
The following table presents the fair value measurements of the Company’s portfolio investments, by major class according to the fair value hierarchy, as of December 31, 2012:
| Level 1 | Level 2 | Level 3 | Total | |||||||||||||
| Senior secured first lien term loans |
$ | — | $ | — | $ | 1,962,630 | $ | 1,962,630 | ||||||||
| Senior secured second lien term loans |
— | — | 2,928,247 | 2,928,247 | ||||||||||||
| Senior secured notes |
— | 3,123,021 | 22,551,198 | 25,674,219 | ||||||||||||
| Warrants/Equity |
— | — | 15,115 | 15,115 | ||||||||||||
| US Government Treasuries |
— | 6,003,000 | — | 6,003,000 | ||||||||||||
|
|
|
|
|
|
|
|
|
|||||||||
| Total |
$ | — | $ | 9,126,021 | $ | 27,457,190 | $ | 36,583,211 | ||||||||
|
|
|
|
|
|
|
|
|
|||||||||
The following table provides a reconciliation of the beginning and ending balances for total investments that use Level 3 inputs for the year ended December 31, 2013 based off of fair value hierarchy at December 31, 2013:
| Senior Secured First Lien Notes |
Senior Secured Second Lien Notes |
Senior Secured First Lien Term Loans |
Senior Secured Second Lien Term Loans |
Warrants/ Equity |
Total Return Swap |
Total | ||||||||||||||||||||||
| Balance, December 31, 2012 |
$ | 18,214,286 | $ | 4,336,912 | $ | 1,962,630 | $ | 2,928,247 | $ | 15,115 | $ | — | $ | 27,457,190 | ||||||||||||||
| Purchases |
32,361,031 | 8,413,823 | 28,305,402 | 57,666,279 | 9,021 | — | 126,755,556 | |||||||||||||||||||||
| Sales |
(8,618,478 | ) | (8,218,562 | ) | (1,665,340 | ) | (4,372,805 | ) | — | — | (22,875,185 | ) | ||||||||||||||||
| Transfers in |
— | 1,659,221 | — | — | — | — | 1,659,221 | |||||||||||||||||||||
| Transfers out |
— | (1,508,330 | ) | — | — | — | — | (1,508,330 | ) | |||||||||||||||||||
| Amortization of discount/(premium) |
(70,796 | ) | 7,674 | 3,929 | 5,556 | — | — | (53,637 | ) | |||||||||||||||||||
| Paid-in-kind interest income |
— | — | 580 | — | — | — | 580 | |||||||||||||||||||||
| Net realized gains |
(306,571 | ) | 422,374 | 9,955 | 21,621 | — | — | 147,379 | ||||||||||||||||||||
| Net change in unrealized appreciation (depreciation) |
338,527 | 141,564 | (33,830 | ) | 232,349 | 30,841 | 351,396 | 1,060,847 | ||||||||||||||||||||
|
|
|
|
|
|
|
|
|
|
|
|
|
|
|
|||||||||||||||
| Balance, December 31, 2013 |
$ | 41,917,999 | $ | 5,254,676 | $ | 28,583,326 | $ | 56,481,247 | $ | 54,977 | $ | 351,396 | $ | 132,643,621 | ||||||||||||||
|
|
|
|
|
|
|
|
|
|
|
|
|
|
|
|||||||||||||||
| Change in net unrealized appreciation (depreciation) in investments held as of December 31, 2013(1) |
$ | 79,617 | $ | 90,431 | $ | (33,858 | ) | $ | 221,794 | $ | 54,803 | $ | 351,396 | $ | 764,183 | |||||||||||||
|
|
|
|
|
|
|
|
|
|
|
|
|
|
|
|||||||||||||||
| (1) | Amount is included in the related amount on investments and derivative instruments in the condensed consolidated statements of operations. |
F-25
Table of Contents
During the year ended December 31, 2013, the Company recorded $1,508,330 of transfers from Level 3 to Level 2 due to an increase of observable inputs in market data and $1,659,221 in transfers from level 2 to level 3 due to a decrease in observable market data.
The following table provides a reconciliation of the beginning and ending balances for portfolio investments that use Level 3 inputs for the year ended December 31, 2012 based off of fair value hierarchy at December 31, 2012:
| Senior Secured Notes |
First Lien Term Loans |
Second Lien Term Loans |
Warrants/ Equity |
Total | ||||||||||||||||
| Balance, December 31, 2011 |
$ | — | $ | — | $ | — | $ | — | $ | — | ||||||||||
| Purchases |
23,691,208 | 3,941,316 | 2,900,000 | 20,152 | 30,552,676 | |||||||||||||||
| Sales |
(1,007,500 | ) | (1,983,131 | ) | — | — | (2,990,631 | ) | ||||||||||||
| Amortization of discount/(premium) |
(14,224 | ) | (2,030 | ) | 3,899 | — | (12,355 | ) | ||||||||||||
| Paid-in-kind interest income |
— | 3,911 | — | — | 3,911 | |||||||||||||||
| Net realized gains |
22,500 | 2,565 | — | — | 25,065 | |||||||||||||||
| Net change in unrealized appreciation (depreciation) |
(140,786 | ) | (1 | ) | 24,348 | (5,037 | ) | (121,476 | ) | |||||||||||
|
|
|
|
|
|
|
|
|
|
|
|||||||||||
| Balance, December 31, 2012 |
$ | 22,551,198 | $ | 1,962,630 | $ | 2,928,247 | $ | 15,115 | 27,457,190 | |||||||||||
|
|
|
|
|
|
|
|
|
|
|
|||||||||||
During the year ended December 31, 2012, there were no transfers from Level 3 to Level 2 or from Level 2 to Level 3.
The following table presents the quantitative information about level 3 fair value measurements of our total investments, as of December 31, 2013:
| Fair Value | Valuation techniques | Unobservable input | Range (weighted average) |
|||||||||
| Senior secured first lien term loans |
$28,583,326 | Market approach | Market yield | 5.66% -10.51% (9.52% | ) | |||||||
| Senior secured first lien notes |
$41,917,999 | Market approach | Market yield | 7.35% -15.05% (10.22% | ) | |||||||
| Enterprise valuation analysis | Liquidation Proceeds |
|
$189.0M - $222.4M ($205.8M |
) | ||||||||
| Senior secured second lien term loans |
$56,481,247 | Market approach | Market yield | 8.05% -11.83% (9.65% | ) | |||||||
| Senior secured second lien notes |
$5,254,676 | Market approach | Market yield | 7.59% -10.67% (9.23% | ) | |||||||
| Warrants/Equity |
$54,977 | Enterprise valuation analysis | EBITDA multiple | 5.00x (5.00x | ) | |||||||
| Liquidation Proceeds |
|
$189.0M - $222.4M ($205.8M |
) | |||||||||
| Total return swap |
$351,396 | Market approach | Market yield | 5.16% -10.18% (8.49% | ) | |||||||
The following table presents the quantitative information about level 3 fair value measurements of our portfolio investments, as of December 31, 2012:
| Fair Value | Valuation techniques | Unobservable input |
Range (weighted average) |
|||||||||
| Senior secured first lien term loans |
$ | 1,962,630 | Market approach | Market yield | 8.8% - 13.2% (10.8%) | |||||||
| Senior secured second lien term loans |
$ | 2,928,247 | Market approach | Market yield | 8.9% - 13.9% (10.5%) | |||||||
| Senior secured notes |
$ | 22,551,198 | Market approach | Market yield | 4.2% - 15.8% (12.0%) | |||||||
| Warrants/Equity |
$ | 15,115 | Enterprise valuation analysis | EBITDA multiple | 1x | |||||||
The significant unobservable inputs used in the fair value measurement of the Company’s debt and derivative investments are market yields. Significant increases in market yields would result in significantly lower fair value measurements.
The significant unobservable inputs used in the fair value measurement of the Company’s warrants/equity investments are comparable company EBITDA multiples. Significant decreases in EBITDA multiples in isolation would result in significantly lower fair value measurements.
F-26
Table of Contents
Note 5. Total Return Swap
On August 27, 2013, the Company, through its wholly-owned financing subsidiary, Arbor Funding LLC (“Arbor”), entered into a total return swap (“TRS”) with Citibank, N.A. (“Citibank”).
The TRS with Citibank enables Arbor, to obtain the economic benefit of the loans underlying the TRS, despite the fact that such loans will not be directly held or otherwise owned by Arbor, in return for an interest-type payment to Citibank. Accordingly, the TRS is analogous to Arbor utilizing leverage to acquire loans and incurring an interest expense to a lender.
SIC Advisors acts as the investment manager of Arbor and has discretion over the composition of the basket of loans underlying the TRS. The terms of the TRS are governed by an ISDA 2002 Master Agreement, the Schedule thereto and Credit Support Annex to such Schedule, and the Confirmation exchanged thereunder, between Arbor and Citibank, which collectively establish the TRS, and are collectively referred to herein as the “TRS Agreement”.
Pursuant to the terms of the TRS Agreement, and subject to conditions customary for transactions of this nature, Arbor may select a portfolio of loans with a maximum market value (determined at the time each such loan becomes subject to the TRS) of $100,000,000, which is also referred to as the maximum notional amount of the TRS. Each individual loan, and the portfolio of loans taken as a whole, must meet criteria described in the TRS Agreement. Arbor receives from Citibank a periodic payment on set dates that is based upon any coupons, both earned and accrued, generated by the loans underlying the TRS, subject to limitations described in the TRS Agreement as well as any fees associated with the loans included in the portfolio. Arbor pays to Citibank interest at a rate equal to one-month LIBOR + 1.3% per annum. In addition, upon the termination or repayment of any loan subject to the TRS, Arbor either receives from Citibank the appreciation in the value of such loan, or pays to Citibank any depreciation in the value of such loan.
Citibank may terminate the TRS on or after the second anniversary of the effectiveness of the TRS. SIC Advisors may terminate the TRS on behalf of Arbor at any time upon providing 10 days prior notice to Citibank. Any termination by SIC Advisors on behalf of Arbor prior to the second anniversary of the effectiveness of the TRS will result in payment of an early termination fee to Citibank. The early termination fee shall equal the present value of the following two cash flows: (a) interest payments at a rate equal 1.30% based on 70% of the maximum notional amount of $100,000,000, payable from the later of the first anniversary of the effectiveness of the TRS or the termination date until the second anniversary of the effectiveness of the TRS and (b) interest payments at a rate equal to 0.15% based on the maximum notional amount of $100,000,000, payable from the later of the first anniversary of the effectiveness of the TRS or the termination date until the second anniversary of the effectiveness of the TRS.
Arbor is required to pay a minimum usage fee in connection with the TRS of 1.3% on the amount equal to 85% of the average daily unused portion of the maximum amount permitted under the TRS. Such minimum usage fee will not apply during the first 365 days and last 60 days of the term of the TRS. Arbor will also pay Citibank customary fees in connection with the establishment and maintenance of the TRS.
Arbor is required to initially cash collateralize a specified percentage of each loan (generally 25% to 35% of the market value of such loan) included under the TRS in accordance with margin requirements described in the TRS Agreement. Arbor has posted $6,706,159 in collateral to Citibank in relation to the TRS which is recorded on the consolidated statements of assets and liabilities as cash collateral on total return swap. Arbor may be required to post additional collateral from time to time as a result of a decline in the mark-to-market value of the portfolio of loans subject to the TRS. The obligations of Arbor under the TRS Agreement are non-recourse to the Company and the Company’s exposure under the TRS Agreement is limited to the value of the Company’s investment in Arbor, which generally equals the value of cash collateral provided by Arbor under the TRS Agreement.
F-27
Table of Contents
In connection with the TRS, Arbor has made customary representations and warranties and is required to comply with various covenants, reporting requirements and other customary requirements for similar transactions. In addition to customary events of default and termination events included in the form ISDA 2002 Master Agreement, the TRS Agreement contains the following termination events: (a) a failure to satisfy the portfolio criteria for at least 30 days; (b) a failure to post initial cash collateral or additional collateral as required by the TRS Agreement; (c) a default by Arbor or the Company with respect to indebtedness in an amount equal to or greater than the lesser of $10,000,000 and 2% of the Company’s net asset value at such time; (d) a merger of Arbor or the Company meeting certain criteria; (e) the Company or Arbor amending their respective constituent documents to alter their investment strategy in a manner that has or could reasonably be expected to have a material adverse effect; and (f) SIC Advisors ceasing to be the investment manager of Arbor or to have authority to enter into transactions under the TRS Agreement on behalf of Arbor, and not being replaced by an entity reasonably acceptable to Citibank. As of December 31, 2013, the Company did not have any derivatives with contingent features in net liability positions. Therefore, if a trigger event had occurred at December 31, 2013, no amount would have been required to be posted by the Company.
The Company’s maximum derivative risk exposure as of December 31, 2013 is $6,706,159, which is recorded on the consolidated statement of assets and liabilities as cash collateral on total return swap.
The Company’s derivative asset due from Citibank, net of amounts available for offset under a master netting agreement as of December 31, 2013, was $155,317, which is recorded on the consolidated statement of assets and liabilities as receivable due on total return swap. The Company does not offset collateral posted in relation to the TRS with any unrealized appreciation or depreciation outstanding in the consolidated statement of assets and liabilities as of December 31, 2013.
Transactions in total return swap contracts during the year ended December 31, 2013 were $155,317 in realized gains and $351,396 in unrealized gains, which is recorded on the consolidated statement of operations.
The Company only held one derivative position during the year ended December 31, 2013 and the derivative held is subject to a netting arrangement. The following table represents the Company’s gross and net amounts after offset under Master Agreements (“MA”) of the derivative assets and liabilities presented by derivative type net of the related collateral pledged by the Company as of December 31, 2013:
| Gross Derivative Assets Subject to a MA |
Derivative Amount Available for Offset |
Net Amount Presented in the Consolidated Statement of Assets and Liabilities |
Cash Collateral Received |
Net Amount of Derivative Assets |
||||||||||||||
| Total Return Swap (1) |
$351,396 | — | $ | 351,396 | — | $ | 351,396 | |||||||||||
| (1) | Cash was posted for initial margin requirements for the total return swap as of December 31, 2013 and is reported on the consolidated statement of assets and liabilities as cash collateral on total return swap. |
The following represents the volume of the Company’s derivative transactions during the year ended December 31, 2013:
| Average notional par amount of contracts |
$ | 13,545,525 | (1) |
| (1) | Position was open for four months during the year. |
F-28
Table of Contents
The following is a summary of the underlying TRS reference assets as of December 31, 2013:
| Company (3) |
Industry | Type of |
Coupon Rate |
Maturity | Par Amount |
Initial Notional (Cost)(4) |
Fair Value | Unrealized Appreciation (Depreciation) |
||||||||||||||||||
| AMF Bowling Worldwide, Inc. |
Broadcasting and |
Senior Secured First Lien Term Loan | LIBOR + 7.500%, 1.250% |
6/29/2018 | 2,981,250 | $ | 2,966,345 | $ | 2,988,703 | $ | 22,358 | |||||||||||||||
| AP Gaming I, LLC |
Electronics | Senior Secured First Lien Term Loan | LIBOR + 8.250%, 1.000% |
12/18/2020 | 6,750,000 | 6,547,500 | 6,581,250 | 33,750 | ||||||||||||||||||
| El Pollo Loco Inc. |
Personal, Food, and Miscellaneous Services |
Senior Secured Second Lien Term Loan | LIBOR + 8.500%, 1.000% |
4/9/2019 | 1,500,000 | 1,485,000 | 1,507,500 | 22,500 | ||||||||||||||||||
| Fieldwood Energy LLC |
Oil and Gas |
Senior Secured Second Lien Term Loan | LIBOR + 7.125%, 1.250% |
9/30/2020 | 1,000,000 | 970,000 | 1,020,000 | 50,000 | ||||||||||||||||||
| Greenway Medical Technologies, Inc. |
Healthcare, |
Senior Secured First Lien Term Loan | LIBOR + 5.000%, 1.000% |
11/2/2020 | 1,500,000 | 1,485,000 | 1,492,500 | 7,500 | ||||||||||||||||||
| Isola USA |
Diversified/ Conglomerate Service |
Senior Secured First Lien Term Loan | LIBOR + 8.250%, 1.000% |
11/23/2018 | 4,000,000 | 3,940,000 | 4,020,000 | 80,000 | ||||||||||||||||||
| Livingston International, Inc. |
Diversified/ |
Senior Secured Second Lien Term Loan | LIBOR + 7.750%, 1.250% |
4/18/2020 | 1,954,783 | 1,969,443 | 1,976,813 | 7,370 | ||||||||||||||||||
| Maxim Crane Works Holdings, Inc. |
Diversified/ |
Senior Secured Second Lien Term Loan | LIBOR + 9.250%, 1.000% |
11/26/2018 | 500,000 | 492,500 | 501,250 | 8,750 | ||||||||||||||||||
| McGraw-Hill Companies, Inc. |
Healthcare, |
Senior Secured First Lien Term Loan | LIBOR + 7.750%, 1.250% |
3/22/2019 | 1,994,987 | 2,024,912 | 2,029,062 | 4,150 | ||||||||||||||||||
| Mohegan Tribal Gaming Authority |
Hotels, Motels, |
Senior Secured First Lien Term Loan | LIBOR + 4.500%, 1.000% |
11/19/2019 | 2,000,000 | 1,980,000 | 2,028,760 | 48,760 | ||||||||||||||||||
| Polymer Group Inc. |
Containers, Packaging, and Glass |
Senior Secured First Lien Term Loan | LIBOR + 4.250%, 1.000% |
12/13/2019 | 1,000,000 | 995,000 | 1,004,380 | 9,380 | ||||||||||||||||||
|
|
|
|
|
|
|
|||||||||||||||||||||
| $ | 24,855,700 | $ | 25,150,218 | $ | 294,518 | |||||||||||||||||||||
| Total accrued interest income, net of expenses |
56,878 | |||||||||||||||||||||||||
|
|
|
|||||||||||||||||||||||||
| Total unrealized appreciation on total return swap |
$ | 351,396 | ||||||||||||||||||||||||
| (1) | The investment is not a qualifying asset under the Investment Company Act of 1940, as amended. |
| (2) | The referenced asset or portion thereof is unsettled as of December 31, 2013. |
| (3) | All investments are domiciled in the United States except for Livingston International, Inc., which is domiciled in the Canada. |
| (4) | Represents the initial amount of par on an investment in which the TRS is referenced. |
Note 6. Borrowings
As a BDC, the Company is only allowed to employ leverage to the extent that its asset coverage, as defined in the 1940 Act, equals at least 200% after giving effect to such leverage. The amount of leverage that the Company employs at any time depends on its assessment of the market and other factors at the time of any proposed borrowing.
F-29
Table of Contents
The fair value of the Company’s debt obligation is determined in accordance with ASC 820, which defines fair value in terms of the price that would be paid to transfer a liability in an orderly transaction between market participants at the measurement date under current market conditions. The fair value of the Company’s margin borrowings are estimated based upon market interest rates for its own borrowings or entities with similar credit risk, adjusted for nonperformance risk, if any. The Company’s debt obligation is recorded at its carrying value, which approximates fair value.
Prime Brokerage Agreement
Prior to December 4, 2013 the Company maintained a prime brokerage account and margin borrowing facility (the “Margin Facility”) with Barclays Capital Inc. (“Barclays”) for investment purposes that was based on the fair value of investments held at Barclays as determined by Barclays. The prime brokerage account and margin borrowing facility was closed on December 4, 2013 and, as of December 31, 2013 had no balance.
Revolving Credit Facility
On December 4, 2013, the Company entered into a three-year senior secured syndicated revolving credit facility with a one-year term out period (the “ING Facility”) pursuant to a Senior Secured Revolving Credit Agreement (the “Revolving Credit Agreement”) with certain lenders party thereto from time to time and ING Capital LLC, as administrative agent. The ING Facility matures on December 4, 2017 and is secured by substantially all of the Company’s assets, subject to certain exclusions as further set forth in a Guarantee, Pledge and Security Agreement (the “Security Agreement”) entered into in connection with the Revolving Credit Agreement, among the Company, the Subsidiary Guarantors party thereto, ING Capital LLC, as Administrative Agent, each Financial Agent and Designated Indebtedness Holder party thereto and ING Capital LLC, as Collateral Agent. The ING Facility also includes usual and customary representations, covenants and events of default for senior secured revolving credit facilities of this nature.
The ING Facility allows for the Company, at its option, to borrow money at a rate of either (i) an alternate base rate plus 2.50% per annum or (ii) LIBOR plus 3.50% per annum. The interest rate margins are subject to certain step-downs upon the satisfaction of certain conditions described in the Revolving Credit Agreement. The alternate base rate will be the greatest of (i) the U.S. Prime Rate set forth in the Wall Street Journal, (ii) the federal funds effective rate plus 1/2 of 1%, and (iii) three month LIBOR plus 1%. The initial commitment under the ING Facility is $50,000,000, and the ING Facility includes an accordion feature that allows for potential future expansion of the ING Facility up to a total of $100,000,000. Availability of loans under the ING Facility is linked to the valuation of the collateral pursuant to a borrowing base mechanism.
The Company is also required to pay a commitment fee to the lenders based on the daily unused portion of the aggregate commitments under the ING Facility. The commitment fee is (x) 0.50% for the initial six month period commencing on the closing date and (y) thereafter, 1% of the aggregate unused commitments if the used portion of the aggregate commitments is less than or equal to 35% of the aggregate commitments, or 0.50% if the used portion of the aggregate commitments is greater than 35% of the aggregate commitments. The ING Facility provides that the Company may use the proceeds of the facility for general corporate purposes, including making investments in accordance with the Company’s investment objective and strategy.
Borrowings under the Revolving Credit Agreement are subject to, among other things, a minimum borrowing base. Substantially all of the Company’s assets are pledged as collateral under the Revolving Credit Agreement. The ING Facility requires the Company to, among other things (i) make representations and warranties regarding the collateral as well the Company’s business and operations, (ii) agree to certain indemnification obligations, and (iii) agree to comply with various affirmative and negative covenants. The documents for the Revolving Credit Agreement also include default provisions, such as the failure to make timely payments under the Revolving Credit Agreement, the occurrence of a change in control, and the failure by the Company to materially perform under the operative agreements governing the Revolving Credit Agreement, which, if not complied with, could accelerate repayment under the Revolving Credit Agreement, thereby materially and adversely affecting the Company’s liquidity, financial condition and results of operations.
F-30
Table of Contents
In connection with the security interest established under the Security Agreement, the Company, ING Capital LLC, in its capacity as collateral agent, and State Street Bank and Trust Company, in its capacity as the Company’s custodian, entered into a Control Agreement dated as of December 4, 2013 (the “Control Agreement”), in order to, among other things, perfect the security interest granted pursuant to the Security Agreement in, and provide for control over, the related collateral.
As of December 31, 2013, the carrying amount of the Company’s borrowings under the ING Facility approximated the fair value of our debt obligation. The fair value of the Company’s debt obligation is determined in accordance with ASC 820, which defines fair value in terms of the price that would be paid to transfer a liability in an orderly transaction between market participants at the measurement date under current market conditions. The fair value of the Company’s borrowing under the ING Facility is estimated based upon market interest rates of the Company’s borrowing or entities with similar credit risk, adjusted for nonperformance risk, if any. At December 31, 2013, the ING Facility would be deemed to be level 3, as defined in Note 4.
As of December 31, 2013, $1,150,139 of financing costs related to the ING Facility have been capitalized and are being amortized over the respective terms. For the year ended December 31, 2013, the Company recorded $215,059 of interest and financing expenses related to the ING Facility, of which $179,505 was attributable to interest and $35,554 was attributable to amortization of deferred financing costs. As of December 31, 2013, the Company’s outstanding borrowings under the ING facility was $16,000,000. For the year ended December 31, 2013, our weighted average outstanding debt balance and interest rate on the ING Facility was $1,008,219 and 0.20%, respectively.
Note 7. Agreements
Investment Advisory Agreement
On April 16, 2012, the Company entered into an investment advisory agreement (“IAA”) with SIC Advisors to manage the Company’s investment activities. Pursuant to the IAA, SIC Advisors implements the Company’s business strategy on a day-to-day basis and performs certain services for the Company, subject to oversight by the Company’s board of directors. SIC Advisors is responsible for, among other duties, determining investment criteria, sourcing, analyzing and executing investment transactions, asset sales, financings and performing asset management duties. Under the IAA, the Company has agreed to pay SIC Advisors a management fee for investment advisory and management services consisting of a base management fee and an incentive fee.
The base management fee is calculated at an annual rate of 1.75% of the Company’s gross assets payable quarterly in arrears. For purposes of calculating the base management fee, the term “gross assets” includes any assets acquired with the proceeds of leverage. “Gross assets” also includes any cash collateral posted with respect to the TRS, adjusted for realized and unrealized appreciation. For the first quarter of the Company’s operations, the base management fee was calculated based on the initial value of the Company’s gross assets. Subsequently, the base management fee is calculated based on the gross assets at the end of each completed calendar quarter. Base management fees for any partial quarter are appropriately prorated. For the years ended December 31, 2013 and 2012, the Company recorded an expense for base management fees of $1,906,386 and $319,530, of which $814,655 and $171,317 were payable at December 31, 2013 and 2012, respectively.
The incentive fee consists of the following two parts:
An incentive fee on net investment income (“subordinated incentive fee on income”) is calculated and payable quarterly in arrears and is based upon pre-incentive fee net investment income for the immediately preceding quarter. No subordinated incentive fee on income is payable in any calendar quarter in which pre-incentive fee net investment income does not exceed a quarterly return to stockholders of 1.75% per quarter on the Company’s net assets at the end of the immediately preceding fiscal quarter, (the “preferred quarterly
F-31
Table of Contents
return.”) All pre-incentive fee net investment income, if any, that exceeds the quarterly preferred return, but is less than or equal to 2.1875% of net assets at the end of the immediately preceding fiscal quarter in any quarter, will be payable to SIC Advisors. The Company refers to this portion of its subordinated incentive fee on income as the catch up. It is intended to provide an incentive fee of 20% on pre-incentive fee net investment income when pre-incentive fee net investment income exceeds 2.1875% of net assets at the end of the immediately preceding quarter in any quarter. For any quarter in which the Company’s pre-incentive fee net investment income exceeds 2.1875% of net assets at the end of the immediately preceding quarter, the subordinated incentive fee on income shall equal 20% of the amount of pre-incentive fee net investment income, because the preferred return and catch up will have been achieved.
A capital gains incentive fee will be earned on realized investments and shall be payable in arrears as of the end of each calendar year during which the IAA is in effect. If the IAA is terminated, the fee will also become payable as of the effective date of such termination. The fee equals 20% of the realized capital gains, less the aggregate amount of any previously paid capital gains incentive fees. Incentive fee on capital gains is equal to realized capital gains on a cumulative basis from inception, computed net of all realized capital losses and unrealized capital depreciation on a cumulative basis.
Under GAAP, the Company calculates capital gains incentive fees as if the Company had realized all assets at their fair values and liabilities at their settlement amounts as of the reporting date. GAAP requires that the capital gains incentive fee accrual assume the cumulative aggregate unrealized capital appreciation is realized, even though such unrealized capital appreciation is not payable under the IAA. Accordingly, the Company accrues a provisional capital gains incentive fee taking into account any unrealized gains or losses. There can be no assurance that such unrealized capital appreciation will be realized in the future and that the provisional capital gains incentive fee will become payable.
For the year ended December 31, 2013, the provisional capital gains incentive fee payable to SIC Advisors was $182,989. For the year ended December 31, 2012, the provisional capital gains incentive fee payable to SIC Advisors was $628.
Under the terms of the IAA, SIC Advisors bears all organization and offering expenses, as defined in the IAA, on behalf of the Company. Upon such time that the Company has either raised $300,000,000 in gross proceeds in connection with the sale of shares of its common stock or the offering period has expired, SIC Advisors shall no longer be obligated to bear, pay or otherwise be responsible for any ongoing organization and offering expenses on behalf of the Company, and the Company will be responsible for paying or otherwise incurring all such organization and offering expenses.
Pursuant to the terms of the IAA, the Company has agreed to reimburse SIC Advisors for any such organizational and offering expenses incurred by SIC Advisors not to exceed 1.25% of the gross subscriptions raised by the Company over the course of the offering period, which is currently scheduled to terminate two years from the initial offering date, unless extended.
In the event that other organizational and offering expenses exceed 5.25% of the gross proceeds from the sale of shares of the Company’s common stock pursuant to its public offering or one or more private offerings at the time of the completion of the offering or other organizational and offering expenses, together with selling commissions, dealer manager fees and any discounts paid to members of the Financial Industry Regulatory Authority, exceed 15% of the gross proceeds from the sale of shares of the Company’s common stock pursuant to its public offering or one or more private offerings at the time of the completion of the offering, then SIC Advisors shall be required to pay without reimbursement from the Company, or, if already paid by the Company, reimburse the Company, for amounts exceeding such 5.25% and 15% limit, as appropriate.
For the year ended December 31, 2013 and for the period from June 13, 2011 (inception) through December 31, 2012, SIC Advisors incurred organizational and offering costs of $1,066,517 and $2,984,676,
F-32
Table of Contents
respectively. Of the total $4,051,193 organizational and offering costs incurred from inception through December 31, 2013, $1,784,559 and $272,205 were reimbursed to SIC Advisors during the year ended December 31, 2013 and 2012, respectively. Of the $1,761,943 reimbursed to SIC Advisors during the year ended December 31, 2013, $1,739,327 relates to expense reimbursements incurred during the year and of which, $33,311 has been accrued and is reflected in the consolidated statements of assets and liabilities as due to affiliate. The Company incurred $328,132 relating to expense reimbursements to SIC Advisors during the year ended December 31, 2012, of which, $55,927 has been accrued and is reflected in the consolidated statements of assets and liabilities as due to affiliate and $272,205 was reimbursed to SIC Advisors. The remaining unreimbursed amount will be eligible for reimbursement to the extent the Company receives subscriptions until April 16, 2014, which is the currently scheduled date that the offering period ends, unless it is extended. Organizational and offering expenses paid for by SIC Advisors and reimbursed by the Company will be expensed on the Company’s consolidated statements of operations.
Administration Agreement
On April 5, 2012, the Company entered into an administration agreement with Medley Capital LLC, pursuant to which Medley Capital LLC furnishes the Company with administrative services necessary to conduct its day-to-day operations. Medley Capital LLC is reimbursed for administrative expenses it incurs on the Company’s behalf in performing its obligations. Such costs are reasonably allocated to the Company on the basis of assets, revenues, time records or other reasonable methods. The Company does not reimburse Medley Capital LLC for any services for which it receives a separate fee or for rent, depreciation, utilities, capital equipment or other administrative items allocated to a controlling person of Medley Capital LLC. Medley Capital LLC is an affiliate of SIC Advisors. For the year ended December 31, 2013, the Company recorded an expense of $592,585, relating to administrator expenses. For the year ended December 31, 2012, the Company recorded an expense of $375,677, relating to administrator expenses.
Expense Support and Reimbursement Agreement
On June 29, 2012, the Company entered into an Expense Support and Reimbursement Agreement (the “Expense Support Agreement”) with SIC Advisors. Pursuant to the Expense Support Agreement, SIC Advisors has agreed to reimburse the Company for operating expenses in an amount equal to the difference between distributions paid to the Company’s stockholders in each month, less the sum of the Company’s net investment income, the Company’s net realized capital gains and dividends paid to the Company from its portfolio companies during such period (“Expense Support Reimbursement”). To the extent that no dividends or other distributions are paid to the Company’s stockholders in any given month, then the Expense Support Reimbursement for such month shall be equal to such amount necessary in order for Available Operating Funds for the month to equal zero. The terms of the Expense Support Agreement commenced as of the date that the Company’s registration statement was declared effective by the SEC and continued monthly thereafter until December 31, 2012. Subsequently, the Company’s board of directors approved amendments to the Expense Support Agreement that extended the term from December 31, 2012 to June 30, 2014.
Pursuant to the Expense Support Agreement, the Company has a conditional obligation to reimburse SIC Advisors for any amounts funded by SIC Advisors under the Expense Support Agreement if (and only to the extent that), during any fiscal quarter occurring within three years of the date on which SIC Advisors incurred a liability for such amount, the sum of the Company’s net investment income, the Company’s net capital gains and the amount of any dividends and other distributions paid to the Company from its portfolio companies (to the extent not included in net investment income or net capital gains for tax purposes) exceeds the distributions paid by the Company to stockholders. The purpose of the Expense Support Agreement is to avoid such distributions being characterized as returns of capital for GAAP purposes and to reduce operating expenses until the Company has raised sufficient capital to be able to absorb such expenses.
Pursuant to the Expense Support Agreement, the Company will reimburse SIC Advisors for expense support payments it previously made following any calendar quarter in which the Company received net investment income,
F-33
Table of Contents
net capital gains and dividends from its portfolio companies in excess of the distributions paid to the Company’s stockholders during such calendar quarter (the “Excess Operating Funds”). Any such reimbursement will be made within three years of the date that the expense support payment obligation was incurred by SIC Advisors, subject to the conditions described below. The amount of the reimbursement during any calendar quarter will equal the lesser of (i) the Excess Operating Funds received during the quarter and (ii) the aggregate amount of all expense payments made by SIC Advisors that have not yet been reimbursed. In addition, the Company will only make reimbursement payments if its “operating expense ratio” (as described in footnote 1 to the table below) is equal to or less than its operating expense ratio at the time the corresponding expense payment was incurred and if the annualized rate of its regular cash distributions to the Company’s stockholders is equal to or greater than the annualized rate of the Company’s regular cash distributions to stockholders at the time the corresponding expense payment was incurred.
For the year ended December 31, 2013, the Company recorded Expense Support Reimbursements of $3,939,251, on the consolidated statements of operations, which includes $125,000 that SIC Advisors elected to reimburse on June 27, 2013 related to expenses from prior periods. Repayments of amounts paid by SIC Advisors to the Company under the Expense Support Agreement will be accrued as they become probable and estimable. For the year ended December 31, 2012, the Company recorded expense reimbursements of $1,465,910 on the consolidated statements of operations. As of December 31, 2013, the Company recorded $2,592,989 in its consolidated statements of assets and liabilities as due from affiliate relating to the Expense Support and Reimbursement Agreement. From inception through December 31, 2013, the Company did not record any reimbursement to SIC Advisors for Expense Support Reimbursements.
The following table provides information regarding liabilities incurred by SIC Advisors pursuant to the Expense Support Agreement as well as other information relating to the Company’s ability to reimburse SIC Advisors for such payments:
| Quarter Ended |
Amount of Expense Payment Obligation |
Operating Expense Ratio (1) |
Annualized Distribution Rate (2) |
Eligible to be Repaid Through | ||||||||||
| June 30, 2012 |
$ | 454,874 | 6.13 | % | 8.00 | % | June 30, 2015 | |||||||
| September 30, 2012 |
437,303 | 4.05 | % | 8.00 | % | September 30, 2015 | ||||||||
| December 31, 2012 |
573,733 | 3.91 | % | 8.00 | % | December 31, 2015 | ||||||||
| March 31, 2013 |
685,404 | 1.71 | % | 8.00 | % | March 31, 2016 | ||||||||
| June 30, 2013 |
732,425 | 1.00 | % | 7.84 | % | June 30, 2016 | ||||||||
| September 30, 2013 |
1,277,853 | 0.83 | % | 7.84 | % | September 30, 2016 | ||||||||
| December 31, 2013 |
1,243,569 | 0.45 | % | 7.84 | % | December 31, 2016 | ||||||||
| (1) | “Operating Expense Ratio” is as of the date the expense support payment obligation was incurred by our Advisor and includes all expenses borne by the Company, except for organizational and offering expenses, base management and incentive fees owed to SIC Advisors, and interest expense. |
| (2) | “Annualized Distribution Rate” equals the annualized rate of distributions paid to stockholders based on the amount of the regular cash distribution paid immediately prior to the date the expense support payment obligation was incurred by SIC Advisors. “Annualized Distribution Rate” does not include special cash or stock distributions paid to stockholders. |
Note 8. Related Party Transactions
On October 19, 2011, SIC Advisors entered into a subscription agreement to purchase 110.80 shares of common stock for cash consideration of $1,000. The consideration represents $9.025 per share.
On March 31, 2012, SIC Advisors entered into a subscription agreement to purchase 1,108,033.24 shares of common stock for cash consideration of $10,000,000. The purchase was made on April 17, 2012. The consideration represents $9.025 per share.
F-34
Table of Contents
Due from affiliate relates to amounts due from SIC Advisors pursuant to the Expense Support Agreement as discussed in Note 7.
Due to affiliate relates to reimbursements of organizational and offering expenses pursuant to the IAA paid to SIC Advisors as discussed in Note 7.
An affiliate of the Company’s dealer manager has an ownership interest in SIC Advisors.
Note 9. Directors Fees
The Company’s independent directors receive an annual retainer fee of $30,000 and further receive a fee of $2,500 ($1,000 for telephonic attendance) for each regularly scheduled board meeting and a fee of $1,000 for each special board meeting and all committee meetings as well as reimbursement of reasonable and documented out-of-pocket expenses incurred in connection with attending each board or committee meeting. In addition, the chairman of the audit committee receives an annual retainer of $10,000, while the chairman of any other committee receives an annual retainer of $2,500. For the years ended December 31, 2013 and 2012, the Company recorded directors’ fees expenses of $154,084 and $146,861, respectively, of which $0 and $40,081 was payable at December 31, 2013 and 2012, respectively.
Note 10. Earnings Per Share
In accordance with the provisions of ASC Topic 260—Earnings per Share (“ASC 260”), basic earnings per share is computed by dividing earnings available to common shareholders by the weighted average number of shares outstanding during the period. Other potentially dilutive common shares, and the related impact to earnings, are considered when calculating earnings per share on a diluted basis.
The following table sets forth the computation of the weighted average basic and diluted net increase in net assets per share from operations for the years ended December 31, 2013 and 2012:
| For the years ended December 31, |
||||||||
| Basic and diluted |
2013 | 2012 | ||||||
| Net increase/(decrease) in net assets from operations |
$ | 6,280,786 | $ | 493,170 | ||||
| Weighted average common shares outstanding |
7,426,660 | 1,031,621 | ||||||
| Earnings per common share-basic and diluted |
$ | 0.85 | $ | 0.48 | ||||
Note 11. Commitments and Contingencies
The Company’s investment portfolio may contain debt investments that are in the form of lines of credit and unfunded delayed draw commitments, which require the Company to provide funding when requested by portfolio companies in accordance with the terms of the underlying loan agreements. As of December 31, 2013 and 2012, the Company had no unfunded commitments.
Note 12. Distributions and Share Repurchase Plan Distributions
Dividends and distributions to common stockholders are recorded on the ex-dividend date. The amount to be paid out as a dividend is determined by the Company’s board of directors.
The Company has adopted an “opt in” distribution reinvestment plan (“DRIP”) pursuant to which the Company’s common stockholders may elect to have the full amount of any cash distributions reinvested in additional shares of the Company’s common stock. As a result, if the Company declares a cash dividend or other distribution, each stockholder that has “opted in” to the Company’s reinvestment plan will have their distributions automatically reinvested in additional shares of the Company’s common stock rather than receiving
F-35
Table of Contents
cash distributions. Stockholders who receive distributions in the form of shares of common stock will be subject to the same federal, state and local tax consequences as if they received cash distributions. For the year ended December 31, 2013, the Company distributed a total of $6,032,061, of which, $3,915,000 was in cash and $2,117,061 was in the form of common shares associated with the DRIP. For the year ended December 31, 2012, the Company distributed a total of $637,330, of which, $557,132 was in cash and $80,198 was in the form of common shares associated with the DRIP.
The following table reflects the cash distributions per share that the Company declared or paid to its stockholders since it commenced operations in April 2012. Stockholders of record as of each respective record date were entitled to receive the distribution.
| Record Date |
Payment Date | Amount per share | ||||
| July 13 and 31, 2012 |
August 1, 2012 | $ | 0.03333 | |||
| August 15 and 31, 2012 |
September 4, 2012 | 0.03333 | ||||
| September 14 and 28, 2012 |
October 1, 2012 | 0.03333 | ||||
| October 15 and 30, 2012 |
October 31, 2012 | 0.03333 | ||||
| November 15 and 29, 2012 |
November 30, 2012 | 0.03333 | ||||
| December 14 and 28, 2012 |
December 31, 2012 | 0.03333 | ||||
| January 15 and 31, 2013 |
January 31, 2013 | 0.03333 | ||||
| February 15 and 28, 2013 |
February 28, 2013 | 0.03333 | ||||
| March 15 and 29, 2013 |
March 29, 2013 | 0.03333 | ||||
| April 15 and 30, 2013 |
April 30, 2013 | 0.03333 | ||||
| May 15 and 31, 2013 |
May 31, 2013 | 0.03333 | ||||
| June 14 and 28, 2013 |
June 28, 2013 | 0.03333 | ||||
| July 15 and 31, 2013 |
July 31, 2013 | 0.03333 | ||||
| August 15 and 30, 2013 |
August 30, 2013 | 0.03333 | ||||
| September 13 and 30, 2013 |
September 30, 2013 | 0.03333 | ||||
| October 15 and 31, 2013 |
October 31, 2013 | 0.03333 | ||||
| November 15 and 29, 2013 |
November 29, 2013 | 0.03333 | ||||
| December 13 and 31, 2013 |
December 31, 2013 | 0.03333 | ||||
| January 15 and 31, 2014 |
January 31, 2014 | 0.03333 | ||||
| February 14 and 28, 2014 |
February 28, 2014 | 0.03333 | ||||
| March 14 and 31, 2014 |
March 31, 2014 | 0.03333 | ||||
| April 15 and 30, 2014 |
April 30, 2014 | 0.03333 | ||||
| May 15 and 30, 2014 |
May 30, 2014 | 0.03333 | ||||
| June 13 and 30, 2014 |
June 30, 2014 | 0.03333 | ||||
The Company’s distributions may be funded from offering proceeds or borrowings, which may constitute a return of capital and reduce the amount of capital available to the Company for investment. Any capital returned to stockholders through distributions will be distributed after payment of fees and expenses.
The Company’s previous distributions to stockholders were funded from temporary Expense Support Reimbursements that are subject to repayment to SIC Advisors. These distributions were not based on our investment performance and may not continue in the future. If SIC Advisors had not agreed to make Expense Support Reimbursements, these distributions would have come from paid in capital. The reimbursement of these payments owed to SIC Advisors will reduce the future distributions to which stockholders would otherwise be entitled.
The determination of the tax attributes (i.e., paid from ordinary income, paid from net capital gains on the sale of securities, and/or a return of paid-in-capital surplus which is a nontaxable distribution) of distributions is made annually as of the end of the Company’s fiscal year based upon its taxable income for the full year and distributions paid for the full year.
F-36
Table of Contents
Share Repurchase Program
In June 2013, the Company commenced a share repurchase program pursuant to which it intends to conduct quarterly share repurchases, of up to 2.5% of the weighted average number of outstanding shares in any 3-month period or 10% of the weighted average number of outstanding shares in any 12-month period. The purpose of the share repurchase program is to allow stockholders to sell their shares back to the Company at a price equal to the most recently disclosed net asset value per share of the Company’s common stock immediately prior to the date of repurchase. Shares will be purchased from stockholders participating in the program on a pro rata basis. Unless the Company’s board of directors determines otherwise, the number of shares to be repurchased during any calendar year will be limited to the proceeds received in association with the sale of shares of common stock under the distribution reinvestment plan.
On June 4, 2013, the Company offered to repurchase up to 16,652 shares at a price per share of $9.18, which represented the Company’s net asset value per share as of March 31, 2013. No stockholders elected to participate in this quarterly repurchase, and the Company did not purchase any shares.
On August 8, 2013, the Company offered to repurchase up to 32,627 shares at a price per share of $9.13, which represented the Company’s net asset value per share as of June 30, 2013. On September 27, 2013, the Company repurchased 3,642 shares.
On November 7, 2013, the Company offered to repurchase up to 60,966 shares at a price per share of $9.14, which represented the Company’s net asset value per share as of September 30, 2013. On December 19, 2013, the Company repurchased 5,826 shares.
Note 13. Financial Highlights
The following is a schedule of financial highlights of the Company for the year/period ended December 31, 2013 and 2012:
| For the Year Ended December 31, 2013 |
For the Period from April 17, 2012 (commencement of operations) through December 31, 2012 |
|||||||
| Per Share Data:(1) |
||||||||
| Net asset value at beginning of period |
$ | 8.96 | $ | 9.03 | ||||
| Net investment income/(loss) |
0.72 | 0.33 | ||||||
| Net realized gains/(losses) on investments and total return swap |
0.01 | 0.01 | ||||||
| Net unrealized appreciation/(depreciation) on investments and total return swap |
0.12 | (0.01 | ) | |||||
|
|
|
|
|
|||||
| Net increase/(decrease) in net assets |
0.85 | 0.33 | ||||||
| Distributions declared from net investment income(2) |
(0.80 | ) | (0.39 | ) | ||||
| Distributions from net realized capital gains |
— | (0.01 | ) | |||||
|
|
|
|
|
|||||
| Total distributions to stockholders |
(0.80 | ) | (0.40 | ) | ||||
| Issuance of common stock above net asset value(6) |
0.17 | — | ||||||
| Net asset value at end of period |
9.18 | 8.96 | ||||||
| Total return based on net asset value(3)(4) |
11.75 | % | 3.35 | % | ||||
| Portfolio turnover rate |
51.30 | % | 18.86 | % | ||||
| Shares outstanding at end of period |
16,663,500 | 2,300,573 | ||||||
| Net assets at end of period |
153,002,273 | 20,622,982 | ||||||
| Ratio/Supplemental Data: |
||||||||
| Ratio of net investment income/(loss) to average net assets(4) |
7.56 | % | 5.64 | %(5) | ||||
| Ratio of net expenses (including incentive fees) to average net assets(4) |
3.77 | % | 8.58 | %(5) | ||||
| Ratio of incentive fees to average net assets |
0.26 | % | 0.01 | %(5) | ||||
| Supplemental data: |
||||||||
| Ratio of operating expenses to average net assets |
3.59 | % | 24.90 | %(5) | ||||
| Ratio of interest and financing related expenses to average net assets |
0.26 | % | 0.55 | %(5) | ||||
F-37
Table of Contents
| (1) | The per share data was derived by using the weighted average shares outstanding during the year/period ended December 31, 2013 and 2012, which were 7,426,660 and 1,452,160, respectively. |
| (2) | The per share data for distributions is the actual amount of paid distributions per share during the period. |
| (3) | Total annual returns are historical and assume reinvestments of all dividends and distributions at prices obtained under the Company’s dividend reinvestment plan, and no sales charge. |
| (4) | Total returns, ratios of net investment income/(loss), and ratios of net expenses to average net assets for the year/period ended December 31, 2013 and 2012 prior to the effect of the Expense Support and Reimbursement Agreement were as follows: total return 8.88% and (4.00%), ratio of net investment income/(loss): 2.04% and (12.01%) and ratio of net expenses to average net assets: 9.61% and 27.22%, respectively. |
| (5) | Annualized. The period from June 10, 2011 (inception) to April 16, 2012 is not presented as the Company had not commenced operations. |
| (6) | Shares issued under the DRIP (see Note 12) as well as the continuous issuance of shares of common stock may cause on incremental increase/decrease in net asset value per share due to the effect of issuing shares at amounts that differ from the prevailing net asset value at each issuance. |
Note 14. Selected Quarterly Financial Data (unaudited)
| Quarter Ended | ||||||||||||||||
| December 31, 2013 |
September 30, 2013 |
June 30, 2013 |
March 31, 2013 |
|||||||||||||
| Total Investment Income |
$ | 3,393,010 | $ | 2,029,631 | $ | 1,526,284 | $ | 1,058,077 | ||||||||
| Total Investment Income per Common Share |
0.25 | 0.26 | 0.30 | 0.33 | ||||||||||||
| Net Investment Income |
2,029,585 | 1,625,608 | 1,154,119 | 534,233 | ||||||||||||
| Net Investment Income per Common Share |
0.15 | 0.21 | 0.22 | 0.17 | ||||||||||||
| Net Realized and Unrealized Gain (Loss) |
925,855 | (181,452 | ) | (664,116 | ) | 856,954 | ||||||||||
| Net Realized and Unrealized Gain (Loss) per Common Share |
0.07 | (0.02 | ) | (0.13 | ) | 0.27 | ||||||||||
| Net Increase (Decrease) in Net Assets Resulting from Operations |
2,955,440 | 1,444,156 | 490,003 | 1,391,187 | ||||||||||||
| Basic and Diluted Earnings (Loss) per Common Share |
0.22 | 0.18 | 0.09 | 0.43 | ||||||||||||
| Net Asset Value per Common Share at End of Quarter |
9.18 | 9.14 | 9.13 | 9.18 | ||||||||||||
| For the Period from April 17, 2012 (commencement of operations) to December 31, 2012 |
||||
| Total Investment Income |
$ | 1,235,116 | ||
| Total Investment Income per Common Share |
1.20 | |||
| Net Investment Income |
490,032 | |||
| Net Investment Income per Common Share |
0.48 | |||
| Net Realized and Unrealized Gain (Loss) |
3,138 | |||
| Net Realized and Unrealized Gain (Loss) per Common Share |
0.00 | * | ||
| Net Increase (Decrease) in Net Assets Resulting from Operations |
493,170 | |||
| Basic and Diluted Earnings (Loss) per Common Share |
0.48 | |||
| Net Asset Value per Common Share at End of Quarter |
8.96 | |||
| * | Rounds to less than $0.01 per share |
Note 15. Subsequent Events
Management has evaluated subsequent events through the date of issuance of the consolidated financial statements included herein. There have been no subsequent events that occurred during such period that would require disclosure in this Form 10-K or would be required to be recognized in the consolidated financial statements as of and for the year ended December 31, 2013, except as disclosed below.
The Company issued common shares and received gross proceeds of approximately $58.2 million subsequent to December 31, 2013.
F-38
Table of Contents
| Item 9: | Changes in and Disagreements with Accountants on Accounting and Financial Disclosure |
None.
| Item 9A. | Controls and Procedures |
Disclosure Controls
In accordance with Rules 13a-15(b) and 15d-15(b) of the Securities Exchange Act of 1934, as amended (the “Exchange Act”), we, under the supervision and with the participation of our Chief Executive Officer and Chief Financial Officer, carried out an evaluation of the effectiveness of our disclosure controls and procedures (as defined in Rule 13a-15(e) and Rule 15d-15(e) of the Exchange Act) as of the end of the period covered by this Annual Report on Form 10-K and determined that the disclosure controls and procedures are effective.
Change In Internal Control Over Financial Reporting
No change occurred in our internal control over financial reporting (as defined in Rule 13a-15(f) and 15d-15(f) of the Exchange Act) during the year ended December 31, 2013 that has materially affected, or is reasonably likely to materially affect, our internal control over financial reporting.
| Item 9B. | Other Information |
None.
| Item 10. | Directors, Executive Officers and Corporate Governance |
The information required by Item 10 is hereby incorporated by reference from our definitive Proxy statement relating to our 2014 Annual Meeting of Stockholders, to be filed with the Securities and Exchange Commission within 120 days following the end of our fiscal year.
| Item 11. | Executive Compensation |
The information required by Item 11 is hereby incorporated by reference from our definitive Proxy Statement relating to our 2014 Annual Meeting of Stockholders, to be filed with the Securities and Exchange Commission within 120 days following the end of our fiscal year.
| Item 12. | Security Ownership of Certain Beneficial Owners and Management and Related Stockholder Matters |
The information required by Item 12 is hereby incorporated by reference from our definitive Proxy Statement relating to our 2014 Annual Meeting of Stockholders, to be filed with the Securities and Exchange Commission within 120 days following the end of our fiscal year.
| Item 13. | Certain Relationships and Related Transactions, and Director Independence |
The information required by Item 13 is hereby incorporated by reference from our definitive Proxy Statement relating to our 2014 Annual Meeting of Stockholders, to be filed with the Securities and Exchange Commission within 120 days following the end of our fiscal year.
80
Table of Contents
| Item 14. | Principal Accountant Fees and Services |
The information required by Item 14 is hereby incorporated by reference from our definitive Proxy Statement relating to our 2014 Annual Meeting of Stockholders, to be filed with the Securities and Exchange Commission within 120 days following the end of our fiscal year.
| Item 15. | Exhibits and Financial Statement Schedules |
| a. | The following documents are filed as part of this Annual Report: |
The following consolidated financial statements are set forth in Item 8:
| b. | Exhibits |
The following exhibits are filed as part of this report or hereby incorporated by reference to exhibits previously filed with the SEC:
| 24 | Power of Attorney (included on the signature page hereto) | |
| 31.1 | Certification by Chief Executive Officer pursuant to Exchange Act Rule 13a-14(a), as adopted pursuant to Section 302 of the Sarbanes-Oxley Act of 2002 | |
| 31.2 | Certification by Chief Financial Officer pursuant to Exchange Act Rule 13a-14(a), as adopted pursuant to Section 302 of the Sarbanes-Oxley Act of 2002 | |
| 32.1 | Certification pursuant to 18 U.S.C. Section 1350, as adopted pursuant to Section 906 of the Sarbanes-Oxley Act of 2002. | |
81
Table of Contents
Pursuant to the requirements Section 13 or 15(d) of the Securities Exchange Act of 1934, the registrant has duly caused this Annual Report on Form 10-K to be signed on its behalf by the undersigned thereunto duly authorized.
| Dated: March 13, 2014 | Sierra Income Corporation. | |||||
| By
|
/s/ Seth Taube | |||||
| Seth Taube Chief Executive Officer (Principal Executive Officer) | ||||||
| By
|
/s/ Richard T. Allorto, Jr. | |||||
| Richard T. Allorto, Jr. Chief Financial Officer (Principal Accounting and Financial Officer) | ||||||
POWER OF ATTORNEY
KNOW ALL MEN BY THESE PRESENTS, that each person whose signature appears below constitutes and appoints Richard T. Allorto, Jr. and Seth Taube as his true and lawful attorneys-in-fact, each with full power substitution, for him in any and all capacities, to sign any amendments to this Annual Report on Form 10-K and to file the same, with exhibits thereto and other documents in connection therewith, with the Securities and Exchange Commission, hereby ratifying and confirming all that each of said attorneys-in-fact or their substitute or substitutes may do or case to be done by virtue hereof.
Pursuant to the requirements of the Securities Exchange Act of 1934, this Annual Report on Form 10-K has been signed below by the following persons on behalf of the registrant and in the capacities and on the dates indicated.
| Signature |
Title |
Date | ||
| /s/ Seth Taube | Chief Executive Officer and Chairman of the Board of Directors (Principal Executive Officer) | March 13, 2014 | ||
| /s/ Richard T. Allorto, Jr. | Chief Financial Officer (Principal Financial and Accounting Officer) | March 13, 2014 | ||
| /s/ Brook Taube | Director | March 13, 2014 | ||
| /s/ Spencer Neumann | Director | March 13, 2014 | ||
| /s/ Valerie Lancaster Beal | Director | March 13, 2014 | ||
| /s/ Steve Byers | Director | March 13, 2014 | ||
82