Attached files
| file | filename |
|---|---|
| 8-K - 8-K - Nationstar Mortgage Holdings Inc. | a8-k2x14investorconfpres.htm |

Investor Presentation February 2014 Financial data as of December 31, 2013
Disclaimers 1 Forward Looking Statements Any statements in this presentation that are not historical or current facts are forward-looking statements. These forward-looking statements include, but are not limited to, statements regarding: our financial performance for the fiscal year-ended 2013; our future performance in a rising rate environment; estimates of our growth and increased profitability in 2014; opportunities within our servicing portfolio, including amount of prepayments, recapture rates and sales opportunities; our operational and expense initiatives in our originations segment; and 2014 guidance. Forward-looking statements involve known and unknown risks, uncertainties and other factors that may cause our actual results, performance, or achievements to be materially different from any future results, performances or achievements expressed or implied by the forward-statements. Certain of these risks and uncertainties are described in the “Risk Factors” section of our most recent annual and quarterly reports and other required reports as filed with the SEC, which are available at the SEC’s website at http://www.sec.gov. Certain amounts included in this presentation are presented strictly for illustrative purposes, and such amounts should not be viewed as a representation regarding management’s expectations or actual results. Management’s expectations and actual results could differ materially from statements made for illustrative purposes. No reliance, no update and use of information. The information in the presentation is provided to you as of February 12, 2014, and Nationstar does not intend to update the information after its distribution, even in the event that the information becomes materially inaccurate. Certain information contained in this presentation includes calculations or figures that have been prepared internally and have not been audited or verified by a third party. Use of different methods for preparing, calculating or presenting information may lead to different results and such differences may be material. Non-GAAP measures. This presentation contains certain disclosures about pro forma cash, pro forma net income, pro forma EPS, and AEBITDA per share, each of which are considered non-GAAP performance measures. Our management believes that the use of pro forma cash, pro forma net income provide key performance metrics useful for evaluating operating performance and assessing the profitability of our core business. Our management further believes that the use of pro-forma EPS and AEBITDA per share provides additional relevant information for comparison of current earnings per share to that of prior periods. Preliminary Estimated Results This presentation contains preliminary estimated unaudited financial results for the three months and year ended as of December 31, 2013. Estimates of results are inherently uncertain and subject to change, and we undertake no obligation to update this information. The estimates contained in this presentation may differ from actual results. This data has been prepared by, and is the responsibility of, management based on a number of assumptions and has not been reviewed or audited by our independent registered public accounting firm. These estimates should not be viewed as a substitute for full financial statements prepared in accordance with GAAP. During the course of the preparation of the financial statements and related notes and our year-end audit, additional items that would require material adjustments to the preliminary financial information may be identified.
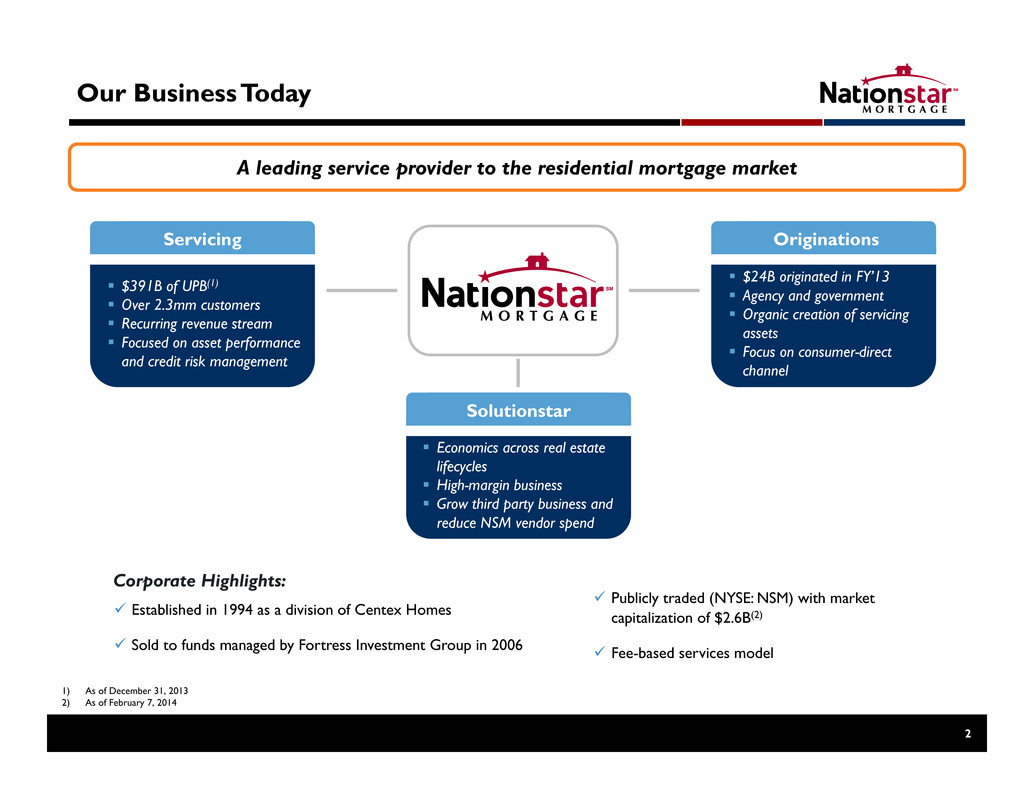
Our Business Today 1) As of December 31, 2013 2) As of February 7, 2014 $24B originated in FY’13 Agency and government Organic creation of servicing assets Focus on consumer-direct channel $391B of UPB(1) Over 2.3mm customers Recurring revenue stream Focused on asset performance and credit risk management Servicing Originations 2 A leading service provider to the residential mortgage market Economics across real estate lifecycles High-margin business Grow third party business and reduce NSM vendor spend Solutionstar Corporate Highlights: Established in 1994 as a division of Centex Homes Sold to funds managed by Fortress Investment Group in 2006 Publicly traded (NYSE: NSM) with market capitalization of $2.6B(2) Fee-based services model
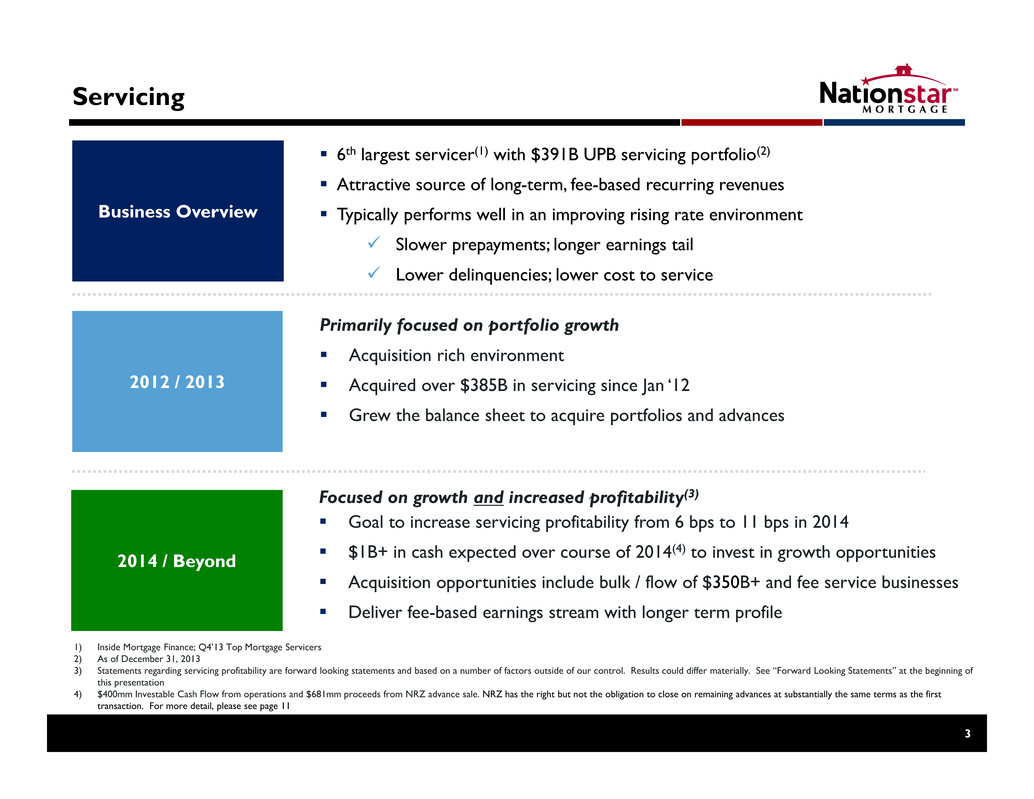
Servicing Business Overview 2012 / 2013 2014 / Beyond Primarily focused on portfolio growth Acquisition rich environment Acquired over $385B in servicing since Jan ‘12 Grew the balance sheet to acquire portfolios and advances Focused on growth and increased profitability(3) Goal to increase servicing profitability from 6 bps to 11 bps in 2014 $1B+ in cash expected over course of 2014(4) to invest in growth opportunities Acquisition opportunities include bulk / flow of $350B+ and fee service businesses Deliver fee-based earnings stream with longer term profile 6th largest servicer(1) with $391B UPB servicing portfolio(2) Attractive source of long-term, fee-based recurring revenues Typically performs well in an improving rising rate environment Slower prepayments; longer earnings tail Lower delinquencies; lower cost to service 3 1) Inside Mortgage Finance; Q4’13 Top Mortgage Servicers 2) As of December 31, 2013 3) Statements regarding servicing profitability are forward looking statements and based on a number of factors outside of our control. Results could differ materially. See “Forward Looking Statements” at the beginning of this presentation 4) $400mm Investable Cash Flow from operations and $681mm proceeds from NRZ advance sale. NRZ has the right but not the obligation to close on remaining advances at substantially the same terms as the first transaction. For more detail, please see page 11
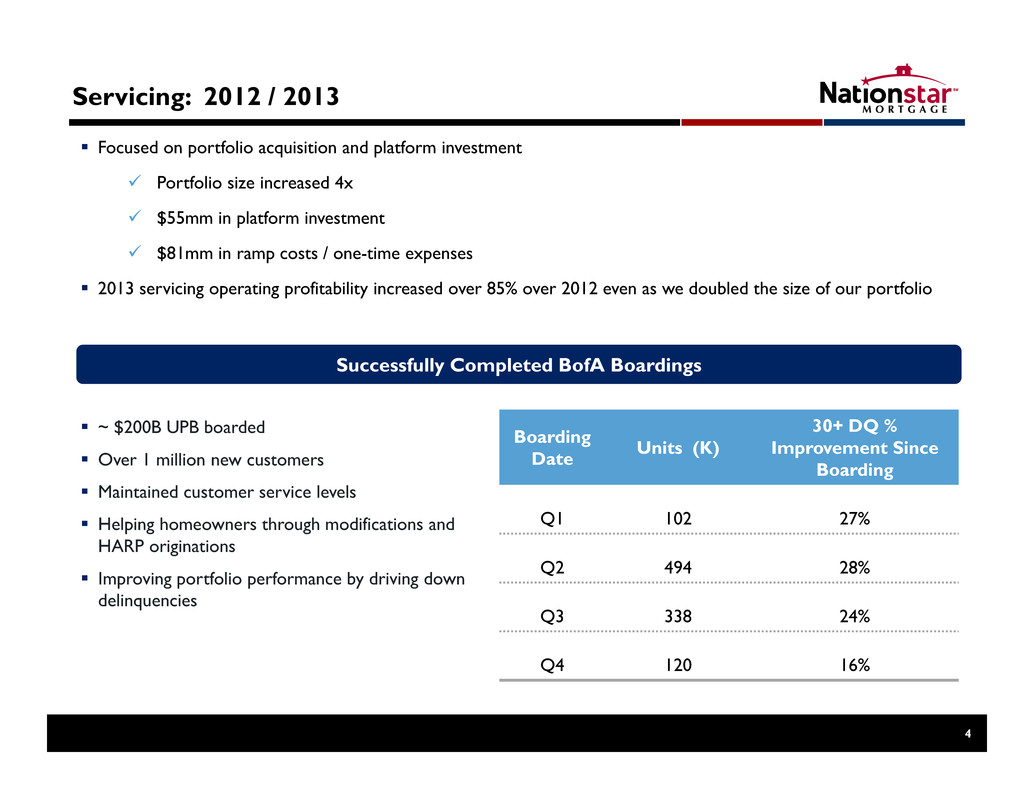
Servicing: 2012 / 2013 Focused on portfolio acquisition and platform investment Portfolio size increased 4x $55mm in platform investment $81mm in ramp costs / one-time expenses 2013 servicing operating profitability increased over 85% over 2012 even as we doubled the size of our portfolio 4 Boarding Date Units (K) 30+ DQ % Improvement Since Boarding Q1 102 27% Q2 494 28% Q3 338 24% Q4 120 16% ~ $200B UPB boarded Over 1 million new customers Maintained customer service levels Helping homeowners through modifications and HARP originations Improving portfolio performance by driving down delinquencies Successfully Completed BofA Boardings
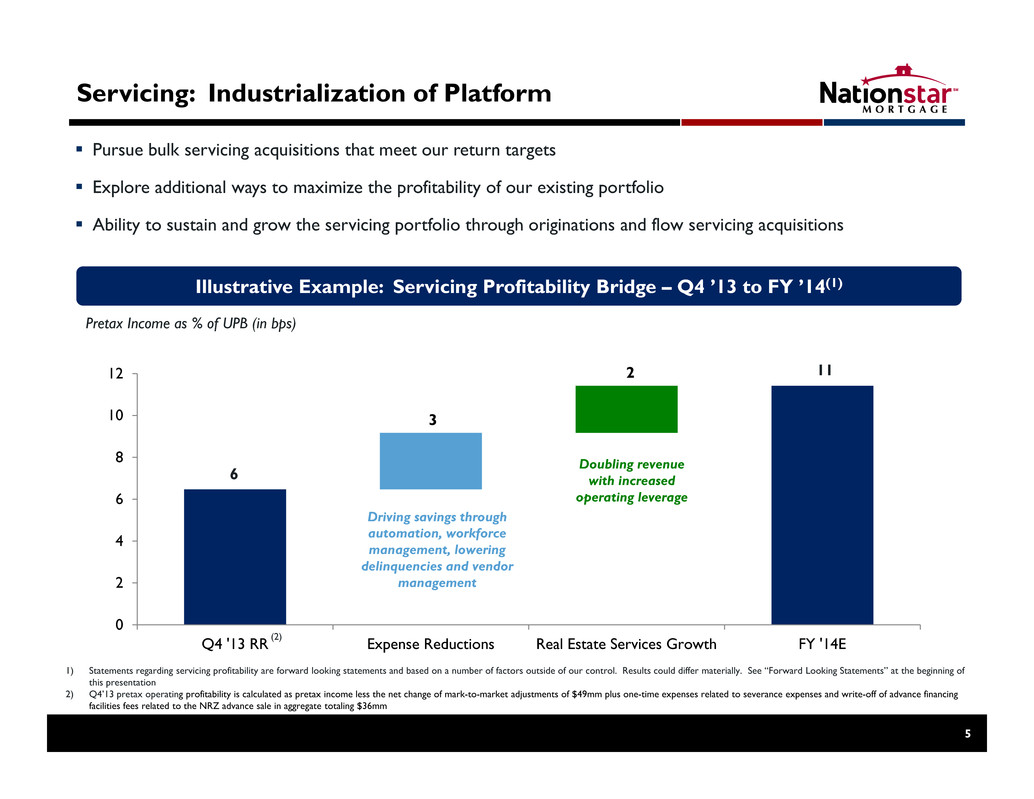
Pursue bulk servicing acquisitions that meet our return targets Explore additional ways to maximize the profitability of our existing portfolio Ability to sustain and grow the servicing portfolio through originations and flow servicing acquisitions Servicing: Industrialization of Platform 5 3 2 0 2 4 6 8 10 12 Q4 '13 RR Expense Reductions Real Estate Services Growth FY '14E Illustrative Example: Servicing Profitability Bridge – Q4 ’13 to FY ’14(1) Pretax Income as % of UPB (in bps) 6 11 Doubling revenue with increased operating leverage Driving savings through automation, workforce management, lowering delinquencies and vendor management 1) Statements regarding servicing profitability are forward looking statements and based on a number of factors outside of our control. Results could differ materially. See “Forward Looking Statements” at the beginning of this presentation 2) Q4’13 pretax operating profitability is calculated as pretax income less the net change of mark-to-market adjustments of $49mm plus one-time expenses related to severance expenses and write-off of advance financing facilities fees related to the NRZ advance sale in aggregate totaling $36mm (2)
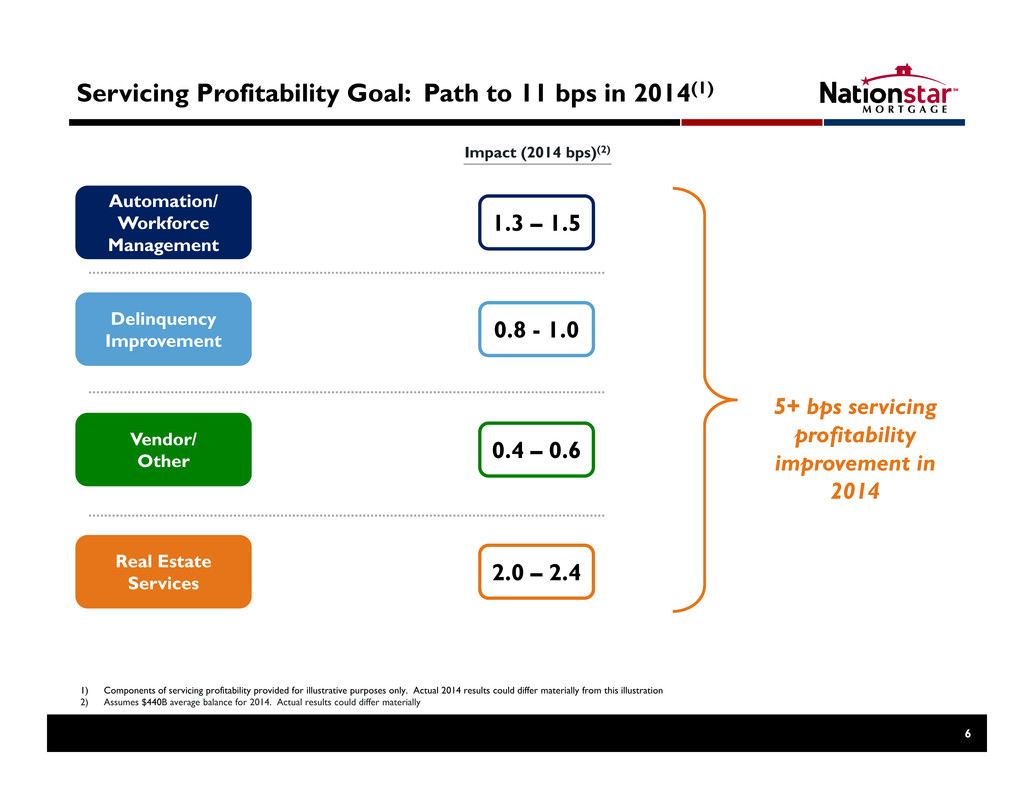
Servicing Profitability Goal: Path to 11 bps in 2014(1) 6 Automation/ Workforce Management Delinquency Improvement Vendor/ Other Real Estate Services Impact (2014 bps)(2) 1.3 – 1.5 0.8 - 1.0 0.4 – 0.6 2.0 – 2.4 5+ bps servicing profitability improvement in 2014 1) Components of servicing profitability provided for illustrative purposes only. Actual 2014 results could differ materially from this illustration 2) Assumes $440B average balance for 2014. Actual results could differ materially
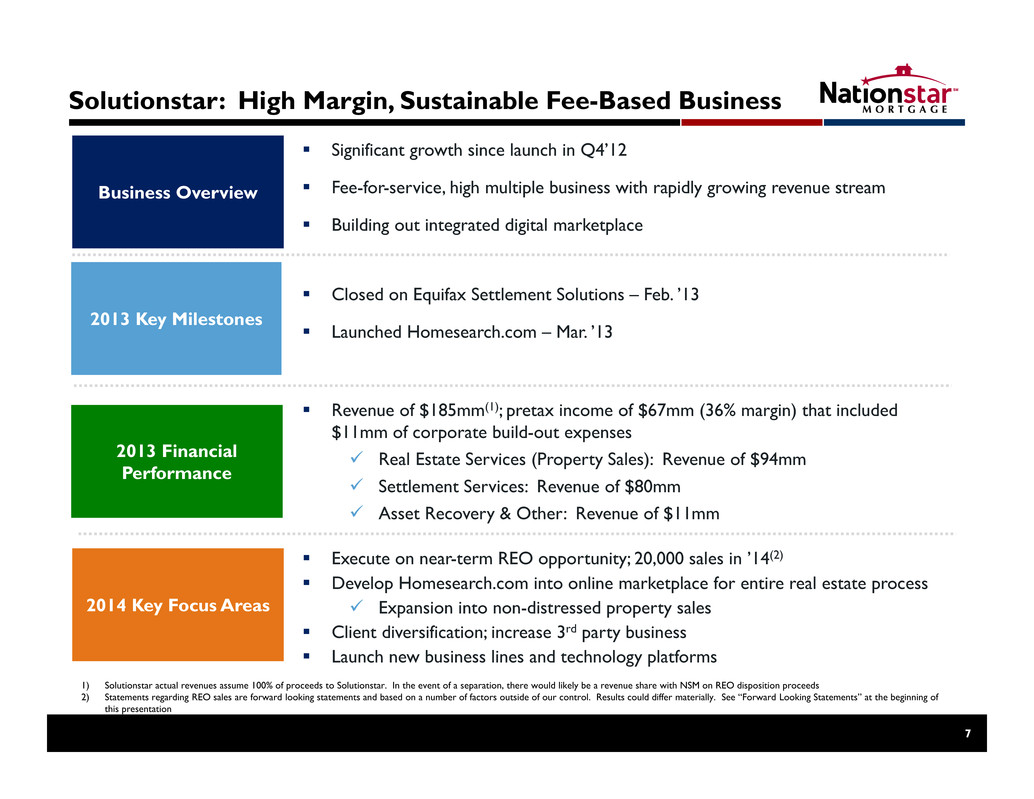
Solutionstar: High Margin, Sustainable Fee-Based Business 7 Closed on Equifax Settlement Solutions – Feb. ’13 Launched Homesearch.com – Mar. ’13 Execute on near-term REO opportunity; 20,000 sales in ’14(2) Develop Homesearch.com into online marketplace for entire real estate process Expansion into non-distressed property sales Client diversification; increase 3rd party business Launch new business lines and technology platforms Revenue of $185mm(1); pretax income of $67mm (36% margin) that included $11mm of corporate build-out expenses Real Estate Services (Property Sales): Revenue of $94mm Settlement Services: Revenue of $80mm Asset Recovery & Other: Revenue of $11mm Business Overview 2013 Key Milestones 2013 Financial Performance 2014 Key Focus Areas Significant growth since launch in Q4’12 Fee-for-service, high multiple business with rapidly growing revenue stream Building out integrated digital marketplace 1) Solutionstar actual revenues assume 100% of proceeds to Solutionstar. In the event of a separation, there would likely be a revenue share with NSM on REO disposition proceeds 2) Statements regarding REO sales are forward looking statements and based on a number of factors outside of our control. Results could differ materially. See “Forward Looking Statements” at the beginning of this presentation
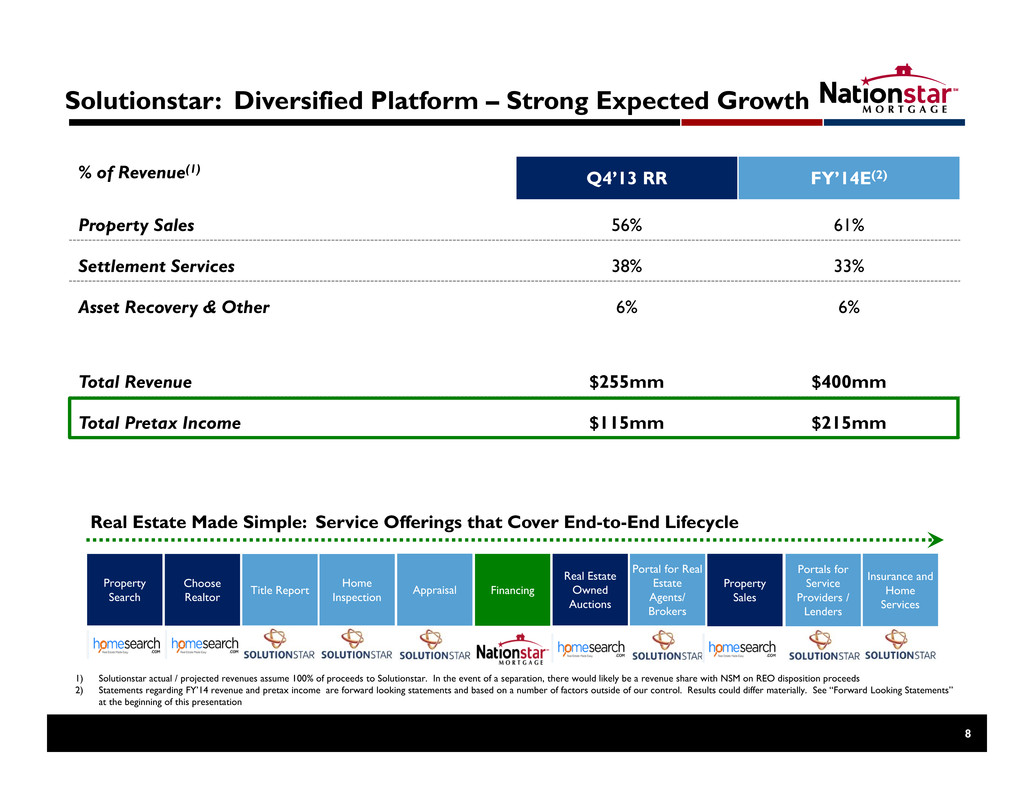
Solutionstar: Diversified Platform – Strong Expected Growth 8 % of Revenue(1) Q4’13 RR FY’14E(2) Property Sales 56% 61% Settlement Services 38% 33% Asset Recovery & Other 6% 6% Total Revenue $255mm $400mm Total Pretax Income $115mm $215mm 1) Solutionstar actual / projected revenues assume 100% of proceeds to Solutionstar. In the event of a separation, there would likely be a revenue share with NSM on REO disposition proceeds 2) Statements regarding FY’14 revenue and pretax income are forward looking statements and based on a number of factors outside of our control. Results could differ materially. See “Forward Looking Statements” at the beginning of this presentation Property Search Choose Realtor Title Report Home Inspection Real Estate Owned Auctions Portal for Real Estate Agents/ Brokers Insurance and Home Services Property Sales Portals for Service Providers / Lenders Real Estate Made Simple: Service Offerings that Cover End-to-End Lifecycle Appraisal Financing
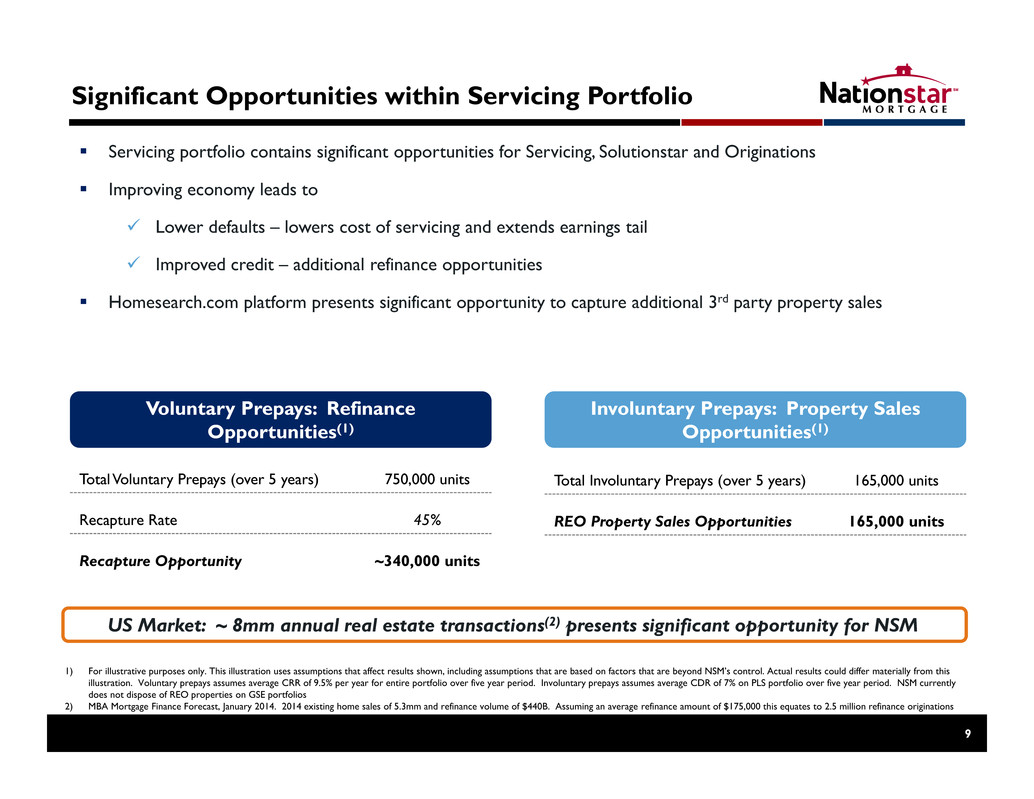
Significant Opportunities within Servicing Portfolio 1) For illustrative purposes only. This illustration uses assumptions that affect results shown, including assumptions that are based on factors that are beyond NSM’s control. Actual results could differ materially from this illustration. Voluntary prepays assumes average CRR of 9.5% per year for entire portfolio over five year period. Involuntary prepays assumes average CDR of 7% on PLS portfolio over five year period. NSM currently does not dispose of REO properties on GSE portfolios 2) MBA Mortgage Finance Forecast, January 2014. 2014 existing home sales of 5.3mm and refinance volume of $440B. Assuming an average refinance amount of $175,000 this equates to 2.5 million refinance originations 9 Servicing portfolio contains significant opportunities for Servicing, Solutionstar and Originations Improving economy leads to Lower defaults – lowers cost of servicing and extends earnings tail Improved credit – additional refinance opportunities Homesearch.com platform presents significant opportunity to capture additional 3rd party property sales Voluntary Prepays: Refinance Opportunities(1) Involuntary Prepays: Property Sales Opportunities(1) Total Voluntary Prepays (over 5 years)over 750,000 units Recapture Rate 45% Recapture Opportunity ~340,000 units Total Involuntary Prepays (over 5 years) 165,000 units REO Property Sales Opportunities 165,000 units US Market: ~ 8mm annual real estate transactions(2) presents significant opportunity for NSM
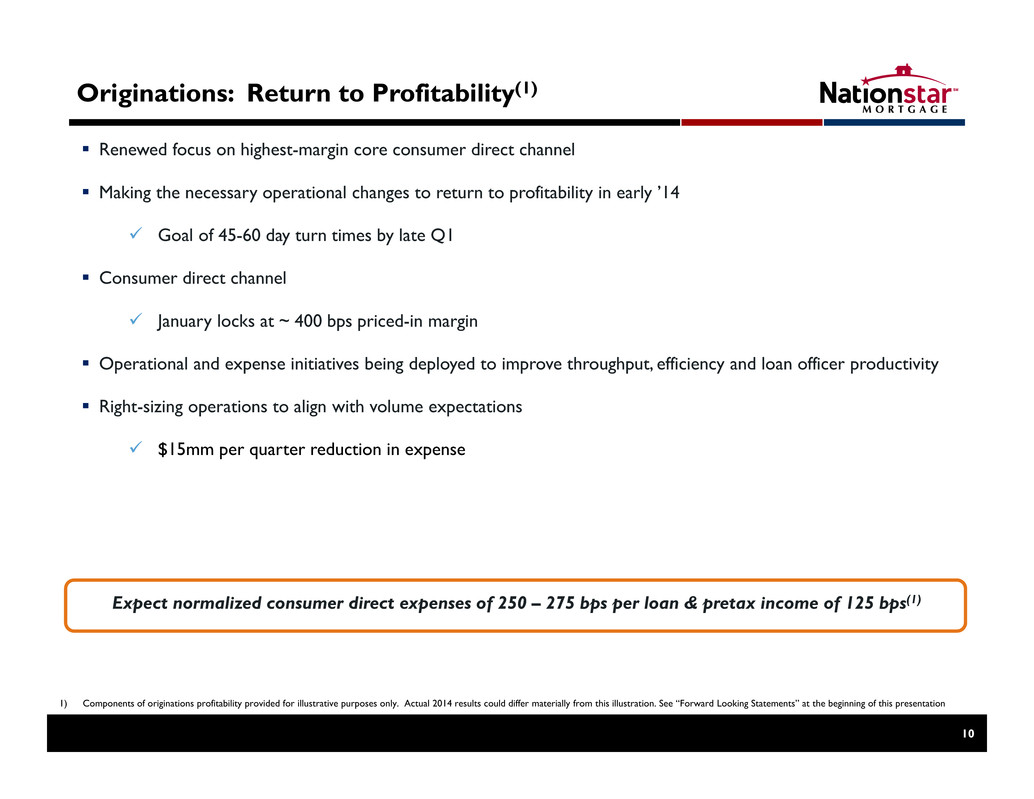
Originations: Return to Profitability(1) 10 Renewed focus on highest-margin core consumer direct channel Making the necessary operational changes to return to profitability in early ’14 Goal of 45-60 day turn times by late Q1 Consumer direct channel January locks at ~ 400 bps priced-in margin Operational and expense initiatives being deployed to improve throughput, efficiency and loan officer productivity Right-sizing operations to align with volume expectations $15mm per quarter reduction in expense Expect normalized consumer direct expenses of 250 – 275 bps per loan & pretax income of 125 bps(1) 1) Components of originations profitability provided for illustrative purposes only. Actual 2014 results could differ materially from this illustration. See “Forward Looking Statements” at the beginning of this presentation
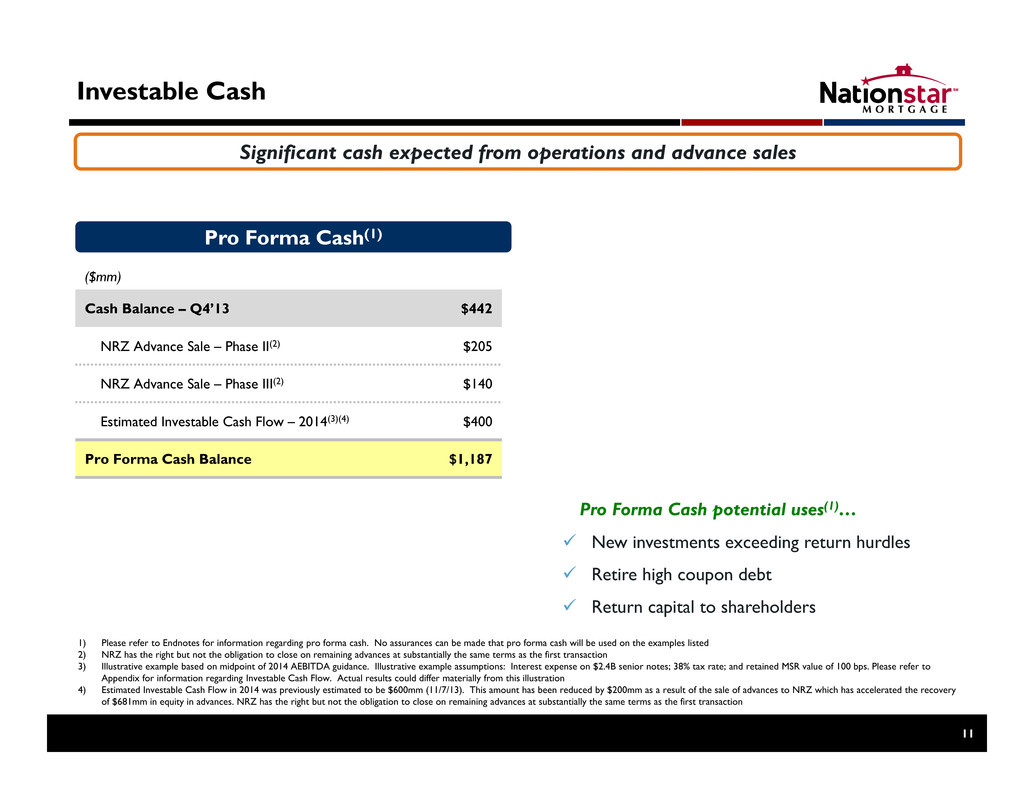
Investable Cash 1) Please refer to Endnotes for information regarding pro forma cash. No assurances can be made that pro forma cash will be used on the examples listed 2) NRZ has the right but not the obligation to close on remaining advances at substantially the same terms as the first transaction 3) Illustrative example based on midpoint of 2014 AEBITDA guidance. Illustrative example assumptions: Interest expense on $2.4B senior notes; 38% tax rate; and retained MSR value of 100 bps. Please refer to Appendix for information regarding Investable Cash Flow. Actual results could differ materially from this illustration 4) Estimated Investable Cash Flow in 2014 was previously estimated to be $600mm (11/7/13). This amount has been reduced by $200mm as a result of the sale of advances to NRZ which has accelerated the recovery of $681mm in equity in advances. NRZ has the right but not the obligation to close on remaining advances at substantially the same terms as the first transaction 11 New investments exceeding return hurdles Retire high coupon debt Return capital to shareholders Pro Forma Cash potential uses(1)… ($mm) Cash Balance – Q4’13 $442 NRZ Advance Sale – Phase II(2) $205 NRZ Advance Sale – Phase III(2) $140 Estimated Investable Cash Flow – 2014(3)(4) $400 Pro Forma Cash Balance $1,187 Pro Forma Cash(1) Significant cash expected from operations and advance sales
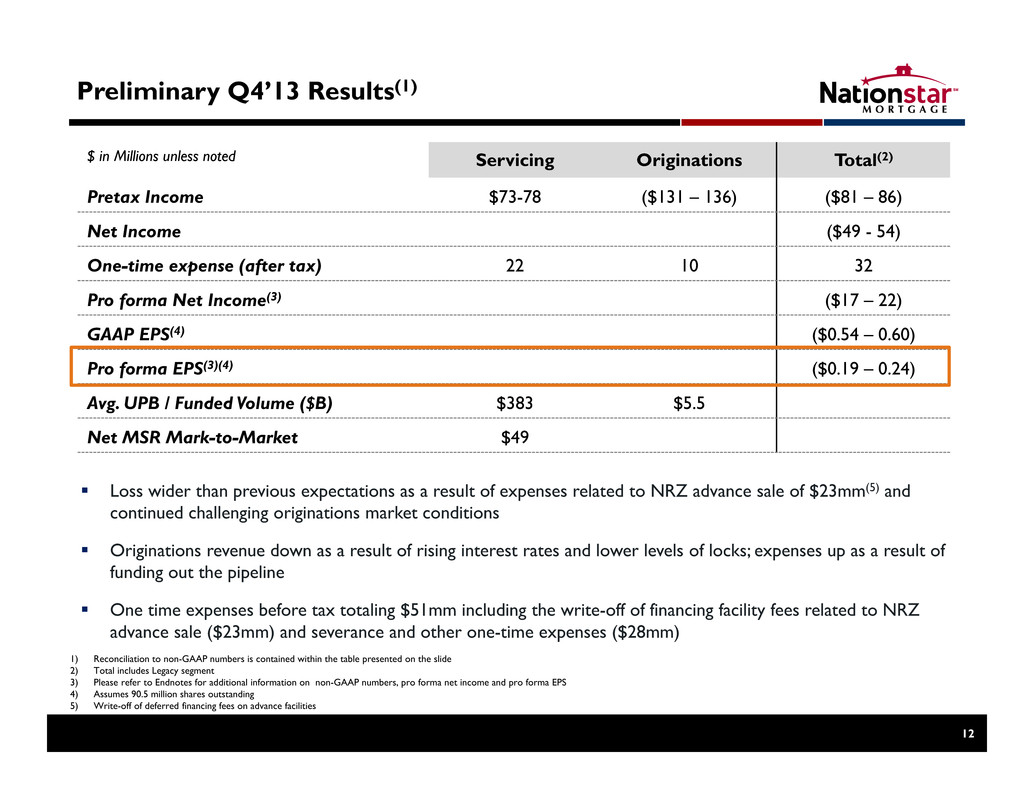
Preliminary Q4’13 Results(1) 12 Loss wider than previous expectations as a result of expenses related to NRZ advance sale of $23mm(5) and continued challenging originations market conditions Originations revenue down as a result of rising interest rates and lower levels of locks; expenses up as a result of funding out the pipeline One time expenses before tax totaling $51mm including the write-off of financing facility fees related to NRZ advance sale ($23mm) and severance and other one-time expenses ($28mm) 1) Reconciliation to non-GAAP numbers is contained within the table presented on the slide 2) Total includes Legacy segment 3) Please refer to Endnotes for additional information on non-GAAP numbers, pro forma net income and pro forma EPS 4) Assumes 90.5 million shares outstanding 5) Write-off of deferred financing fees on advance facilities $ in Millions unless noted Servicing Originations Total(2) Pretax Income $73-78 ($131 – 136) ($81 – 86) Net Income ($49 - 54) One-time expense (after tax) 22 10 32 Pro forma Net Income(3) ($17 – 22) GAAP EPS(4) ($0.54 – 0.60) Pro forma EPS(3)(4) ($0.19 – 0.24) Avg. UPB / Funded Volume ($B) $383 $5.5 Net MSR Mark-to-Market $49
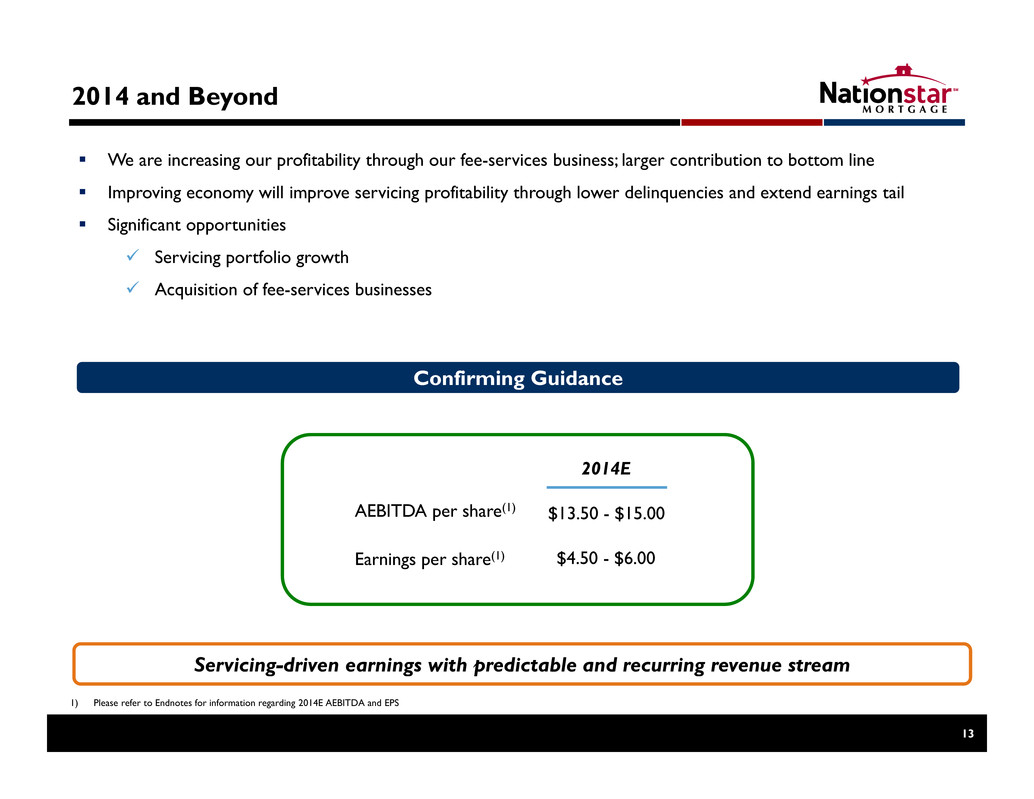
2014 and Beyond 13 2014E AEBITDA per share(1) Earnings per share(1) $13.50 - $15.00 $4.50 - $6.00 Servicing-driven earnings with predictable and recurring revenue stream 1) Please refer to Endnotes for information regarding 2014E AEBITDA and EPS We are increasing our profitability through our fee-services business; larger contribution to bottom line Improving economy will improve servicing profitability through lower delinquencies and extend earnings tail Significant opportunities Servicing portfolio growth Acquisition of fee-services businesses Confirming Guidance
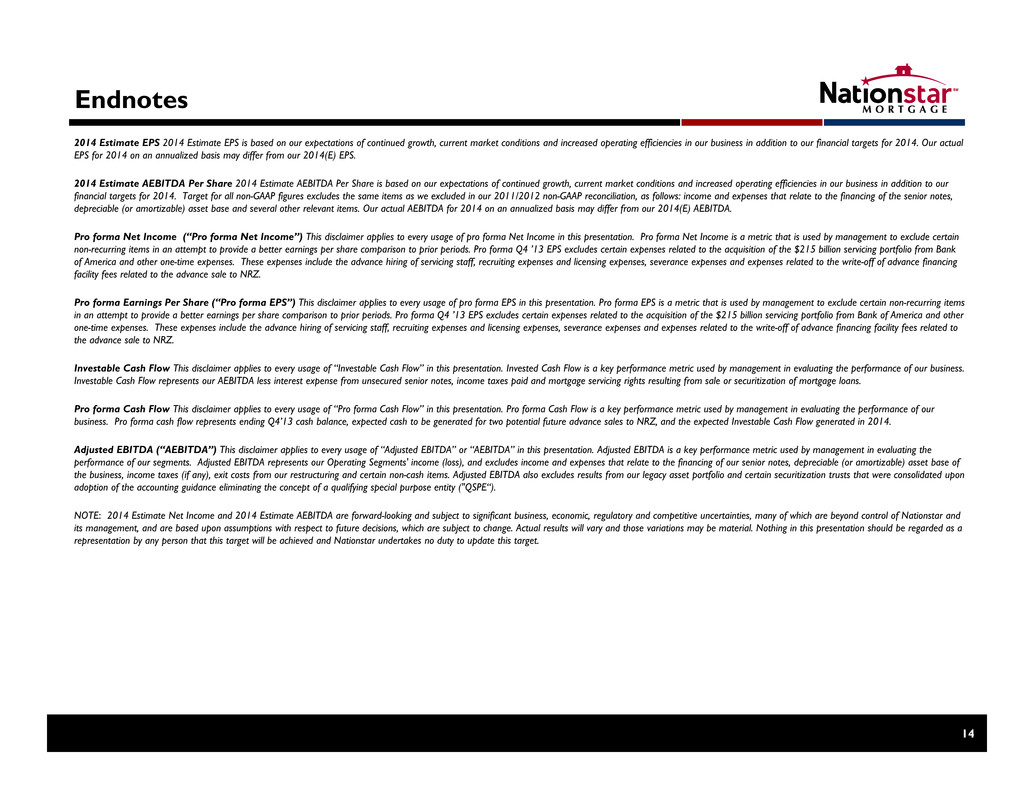
Endnotes 2014 Estimate EPS 2014 Estimate EPS is based on our expectations of continued growth, current market conditions and increased operating efficiencies in our business in addition to our financial targets for 2014. Our actual EPS for 2014 on an annualized basis may differ from our 2014(E) EPS. 2014 Estimate AEBITDA Per Share 2014 Estimate AEBITDA Per Share is based on our expectations of continued growth, current market conditions and increased operating efficiencies in our business in addition to our financial targets for 2014. Target for all non-GAAP figures excludes the same items as we excluded in our 2011/2012 non-GAAP reconciliation, as follows: income and expenses that relate to the financing of the senior notes, depreciable (or amortizable) asset base and several other relevant items. Our actual AEBITDA for 2014 on an annualized basis may differ from our 2014(E) AEBITDA. Pro forma Net Income (“Pro forma Net Income”) This disclaimer applies to every usage of pro forma Net Income in this presentation. Pro forma Net Income is a metric that is used by management to exclude certain non-recurring items in an attempt to provide a better earnings per share comparison to prior periods. Pro forma Q4 ’13 EPS excludes certain expenses related to the acquisition of the $215 billion servicing portfolio from Bank of America and other one-time expenses. These expenses include the advance hiring of servicing staff, recruiting expenses and licensing expenses, severance expenses and expenses related to the write-off of advance financing facility fees related to the advance sale to NRZ. Pro forma Earnings Per Share (“Pro forma EPS”) This disclaimer applies to every usage of pro forma EPS in this presentation. Pro forma EPS is a metric that is used by management to exclude certain non-recurring items in an attempt to provide a better earnings per share comparison to prior periods. Pro forma Q4 ’13 EPS excludes certain expenses related to the acquisition of the $215 billion servicing portfolio from Bank of America and other one-time expenses. These expenses include the advance hiring of servicing staff, recruiting expenses and licensing expenses, severance expenses and expenses related to the write-off of advance financing facility fees related to the advance sale to NRZ. Investable Cash Flow This disclaimer applies to every usage of “Investable Cash Flow” in this presentation. Invested Cash Flow is a key performance metric used by management in evaluating the performance of our business. Investable Cash Flow represents our AEBITDA less interest expense from unsecured senior notes, income taxes paid and mortgage servicing rights resulting from sale or securitization of mortgage loans. Pro forma Cash Flow This disclaimer applies to every usage of “Pro forma Cash Flow” in this presentation. Pro forma Cash Flow is a key performance metric used by management in evaluating the performance of our business. Pro forma cash flow represents ending Q4’13 cash balance, expected cash to be generated for two potential future advance sales to NRZ, and the expected Investable Cash Flow generated in 2014. Adjusted EBITDA (“AEBITDA”) This disclaimer applies to every usage of “Adjusted EBITDA” or “AEBITDA” in this presentation. Adjusted EBITDA is a key performance metric used by management in evaluating the performance of our segments. Adjusted EBITDA represents our Operating Segments' income (loss), and excludes income and expenses that relate to the financing of our senior notes, depreciable (or amortizable) asset base of the business, income taxes (if any), exit costs from our restructuring and certain non-cash items. Adjusted EBITDA also excludes results from our legacy asset portfolio and certain securitization trusts that were consolidated upon adoption of the accounting guidance eliminating the concept of a qualifying special purpose entity ("QSPE“). NOTE: 2014 Estimate Net Income and 2014 Estimate AEBITDA are forward-looking and subject to significant business, economic, regulatory and competitive uncertainties, many of which are beyond control of Nationstar and its management, and are based upon assumptions with respect to future decisions, which are subject to change. Actual results will vary and those variations may be material. Nothing in this presentation should be regarded as a representation by any person that this target will be achieved and Nationstar undertakes no duty to update this target. 14
