Attached files
| file | filename |
|---|---|
| 8-K - FORM 8-K - Arlington Asset Investment Corp. | v367947_8k.htm |
Investor Presentation February 11, 2014
1 Information Related to Forward - Looking Statements This presentation contains “forward - looking statements” within the meaning of the Private Securities Litigation Reform Act of 19 95. These include statements regarding future results or expectations. Forward - looking statements can be identified by forward - looking la nguage, including words such as “believes,” “anticipates,” “views,” “expects,” “estimates,” “intends,” “may,” “plans,” “projects,” “p ote ntial,” “prospective,” “will” and similar expressions, or the negative of these words. Such forward - looking statements are based on fact s and conditions as they exist at the time such statements are made. Forward - looking statements are also based on predictions as to f uture facts and conditions, the accurate prediction of which may be difficult and involve the assessment of events beyond our control. Forwa rd - looking statements are further based on various operating and return assumptions. Caution must be exercised in relying on forward - lookin g statements. Due to known and unknown risks, actual results may differ materially from expectations or projections. You should carefully consider these risks when you make a decision concerning an investment in our common stock or senior not es , along with the following factors, among others, that may cause our actual results to differ materially from those described in any for ward - looking statements: availability of, and our ability to deploy, capital; grow our business primarily through a strategy focused on ac qui ring primarily private - label MBS and agency - backed MBS; yields on MBS; investing in assets other than MBS or pursuing business activities other than investing in MBS; our ability to successfully implement our hedging strategy; our ability to realize reflation on our assets; ou r ability to effectively migrate private - label MBS to agency - backed MBS; the credit performance of our private - label MBS; our ability to pote ntially realize a higher return on capital reallocated to agency - backed MBS; current conditions and adverse developments in the resident ial mortgage market and the overall economy; job growth; home price stabilization; potential risk attributable to our mortgage - related portfo lios; impacts of regulatory changes, including actions taken by the SEC, the U.S. Federal Reserve and the U.S. Treasury and changes affecting Fan nie Mae and Freddie Mac; failure of sovereign or municipal entities to meet their debt obligations or a downgrade in the credit rating of su ch obligations; overall interest rate environment and changes in interest rates, interest rate spreads, the yield curve and prepayment rates; ch anges in anticipated earnings and returns; the amount and growth in our cash earnings and distributable income; growth in our book val ue per share; our ability to maintain adequate liquidity; our use of leverage and dependence on repurchase agreements and other short - term borrowi ngs to finance our mortgage - related holdings; the loss of our exclusion from the definition of “investment company” under the Investmen t Company Act of 1940; our ability to forecast our tax attributes and protect and use our net operating loss carry - forwards and net capita l loss carry - forwards to offset future taxable income and gains; changes in our business, acquisition, leverage, asset allocation, operati ona l, hedging and financing strategies and policies; our ability and willingness to make future dividends; competition for investment opportuni tie s and qualified personnel; our ability to retain key personnel; effects of litigation and contractual claims; changes in, and our ability to rem ain in compliance with, law, regulations or governmental policies affecting our business; risk from strategic ventures or entry into new busine ss areas; failure to maintain effective internal controls; and the factors described in the sections entitled “Risk Factors” in our Annual Report on Form 10 - K for the year ended December 31, 2013 and other documents filed by the Company with the SEC from time to time. You should not pla ce undue reliance on these forward - looking statements, which apply only as of the date of this presentation. We undertake no obligation to update or revise any forward - looking statement, whether written or oral, relating to matters discussed in this presentation, except as may be required by applicable securities laws.
2 Arlington Asset Investment Corp. (NYSE: AI) AI is an internally managed C Corp., listed on the NYSE Our focus is primarily residential mortgage related assets in securitized form Our view is that interest rates and housing will continue to normalize We have constructed our MBS portfolio to benefit from these outcomes We have developed a hybrid MBS portfolio consisting of: - Floating rate private - label MBS in ReREMIC form backed by prime collateral - Prepayment protected agency MBS that is well hedged We generate attractive returns with low leverage and offer growth potential in earnings and book value from our exposure to deep discount private - label MBS

3 Consistent Tax Advantaged Returns Plus Potential Growth Tax - advantaged dividend - $3.50 per share annualized - 14% annualized dividend yield (1)(2) (19% adjusted annualized yield assuming 23.8% Federal income tax on C Corp.) (3) Approximately $200 million of expected net operating loss carry - forwards - Applicable toward any form of income; expiring 2027 - 2028; no annual limitation - AI pays 2% alternative minimum tax rate - Approximately $50 million net capital loss carry - forwards expiring 2014 Approximately $166 million of deferred tax assets or $9.95 per share Complementary “Hybrid” portfolio with flexibility to allocate capital - Private - label MBS $341 million market value, $278 million of allocated capital (63%), prime jumbo loans - Agency MBS $1.6 billion market value, $166 million of allocated capital (37%), prepayment protected, hedged to approximately 100% of market value, low historic CPR Potential EPS upside as private - label MBS gains are realized and reinvested in Agency MBS portfolio ( 1 ) Based on the Company’s Class A common stock closing price on the NYSE of $ 25 . 03 on 2 / 10 / 2014 . (2) The annual dividend rate presented is calculated by annualizing the 4 th quarter of 2013 dividend payment of $0.875. The Company maintains a variable dividend policy and the Board of Directors, in its sole discretion, approves the payment of dividends. Actual dividends in t he future may differ materially from historical practice and from the annualized dividend rate presented. (3) The Company's dividends are eligible for the 23.8% federal income tax rate on qualified dividend income, whereas dividends p aid by a REIT are generally subject to tax at ordinary income rates (currently at a maximum marginal federal rate of 43.4%). To provide the same after - tax return to a shareholder eligible for the 23.8% rate on qualified dividend income and otherwise subject to the maximum marginal rate on ordinary income, a REIT wo uld be required to pay dividends providing a 19% yield.
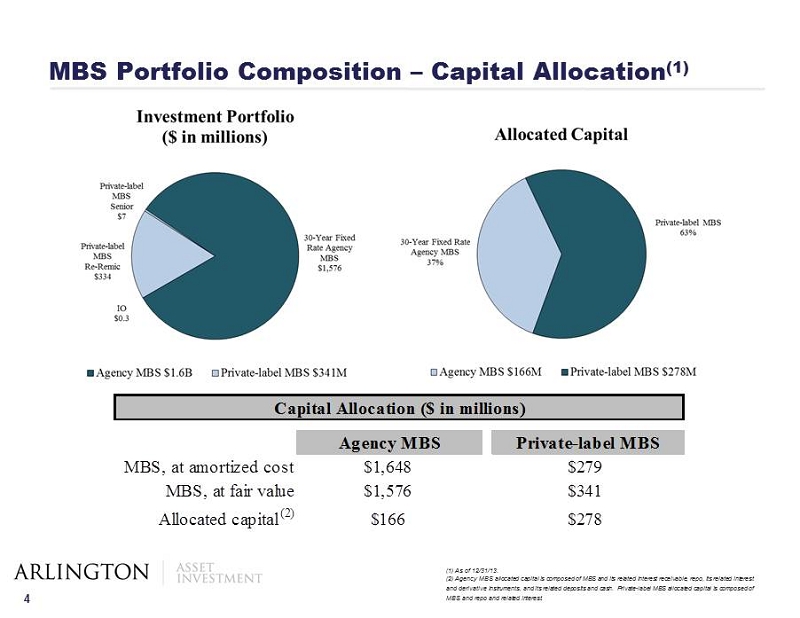
4 MBS Portfolio Composition – Capital Allocation (1) (1) As of 12/31/13. (2) Agency MBS allocated capital is composed of MBS and its related interest receivable, repo, its related interest and derivative instruments, and its related deposits and cash. Private - label MBS allocated capital is composed of MBS and repo and related interest. Agency MBS Private-label MBS MBS, at amortized cost $1,648 $279 MBS, at fair value $1,576 $341 Allocated capital (2) $166 $278 Capital Allocation ($ in millions)
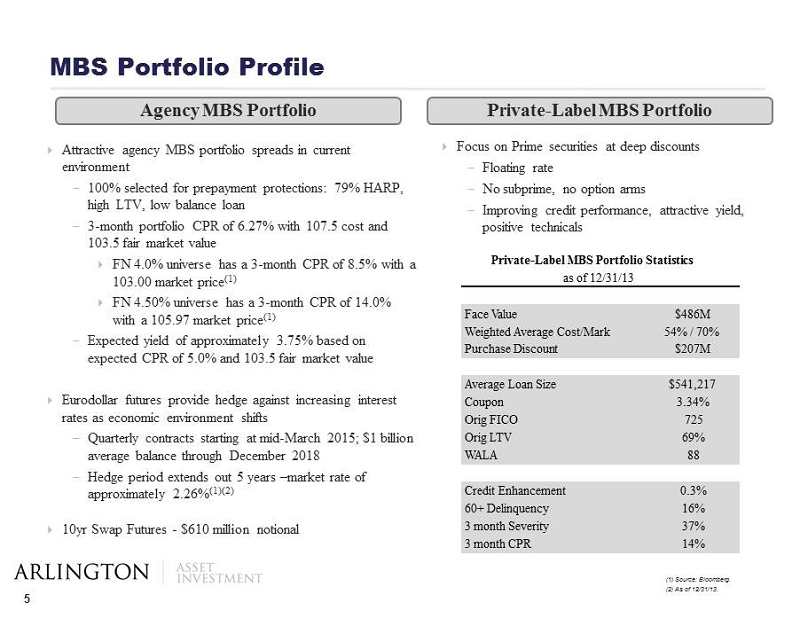
5 MBS Portfolio Profile Attractive agency MBS portfolio spreads in current environment - 100% selected for prepayment protections: 79% HARP, high LTV, low balance loan - 3 - month portfolio CPR of 6.27% with 107.5 cost and 103.5 fair market value FN 4.0% universe has a 3 - month CPR of 8.5% with a 103.00 market price (1) FN 4.50% universe has a 3 - month CPR of 14.0% with a 105.97 market price (1) - Expected yield of approximately 3.75% based on expected CPR of 5.0% and 103.5 fair market value Eurodollar futures provide hedge against increasing interest rates as economic environment shifts - Quarterly contracts starting at mid - March 2015; $1 billion average balance through December 2018 - Hedge period extends out 5 years – market rate of approximately 2.26% ( 1)(2 ) 10yr Swap Futures - $610 million notional (1) Source: Bloomberg. (2) As of 12/31/13. Private - Label MBS Portfolio Focus on Prime securities at deep discounts - Floating rate - No subprime, no option arms - Improving credit performance, attractive yield, positive technicals Agency MBS Portfolio Private - Label MBS Portfolio Statistics Face Value $486M Weighted Average Cost/Mark 54% / 70% Purchase Discount $207M Average Loan Size $541,217 Coupon 3.34% Orig FICO 725 Orig LTV 69% WALA 88 Credit Enhancement 0.3% 60+ Delinquency 16% 3 month Severity 37% 3 month CPR 14% as of 12/31/13

6 Private - label MBS Portfolio: Jumbo Prime and Alt - A Loans - Higher home values and larger loan sizes (approximately $540K) - Prime borrowers with greater financial flexibility - Stronger demographics, higher incomes - More desirable / stable housing markets Top 5 Largest MSAs (1) : - Los Angeles - Long Beach - Santa Ana, CA - San Francisco - Oakland - Fremont, CA - New York - Northern New Jersey - Long Island, NY - NJ - PA - Washington - Arlington - Alexandria, DC - VA - MD - WV - San Diego - Carlsbad - San Marcos, CA 12.5% HPA nationwide in October 2013 year - over - year 20 th consecutive month of year - over - year home price gains Housing supply remains limited and demand remains strong ( 1 ) Source : Bloomberg (2) Source: The Standard & Poor's Case – Shiller Home Price Indices
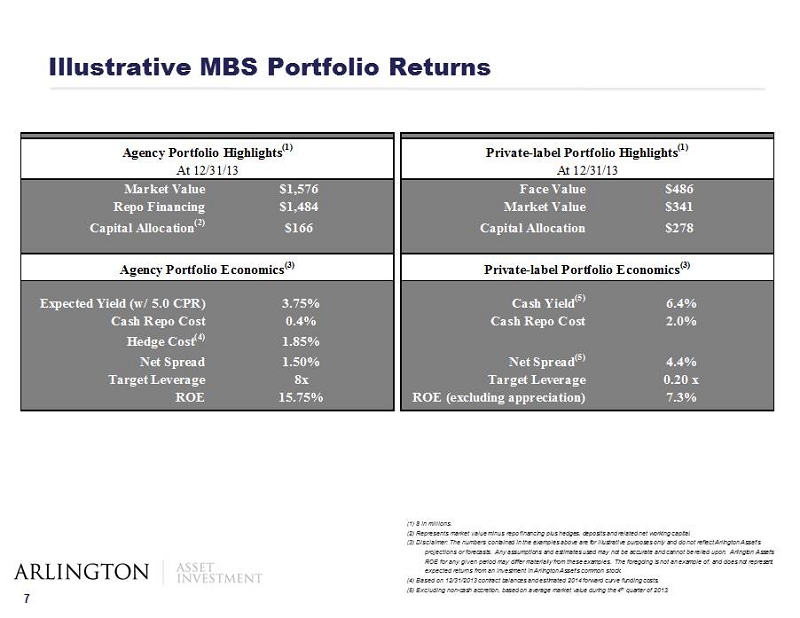
7 Illustrative MBS Portfolio Returns (1) $ in millions. (2) Represents market value minus repo financing plus hedges , deposits and related net working capital. (3) Disclaimer: The numbers contained in the examples above are for illustrative purposes only and do not reflect Arlington Asset’s projections or forecasts. Any assumptions and estimates used may not be accurate and cannot be relied upon. Arlington Asset ’s ROE for any given period may differ materially from these examples. The foregoing is not an example of, and does not represe nt, expected returns from an investment in Arlington Asset’s common stock. (4) Based on 12/31/2013 contract balances and estimated 2014 forward curve funding costs. (5) Excluding non - cash accretion, based on average market value during the 4 th quarter of 2013. Market Value $1,576 Face Value $486 Repo Financing $1,484 Market Value $341 Capital Allocation (2) $166 Capital Allocation $278 Expected Yield (w/ 5.0 CPR) 3.75% Cash Yield (5) 6.4% Cash Repo Cost 0.4% Cash Repo Cost 2.0% Hedge Cost (4) 1.85% Net Spread 1.50% Net Spread (5) 4.4% Target Leverage 8x Target Leverage 0.20 x ROE 15.75% ROE (excluding appreciation) 7.3% Agency Portfolio Economics (3) Agency Portfolio Highlights (1) At 12/31/13 Private-label Portfolio Highlights (1) At 12/31/13 Private-label Portfolio Economics (3)
8 AI Summary Our view is that interest rates and housing will continue to normalize We have developed a hybrid MBS portfolio consisting of: - Floating rate private - label MBS in ReREMIC form backed by prime collateral - Prepayment protected agency MBS that is well hedged High distributable current income with potential growth in investable book value - Private - label MBS portfolio at $0.80 price = $2.85 per AI share - Private - label MBS portfolio at $0.85 price = $4.30 per AI share Potential EPS upside as private - label MBS gains are realized and reinvested in agency MBS portfolio Tax - advantaged dividend - $3.50 per share annualized - 14% annualized dividend yield (1)(2) (19% adjusted annualized yield assuming 23.8% individual Federal income tax on C Corp.) ( 3) Low leverage, high ROI ( 1 ) Based on the Company’s Class A common stock closing price on the NYSE of $ 25 . 03 on 2 / 10 / 2014 . (2) The annual dividend rate presented is calculated by annualizing the 4 th quarter of 2013 dividend payment of $0.875. The Company maintains a variable dividend policy and the Board of Directors, in its sole discretion, approves the payment of dividends. Actual dividends in t he future may differ materially from historical practice and from the annualized dividend rate presented. (3) The Company's dividends are eligible for the 23.8% federal income tax rate on qualified dividend income, whereas dividends p aid by a REIT are generally subject to tax at ordinary income rates (currently at a maximum marginal federal rate of 43.4%). To provide the same after - tax return to a shareholder eligible for the 23.8% rate on qualified dividend income and otherwise subject to the maximum marginal rate on ordinary income, a REIT wo uld be required to pay dividends providing a 19% yield.