Attached files
| file | filename |
|---|---|
| 8-K - 8-K - Mastercard Inc | d667437d8k.htm |
| EX-99.1 - EX-99.1 - Mastercard Inc | d667437dex991.htm |
Exhibit 99.2
Exhibit 99.2
MasterCard Incorporated
Fourth-Quarter and Full-Year 2013 Financial Results Conference Call
January 31, 2014
©2014 MasterCard. Proprietary
Business Update
| 2 |
|
Operational Overview
Economic Update
Business Highlights
©2014 MasterCard.
Proprietary
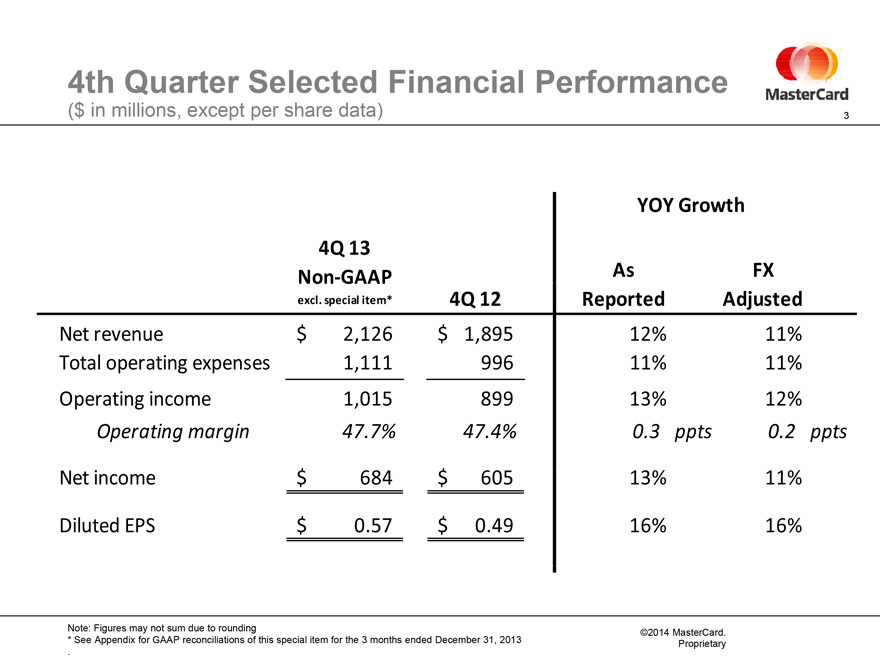
4th Quarter Selected Financial Performance
($ in millions, except per share data)
| 3 |
|
YOY Growth
4Q 13
Non-GAAP As FX
excl. special item* 4Q 12 Reported Adjusted
Net revenue $ 2,126 $ 1,895 12% 11%
Total operating expenses 1,111 996 11% 11%
Operating income 1,015 899 13% 12%
Operating margin 47.7% 47.4% 0.3 ppts 0.2 ppts
Net income $ 684 $ 605 13% 11%
Diluted EPS $ 0.57 $ 0.49 16% 16%
Note: Figures may not sum due to rounding
| * |
|
See Appendix for GAAP reconciliations of this special item for the 3 months ended December 31, 2013 |
©2014 MasterCard.
Proprietary
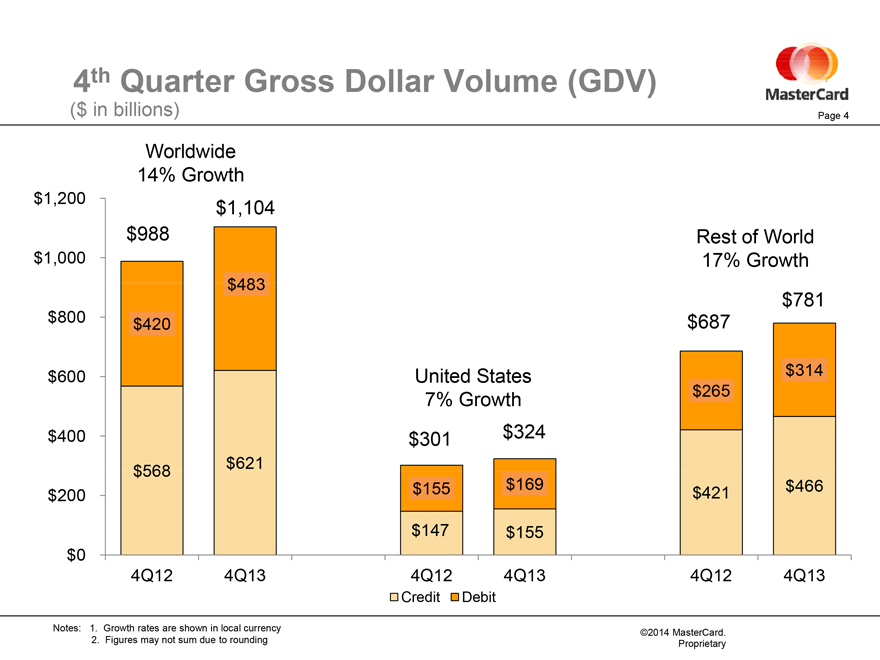
4th Quarter Gross Dollar Volume (GDV)
($ in billions)
Page 4
Worldwide
14% Growth
$1,200 $1,104
$988 Rest of World
$1,000 17% Growth
$483
$781
$800 $420 $687
$600 United States $314
7% Growth $265
$400 $301 $324
$568 $621
$200 $155 $169 $421 $466
$147 $155
$0
4Q12 4Q13 4Q12 4Q13 4Q12 4Q13
Credit Debit
Notes: 1. Growth rates are shown in local currency
2. Figures may not sum due to rounding
©2014 MasterCard.
Proprietary
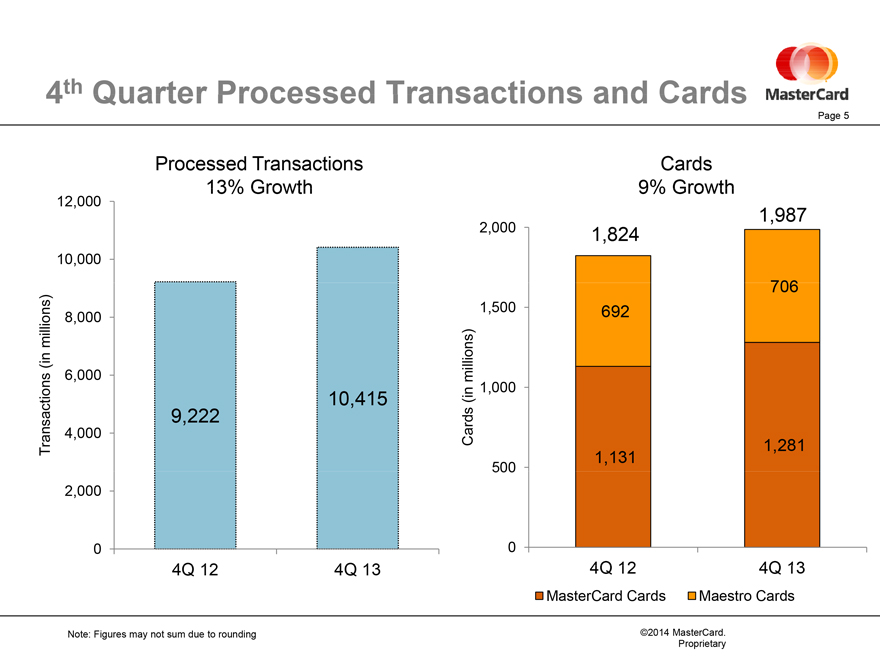
4th Quarter Processed Transactions and Cards
Page 5
Processed Transactions
13% Growth
12,000
10,000
millions) 8,000
(in
6,000
10,415
9,222
Transactions 4,000
2,000
0
4Q 12 4Q 13
Cards
9% Growth
1,987
2,000 1,824
706
1,500 692
(in millions) 1,000
Cards 1,281
500 1,131
0
4Q 12 4Q 13
MasterCard Cards Maestro Cards
Note: Figures may not sum due to rounding
©2014 MasterCard.
Proprietary
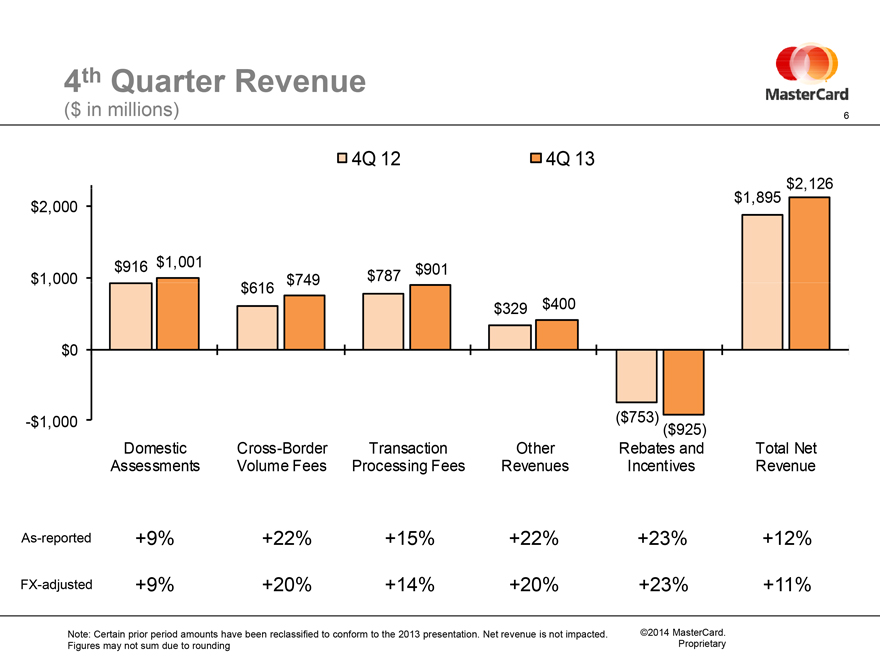
4th Quarter Revenue
($ in millions)
| 6 |
|
4Q 12 4Q 13
$2,126
$2,000 $1,895
$916 $1,001 $901
$1,000 $749 $787
$616
$329 $400
$0
-$1,000 ($753) ($925)
Domestic Cross-Border Transaction Other Rebates and Total Net
Assessments Volume Fees Processing Fees Revenues Incentives Revenue
As-reported +9% +22% +15% +22% +23% +12%
FX-adjusted +9% +20% +14% +20% +23% +11%
Note: Certain prior period amounts have been reclassified to conform to the 2013 presentation. Net revenue is not impacted. Figures may not sum due to rounding
©2014 MasterCard.
Proprietary
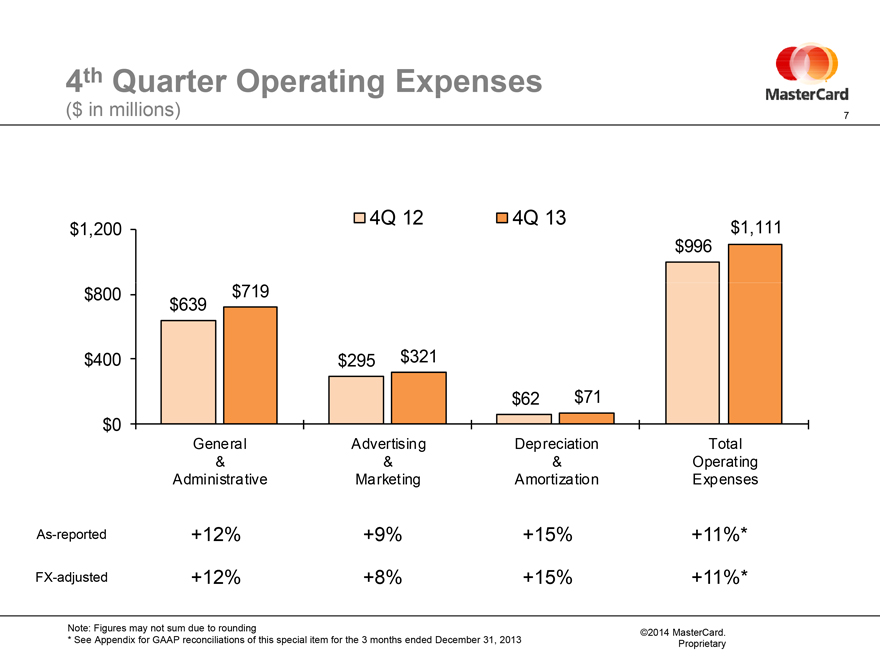
4th Quarter Operating Expenses
($ in millions)
| 7 |
|
4Q 12 4Q 13
$1,200 $1,111
$996
$800 $719
$639
$400 $295 $321
$62 $71
$0
General Advertising Depreciation Total
& & & Operating
Administrative Marketing Amortization Expenses
As-reported +12% +9% +15% +11%*
FX-adjusted +12% +8% +15% +11%*
Note: Figures may not sum due to rounding
| * |
|
See Appendix for GAAP reconciliations of this special item for the 3 months ended December 31, 2013 |
©2014 MasterCard.
Proprietary
Thoughts for the Future
| 8 |
|
Business update through January 28
Long-Term Performance Objectives
Thoughts for 2014
Revenue
Operating Expenses
Tax Rate
©2014 MasterCard.
Proprietary

MasterCard
9
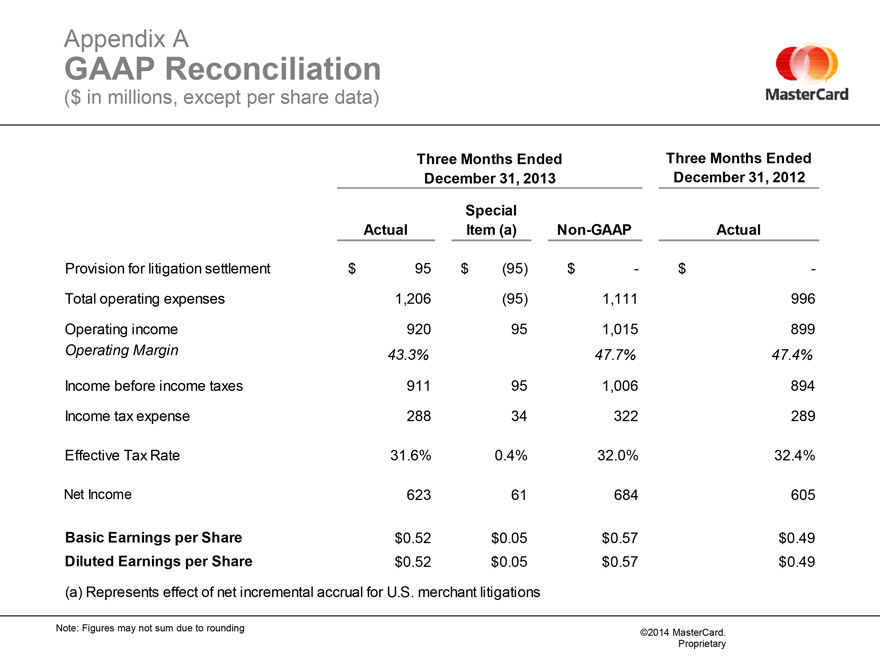
Appendix A
GAAP Reconciliation
($ in millions, except per share data)
Three Months Ended Three Months Ended
December 31, 2013 December 31, 2012
Special
Actual Item (a) Non-GAAP Actual
Provision for litigation settlement $ 95 $ (95) $- $ -
Total operating expenses 1,206 (95) 1,111 996
Operating income 920 95 1,015 899
Operating Margin 43.3% 47.7% 47.4%
Income before income taxes 911 95 1,006 894
Income tax expense 288 34 322 289
Effective Tax Rate 31.6% 0.4% 32.0% 32.4%
Net Income 623 61 684 605
Basic Earnings per Share $0.52 $0.05 $0.57 $0.49
Diluted Earnings per Share $0.52 $0.05 $0.57 $0.49
(a) Represents effect of net incremental accrual for U.S. merchant litigations
Note: Figures may not sum due to rounding
©2014 MasterCard.
Proprietary
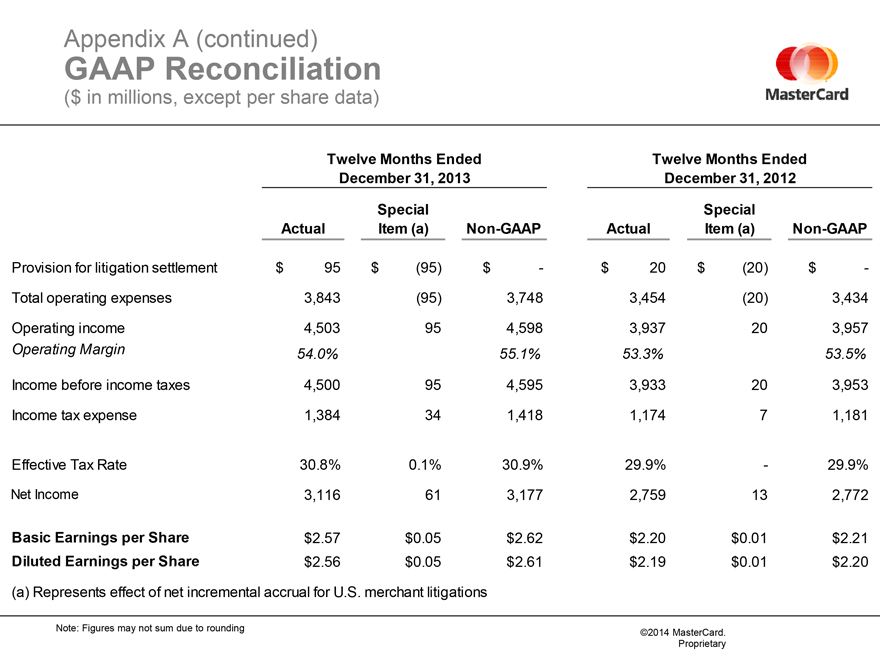
Appendix A (continued)
GAAP Reconciliation
($ in millions, except per share data)
Twelve Months Ended Twelve Months Ended
December 31, 2013 December 31, 2012
Special Special
Actual Item (a) Non-GAAP Actual Item (a) Non-GAAP
Provision for litigation settlement $95 $(95) $- $ 20 $ (20) $ -
Total operating expenses 3,843 (95) 3,748 3,454 (20) 3,434
Operating income 4,503 95 4,598 3,937 20 3,957
Operating Margin 54.0% 55.1% 53.3% 53.5%
Income before income taxes 4,500 95 4,595 3,933 20 3,953
Income tax expense 1,384 34 1,418 1,174 7 1,181
Effective Tax Rate 30.8% 0.1% 30.9% 29.9% - 29.9%
Net Income 3,116 61 3,177 2,759 13 2,772
Basic Earnings per Share $2.57 $0.05 $2.62 $2.20 $ 0.01 $2.21
Diluted Earnings per Share $2.56 $0.05 $2.61 $2.19 $0.01 $2.20
| (a) |
|
Represents effect of net incremental accrual for U.S. merchant litigations |
Note: Figures may not sum due to rounding
©2014 MasterCard.
Proprietary
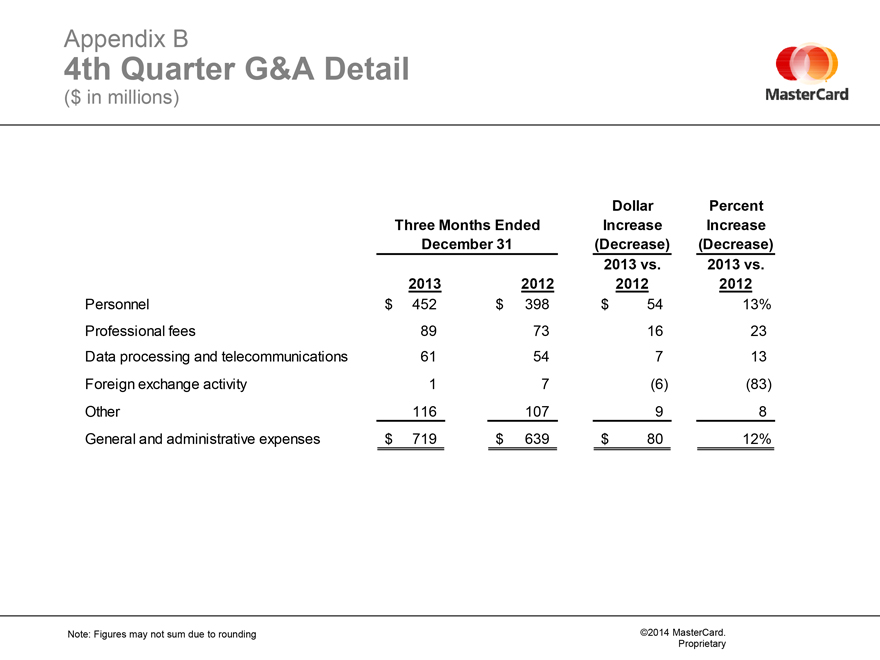
Appendix B
4th Quarter G&A Detail
($ in millions)
Dollar Percent
Three Months Ended Increase Increase
December 31 (Decrease) (Decrease)
2013 vs. 2013 vs.
2013 2012 2012 2012
Personnel $452 $398 $54 13%
Professional fees 89 73 16 23
Data processing and telecommunications 61 54 7 13
Foreign exchange activity 1 7 (6) (83)
Other 116 107 9 8
General and administrative expenses $719 $639 $80 12%
Note: Figures may not sum due to rounding
©2014 MasterCard.
Proprietary
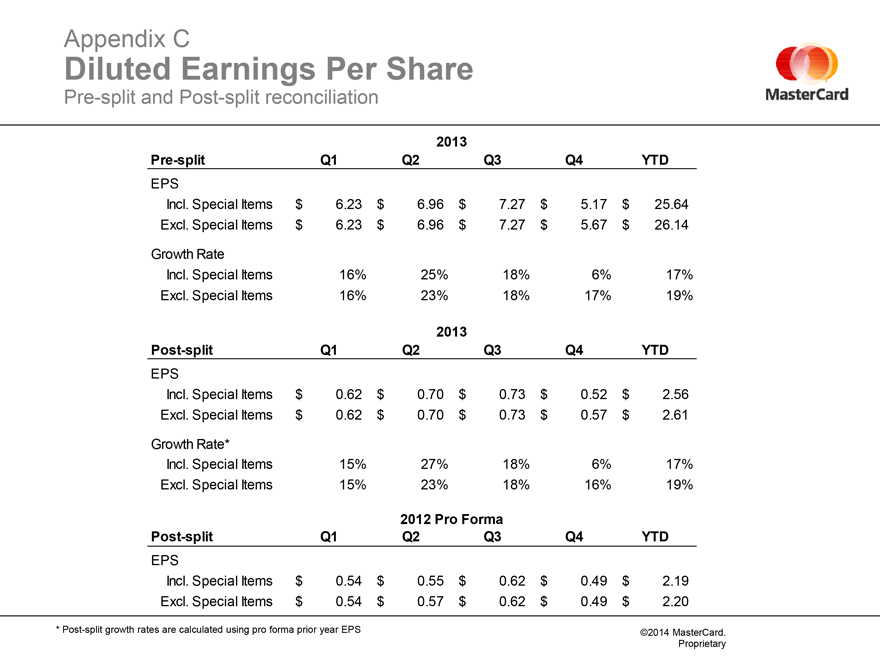
Appendix C
Diluted Earnings Per Share
Pre-split and Post-split reconciliation
2013
Pre-split Q1 Q2 Q3 Q4 YTD
EPS
Incl. Special Items $6.23 $6.96 $7.27 $5.17 $25.64
Excl. Special Items $6.23 $6.96 $7.27 $5.67 $26.14
Growth Rate
Incl. Special Items 16% 25% 18% 6% 17%
Excl. Special Items 16% 23% 18% 17% 19%
2013
Post-split Q1 Q2 Q3 Q4 YTD
EPS
Incl. Special Items $0.62 $0.70 $0.73 $0.52 $2.56
Excl. Special Items $0.62 $0.70 $0.73 $0.57 $2.61
Growth Rate*
Incl. Special Items 15% 27% 18% 6% 17%
Excl. Special Items 15% 23% 18% 16% 19%
2012 Pro Forma
Post-split Q1 Q2 Q3 Q4 YTD
EPS
Incl. Special Items $0.54 $0.55 $0.62 $0.49 $2.19
Excl. Special Items $0.54 $0.57 $0.62 $0.49 $2.20
* Post-split growth rates are calculated using pro forma prior year EPS
©2014 MasterCard.
Proprietary