Attached files
| file | filename |
|---|---|
| 8-K - 8-K - IDEX CORP /DE/ | iex-20140129x8k.htm |
EXHIBIT 99.1
IDEX REPORTS 15 PERCENT EPS GROWTH AND 28 PERCENT FREE CASH FLOW GROWTH IN 2013; Q4 EPS OF 82 CENTS DRIVEN BY 20 PERCENT OPERATING MARGIN
LAKE FOREST, IL, JANUARY 29 - IDEX Corporation (NYSE: IEX) today announced its financial results for the three- and twelve- month periods ended December 31, 2013.
Full Year 2013 Highlights
• | Orders of $2.1 billion increased 7 percent compared to the prior year (+5 percent organic and +2 percent acquisition). |
• | Sales of $2.0 billion increased 4 percent compared to the prior year (+2 percent organic and +2 percent acquisition). |
• | Gross margin of 43.1 percent was up 200 basis points from the prior year. |
• | Operating margin of 19.5 percent was up 110 basis points from the adjusted prior year. |
• | Net income of $255 million represents an increase of 14 percent compared to the adjusted prior year net income of $224 million. |
• | EPS of $3.09 was 41 cents, or 15 percent, higher than the adjusted prior year EPS of $2.68. |
• | EBITDA of $475 million, which represents an 8 percent increase from the adjusted prior year, was 23 percent of sales and covered interest expense by over 11 times. |
• | Free cash flow of $379 million, which represents a 28 percent increase from the prior year, was 148 percent of net income. |
• | The Company completed the repurchase of 2.9 million shares of common stock for $166 million in 2013. |
Fourth Quarter 2013
Orders in the quarter of $519 million were up 8 percent from the prior year period. Sales in the quarter totaled $521 million, 6 percent higher than the prior year period. For the quarter, on an organic basis, orders were 7 percent higher and sales were 5 percent higher than the prior year period.
Fourth quarter 2013 operating income was $104 million, up 14% from the adjusted prior year period. This resulted in an operating margin of 20 percent, up 150 basis points from the adjusted prior year operating margin, primarily due to volume leverage and productivity. Operating income includes $6 million of charges associated with cost-out actions across our three segments partially offset by a $4 million gain on the settlement of the contingent consideration agreement related to the Matcon business acquired in July 2012.
Fourth quarter net income was $68 million, an increase of 18 percent from the adjusted prior year. Fourth quarter earnings per share were 82 cents, an increase of 13 cents, or 19 percent, from the adjusted prior year.
Free cash flow of $95 million was a 20 percent increase from the prior year and 140 percent of net income.
“IDEX finished 2013 with a strong fourth quarter, culminating in a record year. Our flexible operating model allowed us to improve our cost structure and reinvest in organic growth. For the full year 2013, we delivered 7 percent order growth, expanded operating margins to 19.5 percent, generated record free cash flow of $379 million, and achieved 15 percent EPS growth. The fourth quarter saw markets continue to stabilize, and sustained order growth in the second half of 2013 provides solid momentum heading into 2014. In the fourth quarter, we took targeted cost-out actions across our three segments to further optimize our operating footprint. Based on these actions and improved performance throughout 2013, we now expect the Company’s operating margins for 2014 to exceed 20 percent. I am proud of our 2013 accomplishments and I am confident in IDEX’s ability to capitalize on long-term growth opportunities. Fueled by free cash flow conversion of 148 percent in 2013, we returned a record $240 million to shareholders via dividends and share repurchases. Our balance sheet and ability to generate cash are stronger than ever. As we enter 2014, we will continue to rigorously allocate our capital and people where we can create advantage and value. Our strategy of fully funding organic growth is unchanged, and we are committed to further increasing shareholder value through strategic acquisitions, shareholder dividends and share repurchases. We expect global end market demand to remain uneven. Regardless, with our focused efforts, we anticipate 3 to 5 percent organic revenue growth in 2014 and EPS of $3.33 to $3.43, up 8 to 11 percent compared to 2013. We expect first quarter 2014 EPS to be in the range of 83 to 85 cents, up 12 to 15 percent.” Andrew K. Silvernail Chairman and Chief Executive Officer |
Fourth Quarter 2013 Business Highlights (Operating margin excludes non-cash impairment and restructuring charges in 2012)
Fluid & Metering Technologies
• | Sales in the fourth quarter of $222 million reflected a 5 percent increase compared to the fourth quarter of 2012 (+4 percent organic and +1 percent foreign currency translation). |
• | Operating margin of 24.9 percent represented a 390 basis point improvement compared with the fourth quarter of 2012 primarily due to higher volume and productivity initiatives partially offset by $2 million of charges associated with cost-out actions taken during the quarter. |
Health & Science Technologies
• | Sales in the fourth quarter of $182 million reflected a 4 percent increase compared to the fourth quarter of 2012 (+2 percent organic, +3 percent acquisitions and -1 percent foreign currency translation). |
• | Operating margin of 18.2 percent represented a 20 basis point decrease compared with the fourth quarter of 2012 primarily due to $3 million of charges associated with cost-out actions taken during the quarter, partially offset by higher volume and productivity initiatives. |
Fire & Safety/Diversified Products
• | Sales in the fourth quarter of $118 million reflected a 9 percent increase compared to the fourth quarter of 2012 (+8 percent organic and +1 percent foreign currency translation). |
• | Operating margin of 24.3 percent represented a 10 basis point increase compared with the fourth quarter of 2012 primarily due to higher volume and productivity initiatives partially offset by $1 million of charges associated with cost-out actions taken during the quarter. |
For the fourth quarter of 2013, Fluid & Metering Technologies contributed 42 percent of sales and 47 percent of operating income; Health & Science Technologies accounted for 35 percent of sales and 28 percent of operating income; and Fire & Safety/Diversified Products represented 23 percent of sales and 25 percent of operating income.
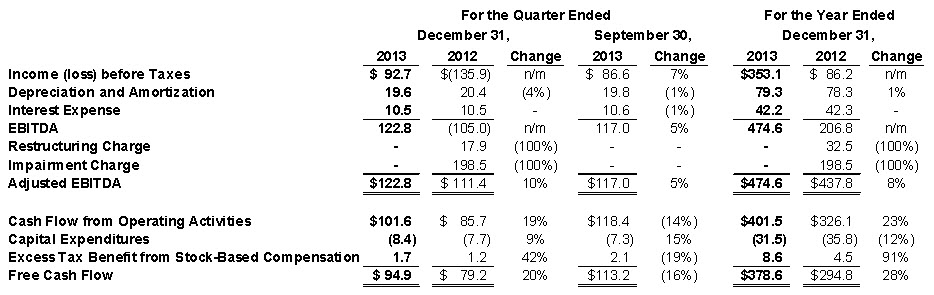
EBITDA and Free Cash Flow
EBITDA means earnings before interest, income taxes, depreciation and amortization, while free cash flow means cash flow from operating activities less capital expenditures plus the excess tax benefit from stock-based compensation. Management uses these non-GAAP financial measures as internal operating metrics and for enterprise valuation purposes. Management believes these measures are useful as analytical indicators of leverage capacity and debt servicing ability, and uses them to measure financial performance as well as for planning purposes. However, they should not be considered as alternatives to net income, cash flow
from operating activities or any other items calculated in accordance with U.S. GAAP, or as an indicator of operating performance. The definitions of EBITDA and free cash flow used here may differ from those used by other companies.
EBITDA and Free Cash Flow Bridge (dollars in millions)
Conference Call to be Broadcast over the Internet
IDEX will broadcast its fourth quarter earnings conference call over the Internet on Thursday, January 30, 2014 at 9:30 a.m. CT. Chairman and Chief Executive Officer Andy Silvernail and Vice President and Chief Financial Officer Heath Mitts will discuss the Company’s recent financial performance and respond to questions from the financial analyst community. IDEX invites interested investors to listen to the call and view the accompanying slide presentation, which will be carried live on its website at www.idexcorp.com. Those who wish to participate should log on several minutes before the discussion begins. After clicking on the presentation icon, investors should follow the instructions to ensure their systems are set up to hear the event and view the presentation slides, or download the correct applications at no charge. Investors will also be able to hear a replay of the call by dialing 855.859.2056 (or 404.537.3406 for international participants) using the ID # 30410743.
Forward-Looking Statements
This news release contains forward-looking statements within the meaning of Section 27A of the Securities Act of 1933, as amended, and Section 21E of the Exchange Act of 1934, as amended. These statements may relate to, among other things, capital expenditures, cost reductions, cash flow,
and operating improvements and are indicated by words or phrases such as “anticipate,” “estimate,” “plans,” “expects,” “projects,” “should,” “will,” “management believes,” “the company believes,” “the company intends,” and similar words or phrases. These statements are subject to inherent uncertainties and risks that could cause actual results to differ materially from those anticipated at the date of this news release. The risks and uncertainties include, but are not limited to, the following: economic and political consequences resulting from terrorist attacks and wars; levels of industrial activity and economic conditions in the U.S. and other countries around the world; pricing pressures and other competitive factors, and levels of capital spending in certain industries - all of which could have a material impact on order rates and IDEX’s results, particularly in light of the low levels of order backlogs it typically maintains; its ability to make acquisitions and to integrate and operate acquired businesses on a profitable basis; the relationship of the U.S. dollar to other currencies and its impact on pricing and cost competitiveness; political and economic conditions in foreign countries in which the company operates; interest rates; capacity utilization and the effect this has on costs; labor markets; market conditions and material costs; and developments with respect to contingencies, such as litigation and environmental matters. The forward-looking statements included here are only made as of the date of this news release, and management undertakes no obligation to publicly update them to reflect subsequent events or circumstances. Investors are cautioned not to rely unduly on forward-looking statements when evaluating the information presented here.
About IDEX
IDEX Corporation is an applied solutions company specializing in fluid and metering technologies, health and science technologies, and fire, safety and other diversified products built to its customers’ exacting specifications. Its products are sold in niche markets to a wide range of industries throughout the world. IDEX shares are traded on the New York Stock Exchange and Chicago Stock Exchange under the symbol “IEX”.
For further information on IDEX Corporation and its business units, visit the company’s website at www.idexcorp.com.
(Tables follow)
IDEX CORPORATION | |||||||||||||||||
Condensed Statements of Consolidated Operations | |||||||||||||||||
(in thousands except per share amounts) | |||||||||||||||||
(unaudited) | |||||||||||||||||
Three Months Ended | Twelve Months Ended | ||||||||||||||||
December 31, | December 31, | ||||||||||||||||
2013 | 2012 | 2013 | 2012 | ||||||||||||||
Net sales | $ | 520,620 | $ | 490,838 | $ | 2,024,130 | $ | 1,954,258 | |||||||||
Cost of sales | 293,611 | 287,980 | 1,150,766 | 1,150,558 | |||||||||||||
Gross profit | 227,009 | 202,858 | 873,364 | 803,700 | |||||||||||||
Selling, general and administrative expenses | 123,136 | 112,059 | 477,851 | 444,490 | |||||||||||||
Impairment | — | 198,519 | — | 198,519 | |||||||||||||
Restructuring expenses | — | 17,869 | — | 32,473 | |||||||||||||
Operating income (loss) | 103,873 | (125,589 | ) | 395,513 | 128,218 | ||||||||||||
Other (income) expense - net | 696 | (217 | ) | 178 | (236 | ) | |||||||||||
Interest expense | 10,482 | 10,516 | 42,206 | 42,250 | |||||||||||||
Income (loss) before income taxes | 92,695 | (135,888 | ) | 353,129 | 86,204 | ||||||||||||
Provision (benefit) for income taxes | 25,140 | (16,869 | ) | 97,914 | 48,574 | ||||||||||||
Net income (loss) | $ | 67,555 | $ | (119,019 | ) | $ | 255,215 | $ | 37,630 | ||||||||
Earnings per Common Share: | |||||||||||||||||
Basic earnings (loss) per common share (a) | $ | 0.83 | $ | (1.45 | ) | $ | 3.11 | $ | 0.45 | ||||||||
Diluted earnings (loss) per common share (a) | $ | 0.82 | $ | (1.45 | ) | $ | 3.09 | $ | 0.45 | ||||||||
Share Data: | |||||||||||||||||
Basic weighted average common shares outstanding | $ | 80,782 | $ | 82,296 | $ | 81,517 | $ | 82,689 | |||||||||
Diluted weighted average common shares outstanding | $ | 81,854 | $ | 82,296 | $ | 82,489 | $ | 83,641 | |||||||||
Condensed Consolidated Balance Sheets | |||||||||||||
(in thousands) | |||||||||||||
(unaudited) | |||||||||||||
December 31, | December 31, | ||||||||||||
2013 | 2012 | ||||||||||||
Assets | |||||||||||||
Current assets | |||||||||||||
Cash and cash equivalents | $ | 439,629 | $ | 318,864 | |||||||||
Receivables - net | 253,226 | 256,095 | |||||||||||
Inventories | 230,967 | 234,950 | |||||||||||
Other current assets | 67,131 | 71,956 | |||||||||||
Total current assets | 990,953 | 881,865 | |||||||||||
Property, plant and equipment - net | 213,488 | 219,161 | |||||||||||
Goodwill and intangible assets | 1,660,683 | 1,663,099 | |||||||||||
Other noncurrent assets | 22,453 | 21,265 | |||||||||||
Total assets | $ | 2,887,577 | $ | 2,785,390 | |||||||||
Liabilities and shareholders' equity | |||||||||||||
Current liabilities | |||||||||||||
Trade accounts payable | $ | 133,312 | $ | 117,341 | |||||||||
Accrued expenses | 150,751 | 150,176 | |||||||||||
Short-term borrowings | 1,871 | 7,335 | |||||||||||
Dividends payable | 18,675 | 16,575 | |||||||||||
Total current liabilities | 304,609 | 291,427 | |||||||||||
Long-term borrowings | 772,005 | 779,241 | |||||||||||
Other noncurrent liabilities | 237,974 | 249,724 | |||||||||||
Total liabilities | 1,314,588 | 1,320,392 | |||||||||||
Shareholders' equity | 1,572,989 | 1,464,998 | |||||||||||
Total liabilities and shareholders' equity | $ | 2,887,577 | $ | 2,785,390 | |||||||||
IDEX CORPORATION | ||||||||||||||||||||||
Company and Business Group Financial Information | ||||||||||||||||||||||
(dollars in thousands) | ||||||||||||||||||||||
(unaudited) | ||||||||||||||||||||||
Three Months Ended | Twelve Months Ended | |||||||||||||||||||||
December 31, (b) | December 31, (b) | |||||||||||||||||||||
2013 | 2012 (c) | 2013 | 2012 (c) | |||||||||||||||||||
Fluid & Metering Technologies | ||||||||||||||||||||||
Net sales | $ | 222,234 | $ | 211,855 | $ | 871,814 | $ | 833,288 | ||||||||||||||
Operating income (c) | 55,326 | 44,455 | 211,256 | 180,630 | ||||||||||||||||||
Operating margin | 24.9 | % | 21.0 | % | 24.2 | % | 21.7 | % | ||||||||||||||
Depreciation and amortization | $ | 6,680 | $ | 7,445 | $ | 27,633 | $ | 29,637 | ||||||||||||||
Capital expenditures | 3,455 | 3,784 | 11,581 | 13,535 | ||||||||||||||||||
Health & Science Technologies | ||||||||||||||||||||||
Net sales | $ | 182,287 | $ | 174,661 | $ | 714,650 | $ | 695,235 | ||||||||||||||
Operating income (c) | 33,143 | 32,214 | 136,707 | 122,708 | ||||||||||||||||||
Operating margin | 18.2 | % | 18.4 | % | 19.1 | % | 17.6 | % | ||||||||||||||
Depreciation and amortization | $ | 10,959 | $ | 10,687 | $ | 43,496 | $ | 39,981 | ||||||||||||||
Capital expenditures | 2,503 | 2,704 | 12,280 | 13,140 | ||||||||||||||||||
Fire & Safety/Diversified Products | ||||||||||||||||||||||
Net sales | $ | 118,223 | $ | 108,880 | $ | 445,049 | $ | 437,053 | ||||||||||||||
Operating income (c) | 28,703 | 26,296 | 102,730 | 104,461 | ||||||||||||||||||
Operating margin | 24.3 | % | 24.2 | % | 23.1 | % | 23.9 | % | ||||||||||||||
Depreciation and amortization | $ | 1,677 | $ | 1,881 | $ | 6,852 | $ | 7,107 | ||||||||||||||
Capital expenditures | 2,043 | 1,471 | 5,040 | 6,654 | ||||||||||||||||||
Company | ||||||||||||||||||||||
Net sales | $ | 520,620 | $ | 490,838 | $ | 2,024,130 | $ | 1,954,258 | ||||||||||||||
Operating income (c) | 103,873 | 90,799 | 395,513 | 359,210 | ||||||||||||||||||
Operating margin | 20.0 | % | 18.5 | % | 19.5 | % | 18.4 | % | ||||||||||||||
Depreciation and amortization (d) | $ | 19,639 | $ | 20,374 | $ | 79,334 | $ | 78,312 | ||||||||||||||
Capital expenditures | 8,396 | 8,254 | 31,536 | 35,520 | ||||||||||||||||||
(a) | Calculated by applying the two-class method of allocating earnings to common stock and participating securities as required by ASC 260, Earnings Per Share. | |||||||||||||||||||||
(b) | Three and twelve month data includes acquisitions of FTL (March 2013), Matcon (July 2012) and ERC (April 2012) in the Health & Science Technologies segment from the date of acquisition. | |||||||||||||||||||||
(c) | Group operating income excludes unallocated corporate operating expenses while both Group and Company operating income excludes the impairment charge (for the Fluid & Metering Technologies and Health & Science Technologies segments) and restructuring related charges for 2012. | |||||||||||||||||||||
(d) | Depreciation and amortization excludes amortization of debt issuance expenses. | |||||||||||||||||||||