Attached files
| file | filename |
|---|---|
| EX-99.1 - EXHIBIT 99.1 PDF - DUPONT FABROS TECHNOLOGY, INC. | exhibit991123113.pdf |
| 8-K - 8-K - DUPONT FABROS TECHNOLOGY, INC. | a8kearningsrelease12-31x13.htm |
Fourth Quarter 2013 |
Earnings Release |
and Supplemental Information |
May 2013 August 2013
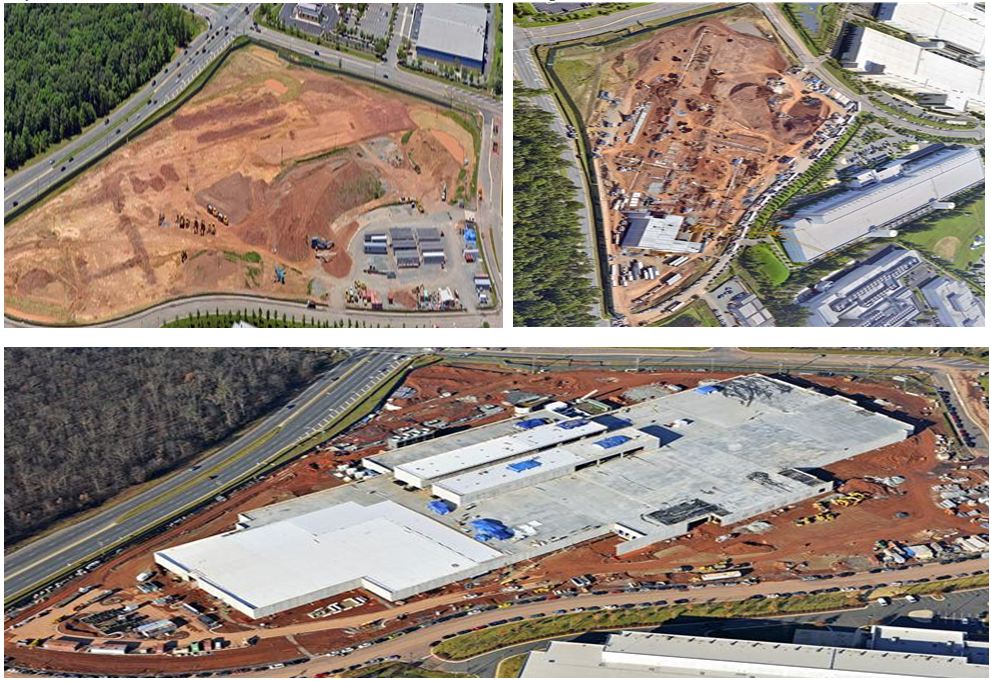
December 2013
ACC7 Under Development
Ashburn, VA
DuPont Fabros Technology, Inc. 1212 New York Avenue, NW Suite 900 Washington, D.C. 20005 (202) 728-0044 www.dft.com NYSE: DFT | Investor Relations Contacts: Jeffrey H. Foster Chief Financial Officer jfoster@dft.com (202) 478-2333 | Christopher A. Warnke Manager, Investor Relations investorrelations@dft.com (202) 478-2330 | |
Fourth Quarter 2013 Results
Table of Contents | ||||
Earnings Release | 1-4 | |||
Consolidated Statements of Operations | 5 | |||
Reconciliations of Net Income to FFO, Normalized FFO and AFFO | 6 | |||
Consolidated Balance Sheets | 7 | |||
Consolidated Statements of Cash Flows | 8 | |||
Operating Properties | 9 | |||
Lease Expirations | 10 | |||
Development Projects | 11 | |||
Debt Summary and Debt Maturity | 12 | |||
Selected Unsecured Debt Metrics and Capital Structure | 13 | |||
Common Share and Operating Partnership Unit Weighted Average Amounts Outstanding | 14 | |||
2014 Guidance | 15 | |||
Note: This press release supplement contains certain non-GAAP financial measures that we believe are helpful in understanding our business, as further discussed within this press release supplement. These financial measures, which include Funds From Operations, Normalized Funds From Operations, Adjusted Funds From Operations, Funds From Operations per share, Normalized Funds From Operations per share and Adjusted Funds From Operations per share, should not be considered as an alternative to net income, earnings per share or any other GAAP measurement of performance or as an alternative to cash flows from operating, investing or financing activities. Furthermore, these non-GAAP financial measures are not intended to be a measure of cash flow or liquidity. Information included in this supplemental package is unaudited.
Exhibit 99.1
NEWS
DUPONT FABROS TECHNOLOGY, INC. REPORTS FOURTH QUARTER 2013 RESULTS
Revenues increase 16%; Normalized FFO per share increases 50%
2014 Guidance provided
WASHINGTON, DC, - January 30, 2014 - DuPont Fabros Technology, Inc. (NYSE: DFT) is reporting results for the quarter ended December 31, 2013. All per share results are reported on a fully diluted basis.
Highlights
• | As of December 31, 2013, our operating portfolio was stabilized at 94% leased and commenced. |
• | Quarterly Highlights: |
• | Normalized Funds from Operations (“Normalized FFO”) of $0.57 per share representing a 50% increase over the prior year quarter and a 12% increase sequentially. |
• | Adjusted Funds from Operations ("AFFO") per share of $0.56 representing a 51% increase over the prior year quarter and an 8% increase sequentially. |
• | Commenced one lease totaling 1.14 megawatts ("MW") and 5,500 computer room square feet. |
• | Renewed two leases scheduled to expire in 2014, each for five years, totaling 1.17 MW and 9,760 computer room square feet. |
• | Repaid the remaining 24% of the $550 million 8.5% Senior Notes due 2017. |
• | Exercised the accordion on the unsecured term loan, increasing its total capacity from $195 million to $250 million. |
• | Subsequent to the Fourth Quarter 2013: |
• | Declared first quarter 2014 dividend of $0.35 per share, an increase of 40% over the prior quarter. |
Hossein Fateh, President and Chief Executive Officer, said, “DFT enters 2014 with a strong balance sheet poised for new growth. We had record lease commencements of 33 megawatts in 2013 which resulted in 32% growth in Normalized FFO per share as compared to 2012. We continue to focus on the lease up of our existing available inventory and our two new developments to fuel our future growth.”
Fourth Quarter 2013 Results
For the quarter ended December 31, 2013, earnings were $0.18 per share compared to earnings of $0.11 per share for the fourth quarter of 2012. The $0.18 per share of earnings includes an $0.11 per share loss on early extinguishment of debt related to the call of the remaining 8.5% Senior Notes due 2017. Excluding the $0.11 per share loss on early extinguishment of debt, earnings were $0.28 per share, an increase of 155% over the prior year quarter. Revenues increased 16%, or $13.5 million, to $99.4 million for the fourth quarter of 2013 over the fourth quarter of 2012. The increase in revenues is primarily due to new leases commencing.
1
Normalized FFO is FFO with the loss on early extinguishment of debt added back. Normalized FFO for the quarter ended December 31, 2013 was $0.57 per share compared to $0.38 per share for the fourth quarter of 2012. The increase of $0.19 per share, or 50%, from the prior year quarter is primarily due to the following:
• | Higher operating income excluding depreciation of $0.16 per share and |
• | Lower interest expense of $0.03 per share from lower interest rates and higher capitalized interest. |
Full Year 2013 Results
For the year ended December 31, 2013, earnings were $0.32 per share compared to $0.41 per share for 2012. Earnings of $0.32 per share includes losses on the early extinguishment of debt of $0.50 per share from our refinancing of the 8.5% Senior Notes Due 2017 and the ACC5 Term Loan. Excluding the $0.50 per share loss on early extinguishment of debt, earnings were $0.82 per share, an increase of 100% over 2012. Revenues increased 13%, or $42.7 million, to $375.1 million for 2013 versus 2012. The increase in revenues is primarily due to new leases commencing.
Normalized FFO for the year ended December 31, 2013 was $1.96 per share, compared to $1.48 per share for 2012. The increase of $0.48 per share, or 32%, from 2012 is primarily due to higher operating income excluding depreciation.
Portfolio Update
During the fourth quarter 2013, we:
• | Renewed one lease at VA3 for five years totaling 0.60 MW and 7,060 computer room square feet and one lease for five years at ACC5 totaling 0.57 MW and 2,700 computer room square feet. |
In 2013, we:
• | Signed five leases and a pre-lease with a weighted average lease term of 5.5 years totaling 15.71 MW and 106,130 computer room square feet that are expected to generate approximately $16.0 million of annualized GAAP base rent revenue which includes $1.0 million of management fees. |
• | Commenced 14 leases totaling 33.31 MW and 201,225 computer room square feet. |
• | Renewed five leases by a weighted average of 3.8 years totaling 5.72 MW and 31,460 computer room square feet. |
Development Update
We are currently under development at ACC7 Phase I (11.9 MW) and SC1 Phase IIA (9.1 MW). Both of these developments are on time and on budget, with completion expected in mid-2014. SC1 Phase IIA is 50% pre-leased.
Balance Sheet and Liquidity
In September 2013, we issued $600 million of Senior Notes due 2021 at par bearing an interest rate of 5.875%. The proceeds from this issuance were used to retire our 8.5% Senior Notes due 2017. Bondholders tendered $418.1 million of these notes outstanding and we settled this tender on September 24, 2013 for $443.4 million which included a premium of $25.3 million. On October 24, 2013, we redeemed the remaining bonds for $139.0 million which included a premium of $7.1 million.
In September 2013, we entered into a $195 million senior unsecured term loan. This loan bears interest at LIBOR plus 1.75% and matures on February 15, 2019 with no extension option. In October 2013, we exercised the accordion feature of this loan which increased its total capacity by $55 million to $250 million. This loan includes a delayed draw feature, and as of December 31, 2013 we had drawn $154.0 million of the total $250 million. The remaining $96.0 million was drawn in January 2014.
2
In September 2013, the Company's Board of Directors approved a new common stock repurchase program that commenced in November 2013 and expires on December 31, 2014. The new program allows purchases of up to $142.2 million. In the fourth quarter of 2013, we did not repurchase any shares.
As of December 31, 2013, we had $39 million of cash, $96 million of available capacity on our unsecured term loan and $400 million of available capacity under our revolving credit facility.
Dividend
Yesterday, we announced that our first quarter 2014 dividend is $0.35 per share which is a 40% increase from the fourth quarter 2013 dividend of $0.25 per share. The increase is due to a forecasted increase in taxable income in 2014 as the Company's policy is to pay out 100% of taxable income as a dividend. Jeff Foster, Chief Financial Officer, said, "We are pleased to announce our fourth dividend increase in the last two years. The 2014 annualized dividend of $1.40 per share represents an estimated Normalized FFO payout ratio of 60 percent at the midpoint of our 2014 guidance." The Normalized FFO payout ratio in 2013 was 48% and the AFFO payout ratio was 51%.
First Quarter and Full Year 2014 Guidance
Our Normalized FFO guidance range is $0.56 to $0.58 per share for the first quarter of 2014. The midpoint of this range is equal to our fourth quarter 2013 Normalized FFO per share of $0.57.
Our 2014 Normalized FFO guidance range is $2.28 to $2.38 per share and the lower end of this range assumes no additional leases will be executed through the end of this calendar year. The assumptions underlying this guidance can be found on page 15 of this earnings release. The $0.37 per share, or 19%, increase between our full year 2013 Normalized FFO per share of $1.96 and the mid-point of the 2014 guidance range is primarily due to:
• | Higher operating income excluding depreciation of $0.25 per share primarily from new leases commencing in 2013 and 2014 and |
• | Lower interest expense of $0.12 per share of which $0.07 per share is due to higher capitalized interest and the remainder is due to decreasing the average interest rate of our debt by 185 basis points in 2014, partially offset by an increase in our average outstanding debt of $198 million. |
Fourth Quarter 2013 Conference Call and Webcast Information
We will host a conference call to discuss these results today, Thursday, January 30, 2014 at 1:00 p.m. ET. To access the live call, please visit the Investor Relations section of our website at www.dft.com or dial 1-877-870-4263 (domestic) or 1-412-317-0790 (international). A replay will be available for seven days by dialing 1-877-344-7529 (domestic) or 1-412-317-0088 (international) using passcode 10039043. The webcast will be archived on our website for one year at www.dft.com on the Presentations & Webcasts page.
About DuPont Fabros Technology, Inc.
DuPont Fabros Technology, Inc. (NYSE: DFT) is a leading owner, developer, operator and manager of enterprise-class, carrier neutral, multi-tenant wholesale data centers. The Company's facilities are designed to offer highly specialized, efficient and safe computing environments in a low-cost operating model. The Company's customers outsource their mission critical applications and include national and international enterprises across numerous industries, such as technology, Internet content providers, media, communications, cloud-based, healthcare and financial services. The Company's ten data centers are located in four major U.S. markets, which total 2.5 million gross square feet and 218 megawatts of available critical load to power the servers and computing equipment of its customers. DuPont Fabros Technology, Inc., a real estate investment trust (REIT), is headquartered in Washington, DC. For more information, please visit www.dft.com.
3
Forward-Looking Statements
Certain statements contained in this press release may be deemed to be forward-looking statements within the meaning of the Private Securities Litigation Reform Act of 1995. The matters described in these forward-looking statements include expectations regarding future events, results and trends and are subject to known and unknown risks, uncertainties and other unpredictable factors, many of which are beyond our control. We face many risks that could cause our actual performance to differ materially from the results contemplated by our forward-looking statements, including, without limitation, the risk that the assumptions underlying our full year and first quarter 2014 guidance are not realized, the risks related to the leasing of available space to third-party customers, including delays in executing new leases and failure to negotiate leases on terms that will enable us to achieve our expected returns, risks related to the collection of accounts and notes receivable, the risk that we may be unable to obtain new financing on favorable terms to facilitate, among other things, future development projects, the risks commonly associated with construction and development of new facilities (including delays and/or cost increases associated with the completion of new developments), risks relating to obtaining required permits and compliance with permitting, zoning, land-use and environmental requirements, the risk that we will not declare and pay dividends as anticipated for 2014 and the risk that we may not be able to maintain our qualification as a REIT for federal tax purposes. The periodic reports that we file with the Securities and Exchange Commission, including the annual report on Form 10-K for the year ended December 31, 2012 and the quarterly reports on Form 10-Q for the quarters ended September 30, 2013, June 30, 2013 and March 31, 2013, contain detailed descriptions of these and many other risks to which we are subject. These reports are available on our website at www.dft.com. Because of the risks described above and other unknown risks, our actual results, performance or achievements may differ materially from the results, performance or achievements contemplated by our forward-looking statements. The information set forth in this news release represents our expectations and intentions only as of the date of this press release. We assume no responsibility to issue updates to the contents of this press release.
4
DUPONT FABROS TECHNOLOGY, INC.
CONSOLIDATED STATEMENTS OF OPERATIONS
(in thousands except share and per share data)
Three months ended December 31, | Year ended December 31, | ||||||||||||||
2013 | 2012 | 2013 | 2012 | ||||||||||||
Revenues: | |||||||||||||||
Base rent (1) | $ | 68,904 | $ | 61,000 | $ | 265,695 | $ | 236,810 | |||||||
Recoveries from tenants (1) | 28,515 | 23,702 | 104,271 | 91,049 | |||||||||||
Other revenues | 2,025 | 1,257 | 5,143 | 4,586 | |||||||||||
Total revenues | 99,444 | 85,959 | 375,109 | 332,445 | |||||||||||
Expenses: | |||||||||||||||
Property operating costs | 28,124 | 24,286 | 103,522 | 94,646 | |||||||||||
Real estate taxes and insurance | 3,436 | 3,474 | 14,380 | 12,689 | |||||||||||
Depreciation and amortization | 23,285 | 22,356 | 93,058 | 89,241 | |||||||||||
General and administrative | 3,715 | 3,310 | 16,261 | 17,024 | |||||||||||
Other expenses | 1,419 | 4,773 | 3,650 | 6,919 | |||||||||||
Total expenses | 59,979 | 58,199 | 230,871 | 220,519 | |||||||||||
Operating income | 39,465 | 27,760 | 144,238 | 111,926 | |||||||||||
Interest income | 52 | 56 | 137 | 168 | |||||||||||
Interest: | |||||||||||||||
Expense incurred | (8,953 | ) | (11,294 | ) | (46,443 | ) | (47,765 | ) | |||||||
Amortization of deferred financing costs | (807 | ) | (819 | ) | (3,349 | ) | (3,496 | ) | |||||||
Loss on early extinguishment of debt | (8,668 | ) | — | (40,978 | ) | — | |||||||||
Net income | 21,089 | 15,703 | 53,605 | 60,833 | |||||||||||
Net income attributable to redeemable noncontrolling interests – operating partnership | (2,817 | ) | (2,046 | ) | (5,214 | ) | (7,803 | ) | |||||||
Net income attributable to controlling interests | 18,272 | 13,657 | 48,391 | 53,030 | |||||||||||
Preferred stock dividends | (6,812 | ) | (6,812 | ) | (27,245 | ) | (27,053 | ) | |||||||
Net income attributable to common shares | $ | 11,460 | $ | 6,845 | $ | 21,146 | $ | 25,977 | |||||||
Earnings per share – basic: | |||||||||||||||
Net income attributable to common shares | $ | 0.18 | $ | 0.11 | $ | 0.32 | $ | 0.41 | |||||||
Weighted average common shares outstanding | 64,685,508 | 63,000,839 | 64,645,316 | 62,866,189 | |||||||||||
Earnings per share – diluted: | |||||||||||||||
Net income attributable to common shares | $ | 0.18 | $ | 0.11 | $ | 0.32 | $ | 0.41 | |||||||
Weighted average common shares outstanding | 65,439,427 | 63,833,651 | 65,474,039 | 63,754,006 | |||||||||||
Dividends declared per common share | $ | 0.25 | $ | 0.20 | $ | 0.95 | $ | 0.62 | |||||||
(1) Effective this quarter, we reclassified the management fee that we collect from customers from "Recoveries from tenants" to "Base rent." All periods presented were conformed to this change. We believe that this change more accurately reflects the true nature of our management fee which is equivalent to additional rent for the Company with no offsetting direct expenses. We continue to recover all of our property management expenses under our triple net lease structure and these recoveries are still reported in "Recoveries from tenants."
5
DUPONT FABROS TECHNOLOGY, INC.
RECONCILIATIONS OF NET INCOME TO FFO, NORMALIZED FFO AND AFFO (1)
(unaudited and in thousands except share and per share data)
Three months ended December 31, | Year ended December 31, | ||||||||||||||
2013 | 2012 | 2013 | 2012 | ||||||||||||
Net income | $ | 21,089 | $ | 15,703 | $ | 53,605 | $ | 60,833 | |||||||
Depreciation and amortization | 23,285 | 22,356 | 93,058 | 89,241 | |||||||||||
Less: Non real estate depreciation and amortization | (186 | ) | (238 | ) | (875 | ) | (1,023 | ) | |||||||
FFO | 44,188 | 37,821 | 145,788 | 149,051 | |||||||||||
Preferred stock dividends | (6,812 | ) | (6,812 | ) | (27,245 | ) | (27,053 | ) | |||||||
FFO attributable to common shares and OP units | $ | 37,376 | $ | 31,009 | $ | 118,543 | $ | 121,998 | |||||||
Loss on early extinguishment of debt | 8,668 | — | 40,978 | — | |||||||||||
Normalized FFO | 46,044 | 31,009 | 159,521 | 121,998 | |||||||||||
Straight-line revenues, net of reserve | (1,597 | ) | (1,143 | ) | (6,920 | ) | (17,967 | ) | |||||||
Amortization of lease contracts above and below market value | (598 | ) | (599 | ) | (2,391 | ) | (3,194 | ) | |||||||
Compensation paid with Company common shares | 1,012 | 1,647 | 6,088 | 6,980 | |||||||||||
Non real estate depreciation and amortization | 186 | 238 | 875 | 1,023 | |||||||||||
Amortization of deferred financing costs | 807 | 819 | 3,349 | 3,496 | |||||||||||
Improvements to real estate | (722 | ) | (1,093 | ) | (5,757 | ) | (4,426 | ) | |||||||
Capitalized leasing commissions | (52 | ) | (362 | ) | (2,134 | ) | (1,143 | ) | |||||||
AFFO | $ | 45,080 | $ | 30,516 | $ | 152,631 | $ | 106,767 | |||||||
FFO attributable to common shares and OP units per share - diluted | $ | 0.46 | $ | 0.38 | $ | 1.46 | $ | 1.48 | |||||||
Normalized FFO per share - diluted | $ | 0.57 | $ | 0.38 | $ | 1.96 | $ | 1.48 | |||||||
AFFO per share - diluted | $ | 0.56 | $ | 0.37 | $ | 1.87 | $ | 1.29 | |||||||
Weighted average common shares and OP units outstanding - diluted | 81,197,007 | 82,662,537 | 81,409,279 | 82,638,775 | |||||||||||
(1) Funds from operations, or FFO, is used by industry analysts and investors as a supplemental operating performance measure for REITs. We calculate FFO in accordance with the definition that was adopted by the Board of Governors of the National Association of Real Estate Investment Trusts, or NAREIT. FFO, as defined by NAREIT, represents net income determined in accordance with GAAP, excluding extraordinary items as defined under GAAP, impairment charges on depreciable real estate assets and gains or losses from sales of previously depreciated operating real estate assets, plus specified non-cash items, such as real estate asset depreciation and amortization, and after adjustments for unconsolidated partnerships and joint ventures. We also present FFO attributable to common shares and OP units, which is FFO excluding preferred stock dividends. FFO attributable to common shares and OP units per share is calculated on a basis consistent with net income attributable to common shares and OP units and reflects adjustments to net income for preferred stock dividends.
We use FFO as a supplemental performance measure because, in excluding real estate related depreciation and amortization and gains and losses from property dispositions, it provides a performance measure that, when compared period over period, captures trends in occupancy rates, rental rates and operating expenses. We also believe that, as a widely recognized measure of the performance of equity REITs, FFO may be used by investors as a basis to compare our operating performance with that of other REITs. However, because FFO excludes real estate related depreciation and amortization and captures neither the changes in the value of our properties that result from use or market conditions nor the level of capital expenditures and leasing commissions necessary to maintain the operating performance of our properties, all of which have real economic effects and could materially impact our results from operations, the utility of FFO as a measure of our performance is limited.
While FFO is a relevant and widely used measure of operating performance of equity REITs, other equity REITs may use different methodologies for calculating FFO and, accordingly, FFO as disclosed by such other REITs may not be comparable to our FFO. Therefore, we believe that in order to facilitate a clear understanding of our historical operating results, FFO should be examined in conjunction with net income as presented in the consolidated statements of operations. FFO should not be considered as an alternative to net income or to cash flow from operating activities (each as computed in accordance with GAAP) or as an indicator of our liquidity, nor is it indicative of funds available to meet our cash needs, including our ability to pay dividends or make distributions.
We present FFO with adjustments to arrive at Normalized FFO. Normalized FFO is FFO attributable to common shares and units excluding gain or loss on early extinguishment of debt and gain or loss on derivative instruments. We also present FFO with supplemental adjustments to arrive at Adjusted FFO (“AFFO”). AFFO is Normalized FFO excluding straight-line revenue, compensation paid with Company common shares, below market lease amortization net of above market lease amortization, non real estate depreciation and amortization, amortization of deferred financing costs, improvements to real estate and capitalized leasing commissions. AFFO does not represent cash generated from operating activities in accordance with GAAP and therefore should not be considered an alternative to net income as an indicator of our operating performance or as an alternative to cash flow provided by operations as a measure of liquidity and is not necessarily indicative of funds available to fund our cash needs including our ability to pay dividends. In addition, AFFO may not be comparable to similarly titled measurements employed by other companies. We use AFFO in management reports to provide a measure of REIT operating performance that can be compared to other companies using AFFO.
6
DUPONT FABROS TECHNOLOGY, INC.
CONSOLIDATED BALANCE SHEETS
(in thousands except share data)
December 31, 2013 | December 31, 2012 | ||||||
ASSETS | |||||||
Income producing property: | |||||||
Land | $ | 75,956 | $ | 73,197 | |||
Buildings and improvements | 2,420,986 | 2,315,499 | |||||
2,496,942 | 2,388,696 | ||||||
Less: accumulated depreciation | (413,394 | ) | (325,740 | ) | |||
Net income producing property | 2,083,548 | 2,062,956 | |||||
Construction in progress and land held for development | 302,068 | 218,934 | |||||
Net real estate | 2,385,616 | 2,281,890 | |||||
Cash and cash equivalents | 38,733 | 23,578 | |||||
Rents and other receivables, net | 12,674 | 3,840 | |||||
Deferred rent, net | 150,038 | 144,829 | |||||
Lease contracts above market value, net | 9,154 | 10,255 | |||||
Deferred costs, net | 39,866 | 35,670 | |||||
Prepaid expenses and other assets | 44,507 | 30,797 | |||||
Total assets | $ | 2,680,588 | $ | 2,530,859 | |||
LIABILITIES AND STOCKHOLDERS’ EQUITY | |||||||
Liabilities: | |||||||
Line of credit | $ | — | $ | 18,000 | |||
Mortgage notes payable | 115,000 | 139,600 | |||||
Unsecured term loan | 154,000 | — | |||||
Unsecured notes payable | 600,000 | 550,000 | |||||
Accounts payable and accrued liabilities | 23,566 | 22,280 | |||||
Construction costs payable | 45,444 | 6,334 | |||||
Accrued interest payable | 9,983 | 2,601 | |||||
Dividend and distribution payable | 25,971 | 22,177 | |||||
Lease contracts below market value, net | 10,530 | 14,022 | |||||
Prepaid rents and other liabilities | 56,576 | 35,524 | |||||
Total liabilities | 1,041,070 | 810,538 | |||||
Redeemable noncontrolling interests – operating partnership | 387,244 | 453,889 | |||||
Commitments and contingencies | — | — | |||||
Stockholders’ equity: | |||||||
Preferred stock, $.001 par value, 50,000,000 shares authorized: | |||||||
Series A cumulative redeemable perpetual preferred stock, 7,400,000 issued and outstanding at December 31, 2013 and 2012 | 185,000 | 185,000 | |||||
Series B cumulative redeemable perpetual preferred stock, 6,650,000 issued and outstanding at December 31, 2013 and 2012 | 166,250 | 166,250 | |||||
Common stock, $.001 par value, 250,000,000 shares authorized, 65,205,274 shares issued and outstanding at December 31, 2013 and 63,340,929 shares issued and outstanding at December 31, 2012 | 65 | 63 | |||||
Additional paid in capital | 900,959 | 915,119 | |||||
Retained earnings | — | — | |||||
Total stockholders’ equity | 1,252,274 | 1,266,432 | |||||
Total liabilities and stockholders’ equity | $ | 2,680,588 | $ | 2,530,859 | |||
7
DUPONT FABROS TECHNOLOGY, INC.
CONSOLIDATED STATEMENTS OF CASH FLOWS
(in thousands)
Year ended December 31, | |||||||
2013 | 2012 | ||||||
Cash flow from operating activities | |||||||
Net income | $ | 53,605 | $ | 60,833 | |||
Adjustments to reconcile net income to net cash provided by operating activities | |||||||
Depreciation and amortization | 93,058 | 89,241 | |||||
Loss on early extinguishment of debt | 40,978 | — | |||||
Straight line rent, net of reserve | (6,920 | ) | (17,967 | ) | |||
Amortization of deferred financing costs | 3,349 | 3,496 | |||||
Amortization of lease contracts above and below market value | (2,391 | ) | (3,194 | ) | |||
Compensation paid with Company common shares | 6,088 | 6,980 | |||||
Changes in operating assets and liabilities | |||||||
Rents and other receivables | (5,900 | ) | (2,452 | ) | |||
Deferred costs | (2,082 | ) | (1,278 | ) | |||
Prepaid expenses and other assets | (14,760 | ) | (5,854 | ) | |||
Accounts payable and accrued liabilities | 1,520 | (1,112 | ) | ||||
Accrued interest payable | 7,382 | 73 | |||||
Prepaid rents and other liabilities | 19,834 | 3,997 | |||||
Net cash provided by operating activities | 193,761 | 132,763 | |||||
Cash flow from investing activities | |||||||
Investments in real estate – development | (129,332 | ) | (94,753 | ) | |||
Land acquisition costs | (14,186 | ) | (3,830 | ) | |||
Interest capitalized for real estate under development | (3,774 | ) | (4,434 | ) | |||
Improvements to real estate | (5,757 | ) | (4,426 | ) | |||
Additions to non-real estate property | (71 | ) | (57 | ) | |||
Net cash used in investing activities | (153,120 | ) | (107,500 | ) | |||
Cash flow from financing activities | |||||||
Line of credit: | |||||||
Proceeds | 102,000 | 48,000 | |||||
Repayments | (120,000 | ) | (50,000 | ) | |||
Mortgage notes payable: | |||||||
Proceeds | 115,000 | — | |||||
Lump sum payoffs | (138,300 | ) | — | ||||
Repayments | (1,300 | ) | (5,200 | ) | |||
Unsecured term loan: | |||||||
Proceeds | 154,000 | — | |||||
Unsecured notes payable: | |||||||
Proceeds | 600,000 | — | |||||
Repayments | (550,000 | ) | — | ||||
Payments of financing costs | (18,200 | ) | (2,109 | ) | |||
Payments for early extinguishment of debt | (32,544 | ) | — | ||||
Issuance of preferred stock, net of offering costs | — | 62,685 | |||||
Exercises of stock options | 1,711 | 868 | |||||
Common stock repurchases | (37,792 | ) | — | ||||
Dividends and distributions: | |||||||
Common shares | (57,927 | ) | (34,112 | ) | |||
Preferred shares | (27,245 | ) | (26,006 | ) | |||
Redeemable noncontrolling interests – operating partnership | (14,889 | ) | (10,213 | ) | |||
Net cash used in financing activities | (25,486 | ) | (16,087 | ) | |||
Net increase in cash and cash equivalents | 15,155 | 9,176 | |||||
Cash and cash equivalents, beginning | 23,578 | 14,402 | |||||
Cash and cash equivalents, ending | $ | 38,733 | $ | 23,578 | |||
Supplemental information: | |||||||
Cash paid for interest | $ | 42,835 | $ | 52,127 | |||
Deferred financing costs capitalized for real estate under development | $ | 226 | $ | 277 | |||
Construction costs payable capitalized for real estate under development | $ | 45,444 | $ | 6,334 | |||
Redemption of operating partnership units | $ | 75,600 | $ | 6,800 | |||
Adjustments to redeemable noncontrolling interests - operating partnership | $ | 18,791 | $ | 2,830 | |||
8
DUPONT FABROS TECHNOLOGY, INC.
Operating Properties
As of January 1, 2014
Property | Property Location | Year Built/ Renovated | Gross Building Area (2) | Computer Room Square Feet (2) | Critical Load MW (3) | % Leased (4) | % Commenced (5) | ||||||||||||
Stabilized (1) | |||||||||||||||||||
ACC2 | Ashburn, VA | 2001/2005 | 87,000 | 53,000 | 10.4 | 100 | % | 100 | % | ||||||||||
ACC3 | Ashburn, VA | 2001/2006 | 147,000 | 80,000 | 13.9 | 100 | % | 100 | % | ||||||||||
ACC4 | Ashburn, VA | 2007 | 347,000 | 172,000 | 36.4 | 100 | % | 100 | % | ||||||||||
ACC5 | Ashburn, VA | 2009-2010 | 360,000 | 176,000 | 36.4 | 98 | % | 98 | % | ||||||||||
ACC6 | Ashburn, VA | 2011-2013 | 262,000 | 130,000 | 26.0 | 100 | % | 100 | % | ||||||||||
CH1 | Elk Grove Village, IL | 2008-2012 | 485,000 | 231,000 | 36.4 | 100 | % | 100 | % | ||||||||||
NJ1 Phase I | Piscataway, NJ | 2010 | 180,000 | 88,000 | 18.2 | 52 | % | 52 | % | ||||||||||
SC1 Phase I | Santa Clara, CA | 2011 | 180,000 | 88,000 | 18.2 | 100 | % | 100 | % | ||||||||||
VA3 | Reston, VA | 2003 | 256,000 | 147,000 | 13.0 | 71 | % | 71 | % | ||||||||||
VA4 | Bristow, VA | 2005 | 230,000 | 90,000 | 9.6 | 100 | % | 100 | % | ||||||||||
Total Operating Properties | 2,534,000 | 1,255,000 | 218.5 | 94 | % | 94 | % | ||||||||||||
(1) | Stabilized operating properties are either 85% or more leased and commenced or have been in service for 24 months or greater. |
(2) | Gross building area is the entire building area, including computer room square footage (the portion of gross building area where our customers' computer servers are located), common areas, areas controlled by us (such as the mechanical, telecommunications and utility rooms) and, in some facilities, individual office and storage space leased on an as available basis to our customers. |
(3) | Critical load (also referred to as IT load or load used by customers' servers or related equipment) is the power available for exclusive use by customers expressed in terms of megawatt, or MW, or kilowatt, or kW (1 MW is equal to 1,000 kW). |
(4) | Percentage leased is expressed as a percentage of critical load that is subject to an executed lease totaling 205.3 MW. Leases executed as of January 1, 2014 represent $275 million of base rent on a GAAP basis and $283 million of base rent on a cash basis over the next twelve months. Both amounts include $17 million of revenue from management fees over the next twelve months. |
(5) | Percentage commenced is expressed as a percentage of critical load where the lease has commenced under generally accepted accounting principles. |
9
DUPONT FABROS TECHNOLOGY, INC.
Lease Expirations
As of January 1, 2014
The following table sets forth a summary schedule of lease expirations at our operating properties for each of the ten calendar years beginning with 2014. The information set forth in the table below assumes that customers exercise no renewal options and takes into account customers’ early termination options in determining the life of their leases under GAAP.
Year of Lease Expiration | Number of Leases Expiring (1) | Computer Room Square Feet of Expiring Commenced Leases (in thousands) (2) | % of Leased Computer Room Square Feet | Total kW of Expiring Commenced Leases (2) | % of Leased kW | % of Annualized Base Rent (3) | ||||||||||||
2014 | 2 | 8 | 0.7 | % | 1,705 | 0.8 | % | 1.1 | % | |||||||||
2015 | 4 | 70 | 6.0 | % | 13,812 | 6.7 | % | 6.7 | % | |||||||||
2016 | 4 | 32 | 2.7 | % | 4,686 | 2.3 | % | 2.4 | % | |||||||||
2017 | 13 | 96 | 8.2 | % | 17,619 | 8.6 | % | 8.7 | % | |||||||||
2018 | 19 | 215 | 18.3 | % | 39,298 | 19.1 | % | 18.4 | % | |||||||||
2019 | 13 | 171 | 14.5 | % | 31,337 | 15.3 | % | 14.8 | % | |||||||||
2020 | 10 | 106 | 9.0 | % | 16,496 | 8.0 | % | 8.7 | % | |||||||||
2021 | 9 | 159 | 13.5 | % | 27,682 | 13.5 | % | 13.8 | % | |||||||||
2022 | 6 | 75 | 6.4 | % | 12,812 | 6.1 | % | 7.2 | % | |||||||||
2023 | 4 | 48 | 4.1 | % | 6,475 | 3.2 | % | 2.7 | % | |||||||||
After 2023 | 12 | 196 | 16.6 | % | 33,425 | 16.4 | % | 15.5 | % | |||||||||
Total | 96 | 1,176 | 100 | % | 205,347 | 100 | % | 100 | % | |||||||||
(1) | Represents 33 customers with 96 lease expiration dates. Top four customers represent 62% of annualized base rent. |
(2) | Computer room square footage is that portion of gross building area where customers locate their computer servers. One MW is equal to 1,000 kW. |
(3) | Annualized base rent represents the monthly contractual base rent (defined as cash base rent before abatements) multiplied by 12 for commenced leases totaling 205.3 MW as of January 1, 2014. |
10
DUPONT FABROS TECHNOLOGY, INC.
Development Projects
As of December 31, 2013
($ in thousands)
Property | Property Location | Gross Building Area (1) | Computer Room Square Feet (2) | Critical Load MW (3) | Estimated Total Cost (4) | Construction in Progress & Land Held for Development (5) | % Pre-leased | |||||||||||||
Current Development Projects | ||||||||||||||||||||
SC1 Phase IIA | Santa Clara, CA | 90,000 | 44,000 | 9.1 | $105,000 - $115,000 | $ | 64,972 | 50 | % | |||||||||||
ACC7 Phase I | Ashburn, VA | 126,000 | 70,000 | 11.9 | 85,000 - 90,000 | 68,402 | 0 | % | ||||||||||||
216,000 | 114,000 | 21.0 | 190,000 - 205,000 | 133,374 | ||||||||||||||||
Future Development Projects/Phases | ||||||||||||||||||||
SC1 Phase IIB | Santa Clara, CA | 90,000 | 44,000 | 9.1 | 46,000 - 50,000 | 44,610 | ||||||||||||||
ACC7 Phases II to IV | Ashburn, VA | 320,000 | 176,000 | 29.7 | 78,000 - 82,000 | 59,705 | ||||||||||||||
NJ1 Phase II | Piscataway, NJ | 180,000 | 88,000 | 18.2 | 39,212 | 39,212 | ||||||||||||||
590,000 | 308,000 | 57.0 | $163,212 - $171,212 | 143,527 | ||||||||||||||||
Land Held for Development | ||||||||||||||||||||
ACC8 | Ashburn, VA | 100,000 | 50,000 | 10.4 | 3,855 | |||||||||||||||
CH2 | Elk Grove Village, IL | 338,000 | 167,000 | 25.6 | 15,702 | |||||||||||||||
SC2 | Santa Clara, CA | 200,000 | 125,000 | 26.0 | 5,610 | |||||||||||||||
638,000 | 342,000 | 62.0 | 25,167 | |||||||||||||||||
Total | 1,444,000 | 764,000 | 140.0 | $ | 302,068 | |||||||||||||||
(1) | Gross building area is the entire building area, including computer room square footage (the portion of gross building area where our customers’ computer servers are located), common areas, areas controlled by us (such as the mechanical, telecommunications and utility rooms) and, in some facilities, individual office and storage space leased on an as available basis to our customers. The amount listed for CH2 is an estimate. |
(2) | Computer room square footage is that portion of gross building area where customers locate their computer servers. The amount listed for CH2 is an estimate. |
(3) | Critical load (also referred to as IT load or load used by customers’ servers or related equipment) is the power available for exclusive use by customers expressed in terms of MW or kW (1 MW is equal to 1,000 kW). The amount listed for CH2 is an estimate. |
(4) | Current development projects include land, capitalization for construction and development and capitalized operating carrying costs, as applicable, upon completion. Capitalized interest is excluded. Future development projects/phases other than SC1 Phase IIB include land, shell and underground work through Phase I opening only. SC1 Phase IIB also includes a portion of the electrical and mechanical infrastructure. |
(5) | Amount capitalized as of December 31, 2013. Future development projects/phases other than SC1 Phase IIB include land, shell and underground work through Phase I opening only. SC1 Phase IIB also includes a portion of the electrical and mechanical infrastructure. |
11
DUPONT FABROS TECHNOLOGY, INC.
Debt Summary as of December 31, 2013
($ in thousands)
December 31, 2013 | ||||||||||||
Amounts | % of Total | Rates | Maturities (years) | |||||||||
Secured | $ | 115,000 | 13 | % | 2.0 | % | 4.2 | |||||
Unsecured | 754,000 | 87 | % | 5.1 | % | 7.2 | ||||||
Total | $ | 869,000 | 100 | % | 4.7 | % | 6.8 | |||||
Fixed Rate Debt: | ||||||||||||
Unsecured Notes due 2021 | $ | 600,000 | 69 | % | 5.9 | % | 7.7 | |||||
Fixed Rate Debt | 600,000 | 69 | % | 5.9 | % | 7.7 | ||||||
Floating Rate Debt: | ||||||||||||
Unsecured Credit Facility | — | — | — | 2.2 | ||||||||
Unsecured Term Loan | 154,000 | 18 | % | 1.9 | % | 5.1 | ||||||
ACC3 Term Loan | 115,000 | 13 | % | 2.0 | % | 4.2 | ||||||
Floating Rate Debt | 269,000 | 31 | % | 2.0 | % | 4.7 | ||||||
Total | $ | 869,000 | 100 | % | 4.7 | % | 6.8 | |||||
Note: | We capitalized interest and deferred financing cost amortization of $2.4 million and $4.0 million during the three months and year ended December 31, 2013, respectively. |
Debt Maturity as of December 31, 2013
($ in thousands)
Year | Fixed Rate | Floating Rate | Total | % of Total | Rates | |||||||||||||||
2014 | — | — | — | — | — | |||||||||||||||
2015 | — | — | — | — | — | |||||||||||||||
2016 | — | 3,750 | (2) | 3,750 | 0.4 | % | 2.0 | % | ||||||||||||
2017 | — | 8,750 | (2) | 8,750 | 1.0 | % | 2.0 | % | ||||||||||||
2018 | — | 102,500 | (2) | 102,500 | 11.8 | % | 2.0 | % | ||||||||||||
2019 | — | 154,000 | (3) | 154,000 | 17.7 | % | 1.9 | % | ||||||||||||
2020 | — | — | — | — | — | |||||||||||||||
2021 | 600,000 | (1) | — | 600,000 | 69.1 | % | 5.9 | % | ||||||||||||
Total | $ | 600,000 | $ | 269,000 | $ | 869,000 | 100 | % | 4.7 | % | ||||||||||
(1) | The 5.875% Unsecured Notes are due September 15, 2021. |
(2) | The ACC3 Term Loan matures on March 27, 2018 with no extension option. Quarterly principal payments of $1.25 million begin on April 1, 2016, increase to $2.5 million on April 1, 2017 and continue through maturity. |
(3) | The $250 million Unsecured Term Loan matures on February 15, 2019 with no extension option. In January 2014, we drew the remaining $96.0 million. |
12
DUPONT FABROS TECHNOLOGY, INC.
Selected Unsecured Debt Metrics(1)
12/31/13 | 12/31/12 | ||
Interest Coverage Ratio (not less than 2.0) | 5.8 | 4.0 | |
Total Debt to Gross Asset Value (not to exceed 60%) | 28.2% | 24.9% | |
Secured Debt to Total Assets (not to exceed 40%) | 3.7% | 4.9% | |
Total Unsecured Assets to Unsecured Debt (not less than 150%) | 364.8% | 334.3% | |
(1) | These selected metrics relate to DuPont Fabros Technology, LP's outstanding unsecured notes. DuPont Fabros Technology, Inc. is the general partner of DuPont Fabros Technology, LP. |
Capital Structure as of December 31, 2013
(in thousands except per share data)
Line of Credit | $ | — | |||||||||||||||
Mortgage Notes Payable | 115,000 | ||||||||||||||||
Unsecured Term Loan | 154,000 | ||||||||||||||||
Unsecured Notes | 600,000 | ||||||||||||||||
Total Debt | 869,000 | 27.0 | % | ||||||||||||||
Common Shares | 81 | % | 65,205 | ||||||||||||||
Operating Partnership (“OP”) Units | 19 | % | 15,672 | ||||||||||||||
Total Shares and Units | 100 | % | 80,877 | ||||||||||||||
Common Share Price at December 31, 2013 | $ | 24.71 | |||||||||||||||
Common Share and OP Unit Capitalization | $ | 1,998,471 | |||||||||||||||
Preferred Stock ($25 per share liquidation preference) | 351,250 | ||||||||||||||||
Total Equity | 2,349,721 | 73.0 | % | ||||||||||||||
Total Market Capitalization | $ | 3,218,721 | 100.0 | % | |||||||||||||
13
DUPONT FABROS TECHNOLOGY, INC.
Common Share and OP Unit
Weighted Average Amounts Outstanding
Q4 2013 | Q4 2012 | 2013 | 2012 | ||||||||
Weighted Average Amounts Outstanding for EPS Purposes: | |||||||||||
Common Shares - basic | 64,685,508 | 63,000,839 | 64,645,316 | 62,866,189 | |||||||
Shares issued from assumed conversion of: | |||||||||||
- Restricted Shares | 87,317 | 115,880 | 77,999 | 126,534 | |||||||
- Stock Options | 666,602 | 716,932 | 723,917 | 761,283 | |||||||
- Performance Units | — | — | 26,807 | — | |||||||
Total Common Shares - diluted | 65,439,427 | 63,833,651 | 65,474,039 | 63,754,006 | |||||||
Weighted Average Amounts Outstanding for FFO, Normalized FFO and AFFO Purposes: | |||||||||||
Common Shares - basic | 64,685,508 | 63,000,839 | 64,645,316 | 62,866,189 | |||||||
OP Units - basic | 15,757,580 | 18,828,886 | 15,935,240 | 18,884,769 | |||||||
Total Common Shares and OP Units | 80,443,088 | 81,829,725 | 80,580,556 | 81,750,958 | |||||||
Shares and OP Units issued from assumed conversion of: | |||||||||||
- Restricted Shares | 87,317 | 115,880 | 77,999 | 126,534 | |||||||
- Stock Options | 666,602 | 716,932 | 723,917 | 761,283 | |||||||
- Performance Units | — | — | 26,807 | — | |||||||
Total Common Shares and Units - diluted | 81,197,007 | 82,662,537 | 81,409,279 | 82,638,775 | |||||||
Period Ending Amounts Outstanding: | |||||||||||
Common Shares | 65,205,274 | ||||||||||
OP Units | 15,671,537 | ||||||||||
Total Common Shares and Units | 80,876,811 | ||||||||||
14
DUPONT FABROS TECHNOLOGY, INC.
2014 Guidance
The earnings guidance/projections provided below are based on current expectations and are forward-looking.
Expected Q1 2014 per share | Expected 2014 per share | ||
Net income per common share and unit - diluted | $0.27 to $0.29 | $1.09 to $1.19 | |
Depreciation and amortization, net | 0.29 | 1.19 | |
FFO per share - diluted (1) | $0.56 to $0.58 | $2.28 to $2.38 | |
Loss on early extinguishment of debt | — | — | |
Normalized FFO per share - diluted (1) | $0.56 to $0.58 | $2.28 to $2.38 | |
2014 Debt Assumptions | |
Weighted average debt outstanding | $977.0 million |
Weighted average interest rate (one month LIBOR average 0.36%) | 4.59% |
Total interest costs | $44.8 million |
Amortization of deferred financing costs | 3.7 million |
Interest expense capitalized | (8.8) million |
Deferred financing costs amortization capitalized | (0.6) million |
Total interest expense after capitalization | $39.1 million |
2014 Other Guidance Assumptions | |
Total revenues | $400 to $415 million |
Base rent (included in total revenues) | $280 to $290 million |
Straight-line revenues (included in base rent) (2) | $(4) to $(9) million |
General and administrative expense | $17 to $19 million |
Investments in real estate - development (3) | $225 to $275 million |
Improvements to real estate excluding development | $4 million |
Preferred stock dividends | $27 million |
Annualized common stock dividend | $1.40 per share |
Weighted average common shares and OP units - diluted | 81 million |
Common share repurchase | No amounts budgeted |
Acquisitions of income producing properties | No amounts budgeted |
(1) | For information regarding FFO and Normalized FFO, see “Reconciliations of Net Income to FFO, Normalized FFO and AFFO” on page 6 of this earnings release. |
(2) | Straight-line revenues are projected to reduce total revenues in 2014 as cash rents are projected to be higher than GAAP rents. |
(3) | Represents cash spend expected in 2014 for the ACC7, SC1 Phase IIA and CH2 developments. The CH2 development is forecasted to begin in the second quarter of 2014 with an in service date in the first half of 2015. |
15