Attached files
| file | filename |
|---|---|
| 8-K - 8-K - SOUTH STATE Corp | a14-4478_18k.htm |
| EX-99.1 - EX-99.1 - SOUTH STATE Corp | a14-4478_1ex99d1.htm |
Exhibit 99.2
|
|
4th Quarter 2013 Earnings Call January 28, 2014 |

|
|
Cautionary Statement Regarding Forward Looking Statements Statements included in this report which are not historical in nature are intended to be, and are hereby identified as, forward looking statements for purposes of the safe harbor provided by Section 21E of the Securities Exchange Act of 1934. Forward looking statements generally include words such as “expects,” “projects,” “anticipates,” “believes,” “intends,” “estimates,” “strategy,” “plan,” “potential,” “possible” and other similar expressions. The Company cautions readers that forward looking statements are subject to certain risks and uncertainties that could cause actual results to differ materially from anticipated results. Such risks and uncertainties, include, among others, the following possibilities: (1) the outcome of any legal proceedings instituted against the Company; (2) credit risks associated with an obligor’s failure to meet the terms of any contract with the bank or otherwise fail to perform as agreed under the terms of any loan-related document; (3) interest risk involving the effect of a change in interest rates on the bank’s earnings, the market value of the bank's loan and securities portfolios, and the market value of the Company's equity; (4) liquidity risk affecting the bank’s ability to meet its obligations when they come due; (5) risks associated with an anticipated increase in the Company's investment securities portfolio, including risks associated with acquiring and holding investment securities or potentially determining that the amount of investment securities the Company desires to acquire are not available on terms acceptable to the Company; (6) price risk focusing on changes in market factors that may affect the value of traded instruments in “mark-to-market” portfolios; (7) transaction risk arising from problems with service or product delivery; (8) compliance risk involving risk to earnings or capital resulting from violations of or nonconformance with laws, rules, regulations, prescribed practices, or ethical standards; (9) regulatory change risk resulting from new laws, rules, regulations, accounting principles, proscribed practices or ethical standards, including, without limitation, increased capital requirements (including, without limitation, the impact of the capital rules adopted to implement Basel III), Consumer Financial Protection Bureau rules and regulations, and potential changes in accounting principles relating to loan loss recognition; (10) strategic risk resulting from adverse business decisions or improper implementation of business decisions; (11) reputation risk that adversely affects earnings or capital arising from negative public opinion; (12) terrorist activities risk that results in loss of consumer confidence and economic disruptions; (13) cybersecurity risk related to our dependence on internal computer systems and the technology of outside service providers, as well as the potential impacts of third-party security breaches, subjects the company to potential business disruptions or financial losses resulting from deliberate attacks or unintentional events; (14) economic downturn risk potentially resulting in deterioration in the credit markets, greater than expected non-interest expenses, excessive loan losses and other negative consequences, which risks could be exacerbated by potential negative economic developments resulting from federal spending cuts and/or one or more federal budget-related impasses or actions; (15) greater than expected noninterest expenses; (16) excessive loan losses; (17) failure to realize synergies and other financial benefits from, and to limit liabilities associates with, mergers and acquisitions, including, without limitation, mergers with The Savannah Bancorp, Inc. (“Savannah”) and First Financial Holdings, Inc. ("FFCH"), within the expected time frame; (18) potential deposit attrition, higher than expected costs, customer loss and business disruption associated with merger and acquisition integration, including, without limitation, with respect to Savannah and FFCH, and including, without limitation, potential difficulties in maintaining relationships with key personnel and other integration related-matters; (19) the risks of fluctuations in market prices for Company common stock that may or may not reflect economic condition or performance of the Company; (20) the payment of dividends on Company common stock is subject to regulatory supervision as well as the discretion of the board of directors of the Company, the Company's performance and other factors; and (21) other risks and uncertainties disclosed in the Company's most recent Annual Report on Form 10-K filed with the SEC or disclosed in documents filed or furnished by the Company with or to the SEC after the filing of such Annual report on Form 10-K, any of which could cause actual results to differ materially from future results expressed, implied or otherwise anticipated by such forward looking statements. The Company undertakes no obligation to update or otherwise revise any forward-looking statements, whether as a result of new information, future events, or otherwise. Non-GAAP Measures Statements included in this presentation include non-GAAP measures and should be read along with the accompanying tables to the earnings release which provide a reconciliation of non-GAAP measures to GAAP measures. Management believes that these non-GAAP measures provide additional useful information. Non-GAAP measures should not be considered as an alternative to any measure of performance or financial condition as promulgated under GAAP, and investors should consider the company's performance and financial condition as reported under GAAP and all other relevant information when assessing the performance or financial condition of the company. Non-GAAP measures have limitations as analytical tools, and investors should not consider them in isolation or as a substitute for analysis of the company's results or financial condition as reported under GAAP. Forward Looking Statements and Non-GAAP Measures 2 |
|
|
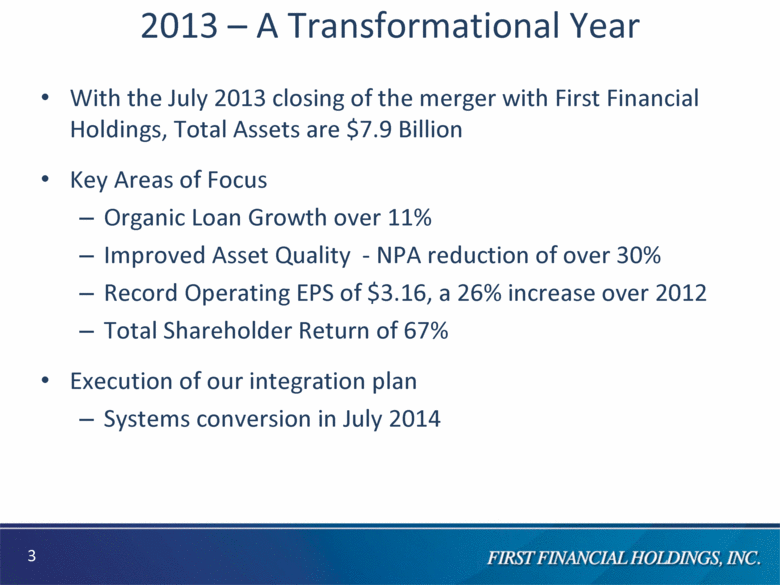
2013 – A Transformational Year With the July 2013 closing of the merger with First Financial Holdings, Total Assets are $7.9 Billion Key Areas of Focus Organic Loan Growth over 11% Improved Asset Quality - NPA reduction of over 30% Record Operating EPS of $3.16, a 26% increase over 2012 Total Shareholder Return of 67% Execution of our integration plan Systems conversion in July 2014 3 |
|
|
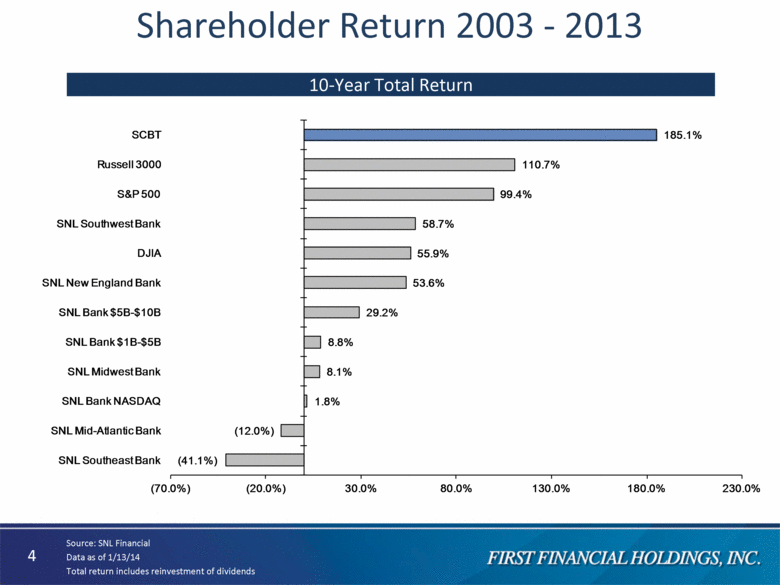
Shareholder Return 2003 - 2013 10-Year Total Return 4 Source: SNL Financial Data as of 1/13/14 Total return includes reinvestment of dividends (41.1%) (12.0%) 1.8% 8.1% 8.8% 29.2% 53.6% 55.9% 58.7% 99.4% 110.7% 185.1% (70.0%) (20.0%) 30.0% 80.0% 130.0% 180.0% 230.0% SNL Southeast Bank SNL Mid - Atlantic Bank SNL Bank NASDAQ SNL Midwest Bank SNL Bank $1B - $5B SNL Bank $5B - $10B SNL New England Bank DJIA SNL Southwest Bank S&P 500 Russell 3000 SCBT |
|
|
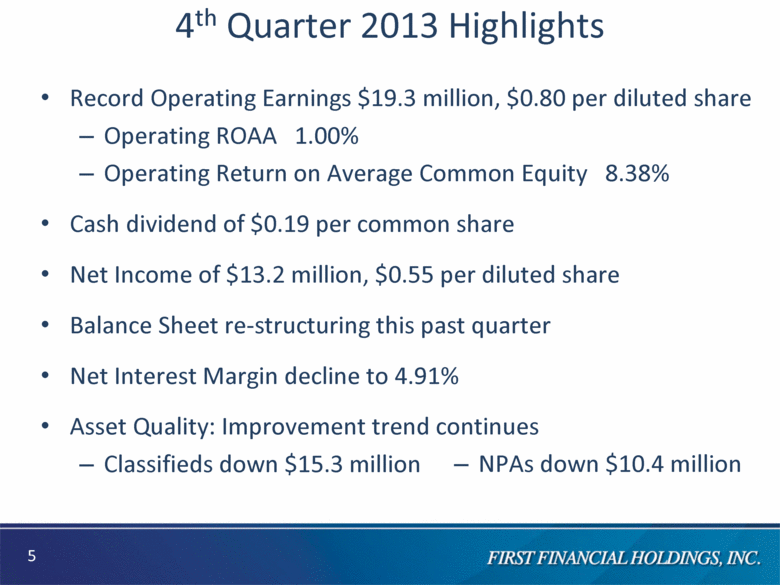
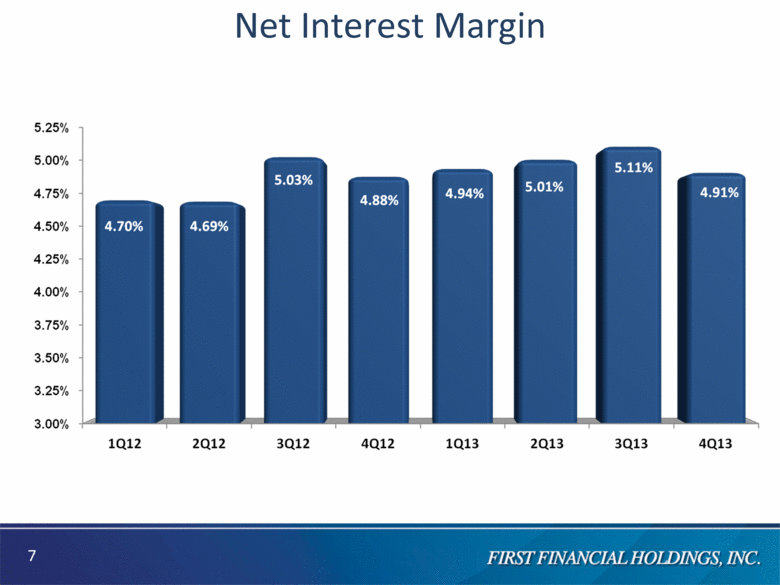
4th Quarter 2013 Highlights Record Operating Earnings $19.3 million, $0.80 per diluted share Operating ROAA 1.00% Operating Return on Average Common Equity 8.38% Cash dividend of $0.19 per common share Net Income of $13.2 million, $0.55 per diluted share Balance Sheet re-structuring this past quarter Net Interest Margin decline to 4.91% Asset Quality: Improvement trend continues Classifieds down $15.3 million NPAs down $10.4 million 5 |
|
|
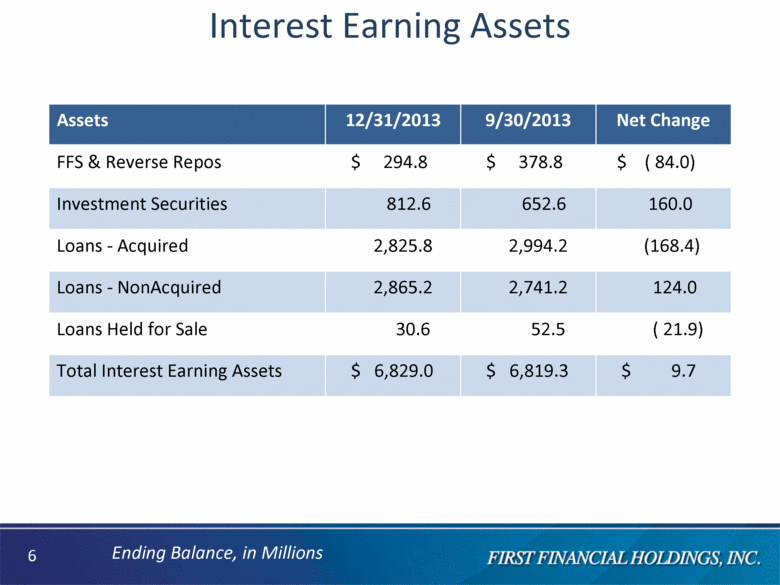
Interest Earning Assets Assets 12/31/2013 9/30/2013 Net Change FFS & Reverse Repos $ 294.8 $ 378.8 $ ( 84.0) Investment Securities 812.6 652.6 160.0 Loans - Acquired 2,825.8 2,994.2 (168.4) Loans - NonAcquired 2,865.2 2,741.2 124.0 Loans Held for Sale 30.6 52.5 ( 21.9) Total Interest Earning Assets $ 6,829.0 $ 6,819.3 $ 9.7 Ending Balance, in Millions 6 |
|
|
Net Interest Margin 7 |
|
|
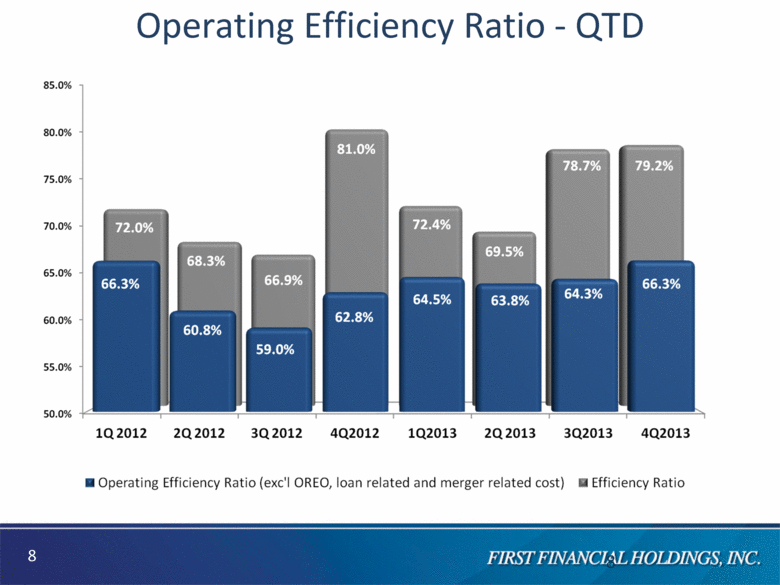
Operating Efficiency Ratio - QTD 8 8 |
|
|
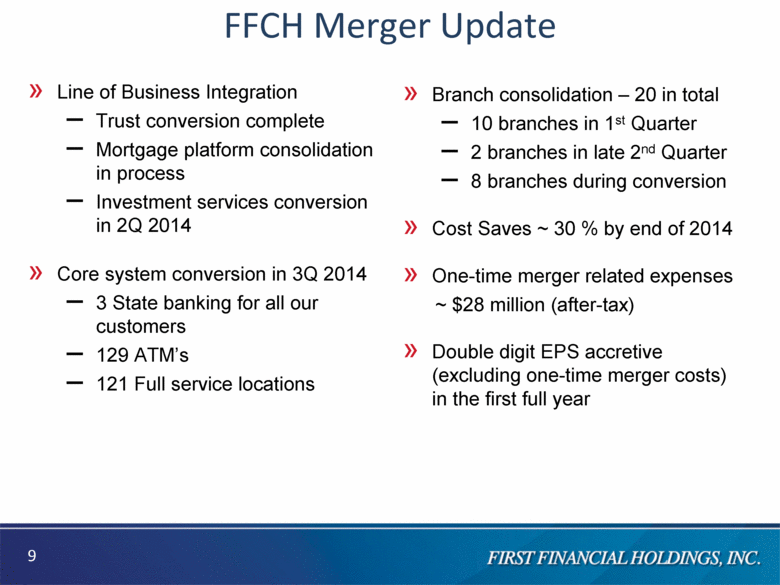
Branch consolidation – 20 in total 10 branches in 1st Quarter 2 branches in late 2nd Quarter 8 branches during conversion Cost Saves ~ 30 % by end of 2014 One-time merger related expenses ~ $28 million (after-tax) Double digit EPS accretive (excluding one-time merger costs) in the first full year Line of Business Integration Trust conversion complete Mortgage platform consolidation in process Investment services conversion in 2Q 2014 Core system conversion in 3Q 2014 3 State banking for all our customers 129 ATM’s 121 Full service locations 9 FFCH Merger Update |
|
|
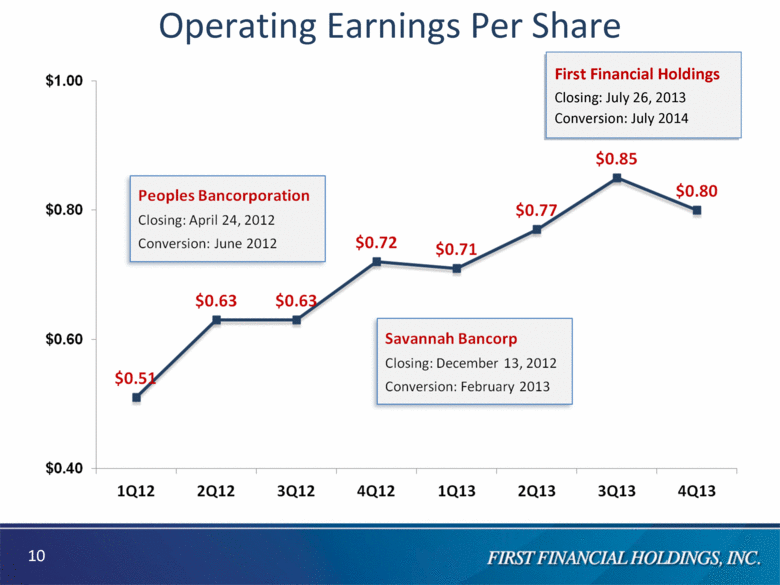
First Financial Holdings Closing: July 26, 2013 Conversion: July 2014 Operating Earnings Per Share 10 |