Attached files
| file | filename |
|---|---|
| 8-K - 8-K - W. P. Carey Inc. | a14-4355_18k.htm |
| EX-99.1 - EX-99.1 - W. P. Carey Inc. | a14-4355_1ex99d1.htm |
Exhibit 99.2
|
|
W. P. Carey Inc. January 2014 |

|
|
Key Investment Highlights One of the largest owners / managers of net-lease properties with approximately $15.4 billion of assets(1) Highly diversified portfolio by tenant, industry and geography Mix of office, industrial, warehouse / distribution and retail assets Geographically diversified across 45 U.S. states and 10 countries in Europe Unique Business Model Large Diversified Portfolio Experienced Management Team Stable cash flows from long-term leases, with contractual rent increases, to creditworthy tenants Consistent fee income stemming from management of non-traded REIT assets International and domestic real estate presence Access to non-traded REIT equity as an additional source of growth Founded in 1973 with a track record of investing and operating through multiple economic cycles Senior management has extensive experience in commercial real estate investment and capital markets Investing for the long runTM | 2 Flexible and Conservative Balance Sheet Net pro rata debt to enterprise value of 38% and total pro rata debt to gross assets of 46%(2) Investment grade credit ratings from S&P (BBB, stable) and Moody’s (Baa2, stable) Track Record of Investor Returns Long history of stable and growing dividend Returns have outperformed major indices, including the S&P 500 and the MSCI US REIT Index(3) Forecast FY14 minimum dividend of $3.52 represents a 5.8% dividend yield and 78% AFFO payout ratio(4) Combined Company as of September 30, 2013. Owned and managed portfolio based on AUM as of September 30, 2013 and WPC enterprise value based upon stock price of $60.98 per share as of January 24, 2014. Total pro rata debt to total market capitalization based on WPC stock price of $60.98 as of January 24, 2014. Presented on a Combined Company basis. Since January 1, 2009. Past performance does not guarantee future results. Based on $60.98 share price as of January 24, 2014. Payout ratio based on midpoint of AFFO guidance for 2014 (see page 3). |
|
|
W. P. Carey Current(1) CPA®:16 – Global(2) Combined Company(3) Equity Market Capitalization $4.2 billion $2.3 billion $6.0 billion Total Net Pro Rata Debt $2.0 billion $1.7 billion $3.7 billion Total Enterprise Value $6.2 billion $4.0 billion $9.7 billion Based on financials as of September 30, 2013 and WPC stock price of $60.98 as of January 24, 2014. Based on financials as of September 30, 2013 and a proposed purchase price of $11.25 per share. As of September 30, 2013 and is adjusted for W. P. Carey’s current ~18.5% ownership of CPA®:16 – Global. Includes transactions by WPC and the Managed REITs; includes estimated funding commitments for build-to-suit investments at December 31, 2013. Investing for the long runTM | 3 W. P. Carey Inc. is proposing to merge with CPA®:16 – Global, one of its managed non-traded REITs, in an all-stock transaction valued at approximately $4.0 billion, including pro-rata debt Approximately 31 million shares currently expected to be issued as a result Post-merger, the combined company would have a total enterprise value of approximately $9.7 billion CPA®:16 Merger Balance Sheet Acquisitions In January 2014, WPC received investment grade ratings of BBB / Baa2 from S&P and Moody’s, respectively New credit facility expected Q1 ‘14 Approximately $1.8 billion of 2013 total investment volume, including €350 million ($460 million) in Europe(4) Total of approximately $10 billion of acquisitions since 2004 Recent Developments The merger will enhance WPC’s size, diversification and continue to shift the revenue mix to stable real estate income W. P. Carey and CPA®:16 stockholders approved the merger on January 24, 2014 Merger is expected to close on January 31, 2014, subject to customary closing conditions Guidance Guidance for 2014 AFFO of $4.40 - $4.65 |
|
|
W. P. Carey’s 40+ Year History Total Assets Under Ownership and Management As of September 30, 2013. Based on AUM as of September 30, 2013 and WPC enterprise value utilizing a stock price of $60.98 per share as of January 24, 2014. Investing for the long runTM | 4 1979 – CPA series of investment programs begin 1973 – Company is founded by Wm. Polk Carey to provide diversified net-lease partnerships for individual investors 1988 – W. P. Carey Group assets under management surpass $500mm 2008 – European Asset Management office established in Amsterdam 2000 – W. P. Carey & Co. LLC (NYSE: WPC) is created from the merger of Carey Diversified LLC and W. P. Carey & Co. Inc. 1999 – London office established 1998 – W. P. Carey’s first European investment 1998 – CPA®:1-9 go public on NYSE as Carey Diversified LLC (NYSE: CDC) 2012 – W. P. Carey merges with CPA®:15 and becomes a publicly traded REIT 2013 – W. P. Carey celebrates its 40th Anniversary 2013 – W. P. Carey & CPA®:16 agree to merge, with a Combined Company expected enterprise value of $10 billion 1982 – W. P. Carey provides sale leaseback financing for William E. Simon’s LBO of Gibson Greetings 1973 |

|
|
Diversified Net Lease Portfolio Owns Manages W. P. Carey Post Merger Investing for the long runTM | 5 CPA® REITs and CWI $9.7 billion enterprise value post CPA®:16 merger(1) Diverse portfolio of office, warehouse / logistics, industrial and retail properties Generates approximately 91% of AFFO through its owned real estate assets(3) Manages $5.7 billion of net-leased real estate post CPA®:16 merger(2) Fees for assets under management and acquisitions Generates approximately 9% of AFFO in fee income from managing the day-to-day operations of real estate investments for these funds(3) YTD 2013 Combined Company AFFO(3) Real Estate Ownership 91% Investment Management 9% Includes Combined Company market cap based on $60.98 share price as of January 24, 2014, and pro rata debt as of September 30, 2013. Estimated value of assets under management, cash and distributions payable as of September 30, 2013. Includes our first nine months of 2013 annualized pro rata share of AFFO from real estate ownership and investment management. Note: Past performance does not guarantee future results. Share Price Performance 09/28/12 CPA®:15 merger closed and W. P. Carey converted to a REIT 06/25/13 CPA®:16 merger announced |
|
|
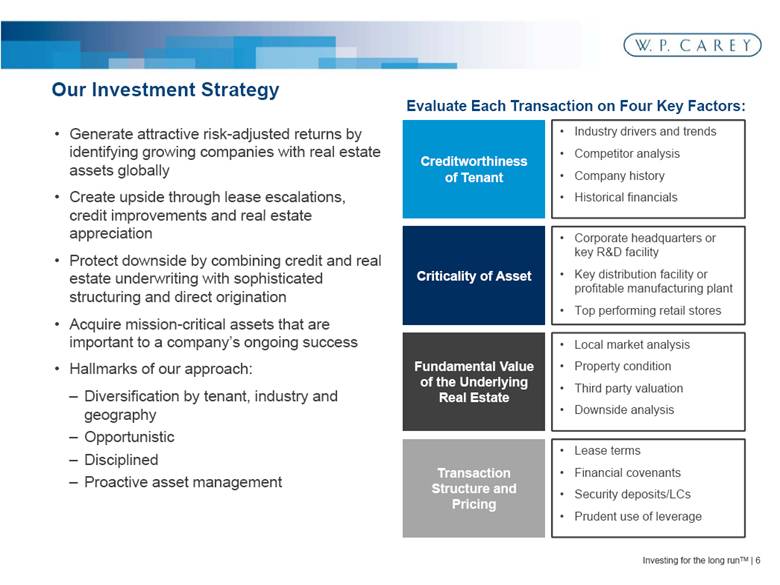
Our Investment Strategy Investing for the long runTM | 6 Creditworthiness of Tenant Criticality of Asset Transaction Structure and Pricing Fundamental Value of the Underlying Real Estate Industry drivers and trends Competitor analysis Company history Historical financials Corporate headquarters or key R&D facility Key distribution facility or profitable manufacturing plant Top performing retail stores Local market analysis Property condition Third party valuation Downside analysis Lease terms Financial covenants Security deposits/LCs Prudent use of leverage Evaluate Each Transaction on Four Key Factors: Generate attractive risk-adjusted returns by identifying growing companies with real estate assets globally Create upside through lease escalations, credit improvements and real estate appreciation Protect downside by combining credit and real estate underwriting with sophisticated structuring and direct origination Acquire mission-critical assets that are important to a company’s ongoing success Hallmarks of our approach: Diversification by tenant, industry and geography Opportunistic Disciplined Proactive asset management |
|
|
WPC Current(1)(2) CPA®:16 – Global(1)(2) Combined Company(2) Number of Properties 423 479 720 Number of Tenants 125 140 234 Square Footage 40 million 46 million 85 million Annualized Contractual Minimum Rent(3) $332 million $329 million $661 million No. of Countries 10 13 16 Average Lease Term 8.7 years 9.6 years 9.2 years Occupancy 99% 98% 98% Top 10 Tenant Concentration(3) 39% 30% 31% % of Investment Grade Tenants(3) 31% 13% 22% Weighted Average Interest Rate 4.4% 5.5% 4.7% Reflects results as of September 30, 2013. Reflects pro-rata joint venture ownership of certain properties. Excludes operating properties. Investing for the long runTM | 7 W. P. Carey’s Portfolio |
|
|
By Property Type(1) W. P. Carey’s Portfolio Diversification - Combined Company By Tenant Industry(3) As of September 30, 2013. Based on pro rata Annualized Contractual Minimum Base Rent (“ABR”) as of September 30, 2013. Excludes operating properties. Other includes: Child Care and Social Services; Education; Hospitality; Sports; and Theater. Based on ABR, the Moody’s Classification System and information provided by the tenant. Includes rent from tenants in the following industries: consumer non-durable goods; transportation – personal; grocery; federal, state and local government; insurance; aerospace and defense; mining, metals and primary metal industries; consumer and durable goods; forest products and paper; textiles, leather and apparel; banking; consumer services; and utilities. Net-lease transactions Investing for the long runTM | 8 Office 27% Industrial 26% Warehouse / Distribution 19% Retail 14% Self –storage 4% Other(2) 10% Retail Stores 20% Electronics 10% Chemicals, Plastics, Rubber, and Glass 6% Healthcare, Education and Childcare 5% Automobile 5% Business and Commercial Services 5% Construction and Building 5% Beverages, Food, and Tobacco 4% Media: Printing and Publishing 4% Transportation – Cargo 4% Telecommunications 4% Hotels and Gaming 3% Leisure, Amusement, Entertainment 3% Machinery 3% Buildings and Real Estate 3% Other(4) 17% Top 10 tenants Annualized rent ($’000s) % of Total $41,663 6.3% 32,843 5.0% 28,738 4.3% 18,259 2.8% 16,100 2.4% 14,514 2.2% 14,486 2.2% 11,944 1.8% 11,552 1.7% 11,538 1.7% Top 10 Total $201,636 30.5% (5) (5) |
|
|
Internal Growth from Built-In Rent Increases - Combined Company Investing for the long runTM | 9 As of September 30, 2013. Based on pro rata ABR and exchange rates as of September 30, 2013. Other includes rents based on a percentage of tenant revenue. Uncapped CPI 44% CPI-based 26% Fixed 25% Other(2) 3% None 2% 98% of leases will include either fixed or CPI-based rent increases or percentage rent (1) |
|
|
Proactive Asset Management Investing for the long runTM | 10 Domestic and international asset management capabilities to address issues such as lease maturities, changing tenant credit profiles and asset repositioning or dispositions Deep tenant relationships, intimate asset knowledge, and robust local market intelligence minimizes asset vacancy and downtime Transactions Team Operations Team Individual specialized expertise Team approach to compliance Scalable structure Institutional knowledge Individual tenant relationships Team approach to deal flow High productivity Relationship continuity Leasing Dispositions Lease modifications Credit & real estate risk analysis Bankruptcy & workout Mortgage debt financing Building expansions Lease compliance Insurance Property inspections Non-NNN lease administration Real estate tax Build-to-suit Projections & portfolio valuation Staffing Model Capabilities Personnel Transactions personnel based in New York, Amsterdam and Shanghai 13 total team members Operations personnel based in New York, Amsterdam and Shanghai 29 total team members |
|
|
Acquisition Track Record Investing for the long runTM | 11 Total acquisitions of $1.8 billion in 2013 including €350 million ($460 million) in Europe(1) Includes acquisitions by WPC and on behalf of our managed funds Countries: U.S., Germany, U.K., Finland, Netherlands, Poland and Croatia Asset types: Office, Retail, Manufacturing, R&D, Hotels and Self-storage Approximately $10 billion in global investment volume over the past decade Includes transactions by WPC and the Managed REITs; includes estimated funding commitments for build-to-suit investments at December 31, 2013. Facility Type: Headquarters and Office Terms: $72.5 million, 10-year lease Size: 679,109 square feet Location: Northfield, IL Facility Type: Office Terms: £40 million ($62 million), 15-year lease Size: 211,367 square feet Location: Manchester, U.K. U.K. Government Select 2013 Acquisitions |
|
|
International Investments – Combined Company More owner-occupied commercial real estate Higher population density Stricter zoning / land-use regulations High barriers to entry for competitors Opportunistic pricing: yields currently wider relative to similar U.S. deals Why We Like Europe International Diversification By Geography Annualized Base Rent ($millions) Percent of Total Region United States East $129 19% South 127 19% West 115 18% Midwest 83 13% Total U.S. $454 69% International Germany $68 10% France 54 8% Finland 33 5% Poland 18 3% United Kingdom 12 2% Other(1) 22 3% Total International $207 31% Total WPC $661 100% W. P. Carey has been investing internationally for 15 years, primarily in Western and Northern Europe As of September 30, 2013. Other includes Belgium, Canada, Hungary, Japan, Malaysia, Mexico, Netherlands, Spain, Sweden and Thailand. Investing for the long runTM | 12 United States 69% International 31% Germany 32% France 26% Finland 16% Poland 10% United Kingdom 6% Other(1) 10% |
|
|
WPC’s investment management business provides real economic benefits Provides access to capital consistently through various market cycles Stable asset management fee stream based on percentage of gross asset value and general partner interests Allows WPC to spread costs over a bigger asset base Successfully completed 14 separate funds between 1979 and 2012 with an average IRR (net of fees) of approximately 10% to investors Current Managed REITs Investment Management Overview Investing for the long runTM | 13 AUM(1) Property Type Year Established Fundraising Status CPA®:17 - Global $4.7 billion Net-Lease 2007 Closed Carey Watermark Investors $1.0 billion Lodging 2010 Open(2)(3) CPA®:18 - Global $68 million Net-Lease 2013 Open(4) (Commenced July 2013) As of September 30, 2013. Re-opened fundraising in 2014 Secondary offering of up to $350 million of equity and $300 million for DRIP. Offering of up to $1 billion of common stock and $400 million for DRIP. |
|
|
Balance Sheet Overview Diversify sources of capital / minimize cost of capital Transition to a predominately unsecured capital structure and increase unencumbered asset base Lengthen the debt maturity profile – continue matching debt to assets Maintain conservative leverage, pro-forma for CPA®:16 transaction Fund future growth with appropriate mix of debt and equity Objectives Company Metrics(1) Investing for the long runTM | 14 Capitalization Current Combined(2) Equity Market Cap $4.2 billion $6.0 billion Total Pro Rata Debt $2.1 billion $3.9 billion Total Market Cap $6.3 billion $9.9 billion Selected Metrics Current Combined(2) Net Pro Rata Debt / Enterprise value 33% 38% Total Pro Rata Debt / Gross Assets(3) 43% 46% Weighted Average Interest Rate 4.4% 4.7% As of September 30, 2013 and WPC stock price of $60.98 as of January 24, 2014. The Combined Company is adjusted for W. P. Carey’s current ~18.5% ownership of CPA®:16 – Global. Gross assets represent total assets as of September 30, 2013 before accumulated depreciation. |
|
|
Investor Returns Investing for the long runTM | 15 Note: Past performance does not guarantee future results. Annualized dividend per share reflects annualized fourth quarter dividend per share for the respective year. Based on $60.98 share price as of January 24, 2014. Payout ratio based on and midpoint of AFFO guidance for 2014. Reflects anticipated minimum Combined Company annual dividend per share following transaction close. Subject to modification. Source: SNL Financial. Annualized Dividends per Share Total Return Comparison(3) W. P. Carey has increased its dividend every year since going public in 1998 FY 2014 expected minimum dividend of $3.52 with a yield of 5.8% and payout ratio of 78%(1) Annual dividend growth has averaged 5% from 1998 – 2013 Returns have outpaced major indices, including the S&P 500 and the MSCI US REIT Index (2) +357% +214% +229% |

|
|
Disclosures Cautionary Statement Concerning Forward-Looking Statements: Certain of the matters discussed in this communication constitute forward-looking statements within the meaning of the Securities Act of 1933, as amended, and the Securities Exchange Act of 1934, as amended, both as amended by the Private Securities Litigation Reform Act of 1995. The forward-looking statements include, among other things, statements regarding the intent, belief or expectations of W. P. Carey and can be identified by the use of words such as “may,” “will,” “should,” “would,” “assume,” “outlook,” “seek,” “plan,” “believe,” “expect,” “anticipate,” “intend,” “estimate,” “forecast” and other comparable terms. These forward-looking statements include, but are not limited to, statements regarding the expected range of AFFO per diluted share, the benefits of the proposed merger with CPA®:16 – Global (the “Merger”), annualized dividends, funds from operations coverage, integration plans and expected synergies, anticipated future financial and operating performance and results, including estimates of growth, and the expected timing of completion of the proposed Merger. These statements are based on the current expectations of the management of W. P. Carey. It is important to note that the actual results of W. P. Carey or of the combined company following the consummation of the proposed Merger could be materially different from those projected in such forward-looking statements. There are a number of risks and uncertainties that could cause actual results to differ materially from the forward-looking statements. Other unknown or unpredictable factors could also have material adverse effects on future results, performance or achievements of the combined company. Discussions of some of these other important factors and assumptions are contained in W. P. Carey’s and CPA®:16 – Global’s filings with the SEC and are available at the SEC’s website at http://www.sec.gov, including Item 1A. Risk Factors in each company’s Annual Report on Form 10-K for the year ended December 31, 2012 and subsequent reports filed with the SEC. These risks, as well as other risks associated with the proposed Merger, are more fully discussed in the Form S-4 and the Joint Proxy Statement/Prospectus, as amended (File No. 333-191517) filed by W. P. Carey and CPA®:16 – Global. In light of these risks, uncertainties, assumptions and factors, the forward-looking events discussed in this communication may not occur. Readers are cautioned not to place undue reliance on these forward-looking statements, which speak only as of the date of this communication, unless noted otherwise. Except as required under the federal securities laws and the rules and regulations of the SEC, W. P. Carey does not undertake any obligation to release publicly any revisions to the forward-looking statements to reflect events or circumstances after the date of this communication or to reflect the occurrence of unanticipated events. Investing for the long runTM | 16 |
|
|
Disclosures Non-GAAP Financial Disclosure Funds from operations (“FFO”) is a non-GAAP measure defined by the National Association of Real Estate Investment Trusts (“NAREIT”). NAREIT defines FFO as net income or loss (as computed in accordance with GAAP) excluding: depreciation and amortization expense from real estate assets, impairment charges on real estate, gains or losses from sales of depreciated real estate assets and extraordinary items; however FFO related to assets held for sale, sold or otherwise transferred and included in the results of discontinued operations are included. These adjustments also incorporate the pro rata share of unconsolidated subsidiaries. FFO is used by management, investors and analysts to facilitate meaningful comparisons of operating performance between periods and among our peers. Although NAREIT has published this definition of FFO, companies often modify this definition as they seek to provide financial measures that meaningfully reflect their distinctive operations. We modify the NAREIT computation of FFO to include other adjustments to GAAP net income to adjust for certain non-cash charges such as amortization of intangibles, deferred income tax benefits and expenses, straight-line rents, stock compensation, gains or losses from extinguishment of debt and deconsolidation of subsidiaries and unrealized foreign currency exchange gains and losses. Our assessment of our operations is focused on long-term sustainability and not on such non-cash items, which may cause short-term fluctuations in net income but have no impact on cash flows. Additionally, we exclude expenses related to the CPA®:15 Merger and realized gain/losses on foreign exchange and derivatives which are not considered fundamental attributes of our business plan and do not affect our overall long-term operating performance. We refer to our modified definition of FFO as adjusted funds from operations (“AFFO”). We exclude these items from GAAP net income as they are not the primary drivers in our decision making process and excluding those items provides investors a view of our portfolio performance over time and make it more comparable to other REITs which are currently not engaged in acquisitions and mergers. We use AFFO as one measure of our operating performance when we formulate corporate goals, evaluate the effectiveness of our strategies, and determine executive compensation. We believe that AFFO is a useful supplemental measure for investors to consider because it will help them to better assess the sustainability of our operating performance without potentially distorting the impact of these short-term fluctuations. However, there are limits on the usefulness of AFFO to investors. For example, impairment charges and unrealized foreign currency losses that we exclude may become actual realized losses upon the ultimate disposition of the properties in the form of lower cash proceeds or other considerations. We use our FFO and AFFO measures as supplemental financial measures of operating performance. We do not use our FFO and AFFO measures as, nor should they be considered to be, alternatives to net earnings computed under GAAP, as alternatives to cash from operating activities computed under GAAP or as indicators of our ability to fund our cash needs. Furthermore, we do not calculate certain prospective financial information that would be required for a full reconciliation to GAAP net income, which information is not significant to the determination of our AFFO projections Pro Rata Amounts This presentation contains certain measures prepared under the pro rata consolidation method, which is not in accordance with GAAP. We refer to these non-GAAP measures as pro rata measures. We believe that these pro rata measures, including primarily “pro rata debt”, are useful to investors as they provide supplemental information on the nature and performance of our investments that is not easily discernible in the equivalent GAAP measures. Consistent with industry practice and as a means of procuring opportunities and sharing risk, we have a number of investments, usually with our affiliates, in which our economic ownership is less than 100%. Under the full consolidation method required under GAAP, we report 100% of the assets, liabilities, revenues and expenses of those investments that are deemed to be under our control or for which we are deemed to be the primary beneficiary, even if our ownership is less than 100%. Also, under GAAP, for all other jointly-owned investments, we report our net investment and our net income or loss from that investment. Under the pro rata consolidation method, we generally present our proportionate share, based on our economic ownership of these jointly-owned investments, of the assets, liabilities, revenues and expenses of those investments, as we use this information to evaluate our financial performance without including any ownership of the other investors. Our non-GAAP measures are not intended to be performance measures that should be regarded as alternatives to or more meaningful than, our GAAP measures. All data is as of September 30, 2013 unless otherwise noted. Investing for the long runTM | 17 |