Attached files
| file | filename |
|---|---|
| 8-K - 8-K - KEYCORP /NEW/ | d661532d8k.htm |
| EX-99.3 - EX-99.3 - KEYCORP /NEW/ | d661532dex993.htm |
| EX-99.1 - EX-99.1 - KEYCORP /NEW/ | d661532dex991.htm |
| KeyCorp
Fourth Quarter 2013 Earnings Review
January 23, 2014
Beth E. Mooney
Chairman and
Chief Executive Officer
Don Kimble
Chief Financial Officer
Exhibit 99.2 |
| 2
FORWARD-LOOKING STATEMENTS AND ADDITIONAL
INFORMATION DISCLOSURE
This presentation contains forward-looking statements, including statements
about our financial condition, results of operations, asset quality trends,
capital
levels
and
profitability.
Forward-looking
statements
can
often
be
identified
by
words
such
as
“outlook,”
“goal,”
“objective,”
“plan,”
“expect,”
“anticipate,”
“intend,”
“project,”
“believe,”
or “estimate.”
Forward-looking statements represent management’s current expectations
and forecasts regarding future events. If underlying assumptions prove to be
inaccurate or unknown risks or uncertainties arise, actual results could vary
materially from these projections or expectations. Risks and uncertainties
include but are not limited to: (1) deterioration of commercial real estate market fundamentals; (2) declining asset prices; (3)
adverse changes in credit quality trends; (4) changes in local, regional and
international business, economic or political conditions; (5) the extensive
and increasing regulation of the U.S. financial services industry; (6) increasing
capital and liquidity standards under applicable regulatory rules; (7)
unanticipated changes in our liquidity position, including but not limited to,
changes in the cost of liquidity, our ability to enter the financial markets and
to secure alternative funding sources; (8) our ability to receive dividends from
our subsidiary, KeyBank; (9) downgrades in our credit ratings or those
of
KeyBank;
(10)
operational
or
risk
management
failures
by
us
or
critical
third-parties;
(11)
breaches
of
security
or
failures
of
our
technology
systems
due to technological or other factors and cybersecurity threats;
(12) adverse judicial proceedings; (13) the occurrence of natural or man-made
disasters or conflicts or terrorist attacks; (14) a reversal of the U.S.
economic recovery due to economic, political or other shocks; (15) our ability to
anticipate interest rate changes and manage interest rate risk; (16) deterioration
of economic conditions in the geographic regions where we operate;
(17)
the
soundness
of
other
financial
institutions;
(18)
our
ability
to
attract
and
retain
talented
executives
and
employees,
to
effectively
sell
additional
products
or
services
to
new
or
existing
customers,
and
to
manage
our
reputational
risks;
(19)
our
ability
to
timely
and
effectively
implement
our
strategic initiatives; (20) increased competitive pressure due to industry
consolidation; (21) unanticipated adverse effects of acquisitions and
dispositions of assets or businesses; and (22) our ability to develop and
effectively use the quantitative models we rely upon in our business planning.
We provide greater detail regarding these factors in our 2012 Form 10-K and
subsequent filings, which are available online at www.key.com/ir and
www.sec.gov. Forward looking statements speak only as of the date they are made and
Key does not undertake any obligation to update the forward- looking
statements to reflect new information or future events. This
presentation
also
includes
certain
Non-GAAP
financial
measures
related
to
“tangible
common
equity,”
“Tier
1
common
equity,”
“pre-provision
net
revenue,”
“cash
efficiency
ratio,”
and
“adjusted
cash
efficiency
ratio.”
Management
believes
these
ratios
may
assist
investors,
analysts
and
regulators
in analyzing Key’s financials. Although Key has procedures in place to ensure
that these measures are calculated using the appropriate GAAP or
regulatory
components,
they
have
limitations
as
analytical
tools
and
should
not
be
considered
in
isolation,
or
as
a
substitute
for
analysis
of
results
under GAAP. For more information on these calculations and to view the
reconciliations to the most comparable GAAP measures, please refer to the
Appendix to this presentation or our most recent earnings press release.
Reconciliations to the most comparable GAAP measures for 1Q13 and 2Q13
Non-GAAP
financial
measures
are
available
in
our
second
quarter
2013
earnings
press
release.
All
of
the
foregoing
are
accessible
on
Key’s
website at www.key.com/ir. |
 3
Grew commercial and consumer loans
Total average loans up 5% from 2012, driven by CF&A up 12%
Net interest income up 3% from prior year
Fifth straight year of growth for investment banking and debt placement fees
Benefitted from investments: cards and payments income up 20%; mortgage
servicing revenue more than double prior year
Implemented $241 million in annualized savings
Optimized staffing; 2013 FTE down 5% from 2012
Consolidated 62 branches in 2013; 81 total, or approximately 8% of the
franchise since the launch of our efficiency initiative
Improve
Efficiency
Repurchased $474 million of common shares in 2013; $99 million in 4Q13
2013 total shareholder payout of 76%
Committed to capital priorities: organic growth, dividends, repurchases,
opportunistic growth
Optimize and
Grow
Revenue
Investor Highlights –
2013
Execution of strategy and differentiated business model driving results
Effectively
Manage
Capital |
| 4
Financial Review
*
**
**
*
*
*
*
*
*
* |
 5
Financial Highlights
TE = Taxable equivalent, EOP = End of Period
(a)
From continuing operations
(b)
Year-over-year average balance growth
(c)
From consolidated operations
(d)
12-31-13 ratios are estimated
(e)
Non-GAAP measure: see Appendix for reconciliation; 2Q13 and 1Q13
reconciliations are available in our 2Q13 earnings press release, available
on our website: www.key.com/ir
(f)
Efficiency initiative charges include pension settlement in 3Q13
and 4Q13
Metrics
4Q13
3Q13
2Q13
1Q13
4Q12
EPS –
assuming dilution
$ .26
$ .25
$ .21
$ .21
$ .20
Cash efficiency ratio
(e)
67.4
%
67.5
%
69.1
%
66.0
%
69.0
%
Adj. cash efficiency ratio (ex. initiative charges
(f)
)
(e)
65.1
63.6
65.4
64.5
67.5
Net interest margin (TE)
3.01
3.11
3.13
3.24
3.37
Return on average total assets
1.08
1.12
.95
.99
.96
Total loans and leases
3
%
5
%
7
%
6
%
7
%
CF&A loans
8
11
14
16
21
Deposits (excl. foreign deposits)
8
5
8
7
7
Tier 1 common equity
(d), (e)
11.2
%
11.2
%
11.2
%
11.4
%
11.4
%
Tier 1 risk-based capital
(d)
12.0
11.9
11.9
12.2
12.2
Tangible common equity to tangible assets
(e)
9.8
9.9
10.0
10.2
10.2
NCOs to average loans
.27
%
.28
%
.34
%
.38
%
.44
%
NPLs to EOP portfolio loans
.93
1.01
1.23
1.24
1.28
Allowance for loan losses to EOP loans
1.56
1.62
1.65
1.70
1.68
Financial
Performance
(a)
Balance
Sheet
Growth
(a),
(b)
Capital
(c)
Asset
Quality
(a) |
 6
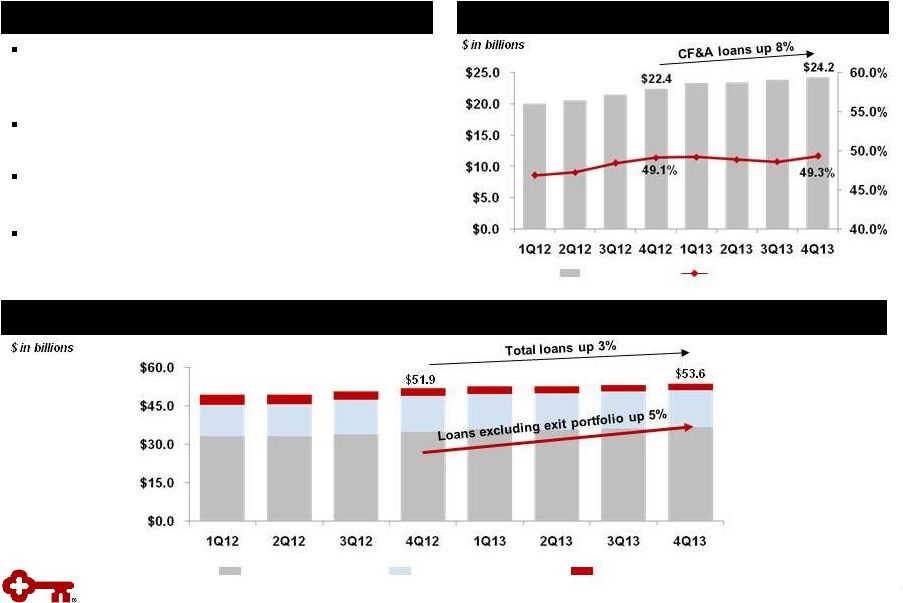
4Q13 total average loans up 3% from the prior
year; up 5% excluding the exit portfolio
–
Driven by CF&A up 8% in 4Q13 from 4Q12
Average loans up 1% unannualized from 3Q13 with
period-end loans up 2%
Total commitments up, with utilization relatively
stable
High quality new loan originations: consistent with
moderate risk profile
Loan Growth
Highlights
Average Commercial, Financial & Agricultural Loans
CF&A loans
Utilization rate
Average Loans
Exit Portfolios
Home Equity & Other
Total Commercial |
 7
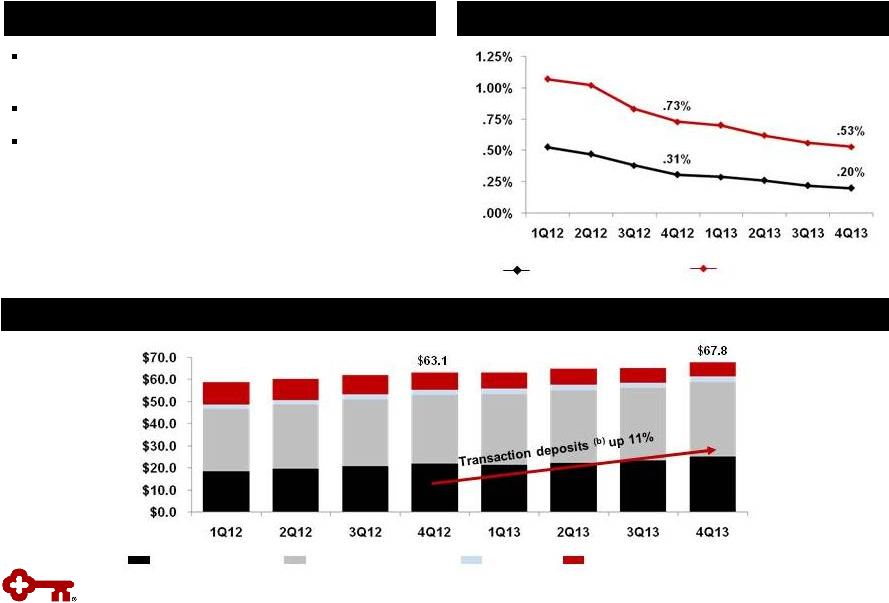
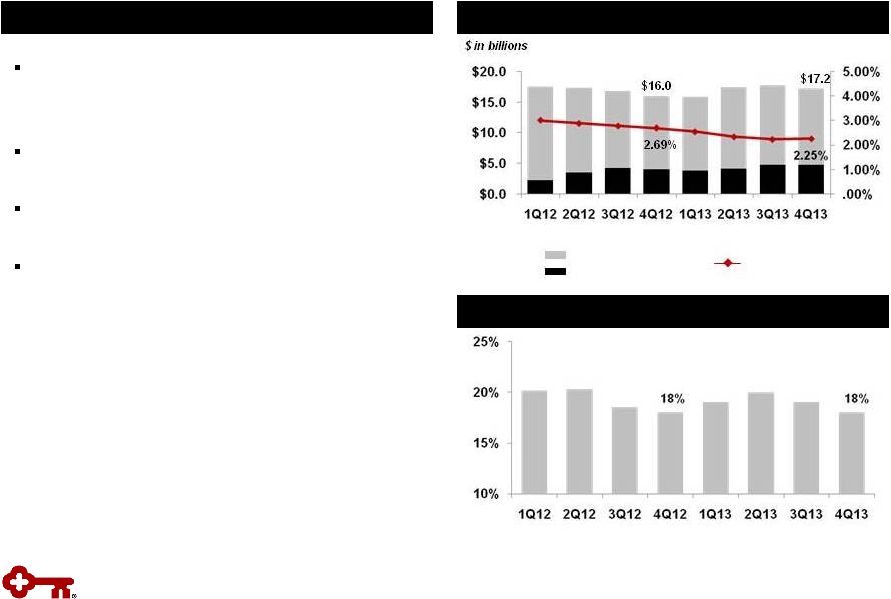
Improving Deposit Mix
Highlights
Funding Cost
Overall funding cost continues to improve, with
total deposit cost declining to 20 bps
Transaction deposit balances up 11% from 4Q12
Total CD maturities and average cost
–
2014 Q1: $1.6 billion at .65%
–
2014 Q2: $1.2 billion at 1.36%
–
2014 Q3: $1.0 billion at 1.62%
–
2014 Q4: $.6 billion at .86%
–
2015 and beyond: $1.9 billion at 1.75%
Average
Deposits
(a)
$ in billions
(a)
Excludes deposits in foreign office
(b)
Transaction deposits include noninterest-bearing, and NOW and MMDA
Cost of total deposits
(a)
Interest-bearing liability cost
CDs and other time deposits
Savings
Noninterest-bearing
NOW and MMDA |
 8
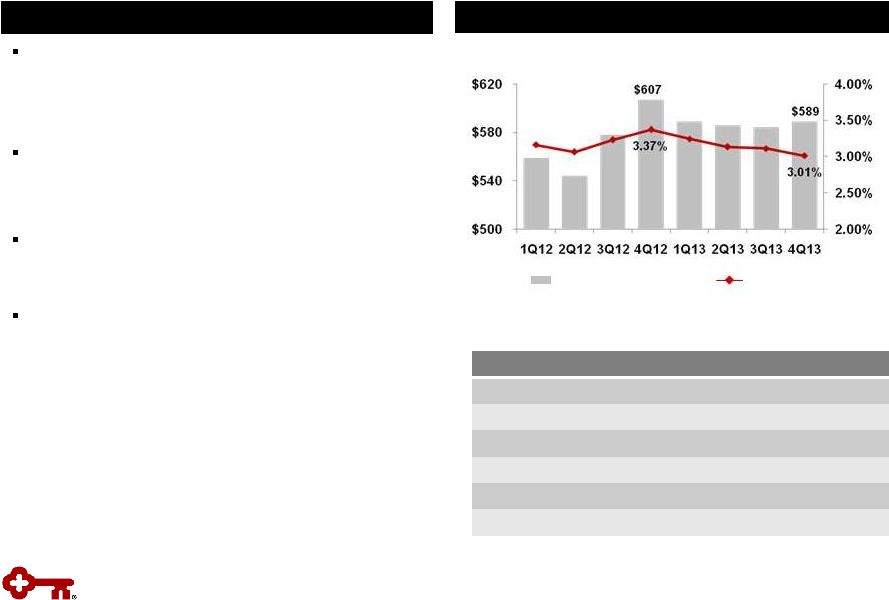
Net Interest Income and Margin
TE = Taxable equivalent
Continuing Operations
Highlights
Net Interest Income (TE) & Net Interest Margin (TE) Trend
Net interest income up 1% from 3Q13
–
Relatively stable excl. the impact of leveraged
lease terminations, which reduced net interest
income by $8 MM in 3Q13 and $2 MM in 4Q13
Net interest margin down 10 bps from prior quarter
–
Result of higher levels of liquidity
–
Larger than anticipated deposit inflows
Compared to prior year, net interest income and
margin were impacted by asset repricing, swap
terminations and leveraged lease terminations
Maintaining moderate asset sensitive position
–
Naturally asset sensitive balance sheet:
approximately 70% of loans variable rate
–
High quality investment portfolio with average
life of 3.6 years
–
Flexibility to quickly adjust interest rate risk
position through use of swaps
NIM Change (bps):
vs. 3Q13
Increased liquidity
(.11)
Loan yield and mix
(.02)
Interest rate risk management / swaps
(.02)
Leveraged lease terminations 4Q13 vs. 3Q13
.03
Deposit pricing / mix
.02
Total Change
(.10)
Net interest income (TE)
NIM (TE)
$ in millions |
 9
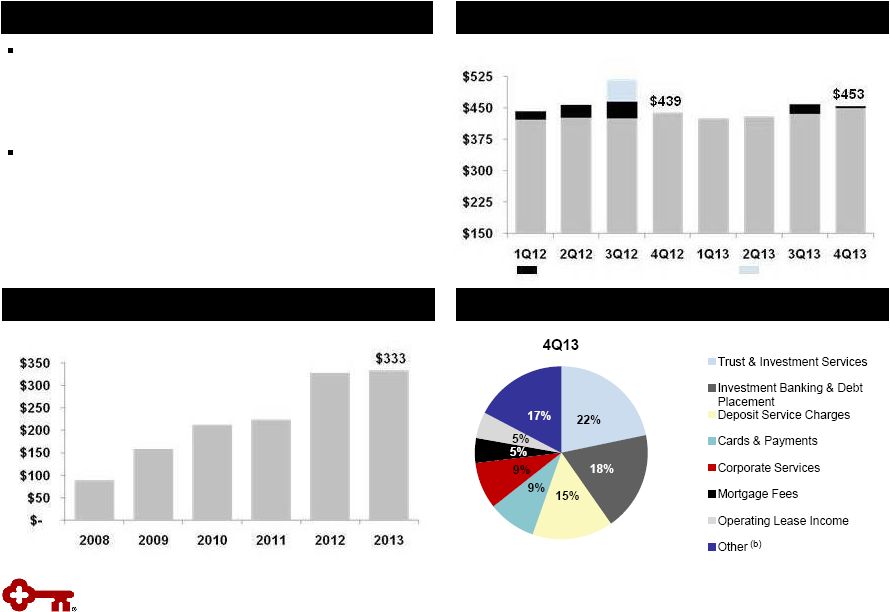
Noninterest Income
TE = Taxable equivalent
Continuing Operations
Highlights
Noninterest Income
Core fee income businesses showing strength
–
Excl. gains from leveraged lease terminations
(a)
,
noninterest income is up 2% from prior year and up
3% from prior quarter
Benefitting from investments
–
Five consecutive years of growth for investment
banking and debt placement
–
Cards and payments income up 20% in 2013
–
Mortgage servicing revenue more than double FY12
Investment Banking & Debt Placement Fees
Noninterest Income Components
$ in millions
$ in millions
(a)
Excludes gains resulting from the early termination of leveraged
leases amounting to $23 MM in 3Q13 and $4 MM in 4Q13
(b)
Other includes corporate-owned life insurance, principal investing, etc.
Leveraged lease termination gains
TruPS gains |
 $
in millions 10
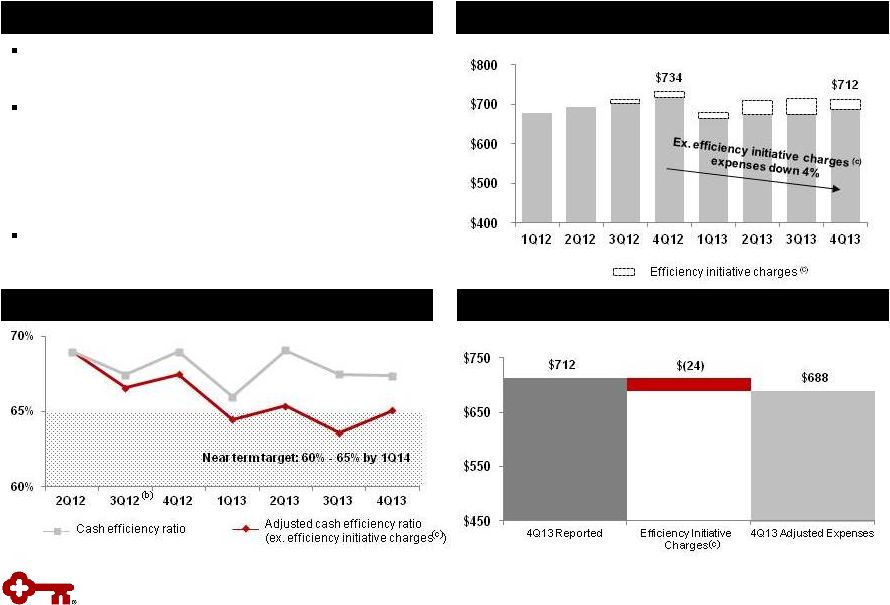
Focused Expense Management
Noninterest Expense
$ in millions
Highlights
Noninterest Expense
(a)
Non-GAAP measures: see Appendix for reconciliation
(b)
Excludes one-time gains of $54 million related to the redemption of trust
preferred securities (c)
Efficiency initiative charges includes pension settlement in 3Q13 and 4Q13
Efficiency Ratio
(a)
Expenses down 3% from prior year and 1% from
prior quarter
Compared to prior quarter, expenses impacted by:
–
Lower efficiency initiative and pension settlement
charges (down $17 MM)
–
Increased incentives and business services and
professional fees (up $11 MM)
Implemented $241 MM in annualized savings
–
Efficiency charges of $24 MM in 4Q13 |
 11
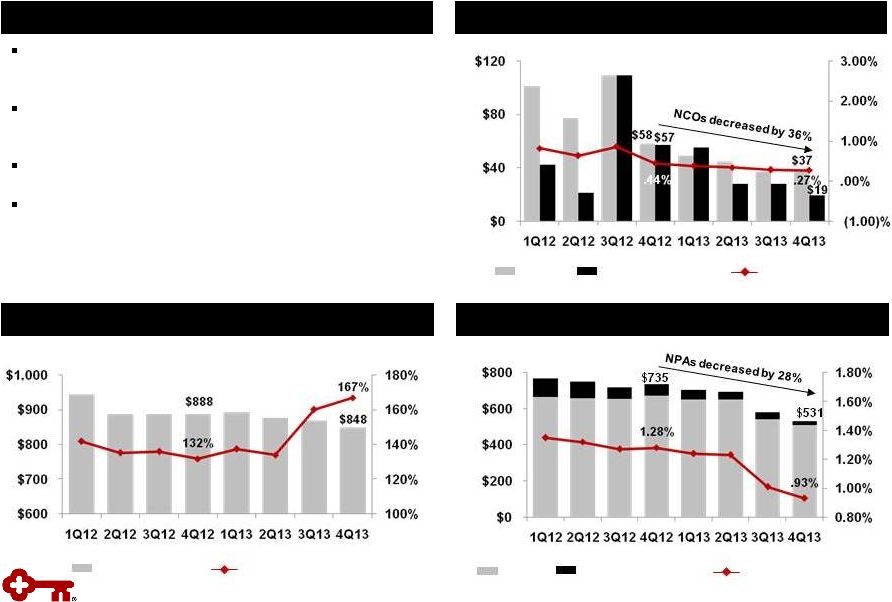
Nonperforming Assets
Net Charge-offs & Provision for Loan and Lease Losses
NPLs
NPLs to period-end loans
NCOs
Provision for loan and
lease losses
NCOs to average loans
$ in millions
$ in millions
NPLs held for sale,
OREO & other NPAs
Continued Improvement in Asset Quality
Highlights
Net loan charge-offs decreased 36% from 4Q12 to
$37MM, or 27 bps of average loans
4Q13 commercial loan net charge-offs were $2MM
or 2 bps of average loans
Gross charge-offs down $12MM or 15% from 3Q13
Net charge-offs expected to be at the lower end of
or below the targeted range
Allowance for Loan and Lease Losses
Allowance for loan and
lease losses to NPLs
Allowance for loan
and lease losses
$ in millions |
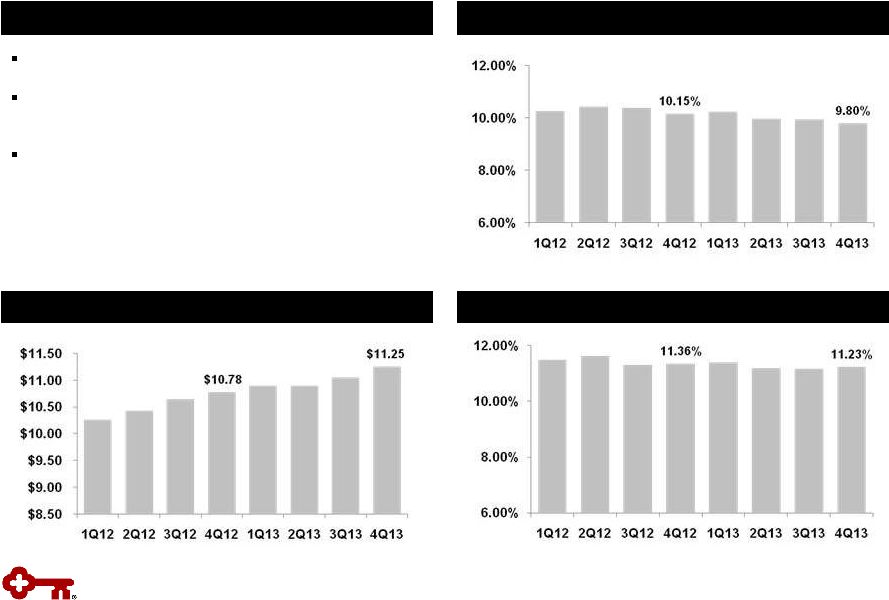 12
Disciplined execution of capital plan
Repurchased $99 million in common shares
during 4Q13
Estimated Tier 1 common equity ratio under the
Regulatory Capital Rules of 10.6%
(a), (b)
Tier 1 Common Equity
(b), (c)
Tangible Common Equity to Tangible Assets
(b)
Strong Capital Ratios
Highlights
Book Value per Share
(a)
Based upon December 31, 2013 pro forma analysis; see Appendix for further
detail (b)
Non-GAAP measure: see Appendix for reconciliations
(c)
12-31-13 ratio is estimated |
 2014
Outlook and Expectations Loans
•
Mid-single digit average balance growth
Net Interest
Income
•
Relatively stable from 2013
Noninterest
Income
•
Low single-digit growth compared to prior year
Expense
•
Low single-digit percentage decline from 2013
Efficiency /
Productivity
•
Positive operating leverage
Asset Quality
•
At the lower-end or below targeted range of 40 –
60 bps of net
charge-offs to average loans
Capital
•
Remaining net share repurchase authority of
approximately $90 million for 2013
CCAR •
2014 capital plan announcement expected in March
13
Guidance ranges: relatively stable: +/-
2%; low single-digit: <5%; mid-single digit:
4% - 6% |
| 14
Appendix
*
*
*
*
*
*
*
*
* |
 Progress on Targets for Success
Focus areas
Metrics
(a)
4Q13
3Q13
Targets
Improving balance
sheet efficiency
Loan to deposit ratio
(b)
84%
84%
90-100%
Maintaining
moderate risk
profile
NCOs to average loans
.27%
.28%
40-60 bps
Provision to average loans
.14%
.21%
Growing high
quality, diverse
revenue streams
Net interest margin
3.01%
3.11%
>3.50%
Noninterest income
to total revenue
43%
44%
>40%
Generating
positive operating
leverage
Adj. cash efficiency ratio
(ex. efficiency initiative
charges)
(c)
65%
64%
60-65%
Strengthening
returns with
disciplined capital
management
Return on average assets
1.08%
1.12%
1.00-1.25%
(a)
Continuing operations, unless otherwise noted
(b)
Represents period-end consolidated total loans and loans held for sale
(excluding education loans in the securitization trusts) divided by
period-end consolidated total deposits (excluding deposits in foreign office)
(c)
Excludes intangible asset amortization; non-GAAP measure: see Appendix for
reconciliation 15 |
 16
Average Total Investment Securities
Highlights
Average AFS securities
High Quality Investment Portfolio
Portfolio composed of Agency or GSE backed
CMOs: Fannie, Freddie & GNMA
–
No private label MBS or financial paper
Average portfolio life at 12/31/13 of 3.6 years
compared to 3.8 years at 9/30/13
Securities cash flows of $.9 billion in 4Q13
and $1.3 billion in 3Q13
Yields on purchases were 78 bps lower than
4Q13 maturities
Securities to Total Assets
(b)
(a) Yield is calculated on the basis of amortized cost
(b) Includes end of period held-to-maturity and
available-for-sale securities Average yield
(a)
Average HTM securities |
 17
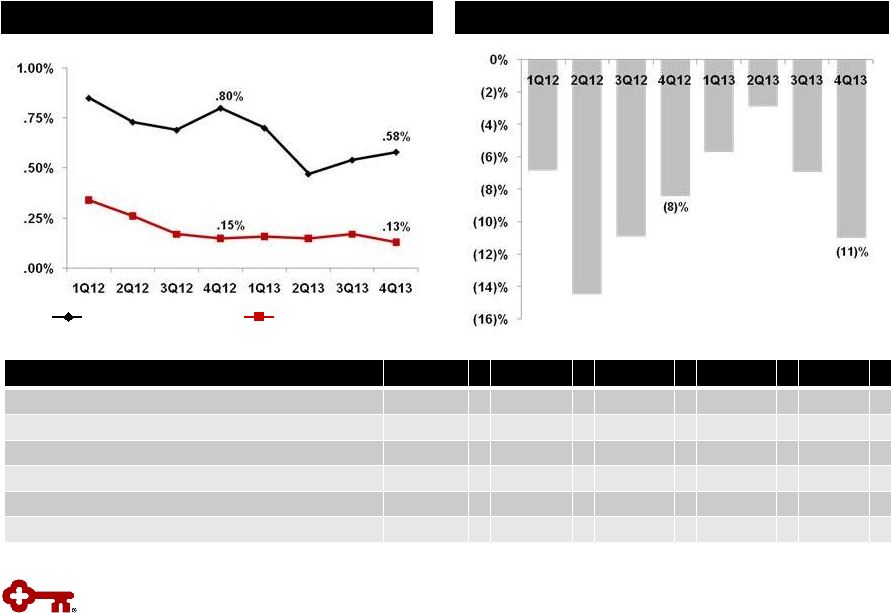
Asset Quality Trends
Quarterly Change in Criticized Outstandings
(a)
Delinquencies to Period-end Total Loans
(a)
Loan and lease outstandings
(b)
From continuing operations
30 –
89 days delinquent
90+ days delinquent
Metric
(b)
4Q13
3Q13
2Q13
1Q13
4Q12
Delinquencies to EOP total loans: 30-89 days
.58
%
.54
%
.47
%
.70
%
.80
%
Delinquencies to EOP total loans: 90+ days
.13
.17
.15
.16
.15
NPLs to EOP portfolio loans
.93
1.01
1.23
1.24
1.28
NPAs to EOP portfolio loans + OREO + Other NPAs
.97
1.08
1.30
1.34
1.39
Allowance for loan losses to period-end loans
1.56
1.62
1.65
1.70
1.68
Allowance for loan losses to NPLs
166.9
160.4
134.4
137.4
131.8
Continuing Operations
Continuing Operations |
 Period-
end loans
Average
loans
Net loan
charge-offs
Net loan
charge-offs
(b)
/
average loans
(%)
Nonperforming
loans
(c)
Ending
allowance
(d)
Allowance /
period-end
loans
(d)
(%)
Allowance /
NPLs
(%)
12/31/13
4Q13
4Q13
4Q13
12/31/13
12/31/13
12/31/13
12/31/13
Commercial, financial and agricultural
(a)
$ 24,963
$ 24,218
$
9 .15
$
77
$ 362
1.45
470.13
Commercial real estate:
Commercial Mortgage
7,720
7,678
(5)
(.26)
37
165
2.14
445.95
Construction
1,093
1,075
1
.37
14
32
2.93
228.57
Commercial lease financing
4,551
4,513
(3)
(.26)
19
62
1.36
326.32
Real estate –
residential mortgage
2,187
2,199
6
1.08
107
37
1.69
34.58
Home equity
10,674
10,653
13
.48
220
95
.89
43.18
Credit cards
722
701
5
2.83
4
34
4.71
850.00
Consumer other –
Key Community Bank
1,449
1,446
5
1.37
3
29
2.00
966.67
Consumer other –
Exit Portfolio
1,098
1,125
6
2.12
27
32
2.91
118.52
Continuing total
(e)
$ 54,457
$ 53,608
$ 37
.27
$
508
$ 848
1.56
166.93
Discontinued operations
4,497
4,663
9
1.34
25
39
1.54
156.00
Consolidated total
$ 58,954
$ 58,271
$ 46
.32
$
533
$ 887
1.56
166.42
Credit Quality by Portfolio
Credit Quality
(a)
12-31-13
ending
loan
balances
include
$94
million
of
commercial
credit
card
balances;
12-31-13
average
loan
balances
include
$97
million
of
assets
from
commercial
credit
cards
(b)
Net
loan
charge-off
amounts
are
annualized
in
calculation.
NCO
ratios
for
discontinued
operations
and
consolidated
Key
exclude
education
loans
in
the
securitization
trusts
since
valued
at
fair-market
value
(c)
12-31-13
and
9-30-13
NPL
amounts
exclude
$16
million
and
$18
million
respectively
of
purchased
credit
impaired
loans
acquired
in
July
2012
(d)
12-31-13
allowance
by
portfolio
is
estimated.
Allowance/period
loans
ratios
for
discontinued
operations
and
consolidated
Key
exclude
education
loans
in
the
securitization
trusts
since
valued
at
fair-market
value
(e)
12-31-13
ending
loan
balances
include
purchased
loans
of
$166
million
of
which
$16
million
were
purchased
credit
impaired
$ in millions
18 |
 Vintage (% of Loans)
Loan
Balances
Average
Loan Size ($)
Average
FICO
Average
LTV
(a)
% of Loans
LTV>90%
2012
and
later
2011
2010
2009
2008
and
prior
Loans and lines
First lien
$
6,007
$
68,571
766
67
%
.6
%
43
%
6%
4
%
4
%
43%
Second lien
4,323
47,518
761
76
3.3
27
6
4
4
59
Community Bank
$
10,340
57,833
764
71
1.8
35
6
4
4
51
Exit portfolio
334
22,728
729
80
31.1
-
-
-
-
100
Total home equity portfolio
$
10,674
Nonaccrual loans and lines
First lien
$
106
$
57,353
713
73
%
.5%
3
%
3%
3
%
6
%
85%
Second lien
99
47,112
710
78
3.1
1
2
2
3
92
Community Bank
$
205
51,893
712
76
1.5
2
3
2
4
89
Exit portfolio
15
23,647
704
79
30.6
-
-
-
-
100
Total home equity nonaccruals
$
220
Fourth quarter net charge-offs (NCOs)
Community Bank
$
10
1
%
1%
3
%
2
%
93%
% of average loans
.38
%
Exit Portfolio
$
3
-
-
-
-
100
% of average loans
3.47
%
(a) Average LTVs are at origination. Current average LTVs for Community Bank total
home equity loans and lines is approximately 73%, which compares to 74% at
the end of the third quarter 2013. Home Equity Portfolio –
12/31/13
$ in millions, except average loan size
Home Equity Portfolio
Highlights
High quality portfolio
Community bank loans and lines: 97% of total portfolio; branch-
originated
–
58% first lien position
–
Average FICO score of 764
–
Average LTV at origination: 71%
$3.9 billion of the total portfolio are fixed rate loans that require
principal and interest payments; $6.8 billion are lines
$1.3 billion in lines outstanding (12% of the total portfolio)
come to end of draw period in the next four years
–
Proactive communication and client outreach initiated
near end of draw period
19 |
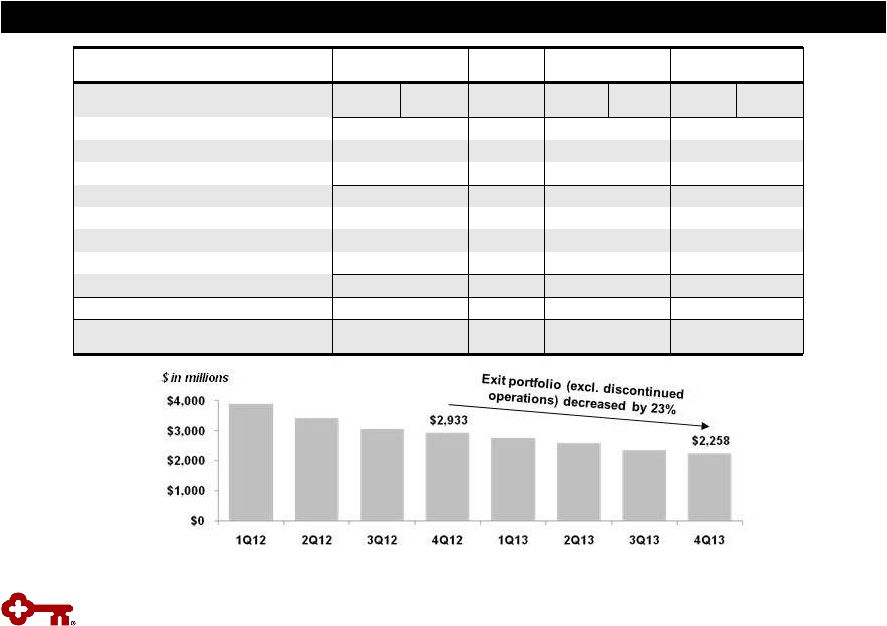 Balance Outstanding
Change
Net Loan Charge-offs
Balance on
Nonperforming Status
12-31-13
9-30-13
12-31-13
vs.
9-30-13-
4Q13
(c)
3Q13
(c)
12-31-13
9-30-13
Residential properties –
homebuilder
$ 20
$ 26
$ (6)
-
-
$
7 $ 8
Marine and RV floor plan
24
25
(1)
-
-
6
6
Commercial lease financing
(a)
782
796
(14)
$ (2)
$ (2)
-
1
Total commercial loans
826
847
(21)
(2)
(2)
13
15
Home equity –
Other
334
353
(19)
3
2
16
14
Marine
1,028
1,083
(55)
5
1
26
25
RV and other consumer
70
71
(1)
1
-
1
2
Total consumer loans
1,432
1,507
(75)
9
3
43
41
Total exit loans in loan portfolio
$ 2,258
$ 2,354
$ (96)
$ 7
$ 1
$
56 $ 56
Discontinued operations –
education lending
business (not included in exit loans above)
(b)
$ 4,497
$ 4,738
$ (241)
$ 9
$ 9
$
25 $ 23
(a)
Includes
(1)
the
business
aviation,
commercial
vehicle,
office
products,
construction
and
industrial
leases;
(2)
Canadian
lease
financing
portfolios;
and
(3) all remaining balances related to lease in, lease out; sale in, lease out;
service contract leases; and (4) qualified technological equipment leases (b)
Includes loans in Key’s consolidated education loan securitization
trusts (c)
Credit amounts indicate recoveries exceeded charge-offs
$ in millions
Exit Loan Portfolio
Exit Loan Portfolio
20 |
 Three months ended
12-31-13
9-30-13
12-31-12
Tangible common equity to tangible assets at period end
Key shareholders’
equity (GAAP)
$
10,303
$
10,206
$
10,271
Less:
Intangible assets
(b)
1,014
1,017
1,027
Preferred Stock, Series A
(c)
282
282
291
Tangible common equity (non-GAAP)
$
9,007
$
8,907
$
8,953
Total assets (GAAP)
$
92,934
$
90,708
$
89,236
Less:
Intangible assets
(b)
1,014
1,017
1,027
Tangible assets (non-GAAP)
$
91,920
$
89,691
$
88,209
Tangible common equity to tangible assets ratio (non-GAAP)
9.80
%
9.93
%
10.15
%
Tier 1 common equity at period end
Key shareholders' equity (GAAP)
$
10,303
$
10,206
$
10,271
Qualifying capital securities
339
340
339
Less:
Goodwill
979
979
979
Accumulated other comprehensive income (loss)
(d)
(394)
(409)
(172)
Other assets
(e)
91
96
114
Total Tier 1 capital (regulatory)
9,966
9,880
9,689
Less:
Qualifying capital securities
339
340
339
Preferred Stock, Series A
(c)
282
282
291
Total Tier 1 common equity (non-GAAP)
$
9,345
$
9,258
$
9,059
Net risk-weighted assets (regulatory)
(e), (f)
$
83,251
$
82,913
$
79,734
Tier 1 common equity ratio (non-GAAP)
(f)
11.23
%
11.17
%
11.36
%
Pre-provision net revenue
Net interest income (GAAP)
$
583
$
578
$
601
Plus:
Taxable-equivalent adjustment
6
6
6
Noninterest income (GAAP)
453
459
439
Less:
Noninterest expense (GAAP)
712
716
734
Pre-provision net revenue from continuing operations (non-GAAP)
$
330
$
327
$
312
GAAP to Non-GAAP Reconciliation
(a)
$ in millions
(a)
2Q13
and
1Q13
reconciliations
available
in
our
2Q13
earnings
press
release,
available
on
our
website:
www.key.com/ir
(b)
Three months ended December 31, 2013, September 30, 2013, and December 31, 2012
exclude $92 million, $99 million, and $123 million, respectively, of period
end purchased credit card receivable intangible assets (c)
Net of capital surplus for the three months ended December 31, 2013 and September
30, 2013 (d)
Includes net unrealized gains or losses on securities available for sale (except
for net unrealized losses on marketable equity securities), net gains or
losses on cash flow hedges, and amounts resulting from the application of the applicable accounting guidance for defined benefit and other
postretirement plans
(e)
Other assets deducted from Tier 1 capital and net risk-weighted assets consist
of disallowed intangible assets (excluding goodwill) and deductible
portions of nonfinancial equity investments. There were no disallowed
deferred tax assets at 12-31-13, 9-30-13, and 12-31-12
(f)
12-31-13 amount is estimated
21 |
 GAAP
to Non-GAAP Reconciliation (a)
(continued)
$ in millions
(a)
2Q13
and
1Q13
reconciliations
available
in
our
2Q13
earnings
press
release,
available
on
our
website:
www.key.com/ir
(b)
Three months ended December 31, 2013, September 30, 2013, and December 31,
2012 exclude $96 million, $103 million and $126 million,
respectively, of average ending purchased credit card receivable
intangible assets
Three months ended
12-31-13
9-30-13
12-31-12
Average tangible common equity
Average Key shareholders' equity (GAAP)
$
10,272
$
10,237
$
10,261
Less:
Intangible assets (average)
(b)
1,016
1,019
1,030
Preferred Stock, Series A (average)
291
291
291
Average tangible common equity (non-GAAP)
$
8,965
$
8,927
$
8,940
Return on average tangible common equity from continuing operations
Net
income
(loss)
from
continuing
operations
attributable
to
Key
common
shareholders (GAAP)
$
229
$
229
$
190
Average tangible common equity (non-GAAP)
8,965
8,927
8,940
Return on average tangible common equity from continuing operations
(non-GAAP) 10.13
%
10.18
%
8.45
%
Return on average tangible common equity consolidated
Net income (loss) attributable to Key common shareholders (GAAP)
$
224
$
266
$
197
Average tangible common equity (non-GAAP)
8,965
8,927
8,940
Return on average tangible common equity consolidated (non-GAAP)
9.91
%
11.82
%
8.77
%
Cash efficiency ratio
Noninterest expense (GAAP)
$
712
$
716
$
734
Less:
Intangible asset amortization on credit cards (GAAP)
7
8
8
Other intangible asset amortization (GAAP)
3
4
4
Adjusted noninterest expense (non-GAAP)
$
702
$
704
$
722
Net interest income (GAAP)
$
583
$
578
$
601
Plus:
Taxable-equivalent adjustment
6
6
6
Noninterest income (GAAP)
453
459
439
Total taxable-equivalent revenue (non-GAAP)
$
1,042
$
1,043
$
1,046
Cash efficiency ratio (non-GAAP)
67.4
%
67.5
%
69.0
%
Adjusted cash efficiency ratio
Adjusted noninterest expense (non-GAAP)
$
702
$
704
$
722
Less:
Efficiency initiative and pension settlement charges (non-GAAP)
24
41
16
Net adjusted noninterest expense (non-GAAP)
$
678
$
663
$
706
Total taxable-equivalent revenue (non-GAAP)
$
1,042
$
1,043
$
1,046
Adjusted cash efficiency ratio (non-GAAP)
65.1
%
63.6
%
67.5
%
22 |
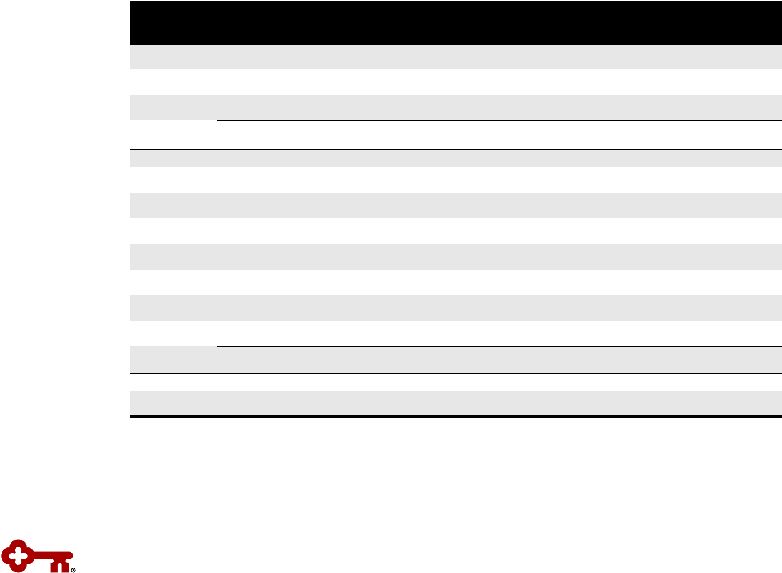 Tier
1
Common
Equity
Under
the
Regulatory
Capital
Rules (estimated)
(a)
KeyCorp & Subsidiaries
$ in billions
Quarter ended
Dec. 31, 2013
Tier 1 common equity under current regulatory rules
$
9.3 Adjustments from current regulatory rules
to the Regulatory Capital Rules: Deferred tax assets and PCCRs
(b)
(.1)
Tier 1 common equity anticipated under the Regulatory Capital Rules
(c)
$
9.2 Total risk-weighted assets under
current regulatory rules
$
83.3 Adjustments from current regulatory rules to the
Regulatory Capital Rules: Loan commitments <1 year
.9
Past Due Loans
.2
Mortgage servicing assets
(d)
.6
Deferred tax assets
(d)
.2
Other
1.5
Total risk-weighted assets anticipated under the Regulatory Capital
Rules
$
86.7 Tier 1 common equity ratio under the Regulatory Capital
Rules 10.6
%
(a)
Tier 1 common equity is a non-generally accepted accounting principle (GAAP)
financial measure that is used by investors, analysis and bank
regulatory agencies to assess the capital position of financial services
companies; management reviews Tier 1 common equity along with other
measures of capital as part of its financial analyses
(b)
Includes the deferred tax asset subject to future taxable income
for realization, primarily tax credit carryforwards as well as the deductible
portion of purchased credit card receivables
(c)
The anticipated amount of regulatory capital and risk-weighted assets is based
upon the federal banking agencies’ Regulatory Capital Rules (as
fully phased-in on January 1, 2019); Key is subject to the Regulatory
Capital Rules under the “standardized approach”
(d)
Item is included in the 10%/15% exceptions bucket calculation and is
risk-weighted at 250% Table
may
not
foot
due
to
rounding
23 |