Attached files
| file | filename |
|---|---|
| 8-K - 8-K - HANCOCK WHITNEY CORP | d664232d8k.htm |
Exhibit 99.1

For Immediate Release
January 23, 2014
For More Information
Trisha Voltz Carlson
SVP, Investor Relations Manager
504.299.5208
trisha.carlson@hancockbank.com
Hancock reports fourth quarter 2013 financial results
Higher core net interest income and lower operating expense largely offset declining purchased loan accretion
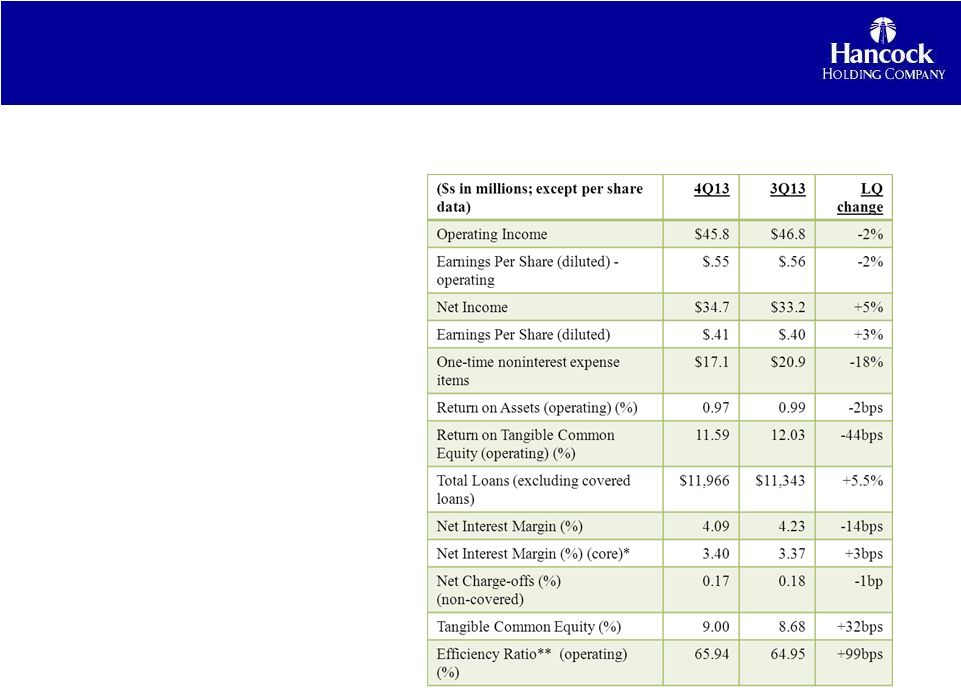
GULFPORT, Miss. (January 23, 2014) — Hancock Holding Company (Nasdaq: HBHC) today announced its financial results for the fourth quarter of 2013. Operating income for the fourth quarter of 2013 was $45.8 million or $.55 per diluted common share, compared to $46.8 million, or $.56 in the third quarter of 2013. Operating income was $46.6 million, or $.54, in the fourth quarter of 2012. We define our operating income as net income excluding tax-effected securities transactions gains or losses and one-time noninterest expense items. Management believes that operating income provides a useful measure of financial performance that helps investors compare the Company’s fundamental operations over time. The financial tables include a reconciliation of net income to operating income.
Highlights of the Company’s fourth quarter of 2013 results:
| • | Core net interest income (TE) increased approximately $1.5 million and core net interest margin (NIM) improved 3 basis points (bps) linked-quarter (we define our core results as reported results less the impact of net purchase accounting adjustments) |
| • | Operating expenses declined $4.2 million linked-quarter as the Company remains on track to meet its first quarter of 2014 expense target |
| • | Approximately $625 million linked-quarter net loan growth, or 22% annualized, and over $900 million, or 8%, year-over-year loan growth (each excluding the FDIC-covered portfolio) |
| • | Purchase accounting loan accretion declined approximately $8 million, or $.06 per diluted common share after tax |
| • | Continued improvement in overall asset quality metrics |
| • | Tax rate declined to 20%, mainly related to benefits from additional investments in New Market Tax Credit projects in the fourth quarter |
| • | Net income included one-time noninterest expense items of $17.1 million, or $11.1 million after tax ($.14 per diluted common share) |
Hancock’s return on average assets (ROA) (operating) was 0.97% for the fourth quarter of 2013, down slightly from 0.99% in the third quarter of 2013 and 0.98% in the fourth quarter a year ago.
- 1 -
Hancock reports fourth quarter 2013 financial results
January 23, 2014
“I have noted in previous quarters that our performance reflected an improvement in our core results, a trend we expected to build upon in the future,” said Hancock’s President and Chief Executive Officer Carl J. Chaney. “In the fourth quarter that trend accelerated and has now become more evident in our results. The results reflect the significant progress we are making in replacing the runoff in purchase accounting loan accretion with core operating income. Improvements were noted in many areas such as loan growth and mix, core net interest income and core net interest margin, and a reduction in operating expenses.”
Net income in the fourth quarter of 2013 was $34.7 million, or $.41 per diluted common share, compared to $33.2 million, or $.40, in the third quarter of 2013. Net income was $47.0 million, or $.54 per diluted common share, in the fourth quarter of 2012. Return on average assets (ROA) was 0.74% for the fourth quarter of 2013, compared to 0.70% in the third quarter of 2013 and 0.99% in the fourth quarter a year ago. Net income reflected the impact of certain one-time noninterest expenses of $17.1 million in the fourth quarter of 2013 and $20.9 million in the third quarter of 2013.
Loans
Total loans at December 31, 2013 were $12.3 billion, up $590 million from September 30, 2013. Excluding the FDIC-covered portfolio, which declined $33 million during the fourth quarter of 2013, total loans increased approximately $625 million, or 5.5% linked-quarter.
The largest component of linked-quarter net growth (excluding the FDIC-covered portfolio) was in the commercial and industrial (C&I) portfolio (+10%), followed by increases in the commercial real estate (CRE) (+5%) and residential mortgage (+3%) portfolios. Many of the markets across the Company’s footprint reported net loan growth during the quarter, with the majority of the growth in south Louisiana, Houston and Florida markets. The fourth quarter also included some net growth from seasonal borrowers, and loan paydowns and payoffs returned to a more normal level compared to the third quarter of 2013. For the full year of 2014 management expects period-end loan growth in the mid-single digit range.
A substantial portion of the fourth quarter’s net loan growth came toward the latter part of the period, and average loans were up $101 million, or 1%, from the third quarter of 2013.
Deposits
Total deposits at December 31, 2013 were $15.4 billion, up $306 million, or 2%, from September 30, 2013. Average deposits for the fourth quarter of 2013 were $14.9 billion, down $106 million, or 1%, from the third quarter of 2013.
Noninterest-bearing demand deposits (DDAs) totaled $5.5 billion at December 31, 2013, up $51 million, or 1%, compared to September 30, 2013. DDAs comprised 36% of total period-end deposits at December 31, 2013.
Interest bearing transaction and savings deposits totaled $6.2 billion at year-end 2013, up $155 million, or 3%, from September 30, 2013.
- 2 -
Hancock reports fourth quarter 2013 financial results
January 23, 2014
Time deposits (CDs) and interest-bearing public fund deposits totaled $3.7 billion at December 31, 2013, up $100 million, or 3%, from September 30, 2013. Public fund deposits typically reflect higher balances toward year-end with subsequent reductions beginning in the first quarter.
Asset Quality
Non-performing assets (NPAs) totaled $186 million at December 31, 2013, down $30 million from September 30, 2013. During the fourth quarter, total non-performing loans declined $21 million, and foreclosed and surplus real estate (ORE) and other foreclosed assets decreased $9 million. Non-performing assets as a percent of total loans, ORE and other foreclosed assets was 1.50% at December 31, 2013, down from 1.83% at September 30, 2013.
The Company’s total allowance for loan losses was $133.6 million at December 31, 2013, down from $138.2 million at September 30, 2013. The ratio of the allowance to period-end loans was 1.08%, compared to 1.18% at September 30, 2013. The decline in the allowance during the fourth quarter was primarily related to a $7.2 million reversal of a previous impairment on FDIC covered loans. The allowance maintained on the non-covered portion of the loan portfolio increased $2.6 million linked-quarter, totaling $80.5 million at December 31, 2013.
Net charge-offs from the non-covered loan portfolio were $5.2 million, or 0.17% of average total loans on an annualized basis in the fourth quarter of 2013, virtually unchanged from $5.4 million, or 0.18% of average total loans in the third quarter of 2013.
During the fourth quarter of 2013, Hancock recorded a total provision for loan losses of $7.3 million, down slightly from $7.6 million in the third quarter of 2013. The provision for non-covered loans was $7.9 million in the fourth quarter of 2013, compared to $6.5 million in the third quarter of 2013. The net provision from the covered portfolio was a credit of $0.5 million for the fourth quarter of 2013 compared to a provision of $1.0 million in the third quarter of 2013. This decline was driven by the reversal of impairment noted above.
Net Interest Income
Net interest income (TE) for the fourth quarter of 2013 was $168.5 million, down $5.6 million from the third quarter of 2013. Average earning assets were $16.4 billion, virtually unchanged from the third quarter of 2013. The reported net interest margin (TE) was 4.09% for the fourth quarter of 2013, down 14 basis points (bps) from the third quarter of 2013.
The linked-quarter decrease in both net interest income and net interest margin was primarily related to a decline of approximately $8 million in total purchase accounting loan accretion. As discussed in previous quarters, loan accretion can be volatile due in part to excess cash recoveries on acquired-impaired loan pools. During the fourth quarter of 2013, there were no excess cash recoveries above expected amounts included in the purchase accounting income total. The slide presentation referenced below includes detailed information on expected loan accretion and excess cash recoveries.
- 3 -
Hancock reports fourth quarter 2013 financial results
January 23, 2014
The core margin (reported net interest income (TE) excluding total net purchase accounting adjustments, annualized, as a percent of average earning assets) expanded 3 bps to 3.40% during the fourth quarter of 2013. A slight decline in the core loan yield (-3 bps) was offset by an improved earning asset mix, higher yields on investment securities (+19 bps) and a slight decline in the cost of funds (-1 bp).
Noninterest Income
Noninterest income totaled $59.0 million for the fourth quarter of 2013, down $4.1 million from the third quarter of 2013.
Service charges on deposits totaled $19.6 million for the fourth quarter of 2013, down $0.9 million, or 4%, from the third quarter of 2013. Bankcard and ATM fees totaled $11.3 million, down approximately $1.0 million, or 8%, from the third quarter of 2013.
Trust, investment and annuity, and insurance fees totaled $18.1 million, down $0.2 million, or 1%, from the third quarter of 2013. During the fourth quarter, an increase of $0.7 million, or 8%, in trust fees was offset by declines in investment and annuity, and insurance fees.
Fees from secondary mortgage operations totaled $1.6 million for the fourth quarter of 2013, down $0.9 million, or 37%, linked-quarter. The decline mainly reflects a continued slowdown in mortgage loan activity, reflecting mainly the impact of increased longer-term interest rates on originations. The fourth quarter’s activity also reflects a continued higher level of portfolio loan production compared to secondary market loan production.
Other noninterest income totaled $8.3 million for the fourth quarter of 2013, down $1.2 million, or 12%, linked-quarter. The decline mainly reflects a lower level of expected future losses on covered loans, which resulted in an increase of $1.1 million in the amortization of the indemnification asset.
Noninterest Expense & Taxes
Noninterest expense for the fourth quarter of 2013 totaled $174.2 million, including $17.1 million of one-time costs related to the expense and efficiency initiative. Excluding these costs, noninterest expense (or operating expense) totaled $157.1 million, down $4.2 million, or 3%, from the comparable operating expense total for the third quarter of 2013.
Excluding one-time costs, total personnel expense, the largest component of the Company’s expense base, was $84.9 million in the fourth quarter of 2013, down $1.9 million, or 2%, from the third quarter of 2013. Occupancy and equipment expense totaled $16.3 million in the fourth quarter of 2013, down $1.2 million, or 7%, from the third quarter of 2013. The reduction in the personnel, occupancy and equipment expense categories reflect in part a full quarter’s impact from the closing of 26 branch locations across the Company’s five-state footprint in August 2013.
The sale of 7 Houston area branches was completed on November 8, 2013, and the sale of 3 Alexandria, Louisiana area branches was completed on January 10, 2014. Additionally, at year-end, the Company closed the remaining two branches that were part of the previously announced ongoing branch rationalization process.
- 4 -
Hancock reports fourth quarter 2013 financial results
January 23, 2014
ORE expense totaled $1.5 million in the fourth quarter of 2013, down $0.9 million from the third quarter, while other operating expense was essentially unchanged at $47.2 million.
The effective income tax rate for the fourth quarter of 2013 was 20%, down from 26% in the third quarter of 2013. The decline in the tax rate is primarily related to several additional New Market Tax Credit investments that were closed during the fourth quarter of 2013. Management expects the effective tax rate to approximate 25-27% in 2014. The effective income tax rate continues to be less than the statutory rate of 35% due primarily to tax-exempt income and tax credits.
Capital
Common shareholders’ equity at year-end 2013 totaled $2.4 billion. The tangible common equity (TCE) ratio was 9.00% at December 31, 2013, up 32 bps from September 30, 2013. Management continues to review a full range of the strategic options presented by Hancock’s strong capital position, including additional stock buybacks, organic growth, acquisitions or increased dividends. Additional capital ratios are included in the financial tables.
Conference Call and Slide Presentation
Management will host a conference call for analysts and investors at 8:00 a.m. Central Time on Friday, January 24, 2014 to review the results. A live listen-only webcast of the call will be available under the Investor Relations section of Hancock’s website at www.hancockbank.com. A slide presentation related to fourth quarter results is also posted as part of the webcast link. To participate in the Q&A portion of the call, dial (877) 564-1219 or (973) 638-3429. An audio archive of the conference call will be available under the Investor Relations section of our website. A replay of the call will also be available through January 30, 2014 by dialing (855) 859-2056 or (404) 537-3406, passcode 30587330.
About Hancock Holding Company
Hancock Holding Company is the parent company of Hancock Bank and Whitney Bank. The Company operates as Hancock Bank in south Mississippi, southern and central Alabama, and the northern, central, and panhandle regions of Florida; and as Whitney Bank in south Louisiana and Houston, Texas. The Hancock Holding Company family of financial services companies also includes Hancock Investment Services, Inc.; Hancock Insurance Agency and Whitney Insurance Agency, Inc.; corporate trust offices in Gulfport and Jackson, Mississippi, New Orleans and Baton Rouge, Louisiana, and Orlando, Florida; and Harrison Finance Company. Additional information is available at www.hancockbank.com and www.whitneybank.com.
Forward-Looking Statements
This news release contains “forward-looking statements” within the meaning of section 27A of the Securities Act of 1933, as amended, and section 21E of the Securities Exchange Act of 1934, as amended, and we intend such forward-looking statements to be covered by the safe harbor provisions therein and are including this statement for purposes of invoking these safe-harbor provisions. Forward-looking statements provide projections of results of operations or of financial condition or state other forward-looking information, such as expectations about future conditions and descriptions of plans and strategies for the future.
- 5 -
Hancock reports fourth quarter 2013 financial results
January 23, 2014
Forward-looking statements that we may make include, but may not be limited to, comments with respect to future levels of economic activity in our markets, loan growth, deposit trends, credit quality trends, future sales of nonperforming assets, net interest margin trends, future expense levels and the ability to achieve reductions in non-interest expense or other cost savings, projected tax rates, future profitability, improvements in expense to revenue (efficiency) ratio, purchase accounting impacts such as accretion levels, the impact of the branch rationalization process, and the financial impact of regulatory requirements.
Hancock’s ability to accurately project results or predict the effects of future plans or strategies is inherently limited. Although Hancock believes that the expectations reflected in its forward-looking statements are based on reasonable assumptions, actual results and performance could differ materially from those set forth in the forward-looking statements. Factors that could cause actual results to differ from those expressed in Hancock’s forward-looking statements include, but are not limited to, those risk factors outlined in Hancock’s public filings with the Securities and Exchange Commission, which are available at the SEC’s internet site (http://www.sec.gov).
You are cautioned not to place undue reliance on these forward-looking statements. Hancock does not intend, and undertakes no obligation, to update or revise any forward-looking statements, whether as a result of differences in actual results, changes in assumptions or changes in other factors affecting such statements, except as required by law.
- 6 -
Hancock Holding Company
Financial Highlights
(amounts in thousands, except per share data and FTE headcount)
(unaudited)
| Three Months Ended | Twelve Months Ended | |||||||||||||||||||
| 12/31/2013 | 9/30/2013 | 12/31/2012 | 12/31/2013 | 12/31/2012 | ||||||||||||||||
| Common Share Data |
||||||||||||||||||||
| Earnings per share: |
||||||||||||||||||||
| Basic |
$ | 0.41 | $ | 0.40 | $ | 0.55 | $ | 1.93 | $ | 1.77 | ||||||||||
| Diluted |
$ | 0.41 | $ | 0.40 | $ | 0.54 | $ | 1.93 | $ | 1.75 | ||||||||||
| Operating earnings per share: (a) |
||||||||||||||||||||
| Basic |
$ | 0.55 | $ | 0.56 | $ | 0.54 | $ | 2.22 | $ | 2.15 | ||||||||||
| Diluted |
$ | 0.55 | $ | 0.56 | $ | 0.54 | $ | 2.22 | $ | 2.13 | ||||||||||
| Cash dividends per share |
$ | 0.24 | $ | 0.24 | $ | 0.24 | $ | 0.96 | $ | 0.96 | ||||||||||
| Book value per share (period-end) |
$ | 29.49 | $ | 28.70 | $ | 28.91 | $ | 29.49 | $ | 28.91 | ||||||||||
| Tangible book value per share (period-end) |
$ | 19.94 | $ | 19.04 | $ | 19.27 | $ | 19.94 | $ | 19.27 | ||||||||||
| Weighted average number of shares: |
||||||||||||||||||||
| Basic |
82,085 | 82,091 | 84,798 | 83,066 | 84,767 | |||||||||||||||
| Diluted |
82,220 | 82,205 | 85,777 | 83,167 | 85,588 | |||||||||||||||
| Period-end number of shares |
82,237 | 82,107 | 84,848 | 82,237 | 84,848 | |||||||||||||||
| Market data: |
||||||||||||||||||||
| High sales price |
$ | 37.12 | $ | 33.85 | $ | 32.50 | $ | 37.12 | $ | 36.73 | ||||||||||
| Low sales price |
$ | 30.09 | $ | 29.00 | $ | 29.47 | $ | 25.00 | $ | 27.96 | ||||||||||
| Period end closing price |
$ | 36.68 | $ | 31.38 | $ | 31.73 | $ | 36.68 | $ | 31.73 | ||||||||||
| Trading volume |
27,816 | 29,711 | 20,910 | 122,496 | 119,519 | |||||||||||||||
| Other Period-end Data |
||||||||||||||||||||
| FTE headcount |
3,978 | 4,068 | 4,235 | 3,978 | 4,235 | |||||||||||||||
| Tangible common equity |
$ | 1,639,524 | $ | 1,563,542 | $ | 1,634,833 | $ | 1,639,524 | $ | 1,634,833 | ||||||||||
| Tier I capital |
$ | 1,682,782 | $ | 1,656,497 | $ | 1,668,809 | $ | 1,682,782 | $ | 1,668,809 | ||||||||||
| Goodwill |
$ | 625,675 | $ | 625,675 | $ | 628,877 | $ | 625,675 | $ | 628,877 | ||||||||||
| Amortizing intangibles |
$ | 159,773 | $ | 167,116 | $ | 189,409 | $ | 159,773 | $ | 189,409 | ||||||||||
| Performance Ratios |
||||||||||||||||||||
| Return on average assets |
0.74 | % | 0.70 | % | 0.99 | % | 0.86 | % | 0.80 | % | ||||||||||
| Return on average assets (operating) (a) |
0.97 | % | 0.99 | % | 0.98 | % | 0.99 | % | 0.97 | % | ||||||||||
| Return on average common equity |
5.85 | % | 5.63 | % | 7.67 | % | 6.84 | % | 6.32 | % | ||||||||||
| Return on average common equity (operating) (a) |
7.71 | % | 7.93 | % | 7.60 | % | 7.88 | % | 7.66 | % | ||||||||||
| Return on average tangible common equity |
8.79 | % | 8.54 | % | 11.58 | % | 10.30 | % | 9.72 | % | ||||||||||
| Return on average tangible common equity (operating) (a) |
11.59 | % | 12.03 | % | 11.48 | % | 11.85 | % | 11.78 | % | ||||||||||
| Tangible common equity ratio |
9.00 | % | 8.68 | % | 8.77 | % | 9.00 | % | 8.77 | % | ||||||||||
| Earning asset yield (TE) |
4.32 | % | 4.47 | % | 4.76 | % | 4.45 | % | 4.80 | % | ||||||||||
| Total cost of funds |
0.23 | % | 0.24 | % | 0.28 | % | 0.25 | % | 0.32 | % | ||||||||||
| Net interest margin (TE) |
4.09 | % | 4.23 | % | 4.48 | % | 4.20 | % | 4.48 | % | ||||||||||
| Efficiency ratio (b) |
65.94 | % | 64.95 | % | 60.78 | % | 65.17 | % | 64.63 | % | ||||||||||
| Allowance for loan losses as a percent of period-end loans |
1.08 | % | 1.18 | % | 1.18 | % | 1.08 | % | 1.18 | % | ||||||||||
| Allowance for loan losses to non-performing loans + accruing loans 90 days past due |
111.97 | % | 94.69 | % | 81.40 | % | 111.97 | % | 81.40 | % | ||||||||||
| Average loan/deposit ratio |
79.93 | % | 78.70 | % | 76.29 | % | 77.56 | % | 74.68 | % | ||||||||||
| Noninterest income excluding securities transactions as a percent of total revenue (TE) |
25.90 | % | 26.59 | % | 26.02 | % | 26.25 | % | 25.88 | % | ||||||||||
| (a) | Excludes tax-effected securities transactions and one-time noninterest expense items. Management believes that operating income provides a useful measure of financial performance that helps investors compare the Company’s fundamental operations over time. |
| (b) | Efficiency ratio is defined as noninterest expense as a percent of total revenue (TE) before amortization of purchased intangibles, one-time noninterest expense items, and securities transactions. |
- 7 -
Hancock Holding Company
Financial Highlights
(amounts in thousands)
(unaudited)
| Three Months Ended | Twelve Months Ended | |||||||||||||||||||
| 12/31/2013 | 9/30/2013 | 12/31/2012 | 12/31/2013 | 12/31/2012 | ||||||||||||||||
| Income Statement |
||||||||||||||||||||
| Interest income |
$ | 175,650 | $ | 181,639 | $ | 191,140 | $ | 722,210 | $ | 762,549 | ||||||||||
| Interest income (TE) |
178,109 | 184,221 | 194,075 | 732,620 | 774,134 | |||||||||||||||
| Interest expense |
9,643 | 10,109 | 11,275 | 41,479 | 51,682 | |||||||||||||||
|
|
|
|
|
|
|
|
|
|
|
|||||||||||
| Net interest income (TE) |
168,466 | 174,112 | 182,800 | 691,141 | 722,452 | |||||||||||||||
| Provision for loan losses |
7,331 | 7,569 | 28,051 | 32,734 | 54,192 | |||||||||||||||
| Noninterest income excluding securities transactions |
58,894 | 63,057 | 64,308 | 246,038 | 252,195 | |||||||||||||||
| Securities transactions gains |
105 | — | 623 | 105 | 1,552 | |||||||||||||||
| Noninterest expense |
174,213 | 182,205 | 157,920 | 678,274 | 713,067 | |||||||||||||||
|
|
|
|
|
|
|
|
|
|
|
|||||||||||
| Income before income taxes |
43,462 | 44,813 | 58,825 | 215,866 | 197,355 | |||||||||||||||
| Income tax expense |
8,746 | 11,611 | 11,866 | 52,510 | 45,613 | |||||||||||||||
|
|
|
|
|
|
|
|
|
|
|
|||||||||||
| Net income |
$ | 34,716 | $ | 33,202 | $ | 46,959 | $ | 163,356 | $ | 151,742 | ||||||||||
|
|
|
|
|
|
|
|
|
|
|
|||||||||||
| Adjustments from net to operating income |
||||||||||||||||||||
| Securities transactions gains |
105 | — | 623 | 105 | 1,552 | |||||||||||||||
| One-time noninterest expense items |
||||||||||||||||||||
| Merger-related expenses |
— | — | — | — | 45,789 | |||||||||||||||
| Sub-debt early redemption costs |
— | — | — | — | 5,336 | |||||||||||||||
| Expense & efficiency initiative and other items |
17,116 | 20,887 | — | 38,003 | — | |||||||||||||||
|
|
|
|
|
|
|
|
|
|
|
|||||||||||
| Total one-time noninterest expense items |
17,116 | 20,887 | — | 38,003 | 51,125 | |||||||||||||||
| Taxes on adjustments at 35% |
5,954 | 7,310 | (218 | ) | 13,264 | 17,350 | ||||||||||||||
|
|
|
|
|
|
|
|
|
|
|
|||||||||||
| Total adjustments (net of taxes) |
11,057 | 13,577 | (405 | ) | 24,634 | 32,223 | ||||||||||||||
|
|
|
|
|
|
|
|
|
|
|
|||||||||||
| Operating income (c) |
$ | 45,773 | $ | 46,779 | $ | 46,554 | $ | 187,990 | $ | 183,965 | ||||||||||
|
|
|
|
|
|
|
|
|
|
|
|||||||||||
| Noninterest Income and Noninterest Expense |
||||||||||||||||||||
| Service charges on deposit accounts |
$ | 19,605 | $ | 20,519 | $ | 20,232 | $ | 79,000 | $ | 78,246 | ||||||||||
| Trust fees |
10,214 | 9,477 | 8,273 | 38,186 | 32,736 | |||||||||||||||
| Bank card and ATM fees |
11,261 | 12,221 | 11,526 | 45,939 | 49,112 | |||||||||||||||
| Investment & annuity fees |
4,619 | 5,186 | 4,743 | 19,574 | 18,033 | |||||||||||||||
| Secondary mortgage market operations |
1,554 | 2,467 | 5,160 | 12,543 | 16,488 | |||||||||||||||
| Insurance fees |
3,304 | 3,661 | 3,588 | 15,804 | 15,692 | |||||||||||||||
| Other income |
8,337 | 9,526 | 10,786 | 34,992 | 41,888 | |||||||||||||||
|
|
|
|
|
|
|
|
|
|
|
|||||||||||
| Noninterest income excluding securities transactions |
58,894 | 63,057 | 64,308 | 246,038 | 252,195 | |||||||||||||||
| Securities transactions gains |
105 | — | 623 | 105 | 1,552 | |||||||||||||||
|
|
|
|
|
|
|
|
|
|
|
|||||||||||
| Total noninterest income including securities transactions |
$ | 58,999 | $ | 63,057 | $ | 64,931 | $ | 246,143 | $ | 253,747 | ||||||||||
|
|
|
|
|
|
|
|
|
|
|
|||||||||||
| Personnel expense |
$ | 84,912 | $ | 86,850 | $ | 87,358 | $ | 347,266 | $ | 356,734 | ||||||||||
| Occupancy expense (net) |
11,613 | 12,369 | 12,683 | 48,713 | 53,856 | |||||||||||||||
| Equipment expense |
4,679 | 5,120 | 5,051 | 20,019 | 21,862 | |||||||||||||||
| Other real estate owned expense (net) |
1,535 | 2,439 | 2,236 | 8,036 | 12,250 | |||||||||||||||
| Other operating expense |
47,180 | 47,234 | 42,862 | 186,767 | 185,173 | |||||||||||||||
| Amortization of intangibles |
7,178 | 7,306 | 7,730 | 29,470 | 32,067 | |||||||||||||||
|
|
|
|
|
|
|
|
|
|
|
|||||||||||
| Total operating expense |
157,097 | 161,318 | 157,920 | 640,271 | 661,942 | |||||||||||||||
| One-time noninterest expense items |
17,116 | 20,887 | — | 38,003 | 51,125 | |||||||||||||||
|
|
|
|
|
|
|
|
|
|
|
|||||||||||
| Total noninterest expense |
$ | 174,213 | $ | 182,205 | $ | 157,920 | $ | 678,274 | $ | 713,067 | ||||||||||
|
|
|
|
|
|
|
|
|
|
|
|||||||||||
| Common Share Data |
||||||||||||||||||||
| Earnings per share: |
||||||||||||||||||||
| Basic |
$ | 0.41 | $ | 0.40 | $ | 0.55 | $ | 1.93 | $ | 1.77 | ||||||||||
| Diluted |
$ | 0.41 | $ | 0.40 | $ | 0.54 | $ | 1.93 | $ | 1.75 | ||||||||||
| Operating earnings per share: |
||||||||||||||||||||
| Basic |
$ | 0.55 | $ | 0.56 | $ | 0.54 | $ | 2.22 | $ | 2.15 | ||||||||||
| Diluted |
$ | 0.55 | $ | 0.56 | $ | 0.54 | $ | 2.22 | $ | 2.13 | ||||||||||
|
|
|
|
|
|
|
|
|
|
|
|||||||||||
| Cash dividends per share |
$ | 0.24 | $ | 0.24 | $ | 0.24 | $ | 0.96 | $ | 0.96 | ||||||||||
| Book value per share (period-end) |
$ | 29.49 | $ | 28.70 | $ | 28.91 | $ | 29.49 | $ | 28.91 | ||||||||||
| Tangible book value per share (period-end) |
$ | 19.94 | $ | 19.04 | $ | 19.27 | $ | 19.94 | $ | 19.27 | ||||||||||
| Weighted average number of shares: |
||||||||||||||||||||
| Basic |
82,085 | 82,091 | 84,798 | 83,066 | 84,767 | |||||||||||||||
| Diluted |
82,220 | 82,205 | 85,777 | 83,167 | 85,588 | |||||||||||||||
| Period-end number of shares |
82,237 | 82,107 | 84,848 | 82,237 | 84,848 | |||||||||||||||
| Market data: |
||||||||||||||||||||
| High sales price |
$ | 37.12 | $ | 33.85 | $ | 32.50 | $ | 37.12 | $ | 36.73 | ||||||||||
| Low sales price |
$ | 30.09 | $ | 29.00 | $ | 29.47 | $ | 25.00 | $ | 27.96 | ||||||||||
| Period end closing price |
$ | 36.68 | $ | 31.38 | $ | 31.73 | $ | 36.68 | $ | 31.73 | ||||||||||
| Trading volume |
27,816 | 29,711 | 20,910 | 122,496 | 119,519 | |||||||||||||||
| (c) | Net income less tax-effected securities gains and one-time noninterest expense items. Management believes that operating income provides a useful measure of financial performance that helps investors compare the Company’s fundamental operations over time. |
- 8 -
Hancock Holding Company
Financial Highlights
(amounts in thousands)
(unaudited)
| Three Months Ended | ||||||||||||||||||||
| 12/31/2013 | 9/30/2013 | 6/30/2013 | 3/31/2013 | 12/31/2012 | ||||||||||||||||
| Period-end Balance Sheet |
||||||||||||||||||||
| Commercial non-real estate loans |
$ | 5,064,224 | $ | 4,625,315 | $ | 4,653,342 | $ | 4,425,286 | $ | 4,433,288 | ||||||||||
| Construction and land development loans |
915,541 | 920,408 | 966,499 | 992,820 | 989,306 | |||||||||||||||
| Commercial real estate loans |
3,042,841 | 2,914,969 | 2,872,254 | 2,873,403 | 2,923,094 | |||||||||||||||
| Residential mortgage loans |
1,720,614 | 1,695,197 | 1,616,093 | 1,587,519 | 1,577,944 | |||||||||||||||
| Consumer loans |
1,581,597 | 1,578,583 | 1,573,309 | 1,603,734 | 1,654,170 | |||||||||||||||
|
|
|
|
|
|
|
|
|
|
|
|||||||||||
| Total loans |
12,324,817 | 11,734,472 | 11,681,497 | 11,482,762 | 11,577,802 | |||||||||||||||
|
|
|
|
|
|
|
|
|
|
|
|||||||||||
| Loans held for sale |
24,515 | 18,444 | 20,233 | 34,813 | 50,605 | |||||||||||||||
| Securities |
4,033,124 | 4,124,202 | 4,303,918 | 4,662,279 | 3,716,460 | |||||||||||||||
| Short-term investments |
268,839 | 462,313 | 442,917 | 475,677 | 1,500,188 | |||||||||||||||
|
|
|
|
|
|
|
|
|
|
|
|||||||||||
| Earning assets |
16,651,295 | 16,339,431 | 16,448,565 | 16,655,531 | 16,845,055 | |||||||||||||||
|
|
|
|
|
|
|
|
|
|
|
|||||||||||
| Allowance for loan losses |
(133,626 | ) | (138,223 | ) | (137,969 | ) | (137,777 | ) | (136,171 | ) | ||||||||||
| Other assets |
2,491,582 | 2,600,638 | 2,623,705 | 2,546,369 | 2,755,601 | |||||||||||||||
|
|
|
|
|
|
|
|
|
|
|
|||||||||||
| Total assets |
$ | 19,009,251 | $ | 18,801,846 | $ | 18,934,301 | $ | 19,064,123 | $ | 19,464,485 | ||||||||||
|
|
|
|
|
|
|
|
|
|
|
|||||||||||
| Noninterest bearing deposits |
$ | 5,530,253 | $ | 5,479,696 | $ | 5,340,177 | $ | 5,418,463 | $ | 5,624,127 | ||||||||||
| Interest bearing transaction and savings deposits |
6,162,959 | 6,008,042 | 5,965,372 | 6,017,735 | 6,038,003 | |||||||||||||||
| Interest bearing public fund deposits |
1,571,532 | 1,240,336 | 1,410,866 | 1,528,790 | 1,580,260 | |||||||||||||||
| Time deposits |
2,095,772 | 2,326,797 | 2,439,523 | 2,288,363 | 2,501,798 | |||||||||||||||
|
|
|
|
|
|
|
|
|
|
|
|||||||||||
| Total interest bearing deposits |
9,830,263 | 9,575,175 | 9,815,761 | 9,834,888 | 10,120,061 | |||||||||||||||
|
|
|
|
|
|
|
|
|
|
|
|||||||||||
| Total deposits |
15,360,516 | 15,054,871 | 15,155,938 | 15,253,351 | 15,744,188 | |||||||||||||||
| Short-term borrowings |
657,960 | 782,779 | 828,107 | 722,537 | 639,133 | |||||||||||||||
| Long-term debt |
385,826 | 376,664 | 385,122 | 393,920 | 396,589 | |||||||||||||||
| Other liabilities |
179,880 | 231,090 | 219,794 | 217,215 | 231,297 | |||||||||||||||
| Common shareholders’ equity |
2,425,069 | 2,356,442 | 2,345,340 | 2,477,100 | 2,453,278 | |||||||||||||||
|
|
|
|
|
|
|
|
|
|
|
|||||||||||
| Total liabilities & shareholders’ equity |
$ | 19,009,251 | $ | 18,801,846 | $ | 18,934,301 | $ | 19,064,123 | $ | 19,464,485 | ||||||||||
|
|
|
|
|
|
|
|
|
|
|
|||||||||||
| Capital Ratios |
||||||||||||||||||||
| Common shareholders’ equity |
$ | 2,425,069 | $ | 2,356,442 | $ | 2,345,340 | $ | 2,477,100 | $ | 2,453,278 | ||||||||||
| Tier 1 capital (d) |
1,682,782 | 1,656,497 | 1,632,874 | 1,700,115 | 1,668,809 | |||||||||||||||
| Tangible common equity ratio |
9.00 | % | 8.68 | % | 8.52 | % | 9.14 | % | 8.77 | % | ||||||||||
| Common equity (period-end) as a percent of total assets (period-end) |
12.76 | % | 12.53 | % | 12.39 | % | 12.99 | % | 12.60 | % | ||||||||||
| Leverage (Tier 1) ratio (d) |
9.36 | % | 9.10 | % | 8.96 | % | 9.28 | % | 9.11 | % | ||||||||||
| Tier 1 risk-based capital ratio (d) |
11.87 | % | 12.07 | % | 12.00 | % | 12.78 | % | 12.64 | % | ||||||||||
| Total risk-based capital ratio (d) |
13.23 | % | 13.52 | % | 13.45 | % | 14.41 | % | 14.28 | % | ||||||||||
| (d) | Estimated for most recent period-end. |
- 9 -
Hancock Holding Company
Financial Highlights
(amounts in thousands)
(unaudited)
| Three Months Ended | Twelve Months Ended | |||||||||||||||||||
| 12/31/2013 | 9/30/2013 | 12/31/2012 | 12/31/2013 | 12/31/2012 | ||||||||||||||||
| Average Balance Sheet |
||||||||||||||||||||
| Commercial non-real estate loans |
$ | 4,786,680 | $ | 4,720,608 | $ | 4,316,455 | $ | 4,615,973 | $ | 4,007,506 | ||||||||||
| Construction and land development loans |
931,214 | 970,411 | 1,035,401 | 965,237 | 1,157,064 | |||||||||||||||
| Commercial real estate loans |
2,915,323 | 2,891,830 | 2,910,880 | 2,899,317 | 2,897,317 | |||||||||||||||
| Residential mortgage loans |
1,715,716 | 1,668,201 | 1,613,919 | 1,659,324 | 1,571,465 | |||||||||||||||
| Consumer loans |
1,573,446 | 1,570,345 | 1,667,134 | 1,585,353 | 1,651,387 | |||||||||||||||
|
|
|
|
|
|
|
|
|
|
|
|||||||||||
| Total loans (e) |
11,922,379 | 11,821,395 | 11,543,789 | 11,725,204 | 11,284,739 | |||||||||||||||
|
|
|
|
|
|
|
|
|
|
|
|||||||||||
| Securities (f) |
4,070,657 | 4,135,348 | 3,732,815 | 4,140,051 | 4,063,817 | |||||||||||||||
| Short-term investments |
383,551 | 427,892 | 969,037 | 578,613 | 771,523 | |||||||||||||||
|
|
|
|
|
|
|
|
|
|
|
|||||||||||
| Earning assets |
16,376,587 | 16,384,635 | 16,245,641 | 16,443,868 | 16,120,079 | |||||||||||||||
|
|
|
|
|
|
|
|
|
|
|
|||||||||||
| Allowance for loan losses |
(138,708 | ) | (137,936 | ) | (136,254 | ) | (137,897 | ) | (136,257 | ) | ||||||||||
| Other assets |
2,501,212 | 2,549,328 | 2,855,565 | 2,623,047 | 2,951,547 | |||||||||||||||
|
|
|
|
|
|
|
|
|
|
|
|||||||||||
| Total assets |
$ | 18,739,091 | $ | 18,796,027 | $ | 18,964,952 | $ | 18,929,018 | $ | 18,935,369 | ||||||||||
|
|
|
|
|
|
|
|
|
|
|
|||||||||||
| Noninterest bearing deposits |
$ | 5,483,918 | $ | 5,415,303 | $ | 5,420,081 | $ | 5,393,955 | $ | 5,251,391 | ||||||||||
| Interest bearing transaction and savings deposits |
5,981,110 | 5,919,709 | 5,930,964 | 5,962,114 | 5,827,370 | |||||||||||||||
| Interest bearing public fund deposits |
1,253,199 | 1,302,425 | 1,332,163 | 1,410,679 | 1,451,459 | |||||||||||||||
| Time deposits |
2,197,450 | 2,384,248 | 2,448,694 | 2,350,488 | 2,579,963 | |||||||||||||||
|
|
|
|
|
|
|
|
|
|
|
|||||||||||
| Total interest bearing deposits |
9,431,759 | 9,606,382 | 9,711,821 | 9,723,281 | 9,858,792 | |||||||||||||||
|
|
|
|
|
|
|
|
|
|
|
|||||||||||
| Total deposits |
14,915,677 | 15,021,685 | 15,131,902 | 15,117,236 | 15,110,183 | |||||||||||||||
| Short-term borrowings |
848,934 | 820,500 | 847,058 | 806,082 | 843,798 | |||||||||||||||
| Long-term debt |
381,561 | 385,203 | 321,713 | 389,153 | 338,875 | |||||||||||||||
| Other liabilities |
237,151 | 229,694 | 229,100 | 229,983 | 241,710 | |||||||||||||||
| Common shareholders’ equity |
2,355,768 | 2,338,945 | 2,435,179 | 2,386,564 | 2,400,803 | |||||||||||||||
|
|
|
|
|
|
|
|
|
|
|
|||||||||||
| Total liabilities & shareholders’ equity |
$ | 18,739,091 | $ | 18,796,027 | $ | 18,964,952 | $ | 18,929,018 | $ | 18,935,369 | ||||||||||
|
|
|
|
|
|
|
|
|
|
|
|||||||||||
| (e) | Includes loans held for sale. |
| (f) | Average securities does not include unrealized holding gains/losses on available for sale securities. |
- 10 -
Hancock Holding Company
Average Balance and Net Interest Margin Summary
(amounts in thousands)
(unaudited)
| Three Months Ended | ||||||||||||||||||||||||||||||||||||
| 12/31/2013 | 9/30/2013 | 12/31/2012 | ||||||||||||||||||||||||||||||||||
| Interest | Volume | Rate | Interest | Volume | Rate | Interest | Volume | Rate | ||||||||||||||||||||||||||||
| Average Earning Assets |
||||||||||||||||||||||||||||||||||||
| Commercial & real estate loans (TE) |
$ | 104,168 | $ | 8,633,217 | 4.79 | % | $ | 109,450 | $ | 8,582,849 | 5.06 | % | $ | 113,004 | $ | 8,262,736 | 5.44 | % | ||||||||||||||||||
| Residential mortgage loans |
23,612 | 1,715,716 | 5.50 | % | 24,968 | 1,668,201 | 5.99 | % | 27,998 | 1,613,919 | 6.94 | % | ||||||||||||||||||||||||
| Consumer loans |
24,382 | 1,573,446 | 6.15 | % | 25,740 | 1,570,345 | 6.51 | % | 28,593 | 1,667,134 | 6.82 | % | ||||||||||||||||||||||||
| Loan fees & late charges |
1,001 | — | 0.00 | % | 689 | — | 0.00 | % | 3,098 | — | 0.00 | % | ||||||||||||||||||||||||
|
|
|
|
|
|
|
|
|
|
|
|
|
|
|
|
|
|
|
|||||||||||||||||||
| Total loans (TE) |
153,163 | 11,922,379 | 5.10 | % | 160,847 | 11,821,395 | 5.41 | % | 172,693 | 11,543,789 | 5.95 | % | ||||||||||||||||||||||||
| US Treasury and government agency securities |
555 | 100,150 | 2.20 | % | 33 | 5,585 | 2.34 | % | 51 | 18,315 | 1.11 | % | ||||||||||||||||||||||||
| CMOs |
7,804 | 1,425,839 | 2.19 | % | 7,278 | 1,463,403 | 1.99 | % | 7,204 | 1,577,165 | 1.83 | % | ||||||||||||||||||||||||
| Mortgage backed securities |
13,866 | 2,299,544 | 2.41 | % | 13,042 | 2,410,763 | 2.16 | % | 10,475 | 1,891,704 | 2.22 | % | ||||||||||||||||||||||||
| Municipals (TE) |
2,443 | 235,778 | 4.14 | % | 2,715 | 247,140 | 4.39 | % | 2,942 | 238,733 | 4.93 | % | ||||||||||||||||||||||||
| Other securities |
58 | 9,346 | 2.49 | % | 53 | 8,457 | 2.51 | % | 94 | 6,898 | 5.43 | % | ||||||||||||||||||||||||
|
|
|
|
|
|
|
|
|
|
|
|
|
|
|
|
|
|
|
|||||||||||||||||||
| Total securities (TE) (g) |
24,726 | 4,070,657 | 2.43 | % | 23,121 | 4,135,348 | 2.24 | % | 20,766 | 3,732,815 | 2.21 | % | ||||||||||||||||||||||||
| Total short-term investments |
220 | 383,551 | 0.23 | % | 253 | 427,892 | 0.23 | % | 616 | 969,037 | 0.25 | % | ||||||||||||||||||||||||
| Average earning assets yield (TE) |
$ | 178,109 | $ | 16,376,587 | 4.32 | % | $ | 184,221 | $ | 16,384,635 | 4.47 | % | $ | 194,075 | $ | 16,245,641 | 4.76 | % | ||||||||||||||||||
| Interest-bearing Liabilities |
||||||||||||||||||||||||||||||||||||
| Interest-bearing transaction and savings deposits |
$ | 1,399 | $ | 5,981,110 | 0.09 | % | $ | 1,398 | $ | 5,919,709 | 0.09 | % | $ | 1,719 | $ | 5,930,964 | 0.12 | % | ||||||||||||||||||
| Time deposits |
3,328 | 2,197,450 | 0.60 | % | 3,687 | 2,384,248 | 0.61 | % | 4,507 | 2,448,694 | 0.73 | % | ||||||||||||||||||||||||
| Public funds |
663 | 1,253,199 | 0.21 | % | 766 | 1,302,425 | 0.23 | % | 861 | 1,332,163 | 0.26 | % | ||||||||||||||||||||||||
|
|
|
|
|
|
|
|
|
|
|
|
|
|
|
|
|
|
|
|||||||||||||||||||
| Total interest bearing deposits |
5,390 | 9,431,759 | 0.23 | % | 5,851 | 9,606,382 | 0.24 | % | 7,087 | 9,711,821 | 0.29 | % | ||||||||||||||||||||||||
| Short-term borrowings |
1,092 | 848,934 | 0.51 | % | 1,074 | 820,500 | 0.52 | % | 1,273 | 847,058 | 0.60 | % | ||||||||||||||||||||||||
| Long-term debt |
3,161 | 381,561 | 3.29 | % | 3,184 | 385,203 | 3.28 | % | 2,915 | 321,713 | 3.60 | % | ||||||||||||||||||||||||
|
|
|
|
|
|
|
|
|
|
|
|
|
|
|
|
|
|
|
|||||||||||||||||||
| Total borrowings |
4,253 | 1,230,495 | 1.37 | % | 4,258 | 1,205,703 | 1.40 | % | 4,188 | 1,168,771 | 1.43 | % | ||||||||||||||||||||||||
| Total interest bearing liabilities cost |
$ | 9,643 | $ | 10,662,254 | 0.36 | % | $ | 10,109 | $ | 10,812,085 | 0.37 | % | $ | 11,275 | $ | 10,880,592 | 0.41 | % | ||||||||||||||||||
| Net interest-free funding sources |
5,714,333 | 5,572,550 | 5,365,049 | |||||||||||||||||||||||||||||||||
| Total Cost of Funds |
$ | 9,643 | $ | 16,376,587 | 0.23 | % | $ | 10,109 | $ | 16,384,635 | 0.24 | % | $ | 11,275 | $ | 16,245,641 | 0.28 | % | ||||||||||||||||||
| Net Interest Spread (TE) |
$ | 168,466 | 3.96 | % | $ | 174,112 | 4.10 | % | $ | 182,800 | 4.35 | % | ||||||||||||||||||||||||
| Net Interest Margin (TE) |
$ | 168,466 | $ | 16,376,587 | 4.09 | % | $ | 174,112 | $ | 16,384,635 | 4.23 | % | $ | 182,800 | $ | 16,245,641 | 4.48 | % | ||||||||||||||||||
| (g) | Average securities does not include unrealized holding gains/losses on available for sale securities. |
- 11 -
Hancock Holding Company
Average Balance and Net Interest Margin Summary
(amounts in thousands)
(unaudited)
| Twelve Months Ended | ||||||||||||||||||||||||
| 12/31/2013 | 12/31/2012 | |||||||||||||||||||||||
| Interest | Volume | Rate | Interest | Volume | Rate | |||||||||||||||||||
| Average Earning Assets |
||||||||||||||||||||||||
| Commercial & real estate loans (TE) |
$ | 430,258 | $ | 8,480,527 | 5.07 | % | $ | 443,360 | $ | 8,061,887 | 5.50 | % | ||||||||||||
| Residential mortgage loans |
101,800 | 1,659,324 | 6.14 | % | 111,662 | 1,571,465 | 7.11 | % | ||||||||||||||||
| Consumer loans |
103,157 | 1,585,353 | 6.51 | % | 115,470 | 1,651,387 | 6.99 | % | ||||||||||||||||
| Loan fees & late charges |
3,494 | — | 0.00 | % | 6,335 | — | 0.00 | % | ||||||||||||||||
|
|
|
|
|
|
|
|
|
|
|
|
|
|||||||||||||
| Total loans (TE) |
638,709 | 11,725,204 | 5.45 | % | 676,827 | 11,284,739 | 6.00 | % | ||||||||||||||||
| US Treasury and government agency securities |
606 | 28,063 | 2.16 | % | 2,104 | 99,136 | 2.12 | % | ||||||||||||||||
| CMOs |
29,627 | 1,502,867 | 1.97 | % | 29,790 | 1,545,531 | 1.93 | % | ||||||||||||||||
| Mortgage backed securities |
51,730 | 2,367,274 | 2.19 | % | 51,332 | 2,150,799 | 2.39 | % | ||||||||||||||||
| Municipals (TE) |
10,342 | 233,310 | 4.43 | % | 11,814 | 260,488 | 4.54 | % | ||||||||||||||||
| Other securities |
208 | 8,537 | 2.44 | % | 348 | 7,863 | 4.43 | % | ||||||||||||||||
|
|
|
|
|
|
|
|
|
|
|
|
|
|||||||||||||
| Total securities (TE) (h) |
92,513 | 4,140,051 | 2.23 | % | 95,388 | 4,063,817 | 2.35 | % | ||||||||||||||||
| Total short-term investments |
1,398 | 578,613 | 0.24 | % | 1,919 | 771,523 | 0.25 | % | ||||||||||||||||
| Average earning assets yield (TE) |
$ | 732,620 | $ | 16,443,868 | 4.45 | % | $ | 774,134 | $ | 16,120,079 | 4.80 | % | ||||||||||||
| Interest-Bearing Liabilities |
||||||||||||||||||||||||
| Interest-bearing transaction deposits |
$ | 5,998 | $ | 5,962,114 | 0.10 | % | $ | 7,353 | $ | 5,827,370 | 0.13 | % | ||||||||||||
| Time deposits |
14,896 | 2,350,488 | 0.63 | % | 21,242 | 2,579,963 | 0.82 | % | ||||||||||||||||
| Public funds |
3,281 | 1,410,679 | 0.23 | % | 4,146 | 1,451,459 | 0.29 | % | ||||||||||||||||
|
|
|
|
|
|
|
|
|
|
|
|
|
|||||||||||||
| Total interest bearing deposits |
24,175 | 9,723,281 | 0.25 | % | 32,741 | 9,858,792 | 0.33 | % | ||||||||||||||||
| Short-term borrowings |
4,542 | 806,082 | 0.56 | % | 6,065 | 843,798 | 0.72 | % | ||||||||||||||||
| Long-term debt |
12,762 | 389,153 | 3.28 | % | 12,876 | 338,875 | 3.80 | % | ||||||||||||||||
|
|
|
|
|
|
|
|
|
|
|
|
|
|||||||||||||
| Total borrowings |
17,304 | 1,195,235 | 1.45 | % | 18,941 | 1,182,673 | 1.60 | % | ||||||||||||||||
| Total interest bearing liabilities cost |
$ | 41,479 | $ | 10,918,516 | 0.38 | % | $ | 51,682 | $ | 11,041,465 | 0.47 | % | ||||||||||||
| Net interest-free funding sources |
5,525,352 | 5,078,614 | ||||||||||||||||||||||
| Total Cost of Funds |
$ | 41,479 | $ | 16,443,868 | 0.25 | % | $ | 51,682 | $ | 16,120,079 | 0.32 | % | ||||||||||||
| Net Interest Spread (TE) |
$ | 691,141 | 4.07 | % | $ | 722,452 | 4.33 | % | ||||||||||||||||
| Net Interest Margin (TE) |
$ | 691,141 | $ | 16,443,868 | 4.20 | % | $ | 722,452 | $ | 16,120,079 | 4.48 | % | ||||||||||||
| (h) | Average securities does not include unrealized holding gains/losses on available for sale securities. |
- 12 -
Hancock Holding Company
Financial Highlights
(amounts in thousands)
(unaudited)
| Three Months Ended | Twelve Months Ended | |||||||||||||||||||
| 12/31/2013 | 9/30/2013 | 12/31/2012 | 12/31/2013 | 12/31/2012 | ||||||||||||||||
| Asset Quality Information |
||||||||||||||||||||
| Non-accrual loans (i) |
$ | 84,011 | $ | 100,649 | $ | 121,837 | $ | 84,011 | $ | 121,837 | ||||||||||
| Restructured loans (j) |
24,947 | 29,705 | 32,215 | 24,947 | 32,215 | |||||||||||||||
|
|
|
|
|
|
|
|
|
|
|
|||||||||||
| Total non-performing loans |
108,958 | 130,354 | 154,052 | 108,958 | 154,052 | |||||||||||||||
| ORE and foreclosed assets |
76,979 | 85,560 | 102,072 | 76,979 | 102,072 | |||||||||||||||
|
|
|
|
|
|
|
|
|
|
|
|||||||||||
| Total non-performing assets |
$ | 185,937 | $ | 215,914 | $ | 256,124 | $ | 185,937 | $ | 256,124 | ||||||||||
|
|
|
|
|
|
|
|
|
|
|
|||||||||||
| Non-performing assets as a percent of loans, ORE and foreclosed assets |
1.50 | % | 1.83 | % | 2.19 | % | 1.50 | % | 2.19 | % | ||||||||||
| Accruing loans 90 days past due |
$ | 10,387 | $ | 15,620 | $ | 13,244 | $ | 10,387 | $ | 13,244 | ||||||||||
| Accruing loans 90 days past due as a percent of loans |
0.08 | % | 0.13 | % | 0.11 | % | 0.08 | % | 0.11 | % | ||||||||||
| Non-performing assets + accruing loans 90 days past due to loans, ORE and foreclosed assets |
1.58 | % | 1.96 | % | 2.31 | % | 1.58 | % | 2.31 | % | ||||||||||
| Net charge-offs - non-covered |
$ | 5,216 | $ | 5,430 | $ | 28,038 | $ | 24,309 | $ | 55,031 | ||||||||||
| Net charge-offs - covered |
(3,399 | ) | 506 | 3,230 | 2,355 | 26,069 | ||||||||||||||
| Net charge-offs - non-covered as a percent of average loans |
0.17 | % | 0.18 | % | 0.97 | % | 0.21 | % | 0.49 | % | ||||||||||
| Allowance for loan losses |
$ | 133,626 | $ | 138,233 | $ | 136,171 | $ | 133,626 | $ | 136,171 | ||||||||||
| Allowance for loan losses as a percent of period-end loans |
1.08 | % | 1.18 | % | 1.18 | % | 1.08 | % | 1.18 | % | ||||||||||
| Allowance for loan losses to non-performing loans + accruing loans 90 days past due |
111.97 | % | 94.69 | % | 81.40 | % | 111.97 | % | 81.40 | % | ||||||||||
| Provision for loan losses |
$ | 7,331 | $ | 7,569 | $ | 28,051 | $ | 32,734 | $ | 54,192 | ||||||||||
| Allowance for Loan Losses |
||||||||||||||||||||
| Beginning Balance |
$ | 138,223 | $ | 137,969 | $ | 135,591 | $ | 136,171 | $ | 124,881 | ||||||||||
| Net provision for loan losses - covered loans |
(532 | ) | 1,024 | 199 | 7,455 | 2,823 | ||||||||||||||
| Provision for loan losses - non-covered loans |
7,863 | 6,545 | 27,852 | 25,279 | 51,369 | |||||||||||||||
|
|
|
|
|
|
|
|
|
|
|
|||||||||||
| Net provision for loan losses |
7,331 | 7,569 | 28,051 | 32,734 | 54,192 | |||||||||||||||
|
|
|
|
|
|
|
|
|
|
|
|||||||||||
| (Decrease) increase in FDIC loss share receivable |
(10,111 | ) | (1,379 | ) | 3,797 | (8,615 | ) | 38,198 | ||||||||||||
| Charge-offs - non-covered |
11,515 | 8,698 | 30,172 | 42,899 | 64,760 | |||||||||||||||
| Recoveries - non-covered |
(6,299 | ) | (3,268 | ) | (2,134 | ) | (18,590 | ) | (9,729 | ) | ||||||||||
| Net charge-offs - covered |
(3,399 | ) | 506 | 3,230 | 2,355 | 26,069 | ||||||||||||||
|
|
|
|
|
|
|
|
|
|
|
|||||||||||
| Net charge-offs |
1,817 | 5,936 | 31,268 | 26,664 | 81,100 | |||||||||||||||
|
|
|
|
|
|
|
|
|
|
|
|||||||||||
| Ending Balance |
$ | 133,626 | $ | 138,223 | $ | 136,171 | $ | 133,626 | $ | 136,171 | ||||||||||
|
|
|
|
|
|
|
|
|
|
|
|||||||||||
| Net Charge-off Information |
||||||||||||||||||||
| Net charge-offs - non-covered: |
||||||||||||||||||||
| Commercial/real estate loans |
$ | 2,183 | $ | 1,267 | $ | 23,090 | $ | 11,684 | $ | 36,902 | ||||||||||
| Residential mortgage loans |
(197 | ) | 541 | 1,372 | 361 | 5,951 | ||||||||||||||
| Consumer loans |
3,230 | 3,622 | 3,576 | 12,264 | 12,178 | |||||||||||||||
|
|
|
|
|
|
|
|
|
|
|
|||||||||||
| Total net charge-offs - non-covered |
$ | 5,216 | $ | 5,430 | $ | 28,038 | $ | 24,309 | $ | 55,031 | ||||||||||
|
|
|
|
|
|
|
|
|
|
|
|||||||||||
| Average loans: |
||||||||||||||||||||
| Commercial/real estate loans |
$ | 8,633,217 | $ | 8,582,849 | $ | 8,262,736 | $ | 8,480,527 | $ | 8,061,887 | ||||||||||
| Residential mortgage loans |
1,715,716 | 1,668,201 | 1,613,919 | 1,659,324 | 1,571,465 | |||||||||||||||
| Consumer loans |
1,573,446 | 1,570,345 | 1,667,134 | 1,585,353 | 1,651,387 | |||||||||||||||
|
|
|
|
|
|
|
|
|
|
|
|||||||||||
| Total average loans |
$ | 11,922,379 | $ | 11,821,395 | $ | 11,543,789 | $ | 11,725,204 | $ | 11,284,739 | ||||||||||
|
|
|
|
|
|
|
|
|
|
|
|||||||||||
| Net charge-offs - non-covered to average loans: |
||||||||||||||||||||
| Commercial/real estate loans |
0.10 | % | 0.06 | % | 1.11 | % | 0.14 | % | 0.46 | % | ||||||||||
| Residential mortgage loans |
(0.05 | )% | 0.13 | % | 0.34 | % | 0.02 | % | 0.38 | % | ||||||||||
| Consumer loans |
0.81 | % | 0.92 | % | 0.85 | % | 0.77 | % | 0.74 | % | ||||||||||
|
|
|
|
|
|
|
|
|
|
|
|||||||||||
| Total net charge-offs - non-covered to average loans |
0.17 | % | 0.18 | % | 0.97 | % | 0.21 | % | 0.49 | % | ||||||||||
|
|
|
|
|
|
|
|
|
|
|
|||||||||||
| (i) | Non-accrual loans and accruing loans past due 90 days or more do not include non-accrual restructured loans and acquired credit-impaired loans which were written down to fair value upon acquisition and accrete interest income over the remaining life of the loan. |
| (j) | Included in restructured loans are $15.7 million, $19.1 million, and $15.8 million in non-accrual loans at 12/31/2013, 9/30/13, and 12/31/12, respectively. Total excludes acquired credit-impaired loans. |
- 13 -
Hancock Holding Company
Financial Highlights
(amounts in thousands)
(unaudited)
| Supplemental Asset Quality Information |
Originated Loans | Acquired Loans (k) | Covered Loans (l) | Total | ||||||||||||
| 12/31/2013 | ||||||||||||||||
| Non-accrual loans |
$ | 61,887 | $ | 18,580 | $ | 3,544 | $ | 84,011 | ||||||||
| Restructured loans |
21,222 | 3,725 | — | 24,947 | ||||||||||||
|
|
|
|
|
|
|
|
|
|||||||||
| Total non-performing loans |
83,109 | 22,305 | 3,544 | 108,958 | ||||||||||||
| ORE and foreclosed assets |
51,240 | — | 25,739 | 76,979 | ||||||||||||
|
|
|
|
|
|
|
|
|
|||||||||
| Total non-performing assets (m) |
$ | 134,349 | $ | 22,305 | $ | 29,283 | $ | 185,937 | ||||||||
|
|
|
|
|
|
|
|
|
|||||||||
| Accruing loans 90 days past due |
$ | 3,298 | $ | 7,089 | — | $ | 10,387 | |||||||||
| Allowance for loan losses |
$ | 78,885 | $ | 1,647 | $ | 53,094 | $ | 133,626 | ||||||||
| 9/30/2013 | ||||||||||||||||
| Non-accrual loans |
$ | 75,663 | $ | 19,823 | $ | 5,163 | $ | 100,649 | ||||||||
| Restructured loans |
25,942 | 3,763 | — | 29,705 | ||||||||||||
|
|
|
|
|
|
|
|
|
|||||||||
| Total non-performing loans |
101,605 | 23,586 | 5,163 | 130,354 | ||||||||||||
| ORE and foreclosed assets |
60,187 | — | 25,373 | 85,560 | ||||||||||||
|
|
|
|
|
|
|
|
|
|||||||||
| Total non-performing assets |
$ | 161,792 | $ | 23,586 | $ | 30,536 | $ | 215,914 | ||||||||
|
|
|
|
|
|
|
|
|
|||||||||
| Accruing loans 90 days past due |
$ | 12,512 | $ | 3,108 | — | $ | 15,620 | |||||||||
| Allowance for loan losses |
$ | 77,421 | $ | 463 | $ | 60,339 | $ | 138,223 | ||||||||
| Loans Outstanding |
Originated Loans | Acquired Loans (k) | Covered Loans (l) | Total | ||||||||||||
| 12/31/2013 | ||||||||||||||||
| Commercial non-real estate loans |
$ | 4,113,837 | $ | 926,997 | $ | 23,390 | $ | 5,064,224 | ||||||||
| Construction and land development loans |
752,381 | 142,931 | 20,229 | 915,541 | ||||||||||||
| Commercial real estate loans |
2,022,528 | 967,148 | 53,165 | 3,042,841 | ||||||||||||
| Residential mortgage loans |
1,196,256 | 315,340 | 209,018 | 1,720,614 | ||||||||||||
| Consumer loans |
1,409,130 | 119,603 | 52,864 | 1,581,597 | ||||||||||||
|
|
|
|
|
|
|
|
|
|||||||||
| Total loans |
$ | 9,494,132 | $ | 2,472,019 | $ | 358,666 | $ | 12,324,817 | ||||||||
|
|
|
|
|
|
|
|
|
|||||||||
| Change in loan balance from previous quarter |
$ | 793,365 | ($ | 169,684 | ) | ($ | 33,336 | ) | $ | 590,345 | ||||||
|
|
|
|
|
|
|
|
|
|||||||||
| 9/30/2013 | ||||||||||||||||
| Commercial non-real estate loans |
$ | 3,633,490 | $ | 967,485 | $ | 24,340 | $ | 4,625,315 | ||||||||
| Construction and land development loans |
738,983 | 158,228 | 23,197 | 920,408 | ||||||||||||
| Commercial real estate loans |
1,816,402 | 1,038,287 | 60,280 | 2,914,969 | ||||||||||||
| Residential mortgage loans |
1,124,649 | 347,054 | 223,494 | 1,695,197 | ||||||||||||
| Consumer loans |
1,387,243 | 130,649 | 60,691 | 1,578,583 | ||||||||||||
|
|
|
|
|
|
|
|
|
|||||||||
| Total loans |
$ | 8,700,767 | $ | 2,641,703 | $ | 392,002 | $ | 11,734,472 | ||||||||
|
|
|
|
|
|
|
|
|
|||||||||
| Change in loan balance from previous quarter |
$ | 447,012 | ($ | 355,328 | ) | ($ | 38,709 | ) | $ | 52,975 | ||||||
|
|
|
|
|
|
|
|
|
|||||||||
| (k) | Loans which have been acquired and no allowance brought forward in accordance with acquisition accounting. |
| (l) | Acquired loans which are covered by loss sharing agreements with the FDIC providing considerable protection against credit risk. |
| (m) | ORE received in settlement of acquired loans is no longer subject to purchase accounting guidance and has been included with ORE from originated loans. ORE received in settlement of covered loans remains covered under the FDIC loss share agreements. |
- 14 -
 Fourth Quarter 2013
Financial Results
January
23, 2014
Fourth Quarter 2013
Financial Results
January
23, 2014 |
 Forward-Looking
Statements
Forward-Looking
Statements
Certain of the statements or information included in this presentation
may constitute forward-looking statements.
Forward-looking statements include projections of revenue, costs, results of operations or
financial condition or statements regarding future market conditions or
our potential plans and strategies for the future.
Forward-looking statements that we may make include, but may not be limited to, comments
with respect to future levels of economic activity in our
markets, loan growth, deposit trends, credit quality
trends, future sales of nonperforming assets, net interest margin
trends, future expense levels and the ability to achieve
reductions in non-interest expense or other cost savings, projected tax rates, future
profitability, improvements in expense to revenue (efficiency) ratio,
purchase accounting impacts such as accretion levels, the impact
of the branch rationalization process, and the financial impact of regulatory
requirements. Hancock’s ability to accurately project
results or predict the effects of future plans or strategies is
inherently limited. We believe that the expectations
reflected or implied by any forward-looking statements are based on
reasonable assumptions, but actual results and performance could
differ materially from those set forth in
the forward-looking statements. Factors that could cause
actual results or outcomes to differ from those expressed in the
Company’s forward-looking statements include, but are not limited to, those outlined in
Hancock’s SEC filings, including the “Risk
Factors” section of the Company’s 10-K for the
year ended December 31, 2012 and most recent form
10-Q. Hancock undertakes no obligation to update or revise
any forward-looking statements, and you are cautioned not to
place undue reliance on such forward-looking statements. 2
|
 Fourth Quarter Highlights:
Core Improvements Largely Offset Declining PAAs
Core Improvements Largely Offset Declining PAAs
3
Core net interest income (TE) increased approximately $1.5 million and
core net interest margin (NIM) improved 3 basis points (bps)
linked-quarter –
The Company defines its core results as reported results less the
impact of net purchase accounting adjustments (PAAs)
Operating expenses declined $4.2 million linked-quarter and the
Company remains on track to meet its first quarter of 2014
expense target Approximately $625 million linked-quarter net
loan growth, or 22% annualized, and over $900 million, or 8%,
year-over-year loan growth –
Each excluding the FDIC-covered loan portfolio
Purchase accounting loan accretion declined approximately $8 million,
or $.06 per diluted common share after tax
Continued improvement in overall asset quality metrics
Tax rate declined to 20%, mainly related to benefits from additional
investments in New Market Tax Credit projects in the fourth
quarter |
 •
Net income (operating) $46 million or $.55 per diluted common share,
in line with Company guidance
•
ROA (operating) 0.97%
•
ROTCE (operating) 11.59%
•
Net income includes one-time
noninterest expense items of
$17.1 million ($11.1 million
after tax), or $.14 per diluted
common share
Fourth Quarter Highlights:
Fourth Quarter Highlights:
Core Improvements Largely Offset Declining PAAs
Core Improvements Largely Offset Declining PAAs
4
Operating income is defined as net income excluding tax-effected
securities transactions gains or losses and one-time
noninterest expense items. * Core is defined as
reported results less purchase accounting adjustments. See
table on slide 13. ** Noninterest expense as a percent of
total revenue (TE) before amortization of purchased intangibles,
one-time noninterest expense items and securities
transactions. |
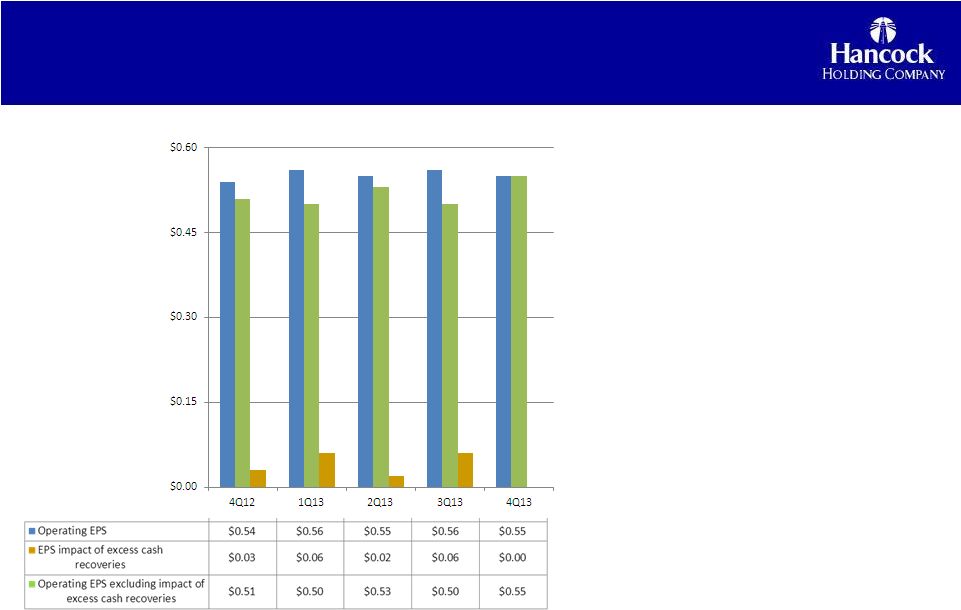 Results In Line With Guidance
Results In Line With Guidance
•
Volatility related to excess
cash recoveries (included in
loan accretion totals) has been
impacting quarterly operating
EPS results (additional data on
slide 13) •
Projections do not include
excess cash recoveries
•
Expected 4Q13 operating EPS
to be flat to slightly down
•
No excess cash recoveries
forecast for 2014
5 |
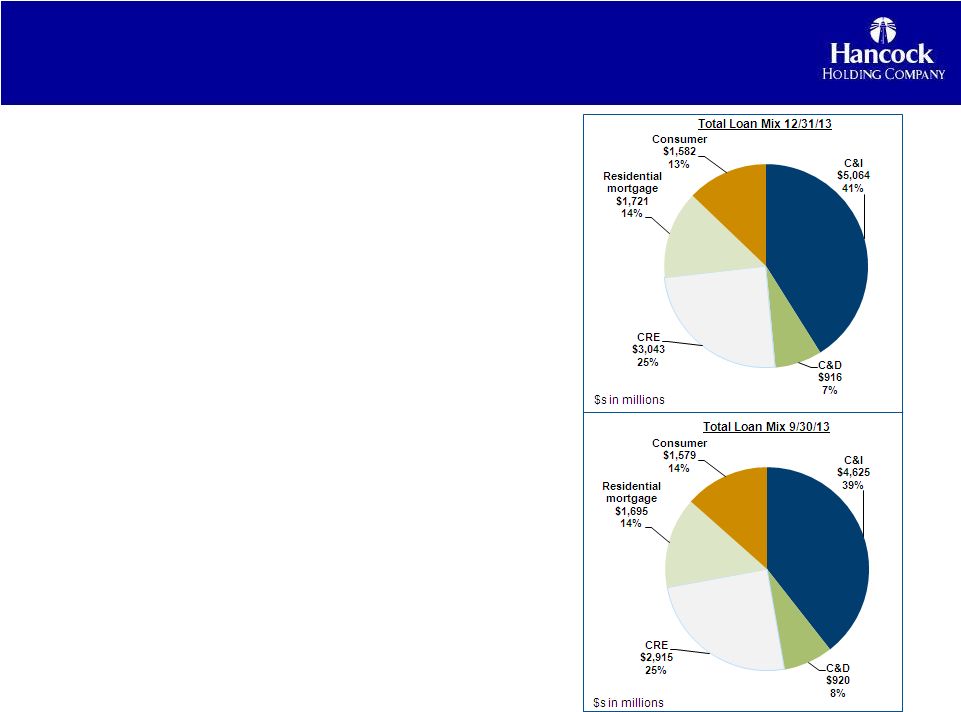 Strong Level of Originations Across The
Footprint
Footprint
•
Excluding FDIC covered loans, total loans of $12.0
billion were up $625 million
–
The largest component of linked-quarter net growth was in
the commercial and industrial (C&I) portfolio (+10%),
followed by increases in the commercial real estate (CRE)
(+5%) and residential mortgage (+3%) portfolios
•
Many of the markets across the Company’s footprint
reported net loan growth during the quarter, with the
majority of the growth in south Louisiana, Houston
and Florida markets
•
For the full year of 2014, management expects
period-end loan growth in the mid-single digit range
Period-end balances. As of December 31, 2013
6 |
 Whitney Portfolio Continues
Solid Performance
Solid Performance
•
Loan mark on the acquired-performing portfolio accreted into
earnings over the life of the portfolio
•
Credit-impaired loan mark available for charge-offs; if not
needed for charge-offs then accreted into income
•
Quarterly reviews of accretion levels and portfolio performance will
impact reported margin 7
As of December 31, 2013
$s in millions
Credit-
Impaired
Performing
Total
Whitney loan mark at acquisition
(as adjusted in 4Q11)
$284
$187
$471
Acquired portfolio loan balances at acquisition
$818
$6,101
$6,919
Discount at acquisition
34.7%
3.1%
6.8%
Remaining Whitney loan mark at 12/31/13
$128
$30
$158
Remaining acquired portfolio loan balances at 12/31/13
$200
$2,431
$2,631
Acquired loan charge-offs from acquisition thru
12/31/13
$29
$10
$39
Discount at 12/31/13
64%
1.2%
6.0% |
 Peoples First Loan Mark Used
For Charge-Offs
For Charge-Offs
•
FDIC covered loan portfolio
•
Entire loan mark available for charge-offs; if not needed for
charge-offs then accreted into income •
Quarterly reviews of accretion levels and portfolio performance will
impact reported margin •
FDIC loss share receivable totaled $114 million at December 31,
2013 Balance reflects the total amount expected to be collected
from the FDIC 8
$s in millions
Credit Impaired
Peoples First loan mark at acquisition (12/2009)
$509
Charge-offs from acquisition thru 12/31/13
$413
Accretion since acquisition date
$85
Remaining loan mark at 12/31/13
$50
Impairment reserve at 12/31/13
$53
Remaining covered portfolio loan balances at 12/31/13
$409
Discount & allowance at 12/31/13
25%
As of December 31, 2013 |
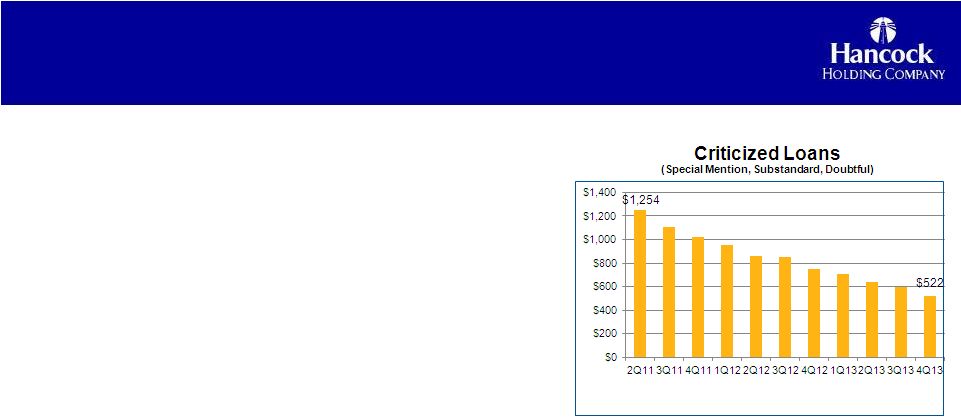 •
Nonperforming assets totaled $186 million, down $30
million compared to September 30, 2013
–
ORE and foreclosed assets declined $9 million linked-quarter
–
Nonperforming loans down $21 million, or 16%,
compared to 3Q13
•
The allowance for loan losses was $133.6 million (1.08%)
at year-end, down from $138.2 million (1.18%) linked-
quarter
–
The decline in the allowance was primarily related to a $7.2 million
reversal of a previous impairment on FDIC covered loans
–
The allowance maintained on the non-covered portion of the loan
portfolio increased $2.6 million linked-quarter, totaling
$80.5 million •
Provision for loan losses was $7.3 million, slightly down
from $7.6 million in 3Q13
–
4Q13 includes $7.9 million for the non-covered loan
portfolio, compared to $6.5 million in 3Q13
•
Non-covered net charge-offs totaled $5.2 million, or 0.17%,
compared to $5.4 million, or 0.18%, in 3Q13
Continued Improvement In
Continued Improvement In
Asset Quality Metrics
Asset Quality Metrics
9
$s in millions
Excludes covered portfolio and gross of the Whitney loan mark
As of December 31, 2013 |
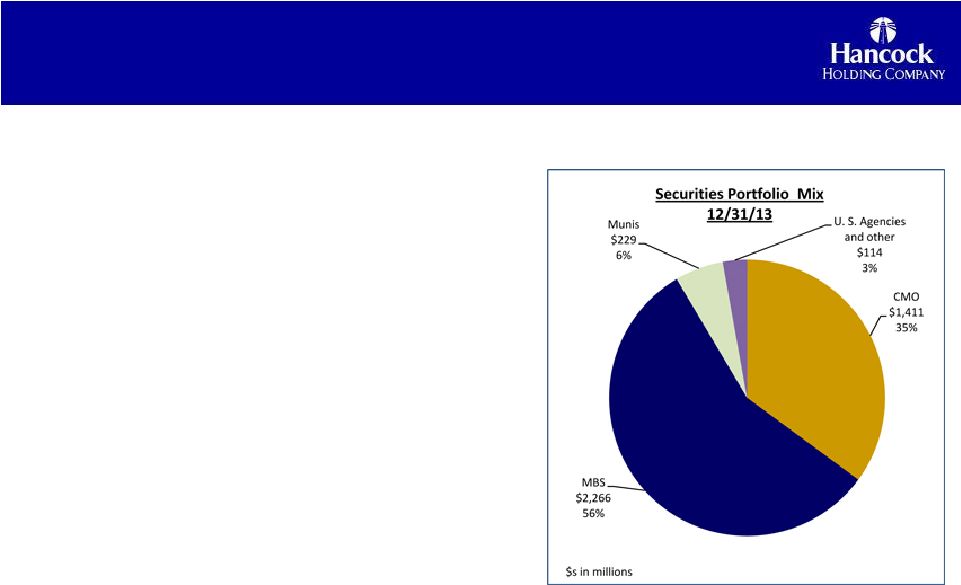 Securities Portfolio Continues To Fund
Loan Growth
Securities Portfolio Continues To Fund
Loan Growth
10
•
Portfolio totaled $4.0 billion, down $82 million
linked-quarter
•
Decline continues to fund loan growth
–
Better earning asset mix
•
Yield 2.43% for 4Q13, up 19 bps
•
Slowdowns in prepayments on mortgage-backed
securities continued to positively impact overall
portfolio yield during the quarter
•
Unrealized gain (net) of $13.0 million on AFS
•
65% HTM, 35% AFS
•
Duration 3.99, up from 3.84 at September 30, 2013
–
Extends to 4.2 in +100 bps shift in the yield curve
–
Extends to 4.5 in +200 bps shift in the yield curve
Period-end balances. As of December 31, 2013
|
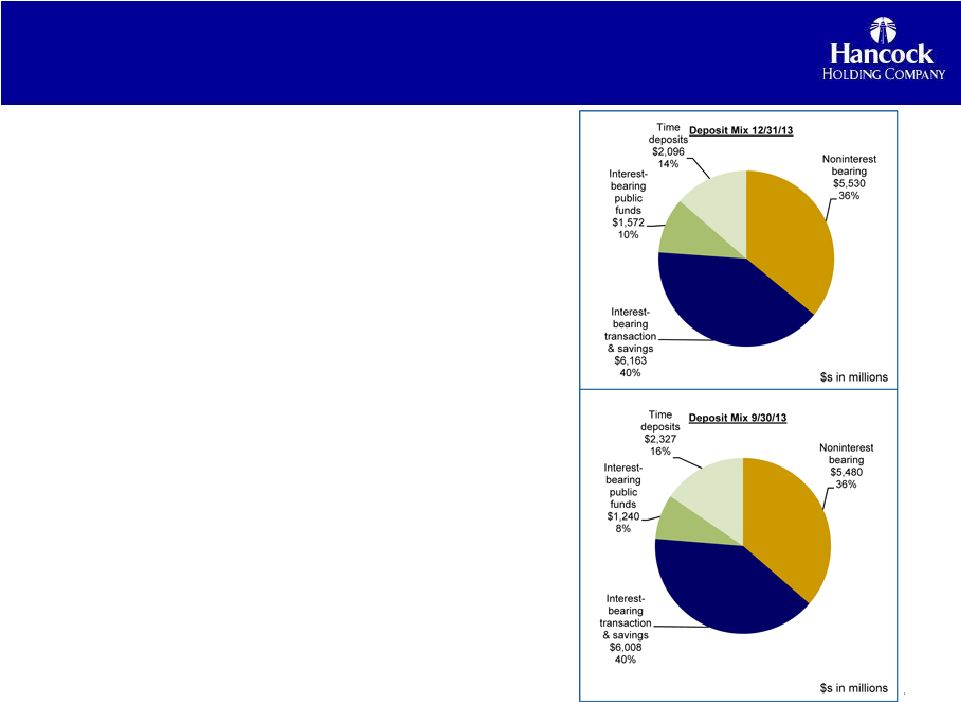 Strong Core Deposit
Funding
Funding
•
Total deposits $15.4 billion, up over $300
million linked-quarter
•
Linked-quarter growth related to increases in
interest bearing public fund deposits of $331
million
•
Time deposits declined $231 million, with the
remaining deposit categories up $206 million
•
Funding mix remained strong
–
Noninterest-bearing demand deposits (DDA)
comprised 36% of total period-end deposits
–
No and low cost deposits comprised 76% of total period-end
deposits
–
Cost of funds declined 1bp to 23 bps
11
Period-end balances. As of December 31, 2013
|
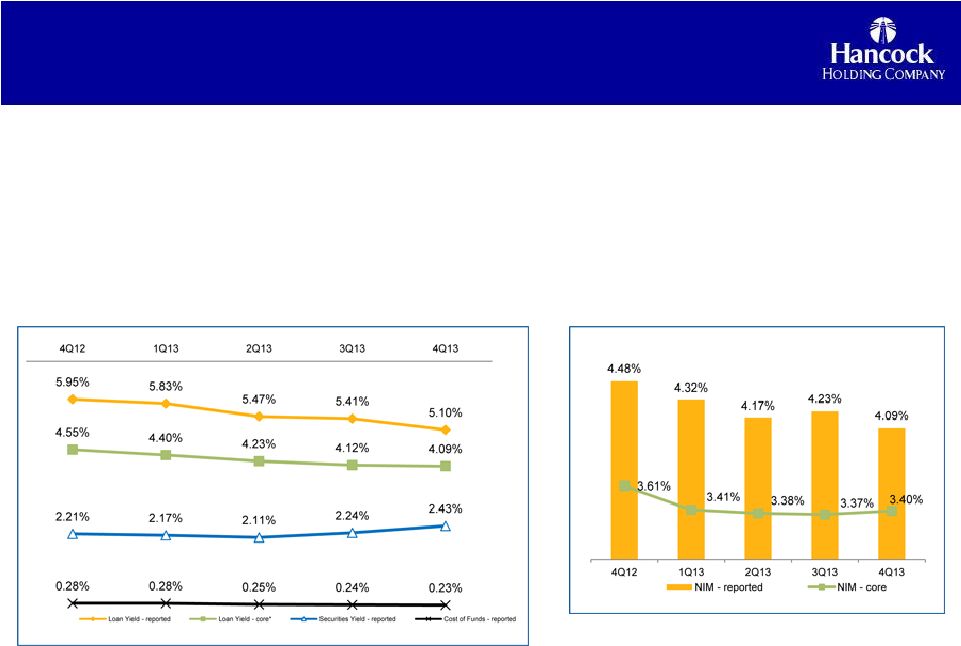 Core NIM Expansion; Reported NIM
Impacted By Decline in PAAs
Impacted By Decline in PAAs
•
Reported net interest margin (NIM) 4.09%, down 14 bps
linked-quarter –
Approximately 17 bps of NIM compression related to the $7.1 million
decrease in net purchase accounting adjustments
linked-quarter •
Core NIM expanded 3 bps
–
Slight decline in core loan yield (3bps) offset by increased yield on
securities (+19bps) portfolio and a lower cost of funds
(1bp) –
Better earning asset mix and increased loan volume
12
Core NIM = reported net interest income (TE) excluding total net
purchase accounting adjustments, annualized, as a percent of
average earning assets. (See slide 12)
As of December 31, 2013 |
 Purchase Accounting Adjustments
Core NII & NIM Reconciliation
Purchase Accounting Adjustments
Core NII & NIM Reconciliation
13
($s in millions)
4Q13
3Q13
2Q13
1Q13
4Q12
Net Interest Income (TE) –
reported (NII)
$168.5
$174.1
$171.8
$176.7
$182.8
Whitney expected loan accretion (performing)
9.3
10.4
12.8
13.7
17.6
Whitney expected loan accretion (credit impaired)
18.2
15.8
15.9
14.6
11.5
Peoples First expected loan accretion
2.8
4.3
4.1
4.5
7.4
Excess cash recoveries*
---
7.7
3.1
7.5
4.0
Total Loan Accretion
$30.3
$38.3
$35.9
$40.3
$40.5
Whitney premium bond amortization
(1.8)
(2.8)
(3.4)
(3.5)
(5.4)
Whitney and Peoples First CD accretion
.1
.1
.2
.3
.3
Total Net Purchase Accounting
Adjustments (PAAs) impacting NII
$28.5
$35.6
$32.7
$37.1
$35.5
Net Interest Income (TE) –
core
(Reported NII less net PAAs)
$140.0
$138.5
$139.0
$139.7
$147.3
Average Earning Assets
$16,377
$16,385
$16,500
$16,518
$16,246
Net Interest Margin –
reported
4.09%
4.23%
4.17%
4.32%
4.48%
Net Purchase Accounting Adjustments (%)
.69%
.86%
.79%
.91%
.87%
Net Interest Margin -
core
3.40%
3.37%
3.38%
3.41%
3.61%
* Excess cash recoveries include cash collected on certain zero
carrying value acquired loan pools above expected amounts. |
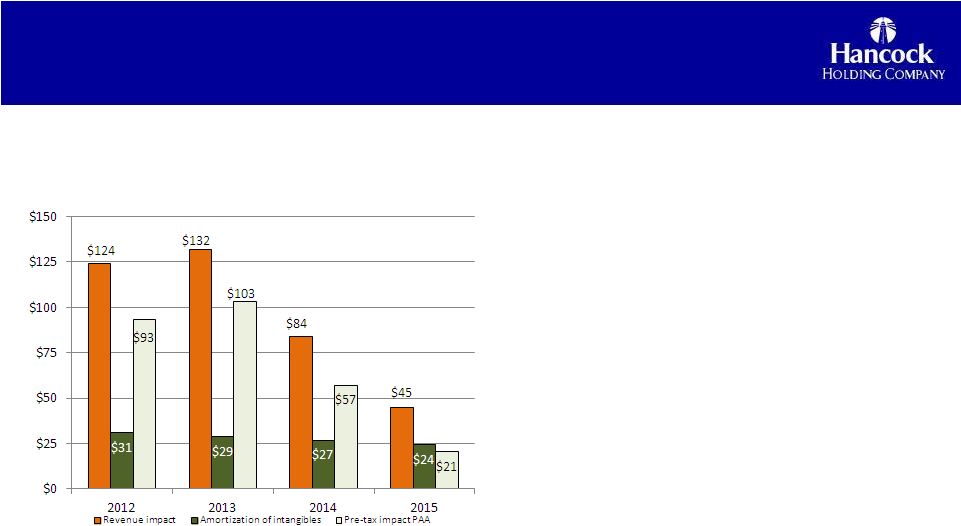 Purchased Loan Accretion Declining
•
Net purchase accounting
adjustments will be part of
earnings through 2015
•
Revenue includes loan
accretion, securities
amortization, CD accretion
•
Amortization of intangibles
mainly related to the Whitney
acquisition
14
$s in millions
Impact of Purchase Accounting Adjustments 2012-2015
(2014-2015 projections will be updated quarterly; subject to
volatility) As of December 31, 2013
|
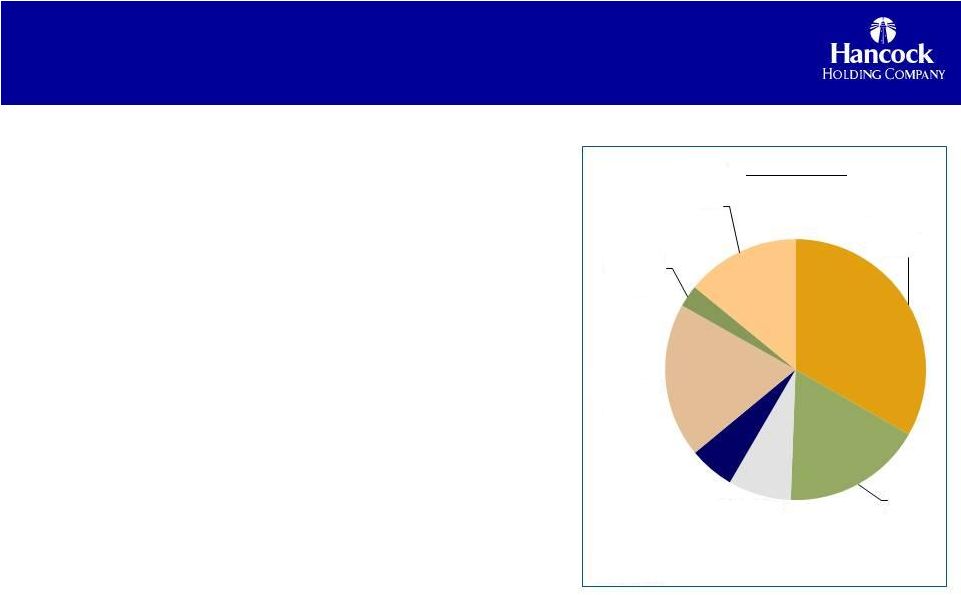 Noninterest Income Reflects Changes
Related to Seasonality, Economy
Related to Seasonality, Economy
15
As of December 31, 2013
•
Noninterest income totaled $59.0 million, down $4.1 million
linked-quarter •
Service charges on deposits totaled $19.6 million, down $0.9 million
from 3Q13, due, in part, to fewer business days in the fourth
quarter •
Bankcard and ATM fees totaled $11.3 million, down approximately $1.0
million from 3Q13
–
Decline due, in part, to a one-time Visa-related incentive
recorded in 3Q13
•
Trust, investment and annuity, and insurance fees totaled $18.1
million, down $0.2 million from 3Q13
–
During the fourth quarter, an increase of $0.7 million, or 8%, in trust
fees was offset by declines in investment and annuity, and
insurance fees •
Other noninterest income totaled $8.3 million, down $1.2 million, or
12%, linked-quarter
–
The decline mainly reflects a lower level of expected future losses on
covered loans, which resulted in an increase of $1.1 million in
the amortization of the indemnification asset
•
Fees from secondary mortgage operations totaled $1.6 million, down $0.9
million linked-quarter
–
The decline mainly reflects a continued slowdown in mortgage loan
activity, reflecting mainly the impact of increased
longer-term interest rates on originations
–
The quarter’s activity also reflects a continued higher level of
portfolio production compared to secondary market
production $s in millions
Service
Charges on
Deposit
$19.6
33%
Trust
$10.2
17%
Investment &
annuity
$4.6
8%
Insurance
$3.3
6%
ATM
$11.3
19%
Secondary
mortgage
operations
$1.6
3%
Other
$8.3
14%
Bankcard and
Fee Mix 4Q13 |
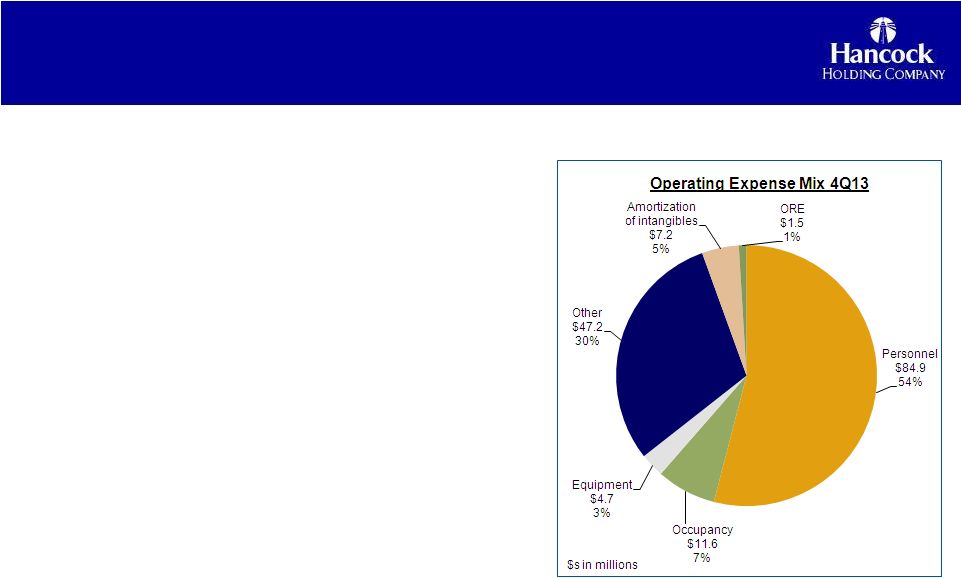 Noninterest Expense Includes One-Time Items;
Operating Expense Continues To Decline
Operating Expense Continues To Decline
•
Noninterest expense totaled $174.2 million in 4Q13
–
Includes $17.1 million of one-time costs mainly related
to the expense & efficiency initiative
•
Noninterest expense excluding one-time costs (or operating
expense) totaled $157.1 million, down $4.2 million from
3Q13
•
Personnel expense, the largest component of total
noninterest expense, totaled $84.9 million, a decrease
of $1.9 million linked-quarter
•
Occupancy and equipment totaled $16.3 million, down
$1.2 million linked-quarter
•
The reduction in personnel, occupancy and equipment
reflect a full quarter’s impact from the closing of 26
branch locations across its five-state footprint in August
2013
•
ORE expense totaled $1.5 million down $0.9 million
from 3Q13
16
As of December 31, 2013 |
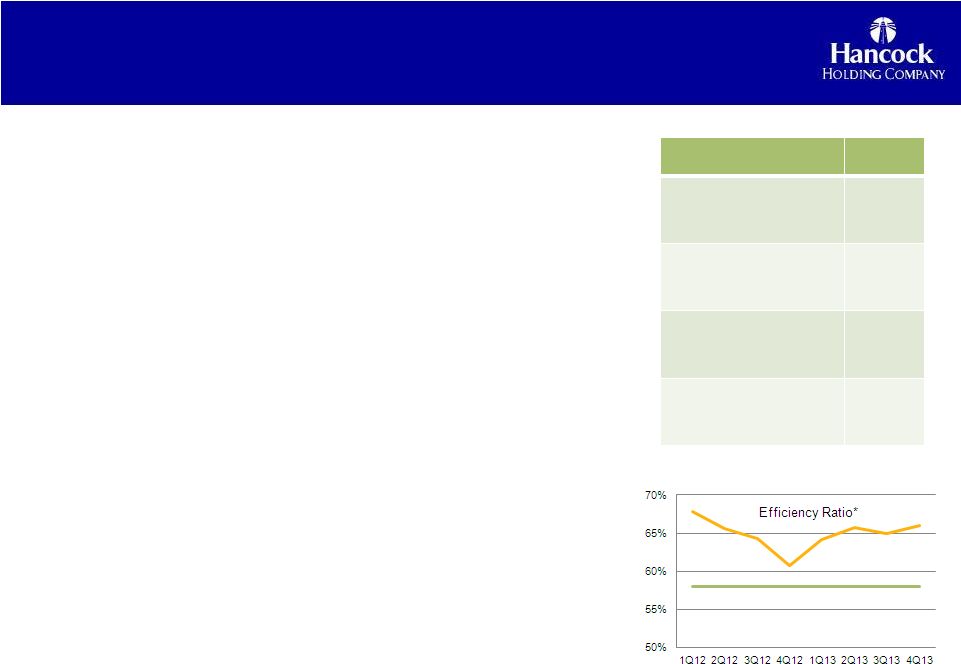 Efficiency & Process Improvement
Initiative On Track
Initiative On Track
•
On track to achieve the first quarter of 2014 efficiency and
expense target
–
Re-defined markets with either a consumer, business or
combination focus
–
Continued the branch rationalization process and recently closed
or sold 38 smaller, retail branches across the five-state
footprint –
Restructured and consolidated market leadership
–
Re-focused efforts around procurement savings through centralized
sourcing and RFPs
–
Added efficiency through process enhancements and enabling
technology implementation
–
Announced the bank charter consolidation
•
Continuing to review initiatives designed to meet the fourth
quarter of 2014 target
•
Longer-term sustainable efficiency ratio target of 57%-59% set
for 2016
•
Expect to incur additional one-time costs through the remainder
of the initiative
17
$s in millions
1Q13 noninterest
expense
$160
Annualized 1Q13
noninterest expense
$640
1Q14 noninterest
expense projection
$153
4Q14 noninterest
expense projection
$147
Midpoint Long-Term Efficiency Ratio Target 57%
-
59%
The efficiency ratio is defined as noninterest expense as a percent of
total revenue (TE) before amortization of purchased intangibles, sub debt redemption costs, securities transactions and merger expenses. |
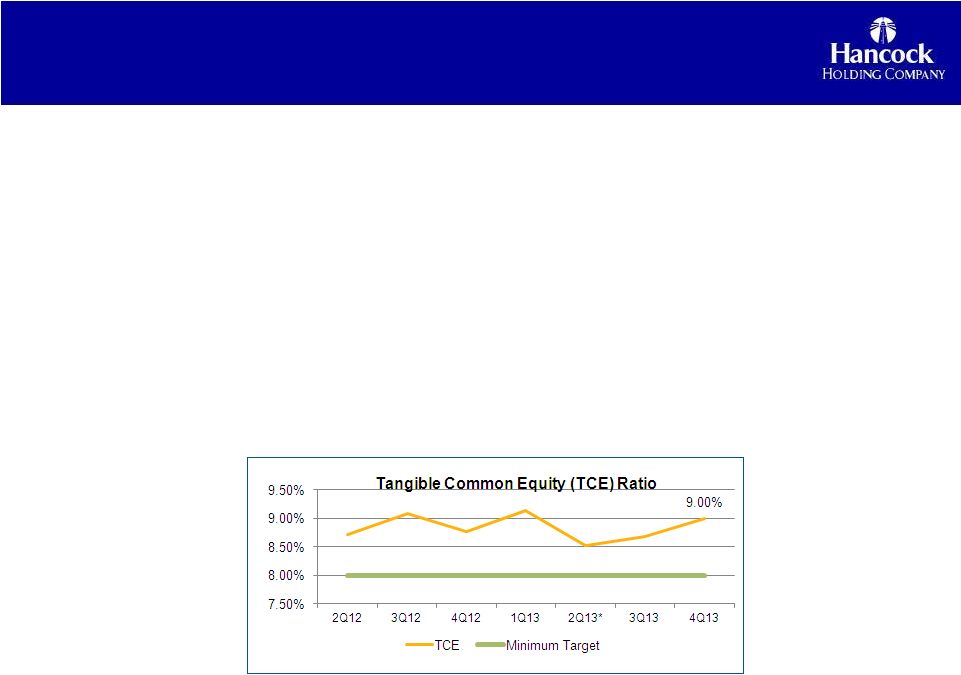 •
TCE ratio 9.00%
•
Announced stock buyback of up to 5% of outstanding common stock
–
Executed an accelerated share repurchase on May 9, 2013
–
Total transaction amount of $115 million
–
Received approximately 2.8 million shares
–
Impacted TCE ratio by 63 bps in 2Q13
–
Based on current stock prices, the remaining shares of approximately
700,000 will be received no later than 2Q14 •
Continue reviewing options to deploy excess capital in the best
interest of the Company and its shareholders
•
Projected capital levels exceed Basel III fully implemented, required
guidelines Solid Capital Levels
Solid Capital Levels
18
As of December 31, 2013
*Stock Buyback
(ASR) initiated |
 Appendix
19 |
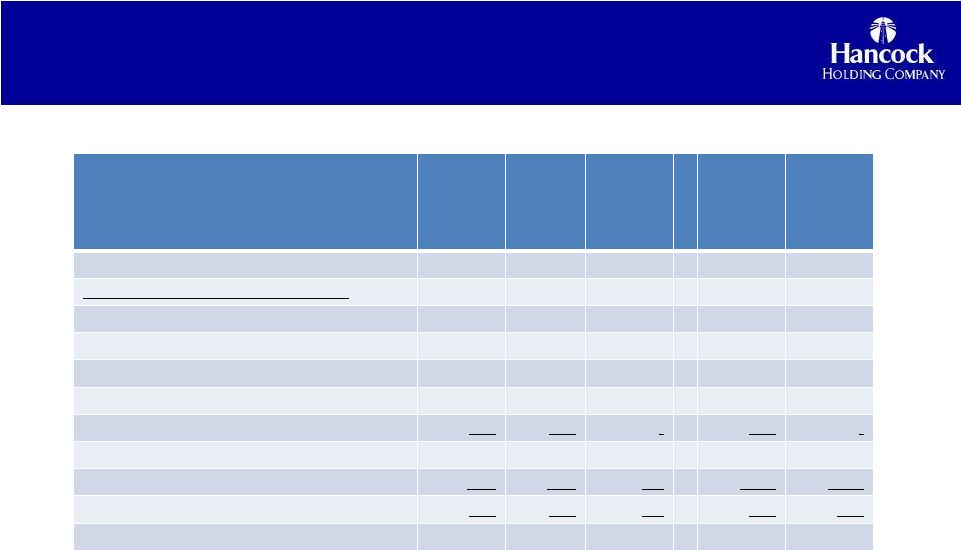 Non-GAAP
Reconciliation
Non-GAAP
Non-GAAP
Reconciliation
Reconciliation
20
*Management believes that adjusting net income to operating income provides a useful measure
of financial performance that helps investors compare the Company’s fundamental
operations over time. $s in millions
Three
Months
Ended
12/31/2013
Three
Months
Ended
9/30/2013
Three
Months
Ended
12/31/2012
Twelve
Months
Ended
12/31/2013
Twelve
Months
Ended
12/31/2012
Net income
$34.7
$33.2
$47.0
$163.4
$151.7
Adjustments from net to operating income
Securities transactions gains/(losses)
.1
-
.6
.1
1.6
One-time noninterest expense items:
Merger-related
-
-
-
-
45.8
Subdebt early redemption
-
-
-
-
5.3
Expense & efficiency initiative and other items
17.1
20.9
-
38.0
-
Total one-time noninterest expense items
17.1
20.9
-
38.0
51.1
Taxes on adjustment @ 35%
(6.0)
(7.3)
(.2)
(13.3)
(17.4)
Total adjustments (net of taxes)
11.1
13.6
(.4)
24.6
32.2
Operating income*
$45.8
$46.8
$46.6
$188.0
$184.0 |
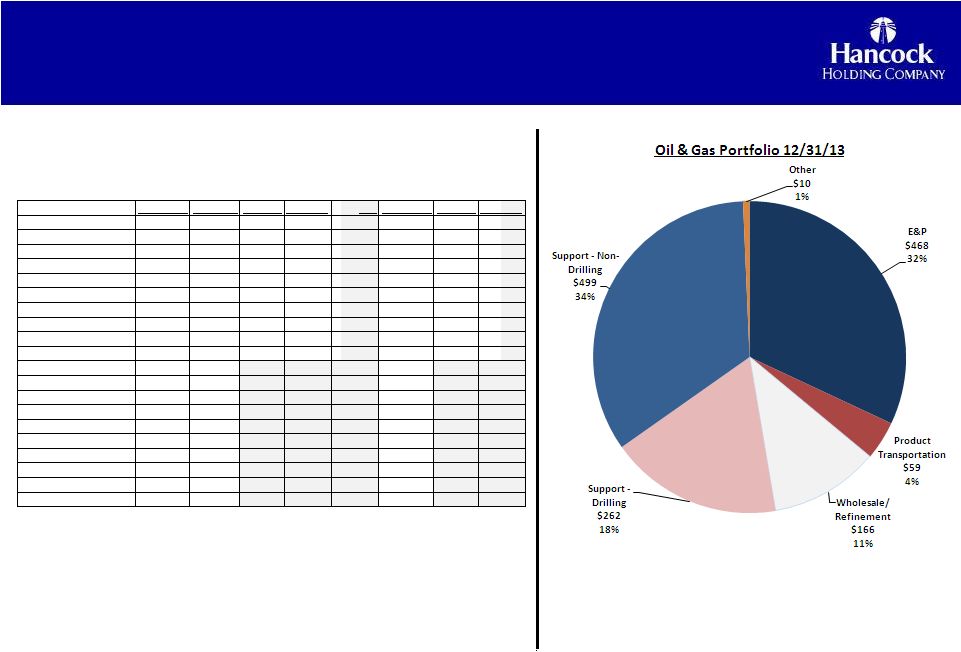   Additional Loan Data
Additional Loan Data
21
$s in millions
12/31/2013
9/30/2013
$ change
% change
LQA
12/31/2012
$ change
% change
Loans (EOP)
12,325
$
11,735
$
590
$
5%
20%
11,578
$
747
$
6%
Commercial
5,064
4,625
439
9%
38%
4,433
631
14%
Construction
916
920
(5)
-1%
-2%
989
(74)
-7%
Real Estate
3,043
2,915
128
4%
18%
2,923
120
4%
Residential mortgage
1,721
1,695
25
1%
6%
1,578
143
9%
Consumer
1,582
1,579
3
0%
1%
1,654
(73)
-4%
Covered Loans
359
$
392
$
(33)
$
-9%
-34%
516
$
(157)
$
-30%
Commercial
23
24
(1)
-4%
-15%
29
(6)
-20%
Construction
20
23
(3)
-13%
-51%
28
(8)
-29%
Real Estate
53
60
(7)
-12%
-47%
95
(42)
-44%
Residential mortgage
209
224
(14)
-6%
-26%
264
(54)
-21%
Consumer
53
61
(8)
-13%
-52%
99
(47)
-47%
Loans excluding covered
11,966
$
11,343
$
624
$
5%
22%
11,062
$
904
$
8%
Commercial
5,041
4,601
440
10%
38%
4,404
637
14%
Construction
895
897
(2)
0%
-1%
961
(66)
-7%
Real Estate
2,990
2,855
135
5%
19%
2,828
162
6%
Residential mortgage
1,512
1,472
40
3%
11%
1,314
197
15%
Consumer
1,529
1,518
11
1%
3%
1,555
(26)
-2%
O&G totals for 9/30/13 have been updated.
Portfolio increased approximately $180 million
versus a comparable 9/30/13 total. |
 Fourth Quarter 2013
Financial Results
January
23, 2014
Fourth Quarter 2013
Financial Results
January
23, 2014 |