Attached files
| file | filename |
|---|---|
| 8-K - Q4 2013 FORM 8-K - CSX CORP | form8kq42013.htm |
| EX-99.1 - Q4 2013 PRESS RELEASE - CSX CORP | pressrelease_q42013.htm |
Exhibit 99.2


CSX Corporation Announces Fourth-Quarter and Full-Year Earnings
Highlights:
• | Fourth-quarter and full-year earnings per share of $0.42 and $1.83, respectively |
• | Revenue gains broad-based, led by intermodal and merchandise markets |
• | Favorable outlook for majority of markets in 2014 |
JACKSONVILLE, Fla. - January 15, 2014 - CSX Corporation (NYSE: CSX) today announced fourth-quarter 2013 net earnings of $426 million, or $0.42 per share, down slightly from $449 million, or $0.44 per share in 2012. Prior year results included after-tax real estate gains of $57 million or 6 cents per share.
“Supported by the strength of an expanding economy, we delivered 6 percent volume growth in the quarter, despite another sharp decline in coal,” said Michael J. Ward, chairman, president and chief executive officer. “As the economy continues to expand, CSX is well positioned to leverage that environment to create sustainable long-term value for our customers and shareholders.”
Fourth-quarter revenue increased 5 percent to $3.0 billion, driven by broad-based strength in the company’s merchandise and intermodal markets. Operations were resilient in the quarter, despite increased volume and challenging winter weather at the end of the quarter. However, the cycling of prior year real estate gains contributed to operating income that was essentially unchanged at $813 million.
For the full-year 2013, net earnings were $1.83 per share, up slightly from $1.79 per share in 2012. Full-year 2013 revenue increased 2 percent to a record $12.0 billion, operating income remained stable at $3.5 billion, and the operating ratio increased slightly to 71.1 percent compared with 70.6 percent for 2012.
Looking forward, the company remains on target to sustain a high-60s operating ratio by 2015 and achieve a mid-60s operating ratio longer-term.
CSX executives will conduct a quarterly earnings conference call with the investment community on January 16, 2014, at 8:30 a.m. Eastern time. Investors, media and the public may listen to the conference call by dialing 1-888-EARN-CSX (888-327-6279) and asking for the CSX earnings call. Callers outside the U.S., dial 1-773-756-0199. Participants should dial in 10 minutes prior to the call. In conjunction with the call, a live webcast will be accessible and presentation materials will be posted on the company's website at http://investors.csx.com. Following the earnings call, an internet replay of the presentation will be archived on the company website.
This earnings announcement, as well as additional detailed financial information, is contained in the CSX Quarterly Financial Report available on the company’s website at http://investors.csx.com and on Form 8-K with the Securities and Exchange Commission.
Table of Contents | The accompanying unaudited | CSX CORPORATION | CONTACTS: |
financial information should be | 500 Water Street, C900 | ||
read in conjunction with the | Jacksonville, FL 32202 | INVESTOR RELATIONS | |
Company’s most recent | www.csx.com | David Baggs | |
Annual Report on Form 10-K, | (904) 359-4812 | ||
Quarterly Reports on Form | MEDIA | ||
10-Q, and any Current | Melanie Cost | ||
Reports on Form 8-K. | (904) 359-1702 | ||
1
CSX, based in Jacksonville, Florida, is a premier transportation company. It provides rail, intermodal and rail-to-truck transload services and solutions to customers across a broad array of markets, including energy, industrial, construction, agricultural, and consumer products. For more than 185 years, CSX has played a critical role in the nation’s economic expansion and industrial development. Its network connects every major metropolitan area in the eastern United States, where nearly two-thirds of the nation’s population resides. It also links more than 240 short-line railroads and more than 70 ocean, river and lake ports with major population centers and small farming towns alike. More information about CSX Corporation and its subsidiaries is available at www.csx.com. Like us on Facebook (http://www.facebook.com/OfficialCSX) and follow us on Twitter (http://twitter.com/CSX).
Forward-looking Statements
This information and other statements by the company may contain forward-looking statements within the meaning of the Private Securities Litigation Reform Act with respect to, among other items: projections and estimates of earnings, revenues, margins, volumes, rates, cost-savings, expenses, taxes, liquidity, capital expenditures, dividends, share repurchases or other financial items, statements of management's plans, strategies and objectives for future operations, and management's expectations as to future performance and operations and the time by which objectives will be achieved, statements concerning proposed new services, and statements regarding future economic, industry or market conditions or performance. Forward-looking statements are typically identified by words or phrases such as “will,” “should,” “believe,” “expect,” “anticipate,” “project,” “estimate,” “preliminary” and similar expressions. Forward-looking statements speak only as of the date they are made, and the company undertakes no obligation to update or revise any forward-looking statement. If the company updates any forward-looking statement, no inference should be drawn that the company will make additional updates with respect to that statement or any other forward-looking statements.
Forward-looking statements are subject to a number of risks and uncertainties, and actual performance or results could differ materially from that anticipated by any forward-looking statements. Factors that may cause actual results to differ materially from those contemplated by any forward- looking statements include, among others; (i) the company's success in implementing its financial and operational initiatives; (ii) changes in domestic or international economic, political or business conditions, including those affecting the transportation industry (such as the impact of industry competition, conditions, performance and consolidation); (iii) legislative or regulatory changes; (iv) the inherent business risks associated with safety and security; (v) the outcome of claims and litigation involving or affecting the company; (vi) natural events such as severe weather conditions or pandemic health crises; and (vii) the inherent uncertainty associated with projecting economic and business conditions.
Other important assumptions and factors that could cause actual results to differ materially from those in the forward-looking statements are specified in the company's SEC reports, accessible on the SEC's website at www.sec.gov and the company's website at www.csx.com.
2
CSX Corporation
CONSOLIDATED INCOME STATEMENTS (a)
(Dollars in millions, except per share amounts)
(Unaudited) | (Unaudited) | ||||||||||||||||||||||
Quarters Ended | Years Ended | ||||||||||||||||||||||
Dec. 27, 2013 | Dec. 28, 2012 | $ Change | % Change | Dec. 27, 2013 | Dec. 28, 2012 | $ Change | % Change | ||||||||||||||||
(Adjusted)(a) | (Adjusted)(a) | ||||||||||||||||||||||
Revenue | $ | 3,032 | $ | 2,895 | $ | 137 | 5 | % | $ | 12,026 | $ | 11,763 | $ | 263 | 2 | % | |||||||
Expense | |||||||||||||||||||||||
Labor and Fringe | 803 | 752 | (51 | ) | (7 | ) | 3,138 | 3,020 | (118 | ) | (4 | ) | |||||||||||
Materials, Supplies and Other | 632 | 539 | (93 | ) | (17 | ) | 2,275 | 2,156 | (119 | ) | (6 | ) | |||||||||||
Fuel | 408 | 421 | 13 | 3 | 1,656 | 1,672 | 16 | 1 | |||||||||||||||
Depreciation | 281 | 271 | (10 | ) | (4 | ) | 1,104 | 1,059 | (45 | ) | (4 | ) | |||||||||||
Equipment and Other Rents | 95 | 97 | 2 | 2 | 380 | 392 | 12 | 3 | |||||||||||||||
Total Expense | 2,219 | 2,080 | (139 | ) | (7 | ) | 8,553 | 8,299 | (254 | ) | (3 | ) | |||||||||||
Operating Income | 813 | 815 | (2 | ) | — | 3,473 | 3,464 | 9 | — | ||||||||||||||
Interest Expense | (139 | ) | (145 | ) | 6 | 4 | (562 | ) | (566 | ) | 4 | 1 | |||||||||||
Other Income - Net (b) | — | 59 | (59 | ) | (100 | ) | 11 | 73 | (62 | ) | (85 | ) | |||||||||||
Earnings Before Income Taxes | 674 | 729 | (55 | ) | (8 | ) | 2,922 | 2,971 | (49 | ) | (2 | ) | |||||||||||
Income Tax Expense | (248 | ) | (280 | ) | 32 | 11 | (1,058 | ) | (1,108 | ) | 50 | 5 | |||||||||||
Net Earnings | $ | 426 | $ | 449 | $ | (23 | ) | (5 | )% | $ | 1,864 | $ | 1,863 | $ | 1 | — | % | ||||||
Operating Ratio | 73.2 | % | 71.8 | % | 71.1 | % | 70.6 | % | |||||||||||||||
Per Common Share | |||||||||||||||||||||||
Net Earnings Per Share, Assuming Dilution | $ | 0.42 | $ | 0.44 | $ | (0.02 | ) | (5 | )% | $ | 1.83 | $ | 1.79 | $ | 0.04 | 2 | % | ||||||
Average Shares Outstanding, Assuming Dilution (millions) | 1,013 | 1,028 | 1,019 | 1,040 | |||||||||||||||||||
Cash Dividends Paid Per Common Share | $ | 0.15 | $ | 0.14 | $ | 0.59 | $ | 0.54 | |||||||||||||||
3
CSX Corporation
CONDENSED CONSOLIDATED BALANCE SHEETS
(Dollars in millions)
(Unaudited) | ||||||
Dec. 27, 2013 | Dec. 28, 2012 | |||||
(Adjusted)(a) | ||||||
ASSETS | ||||||
Cash and Cash Equivalents | $ | 592 | $ | 784 | ||
Short-term Investments | 487 | 587 | ||||
Other Current Assets | 1,523 | 1,582 | ||||
Properties - Net | 27,291 | 26,050 | ||||
Investment in Affiliates and Other Companies | 1,298 | 1,206 | ||||
Other Long-term Assets | 591 | 514 | ||||
Total Assets | $ | 31,782 | $ | 30,723 | ||
LIABILITIES AND SHAREHOLDERS' EQUITY | ||||||
Current Maturities of Long-term Debt | $ | 533 | $ | 780 | ||
Other Current Liabilities | 1,891 | 1,865 | ||||
Long-term Debt | 9,022 | 9,052 | ||||
Deferred Income Taxes | 8,662 | 8,096 | ||||
Other Long-term Liabilities | 1,170 | 1,794 | ||||
Total Liabilities | 21,278 | 21,587 | ||||
Total Shareholders' Equity | 10,504 | 9,136 | ||||
Total Liabilities and Shareholders' Equity | $ | 31,782 | $ | 30,723 | ||
4
CSX Corporation
CONDENSED CONSOLIDATED CASH FLOW STATEMENTS
(Dollars in millions)
(Unaudited) | ||||||
Years Ended | ||||||
Dec. 27, 2013 | Dec. 28, 2012 | |||||
(Adjusted)(a) | ||||||
OPERATING ACTIVITIES | ||||||
Net Earnings | $ | 1,864 | $ | 1,863 | ||
Depreciation | 1,104 | 1,059 | ||||
Deferred Income Taxes | 300 | 592 | ||||
Contributions to Qualified Pension Plans | — | (275 | ) | |||
Gains on Property Dispositions | (70 | ) | (166 | ) | ||
Other Operating Activities - Net | 69 | (127 | ) | |||
Net Cash Provided by Operating Activities | 3,267 | 2,946 | ||||
INVESTING ACTIVITIES | ||||||
Property Additions | (2,313 | ) | (2,341 | ) | ||
Purchase of Short-term Investments | (1,256 | ) | (633 | ) | ||
Proceeds from Sales of Short-term Investments | 1,401 | 581 | ||||
Proceeds from Property Dispositions | 53 | 186 | ||||
Other Investing Activities | (112 | ) | (70 | ) | ||
Net Cash Used in Investing Activities | (2,227 | ) | (2,277 | ) | ||
FINANCING ACTIVITIES | ||||||
Long-term Debt Issued | 500 | 1,100 | ||||
Long-term Debt Repaid | (780 | ) | (508 | ) | ||
Dividends Paid | (600 | ) | (558 | ) | ||
Shares Repurchased (c) | (353 | ) | (734 | ) | ||
Other Financing Activities - Net | 1 | 32 | ||||
Net Cash Used in Financing Activities | (1,232 | ) | (668 | ) | ||
Net (Decrease) Increase in Cash and Cash Equivalents | (192 | ) | 1 | |||
CASH AND CASH EQUIVALENTS | ||||||
Cash and Cash Equivalents at Beginning of Period | 784 | 783 | ||||
Cash and Cash Equivalents at End of Period | $ | 592 | $ | 784 | ||
5
CSX Corporation
NOTES TO CONSOLIDATED FINANCIAL STATEMENTS (Unaudited)
Income Statement, Balance Sheet and Cash Flow Statement
a) | Revision of Prior Period Financial Statements |
During the fourth quarter of 2013, CSX completed a review of certain accounts receivable balances which resulted in an adjustment to prior period revenue. This review identified differences between estimated and actual revenue earned on a small percentage of transactions over at least a decade. The Company evaluated the materiality of this error on prior period financial statements and determined that the effects of this change were not material to the financial condition, results of operations, or liquidity for any of the periods presented.
As a result, 2013 and 2012 previously reported quarters have been revised to correct the errors. For the first three quarters of 2013, revised revenue decreased $32 million. For the full year of 2013 the revenue reduction was ($26) million or ($0.02) per share. For the full year of 2012, revised revenue increased $7 million with no impact to earnings per share. This correction is presented in other revenue on the Volume and Revenue table included in this Quarterly Financial Report. The cumulative impact of this multi-year correction for periods prior to 2012 was $130 million, net of tax, and is included in shareholders' equity. Cash flow from operating activities was not impacted.
2013 and 2012 Impact of Revenue Adjustment | |||||||||||||||||||||||||||||||
(Dollars in millions, except per share amounts) | |||||||||||||||||||||||||||||||
(Unaudited) | (Unaudited) | ||||||||||||||||||||||||||||||
Quarters Ended | Year | Quarters Ended | Year | ||||||||||||||||||||||||||||
Quarterly and Annual Impact | Mar. 29, 2013 | Jun. 28, 2013 | Sep. 27, 2013 | Dec. 27, 2013 | 2013 | Mar. 30, 2012 | Jun. 29, 2012 | Sep. 28, 2012 | Dec. 28, 2012 | 2012 | |||||||||||||||||||||
Revenue | $ | 5 | $ | (23 | ) | $ | (14 | ) | $ | 6 | $ | (26 | ) | $ | 52 | $ | (26 | ) | $ | (30 | ) | $ | 11 | $ | 7 | ||||||
Net Earnings per Share, Assuming Dilution | $ | — | $ | (0.01 | ) | $ | (0.01 | ) | $ | — | $ | (0.02 | ) | $ | 0.03 | $ | (0.01 | ) | $ | (0.02 | ) | $ | 0.01 | $ | — | ||||||
(Unaudited) | |||||||||||||||||||
Quarter Ended December 28, 2012 | Year Ended December 28, 2012 | ||||||||||||||||||
Consolidated Income Statement | As Previously Reported | Adjustment | As Revised | As Previously Reported | Adjustment | As Revised | |||||||||||||
Revenue | $ | 2,884 | $ | 11 | $ | 2,895 | $ | 11,756 | $ | 7 | $ | 11,763 | |||||||
Operating Income | 804 | 11 | 815 | 3,457 | 7 | $ | 3,464 | ||||||||||||
Earnings Before Income Taxes | 718 | 11 | 729 | 2,964 | 7 | $ | 2,971 | ||||||||||||
Income Tax Expense | (275 | ) | (5 | ) | (280 | ) | (1,105 | ) | (3 | ) | $ | (1,108 | ) | ||||||
Net Earnings | 443 | 6 | 449 | 1,859 | 4 | 1,863 | |||||||||||||
Net Earnings per Share, Assuming Dilution | $ | 0.43 | $ | 0.01 | $ | 0.44 | $ | 1.79 | $ | — | $ | 1.79 | |||||||
6
CSX Corporation
NOTES TO CONSOLIDATED FINANCIAL STATEMENTS (Unaudited), continued
Income Statement
b) | Other Income - Net: In the fourth quarter of last year, income from real estate operations included a gain of $57 million recognized on the sale of a non-operating property. |
Quarters Ended | Years Ended | ||||||||||||||||||
(Dollars in millions) | Dec. 27, 2013 | Dec. 28, 2012 | $ Change | Dec. 27, 2013 | Dec. 28, 2012 | $ Change | |||||||||||||
Interest Income | $ | 2 | $ | 1 | $ | 1 | $ | 8 | $ | 5 | $ | 3 | |||||||
Income from Real Estate Operations | 7 | 64 | (57 | ) | 23 | 81 | (58 | ) | |||||||||||
Miscellaneous Expense | (9 | ) | (6 | ) | (3 | ) | (20 | ) | (13 | ) | (7 | ) | |||||||
Total Other Income - Net | $ | — | $ | 59 | $ | (59 | ) | $ | 11 | $ | 73 | $ | (62 | ) | |||||
Cash Flow Statement
c) | Share repurchases: There were 14 million shares repurchased for $353 million and 34 million shares repurchased for $734 million during 2013 and 2012, respectively. |
7
CSX Corporation
VOLUME AND REVENUE (Unaudited) | |||||||||||||||||||||||||||
Volume (Thousands of units); Revenue (Dollars in millions); Revenue Per Unit (Dollars) | |||||||||||||||||||||||||||
Quarters Ended December 27, 2013 and December 28, 2012 | |||||||||||||||||||||||||||
Volume | Revenue | Revenue Per Unit | |||||||||||||||||||||||||
2013 | 2012 | % Change | 2013 | 2012 | % Change | 2013 | 2012 | % Change | |||||||||||||||||||
Agricultural | (Adjusted)(a) | (Adjusted)(a) | |||||||||||||||||||||||||
Agricultural Products | 113 | 97 | 16 | % | $ | 301 | $ | 251 | 20 | % | $ | 2,664 | $ | 2,588 | 3 | % | |||||||||||
Phosphates and Fertilizers | 77 | 82 | (6 | ) | 124 | 133 | (7 | ) | 1,610 | 1,622 | (1 | ) | |||||||||||||||
Food and Consumer | 24 | 25 | (4 | ) | 68 | 71 | (4 | ) | 2,833 | 2,840 | — | ||||||||||||||||
Industrial | |||||||||||||||||||||||||||
Chemicals | 137 | 116 | 18 | 483 | 413 | 17 | 3,526 | 3,560 | (1 | ) | |||||||||||||||||
Automotive | 113 | 109 | 4 | 320 | 301 | 6 | 2,832 | 2,761 | 3 | ||||||||||||||||||
Metals | 63 | 60 | 5 | 156 | 146 | 7 | 2,476 | 2,433 | 2 | ||||||||||||||||||
Housing and Construction | |||||||||||||||||||||||||||
Forest Products | 74 | 69 | 7 | 192 | 175 | 10 | 2,595 | 2,536 | 2 | ||||||||||||||||||
Minerals(b) | 67 | 69 | (3 | ) | 107 | 104 | 3 | 1,597 | 1,507 | 6 | |||||||||||||||||
Waste and Equipment(b) | 39 | 35 | 11 | 68 | 67 | 1 | 1,744 | 1,914 | (9 | ) | |||||||||||||||||
Total Merchandise | 707 | 662 | 7 | 1,819 | 1,661 | 10 | 2,573 | 2,509 | 3 | ||||||||||||||||||
Coal | 289 | 305 | (5 | ) | 679 | 747 | (9 | ) | 2,349 | 2,449 | (4 | ) | |||||||||||||||
Intermodal | 666 | 600 | 11 | 437 | 398 | 10 | 656 | 663 | (1 | ) | |||||||||||||||||
Other (a) | — | — | — | 97 | 89 | 9 | — | — | — | ||||||||||||||||||
Total (a) | 1,662 | 1,567 | 6 | % | $ | 3,032 | $ | 2,895 | 5 | % | $ | 1,824 | $ | 1,847 | (1 | )% | |||||||||||
Years Ended December 27, 2013 and December 28, 2012 | |||||||||||||||||||||||||||
Volume | Revenue | Revenue Per Unit | |||||||||||||||||||||||||
2013 | 2012 | % Change | 2013 | 2012 | % Change | 2013 | 2012 | % Change | |||||||||||||||||||
Agricultural | (Adjusted)(a) | (Adjusted)(a) | |||||||||||||||||||||||||
Agricultural Products | 390 | 394 | (1 | )% | $ | 1,013 | $ | 1,007 | 1 | % | $ | 2,597 | $ | 2,556 | 2 | % | |||||||||||
Phosphates and Fertilizers | 327 | 321 | 2 | 527 | 512 | 3 | 1,612 | 1,595 | 1 | ||||||||||||||||||
Food and Consumer | 96 | 100 | (4 | ) | 269 | 273 | (1 | ) | 2,802 | 2,730 | 3 | ||||||||||||||||
Industrial | |||||||||||||||||||||||||||
Chemicals | 532 | 471 | 13 | 1,896 | 1,682 | 13 | 3,564 | 3,571 | — | ||||||||||||||||||
Automotive | 432 | 425 | 2 | 1,217 | 1,154 | 5 | 2,817 | 2,715 | 4 | ||||||||||||||||||
Metals | 262 | 263 | — | 644 | 635 | 1 | 2,458 | 2,414 | 2 | ||||||||||||||||||
Housing and Construction | |||||||||||||||||||||||||||
Forest Products | 298 | 286 | 4 | 775 | 722 | 7 | 2,601 | 2,524 | 3 | ||||||||||||||||||
Minerals(b) | 275 | 270 | 2 | 432 | 409 | 6 | 1,571 | 1,515 | 4 | ||||||||||||||||||
Waste and Equipment(b) | 150 | 138 | 9 | 264 | 262 | 1 | 1,760 | 1,899 | (7 | ) | |||||||||||||||||
Total Merchandise | 2,762 | 2,668 | 4 | 7,037 | 6,656 | 6 | 2,548 | 2,495 | 2 | ||||||||||||||||||
Coal | 1,195 | 1,290 | (7 | ) | 2,895 | 3,190 | (9 | ) | 2,423 | 2,473 | (2 | ) | |||||||||||||||
Intermodal | 2,582 | 2,451 | 5 | 1,697 | 1,594 | 6 | 657 | 650 | 1 | ||||||||||||||||||
Other (a) | — | — | — | 397 | 323 | 23 | — | — | — | ||||||||||||||||||
Total (a) | 6,539 | 6,409 | 2 | % | $ | 12,026 | $ | 11,763 | 2 | % | $ | 1,839 | $ | 1,835 | — | % | |||||||||||
(a) See notes to the consolidated financial statements of page 6 for full details.
(b) Prior periods have been reclassified to conform to current presentation.
8
CSX Corporation
Volume and Revenue
Volume increased 6% year-over-year as growth in merchandise and intermodal more than offset lower coal volume. Total revenue increased by 5% year-over-year driven by this volume growth and pricing gains across many markets, partially offset by mix of business.
Merchandise
Agricultural Sector
Agricultural Products - Volume growth was driven by increased shipments of grain and ethanol. Grain shipments increased due to a strong corn and soybean crop when compared to the prior year crop, which was negatively impacted by the prior year’s drought in the Midwest. Ethanol shipments increased due to lower input prices that incented producers to increase both production and exports.
Phosphates and Fertilizers - Volume declined due to lower fertilizer production as inventories remained high and demand softened resulting from the expectation of further price declines.
Food and Consumer - Volume declined due to lower shipments of potatoes and western apples. The decline in potatoes resulted from more normalized production levels compared to the above-average yields in the prior year, while the decline in apples resulted from a stronger Midwest crop that was moved by truck which displaced product previously moved by rail from the Pacific Northwest.
Industrial Sector
Chemicals - Volume growth was driven by an increase in energy-related shipments that included crude oil, liquefied petroleum gas (LPG) and frac sand. The rise in crude oil shipments was due to increased supply of low-cost crude from shale drilling activity, resulting in new shipments to east coast refineries.
Automotive - Finished vehicle shipments increased as North American light vehicle production grew year-over-year. This increase was partially offset by the continuing effect of earlier competitive losses in both automotive parts and finished vehicles.
Metals - Volume growth was driven by an increase in scrap metal and semi-finished steel products. Scrap increased as a result of higher domestic steel production, while semi-finished steel increased due to more shipments of slab (which is used as an input for products like sheet metal) that were temporarily sourced from another location due to a customer mill outage.
Housing and Construction Sector
Forest Products - Volume growth was led by an increase in building products and pulp board shipments, which is used to produce packaging materials. Building products increased due to the continued recovery of the residential housing market. Pulp board shipments grew as a result of inventory replenishments that resulted from production outages earlier in the year.
Minerals - Volume declined in aggregates (which include crushed stone, sand and gravel) due to the completion of several road construction projects during the quarter. This decline was partially offset by an increase in salt shipments due to modal conversions and new distribution terminals.
Waste and Equipment - Volume growth was led by waste shipments which were driven by an increase in shipments related to large scale remediation projects.
Coal
Coal volume declined due to a decrease in shipments of domestic coal as a result of a continued low natural gas prices and utility stockpiles, which remained above target levels. This decline was partially offset by an increase in export coal which was driven by increased shipments of U.S. metallurgical coal when compared to prior year.
Intermodal
Domestic volume growth was driven by continued success with highway-to-rail conversions, growth with existing customers, and service product enhancements. International volume increased due to strength with existing customers and the cycling of disruptions resulting from Hurricane Sandy last year.
9
CSX Corporation
EXPENSE
Expenses in the fourth quarter 2013 increased $139 million from the prior year's fourth quarter. Significant variances are described below.
Labor and Fringe expense increased $51 million due to the following:
• | Incentive compensation costs were $24 million higher reflecting higher expected award payouts. |
• | Inflation increased expenses $14 million. |
• | Volume-related and other costs were $13 million higher primarily related to increased crew starts and training expenses. |
Materials, Supplies and Other expense increased $93 million due to the following:
• | In the prior year, the Company recognized gains of $35 million related to real estate sales on operating rail corridors. |
• | Volume, materials and services costs increased $31 million primarily due to increased expenses related to higher volume and resource levels. |
• | Inflation increased expenses $11 million. |
• | Net casualty and other costs increased $16 million primarily due to favorable casualty adjustments that did not repeat in the current period. |
Fuel expense decreased $13 million as lower price and improved efficiency was partially offset by volume-related costs (See Fuel Statistics table below).
Depreciation expense increased $10 million due to a larger asset base.
FUEL STATISTICS | ||||||||||||||||||||
Quarters Ended | Years Ended | |||||||||||||||||||
(Dollars and Gallons In Millions, Except Price per Gallon) | Dec. 27, 2013 | Dec. 28, 2012 | Change | Dec. 27, 2013 | Dec. 28, 2012 | Change | ||||||||||||||
Estimated Locomotive Fuel Consumption (Gallons) | 122.6 | 118.3 | (4.3 | ) | 481.9 | 484.4 | 2.5 | |||||||||||||
Price per Gallon(a) (Dollars) | $ | 3.10 | $ | 3.33 | $ | 0.23 | $ | 3.17 | $ | 3.22 | $ | 0.05 | ||||||||
Total Locomotive Fuel Expense(a) | $ | 380 | $ | 394 | $ | 14 | $ | 1,529 | $ | 1,562 | $ | 33 | ||||||||
Other(a) | 28 | 27 | (1 | ) | 127 | 110 | (17 | ) | ||||||||||||
Total Fuel Expense | $ | 408 | $ | 421 | $ | 13 | $ | 1,656 | $ | 1,672 | $ | 16 | ||||||||
(a) Prior periods have been reclassified to conform to current presentation.
EMPLOYEE COUNTS (Estimated) | ||||||||
2013 | 2012 | Change | ||||||
October | 31,454 | 32,041 | (587 | ) | ||||
November | 31,491 | 31,561 | (70 | ) | ||||
December | 31,412 | 30,787 | 625 | |||||
Average | 31,452 | 31,463 | (11 | ) | ||||
10
CSX Corporation
OPERATING STATISTICS (Estimated)
Quarters Ended | Years Ended | |||||||||||||
Dec. 27, 2013 | Dec. 28, 2012 | Improvement (Decline) % | Dec. 27, 2013 | Dec. 28, 2012 | Improvement (Decline) % | |||||||||
Coal (Millions of Tons) | ||||||||||||||
Domestic | ||||||||||||||
Utility | 15.6 | 18.0 | (13 | )% | 66.1 | 71.1 | (7 | )% | ||||||
Coke, Iron Ore and Other | 6.7 | 6.6 | 2 | 24.1 | 25.6 | (6 | ) | |||||||
Total Domestic | 22.3 | 24.6 | (9 | ) | 90.2 | 96.7 | (7 | ) | ||||||
Export | ||||||||||||||
Metallurgical | 5.7 | 5.2 | 10 | 24.9 | 23.8 | 5 | ||||||||
Thermal | 4.5 | 4.4 | 2 | 19.1 | 24.0 | (20 | ) | |||||||
Total Export | 10.2 | 9.6 | 6 | 44.0 | 47.8 | (8 | ) | |||||||
Total Coal | 32.5 | 34.2 | (5 | )% | 134.2 | 144.5 | (7 | )% | ||||||
Revenue Ton-Miles (Billions) | ||||||||||||||
Merchandise | 36.5 | 32.4 | 13 | % | 137.1 | 131.2 | 4 | % | ||||||
Coal | 15.0 | 15.9 | (6 | ) | 64.5 | 67.2 | (4 | ) | ||||||
Intermodal | 6.5 | 5.8 | 12 | 25.1 | 23.6 | 6 | ||||||||
Total | 58.0 | 54.1 | 7 | % | 226.7 | 222.0 | 2 | % | ||||||
Gross Ton-Miles (Billions) | ||||||||||||||
Total Gross Ton-Miles | 107.1 | 100.6 | 6 | % | 417.5 | 408.9 | 2 | % | ||||||
(Excludes locomotive gross ton-miles) | ||||||||||||||
Safety and Service Measurements | ||||||||||||||
FRA Personal Injury Frequency Index | 0.89 | 0.57 | (56 | )% | 0.86 | 0.70 | (23 | )% | ||||||
(Number of FRA-reportable injuries per 200,000 man-hours) | ||||||||||||||
FRA Train Accident Rate | 1.85 | 1.87 | 1 | % | 1.83 | 2.08 | 12 | % | ||||||
(Number of FRA-reportable train accidents per million train miles) | ||||||||||||||
On-Time Train Originations | 85 | % | 90 | % | (6 | )% | 89 | % | 89 | % | — | % | ||
On-Time Destination Arrivals | 76 | % | 84 | % | (10 | )% | 81 | % | 80 | % | 1 | % | ||
Train Velocity (Miles per hour) | 22.9 | 23.3 | (2 | )% | 23.2 | 22.7 | 2 | % | ||||||
Dwell (Hours) | 23.0 | 24.3 | 5 | % | 22.2 | 23.7 | 6 | % | ||||||
Cars-On-Line | 181,927 | 186,687 | 3 | % | 182,266 | 189,994 | 4 | % | ||||||
Resources | Increase(Decrease) % | |||||||||||||
Route Miles | 20,814 | 20,828 | — | % | ||||||||||
Locomotives (Owned and long-term leased) | 4,259 | 4,178 | 2 | % | ||||||||||
Freight Cars (Owned and long-term leased) | 68,008 | 69,126 | (2 | )% | ||||||||||
11
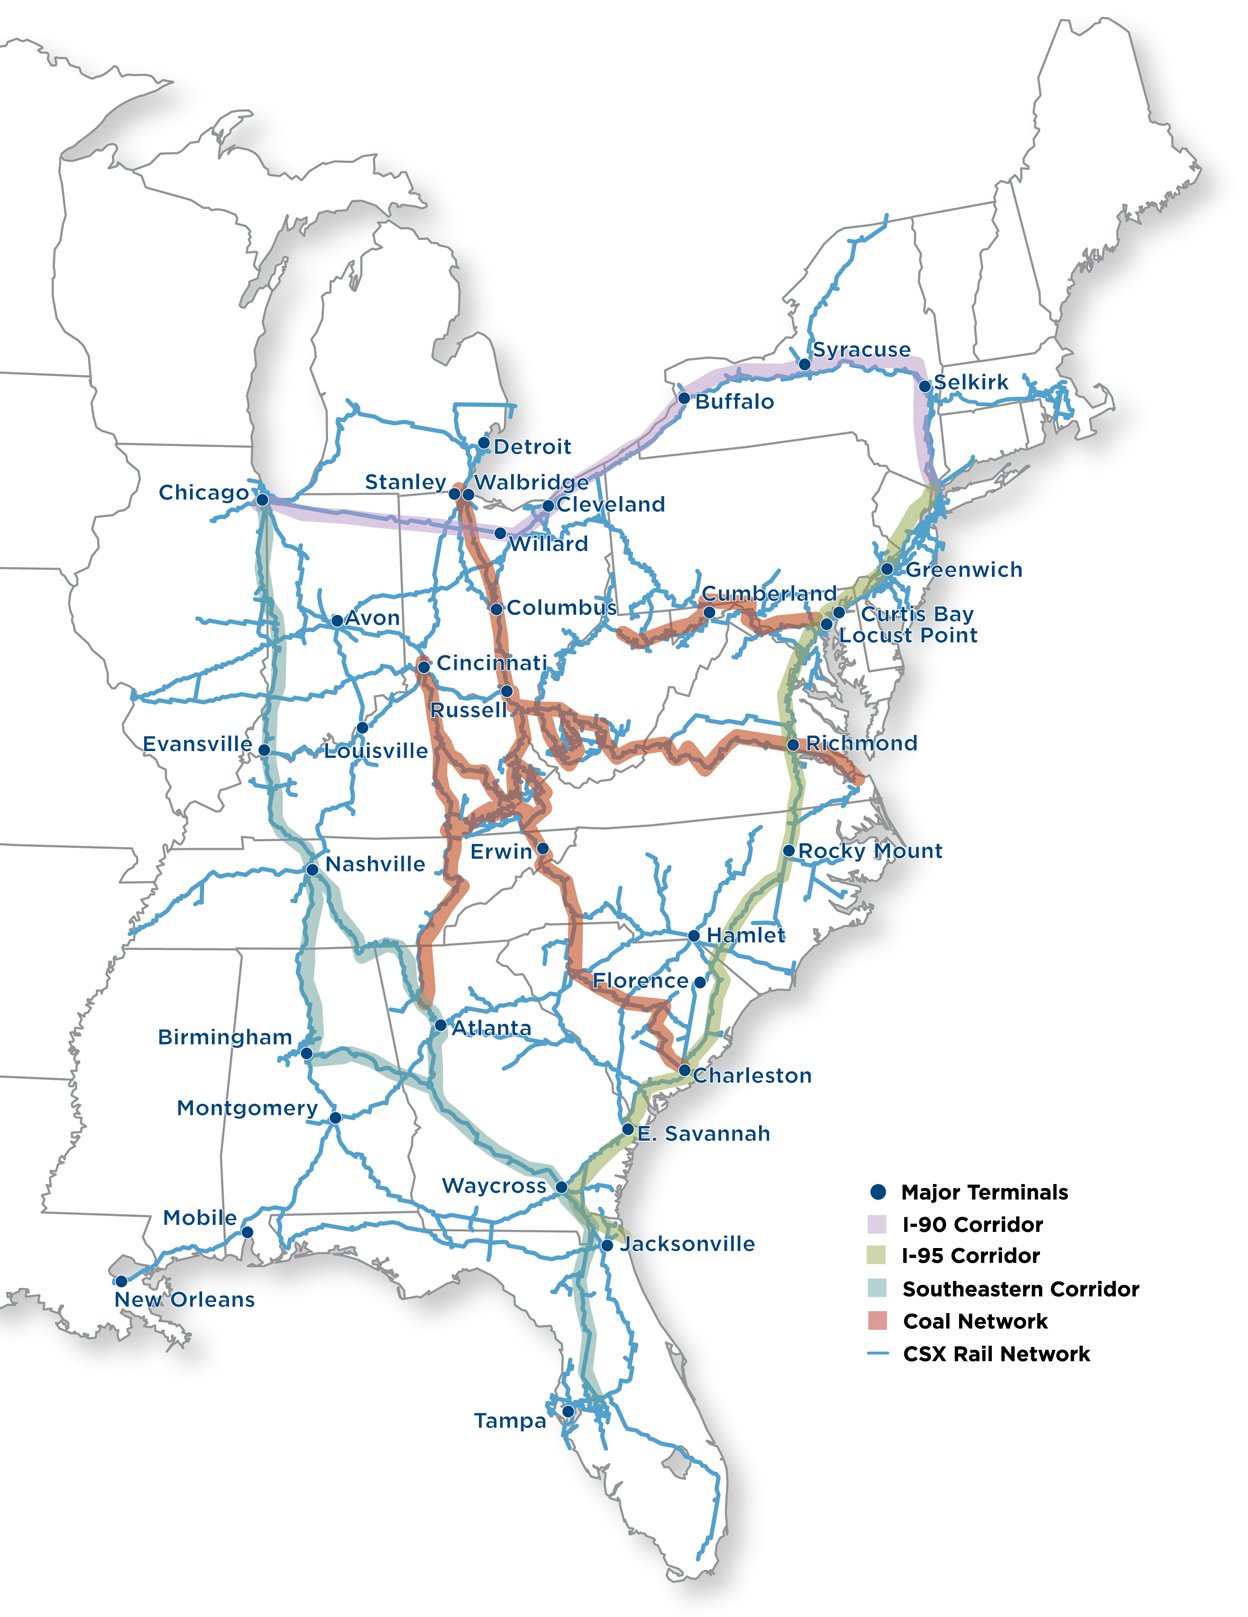
CSX Rail Network
12