Attached files
| file | filename |
|---|---|
| 8-K - 8-K - NOVANTA INC | d658580d8k.htm |
 Investor Presentation
January 15-16, 2014
January 15-16, 2014
Exhibit 99.1 |
 Factors affecting future performance…
…and use of Non-GAAP financial measures
…and use of Non-GAAP financial measures
2
Forward-Looking Statements
Non-GAAP Measures
The statements in this presentation that relate to guidance, pro forma presentations, future plans,
goals, business opportunities, events or performance are forward-looking statements that
involve risks and uncertainties, including risks associated with business and economic conditions,
failure to achieve expected benefits of the NDS acquisition, failure to comply with Food and Drug
Administration regulations, customer and/or supplier contract cancellations, manufacturing risks,
competitive factors, ability to successfully introduce new products, uncertainties pertaining to
customer orders, demand for products and services, growth and development of markets for the
Company's products and services, and other risks identified in our filings made with the
Securities and Exchange Commission. Actual results, events and performance may differ
materially. Readers are cautioned not to place undue reliance on these forward-looking
statements, which speak only as of the date of this presentation. The Company disclaims any
obligation to update these forward-looking statements as a result of developments occurring
after the date of this presentation. Readers are encouraged to refer to the risk disclosures
described in the Company’s Form 10-K for the year ended December 31, 2012 and subsequent
filings with the SEC, as applicable. Please see “Safe Harbor and Forward-Looking
Information” in the Appendix to this presentation for more information.
In this presentation, we present the non-GAAP financial measures of Adjusted EBITDA , free cash flow
and net debt. Please see “Use of Non-GAAP Financial Measures” and the subsequent
slides in the Appendix to this presentation for the reasons we use these measures, a
reconciliation of these measures to the most directly comparable GAAP measures and other
information relating to these measures.
The Company neither updates nor confirms any guidance regarding the future operating results of the
Company which may have been given prior to this presentation.
|
 •
•
Leading provider
Leading provider
of precision
of precision
laser, medical
laser, medical
and motion control technology
and motion control technology
•
•
Canadian Company
Canadian Company
founded in 1968, with U.S. Headquarters in Massachusetts
founded in 1968, with U.S. Headquarters in Massachusetts
•
•
$340M+ in annual
$340M+ in annual
revenue
and ~$50M in annual Adjusted EBITDA*
and ~$50M in annual Adjusted EBITDA*
•
Approximately
1,300
employees for continuing operations
employees for continuing operations
•
•
Trade on NASDAQ
Trade on NASDAQ
(GSIG)
(GSIG)
We are a leading supplier…
…of medical and laser technologies
Operational Excellence
Increased Medical Presence
Leading Technology Franchises
Global Presence and Reach
Highly Capable Team
3
* Reflects prior full year guidance. The company is neither updating, nor
confirming its prior guidance, but is simply using its prior guidance for comparison and illustrative purposes |
 Our
aspirations… …are clear and achievable
Strategic Vision
Strategic Vision
A leading provider of precision photonic and
motion technologies for OEM’s in demanding
markets –
delivering attractive shareholder
returns through sustained profitable growth
4
•
Accelerate growth (organic and M&A)
•
Improve mix (growth, volatility) –
more
Medical, less Semiconductor
•
Strive to become a world class
operating company
Strategic Priorities
•
Organic growth mid to high
single digits
•
>20% Adj. EBITDA margins
•
Long term shareholder returns
above peer average
Performance Goals |
 Medical end market sales are 35% of our portfolio…
…with Microelectronics down to 15%
…with Microelectronics down to 15%
Laser
Laser
Products
Products
Medical
Technologies
Scientific
Medical
Micro-
electronics
GSI Profile
Industrial
Precision
Motion
Product Groups
End Market Mix
5
* Data presented represents last nine months, ending 3Q 2013
|
 GSI
GSI
has a strong global presence…
…with significant reach into the Pacific Rim
•
Strong international presence -
68% of revenue from outside U.S.
•
Nine Production sites in the U.S., U.K. and China
Sales Breakdown
Sales Breakdown
Japan
Europe
Other
U.S.
Asia
Suzhou, PRC
Suzhou, PRC
Sri Lanka
Sri Lanka
Munich, Germany
Munich, Germany
Global Presence
Global Presence
* Reflects data presented in GSI Group Inc. 2012 10K
Zevenhuizen, Netherlands
Zevenhuizen, Netherlands
6
Mukilteo, WA
Mukilteo, WA
Santa Clara, CA
Santa Clara, CA
San Jose, CA
San Jose, CA
Chatsworth, CA
Chatsworth, CA
Bedford, MA
Bedford, MA
Rugby, UK
Rugby, UK
Poole, UK
Poole, UK
Taunton, UK
Taunton, UK
Tokyo, Japan
Tokyo, Japan
Production Site
Production Site
Sales/Support
Sales/Support
10%
30%
3%
25%
32% |
 We
have built momentum… …to enable increased success in 2014
2013 Key Accomplishments
2013 Key Accomplishments
•
•
Successful integration of NDS acquisition
Successful integration of NDS acquisition
•
•
Completion of Semiconductor Systems divestiture
Completion of Semiconductor Systems divestiture
•
•
Balance
Balance
sheet
sheet
strength
strength
–
–
net
net
debt
debt
forecast
forecast
~$15M
~$15M
*
*
•
•
Significant leadership upgrades across businesses
Significant leadership upgrades across businesses
•
•
Strong progress on M&A pipeline
Strong progress on M&A pipeline
•
•
Return to organic growth in 2H’13
Return to organic growth in 2H’13
-
-
Growth platforms gain momentum
Growth platforms gain momentum
-
-
Some end market recovery
Some end market recovery
•
•
Increased focus on operational excellence
Increased focus on operational excellence
7
* Reflects prior full year guidance. The company is neither updating, nor
confirming its prior guidance, but is simply using its prior guidance for comparison and illustrative purposes |
 Our
team was resilient… …in successfully working through several
challenges 2013 Challenges
2013 Challenges
•
Experienced extremely weak conditions in Scientific market
•
We scaled-back our Fiber Laser investments
•
Continue to see a sluggish and sometimes unpredictable
Industrial (Manufacturing) sector in China
•
Experienced an initial setback in NDA, related to a dual
sourcing at an OEM
•
Seeing some temporary weakness in medical CapEx spending
in the U.S., largely driven by the Affordable Care Act
8 |
 Revenue
Growth
Growth
Potential
Potential
Adj. EBITDA**
Adj. EBITDA**
Value Chain
Value Chain
Focus
Focus
Structure
Structure
Mix
Mix
Growth
Growth
Strategy
Strategy
Performance
Performance
Focus
Focus
~$480M*
~$480M*
Low single digit
Low single digit
~$70M
~$70M
33% systems
33% systems
67% components
67% components
<20 distinct P&L’s
>30 sites
>30 sites
>50% Semi
>50% Semi
<10% Medical
<10% Medical
Unrelated
Unrelated
acquisitions
acquisitions
Maximize margins
Maximize margins
Pre 2008
Pre 2008
+$340M
+$340M
Mid to high single digit
Mid to high single digit
~$50M
~$50M
~95%
~95%
components
components
3 focused groups
3 focused groups
<15 sites
<15 sites
~15% Semi
~15% Semi
~35% Medical
~35% Medical
Build growth platforms
Build growth platforms
Bolt-on M&A
Profit growth
Profit growth
Current
Current
$500M+
$500M+
High single digit
High single digit
$100M+
$100M+
~100%
~100%
components
components
3 focused groups
3 focused groups
<10 sites
<10 sites
<10% Semi
<10% Semi
~50% Medical
~50% Medical
Current approach
Current approach
plus selective
plus selective
transformative M&A
transformative M&A
Sustained profitable
Sustained profitable
revenue growth
revenue growth
Vision
Vision
The GSI transformation…
The GSI transformation…
…is making strong progress
…is making strong progress
* pro forma Excel Technologies + GSI Group Inc results as reported in GSI Group Inc.
8K filed on 07/18/08 ** adjusted EBITDA, non-GAAP financial metric
9
*** Current Reflects prior full year guidance. The company is neither
updating, nor confirming its prior guidance, but is simply using its prior guidance for
comparison and illustrative purposes |
 Our
Medical market presence is gaining scale… …and offers significant
growth potential GSI Medical Business
GSI Medical Business
•
~$120M of revenue in enabling technologies for medical systems
•
8 distinct medical technologies sold to over a dozen applications
•
Significant share position with leading OEM’s
•
FDA Certification in San Jose, CA
•
ISO 13485 Certification in Bedford, MA
•
Global sales channel selling to medical OEM’s
Applications
Minimally Invasive Surgery
OCT for Retinal Scanning
Robotic Surgery
Laser Surgery
Digital Radiology
Patient Monitoring
OR Networking
Defibrillation
EKG
Pacemaker Programming
DNA Sequencing
Flow Cytometry
Strategy
Strategy
Overview
Overview
•
Drive further penetration of customers through key account
sales initiative (i.e. “cross sell”
GSI products)
•
Increase design-wins on next generation customer products
•
Move into adjacent applications via M&A to leverage existing
customer channels and quality systems
10 |
 Our
Laser Scanning growth platform… …delivers profitable growth
Laser Scanning Growth
Laser Scanning Growth
•
•
#1 Position in Scanning Galvanometers
#1 Position in Scanning Galvanometers
•
•
$200M+ addressable market
$200M+ addressable market
•
•
Strong growth in 2013:
Strong growth in 2013:
-
-
+8% overall increase
+8% overall increase
-
-
+50% increase in scanning solutions
+50% increase in scanning solutions
•
•
Fastest & highest resolution products available
Fastest & highest resolution products available
•
•
One third of scanning revenue is in medical
One third of scanning revenue is in medical
applications
applications
Strategy
Strategy
GSI Position
GSI Position
•
•
Capture meaningful share of Scan Head
Capture meaningful share of Scan Head
market leveraging galvanometer position
market leveraging galvanometer position
-
-
Doubling addressable market
Doubling addressable market
-
-
~$25M revenue opportunity by 2015
~$25M revenue opportunity by 2015
•
•
Focus on new, emerging applications
Focus on new, emerging applications
•
•
Incorporate most advanced component
Incorporate most advanced component
technology into Scan Head designs
technology into Scan Head designs
~$100M
~$100M
Market
Market
~$200M
~$200M
Market
Market
11 |
 We
are just beginning our journey… …toward Operational Excellence
Broader Opportunity
Broader Opportunity
Project Impact
Project Impact
•
New managers from strong operating cultures:
Danaher, Crane, Ingersoll-Rand, IDEX, GE, Boeing
•
~$150M direct material spend unleveraged today
•
Inventory turns only 3 times per year
•
Customer Satisfaction improvements (quality, OTD)
can drive meaningful share capture
12
Units/Shift
40 to 57
(43%)
Processing Time (min.)
56 to 30
(46%)
Throughput LT (min.)
480 to 30
(94%)
Travel Distance (ft.)
226 to 25
(89%)
Floor Space (sq. ft.)
440 to 306
(30%)
Overtime Reduction
$132K/yr.
•
Lean Cell
•
One-piece flow
•
Raw Materials kept in cell
•
Minimal travel distance
•
Immediate operator
feedback |
 We
have clear focus… …for success in 2014
Key Priorities for 2014
•
Organic Growth: ~$5M of growth investment in key platforms
–
driven by confidence in long-term prospects
•
Acquisitions: Targeting +2 acquisitions in 2014, focused on
medical market adjacencies and extending core technologies
(scanning, precision motion)
•
Productivity: Driving $5M+ savings in 2014, funding internal
investments, mitigating risks, & potential upside results
13 |
 Our
conservative view of 2014… assumes no improvement in
capital equipment markets $271M
Revenue Outlook
+25%*
Low Single
Digit Growth
14
*Includes acquisition of NDS Surgical Imaging on January 15, 2013. Reflects prior
full year guidance. The company is neither updating, nor confirming its prior guidance, but is simply using its prior guidance for comparison and illustrative purposes
2012
2013
2014 Outlook |
 2014
is seeing significant improvements in productivity… $42M
~$50M
8%-10%
15
2012
2014 Outlook
2013
…which funds ~$5M of growth investment & delivers +8% profit growth
Adjusted EBITDA Outlook
*Adjusted EBITDA is a non-GAAP measure. The reconciliation to our most comparable GAAP
numbers is provided in the appendix. ** 2013 Reflects prior full year guidance. The
company is neither updating, nor confirming its prior guidance, but is simply using its prior guidance for comparison and illustrative purposes
|
 Significant cash generation…
…provides capital for our growth strategy
$24M
Free Cash Flow Outlook
Free Cash Flow Outlook
$25M-$30M
*
+$35M
Net Debt
Net Debt
($16M)
($16M)
~$15M
~$15M
~($20M)
~($20M)
16
*EXCLUDES ~$12.5M cash refund related to U.S. IRS audit for the GSI Group’s
2000 through 2008 tax years. 2012
2013
2014 Outlook
*Free Cash Flow and Net Debt are non-GAAP measures. The reconciliation to our most
comparable GAAP numbers is provided in the appendix. Net Debt reflects prior full year guidance. The company is neither updating, nor confirming its prior guidance, but is simply using its prior
guidance for comparison and illustrative purposes
|
 Appendix
17 |
 Medical
GSI’s Laser Products Group…
…is focused on industrial & medical end-markets
Laser Products Overview
Revenue*
$143M
Industrial
Scientific
Brands
Range
Location
Primary
Applications
Sealed CO
10W to 400W
Mukilteo, WA
Marking, Engraving,
Date Coding of
non-metals
Fiber Lasers
50W to 2kW
Rugby, UK
Metal cutting,
welding, drilling
Specialty
High Speed/Power
Santa Clara, CA
Scientific Research
Specialty Industrial
Electronics
* Last nine months, ending 3Q 2013
Galvanometers
Scan Heads
Bedford, MA
Material
Processing
Marking
Ophthalmology
PCB Drilling
Scanners
18 |
 GSI’s Medical Technologies…
…focused around medical peripherals & imaging technologies
Medical Technologies Overview
Brand
Technology
Location
Primary
Applications
Displays, Informatics,
Networking
San Jose, CA
Surgical OR’s
Radiology
Diagnostics; i.e.
Endoscopy
Thermal Printers
Bedford, MA
Patient Monitoring
Defibrillators
EKG
Revenue*
$65M
Industrial
Scientific
Electronics
Medical
Imaging
Recorders
* Last nine months, ending 3Q 2013
Photometers and
Spectroradiometers
Chatsworth, CA
Display Test
Color Measurement
19 |
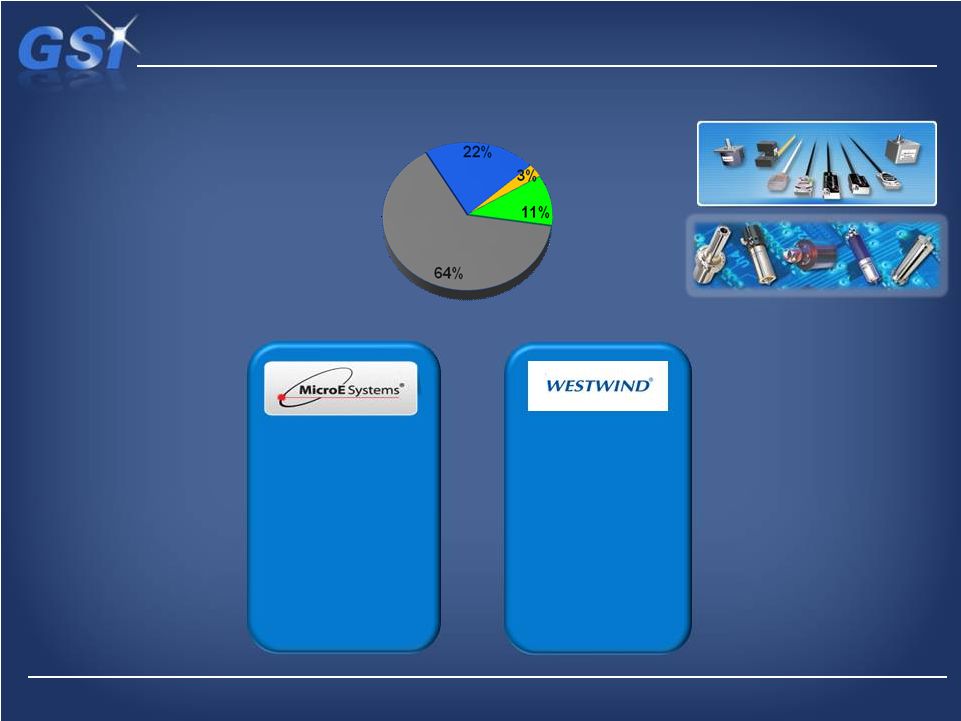 GSI’s Precision Motion Technologies…
…making significant shift to Indrustial and Medical end-markets
Precision Motion Overview
Brand
Technology
Location
Primary
Applications
Air Bearing Spindles
Precision Machining
Poole, UK
Suzhou, China
PCB Drilling
Semiconductor
Energy (Turbines)
Revenue*
$46M
Industrial
Scientific
Electronics
Medical
Spindles
* Last nine months, ending 3Q 2013
Optical Encoders
Positioning Systems
Bedford, MA
Robotic Surgery
DNA Sequencing
Wire Bonding
Disk Drives
Encoders
20 |
 The non-GAAP financial measures used in this presentation are non-GAAP are
Adjusted EBITDA, free cash flow, and net debt. The Company believes that the
non-GAAP financial measures provide useful and supplementary information to investors regarding the Company’s financial
performance. It is management’s belief that these non-GAAP financial
measures would be particularly useful to investors because of the significant changes that
have occurred outside of the Company’s day-to-day business in
accordance with the execution of the Company’s strategy. This strategy includes streamlining the
Company’s existing operations through site and functional consolidations,
strategic divestitures, expanding the Company’s business through significant internal
investments, and broadening the Company’s product and service offerings
through acquisition of innovative and complementary technologies and solutions. The
financial impact of certain elements of these activities, particularly
acquisitions, divestitures, and site and functional restructurings, are often large relative to the
Company’s overall financial performance, which can adversely affect the
comparability of its operating results and investors’ ability to
analyze the business from period to period.
The Company’s Adjusted EBITDA, a non-GAAP financial measure, is used by
management to evaluate operating performance, communicate financial results to the
Board of Directors, benchmark results against historical performance and the
performance of peers, and evaluate investment opportunities including acquisitions
and divestitures. In addition, Adjusted EBITDA is used to determine bonus payments
for senior management and employees. Accordingly, the Company believes
that this non-GAAP measure provides greater transparency and insight into
management’s method of analysis. Non-GAAP financial measures should
not be considered as substitutes for, or superior to, measures of financial performance prepared in accordance with GAAP.
They are limited in value because they exclude charges that have
a material effect on the Company’s reported results and, therefore, should
not be relied upon as the sole financial measures to evaluate the
Company’s financial results. The non-GAAP financial measures are meant to supplement, and to be viewed in
conjunction with, GAAP financial measures. Investors are encouraged to review the
reconciliation of these non-GAAP financial measures to their most directly
comparable GAAP financial measures as provided in the tables accompanying this
presentation. 21
Use of Non-GAAP Financial Measures |
 Non-GAAP Free Cash Flow*
& Net Debt
(a)
Free cash flow, a non-GAAP measure, is defined as cash provided by
operating activities less capital expenditures. (b)
Net debt, a non-GAAP measure, is defined as total debt less cash and cash
equivalents. Nine Months Ended
Twelve Months Ended
September 27, 2013
September 27, 2013
December 31, 2012
December 31, 2012
Cash provided by operating activities
Cash provided by operating activities
$34,448
$34,448
$28,430
$28,430
Less: Capital expenditures
Less: Capital expenditures
3,073
3,073
4,308
4,308
Free Cash Flow (a)
Free Cash Flow (a)
$31,375
$31,375
$24,122
$24,122
Debt
Debt
($78,375)
($78,375)
($50,000)
($50,000)
Less: Cash and cash equivalents
Less: Cash and cash equivalents
53,690
53,690
65,788
65,788
Net Debt (b)
Net Debt (b)
$24,665
$24,665
$15,788
$15,788
* Free Cash Flow includes the cash flows of Continuing and Discontinued
Operations 22 |
 Non-GAAP Adjusted EBITDA Reconciliation
Twelve Months Ended
Last Twelve Months
December 31, 2012
December 31, 2011
September 27, 2013
(in thousands of dollars)
Income from operations (GAAP)
$ 15,007
$ 35,848
$ 14,311
Depreciation and amortization
13,196
14,467
18,458
Share-based compensation
4,580
3,276
5,313
Restructuring and other costs
8,842
2,406
7,338
Acquisition fair value adjustments
_
_
903
Net income attributable to noncontrolling interest
(40)
(28)
(37)
Adjusted EBITDA (Non-GAAP)
$ 41,585
$ 55,969
$ 46,286
23 |
 24
Safe Harbor and Forward-Looking Information
Certain statements in this presentation are “forward-looking statements” within the
meaning of the Private Securities Litigation Reform Act of 1995 and are based on current
expectations and assumptions that are subject to risks and uncertainties. All statements contained in this presentation that do not relate to matters of
historical fact should be considered forward-looking statements, and are generally identified by
words such as “expect,” “intend,” “anticipate,” “estimate,” “believe,”
“future,” “could,” “should,” “plan,” “aim,” and
other similar expressions. These forward-looking statements include, but are not limited to, expectations regarding
anticipated financial performance; management’s goals, plans, strategies and business
opportunities; expectations regarding returns to shareholders; anticipated sales of fiber laser
and scanning solutions products; plans regarding the development and deployment of a lower cost fiber laser products; expected liquidity and
capitalization; drivers of revenue growth; expectations regarding future potential acquisitions and
investments; expenditures and product development; business prospects; expectations regarding
recent and potential future products; anticipated sales performance; industry trends; market conditions; anticipated benefits from
acquisitions; and other statements that are not historical facts.
These forward-looking statements are neither promises nor guarantees, but involve risks and
uncertainties that may cause actual results to differ materially from those contained in the
forward-looking statements. Our actual results could differ materially from those anticipated in these forward-looking statements for many
reasons, including, but not limited to, the following: loss of customers, reductions in orders by
customers, and customer order cancellations; economic and political conditions and the effects
of these conditions on our customers’ businesses and level of business activities; our significant dependence upon our customers’
capital expenditures, which are subject to cyclical market fluctuations; our dependence upon our
ability to respond to fluctuations in product demand; our ability to continually innovate and
successfully commercialize our innovations; delays in our delivery of new products; our reliance upon third party distribution channels
subject to credit, business concentration and business failure risks beyond our control; fluctuations
in our quarterly results, and our failure to meet or exceed our expected financial performance;
customer order timing and other similar factors beyond our control; our dependence on one customer in our medical components
business; disruptions or breaches in security of our information technology systems; changes in
interest rates, credit ratings or foreign currency exchange rates; risk associated with our
operations in foreign countries; disruptions to our manufacturing operations as a result of natural disasters; our increased use of
outsourcing in foreign countries; our failure to comply with local import and export regulations in
the jurisdictions in which we operate; our history of operating losses and our ability to
sustain our profitability; our exposure to the credit risk of some of our customers and in weakened markets; violations of our intellectual
property rights and our ability to protect our intellectual property against infringement by third
parties; risk of losing our competitive advantage; our ability to make divestitures that
provide business benefits; our failure to successfully integrate recent and future acquisitions into our business; our ability to attract and retain key
personnel; our restructuring and realignment activities and disruptions to our operations as a result
of consolidation of our operations; product defects or problems integrating our products with
other vendors’ products; disruptions in the supply of or defects in raw materials, certain key components or other goods from our
suppliers; production difficulties and product delivery delays or disruptions; our failure to comply
with various federal, state and foreign regulations; changes in governmental regulation of our
business or products; our failure to implement new information technology systems and software successfully; our failure to realize
the full value of our intangible assets; our ability to utilize our net operating loss carryforwards
and other tax attributes; fluctuations in our effective tax rates; being subject to U.S.
federal income taxation even though we are a non-U.S. corporation; any need for additional capital to adequately respond to business challenges
or opportunities and repay or refinance our existing indebtedness, which may not be available on
acceptable terms or at all; volatility in the market price for our common shares; our
dependence on significant cash flow to service our indebtedness and fund our operations; our ability to access cash and other assets of our
subsidiaries; the influence of certain significant shareholders over our business; provisions of our
articles of incorporation may delay or prevent a change in control our significant existing
indebtedness may limit our ability to engage in certain activities; and our failure to maintain appropriate internal controls in the future.
Other important risk factors that could affect the outcome of the events set forth in these statements
and that could affect the Company’s operating results and financial condition are
discussed in Item 1A of our Annual Report on Form 10-K for the fiscal year ended December 31, 2012, our subsequent filings with the
Securities and Exchange Commission (“SEC”), and in our future filings with the SEC. Such
statements are based on the Company’s management’s beliefs and assumptions and on
information currently available to the Company’s management. The Company disclaims any obligation to update any forward-looking
statements as a result of developments occurring after the date of this document except as required by
law. |