Attached files
Table of Contents
UNITED STATES
SECURITIES AND EXCHANGE COMMISSION
Washington, D.C. 20549
FORM 10-K
| x | ANNUAL REPORT PURSUANT TO SECTION 13 OR 15(d) OF THE SECURITIES EXCHANGE ACT OF 1934 |
For the fiscal year ended December 31, 2008
OR
| ¨ | TRANSITION REPORT PURSUANT TO SECTION 13 OR 15(d) OF THE SECURITIES EXCHANGE ACT OF 1934 |
Commission File No. 000-25705
GSI Group Inc.
(Exact name of registrant as specified in its charter)
| New Brunswick, Canada | 98-0110412 | |
| (State or other jurisdiction of incorporation or organization) |
(I.R.S. Employer Identification No.) | |
| 125 Middlesex Turnpike | ||
| Bedford, Massachusetts, USA | 01730 | |
| (Address of principal executive offices) | (Zip Code) | |
(781) 266-5700
(Registrant’s telephone number, including area code)
Securities Registered Pursuant to Section 12(b) of the Act:
| Title of Class |
Name of Exchange on which Registered | |
| Common Shares, no par value | NASDAQ |
Securities Registered Pursuant to Section 12(g) of the Act:
None
Indicate by check mark if the registrant is a well-known seasoned issuer, as defined in Rule 405 of the Securities Act. Yes ¨ No x
Indicate by check mark if the registrant is not required to file reports pursuant to Section 13 or 15(d) of the Act. Yes ¨ No x
Indicate by check mark whether the registrant (1) has filed all reports required to be filed by Section 13 or 15(d) of the Securities Exchange Act of 1934 during the preceding 12 months (or such shorter period that the registrant was required to file such reports), and (2) has been subject to such filing requirements for the past 90 days. Yes ¨ No x
Indicate by check mark if disclosure of delinquent filers pursuant to Item 405 of Regulation S-K is not contained herein, and will not be contained, to the best of registrant’s knowledge, in definitive proxy or information statements incorporated by reference in Part III of this Form 10-K or any amendment to this Form 10-K. ¨
Indicate by check mark whether the registrant has submitted electronically and posted on its corporate Website, if any, every Interactive Data File required to be submitted and posted pursuant to Rule 405 of Regulation S-T (Section 232.405 of this chapter) during the preceding 12 months (or for such shorter period that the registrant was required to submit and post such files). Yes ¨ No ¨
Indicate by check mark whether the registrant is a large accelerated filer, an accelerated filer, or a non-accelerated filer. See definition of “accelerated filer and large accelerated filer” in Rule 12b-2 of the Exchange Act. (Check one):
| Large accelerated filer | ¨ | Accelerated filer | x | |||
| Non-accelerated filer | ¨ | Smaller reporting company | ¨ | |||
Indicate by check mark whether the registrant is a shell company (as defined in Rule 12b-2 of the Act). Yes ¨ No x
The aggregate market value of the Registrant’s outstanding common shares held by non-affiliates of the Registrant, based on the closing price of the common shares on The NASDAQ Stock Market on the last business day of the Registrant’s most recently completed second fiscal quarter (June 27, 2008) was approximately $150,504,163. For purposes of this disclosure, common shares held by officers and directors of the Registrant and by persons who hold more than 5% of the Registrant’s outstanding common shares have been excluded because such persons may be deemed to be affiliates. This determination of affiliate status is not necessarily conclusive.
There were approximately 47,901,978 of the Registrant’s common shares, no par value, issued and outstanding on March 23, 2010.
DOCUMENTS INCORPORATED BY REFERENCE.
None.
Table of Contents
FORM 10-K
YEAR ENDED DECEMBER 31, 2008
TABLE OF CONTENTS
As used in this report, the terms “we,” “us,” “our,” “GSI Group”, “GSI”, “GSIG” and the “Company” mean GSI Group Inc. and its subsidiaries, unless the context indicates another meaning.
Unless otherwise noted, all dollar amounts in this report are expressed in United States dollars.
The following trademarks and trade names of GSI Group are used in this report: WaferMark™, WaferRepair™, WaferTrim™, CircuitTrim™, SVS™, MicroE® and Westwind.
Table of Contents
In August 2008, GSI Group Inc. (the “Company”) closed its acquisition of Excel Technology, Inc. (“Excel”). Delays in the integration of the financial accounting systems of the Company and Excel following the acquisition initially led to a delay of several weeks in the preparation of the Company’s Quarterly Report on Form 10-Q for the quarterly period ended September 26, 2008 (the “2008 Q3 Report”). Shortly thereafter and prior to filing the 2008 Q3 Report, the Company initiated an internal review of certain potential errors in the recognition of revenue related to sales to a customer in the first and second fiscal quarters of 2008 in the Company’s Semiconductor Systems Segment, which were brought to the attention of the Audit Committee of the Company’s Board of Directors (the “Audit Committee”) by Company management. Following this initial internal review, the Audit Committee, in consultation with the Company’s outside legal counsel determined that it was appropriate to undertake an independent review of the potential revenue recognition issues brought to its attention.
On or about November 25, 2008, the Audit Committee initiated a broader independent review of sales transactions in the Semiconductor Systems Segment that contain arrangements with multiple deliverables for fiscal years 2007 and 2008. The review was subsequently expanded to include sales transactions in the Semiconductor Systems Segment, along with certain other sales transactions for fiscal years 2006, 2007 and 2008. To assist in its review, the Audit Committee retained independent legal counsel and forensic accounting experts.
On December 4, 2008, the Company announced that it identified errors in the recognition of revenue related to sales to a customer in the first and second fiscal quarters of 2008 in the Semiconductor Systems Segment and that the previously issued financial statements contained in the Company’s Quarterly Reports on Form 10-Q for the periods ended March 28, 2008 and June 27, 2008 should no longer be relied upon.
Subsequently, the Company announced that it had identified additional revenue recognition errors related to the timing of revenue recognition from sales to certain Semiconductor Systems Segment customers during fiscal year 2007. The Audit Committee concluded, upon the recommendation of Company management, that the range of potential adjustments resulting from the identified errors is material to the financial statements of the Company for the periods indicated and as a result, the Audit Committee determined that the previously issued interim and annual historical financial statements for 2007 should no longer be relied upon. The Audit Committee thereafter expanded the scope of its investigation to include fiscal year 2006.
On March 30, 2009, the Company announced that it had identified additional revenue recognition errors related to the timing of revenue recognition from sales to certain Semiconductor Systems Segment customers during fiscal year 2006. The Audit Committee concluded, upon the recommendation of Company management, that the range of potential adjustments resulting from the identified errors is material to the financial statements of the Company for the periods indicated and as a result, the Audit Committee determined that the previously issued interim and annual historical financial statements for 2006 should no longer be relied upon.
The Audit Committee’s advisors reported the results of the investigation to the Audit Committee on April 24, 2009. The Company voluntarily reported the investigation results to the Securities and Exchange Commission (“SEC”) on April 30, 2009. The Company later announced in May 2009 that it was reviewing sales transactions of its Semiconductor Systems Segment during fiscal years 2004 and 2005 to determine if adjustments needed to be made to those periods. Thereafter, on June 30, 2009, the Company announced that it was undertaking a preliminary review of the timing of revenue recognized in connection with multiple element arrangements in its Precision Technology Segment from 2004 through 2008 to determine if adjustments need to be made to those periods (collectively with the Audit Committee’s review of transactions in the Semiconductor Systems Segment and any other related Company reviews of transactions in the Semiconductor Systems Segment and Precision Technology Segment, the “Revenue Review”). As is further explained in Note 2 of the Notes to Consolidated Financial Statements, in connection with the Revenue Review, the Company concluded that there were a number of adjustments required that primarily relate to revenue recognition and the corresponding adjustments to deferred revenue, cost of goods sold and other assets. Adjustments to revenue resulted in revenue and their related costs being deferred and recognized in subsequent periods once all revenue recognition criteria have been met. In addition, these adjustments did not affect the Company’s cash balances. The transactions that are being restated as a result of the Revenue Review include transactions for which the complete facts required to make the appropriate assessment with respect to the timing of the revenue recognition were not communicated to the finance department at the time the initial revenue was booked. As of December 31, 2008, a substantial portion of the revenue deferred through the restatement remains deferred, pending the finalization of all deliverables under the terms of the arrangements with customers. The revenue adjustments, in aggregate for both the Semiconductor Systems and the Precision Technology Segments, primarily relate to:
| • | multiple-element arrangements for which objective and reliable evidence of fair value does not exist for one or more of the undelivered elements; |
1
Table of Contents
| • | for those arrangements whereby it was determined that customer acceptance was required in order to record revenue in accordance with the Company’s policy, the correction of the timing of revenue for instances where customer acceptance could not be demonstrated until a period subsequent to the period of original revenue recognition; |
| • | contractual terms that resulted in arrangements being deemed to not be fixed or determinable at the outset of the arrangement (including extended payment terms and contracts whereby product quantity mix was subject to adjustment during the term of the arrangement); and |
| • | certain other revenue adjustments which were not individually, or in the aggregate, significant. These adjustments have been reflected in the restated consolidated financial statements and primarily relate to the accounting for separately priced extended warranty contracts. |
In addition to adjustments from the Revenue Review, the Company has also identified and recorded the impact of certain adjustments which, due to their materiality, were not previously recorded. Certain of these adjustments affect revenue, cost of goods sold and operating expenses, as well as offsetting balance sheet accounts. These adjustments have been reflected in the accompanying consolidated financial statements.
In connection with its restatement, the Company and Ernst & Young LLP, its independent auditors, identified and reported to the Company’s Audit Committee significant internal control matters that collectively constitute “material weaknesses.” Please see “Item 9A. Controls and Procedures” below for a description of these matters, and of certain of the measures that have been implemented during 2009, to date, as well as additional steps the Company plans to take to strengthen its controls.
The Company does not anticipate amending its previously filed annual reports on Form 10-K or any quarterly reports on Form 10-Q. The consolidated financial statements and related consolidated financial information contained in previously filed reports, including for the years ended December 31, 2007 and 2006 and for the first two quarterly reports during 2008 and the first three quarters of 2007, should no longer be relied upon. See Note 17 of the Notes to Consolidated Financial Statements for disclosure of quarterly results of operations for each quarter in 2007 and 2008.
2
Table of Contents
PART I
Cautionary Note Regarding Forward-Looking Statements
Except for historical information, the matters discussed in this Annual Report on Form 10-K are forward looking statements that involve risks, uncertainties and assumptions that, if they never materialize or if they prove incorrect, could cause our consolidated results to differ materially from those expressed or implied by such forward-looking statements. The Company makes such forward-looking statements under the provision of the “Safe Harbor” section of the Private Securities Litigation Reform Act of 1995. Actual future results may vary materially from those projected, anticipated, or indicated in any forward-looking statements as a result of various factors, including those set forth in Item 1A of this Annual Report on Form 10-K under the heading “Risk Factors.” Readers should also carefully review the risk factors described in the other documents that the Company files from time to time with the SEC. In this Annual Report on Form 10-K, the words “anticipates,” “believes,” “expects,” “intends,” “future,” “could,” “estimates,” “plans,” “will,” “could,” “would,” “should,” “potential,” “continues” and similar words or expressions (as well as other words or expressions referencing future events, conditions or circumstances) identify forward-looking statements. Forward-looking statements also include the assumptions underlying or relating to any of the foregoing statements. The forward-looking statements contained in this Annual Report include, without limitation, statements about our reorganization proceedings under Chapter 11 of the U.S. Bankruptcy Code, our ability to continue as a going concern, the value of our common shares, our delisting proceedings with NASDAQ, our internal controls over our accounting for revenue recognition and income tax transactions, our internal controls over our financial close process, our results of operations and our financial condition. All forward-looking statements included in this document are based on information available to us on the date hereof. We will not undertake and specifically decline any obligation to update any forward-looking statements.
3
Table of Contents
| Item 1. | Business |
OVERVIEW
GSI Group Inc. and its subsidiaries (collectively referred to as the “Company”) design, develop, manufacture and sell photonics-based solutions (consisting of lasers, laser systems and electro-optical components), precision motion devices, associated precision motion control technology and systems. Its customers incorporate its technology into their products or manufacturing processes, for a wide range of applications in a variety of markets, including: industrial, scientific, electronics, semiconductor, medical and aerospace. The Company’s products enable customers to make advances in materials and processing technology and to meet extremely precise manufacturing specifications.
The Company’s products are grouped into three segments: Precision Technology, Semiconductor Systems and Excel Technology, Inc. (“Excel”). The Company strives to create shareholder value through:
| • | Organic sales growth by delivering a consistent stream of successful new product launches, |
| • | Generating high levels of cash flow from operations, and |
| • | Acquiring and successfully integrating businesses that have complementary and established core competencies. |
GSI Group Inc., founded in 1968 as General Scanning, Inc., was initially incorporated in Massachusetts. General Scanning developed, manufactured and sold components and subsystems for high-speed micro positioning of laser beams. In 1999 General Scanning merged with Lumonics Inc., a Canadian company that developed, manufactured and sold laser-based, advanced manufacturing systems for electronics, semiconductor, and general industrial applications. GSI Lumonics Inc., the post-merger entity, continued under the laws of the Province of New Brunswick, Canada. In 2005, the Company renamed itself GSI Group Inc.
In addition to the restatement of the Company’s financial results, which is discussed in the preceding Explanatory Note and further described in detail in Note 2 of Notes to Consolidated Financial Statements, a number of significant events have occurred since August 2008 and through the filing of this Annual Report on Form 10-K. Each of these recent events is discussed below. Following the discussion of these recent events is a discussion of the Company’s continuing operations.
SIGNIFICANT RECENT EVENTS
Acquisition of Excel Technology, Inc. in August 2008
In August 2008, the Company acquired Excel, a designer, manufacturer and marketer of photonics-based solutions consisting of lasers, laser-based systems, precision motion devices and electro-optical components, primarily for industrial and scientific applications. Excel, which was headquartered in East Setauket, New York, manufactures its products in plants located in the United States and Germany, and sells its products to customers worldwide, both directly and indirectly through resellers and distributors. The Company acquired Excel in exchange for a cash payment of $368.7 million, including transaction costs, a portion of which was financed by entering into a loan agreement for $210.0 million. This loan is further discussed in the section below titled ‘Chapter 11 Bankruptcy Filing’, and in Note 8 of Notes to Consolidated Financial Statements. Subsequent to the acquisition of Excel, the Company established a third segment which is comprised solely of the operations of the newly acquired entity. See Note 4 of Notes to Consolidated Financial Statements for further details regarding the Excel transaction.
Divesture of General Optics Business in October 2008
On October 8, 2008, the Company completed the sale of its General Optics business, located in Moorpark, California, (the “U.S. Optics Business”) for a sale price of $21.6 million, which represented a gain of $8.7 million, net of tax. The sale of the U.S. Optics Business is reported as Gain on Disposal of Discontinued Operations in our consolidated statements of operations for the year ended December 31, 2008. This business was part of the Company’s Precision Technology Segment. The results of operations of the U.S. Optics Business have been reclassified and reported as income from discontinued operations in our consolidated statements of operations. See Note 5 of Notes to Consolidated Financial Statements for further details regarding the sale of the U.S. Optics Business.
4
Table of Contents
NASDAQ Delisting Determination
On November 3, 2009, the NASDAQ Hearing Panel (the “Panel”) of the NASDAQ Stock Market (“NASDAQ”) notified the Company that it had determined to delist the Company’s common shares from the NASDAQ Global Select Market and to suspend trading in the Company’s common shares effective at the open of market on November 5, 2009. The Panel’s determination was made in connection with the Company’s non-compliance with the filing requirements set forth in Listing Rule 5250(c)(1) due to the delayed filing of certain of our periodic reports. As permitted by NASDAQ rules, the Company timely appealed the Panel’s determination to the NASDAQ Listing and Hearing Review Council (the “Listing Council”). On January 15, 2010, the Listing Council notified the Company that it affirmed the Panel’s decision to delist the Company’s securities. On March 15, 2010, the Company received notification from the NASDAQ Stock Market, LLC Board of Directors (the “NASDAQ Board”) that the NASDAQ Board has declined to call for review the January 15, 2010 decision of the Listing Council. Accordingly, pursuant to Listing Rule 5825, the Listing Council’s decision represents the final decision of NASDAQ. In accordance with Listing Rule 5830 and Rule 12d2-2 under the Securities Exchange Act of 1934, NASDAQ filed an application on Form 25 with the SEC on April 5, 2010, to delist the Company’s securities from NASDAQ. The application will become effective ten days after filing.
The Company’s common shares are currently quoted on the Pink OTC Markets Inc., continuing under the trading symbol “GSIGQ.” The Company intends to seek relisting of its common shares on a national exchange as soon as possible once it becomes current in its reporting obligations.
Chapter 11 Bankruptcy Filing
In connection with the Company’s failure to file the 2008 Q3 Report, as described in the Explanatory Note, on December 12, 2008, the Company announced that it had received four letters from certain noteholders of the 11% Senior Notes due in 2013, in the principal amount of $210.0 million (the “Senior Notes”), issued by GSI Group Corporation (“GSI US”), alleging that the Company had failed to comply with a covenant in the Senior Note Indenture (the “Indenture”), relating to the Senior Notes, as a result of the Company’s failure to file its 2008 Q3 Report within the time period specified by the rules and regulations of the SEC. These noteholders further alleged that, if such failure continued for 60 days from the date that the Company received notices of failure from holders comprising at least 25% of the aggregate principal amount of Senior Notes then outstanding, then such failure would constitute an event of default. Although the Company asserted that the letters did not constitute proper notice as required pursuant to the terms of the Indenture, and notified the trustee under the Indenture as such, the Company continued to work diligently to complete the review by its Audit Committee and to file its 2008 Q3 Report to avoid any claim of an “Event of Default” from occurring under the Indenture. Upon receipt of the letters from the noteholders, the Company commenced discussions with certain of the noteholders. On February 11, 2009, the Company announced that it entered into forbearance agreements with certain noteholders holding greater than 75% of the outstanding aggregate principal amount of the Senior Notes, pursuant to which such noteholders agreed to forebear from taking any action or exercising any remedies under the Indenture as a result of the Company’s delayed periodic reports until February 27, 2009, pursuant to other terms and conditions more specifically set forth therein. On June 30, 2009, the Company announced that it reached an agreement on a non-binding term sheet with certain noteholders to consensually restructure the Company’s outstanding obligations under the Senior Notes.
Following negotiations between the Company and certain noteholders about the restructuring, on November 20, 2009 (the “Petition Date”), GSI Group Inc. (“GSIG”) and two of its United States subsidiaries, GSI US and MES International, Inc. (“MES” and, collectively with GSIG and GSI US, the “Debtors”), filed voluntary petitions for relief (the “Chapter 11 Petitions”) under Chapter 11 of the United States Bankruptcy Code (the “Bankruptcy Code”) in the United States Bankruptcy Court for the District of Delaware (the “Court”) (the “Chapter 11 Cases”). Following the Petition Date, the Debtors will continue to operate their business as “debtors-in-possession” under the jurisdiction of the Court and in accordance with the applicable provisions of the Bankruptcy Code and orders of the Court.
On November 19, 2009, in anticipation of filing the Chapter 11 Petitions, the Debtors entered into a Noteholder Restructuring Support Agreement with eight of ten of the beneficial holders (the “Consenting Noteholders”) of the Senior Notes, representing Consenting Noteholders holding approximately 88.1% of the outstanding principal amount of the Senior Notes. Pursuant to the Noteholder Restructuring Support Agreement, the Consenting Noteholders have agreed, subject to certain conditions, to support the Joint Chapter 11 Plan of Reorganization proposed by the Debtors, which was filed with the Chapter 11 Petitions.
On March 16, 2010, the Debtors entered into an Amended and Restated Plan Noteholder Restructuring Support Agreement (as amended, the “Plan Support Agreement”) with Consenting Noteholders holding approximately 88.1% of the outstanding principal amount of the Senior Notes. Pursuant to the Plan Support Agreement, the Consenting Noteholders
5
Table of Contents
have agreed to support a modified plan, in substantially the form of the Second Modified Joint Chapter 11 Plan of Reorganization for the Debtors as filed with the Court on March 16, 2010, and attached as Exhibit A to the Amended Plan Support Agreement (the “Second Modified Plan”).
On April 9, 2010, the Debtors filed their Third Modified Joint Chapter 11 Plan of Reorganization (as modified, the “Plan”) with the Court, which reflected further modifications to the Second Modified Plan. The terms of the Plan are hereafter described under the heading “The Third Modified Joint Chapter 11 Plan of Reorganization.”
The Third Modified Joint Chapter 11 Plan of Reorganization
Pursuant to the Plan, which is subject to Court approval, the holders of claims under the Senior Notes (the “Senior Note Claims”) would, in exchange for the Senior Note Claims, receive their pro rata portion of (i) shares of new convertible preferred stock of GSIG (the “Preferred Shares”), which, on an as-converted basis, would represent approximately 53.8% of GSIG’s post-consummation outstanding shares, (ii) new secured notes in the aggregate amount of $110 million, (iii) excess cash available under the Plan to the extent certain allowed claims exceed $22.5 million and (iv) a cash payment (the “Cash Payment”) in an amount of $69,315 for each day from and including the Petition Date until the plan distribution date. Under the terms of the Plan and because the Debtors commenced the Chapter 11 Cases by November 20, 2009, this Cash Payment would be reduced by $2.1 million. On the effective date of the Plan, GSIG would also pay any and all interest accrued on the Senior Note Claims until the Petition Date. As of the Petition Date, there is approximately $6.03 million in accrued and unpaid interest with respect to the Senior Notes. The Preferred Shares would have a 1x liquidation preference and be mandatorily redeemable after 8 years for cash or, if certain circumstances are met, common shares of GSIG. The Preferred Shares would be voted on an as-converted basis together with GSIG’s common shares and share pari passu in any dividend declared on common shares, but not have any guaranteed fixed dividend rights. The interest rate on the new secured notes would be 12.25% and, at GSI US’s option, subject to GSIG’s compliance with a fixed charge coverage ratio defined in the indenture for the new secured notes to be entered into upon the effective date of the Plan, would be payable in kind at a compounded rate of 13%. The new secured notes would be issued by GSI US, guaranteed by GSIG, ten of GSI US’s United States subsidiaries, and two of GSIG’s Canadian subsidiaries and secured by substantially all the assets of GSI US and the guarantors.
As part of the Plan, GSIG’s wholly owned subsidiary, GSI Group Limited, would, in exchange for claims under an unsecured note in the principal amount (as fixed pursuant to the Plan) of $20 million, payable by GSI US to GSI Group Limited (the “GSI UK Note Claim”), receive (i) Preferred Shares, which, on an as-converted basis, would represent approximately 5.1% of GSIG’s post-consummation outstanding shares, (ii) approximately $10.5 million of the new secured notes, (iii) its pro rata share of the excess cash available under the Plan to the extent certain allowed claims exceed $22.5 million and (iv) its pro rata share of the Cash Payment, as adjusted. On the effective date of the Plan, GSIG would also pay interest accrued on the GSI UK Note Claim until the Petition Date.
As contemplated by the Plan, existing shareholders would (i) retain 41.1% of GSIG’s post-consummation outstanding shares, which would be issued in common shares and (ii) receive one series of three-year warrants to purchase a number of common shares equal to 10% of 111% of the post consummation outstanding shares of GSIG (that is, the number of shares of GSIG that would equal 10% of the shares of GSIG, including the Preferred Shares on an as-converted basis, before taking into account the number of shares represented by such warrants) at a strike price of $2.50 per share.
Under the proposed Plan, all classes of claims, including all claims by vendors and suppliers, would be unimpaired and paid in full, except for the Senior Note Claims, the GSI UK Note Claim and the equity interest in GSIG.
The Plan provides that its effectiveness is subject to customary conditions, including, without limitation, that the effective date occurs on or before May 20, 2010, unless such date is extended pursuant to the Plan Support Agreement.
The Plan contemplates that the Debtors will continue to operate their businesses in substantially their current form. On November 23, 2009, the Debtors obtained the Court’s approval of so-called first day motions providing for the continued payment of vendors and suppliers under normal terms in the ordinary course of business for goods and services provided to the Debtors prior to and after the Petition Date. On December 18, 2009, the Court approved the Plan Support Agreement. The Court further approved the Debtors’ Disclosure Statement with respect to the Plan on January 8, 2010, and set a date for consideration of confirmation of the Plan for April 16, 2010.
The Plan provides that, following the effective date of the Plan, GSIG’s Board of Directors would be comprised of seven directors, to include its Chief Executive Officer, three members to be appointed by the beneficial holders of the Senior Notes, two members to be appointed by the current shareholders of GSIG and one member to be appointed by the current board of
6
Table of Contents
directors of GSIG, which member will be selected from the members of GSIG’s current board of directors as of the date of the Plan. The Plan anticipates that the current officers of GSIG would continue as officers of GSIG following the effective date of the Plan.
The recoveries summarized above and the other terms of the Company’s restructuring are more fully described in the Plan.
The Plan Support Agreement
The Debtors’ proposed financial restructuring, as set forth in the Plan, has the support of Consenting Noteholders holding approximately 88.1% of the principal amount of the outstanding Senior Notes, representing 80% of all holders of the Senior Notes. The Plan Support Agreement was approved by the Court on December 18, 2009, and as noted above, was amended and restated on March 16, 2010.
The Plan Support Agreement requires the Consenting Noteholders, and their successors and assigns, (i) to timely file a notice with the Court indicating that the votes previously submitted by the Consenting Noteholders with respect to the Plan shall constitute and be deemed votes accepting and in favor of the Plan, (ii) not to object to confirmation of the Plan and not to object to, or otherwise commence, any proceeding to oppose or alter the Plan or support an alternative restructuring, (iii) not to withdraw, change or revoke their votes with respect to the Plan, except as otherwise permitted in the Plan Support Agreement, and (iv) except as otherwise permitted in the Plan Support Agreement, not to take any other action, including commencing any legal proceeding, that is inconsistent with, or that would materially prevent, hinder or delay the consummation of, the restructuring.
The support of the Consenting Noteholders under the Plan Support Agreement will terminate under certain circumstances, including, without limitation, if (i) the Debtors are in material breach of any obligations under the Plan Support Agreement, (ii) the Debtors file any motion or pleading with the Court that is inconsistent in a material respect with the Plan Support Agreement or the Plan, (iii) the Court grants relief that is materially inconsistent with the Plan Support Agreement or the Plan, (iv) the Debtors fail to achieve certain deadlines with respect to the approval of the Plan Support Agreement or the disclosure statement or confirmation or effectiveness of the Plan, (v) a trustee is appointed in the Chapter 11 Cases or any of the Chapter 11 Cases is dismissed or converted to a case under Chapter 7 of the Bankruptcy Code or if the Debtors make a motion for such appointment, dismissal or conversion, (vi) the Court enters an order invalidating, disallowing, subordinating, recharacterizing or limiting the principal and interest components of the Senior Note Claims or disgorging any amounts paid prior to the Petition Date from any holder of the Senior Note Claims or (vii) there is a Material Adverse Change to GSIG (as defined in the Plan Support Agreement).
The Plan Support Agreement provides that GSIG shall use its best efforts to (i) support and complete the restructuring and all transactions contemplated by the Plan, (ii) take any and all necessary and appropriate actions in furtherance of the restructuring, (iii) complete the restructuring and all transactions contemplated under the Plan within set time-frames, (iv) obtain any and all required regulatory and/or third-party approvals for the restructuring, and (v) not directly or indirectly seek, solicit, support, consent to, or participate in the negotiation or formulation of alternate plans of reorganization, certain other corporate transactions, such as mergers, dissolutions, or a sale of substantially all of GSIG’s assets or any other action that is inconsistent with the reorganization as contemplated by the Plan Support Agreement.
Companies’ Creditors Arrangement Act
On April 8, 2010, the Debtors commenced certain parallel proceedings to the Chapter 11 Cases before the Court of Queen’s Bench of New Brunswick (the “NB Court”), pursuant to section 46 of the Companies’ Creditors Arrangement Act, for an order of the NB Court recognizing the “foreign main proceeding” constituting the Chapter 11 Cases and seeking relief from certain actions by the NB Court.
SEC Investigation
As discussed in the Explanatory Note to the Annual Report on Form 10-K, we have conducted a Revenue Review of certain of our historic revenue transactions. On May 14, 2009, we received a notice from the SEC indicating that the SEC is conducting a formal investigation relating to our historical accounting practices and the restatement of our historical consolidated financial statements. The Company is cooperating fully with the SEC’s investigation.
7
Table of Contents
Going Concern
Operating in bankruptcy imposes significant risks and uncertainties on our business. See Item 1A — “Risk Factors — Risks Relating to Bankruptcy” for a discussion of the risks and uncertainties relating to our business and investing in our securities as a result of the Chapter 11 Cases.
The Company believes that when it emerges from bankruptcy it will be sufficiently capitalized. The Company expects that it will have assets that exceed its liabilities, and that those assets, as well as the net assets derived from its continuing operations, will be sufficient to meet the Company’s obligations, including the obligations with respect to the payment of interest, and repayment of principal under the New Term Loan. Notwithstanding the Company’s expectation upon its emergence from bankruptcy, uncertainties inherent in the bankruptcy process raise substantial doubt about the Company’s ability to continue as a going concern. In particular, until the Plan is confirmed by the Court, the Company may be required to pay the Senior Note Claims under the original terms of the Senior Notes. The consolidated financial statements do not include any adjustments to reflect the possible future effects on the recoverability and classification of assets or the amounts and classification of liabilities that may result from the outcome of this uncertainty.
THE COMPANY’S CONTINUING OPERATIONS
The Company operates in three segments, Precision Technology, Semiconductor Systems and Excel, which are described below.
Precision Technology Segment
The Company’s Precision Technology Segment designs, manufactures, and markets lasers, optical scanners, optics, air bearing spindles, encoders, and thermal printers to customers worldwide. The Company’s OEM products include those based on its core competencies in laser, precision motion and motion control technology. The Company sells the products in the Precision Technology Segment both directly and indirectly through resellers and distributors.
The Precision Technology Segment has six major product lines, including lasers, scanners, optics, printed circuit board spindles, encoders and thermal printers.
| Product Line |
Key End Markets |
Description | ||
| Lasers | Industrial, Electronics, Automotive, Medical, Packaging and Aerospace | Applications include welding, cutting, drilling, surface marking, and deep engraving of metal and plastic parts. | ||
| Scanners | Industrial Electronics, Aerospace, and Medical Applications | High precision motors that, when coupled with a mirror, can direct a laser beam with a high degree of accuracy. Applications include laser marking and coding, laser machining and welding, high density via hole drilling of printed circuit boards, retinal scanning, laser-based vision correction, high resolution printing, 2D or 3D imaging, and laser projection and entertainment. | ||
| Optics | Aerospace, Telecommunications, And Industrial | Super flat and super polished optics, and high performance mirrors primarily used with a scanner to direct a laser light. Applications include all of the above (Scanners), and in addition, the deflection of laser beams in aircraft gyroscopes, and bending optical light beams that transmit telecommunications data. | ||
| Printed Circuit Board Spindles |
Electronics | High-speed air bearing spindles used to drill very small and precise holes in printed circuit boards. Other applications include: semiconductors, industrial and printing. | ||
| Encoders | Electronics | Linear and rotary electro-optical tracking devices that measure movement with sub-micron accuracy. Applications include: motion control of semiconductor and electronic manufacturing equipment, confocal microscopes, positioning magnetic rings on hard drives, precision manufacturing and coordinate measuring systems. | ||
| Thermal Printers | Medical | Rugged paper tape printers for the medical instruments and defibrillator markets. | ||
Semiconductor Systems Segment
The Company’s Semiconductor Systems Segment designs, develops and sells production systems that process semiconductor wafers using laser beams and high precision motion technology. The Company sells manufacturing systems to
8
Table of Contents
integrated device manufacturers and wafer processors. The Company’s systems perform laser based processing on all of the following types of semiconductors: general wafers used for logic or memory purposes, dynamic random access memory (DRAM, NAND) chips and high performance analog chips.
Semiconductor manufacturers’ main technology challenge is to meet the trend toward ever shrinking circuit sizes demanded by consumers of micro-electronics like cell phones. As semiconductor manufacturers put more memory on smaller dye, the two critical challenges for production system suppliers are the ability to provide systems that can process wafers with manufacturing accuracy to the sub-micron level and to increase the wafer processing throughput.
The Semiconductor Systems Segment has three major product lines.
| Product Line |
Key End Markets |
Description | ||
| WaferRepair | Semiconductor - DRAM and Flash Memory chips | Wafer Repair is used to raise production yields for 300mm and 200mm DRAM and NAND wafers to commercially acceptable levels. | ||
| WaferTrim | Semiconductor - high performance analog and mixed signal devices | Wafer Trim systems enable production of high performance integrated circuits by precisely trimming analog and mixed signal integrated circuits with a laser beam to achieve a specified electrical resistance. | ||
| WaferMark | Semiconductor - silicon suppliers and integrated circuit factories | WaferMark systems are used to mark silicon wafers with characters or markings at various stages of the wafer and integrated circuit manufacturing process. The marks are designed to aid process control and device traceability. | ||
The Semiconductor Systems Segment also includes two smaller product lines, CircuitTrim and SVS CircuitTrim systems are used in the production of thick and thin film resistive components for surface mount technology electronic circuits, known as chip resistors, as well as thick and thin film hybrid circuits, and for adjusting the performance of complete multi-chip modules. SVS inspection equipment is used to inspect pre- and post- reflow solder paste and component placement on printed circuit boards.
Excel Segment
The Company’s Excel Segment designs, manufactures and markets photonics-based solutions consisting of lasers, laser-based systems, precision motion devices and electro-optical components, primarily for industrial and scientific applications. The Company sells the products in the Excel Segment to customers worldwide, both directly and indirectly through resellers and distributors.
9
Table of Contents
The Excel Segment has four major product lines.
| Product Line |
Key End Markets |
Description | ||
| Lasers and Laser-Based Systems |
Industrial, Scientific and Homeland Security | Applications include cutting, marking, engraving and micro-machining, scientific research, remote sensing and automation. | ||
| Scanners | Industrial, Medical, Scientific, Military and Academic | High precision motors that, when coupled with a mirror, can direct a laser beam with a high degree of accuracy. Applications include product laser marking and coding, laser machining and welding, high density via hole drilling of printed circuit boards, scanning microscopy, retinal scanning and Optical Coherence Tomography imaging for laser-based biomedical diagnostics, laser-based vision correction, high resolution printing, holographic storage, semiconductor wafer inspection and processing, 2D or 3D imaging and laser projection and entertainment. | ||
| Optics | Scanning | Thin-filmed optics primarily used with a scanner to direct a laser light. Applications include optical scanners, laser systems, professional motion picture cameras and a myriad of other industrial and scientific applications, as well as interferometry and research and development. | ||
| Light and Color Measurement |
Aerospace, Automotive, Lighting, Motion Picture, Research and Development and related industries |
Color metrology systems are used by a wide variety of industries for research, quality control and on-line testing, including portable battery operated Spectro radio meter, photometers and video photometers. | ||
Products and Services
The Company’s sales and gross margin contributions in 2008 were derived from the following business segments (dollars in thousands):
| Sales | Gross Margin Percentage |
||||||
| Precision Technology |
$ | 146,616 | 33.5 | % | |||
| Semiconductor Systems |
88,494 | 31.1 | % | ||||
| Excel |
55,612 | 37.2 | % | ||||
| Intersegment sales eliminations(1) |
(2,254 | ) | (14.8 | )% | |||
| Total |
$ | 288,468 | 33.8 | % | |||
| (1) | Sales of the Precision Technology Segment’s products to the Semiconductor Systems Segment. |
Customers
The Company has a diverse group of customers that includes some of the largest global leaders in their industries. Many of the Company’s customers participate in several market segments. In 2008, 2007 and 2006, no single customer accounted for 10% or more of sales.
Customers of our Semiconductor Systems Segment include some of the major semiconductor and silicon wafer producers. Most of these customers are end users who use our systems in their factories to manufacture products that include silicon wafers, memory chips, analog and hybrid micro-circuits in volume. A large number of them are based in Asia.
Customers of our Precision Technology and Excel Segments include a large number of original equipment manufacturers who integrate our products into their systems for sale to end users. Some of our Precision Technology and Excel products are also sold directly to end users. Precision Technology Segment and Excel Segment customers include
10
Table of Contents
leaders in the semiconductor equipment, industrial systems, electronics, automotive, data storage, and medical equipment markets. A typical OEM customer will evaluate a Precision Technology Segment or Excel Segment product before deciding to incorporate it into a product or system. Customers generally choose suppliers based on a number of factors, including product performance, reliability, price, breadth of the supplier’s product offering, and the geographical coverage offered by the supplier. Once Precision Technology Segment and Excel Segment products have been designed into a given OEM customer’s product or system, there are generally significant barriers to subsequent supplier changes.
Manufacturing
The Company manufactures Precision Technology Segment products at facilities in Bedford, Massachusetts; Poole, Rugby and Taunton, United Kingdom and Suzhou, China. Semiconductor Systems Segment products are manufactured, assembled and tested in Bedford, Massachusetts. The Company manufactures Excel Segment products at facilities in Lexington, Massachusetts, East Setauket, New York; Orlando, Florida; Chatsworth, Oxnard and Santa Clara, California; Cambridge, Massachusetts; Mukilteo, Washington, and Ludwigsburg, Germany. Most of the Company’s products are manufactured under ISO 9001 certification. Manufacturing functions are performed internally when management chooses to maintain control over critical portions of the production process or for cost related reasons. To the extent practical, the Company outsources the remaining portions of the production process. The Semiconductor Systems Segment focuses on outsourcing low value parts and modules and internally retains the tasks of final assembly of subsystems, testing and quality control.
All volume manufacturing of legacy laser products are moving from the Rugby, U.K. facilities, to other Company (including former Excel) laser manufacturing sites. The restructuring was significantly completed in 2009 and is projected to generate annual pretax savings in the range of $2.0 to $3.0 million.
Research and Development and Engineering
The Company continues to make a strong commitment to research and development for core technology programs directed at creating new products, product enhancements and new applications for existing products, as well as funding research into future market opportunities. Each of the markets the Company serves is generally characterized by rapid technological change and product innovation. The Company believes that continued timely development of new products and product enhancements to serve existing and new markets is necessary to remain competitive.
In 2008, 2007 and 2006 respectively, the Company incurred research and development and engineering expenses of $33.4 million, $29.9 million and $30.1 million, which represents 11.6%, 10.3% and 11.6% of sales, respectively.
Marketing, Sales and Distribution
The Company sells its products worldwide through use of a direct sales force team and through distributors and sales agents. In the case of products sold through the Company’s direct sales force, or local sales, applications and service teams work closely with our customers and leverage incremental supporting organizations from the Company to ensure customer satisfaction with our products. Our distributors work with customers in a similar fashion.
| • | Precision Technology products are sold worldwide mostly through direct sales, as well as through distributors, primarily to OEMs. Precision Technology businesses have sales and service centers located in Massachusetts, Michigan, California, United Kingdom, Germany, Switzerland, Taiwan, China, Singapore and Japan. Sumitomo Heavy Industries Ltd. (a significant shareholder of the Company) is a key distributor for certain products in Japan. Because of the fundamental nature and relatively small physical size of the products, the Precision Technology Segment generally employs a factory direct strategy in support of its worldwide customer base except in its laser product line where parts and field technical support is significant. |
| • | Semiconductor Systems products are sold directly, or, in some territories, through distributors. End users include semiconductor integrated device manufacturers and electronic component and assembly firms. Sales activities are directed from the product business unit sites in North America, Europe, Japan and Asia Pacific. Field offices are located close to key customers’ manufacturing sites to maximize sales and support effectiveness. Significant revenues are derived from the sales of parts, and the provisioning of services relating to the installed base of equipment previously sold to customers. The Company maintains field offices in Germany, Japan, South Korea, China, Taiwan and Singapore. |
| • | Excel products are sold worldwide mostly through direct sales, as well as through distributors, primarily to OEMs. Excel Segment businesses have sales and service centers located in Massachusetts, Florida, New York, Washington, California, United Kingdom, Germany, Italy, France, Malaysia, India and Japan. The Company also engages independent manufacturers’ representatives for the sale of its Excel Segment products. Foreign sales of the Company’s Excel Segment products are made primarily through foreign equipment distribution organizations. With the Company’s acquisition of |
11
Table of Contents
| Excel, the Company also has a 50% equity ownership in a joint venture based in Mumbai, India. This joint venture markets, sells, installs and provides application support for certain of Excel’s products in the southern Asian region. |
Competition
The industries in which the Company participates are dynamic and highly competitive. The Company’s markets in the photonics industry are characterized by intense competition and rapid technological change. Accordingly, the Company believes that it must continue to improve and refine its existing products and systems and develop new applications for its technology.
Competitive factors in the Company’s Precision Technology and Excel Segments include: product performance, price, quality, features, flexibility, compatibility of products with existing systems, technical support, product breadth, market presence, on-time delivery and the Company’s overall reputation. The main competitive factors in the Semiconductor Systems Segment include product performance, throughput and price. The Company believes that its products offer a number of competitive advantages, however, some of its competitors are substantially larger and have greater financial and other resources than the Company.
The table below illustrates the competition faced in the markets that the Company serves.
| Segment |
Product Line |
Main Competitor(s) | ||
| Precision Technology | Lasers | Rofin-Sinar, Trumpf-Haas, IPG Photonics, Unitek-Miyachi, Lasag, and other specialized lasers and systems manufacturers | ||
| Scanners | Fragmented among numerous suppliers, including Scanlabs GmbH | |||
| Optics | Fragmented among numerous suppliers | |||
| Printed circuit board spindles | ABL (owned by Hitachi), Mechatronics, Precise | |||
| Encoders | Renishaw and Heidenhain | |||
| Thermal printers | Advanced Printing Solutions | |||
| Semiconductor Systems | All semiconductor product lines | Electro Scientific Industries, Innolas, Shibaura, Omron | ||
| Excel | Lasers and laser-based systems | Rofin-Sinar, Coherent, Newport (Spectra-Physics), Electrox, Foba, Laservall, SEI s.p.A., Cheval Frere, Fotona, E.O. Technics, Trump-Haas, IPG Photonics, Hans Laser, Electro Scientific Industries, ULS, Clark-MXR, Femtolaser, Thales Laser, Cyber Laser, New Wave Research, Quantel Lasers, Big Sky Lasers, Amplitide, Litron, Ekspla, and other specialized lasers and systems manufacturers | ||
| Scanners | Fragmented among numerous suppliers | |||
| Optics | Fragmented among numerous suppliers | |||
| Light and color measurement | Minolta and Topcon | |||
Sources of Supply
The Company depends on an uninterrupted supply of a large number of parts and components. Many of those parts and components are critical, and are available from a limited number of suppliers. The Company procures some components from a single source. The Company also relies on a limited number of independent contractors to manufacture subassemblies for some of its products. A disruption of this supply chain could potentially result in substantial manufacturing delays and additional costs. If suppliers or subcontractors experience difficulties that result in a reduction or interruption in supply to the Company, or fail to meet any of its manufacturing or quality requirements, the Company’s business could be harmed unless or until it is able to secure alternative sources. These components and manufacturing services may not continue to be available to the Company at favorable prices, or at all.
12
Table of Contents
In the Precision Technology Segment, the Company sources most of the parts externally. However, the Company also manufactures many parts, including some critical parts, internally, particularly in the air bearing spindle business. The Company also purchases fully-functional electronics as well as certain key components, such as laser diodes, from external sources.
In the Semiconductor Systems Segment, the Company purchases major subsystems, such as lasers, motion stages, vision systems and software, fully-functional electronics and frames and racks, from the merchant market. Its optics components are both internally manufactured and externally purchased. In some cases, upper level assemblies and entire systems are outsourced to electronic manufacturing services companies.
In the Excel Segment, the Company relies upon unaffiliated suppliers for the material components and parts used to assemble its products. Most parts and components purchased from suppliers are available from multiple sources.
To date, the Company has not experienced any significant delays in obtaining parts and components for its products. The Company believes that it will be able to continue to obtain most required components and parts from a number of different suppliers, although there can be no assurance thereof. The Company cannot guarantee that its suppliers will continue to perform in a satisfactory fashion.
Patents and Intellectual Property
The Company relies upon a combination of copyrights, patents, trademarks, trade secret laws and restrictions on disclosure to protect our intellectual property rights. The Company holds approximately 400 issued patents, approximately 240 in the United States and approximately 160 in foreign countries. These patents are set to expire from 2010 through 2027. Additionally, the Company has approximately 230 pending patents, approximately 45 in the United States and approximately 185 in foreign countries. The issued patents cover various products in many of our key product categories, particularly semiconductor systems, optical scanning products, encoders, air bearing spindles, and lasers. In addition, we also have trademarks registered in the United States and foreign countries. We will continue to actively pursue application for new patents and trademarks as we deem appropriate. However, there can be no assurance that any other patents will be issued to the Company or that such patents, if and when issued, will provide any protection or benefit to the Company.
Although the Company believes that its patents and pending patent applications are important, the Company relies upon several additional factors that are essential to our business success, including: market position, technological innovation, know-how and product performance. There can be no assurance that the Company will realize any of these advantages.
We also protect our proprietary rights by controlling access to our proprietary information and by maintaining confidentiality agreements with our employees and consultants, and certain of our customers and suppliers. There can be no assurance, however, that other companies are not investigating or developing other technologies that are similar to ours. It is also possible that, despite our efforts, other parties may use, obtain or try to copy our technology and products, and that the steps we take to protect our propriety information may not provide meaningful protection in the event of misappropriation or disclosure. Further, policing authorized use of our intellectual property rights is difficult and time consuming and may involve initiating claims or litigation against third parties for infringement of our propriety rights, which could be costly. In particular, our efforts to protect our intellectual property rights may not be effective in some foreign countries where we operate or sell our products.
Additionally, we have received in the past, and could receive in the future, notices from third parties alleging that our products infringe patents or other proprietary rights. Although we believe that our products are non-infringing or that we have the patents and/or licenses to allow us to lawfully sell our products, we may be sued for infringement, which could adversely affect us. For a further discussion of the importance to our business of, and the risks attendant to, intellectual property rights, see “Risk Factors” in Item IA of this Annual Report on Form 10-K.
13
Table of Contents
Human Resources
Employees by functional area, as of December 31, 2009, are as follows:
| Number of Employees |
Percentage | ||||
| Production operations and field service |
746 | 58 | % | ||
| Research and development |
223 | 17 | |||
| Selling, general and administrative |
328 | 25 | |||
| Total |
1,297 | 100 | % | ||
Employees by functional area, as of December 31, 2008, are as follows:
| Number of Employees |
Percentage | ||||
| Production operations and field service |
919 | 59 | % | ||
| Research and development |
252 | 16 | |||
| Selling, general and administrative |
397 | 25 | |||
| Total |
1,568 | 100 | % | ||
Geographic Information
Information regarding the geographic components of the Company’s sales and long-lived assets are provided in Note 15 of Notes to Consolidated Financial Statements included in this Annual Report on Form 10-K.
Government Regulation
The Company is subject to the laser radiation safety regulations of the Radiation Control for Health and Safety Act administered by the National Center for Devices and Radiological Health, a branch of the United States Food and Drug Administration. Among other things, these regulations require laser manufacturers to file new product and annual reports, to maintain quality control and sales records, to perform product testing, to distribute appropriate operating manuals, to incorporate design and operating features in lasers sold to end-users and to certify and label each laser sold to end-users as one of four classes (based on the level of radiation from the laser that is accessible to users). Various warning labels must be affixed and certain protective devices installed depending on the class of product. The National Center for Devices and Radiological Health is empowered to seek fines and other remedies for violations of the regulatory requirements. The Company believes that it is currently in compliance with these regulations.
The Company is subject to similar regulatory oversight, including comparable enforcement remedies, in the European markets it serves.
Other
Information concerning backlog and working capital may be found in Item 7, Management’s Discussion and Analysis of Financial Condition and Results of Operations.
Available Information, Website and Access to Financial Filings
The Company files annual, quarterly and current reports, proxy statements and other information with the SEC under the Securities Exchange Act of 1934 as amended (the “Exchange Act”). The Company’s SEC filings are available on the Internet at the SEC’s website at http://www.sec.gov. You may also access any document the Company has filed by visiting the SEC’s public reference room in Washington, D.C. Please call the SEC at 1-800-SEC-0330 for further information about the public reference rooms.
14
Table of Contents
Financial and other information relating to the Company can also be accessed from the Company’s Internet website at http://www.gsig.com/investors/. Except as otherwise stated in these documents, the information contained on our website or available by hyperlink from our website is not incorporated by reference into this report or any other documents we file with or furnish to the SEC.
The Company makes available, free of charge, copies of its annual reports on Form 10-K, quarterly reports on Form 10-Q, current reports on Form 8-K and amendments to those reports filed or furnished pursuant to Section 13(a) or 15(d) of the Securities Exchange Act as soon as reasonably practicable after filing such material electronically or otherwise furnishing it to the SEC. In addition, the Company’s reports and other information are filed with securities commissions or other similar authorities in Canada, and are available over the Internet at http://www.sedar.com.
Additionally, the Company posts a copy of its Code of Ethics on the Company website at http://www.gsig.com/about/.
| Item 1A. | Risk Factors |
The following information highlights some of the factors that could cause actual results to differ materially from the results expressed or implied by our forward-looking statements. Forward-looking statements should be considered in light of these factors. Factors that may result in such variances include, but are not limited to the following:
Risks that Relate to our Review of Historic Revenue Transactions, Restatement of Historic Consolidated Financial Statements and Control Procedures
The matters relating to the review of our accounting practices and the recent restatement of our historical consolidated financial statements, including pending litigation, could have a material adverse effect on us.
In connection with the closing of our financial statements for the quarter ended September 26, 2008, we discovered errors in the timing of revenue recognition of certain sales transactions in our Semiconductor Systems Segment. As a result of discovering these revenue recognition errors, we undertook a review of sales transactions in our Semiconductor Systems Segment and Precision Technology Segment for fiscal years 2006, 2007 and 2008. As a result of this review, we announced that the previously issued financial statements contained in the Company’s Quarterly Reports on Form 10-Q for the periods ended March 28, 2008 and June 27, 2008 and Annual Reports on Form 10-K for the fiscal years ended December 31, 2007 and December 31, 2006 should no longer be relied upon. Additionally, we undertook a review of sales transactions in our Semiconductors Systems Segment and Precision Technology Segment during years 2004 and 2005, which we subsequently restated as reflected in this Annual Report. These efforts resulted in the delay of the filing of this Annual Report on Form 10-K, as well as our Quarterly Reports on Form 10-Q for the quarterly periods ended September 26, 2008, April 3, 2009, July 3, 2009 and October 2, 2009 and our Annual Report on Form 10-K for the year ended December 31, 2009 to correct the errors and prepare restated historical consolidated financial statements. The Revenue Review and the resulting restatements have required us to incur substantial expenses for legal, accounting, tax and other professional services and have diverted our management’s attention from our business and could in the future adversely affect our business, financial condition, results of operations and cash flows.
The restatement of our prior financial statements has also exposed us to litigation. For example, in December 2008, a shareholder class action complaint was filed in the United States District Court for the District of Massachusetts against us, a former officer and a current officer and director. That complaint asserts claims under the federal securities laws, specifically Sections 10(b) and 20(a) of the Securities Exchange Act of 1934, relating to the restatement of our financial results for 2006, 2007, and the first two quarters of 2008. The complaint alleges that we issued a series of false or misleading statements to the market concerning our revenues, earnings, and financial condition. The plaintiffs contend that such statements caused our stock price to be artificially inflated and seek unspecified damages. Additionally, on May 14, 2009, we received a notice from the SEC indicating that the SEC is conducting a formal investigation relating to our historical accounting practices and the restatement of our historical consolidated financial statements. We could also become subject to litigation brought on behalf of purchasers of our outstanding Senior Notes because of our restatement of the consolidated financial statements. The conduct and resolution of these and future related matters will be time consuming, expensive and distracting from the conduct of our business. Furthermore, if we are subject to adverse findings in any of these matters, we could be required to pay damages or penalties or have other remedies imposed upon us which could have a material adverse effect on our business, financial condition, results of operations and cash flows.
The SEC has initiated a formal investigation relating to the review of our accounting practices and the restatement of our historical consolidated financial statements which could have a material adverse impact on us.
15
Table of Contents
In addition to the litigation prompted by our restatement, we received a notice from the SEC indicating that the SEC is conducting a formal investigation relating to our historical accounting practices and the restatement of our historical consolidated financial statements. We are cooperating fully with the SEC investigation. The conduct and resolution of the SEC investigation and related matters could be time-consuming, expensive and distracting to the conduct of our business. In the event that the investigation results in an adversarial action or proceeding being brought against us, or any of our current or former officers or directors, our business (including our ability to complete financing transactions), and the trading price of our securities, may be adversely impacted. Additionally, if the SEC investigation continues for a prolonged period of time, it may have the same impact regardless of the ultimate outcome of the investigation. In the event of an adverse judgment in any action or proceeding, we may be required to pay damages or penalties, or other remedies may be imposed upon us, which could have a material adverse impact on our business, financial condition, results of operations and cash flows.
Additionally, while we believe we have made appropriate judgments in determining the correct reporting periods for restated revenues, the SEC may disagree with the manner in which we have accounted for and reported, or not reported, the financial impact. Accordingly, there is a risk we may have to further restate our historical financial statements, amend prior filings with the SEC, or take other actions not currently contemplated.
Our Audit Committee, management and independent auditors have identified material weaknesses in our internal controls, and we may be unable to develop, implement and maintain appropriate controls in future periods.
In connection with the review and restatement of our financial statements, our Audit Committee, management team and independent registered public accounting firm identified certain weaknesses in our internal controls that have been considered to be material weaknesses and significant deficiencies. Specifically, our material weaknesses include: inadequate and ineffective controls over the financial statement close process; inadequate and ineffective controls over the accounting for revenue recognition; inadequate and ineffective controls over the accounting for income taxes; and, inadequate and ineffective controls over the evaluation process for the impairment assessment for goodwill, intangible assets and other long-lived assets. Prior to the remediation of these material weaknesses, there remains risk that the transitional controls on which we currently rely will fail to be sufficiently effective, which could result in a material misstatement of our financial position or results of operations and require a restatement.
We are currently designing and implementing a new environment of procedures and controls intended to address the material weaknesses described above. While this design and implementation phase is underway, we are relying on extensive manual procedures, including the significant utilization of outside accounting professionals, to assist us with meeting the objectives otherwise fulfilled by an effective controls environment. We note that a system of procedures and controls, no matter how well conceived and operated, can provide only reasonable, not absolute, assurance that the objectives of the control system are met. Because of the inherent limitations in all systems of procedures and controls, no evaluation can provide absolute assurance that all control issues including instances of fraud, if any, have been detected. These inherent limitations include the realities that judgments in decision-making can be faulty, and breakdowns can occur because of simple error or mistake. Additionally, procedures and controls can be circumvented by the individual acts of some persons, by collusion of two or more people, or by management override. The design of any system of procedures and controls also is based in part upon certain assumptions about the likelihood of future events, and there can be no assurance that any design will succeed in achieving its stated goals under all potential future conditions. Over time, our systems of procedures and controls, as we further develop and enhance them, may become inadequate because of changes in conditions, or the degree of compliance with the policies or procedures may deteriorate. Because of the inherent limitations in a cost-effective system of procedures and controls, misstatements due to error or fraud may occur and not be detected and could be material and require a restatement of our financial statements.
If we are unable to maintain appropriate internal controls, we may not have adequate, accurate or timely financial information, and we may be unable to meet our reporting obligations or comply with the requirements of the SEC or the Sarbanes-Oxley Act of 2002, which could result in the imposition of sanctions, including the inability of registered broker dealers to make a market in our common shares, or investigation by regulatory authorities. Any such action or other negative results caused by our inability to meet our reporting requirements or comply with legal and regulatory requirements or by disclosure of an accounting, reporting or control issue could adversely affect the trading price of our securities. Further and continued determinations that there are significant deficiencies or material weaknesses in the effectiveness of our internal controls could also reduce our ability to obtain financing or could increase the cost of any financing we obtain and require additional expenditures to comply with applicable requirements.
16
Table of Contents
Risks Relating to Bankruptcy
We are subject to the risks and uncertainties associated with bankruptcy proceedings as a result of our filing for reorganization under Chapter 11 of the Bankruptcy Code on November 20, 2009.
On November 20, 2009, we filed voluntary petitions with the Court to reorganize certain of our corporate entities under the Bankruptcy Code. This filing was made by our parent organization and two subsidiaries. We plan to continue to operate our business as a debtor-in-possession under the jurisdiction of the Bankruptcy Court and in accordance with the applicable provisions of the Bankruptcy Code. There can be no assurance that the Plan will be approved by the Bankruptcy Court or that any conditions precedent to its implementation will be satisfied or when, if ever, such confirmation and satisfaction will occur. Failure to obtain such confirmation or to satisfy such conditions to implementation may result in lengthier Chapter 11 proceedings as we attempt to negotiate and implement an alternative plan of reorganization.
For the duration of the Chapter 11 Cases, our operations will be subject to the risks and uncertainties associated with bankruptcy which include, among other things:
| • | the relationships between us and our customers, employees, vendors, strategic partners and others may be negatively affected by the Chapter 11 Cases, including risks that our customers will be less likely to purchase our services, that our employees will seek out other opportunities or lack proper motivation to fulfill their commitments and that vendors and strategic partners could terminate their relationships with us or require financial assurances or enhanced performance to continue their business relationships with us, which may be unduly burdensome on our business and operations; |
| • | the actions and decisions of our creditors and other third parties with interests in our Chapter 11 Cases may be inconsistent with our plans; |
| • | objections to or limitations on our ability to obtain Court approval with respect to motions in the Chapter 11 Cases that we may seek from time to time or potential adverse decisions by the Court with respect to such motions; |
| • | our ability to obtain and maintain commercially reasonable terms with vendors, strategic partners and service providers; |
| • | our ability to obtain and maintain contracts that are critical to our operations; |
| • | our ability to retain customers; and |
| • | our ability to retain and motivate our management team and other key employees. |
These risks and uncertainties could disrupt our business, adversely affect our relationships with customers, vendors, strategic partners or employees, or otherwise adversely affect our results of operations and financial condition. However, the ultimate impact of events that occur during these proceedings will have on our business, financial condition and results of operations, if any, cannot be accurately predicted or quantified. Our current Plan filed with the Court provides, among other things, that all existing equity in the Company will be heavily diluted. We can make no assurance that the price of our securities will not fluctuate or decrease substantially in the future. Accordingly, trading in our securities is highly speculative and poses substantial risks to purchasers of such securities, as holders may not be able to resell such securities or, in connection with our reorganization, may receive payment or other consideration that is less than the par value or the purchase price of such securities.
Operating under the Bankruptcy Code may restrict our ability to pursue our business strategies.
Under the Bankruptcy Code, we must obtain Court approval to, among other things:
| • | sell assets outside the ordinary course of business; |
| • | consolidate, merge, sell or otherwise dispose of all or substantially all of our assets; and |
| • | engage in other activities that are outside the ordinary course of business. |
Our ability to continue as a going concern imposes significant risks to our operations.
As set forth in the explanatory paragraph contained in the audit report on our 2008 Financial Statements of our independent registered public accounting firm, and due to the uncertainties inherent in the Chapter 11 process, there is substantial doubt as to our ability to continue as a going concern and our customers may become more reluctant to enter into arrangements with us.
17
Table of Contents
We have a significant amount of debt which has been accelerated as a result of the Chapter 11 proceedings, which debt may not be restructured satisfactorily in the bankruptcy proceeding and could adversely affect our business, financial condition, results of operations and our ability to meet our payment obligations under our outstanding liabilities.
We currently have $210.0 million principal balance of debt related to our Senior Notes, the payment of which has been accelerated as a result of the Chapter 11 proceedings. Although the Company’s obligation to repay the Senior Notes has been temporarily stayed as a result of the bankruptcy proceedings, and our proposed Plan, as submitted to the Bankruptcy Court, proposes, among other things, reducing the amount of our Senior Notes and certain other Company indebtedness, there can be no assurance that the Plan will be approved by the Bankruptcy Court or that our debt will be restructured satisfactorily. Even if the Plan is approved, we would still emerge from the Chapter 11 proceedings with substantial indebtedness that could adversely affect our business, financial condition and results of operations and our ability to meet our payment obligations under our outstanding liabilities. This level of debt could have significant consequences on our future operations, including:
| • | Making it more difficult for us to meet our payment and other obligations under our outstanding debt; |
| • | Possibly resulting in an event of default if we fail to comply with the financial and other covenants contained in the indenture governing the restructured Senior Notes, which event of default could result in all amounts thereunder becoming immediately due and payable; |
| • | Reducing the availability of our cash flow to fund working capital, capital expenditures, acquisitions and other general corporate purposes, and limiting our ability to obtain additional financing for these purposes; |
| • | Limiting our flexibility in planning for, or reacting to, and increasing our vulnerability to, changes in our business, the industry in which we operate and the general economy; and |
| • | Placing us at a competitive disadvantage compared to our competitors that have less debt or are less leveraged. |
Any of the above-listed factors could have an adverse effect on our business, financial condition and results of operations and our ability to meet our payment obligations under our outstanding liabilities.
The pursuit of the Chapter 11 has consumed and will continue to consume a substantial portion of the time and attention of our management.
The requirements of the Chapter 11 Cases has consumed, and will continue to consume, a substantial portion of our management’s time and attention and leave them with less time to devote to the operations of our business. This diversion of management’s attention may have a material adverse effect on the conduct of our business, and, as a result, on our financial condition and results of operations, particularly if the Chapter 11 Cases are protracted.
We may experience increased levels of employee attrition due to the Chapter 11 Cases.
Because of the Chapter 11 Cases, our employees are facing considerable distractions and uncertainty. In addition, due to the global economic environment, we have conducted reductions of our workforce during 2008 and 2009. A loss of key personnel or a substantial reduction in our workforce or material erosion of employee morale could have a material adverse effect on our business, particularly if the Chapter 11 Cases are protracted. Our ability to motivate and retain key employees is restricted by provisions of the Bankruptcy Code, which limit or prevent our ability to implement a retention program or take other measures intended to motivate key employees to remain with us throughout the pendency of the Chapter 11 Cases without Court approval. The loss of the services of any members of our senior management could impair our ability to execute our strategy and, as a result, could have a material adverse effect on our results of operations and financial condition.
We could be subject to claims made after the date that we filed for bankruptcy and other claims that are not discharged in the Chapter 11 Cases, which could have a material adverse effect on our results of operations and financial condition.
18
Table of Contents
We are currently subject to claims in various legal proceedings and may become subject to other legal proceedings in the future. Although we will seek to satisfy and discharge all claims made against us prior to the date of the bankruptcy filing (which claims are generally stayed during the Chapter 11 Cases), we may not be successful in doing so. Any claims arising after the date of our bankruptcy filing, and possible certain other claims that arose prior to the filing, may not be subject to discharge in the Chapter 11 Cases. The outcome of each of these claims, including our ability to have such claims satisfied and discharged in the Chapter 11 Cases, cannot, at this time, be determined, nor can the liability that may potentially result from a negative outcome be reasonably estimated presently for every case. The liability that we may ultimately incur with respect to any of these claims (in the event of a negative outcome) may be in excess of amounts that have currently been accrued with respect to such claims and, as a result, may have a material adverse effect on our results of operations and financial condition.
Risks Relating to Noncompliance with NASDAQ and SEC Requirements
NASDAQ has made a delisting determination with respect to our common shares, we are not presently in compliance with all applicable continued listing requirements or standards of the NASDAQ Global Select Market, and we are not listed on any other national securities exchange. It will likely be more difficult for stockholders and investors to sell our common shares or to obtain accurate quotations of the share price of our common shares.
As a result of our failure to timely file certain of our periodic reports with the SEC, on November 3, 2009, we received a delisting determination from NASDAQ and were also notified that trading in our common shares would be suspended effective on November 5, 2009. Although we timely appealed the Panel’s determination to the Listing Council, on January 15, 2010, the Listing Council notified the Company that it affirmed the Panel’s decision to delist the Company’s securities. On March 15, 2010, the Company received notification from the NASDAQ Board that it has declined to call for review the January 15, 2010 decision of the Listing Council. Accordingly, pursuant to Listing Rule 5825, the Listing Council’s decision represents the final decision of NASDAQ. In accordance with Listing Rule 5830 and Rule 12d2-2 under the Securities Exchange Act of 1934, NASDAQ filed an application on Form 25 with the SEC on April 5, 2010, to delist the Company’s securities from NASDAQ. The application will become effective ten days after filing.
In addition to our failure to timely file required periodic reports, we are not in compliance with certain other continued listing requirements of NASDAQ. For example, the NASDAQ rules require that, among other things, we maintain a minimum bid price of at least $1 per share. On September 16, 2009, we were notified by NASDAQ that the closing bid price per share of our common shares had been below $1 per share for thirty consecutive business days and, in accordance with applicable NASDAQ rules, we were given an exception until March 15, 2010 to regain compliance with the minimum bid price standard. The NASDAQ rules also require that we hold an annual shareholders meeting within twelve months of our fiscal year end. In connection with our previously mentioned appeal to the Listing Council, we notified NASDAQ that we were unable to hold an annual shareholders meeting in fiscal year 2009, as required, although we recently announced that a meeting date of April 30, 2010 has been set for the Company’s next annual shareholders meeting. In addition, the NASDAQ rules provide that NASDAQ has discretion to suspend or terminate the listing of a company that files for protection under the Bankruptcy Code. Each of the foregoing may have contributed to the Listing Council’s decision to affirm the Panel’s decision to delist our common shares. As a result of the NASDAQ delisting determination, the Company’s common shares are currently quoted on the Pink OTC Markets Inc., continuing under the trading symbol “GSIGQ.” Stocks trading on the over-the-counter market are typically less liquid than stocks that trade on a national securities exchange. Trading on the over-the-counter market may also negatively impact the trading price of our common shares. In addition, the liquidity of our common shares may be impaired, not only in the number of shares that are bought and sold, but also through delays in the timing of transactions, and coverage by security analysts and the news media, if any, of our Company. Stockholders may find it difficult to resell their shares of our common shares, due to the delisting proceedings and the likely effect of the Chapter 11 Cases on our common shares. The delisting of our common shares from NASDAQ may also result in other negative implications, including the potential loss of confidence by customers, strategic partners and employees, and loss of institutional investor interest in our common shares.
We recently discovered that we have inadvertently failed to file with the SEC a registration statement relating to securities issued under our 2006 Plan. As a result, we may have engaged in multiple issuances of duly authorized but unregistered securities and we may be subject to civil litigation, enforcement proceedings, fines, sanctions and/or penalties.
It has come to our attention that between March 2007 and March 2010, we inadvertently issued unregistered shares to fifty-two employees and directors under our 2006 Plan in an amount of approximately 773,037 common shares with a total fair market value at the date of issuance of approximately $3.9 million. These securities were also issued without an appropriate restrictive legend.
19
Table of Contents
Although we believed that we and our counsel at the time had filed the appropriate registration statement on Form S-8, it came to our attention during the preparation of this Annual Report on Form 10-K that a registration statement on Form S-8 or other appropriate form had not been filed and the issuances were not made pursuant to a valid exemption from the applicable federal and state securities laws. Accordingly, it may be determined that such issuances were not exempt from registration or qualification under federal and state securities laws, and we did not obtain the required registrations or qualifications. As a result, we may be subject to civil litigation, enforcement proceedings, fines, sanctions and/or penalties.
We may also be subject to claims by participants in the 2006 Plan for rescission of their acquisitions of common shares under the 2006 Plan under federal securities laws until the expiration of the applicable statute of limitations period, which is one year under federal law from the date of transaction. If applicable, such participants may have the right to rescind their purchases for an amount equal to the purchase price for the shares (or if the shares have been disposed of, claims for any damages with respect to any loss on such disposition) plus interest from the date of purchase. However, under applicable provisions of federal law (including section 510(b) of the Bankruptcy Code (11 U.S.C. § 510(b)), and in connection with our Chapter 11 Cases, if the proposed Plan is confirmed, the holders of any such damage claims and related rescission or other rights would, we believe, be entitled to receive a distribution under the Plan of common shares of the reorganized Company only. We believe that the most likely result is that any such claims, if allowed, would result in the holder receiving that quantity of common shares in the reorganized Company that are determined by a court to result in equal treatment of such claim holders and existing equity holders. Furthermore, rescission or damages claims of a shareholder who holds the above described unregistered shares, but receives new shares, as contemplated by the Plan, would be discharged upon the Company’s emergence from the bankruptcy proceedings. Such new shares would be issued pursuant to an exemption from registration under §1145 of the Bankruptcy Code and be freely tradable by holders who are not deemed to be underwriters.
We may be unable to timely file certain periodic reports with the SEC.
We did not timely file with the SEC this Annual Report or our Quarterly Report on Form 10-Q for the quarter ended September 26, 2008; our Annual Report on Form 10-K for the year ended December 31, 2009; nor our Quarterly Reports on Form 10-Q for each of the quarters ended April 3, 2009, July 3, 2009 and October 2, 2009. We may continue to be unable to timely file our annual and quarterly periodic reports with the SEC in the future. Following the commencement of the Chapter 11 Cases, our management has been particularly strained by the considerable attention required for administering the Chapter 11 Cases. In addition, due to the continuing demands on management’s time and attention in connection with the Chapter 11 Cases, as well as any attrition that we may experience in the future, we cannot make any assurances as to whether or when we will be able to complete and file our periodic reports in the future.
Also as a result of our delayed filings with the SEC, we will be ineligible to register our securities on Form S-3 for sale by us or resale by others until one year from the date the last delinquent filing is made. We may use Form S-1 to raise capital or complete acquisitions, but doing so could increase transaction costs and adversely impact our ability to raise capital or complete acquisitions of other companies in a timely manner.
Risks that are Derived from our Operations
The results of our operations could be adversely affected by economic and political conditions and the effects of these conditions on our customers’ businesses and level of business activity.
A large portion of our sales are dependent on the need for increased capacity or replacement of inefficient manufacturing processes, because of the capital-intensive nature of our customers’ businesses. These sales also tend to lag behind in an economic recovery longer than other businesses. There was a rapid softening of the economy and tightening of the financial markets in the second half of 2008 that continued into the first half of 2009. This slowing of the economy has reduced the financial capacity of our customers and possibly our potential customers, thereby slowing spending on the products and services we provide. If the current down turn lasts longer than expected, and if a recovery does not begin or if a new general economic slowdown commences, we may not be able to meet anticipated revenue levels on a quarterly or annual basis. A severe and/or prolonged economic downturn or a negative or uncertain political climate could adversely affect our customers’ financial condition and the timing or levels of business activity of our customers and the industries we serve. This may reduce the demand for our products or depress pricing for our products and have a material adverse effect on our results of operations. Changes in global economic conditions could also shift demand to products or services for which we do not have competitive advantages, and this could negatively affect the amount of business that we are able to obtain. In addition, if we are unable to successfully anticipate changing economic and political conditions, we may be unable to effectively plan for and respond to those changes, and our business could be negatively affected.
20
Table of Contents
Our business depends significantly upon capital expenditures which are subject to cyclical market fluctuations.
The semiconductor and electronics materials processing industries are cyclical and have historically experienced periods of oversupply, resulting in downturns in demand for capital equipment, including the products that we manufacture. The timing, length and severity of these cycles, and their impact on our business, are difficult to predict. Further, our order levels or results of operations for a given period may not be indicative of order levels or results of operations for subsequent periods. We cannot assure investors that demand for our products will increase or that demand will not decrease. For the foreseeable future, our operations will continue to depend upon industries that are subject to market cycles, which, in turn, could adversely affect the market for our products.
Cyclical variations may have the most pronounced effect on our Semiconductor Systems Segment, which concentrates in the semiconductor and electronics industries.
There is no assurance that we will not be impacted from continuation of the current economic slowdown or face future slowdowns as we have experienced in previous cyclical fluctuations or that the impact will be more or less significant compared to historical fluctuations.
Our business success depends upon our ability to respond to fluctuations in product demand.
If business declines, we may be required to reduce costs while at the same time maintaining the ability to motivate and retain key employees. We must also continually invest in research and development which may inhibit our ability to reduce costs in a down cycle. Additionally, long product lead-times create a risk that we may purchase or manufacture inventories of products that we are unable to sell. While we practice inventory management, we can offer no assurances that our efforts to mitigate this risk will be successful.
During a period of increasing demand and rapid growth, we must be able to increase manufacturing capacity quickly.
Our inability to quickly increase production in response to a surge in demand could prompt customers to look for alternative sources of supply or leave our customers without a supply, both of which events could harm our reputation and make it difficult for us to retain our existing customers or to obtain new customers.
The success of our business requires that we continually innovate.
Technology requirements in our markets are consistently advancing. We must continually introduce new products that meet evolving customer needs. Our ability to grow depends on the successful development, introduction and market acceptance of new or enhanced products that address our customer’s requirements. Developing new technology is a complex and uncertain process requiring us to accurately anticipate technological and market trends and meet those trends with responsive products. Additionally, this requires that we manage the transition from older products to minimize disruption in customer ordering patterns, avoid excess inventory and ensure adequate supplies of new products. Failed market acceptance of new products or problems associated with new product transitions could harm our business.
Delays in delivery of new products could have a negative impact on our business.
Our research and development efforts may not lead to the successful introduction of products within the time period our customers demand. Our competitors may introduce new or improved products, processes or technologies that make our current or proposed products obsolete or less competitive. We may encounter delays or problems in connection with our research and development efforts. Product development delays may result from numerous factors, including:
| • | changing product specifications and customer requirements; |
| • | the inability to manufacture products cost effectively; |
| • | difficulties in reallocating engineering resources and overcoming resource limitations; |
| • | changing market or competitive product requirements; and |
| • | unanticipated engineering complexities. |
21
Table of Contents
New products often take longer to develop, have fewer features than originally considered desirable and achieve higher cost targets than initially estimated. There may be delays in starting volume production of new products and/or new products may not be commercially successful.
Our quarterly results of operations may fluctuate in the future. As a result, we may fail to meet or exceed the expectations of securities analysts or investors, which could cause our stock price to decline.
We sell a relatively small number of high revenue semiconductor systems within any period. These systems are complex and may have multiple elements for customer delivery including overall systems, spare parts, extended warranties, installation and training and may be subject to customer acceptance criteria. In certain transactions, we recognize all or a portion of revenue upon shipment provided title and risk of loss has passed to the customer, evidence of an arrangement exists, fees are contractually fixed or determinable, collectability is reasonably assured through historical collection results and regular credit evaluations, and there are no uncertainties regarding the receipt or timing of customer acceptance. As a result, it is often difficult to project the timing of product revenue recognition. Consequently, our revenue and financial results could vary significantly from expectations in a particular quarter if anticipated orders from even a few customers are not received and fulfilled in time to satisfy customer obligations to the extent necessary to permit revenue to be recognized under generally accepted accounting principles. In addition, our product order backlog at the beginning of each quarter may not include all systems needed to achieve expected revenues for that quarter. Because we may build systems according to forecast, the absence of a significant backlog for an extended period of time could adversely affect financial results.
22
Table of Contents
Customer order timing and other factors beyond our control may lead to an inability to meet our financial forecasts.
Changes in customer order timing and the existence of certain other factors beyond our control may lead to our inability to meet financial forecasts. Such factors include:
| • | fluctuations in our customers’ businesses; |
| • | timing and recognition of revenues from customer orders; |
| • | timing and market acceptance of new products or enhancements introduced by us or our competitors; |
| • | availability of parts from our suppliers and the manufacturing capacity of our subcontractors; |
| • | timing and level of expenditures for sales, marketing and product development; |
| • | changes in the prices of our products or of our competitors’ products; and |
| • | fluctuations in exchange rates for foreign currency. |
A large percentage of our sales come from products with high selling prices and significant lead times. We may receive several large orders in one quarter from a customer and then receive no orders from that customer in the next quarter. As a result, the timing and recognition of sales from customer orders can cause significant fluctuations in our operating results from quarter to quarter.
A delay in a shipment or failure to meet our revenue recognition criteria near the end of a reporting period due, for example, to rescheduling or cancellations by customers or to unexpected difficulties experienced by us, may cause sales in the period to fall significantly below expectations and may have materially adverse effects on our operations for that period. Our inability to adjust quickly enough could magnify the adverse effects of that revenue shortfall on our results of operations.
As a result of these factors, our results of operations for any quarter are not necessarily indicative of results to be expected in future periods. We believe that fluctuations in quarterly results may cause the market prices of our common shares to fluctuate, perhaps substantially.
Our director and officer liability insurance may not cover the Company’s exposure in the securities class action litigation.
During the last several months, the parties have been in settlement discussions and the parties have reached an agreement in principle to settle the securities class action lawsuit. The agreement in principle contemplates that the Company’s insurance carrier will contribute to the settlement. The total settlement amount is well within the Company’s insurance policy limits; the Company’s contribution to the settlement amount would be minimal and reflects the balance of the company’s self-insured retention. The agreement in principle is subject to a number of contingencies including confirmatory discovery by the Lead Plaintiff, after which Lead Plaintiff may affirm or void the agreement in principle, preliminary and final approval by the District Court, and to the extent required by law, approval by the Bankruptcy Court. If the agreement in principle is not finalized, there are no assurances that any future settlement or judgment will either be covered by the Company’s liability insurance policies or fall within their limits.
Our effective tax rates are subject to fluctuation, which could impact our financial position, and our estimates of tax liabilities may be subject to audit, which could result in additional tax assessments.
Our effective tax rates are subject to fluctuation as the income tax rates for each year are a function of taxable income levels in numerous tax jurisdictions, our ability to utilize recorded deferred tax assets, taxes or penalties resulting from tax audits and credits and deductions as a percentage of total taxable income. Further, tax law changes may cause our effective tax rates to fluctuate between periods.
23
Table of Contents
We maintain significant cash balances, and in the past we have maintained and may in the future maintain foreign exchange contracts, where significant changes in interest rates, credit ratings or foreign currency rates could result in materially adverse effects to income.
These balances create financial exposure to changing interest and currency rates. We have attempted to mitigate these risks by, in the past and possibly in the future, purchasing foreign exchange contracts, and by investing in United States government issued treasury bills. However, if long term interest rates or foreign currency rates were to change rapidly, we could incur material losses. Further, if management chooses to invest in less risk adverse investment vehicles, the risk of losing principal and/or interest could increase.
Our investments in auction rate securities are subject to risks which may cause losses and affect the liquidity of these investments.
As of December 31, 2008, we held auction rate securities, recorded at a fair value of $25.1 million, and with a par value of $32.3 million. These securities were acquired as part of our purchase of Excel in 2008. Auctions for some of these auction rate securities have failed, and there is no assurance that auctions on the remaining auction rate securities in our investment portfolio will succeed in the future. An auction failure means that the parties wishing to sell their securities could not do so. As a result, our ability to liquidate and fully recover the carrying value of our auction rate securities in the near term may be limited or not exist. The uncertainties in the credit markets have prevented us and other investors from liquidating holdings of auction rate securities at times when we, or other investors, would have chosen to do so.
We have had some success in liquidating these holdings during 2009. Of the $32.3 million in par value securities that we held as of December 31, 2008, we sold $19.3 million of the securities, and recorded net realized gains on our sales of these securities. As of December 31, 2009, we continue to hold remaining securities with a par value of $13.0 million. If the credit ratings of the issuer, the bond insurers or the collateral deteriorate further, or if the issuers of these auction rate securities are unable to successfully close future auctions, we may further reduce the carrying value of these investments and may in the future be required to record impairment charges against these investments, some of which may be considered other-than-temporary impairment charges. We may be required to wait until market stability is restored for these instruments or until the final maturity of the underlying notes (up to 30 years) to recover our investment.
International operations are an expanding part of our business and our operations in foreign countries subject us to risks not faced by companies operating exclusively in the United States.
During the year ended December 31, 2008, 69.3% of our revenue was derived from operations outside of the United States. The scope of our international operations subjects us to risks which could materially impact our results of operations including:
| • | foreign exchange rate fluctuations; |
| • | social unrest in countries where we operate; |
| • | climatic or other natural disasters in regions where we operate; |
| • | increases in shipping costs or increases in fuel costs; |
| • | longer payment cycles; |
| • | acts of terrorism; |
| • | greater difficulty in collecting accounts receivable; |
| • | use of incompatible systems and equipment; |
| • | problems staffing and managing foreign operations in diverse cultures; |
| • | protective tariffs; |
24
Table of Contents
| • | trade barriers and export/import controls; |
| • | transportation delays and interruptions; |
| • | reduced protection for intellectual property rights in some countries; and |
| • | the impact of recessionary foreign economies. |
We cannot predict whether the United States or any other country will impose new quotas, tariffs, taxes or other trade barriers upon the importation of our products or supplies or gauge the effect that new barriers would have on our financial position or results of operations.
There are inherent risks as we increase our focus on overseas operations.
We manufacture certain products in plants in the United Kingdom and China. Manufacturing in overseas locations creates risks, including the possibility that as operations are transferred or expanded in foreign locations we may not be able to produce products to the quality standards or deliver products on time as our customers have come to expect. This possibility may come about due to an inability to find qualified personnel overseas. It is also possible that after an overseas transition, we may find that we have been producing products with latent defects that come to light only after a long period of operation. Transitioning a business to an overseas location has many additional risks such as developing solid financial, enterprise resource planning (ERP) and customer relationship management (CRM) systems.
Economic, political or trade problems with foreign countries could negatively impact our business.
We are increasingly outsourcing the manufacture of sub assemblies to suppliers based in China and elsewhere overseas. Economic, political or trade problems with foreign countries could substantially impact our ability to obtain critical parts needed in the timely manufacture of our products.
Customs rules are complex and vary within legal jurisdictions in which we operate. Failure to comply with local customs regulations could be discovered during a foreign government customs audit that may produce a substantial penalty.
Customs rules are complex and vary within legal jurisdictions in which we operate and there can be no assurance that there will be no control failure around customs enforcement despite the precautions we take. A failure with local customs regulations could be discovered during a foreign government customs audit and could result in a substantial penalty and a material impact on our financial results. We seek to mitigate this risk by maintaining export control systems and an internal customs staff charged with the responsibility of strictly complying with all applicable import/export laws. Further, we attempt to maintain arms length transactions with our foreign subsidiaries and their customers.
We have a history of operating losses and we may not be able to sustain or grow the current level of profitability.
We incurred operating losses on an annual basis from 1998 through 2003 and again in 2008. No assurances can be given that we will sustain or increase the level of profitability in the future based on extrinsic market forces, and the market price of our common shares may decline as a result.
Our Ability to Utilize Our Net Operating Loss Carryforwards and Other Tax Attributes will be Limited as a Result of Our Plan of Reorganization and is Dependent on Our Ability to Generate Sufficient Future Taxable Income.
We have significant net operating loss carryforwards (“NOLs”) and other tax attributes. Section 382 of the Internal Revenue Code of 1986, as amended, limits a corporation’s ability to utilize NOLs and other tax attributes following a Section 382 ownership change. We expect that we will undergo a Section 382 ownership change upon the implementation of our Plan of Reorganization and, consequently, our ability to utilize our NOLs and other tax attributes will be limited. In order to prevent an “ownership change” during our Chapter 11 proceedings, the Bankruptcy Court has entered an order that places certain restrictions on trading in our common shares. However, despite the order, we can provide no assurances that an “ownership change” has not or will not occur prior to emergence. Such a change prior to emergence could further limit our ability to utilize our NOL carryforwards. A significant limitation in our ability to utilize our NOL carryforwards could have a negative impact on our financial results.
25
Table of Contents
In addition, our ability to use future tax deductions is dependant on our ability to generate sufficient future taxable income in the U.S. In determining our provision for income taxes, our tax attributes and liabilities and any valuation allowance recorded against our net tax attributes require subjective judgment and analysis. We consistently evaluate our tax attributes based on tax recoverable in the carryback period, existing deferred tax liabilities, tax planning strategies and future taxable income. Although we anticipate using certain of our tax attributes to generate tax refunds from prior years, our ability to recover all our tax attributes in certain jurisdictions depends upon our ability to continue to generate future profits. If actual results differ from our plans or we do not achieve the desired level of profitability in a given jurisdiction, we may be required to increase the valuation allowance on our tax attributes by taking a charge to the statement of operations, which could have a material negative result on our financial results.
Our reliance upon third party distribution channels subjects us to credit, inventory, business concentration and business failure risks beyond our control.
We sell products through resellers, distributors, original equipment manufacturers (“OEMs”) and system integrators. We sell certain lasers through a 50% owned Indian joint venture. The holder of the other 50% of the joint venture is not a related party. Selling products through third parties can subject us to credit and business risks. Our sales also depend upon the ability of our OEM customers to develop and sell systems that incorporate our products. Adverse economic conditions, large inventory positions, limited marketing resources and other factors influencing these OEM customers could have a substantial impact upon our financial results. We can not assure investors that our OEM customers will not experience financial or other difficulties that could adversely affect their operations and, in turn, our financial condition or results of operations.
We are exposed to the credit risk of some of our customers and to credit exposures in weakened markets, which could result in material losses.
Customers with liquidity issues may lead to additional bad debt expense. We monitor individual customer payment capability in granting open credit arrangements, and seek to limit such open credit to amounts we believe our customers can pay, and we maintain reserves we believe are adequate to cover exposure for doubtful accounts. However, there can be no assurance that our open credit customers will pay the amounts they owe to us or that the reserves we maintain will be adequate to cover such credit exposure. Our customers’ failure to pay and/or our failure to maintain sufficient reserves could have a material adverse effect on our operating results and financial condition.
In addition, to the extent that the ongoing turmoil in the credit markets makes it more difficult for some customers to obtain financing, those customers’ ability to pay may be adversely impacted, which in turn could have a material adverse effect on our business, operating results and financial condition.
While we generally sell a portion of our sales directly to customers future sales may be derived through distributors. As distributors tend to have more limited financial resources than original equipment manufacturers (“OEM”) and end-user customers, they generally represent sources of increased credit risk. Additionally, in the event that the ongoing turmoil in the credit markets makes it more difficult for some customers to obtain financing, those customers’ ability to pay could be adversely impacted, which in turn could have a material adverse impact on our business, operating results and financial condition.
We are exposed to the risks that others may violate our intellectual property rights.
Our future success depends in part upon our intellectual property rights, including trade secrets, know-how and continuing technological innovation. There can be no assurance that the steps we take to protect our intellectual property rights will be adequate to prevent misappropriation, or that others will not develop competitive technologies or products outside of our patented property. There can be no assurance that other companies are not investigating or developing other technologies that are similar to ours, that any patents will issue from any application filed by us or that, if patents do issue, the claims allowed will be sufficiently broad to deter or prohibit others from marketing similar products. In addition, there can be no assurance that any patents issued to us will not be challenged, invalidated or circumvented in a legal or administrative proceeding, or that our patents and know how will provide a competitive advantage to us.
26
Table of Contents
Our intellectual property rights may not be protected in foreign countries.
Our efforts to protect our intellectual property rights may not be effective in some foreign countries where we operate or sell. Many U.S. companies have encountered substantial problems in protecting their property rights against infringement in foreign countries. If we fail to adequately protect our intellectual property in these countries, it could be easier for our competitors to sell competing products in foreign countries.
Our success depends upon our ability to protect our intellectual property and to successfully defend against claims of infringement by third parties.
We have received in the past, and could receive in the future, notices from third parties alleging that our products infringe patent or other proprietary rights. We believe that our products are non-infringing or that we have the patents and/or licenses to allow us to lawfully sell our products throughout the world. However, we may be sued for infringement. In the event any third party makes a valid claim against us or our customers for which a license was not available to us on commercially reasonable terms, we would be adversely affected. Adverse consequences may also apply to our failure to avoid litigation for infringement or misappropriation of proprietary rights of third parties.
We operate in highly competitive industries, and if we lose competitive advantages, our business would suffer adverse consequences.
Some of our competition comes from established competitors, some of which have greater financial, engineering, manufacturing and marketing resources than we do. Our competitors will continue to improve the design and performance of their products and introduce new products. It is possible that we may not successfully differentiate our current and proposed products from the products of our competitors, or that the marketplace will not consider our products to be superior to competing products. To remain competitive, we will be required to invest heavily in research and development, marketing and customer service and support. It is also possible that we may not be able to make the technological advances necessary to maintain our competitive position, or our products will not receive market acceptance. We may not be able to compete successfully in the future, and increased competition may result in price reductions, reduced profit margins, loss of market share and an inability to generate cash flows that are sufficient to maintain or expand our development of new products.
Our business strategy includes finding and making strategic acquisitions and divestitures. There can be no assurance that we will be able to continue to make acquisitions or divestitures that provide business benefit.
We acquired an optics business in the United Kingdom in 2007, we completed our acquisition of Excel in August 2008 and we sold our U.S. Optics Business in October 2008. We expect to continue to evaluate potential acquisitions and divestitures as part of our long-term strategic plan. Our identification of suitable acquisition candidates involves risks inherent in assessing the values, strengths, weaknesses, risks, synergy and profitability of acquisition candidates, including the effects of the possible acquisition on our business, diversion of management’s attention from our core businesses and risks associated with unanticipated problems or liabilities. We cannot assure investors our efforts will be sufficient, or that acquisition candidates will be receptive to our advances or that any acquisition we may make would be accretive to earnings. We also cannot assure investors that we will find suitable purchasers in the event that we identify a potential divestiture candidate in the future. Further, given our significant debt and inability to use Form S-3, we may have difficulty obtaining financing for such strategic acquisitions.
We may fail to successfully complete the integration of Excel into our business and, as a result, may fail to realize the synergies, cost savings and other benefits expected from the acquisition. Further, Excel’s performance has not been in accordance with our expectations, which has had, and could continue to have a material adverse effect on our financial condition.
We may fail to successfully complete the integration of Excel into our business and, as a result, may fail to realize the synergies, cost savings and other benefits expected from the acquisition. The revenue we expected from Excel did not materialize in 2008, which contributed significantly to the impairment charge we recorded in 2008. We may continue to fail to grow and build revenues and profits in Excel’s business lines or achieve sufficient cost savings through the integration of customers or administrative and other operational activities. Furthermore, we must achieve these objectives without adversely affecting our revenues. If we are not able to successfully achieve these objectives, the anticipated benefits of the acquisition may not be realized fully or at all, or it may take longer to realize them than expected, and our results of operations could be materially adversely affected.
27
Table of Contents
Further, our ability to maintain and increase profitability of Excel’s business lines will depend on our ability to manage and control operating expenses and to generate and sustain increased levels of revenue. Our expectations to achieve more consistent and predictable levels of revenue and to increase Excel’s profitability may not be realized, and such revenues and profitability may decline as we integrate Excel’s operations into our business. If Excel’s revenues grow more slowly than we anticipate, or if its operating expenses are higher than we expect, we may not be able to sustain or increase its profitability, in which case our financial condition will suffer and our stock price could decline. For example, as discussed in Note 6 of Notes to Consolidated Financial Statements, in 2008, we experienced decreased performance relative to our expectations for our acquisition of Excel. The decreased performance contributed to our having recorded a significant impairment charge against the value of assets that were initially attributed to the goodwill, intangible assets and other long-lived assets of Excel. Should there be continued deterioration in Excel’s performance, future impairment changes may be required to be recorded.
We continue our leadership transition, which could have a material effect on our business.
We continuously review our management, business and organizational structures. There are risks associated with changes in strategy and management at the executive and/or director level, and changes in product or operational focus. During 2008, and in early 2009, we experienced significant turnover in our management team, including our Chief Financial Officer, our General Counsel and certain senior members of our various segments or operating groups. There can be no assurance that any of the anticipated or other prospective management changes will not have a negative material effect on the Company.
Our operations could be negatively affected if we lose key executives or employees or are unable to attract and retain skilled executives and employees as needed.
Our business and future operating results depend in part upon our ability to attract and retain qualified management, technical, sales and support personnel for our operations on a worldwide basis. The loss of key personnel could negatively impact our operations. Competition for qualified personnel is intense and we cannot guarantee that we will be able to continue to attract, train and retain qualified personnel.
The Company conducted an internal review of potential issues related to the Foreign Corrupt Practices Act and voluntarily shared information relating to that review with the SEC in the third quarter of 2009. These matters could have a material adverse effect on us. Further, our reputation and our ability to do business may be impaired by improper conduct by any of our employees, agents or business partners.
During the Revenue Review, the Audit Committee and its advisors identified certain potential issues related to the Foreign Corrupt Practices Act (“FCPA”), in particular in China, and referred those issues to the Company for review. With the assistance of outside legal counsel, the Company conducted and completed an internal review of those potential issues and voluntarily shared information relating to the internal review with the SEC in the third quarter of 2009. While we have not received any further requests from the SEC on this internal FCPA review, we cannot predict whether the SEC will request any further information from the Company regarding the internal FCPA review or whether the SEC will take any other action.
Additionally, we cannot provide assurance that our internal controls will always protect us from reckless or criminal acts committed by our employees, agents or business partners that would violate US and/or non-US laws, including the laws governing payments to government officials, competition, money laundering and data privacy. Any such improper actions could subject us to civil or criminal investigations in the US and in other jurisdictions, and could lead to substantial civil or criminal, monetary and non monetary penalties against us or our subsidiaries. Following the aforementioned internal review, we updated our FCPA compliance policies and enhanced our FCPA training program.
We have undertaken restructuring activities, and we will continue to assess our operating structure.
Our ability to reduce operating expenses is dependent upon the nature of the actions we take to reduce expense and subsequent ability to implement those actions and realize expected cost savings. For example, in the past years we shifted certain of our operations in the United States and United Kingdom to China to reduce expenses. We have undertaken actions to consolidate redundant or excess personnel that have arisen due to our acquisition of Excel in August 2008, and due to the contracting demand for certain of our products due to the global economic slowdown. We have also divested of other businesses. There can be no assurance that these actions will provide us economic benefit. Further, there is a risk that these actions may ultimately prove detrimental to operations and sales, or to our intellectual property protections.
28
Table of Contents
We expect to be consolidating some of our operations for greater efficiency.
There is execution risk in these plans. We can not assure investors that economies of scale will or can be realized as a result of any historic or planned restructuring activities. These actions will take time and will include substantial operational risks, including the possible disruption of manufacturing lines. We can not assure investors that any moves would not disrupt business operations or have a material impact on results.
In addition, any decision to limit investment in, dispose of or otherwise exit business activities may result in the recording of special charges, such as technology write-offs, workforce reduction costs, charges relating to consolidation of excess facilities, or a loss on the sale of assets. Our estimates with respect to the useful life or ultimate recoverability of our carrying basis of assets, including intangible assets, could change as a result of such decisions. Further, our estimates related to the liabilities for excess facilities are affected by changes in real estate market conditions. Our December 2008 assessment of the carrying value of goodwill and intangible assets resulted in substantial write downs. Additionally, we are required to perform goodwill impairment tests on an annual basis and during the year in certain circumstances. There can be no assurance that future goodwill and intangible assets impairment tests will not result in a change to earnings.
Product defects or problems with integrating our products with other vendors’ products may seriously harm our business and reputation.
Complex products that we produce can contain latent errors or performance problems. There have been instances where we have found errors immediately after launch of new products, and there have been instances where we have also found latent errors in our products. We cannot always resolve errors that we believe would be considered serious by our customers before implementation, thus our products are not error-free. These errors or performance problems could be detrimental to our business and reputation. In addition, customers frequently integrate our products with other vendor’s products. When problems occur in a combined environment, it may be difficult to identify the source of the problem. These problems may cause us to incur significant warranty and repair costs, divert the attention of our engineering personnel from our product development efforts and cause significant customer relations problems. These problems may also complicate our determination of the timing and amount of revenue recognition. To date, defects in our products or those of other vendors’ products with which our products are used by our customers have not had a material negative effect on our business relationships with our customers. However, we cannot be certain that a material negative impact will not occur in the future.
We depend on limited source suppliers that could cause substantial manufacturing delays if supply disruption occurs.
Many of our products are manufactured with components that are designed by an outside supplier. While we attempt to mitigate risks associated with our reliance on single suppliers by actively managing our supply chain, we still source some components from single vendors. We also rely on a limited number of independent contractors to manufacture subassemblies for some of our products, particularly in our Semiconductor Systems. There can be no assurance that our current or alternative sources will be able to continue to meet all of our demands on a timely basis. If suppliers or subcontractors experience difficulties, or fail to meet any of our manufacturing requirements, our business would be harmed until we are able to secure alternative sources, if any, on commercially reasonable terms.
We also depend on suppliers that provide high precision parts.
Any such parts that have latent or known defects, may materially impact relations with our customers if they cause us to miss our scheduled shipment deadlines. If latent defects are incorporated into our products and discovered later, there could be a material impact on our revenues. We seek to reduce the risk of defects by selecting and qualifying alternative suppliers for key parts, and by monitoring the quality of products coming from key suppliers.
Production difficulties and product delivery delays could materially adversely affect our business.
We assemble our products at our facilities in the United States, the United Kingdom and China. If use of any of our manufacturing facilities were interrupted by a natural disaster or otherwise, our operations could be negatively impacted until we could establish alternative production and service operations. In addition, we may experience production difficulties and product delivery delays in the future as a result of:
| • | mistakes made while transferring manufacturing processes between locations; |
29
Table of Contents
| • | changing process technologies; |
| • | ramping production; |
| • | installing new equipment at our manufacturing facilities; and |
| • | shortage of key components. |
Increased governmental regulation of our business could materially adversely affect us.
We are subject to many governmental regulations, including but not limited to the laser radiation safety regulations of the Radiation Control for Health and Safety Act administered by the National Center for Devices and Radiological Health, a branch of the United States Food and Drug Administration, and certain health regulations related to the manufacture of products using beryllium, an element used in some of our structures and mirrors. Among other things, these regulations require us to file annual reports, to maintain quality control and sales records, to perform product testing, to distribute appropriate operating manuals, to incorporate design and operating features in products sold to end-users and to certify and label our products. Various warning labels must be affixed and certain protective devices installed depending on the class of product. We are subject to regulatory oversight, including comparable enforcement remedies, in the markets we serve.
Changes in governmental regulations may reduce demand for our products or increase our expenses.
We compete in many markets in which we and our customers must comply with federal, state, local and international regulations, such as environmental, health and safety and food and drug regulations. We develop, configure and market our products to meet customer needs created by those regulations. Any significant change in regulations could reduce demand for our products, which in turn could materially adversely affect our business, operating results and financial condition.
We may require additional capital to support business growth, and this capital may not be available on acceptable terms or at all.
We may require additional funds to respond to business challenges, including the need to develop new products or enhance our existing products, enhance our operating infrastructure and acquire complementary businesses and technologies. Accordingly, we may need to engage in equity or debt financings to secure additional funds. If we raise additional funds through further issuances of equity or convertible debt securities, our existing stockholders could suffer significant dilution, and any new equity securities we issue could have rights, preferences and privileges superior to those of holders of our common shares. Further, our existing Senior Notes may restrict or impede our ability to obtain additional debt financing. Any debt financing secured by us in the future could include restrictive covenants relating to our capital raising activities and other financial and operational matters, which may make it more difficult for us to obtain additional capital and to pursue business opportunities, including potential acquisitions. In addition, we may not be able to obtain additional financing on terms favorable to us or at all. If we are unable to obtain adequate financing or financing on terms satisfactory to us when we require it, our ability to continue to support our business growth and to respond to business challenges could be significantly limited. In addition, the terms of any additional equity or debt issuances may adversely affect the value and price of our common shares.
Due to the prevailing global economic conditions that largely began in 2008, many businesses do not have access to the capital markets on acceptable terms. In addition, as a result of this global credit market crisis, conditions for acquisition activities have become very difficult as tight global credit conditions have adversely affected the ability of potential buyers to finance acquisitions. Although these conditions have not immediately affected our current plans, these adverse conditions are not likely to improve significantly in the near future and could have a negative impact on our ability to execute on future strategic activities.
Risks that Relate to Our Common Shares
Trading in our securities during the pendency of the Chapter 11 Cases is highly speculative and poses substantial risks. If our “pre-arranged” Plan of reorganization that we filed is confirmed by the Court, our common shares will be heavily diluted. If our Plan of reorganization is not confirmed by the Court, we may be unable to come to terms with the holders of our Senior Notes, and holders of such common shares likely will not receive any distribution with respect to, or be able to recover any portion of, such investment.
30
Table of Contents
If our Plan of reorganization is confirmed by the Court, our common shares will be heavily diluted. If our Plan of reorganization is not confirmed by the Court, an alternative plan of reorganization could be approved by the Court, resulting in more or less dilution compared with the Company’s proposed Plan or as a result of which our common shares could be cancelled upon the approval of the Court and if that were to occur the holders thereof would not be entitled to receive, and would not receive or retain, any property or interest in property on account of such common shares. Trading prices are very volatile and frequently bear no relationship to the expected recovery by the holders of such securities in Chapter 11 reorganization proceedings. Accordingly, we urge that extreme caution be exercised with respect to existing and future investments in our equity securities and any of our other securities.
Holders of our common shares are subject to the risk of additional and substantial dilution to their interests as a result of future issuances of common shares.
In the future, we may issue additional equity securities to raise capital or restructure our existing debt and our stock option holders may exercise all or some of the options that are outstanding or may be outstanding. These additional issuances would dilute existing share ownership.
Future sales of a substantial number of our common shares in the public market could adversely affect the trading price of our shares and impair our ability to raise funds in future stock offerings.
Future sales of a substantial number of our common shares in the public market or the perception that such sales could occur, could adversely affect the prevailing market price of our common shares and could make it more difficult for us to raise additional capital through the sale of equity securities.
The market price of our common shares has been and may continue to be subject to wide fluctuations, and this may make it difficult for you to resell the common shares when you choose to or at prices you find attractive.
Our stock price historically has been, and may continue to be, volatile. Various factors contribute to the volatility of the stock price, including:
| • | the current general economic downturn and any future general economic downturns that impacts the purchasing decisions of our significant customers or the timing and size of their orders; |
| • | fluctuation in demand for our products and the timing and size of customer orders; |
| • | the cancellation or deferral of existing customer orders or the renegotiation of existing contractual commitments; |
| • | the length and variability of the sales cycle for our products; |
| • | changes in our pricing policies, the pricing policies of our competitors and the prices of the components of our products; |
| • | our ability to develop, introduce and ship new products and product enhancements that meet customer requirements in a timely manner; |
| • | the mix of product configurations sold; |
| • | our ability to attain and maintain production volumes and quality levels for our products; |
| • | costs related to acquisitions of complementary products, technologies or businesses; |
| • | corporate restructurings, including layoffs; |
31
Table of Contents
| • | the timing of revenue recognition and the application of complex revenue recognition accounting rules to our customer arrangements; |
| • | announcements of quarterly operating results and revenue and earnings forecasts by us, our competitors or our customers; |
| • | failure to achieve financial forecasts, either because expected sales do not occur or because they occur at lower prices or on terms that are less favorable to us; |
| • | rumors, announcements or press articles regarding changes in our management, organization, operations or prior financial statements; |
| • | changes in revenue and earnings estimates by securities analysts; |
| • | announcements of planned acquisitions by us or by our competitors; |
| • | announcements of new or planned products and enhancements by us, our competitors or our customers; |
| • | gain or loss of a significant customer; |
| • | our involvement in legal proceedings and the entry of judgments or decisions adverse to us; |
| • | inquiries and/or proceedings by the SEC, NASDAQ, law enforcement or other regulatory bodies; and |
| • | acts of terrorism and the threat of war. |
While we cannot predict the individual effect that these factors may have on the market price of our common shares, these factors, either individually or in the aggregate, could result in significant volatility in our stock price during any given period of time. Additionally, the stock market has recently experienced extreme price volatility, which has adversely affected and may continue to adversely affect the market price of our common shares for reasons unrelated to our business or operating results.
Our directors, executive officers and each of our greater than 5% stockholders and their affiliates have substantial control over the outstanding shares of our common shares, which could limit your ability to influence the outcome of key transactions, including a change of control.
Our directors, executive officers and each of our greater than 5% stockholders and their affiliates, in the aggregate, together beneficially own a substantial amount of the outstanding shares of our common shares. As a result, these stockholders, if acting together, may be able to influence or control matters requiring approval by our stockholders, including the election of directors and the approval of mergers, acquisitions or other extraordinary transactions. They may have interests that differ from yours and may vote in a way with which you disagree and which may be adverse to your interests. This concentration of ownership may have the effect of delaying, preventing or deterring a change of control of our company, could deprive our stockholders of an opportunity to receive a premium for their common shares as part of a sale of our company and might affect the market price of our common shares.
Certain provisions of our articles of incorporation may delay or prevent a change in control of our company.
Our corporate documents and our existence as a corporation under the laws of New Brunswick subject us to provisions of Canadian law that may enable our Board of Directors to resist a change in control of our company. These provisions include:
| • | limitations on persons authorized to call a special meeting of stockholders; |
| • | advance notice procedures required for stockholders to nominate candidates for election as directors or to bring matters before an annual meeting of stockholders; and |
32
Table of Contents
| • | a shareholder rights plan. |
These anti-takeover defenses could discourage, delay or prevent a transaction involving a change in control of our company. The transactions contemplated by our Plan in the Chapter 11 Cases will not trigger our existing shareholder rights plan. These provisions could also discourage proxy contests and make it more difficult for stockholders to elect directors of their choosing and cause us to take other corporate actions that stockholders desire.
| Item 1B. | Unresolved Staff Comments |
Not applicable.
33
Table of Contents
| Item 2. | Properties |
The principal owned and leased properties of the Company and its subsidiaries are listed in the table below.
| Location |
Principal Use |
Current Segment (a) |
Approximate Square Feet |
Owned/Leased | ||||
| Facilities | ||||||||
| Bedford, Massachusetts, USA | Manufacturing, R&D, Marketing, Sales and Administrative | 1,2,4 | 147,000 | Leased; expires in 2013. | ||||
| Rugby, United Kingdom (b) | Manufacturing, R&D, Marketing, Sales and Administrative | 1 | 113,000 | Owned and partially leased to third parties. | ||||
| Poole, United Kingdom (c) | Manufacturing, R&D, Marketing, Sales and Administrative | 1 | 88,000 (two sites) |
2 units owned; 2 units with land leases through 2073 and 2078 | ||||
| Orlando, Florida, USA | Manufacturing, R&D, Marketing, Sales and Administrative | 3 | 80,000 | Owned | ||||
| East Setauket, New York, USA | Manufacturing, R&D, Marketing, Sales and Administrative | 3 | 65,000 | Owned | ||||
| Mukilteo, Washington, USA | Manufacturing, R&D, Marketing, Sales and Administrative | 3 | 63,000 | Owned | ||||
| Suzhou, People’s Republic of China | Manufacturing, R&D, Marketing, Sales and Administrative | 1 | 55,000 | Leased; expires in 2011 | ||||
| Santa Clara, California, USA | Manufacturing, Marketing, Sales and Administrative | 3 | 44,388 | Leased; expires in 2010 | ||||
| Lexington, Massachusetts, USA | Manufacturing, Marketing, Sales and Administrative | 3 | 33,339 | Leased; expires in 2016 | ||||
| Ludwigsburg, Germany | Manufacturing, R&D, Marketing, Sales and Administrative | 3 | 22,500 | Leased; expires in 2011 | ||||
| Chatsworth, California, USA | Manufacturing, R&D, Marketing, Sales and Administrative | 3 | 22,000 | Owned | ||||
| Taunton, United Kingdom | Manufacturing, R&D, Marketing and Sales | 1 | 19,000 | Leased; expires in 2017 | ||||
| Mumbai, India | Service, R&D, Sales and Administrative | 3 | 16,769 | Owned | ||||
| Oxnard, California, USA | Manufacturing and Administrative | 3 | 14,000 | Leased; expires in 2014 | ||||
| (a) | The facilities house product lines that belong to the following segments: |
1 — Precision Technology Segment
2 — Semiconductor Systems Segment
3 — Excel Segment
4 — Corporate
| (b) | At December 31, 2008, the Rugby, U.K. building is classified as an asset available for sale. This property was sold in October 2009 for approximately $3.6 million. Prior to the property being sold, approximately 14% of the space had been leased to third parties. |
| (c) | At December 31, 2008, one of the two Poole, U.K. buildings was classified as an asset available for sale. This property constitutes 37,000 square feet of space. This property was sold in February 2009, for approximately $0.5 million. |
34
Table of Contents
Additional research and development, sales, service and logistics sites are located in California, Colorado, United Kingdom, Germany, France, Italy, Japan, Korea, Taiwan, China, Malaysia and Sri Lanka. These additional offices are in leased facilities occupying approximately 83,000 square feet in the aggregate.
A portion of the Company’s leased facility in Bedford, Massachusetts, and its owned facility in Orlando, Florida are currently underutilized. The Company leases a 29,000 square foot building in Munich, Germany. However, as a result of prior year restructuring activities, this building had more space than the Company needed in this location and in 2007 this building was fully sublet through the end of the lease in 2013. The Company also leases 13,000 square feet of space in Novi, Michigan. However, as a result of a 2008 restructuring activity, this space was abandoned, and is also being sublet. The Company continues to pay for this space in Novi until the expiration of the lease in 2012.
As of December 31, 2009 and 2008, we were productively utilizing substantially all of the space in our facilities, except for space identified above as underutilized, unoccupied, or as subleased to third parties.
| Item 3. | Legal Proceedings |
The Company’s French subsidiary, GSI Lumonics SARL (“Lumonics”), is subject to a claim by a customer, SCGI, that a Laserdyne 890 system delivered in 1999 had unresolved technical problems. During the third quarter of 2005, GSI France, parent of Lumonics, filed for bankruptcy protection, which was granted by the French court on July 7, 2005. On April 18, 2006, the court fixed SCGI’s claim against Lumonics at 598,079 Euros, plus court costs and expert fees of 85,945 Euros. SCGI accepted the court’s determination. SCGI is now demanding that the Liquidator bring an action in the United Kingdom against GSI Group Ltd., the parent corporation of GSI France. The Company is not aware of any facts to support a claim. The Company’s French counsel is addressing these points directly with the Liquidator. At this time, the Company does not believe it will be required to make any payments regarding this action. Accordingly, nothing has been accrued in the Company’s accompanying consolidated financial statements.
On August 6, 2008, a purported stockholder of Excel Technology, Inc., a subsidiary of the Company, filed a complaint seeking certification of a class action lawsuit in the Supreme Court of the State of New York, County of New York, docketed as Joseph Choquette, v. Antoine Dominic, Steven Georgiev, Donald E. Weeden, Ira J. Lamel, J. Donald Hill and Excel Technology, Inc., Index No. 08/602294 (the “Choquette Action”) against Excel and each of its directors. The Choquette Action purports to be brought individually and on behalf of all public stockholders of Excel. The Choquette Action alleges that Excel’s director defendants breached their fiduciary duties to Excel’s stockholders in connection with the proposed tender offer by the Company and that each of the defendants aided and abetted such alleged breach of Excel’s director defendants’ fiduciary duties. Based on these allegations, the Choquette Action seeks, among other relief, an order declaring the action to be a class action, enjoining preliminarily and permanently the tender offer and the merger with the Company, rescinding, to the extent already implemented, the tender offer and the merger with the Company or any of the terms thereof or awarding rescissory damages, directing that the defendants account to plaintiff and other members of the class for all damages caused by them and account for all profits and any special benefits obtained as a result of a breach of their fiduciary duties to the purported stockholder and other members of the class, awarding plaintiff the costs of the Choquette Action including a reasonable allowance for the expenses of plaintiff’s attorneys and experts and granting plaintiff and other members of the class such further relief as the court deems just and proper. On August 14, 2008, Excel and the individual defendants in the Choquette Action filed a motion to dismiss the lawsuit. On August 18, 2008, the plaintiff in the Choquette Action filed a motion seeking a preliminary injunction to enjoin consummation of the tender offer and to require Excel to issue additional and supplementary disclosures in Excel’s Schedule 14D-9 filing. On August 19, 2008, the court denied plaintiff’s motion for a preliminary injunction. On April 15, 2009, the court granted defendants’ motion to dismiss and entered judgment dismissing the complaint with prejudice.
On December 12, 2008, in connection with the delayed filing of its results for the quarter ended September 26, 2008, and the announcement of a review of revenue transactions, a putative shareholder class action alleging federal securities violations was filed in the United States District Court for the District of Massachusetts against us, a former officer and a current officer and director. Specifically, the complaint alleges that the Company and the individual defendants violated Sections 10(b) and 20(a) of the Securities Exchange Act of 1934 and Rule 10b-5 promulgated thereunder, and seeks recovery of damages in an unspecified amount. The action was brought on behalf of a putative class of shareholders who purchased the Company’s stock between April 30, 2008 and December 3, 2008. A lead plaintiff, Mason Tenders District Council Trust Funds, was appointed on May 8, 2009. On July 1, 2009, the Court ordered lead plaintiff to file a consolidated or amended complaint within 30 days of the Company’s filing of restatements for certain of its historical financial results with the SEC. During the last several months, the parties have been in settlement discussions and the parties have reached an agreement in principle to settle this lawsuit. The settlement would, in general, cover purchasers of the common stock of the Company between February 27, 2007 and June 30, 2009. The agreement in principle is subject to a number of contingencies including confirmatory discovery by the Lead Plaintiff, after which Lead Plaintiff may affirm or void the agreement in principle, preliminary and final approval by the District Court, and to the extent required by law, approval by the Bankruptcy Court. Although the agreement in principle is not final, the total settlement amount is well within the Company’s insurance policy limits; the Company’s contribution to the settlement amount would be limited to the balance of the company’s self-insured retention.
35
Table of Contents
The Company is also subject to various legal proceedings and claims that arise in the ordinary course of business. The Company does not believe that the outcome of these claims will have a material adverse effect upon the Company’s financial conditions or results of operations but there can be no assurance that any such claims, or any similar claims, would not have a material adverse effect upon the Company’s financial condition or results of operations.
Chapter 11 Cases
On November 20, 2009, the Debtors filed voluntary petitions for relief under Chapter 11 of the Bankruptcy Code in the United States Bankruptcy Court for Delaware, as discussed in Item 1—“Business.” Under the Bankruptcy Code, the filing of a petition automatically stays most actions against the Company, including most actions to collect pre-petition indebtedness or to exercise control over the property of our bankruptcy estates. Absent further order of the Bankruptcy Court, no party, subject to certain exceptions, may take any action, also subject to certain exceptions, to recover on pre-petition claims against the Debtors. We expect substantially all of our pre-petition liabilities will be resolved under our plan of reorganization if not otherwise satisfied pursuant to orders of the Bankruptcy Court.
SEC Investigation
As discussed in the Explanatory Note to the Annual Report on Form 10-K, we have conducted a Revenue Review of certain of our historic revenue transactions. On May 14, 2009, we received a notice from the SEC indicating that the SEC is conducting a formal investigation relating to our historical accounting practices and the restatement of our historical consolidated financial statements. The Company is cooperating fully with the SEC’s investigation.
| Item 4. | Submission of Matters to a Vote of Security Holders |
None.
36
Table of Contents
PART II
| Item 5. | Market for Registrant’s Common Shares, Related Stockholder Matters and Issuer Purchases of Equity Securities |
Market Information
The Company’s common shares are currently quoted on the Pink OTC Markets Inc., continuing under the trading symbol “GSIGQ.” In 2008 and 2007 the Company’s common shares, no par value, traded on The NASDAQ Stock Market under the symbol “GSIG”. The following table sets forth the high and low sales prices during the periods indicated.
| 2008 | 2007 | |||||||||||
| High | Low | High | Low | |||||||||
| First Quarter |
$ | 9.63 | $ | 7.49 | $ | 9.96 | $ | 8.26 | ||||
| Second Quarter |
8.49 | 7.30 | 10.80 | 9.59 | ||||||||
| Third Quarter |
7.95 | 3.29 | 11.30 | 9.34 | ||||||||
| Fourth Quarter |
3.86 | 0.43 | 11.57 | 9.10 | ||||||||
Holders
As of the close of business on December 31, 2009, there were approximately 101 holders of record of its common shares. Since many of the common shares are registered in “nominee” or “street” names, the Company estimates that the total number of beneficial owners is considerably higher.
Dividend Policy
The Company has never declared or paid cash dividends on its common shares. The Company currently intends to retain any current and future earnings to finance the growth and development of its business and, therefore, does not anticipate paying any cash dividends in the foreseeable future.
Recent Sales of Unregistered Securities
| 1. | 2006 Plan |
The Company recently discovered that it inadvertently failed to file with the SEC a registration statement on Form S-8 relating to securities issued under its 2006 Plan. As a result, the Company inadvertently issued unregistered shares of common stock as described in further detail below. Since becoming aware of this issue, the Company has been unable to take corrective steps to register such securities since the Company has not been current in its SEC periodic reporting obligations and is therefore not eligible to rely on a registration statement on Form S-8 or any other registration statement until it becomes current in its periodic reporting requirements under the Securities Exchange Act of 1934, as amended. The Company has instituted a moratorium on the granting of all equity awards and share issuances until a registration statement on Form S-8 is on file.
The Company’s 2006 Plan was approved by the Company’s shareholders in May 2006 and issuances of equity awards thereunder were available to substantially all of its employees, consultants and directors worldwide. From March 2007 through March 2010, the Company issued approximately 773,037 duly authorized common shares with a total fair market value at the date of issuance of approximately $3,889,796 to fifty-two employees and directors under its 2006 Plan. However, the Company’s management subsequently determined that these common shares issued pursuant to the 2006 Plan were inadvertently not registered under the Securities Act of 1933 or applicable state securities law requirements prior to issuance and were issued without an appropriate restrictive legend. As a result, the Company may be subject to civil litigation, enforcement proceedings, fines, sanctions and/or penalties.
The Company may also be subject to claims by participants in the 2006 Plan for rescission of their acquisitions of common shares under the 2006 Plan under federal securities laws until the expiration of the applicable statute of limitations period, which is one year under federal law from the date of transaction. If applicable, such participants may have the right to rescind their purchases for an amount equal to the purchase price for the shares (or if the shares have been disposed of, claims for any damages with respect
37
Table of Contents
to any loss on such disposition) plus interest from the date of purchase. However, under applicable provisions of federal law (including section 510(b) of the Bankruptcy Code (11 U.S.C. § 510(b)), and in connection with our Chapter 11 Cases, if the Company’s proposed Plan is confirmed, the holders of any such damage claims and related rescission or other rights would, the Company believes, be entitled to receive a distribution under the Plan of common shares of the reorganized Company only. The Company believes that the most likely result is that any such claims, if allowed, would result in the holder receiving that quantity of common shares in the reorganized Company that are determined by a court to result in equal treatment of such claim holders and existing equity holders. Furthermore, rescission or damages claims of a shareholder who holds the above described unregistered shares, but receives new shares, as contemplated by the Plan, would be discharged upon the Company’s emergence from the bankruptcy proceedings. Such new shares would be issued pursuant to an exemption from registration under §1145 of the Bankruptcy Code and be freely tradable by holders who are not deemed to be underwriters.
As noted above, the Company’s failure to (i) register the common shares underlying the 2006 Plan and (ii) issue the common shares pursuant to a valid exemption from such registration requirements was inadvertent and the Company has always treated the common shares issued under the 2006 Plan as outstanding for financial reporting purposes. Consequently, these unregistered transactions do not represent any additional dilution.
| 2. | Excel Technology, Inc. |
In August 2008, in connection with our acquisition of Excel, the Company entered into a Warrant Agreement with certain holders of our Senior Notes, dated August 20, 2008 (the “Warrant Agreement”), pursuant to which the Company issued and sold to such noteholders warrants to purchase common shares of the Company (the “Warrants”). The Warrants were issued in a private transaction in reliance upon the exemption from registration contained in Section 4(2) of the Securities Act of 1933, as amended. The Warrants were subsequently net exercised in exchange for 5,858,495 common shares and such common shares were simultaneously registered pursuant to a Registration Statement on Form S-3 filed with the SEC in October 2008.
38
Table of Contents
Purchases of Equity Securities by the Issuer and Affiliated Purchaser
The following table provides information about purchases by the Company during the year ended December 31, 2008 of equity securities that were registered by the Company pursuant to Section 12 of the Exchange Act:
| Period |
Total Number of Shares Purchased |
Average Price Paid per Share |
Total Number of Shares Purchased as Part of Publicly Announced Plan or Programs |
Maximum Number (or Approximate Dollar Value) of Shares that May Yet be Purchased Under Plans or Programs | ||||||
| January 2 – January 17, 2008 |
248,700 | $ | 8.67 | 248,700 | $ | 1,227,837 | ||||
| March 7 – March 20, 2008 |
116,000 | $ | 8.26 | 116,000 | $ | 25,269,803 | ||||
| March 31 – May 2, 2008 |
293,000 | $ | 8.15 | 293,000 | $ | 22,886,157 | ||||
| May 5 – May 19, 2008 |
114,767 | $ | 8.19 | 114,767 | $ | 21,943,633 | ||||
All of the purchases of shares noted above were made under the Company’s Stock Repurchase Program on the open market at prevailing prices using the Company’s available cash. The Stock Repurchase Program was announced on December 21, 2005. In February 2008, the Company’s Board of Directors authorized an increase in the Stock Repurchase Program, initially approved in December 2005 at $15.0 million, to $40.0 million. The program was suspended in May 2008 as a result of the Company’s decision to acquire Excel.
NASDAQ Listing Requirements
As of the date of this Annual Report on Form 10-K, the Company was subject to the listing requirements of the NASDAQ Global Select Market. Subsequently, however, and as described earlier in this Annual Report on Form 10-K, NASDAQ has determined to delist the Company’s shares. The Company’s shares are currently quoted on the Pink OTC Markets Inc., continuing under the trading symbol “GSIGQ.”
39
Table of Contents
Performance Graph
The following graph compares the cumulative total return to stockholders for the Company’s common shares for the period from December 31, 2003 through December 31, 2008 with the NASDAQ Composite Index and the Philadelphia Semiconductor Index. The comparison assumes an investment of $100 is made on December 31, 2003 in the Company’s common shares and in each of the indices and in the case of the indices it also assumes reinvestment of all dividends. The performance shown is not necessarily indicative of future performance.
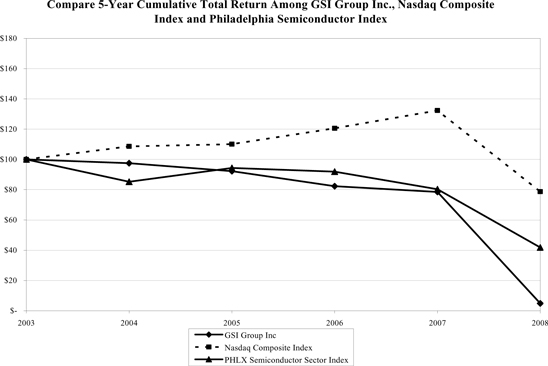
40
Table of Contents
| Item 6. | Selected Financial Data |
The consolidated balance sheet as of December 31, 2007 and the consolidated statements of operations for the years ended December 31, 2007 and 2006 have been restated as set forth in this Annual Report on Form 10-K for the year ended December 31, 2008. The data for the consolidated balance sheets as of December 31, 2006, 2005 and 2004 and the consolidated statements of operations for the years ended December 31, 2005 and 2004 have been restated to reflect the impact of the adjustments from the Revenue Review, other adjustments which had been previously identified but not previously recorded due to their materiality, and adjustments to our provision for income tax, but such restated data have not been audited and is derived from the books and records of the Company. The information set forth below is not necessarily indicative of results of future operations, and should be read in conjunction with Item 7, “Management’s Discussion and Analysis of Financial Condition and Results of Operations” and the consolidated financial statements and related notes thereto included in Item 8 of this Annual Report on Form 10-K to fully understand factors that may affect the comparability of the information presented below. The information presented in the following tables has been adjusted to reflect the restatement of the Company’s financial results, which is more fully described in the “Explanatory Note” immediately preceding Part I, Item 1 and in Note 2, “Restatement of Previously Issued Financial Statements”, in the Notes to Consolidated Financial Statements of this Annual Report on Form 10-K. The selected consolidated financial data in this section is not intended to replace the consolidated financial statements.
On November 20, 2009, the Company, along with two of its subsidiaries, voluntarily filed petitions for relief under Chapter 11 of the United States Bankruptcy Code. Under the Bankruptcy Code, the Company’s status as a bankruptcy debtor automatically accelerates the payment of all of the Company’s debt, including the debt arising under the Senior Notes. Accordingly, the Company has classified this debt as current. These conditions raise substantial doubt about the Company’s ability to continue as a going concern, including uncertainty with respect to the realization of the value of its assets and its ability to discharge its liabilities. The consolidated financial statements do not include any adjustments to reflect the possible future effects on the recoverability and classification of assets or the amounts and classification of liabilities that may result from the outcome of this uncertainty.
| Years Ended December 31, | |||||||||||||||||
| 2008 | 2007 | 2006 | 2005 | 2004 | |||||||||||||
| (In thousands, except per share data) | |||||||||||||||||
| (As Restated) | (As Restated) | (As Restated) | (As Restated) | ||||||||||||||
| (Unaudited) | (Unaudited) | ||||||||||||||||
| Condensed Consolidated Statements of Operations: |
|||||||||||||||||
| Sales |
$ | 288,468 | $ | 291,081 | $ | 259,030 | $ | 248,283 | $ | 319,508 | |||||||
| Gross profit |
97,618 | 113,133 | 102,398 | 98,239 | 130,209 | ||||||||||||
| Operating expenses: |
|||||||||||||||||
| Research and development and engineering |
33,449 | 29,861 | 30,130 | 25,460 | 23,928 | ||||||||||||
| Selling, general and administrative |
65,904 | 59,545 | 62,893 | 58,681 | 56,839 | ||||||||||||
| Amortization of purchased intangible assets |
5,714 | 2,213 | 2,131 | 1,971 | 2,458 | ||||||||||||
| Impairment of goodwill, intangible assets and other long-lived assets |
215,051 | — | — | — | — | ||||||||||||
| Restructuring and other |
10,485 | 6,655 | — | 212 | 573 | ||||||||||||
| Acquisition related in-process research and development charge |
12,142 | — | — | — | 390 | ||||||||||||
| Total operating expenses |
342,745 | 98,274 | 95,154 | 86,324 | 84,188 | ||||||||||||
| Income (loss) from operations |
(245,127 | ) | 14,859 | 7,244 | 11,915 | 46,021 | |||||||||||
| Interest and other income (expense), net |
(6,754 | ) | 7,313 | 2,526 | 1,938 | (242 | ) | ||||||||||
| Income (loss) from continuing operations before income taxes |
(251,881 | ) | 22,172 | 9,770 | 13,853 | 45,779 | |||||||||||
41
Table of Contents
| Years Ended December 31, | ||||||||||||||||||
| 2008 | 2007 | 2006 | 2005 | 2004 | ||||||||||||||
| (In thousands, except per share data) | ||||||||||||||||||
| (As Restated) | (As Restated) | (As Restated) | (As Restated) | |||||||||||||||
| (Unaudited) | (Unaudited) | |||||||||||||||||
| Income tax provision (benefit) |
(39,032 | ) | 7,484 | 2,914 | (4,371 | ) | 8,481 | |||||||||||
| Net income (loss) from continuing operations |
(212,849 | ) | 14,688 | 6,856 | 18,224 | 37,298 | ||||||||||||
| Income (loss) from discontinued operations, net of tax |
270 | 467 | 645 | (445 | ) | (925 | ) | |||||||||||
| Gain on disposal of discontinued operations, net of tax |
8,732 | — | — | — | — | |||||||||||||
| Net income (loss) |
$ | (203,847 | ) | $ | 15,155 | $ | 7,501 | $ | 17,779 | $ | 36,373 | |||||||
| Net income (loss) from continuing operations per common share: |
||||||||||||||||||
| Basic |
$ | (4.94 | ) | $ | 0.35 | $ | 0.16 | $ | 0.44 | $ | 0.91 | |||||||
| Diluted |
$ | (4.94 | ) | $ | 0.34 | $ | 0.16 | $ | 0.44 | $ | 0.89 | |||||||
| Net income (loss) from discontinued operations per common share: |
||||||||||||||||||
| Basic |
$ | 0.21 | $ | 0.01 | $ | 0.02 | $ | (0.01 | ) | $ | (0.02 | ) | ||||||
| Diluted |
$ | 0.21 | $ | 0.01 | $ | 0.02 | $ | (0.01 | ) | $ | (0.02 | ) | ||||||
| Net income (loss) per common share: |
||||||||||||||||||
| Basic |
$ | (4.73 | ) | $ | 0.36 | $ | 0.18 | $ | 0.43 | $ | 0.89 | |||||||
| Diluted |
$ | (4.73 | ) | $ | 0.35 | $ | 0.18 | $ | 0.43 | $ | 0.87 | |||||||
| Weighted average common shares outstanding for basic net income (loss) per common share |
43,125 | 42,364 | 41,896 | 41,548 | 41,124 | |||||||||||||
| Weighted average common shares outstanding for diluted net income (loss) per common share |
43,125 | 42,645 | 42,251 | 41,856 | 42,125 | |||||||||||||
| December 31, | ||||||||||||||||||
| 2008 | 2007 | 2006 | 2005 | 2004 | ||||||||||||||
| (In thousands) | ||||||||||||||||||
| (As Restated) | (As Restated) | (As Restated) | (As Restated) | |||||||||||||||
| Balance Sheet Data: |
||||||||||||||||||
| Cash, cash equivalents and short-term investments |
$ | 69,001 | $ | 172,387 | $ | 136,501 | $ | 93,643 | $ | 85,043 | ||||||||
| Debt |
185,115 | — | — | — | — | |||||||||||||
| Working capital (deficit) |
(7,434 | ) | 267,062 | 232,427 | 202,798 | 162,054 | ||||||||||||
| Total assets |
520,317 | 507,645 | 464,143 | 397,100 | 398,326 | |||||||||||||
| Deferred revenue, current and long-term |
84,225 | 101,563 | 80,283 | 36,511 | 30,411 | |||||||||||||
| Long-term liabilities, excluding deferred revenue |
45,820 | 20,262 | 25,734 | 25,577 | 23,607 | |||||||||||||
| Total stockholders’ equity |
152,677 | 345,678 | 317,676 | 295,753 | 286,446 | |||||||||||||
42
Table of Contents
| Item 7. | Management’s Discussion and Analysis of Financial Condition and Results of Operations |
Management’s Discussion and Analysis of Financial Condition and Results of Operations (“MD&A”) should be read in conjunction with the Consolidated Financial Statements and Notes included in Item 8 of this Annual Report on Form 10-K. The MD&A contains certain forward-looking statements within the meaning of the United States Private Securities Litigation Reform Act of 1995, Section 27A of the United States Securities Act of 1933, as amended, and Section 21E of the United States Securities Exchange Act of 1934, as amended. In addition to historical financial information, the following discussion and analysis contains forward-looking statements that involve risks, uncertainties and assumptions. These forward-looking statements include, but are not limited to, anticipated financial performance; anticipated outcome of the Chapter 11 Cases; the impact of our delisting from NASDAQ; our ability to continue as a going concern; expected liquidity and capitalization; drivers of revenue growth; management’s plans and objectives for future operations, expenditures and product development and investments in research and development; business prospects; potential of future product releases; anticipated sales performance; industry trends; market conditions; changes in accounting principles and changes in actual or assumed tax liabilities; expectations regarding tax exposure; expectations related to the restructuring of our debt through the Chapter 11 Cases; anticipated reinvestment of future earnings; anticipated expenditures in regard to the Company’s benefit plans; future acquisitions and dispositions and anticipated benefits from prior acquisitions; anticipated outcomes of legal proceedings and litigation matters; and anticipated use of currency hedges. These forward-looking statements are neither promises nor guarantees, but involve risks and uncertainties that may cause actual results to differ materially from those contained in the forward-looking statements. Our actual results could differ materially from those anticipated in these forward-looking statements for many reasons, including the risks described in Item 1A of this Annual Report on Form 10-K and elsewhere in this Annual Report on Form 10-K. See also “Cautionary Statement Regarding Forward-Looking Statements” at the beginning of this Annual Report on Form 10-K. Readers should not place undue reliance on any such forward-looking statements, which speak only as of the date they are made. Management and the Company disclaim any obligation to publicly update or revise any such statement to reflect any change in its expectations or in events, conditions, or circumstances on which any such statements may be based, or that may affect the likelihood that actual results will differ from those contained in the forward-looking statements.
Business Overview
We design, develop, manufacture and sell photonics-based solutions (consisting of lasers, laser systems and electro-optical components), precision motion devices, associated precision motion control technology and systems. Our customers incorporate our technology into their products or manufacturing processes, for a wide range of applications in the industrial, scientific, electronics, semiconductor, medical and aerospace markets. Our products allow customers to make advances in materials and processing technology and to meet extremely precise manufacturing specifications, including device complexity and miniaturization.
The photonics and electro-optical industry is subject to intense competition and rapid technological developments. Our strength and success is dependent upon developing and delivering successful, timely and cost effective solutions to our customers. For us to maintain our performance, we believe we must continue to increase our operational efficiencies, improve and refine our existing products, expand our product offerings and develop new applications for our technology.
The Company strives to create shareholder value through:
| • | Organic sales growth by delivering a consistent stream of successful new product launches, |
| • | Generating high levels of cash flow from operations, and |
| • | Acquiring and successfully integrating businesses that have complementary and established core competencies. |
We and our subsidiaries serve three primary industries or market segments: Precision Technology, Semiconductor Systems, and Excel. The Company’s Precision Technology Segment primarily sells components to original equipment manufacturers (OEMs), who then integrate its products into application specific products or systems. The Company’s OEM products include those based on its core competencies in laser, precision motion and motion control technology. The Company’s Semiconductor Systems Segment designs, develops and sells production systems that process semiconductor wafers using laser beams and high precision motion technology. The Company sells manufacturing systems to integrated device manufacturers and wafer processors. The Company’s Excel Segment designs, manufactures and markets photonics-based solutions consisting of lasers, laser-based systems, precision motion devices and electro-optical components, primarily for industrial and scientific applications. The Company’s Excel Segment primarily sells components to OEMs, who then integrate its products into application specific products or systems.
Strategy
GSI strives to expand its presence in its most attractive markets both through organic growth and strategic acquisitions. This strategy led to our acquisition of Excel in the third quarter of 2008. This transaction was a major step for us, as it introduced us to
43
Table of Contents
some of the attractive markets in which the Excel Segment operates, and it expanded our presence in some of the most attractive markets in which the Precision Technology Segment operates. During 2008 and 2009, we initiated the integration of Excel’s operations with ours. In 2010, we intend to focus on the completion of the integration of Excel into our operations and on the continued development and introduction of new products. In addition, we intend to continue to explore potential divestments of non-strategic businesses.
We had a number of significant events in 2008, and also in 2009 and 2010 through the filing of this Annual Report on Form 10-K. Discussion of those events follows.
Significant Events in 2008
Financial data, when presented throughout MD&A and our accompanying consolidated financial statements, includes the effect of each of the following:
| 1. | Restatement of our Financial Results. This restatement is more fully described in the “Explanatory Note” immediately preceding Item 1 of this Annual Report on Form 10-K, and in Note 2, “Restatement of Previously Issued Financial Statements”, in Notes to Consolidated Financial Statements. The following table presents revenues and deferred revenues as reported and as restated (in thousands): |
| Year Ended December 31, | |||||||||||||||
| 2008 | 2007 | 2006 | 2005 | 2004 | |||||||||||
| (unaudited) | (unaudited) | ||||||||||||||
| Revenues: |
|||||||||||||||
| As reported (a) |
$ | 288,468 | $ | 306,067 | $ | 302,083 | $ | 251,761 | $ | 321,367 | |||||
| As restated |
— | 291,081 | 259,030 | 248,283 | 319,508 | ||||||||||
| December 31, | |||||||||||||||
| 2008 | 2007 | 2006 | 2005 | 2004 | |||||||||||
| (unaudited) | (unaudited) | (unaudited) | |||||||||||||
| Deferred Revenue (b): |
|||||||||||||||
| As reported (a) |
$ | 84,225 | $ | 9,949 | $ | 2,965 | $ | 2,963 | $ | 1,811 | |||||
| As restated |
— | 101,563 | 80,283 | 36,511 | 30,411 | ||||||||||
| (a) | Excludes U.S. Optics Business which is classified as discontinued operations. |
| (b) | Includes current and non-current deferred revenue. |
| 2. | Divestiture of our U.S. Optics Business. In October 2008, we sold our U.S. Optics Business which was located in Moorpark, California, and which was historically included in our Precision Technology Segment. On October 8, 2008, we completed the sale of our U.S. Optics Business for $21.6 million. The net gain of $8.7 million on the sale of this business is reported as Gain on Disposal of Discontinued Operations, net of tax, in our consolidated statements of operations. This sale is more fully described in Note 5, “Discontinued Operations”, in Notes to Consolidated Financial Statements of this Annual Report on Form 10-K. |
| 3. | Excel Acquisition. In August 2008, we completed our acquisition of Excel, a designer, manufacturer and marketer of photonics-based solutions consisting of lasers, laser based systems, precision motion devices and electro-optical components, primarily for industrial and scientific applications. Excel has complementary products, technologies, and distribution channels to ours that we believe will enable us to provide customers with a significantly broader set of technical solutions and to expand our market share. The Excel acquisition had a material impact on our results of operations in 2008. Excel was included in our consolidated financial statements since August 20, 2008. See Note 4, “Business Combinations,” of Notes to Consolidated Financial Statements of this Annual Report on Form 10-K for details. The material impact on our financial results includes the normal operations since August 20, 2008, and also includes an impairment charge with respect to a portion of the goodwill, intangible assets and other long-lived assets that we acquired in our purchase of Excel. |
44
Table of Contents
| 4. | Debt Financing. We financed the purchase price of Excel in part from the net proceeds that were received from our sale of $210.0 million of senior unsecured notes and warrants to purchase our common shares. The remaining cash required to acquire Excel was provided by cash on hand at the time of closing. |
| 5. | Impairment of Goodwill, Intangible Assets and Other Long-lived Assets. We recorded a charge of $215.1 million relating to our assessment of the fair value of these assets as of December 31, 2008. This charge includes a portion of the assets that we acquired from Excel in August 2008, and is more fully discussed below under “Significant Accounting Policies and Estimates,” and also in Note 3 of Notes to Consolidated Financial Statements of this Annual Report on Form 10-K. |
| 6. | Restructuring Charges. In 2008, we recorded restructuring and other charges of $10.5 million relating to a number of initiatives to reduce our workforce, the cessation or relocation of certain activities, and our Revenue Review and related restatement of historic financial statements. These activities are discussed further, below, in our discussion of our results of operations for the years ended December 31, 2008 and 2007. |
Significant Events in 2009
In 2009, the Company had a number of significant developments. Certain of these developments are discussed in “Item 1, Significant Recent Developments” of this Annual Report on Form 10-K under the following headings: “NASDAQ Delisting Determination”, “Chapter 11 Bankruptcy Filing”, “The Third Modified Joint Chapter 11 Plan of Reorganization,” “The Plan Support Agreement,” and “SEC Investigation.”
In addition to these events, we also undertook a number of restructuring activities in 2009. We undertook a number of cost reduction initiatives, including a workforce reduction of approximately 214 employees in fiscal 2009. The total approximate severance paid in 2009 by the Company in connection with these initiatives was approximately $3.9 million. The approximate annualized savings realized by us from these workforce reductions was approximately $11.2 million.
Our Revenue Review and related restatement of historic financial statements has continued into 2009 as well. The costs for these activities are significant, and will be charged to restructuring and other costs as incurred.
Going Concern
As a result of certain of the significant events discussed above and uncertainties inherent in the bankruptcy process, there is substantial doubt about our ability to continue as a going concern. Operating in bankruptcy imposes significant risks and uncertainties on our business. See Item 1A — “Risk Factors — Risks Relating to Bankruptcy” for a discussion of the risks and uncertainties relating to our business and investing in our securities as a result of the Chapter 11 Cases.
We believe that when we emerge from bankruptcy, we will be sufficiently capitalized. We expect that we will have assets that exceed our liabilities, and that those assets, as well as the net assets derived from our continuing operations, will be sufficient to meet our obligations, including the obligations with respect to the payment of interest, and repayment of principal under the New Term Loan. Notwithstanding our expectation upon our emergence from bankruptcy, uncertainties inherent in the bankruptcy process raise substantial doubt about our ability to continue as a going concern. In particular, until the Plan is confirmed by the Court, we may be required to pay the Senior Note Claims under the original terms of the Senior Notes. The consolidated financial statements do not include any adjustments to reflect the possible future effects on the recoverability and classification of assets or the amounts and classification of liabilities that may result from the outcome of this uncertainty.
Overview of Financial Results
As a result of the significant events discussed above, our financial results in 2008 differ significantly from those in recent years. We reported a net loss of $203.8 million in 2008, compared to net income of $15.2 million in 2007 and net income of $7.5 million in 2006. Our 2008 operating results included three significant non-recurring charges: we recorded a charge of $215.1 million relating to the impairment of our goodwill, intangible assets and other long-lived assets; we expensed $12.1 million of acquisition related in-process research and development in connection with our acquisition of Excel; and we expensed $10.5 million in connection with restructuring and other non-recurring activities.
The financial results of 2008 reflect the extremely difficult global economic environment, which resulted in significantly weakened demand for our products, which ultimately resulted in our recording of a loss of $203.8 million in 2008. The
45
Table of Contents
specific components of our loss, and enhanced discussion of the factors that led to this loss are further discussed below in the comparison of our 2008 and 2007 financial results. During the first half of 2009, the Company experienced further deterioration in both its sales and operating profits. Sales declined across the Precision Technology and Semiconductor Segments; Excel was not owned in the first half of 2008. Sales in the Company’s Semiconductor Systems Segment underwent a particularly pronounced decline, as the semiconductor industry went through one of the worst downturns in the industry’s history. Overall sales recovered somewhat later in 2009. The Company’s business outlook for 2010 remains uncertain.
46
Table of Contents
Results of Operations
The following table sets forth our results of operations as a percentage of sales for the periods indicated:
| Year Ended December 31, | |||||||||
| 2008 | 2007 | 2006 | |||||||
| (As Restated) | (As Restated) | ||||||||
| Sales |
100.0 | % | 100.0 | % | 100.0 | % | |||
| Cost of goods sold |
66.2 | 61.1 | 60.5 | ||||||
| Gross profit |
33.8 | 38.9 | 39.5 | ||||||
| Operating expenses: |
|||||||||
| Research and development and engineering |
11.6 | 10.3 | 11.6 | ||||||
| Selling, general and administrative |
22.8 | 20.5 | 24.3 | ||||||
| Amortization of purchased intangible assets |
2.0 | 0.8 | 0.8 | ||||||
| Impairment of goodwill, intangible assets and other long-lived assets |
74.5 | — | — | ||||||
| Restructuring and other |
3.7 | 2.3 | — | ||||||
| Acquisition related in-process research and development charge |
4.2 | — | — | ||||||
| Total operating expenses |
118.8 | 33.9 | 36.7 | ||||||
| Income (loss) from operations |
(85.0 | ) | 5.0 | 2.8 | |||||
| Interest income |
1.1 | 2.2 | 1.8 | ||||||
| Interest expense |
(3.6 | ) | — | (0.2 | ) | ||||
| Foreign exchange transaction gains (losses) |
0.3 | 0.2 | (0.6 | ) | |||||
| Other income (expense), net |
(0.2 | ) | 0.1 | — | |||||
| Income (loss) from continuing operations before income taxes |
(87.4 | ) | 7.5 | 3.8 | |||||
| Income tax provision (benefit) |
(13.5 | ) | 2.6 | 1.1 | |||||
| Income (loss) from continuing operations |
(73.9 | ) | 4.9 | 2.7 | |||||
| Income from discontinued operations, net of tax |
— | 0.2 | 0.2 | ||||||
| Gain on disposal of discontinued operations, net of tax |
3.1 | — | — | ||||||
| Net income (loss) |
(70.8 | )% | 5.1 | % | 2.9 | % | |||
47
Table of Contents
Years Ended December 31, 2008 and 2007
Sales
The following table sets forth sales by business segment for 2008 and 2007 in dollars (dollars in thousands) and percentage change:
| 2008 | 2007 | Increase (Decrease) |
Percentage Change |
||||||||||||
| (As Restated) | |||||||||||||||
| Precision Technology |
$ | 146,616 | $ | 184,509 | $ | (37,893 | ) | 20.5 | % | ||||||
| Semiconductor Systems |
88,494 | 111,515 | (23,021 | ) | (20.6 | )% | |||||||||
| Excel |
55,612 | — | 55,612 | 100.0 | % | ||||||||||
| Intersegment sales eliminations(1) |
(2,254 | ) | (4,943 | ) | 2,689 | (54.4 | )% | ||||||||
| Total |
$ | 288,468 | $ | 291,081 | $ | (2,613 | ) | (0.9 | )% | ||||||
| (1) | Sales of the Precision Technology Segment’s products to the Semiconductor Systems Segment. |
Precision Technology product lines’ sales decreased by $37.9 million, or 20.5%, in 2008. The decrease in sales of these product lines was primarily attributable to declines in our Spindles and Encoders product lines in the second half of 2008. Worldwide demand for those products and in general weakened markedly in late 2008 as turmoil in world financial markets intensified, credit conditions tightened and business and consumer confidence plummeted. The weakness in demand continued during the first half of 2009 before starting to recover late in 2009.
The decrease in Semiconductor Systems sales was primarily attributable to the global slowdown which had a dramatic adverse effect on the semiconductor market, which saw a markedly weakened end-user market for products. This weakened end-user demand directly affected our customers’ purchases of equipment that is used to produce semiconductor products. Included in the 2008 revenue is revenue from many orders that were placed by customers prior to 2008, but that were not able to be fully delivered in those prior periods. The revenue has been recorded in 2008, upon our completion of all deliverables for this equipment. Our worldwide deferred revenue is primarily related to our Semiconductor Systems. It decreased 17.1% from $101.6 million at December 31, 2007 to $84.2 million at December 31, 2008. We expect that a significant portion of the deferred revenue relating to undelivered elements as of December 31, 2008 will be recognized in 2009 and 2010. The decrease in sales of Semiconductor Systems was particularly pronounced in the second half of 2008. Sales of Semiconductor Systems continued at a low level throughout most of 2009. The outlook for 2010 is uncertain.
Excel contributed sales of $55.6 million from the date of acquisition in August 2008 to December 31, 2008.
We measure the sales to our customers based on the geographic location of each customer. Based on these locations, $88.5 million and $79.2 million, or 30.7% and 27.2%, of our total sales were made to customers in the United States in 2008 and 2007, respectively. Our sales to customers outside of the United States represented $199.9 million and $211.9, or 69.3% and 72.8%, of our total sales in 2008 and 2007, respectively. The difference in proportion of our sales derived from customers within the United States is primarily attributable to our acquisition of Excel in August 2008, as Excel has a higher proportion of its revenue demand from customers located in the United States.
48
Table of Contents
Gross Profit
The following table sets forth gross profit and gross profit percentage, by business segments for 2008 and 2007 (dollars in thousands):
| 2008 | 2007 | |||||||
| (As Restated) | ||||||||
| Gross profit: |
||||||||
| Precision Technology |
$ | 49,092 | $ | 66,877 | ||||
| Semiconductor Systems |
27,523 | 45,958 | ||||||
| Excel |
20,669 | — | ||||||
| Intersegment sales elimination and other |
334 | 298 | ||||||
| Total |
$ | 97,618 | $ | 113,133 | ||||
| Gross profit percentages: |
||||||||
| Precision Technology |
33.5 | % | 36.2 | % | ||||
| Semiconductor Systems |
31.1 | % | 41.2 | % | ||||
| Excel |
37.2 | % | — | |||||
| Intersegment sales elimination and other |
(14.8 | )% | (6.0 | )% | ||||
| Total |
33.8 | % | 38.9 | % | ||||
Gross profit as a percentage of sales can be influenced by a number of factors including product mix, pricing, volume, costs for raw materials and outsourced manufacturing, warranty costs and charges related to excess and obsolete inventory, at any particular time.
The Precision Technology Segment gross profit margins were 33.5% in 2008, a decrease of 2.7 percentage points compared to 36.2% in 2007. The decline of gross profit is primarily due to changes in product mix, as the gross profits vary among the product lines in this segment.
The Semiconductor Systems Segment gross profit reduction of 10.1 percentage points is primarily attributable to fixed costs being absorbed into the revenue base that decreased by 20.6% in 2008 as compared to 2007.
The gross profit margins of the products within the Excel Segment were 37.2% in 2008 since the date of acquisition in August 2008.
Research and Development and Engineering Expenses
Research and development and engineering (“R&D”) expenses are primarily comprised of labor and other employee-related expenses. R&D expenses were $33.4 million in 2008, representing 11.6% of sales compared to $29.9 million, or 10.3%, of sales in 2007. R&D expenses, in terms of their total dollars, primarily increased as a result of our acquisition of Excel in August 2008. The increases in R&D expenses were partially offset by our 2008 reductions in force in connection with restructuring activities discussed below. We believe that the development and market introduction of new products and the enhancement of existing products are essential to our success. Accordingly, during 2009, we continued to invest in the development of new products across all three of our segments. We plan to continue to invest in R&D as we continue to pursue market leadership in all of our segments.
Selling, General and Administrative Expenses
Selling, general and administrative (“SG&A”) expenses include costs for sales and marketing, sales administration, finance, human resources, legal, information systems, facilities and executive management, and includes personnel related costs, commissions, advertising, legal, tax, accounting and other professional fees. SG&A expenses were $65.9 million in 2008, representing 22.8% of sales, compared to $59.5 million, or 20.5% of sales in 2007. SG&A expenses, in terms of their total dollars, increased primarily as a result of personnel related costs associated with our acquisition of Excel in August 2008. The increases were partially offset by reductions in payroll related costs attributable to our 2008 reductions in force in connection with restructuring activities discussed below. Additionally, in 2007, we recorded a $2.0 million reduction to our SG&A expenses due to the cash payment we received in connection with the settlement of our claims against Lumenis Ltd.
49
Table of Contents
Amortization of Purchased Intangible Assets
Amortization of intangible assets is discussed below in “Critical Accounting Policies and Estimates.” Amortization of purchased intangible assets is charged to our Precision Technology and Excel Segments. Amortization of purchased intangible assets, excluding the amortization for core technology that is included in cost of goods sold, was $5.7 million, or 2.0% of sales in 2008, compared to $2.2 million, or 0.8%, of sales in 2007. The increase in 2008, in terms of dollars and as a percentage of sales, was primarily related to the amount of intangible assets acquired in connection with our acquisition of Excel in August 2008.
As discussed below, on December 31, 2008, we recorded a $215.1 million charge for the impairment of goodwill, intangible assets and other long-lived assets. Based on the amortizable intangible assets as of December 31, 2008, and assuming no impairment or reduction in the expected lives, we expect to record amortization of intangible assets for 2009 of $9.6 million, of which $3.8 million will be recorded to cost of goods sold, and $5.8 million will be recorded to SG&A expenses.
Impairment of Goodwill, Intangible Assets and other Long-Lived Assets
As of December 31, 2008, we conducted a review to assess whether the carrying value of our goodwill, intangible assets and other long-lived assets was impaired. Based on our review, we noted that the carrying value of certain assets exceeded their fair market value. Additional information with respect to the manner in which we conducted our review is discussed below under “Critical Accounting Policies and Estimates.” Based on our evaluation, we recorded a charge to reduce the carrying amounts of goodwill, intangible assets and other long-lived assets by an aggregate of $215.1 million.
Restructuring and other
We recorded restructuring and other charges of $10.5 million and $6.7 million in 2008 and 2007, respectively. In 2008, we reported charges of $3.6 million in connection with our closure of excess manufacturing operations in the United Kingdom, as those operations moved to China. We also accrued $4.7 million to consolidate certain of our operations within the United States, including charges for duplicate facilities and staffing reductions, into our new Bedford, Massachusetts facility. These 2008 charges were partially offset by reductions to the restructuring charge relating to the sale of inventory at a price that exceeded the value that such inventory had been written down to in a prior year’s restructuring charge. The 2008 restructuring and other costs also include $1.9 million relating to our Revenue Review. This amount includes amounts payable to third parties, including attorneys, forensic accountants, and other advisors. These costs have been charged to expense as incurred. The Revenue Review costs, including costs relating to the restatement of historic financial statements, have continued for periods subsequent to 2008, and will be included in future ‘restructuring and other’ charges.
The 2007 charges related primarily to a charge of $6.7 million relating to our expansion of certain manufacturing operations in China. The charge was composed of $2.6 million in employee termination benefits, $3.1 million in inventory write-offs, $0.7 million in direct costs associated with the manufacturing transition from the United Kingdom to China, and $0.3 million related to facility consolidations. The inventory write-offs were charged to restructuring and other charges as they related to discontinued product offerings, and not recurring activities. These restructuring efforts were largely completed in 2007.
The following table summarizes the aggregate balance of the activity relating to our restructuring and other charges recorded on our consolidated balance sheets (in thousands):
| Balance at December 31, 2005 |
$ | 1,502 | ||
| Restructuring charges (benefits), net |
— | |||
| Cash payments |
(165 | ) | ||
| Balance at December 31, 2006 |
1,337 | |||
| Restructuring charges (benefits), net |
6,655 | |||
| Cash payments |
(3,249 | ) | ||
| Non-cash write-offs or other adjustments |
(3,401 | ) | ||
| Balance at December 31, 2007 |
1,342 | |||
| Restructuring charges (benefits), net |
10,485 | |||
| Cash payments |
(4,223 | ) | ||
| Non-cash write-offs or other adjustments |
(3,563 | ) | ||
| Balance at December 31, 2008 |
$ | 4,041 | ||
50
Table of Contents
As of December 31, 2008 and 2007, $1.1 million and $1.0 million, respectively, of accrued restructuring charges were included in long-term liabilities. The current portion is included in accrued expenses (see Note 7 of Notes to Consolidated Financial Statements).
Acquisition Related In-Process Research and Development Charge
In connection with our acquisition of Excel in August 2008, we recorded a $12.1 million charge for acquisition related in-process research and development. The value assigned to in-process research and development was determined using an income approach by estimating the costs to develop the acquired technology into commercially viable products, estimating the resulting net cash flows from the projects, and discounting the net cash flows to their present value. At the date of acquisition, the development of these projects had not yet reached technological feasibility, and had no alternative future uses. Accordingly, we have expensed the value of this research and development at the acquisition date in accordance with the provisions of Statement of Financial Accounting Standards (“SFAS”) 141. Due to the nature of the forecasts and the risks associated with the developmental projects, a discount rate of 15.0% was used to discount the net cash flows to their present value. We anticipate that costs to complete the development of these projects will be $4.4 million, and will be completed between December 2008 and December 2010. The successful development of new products and product enhancements is subject to numerous risks and uncertainties, both known and unknown, including unanticipated delays, access to capital, budget overruns, technical problems and other difficulties that could result in the abandonment or substantial change in the design, development and commercialization of these new products and enhancements. Given the uncertainties inherent with product development and introduction, there can be no assurance that any of our product development efforts will be successful on a timely basis or within budget, if at all. The failure of the combined Company to develop new products and product enhancements on a timely basis or within budget could harm our results of operations and financial condition.
Interest Income
Interest income was $3.3 million in 2008, compared to $6.6 million in 2007. Interest income decreased primarily due to us having lower cash and investment balances following our acquisition of Excel in August 2008.
Interest Expense
Interest expense was $10.4 million in 2008, compared to $0.1 million in 2007. Interest expense increased due to us having incurred $210.0 million in debt, the proceeds of which were used to fund a portion of the purchase of our acquisition of Excel in August 2008.
Foreign Exchange Transaction Gains (Losses)
Foreign exchange currency transaction gains, net, were $0.9 million in 2008, compared to $0.6 million in 2007, which arose from the change in exchange rates from 2008 compared to 2007, and which resulted in additional other income of $0.3 million in 2008 compared to 2007.
Other Income (Expense), Net
Other income (expense), net, was $(0.6) million in 2008 as compared to $0.2 million in 2007. The difference is primarily attributable to a penalty that we recorded in 2008 relating to our inability to maintain the effectiveness of the registration statement on Form S-3 that we filed in October 2008 relating to the resale of our common shares issued upon the exercise of the Warrants. See Note 8 of Notes to Consolidated Financial Statements. We did not have any such charge in 2007.
Income Taxes
The Company recorded a tax benefit of $39.0 million during the 2008 fiscal year. The effective tax rate for 2008 was (15.5%) of income before taxes, compared to an effective tax rate of 33.8% of income before taxes for 2007. The Company is incorporated in Canada and therefore uses the Canadian statutory rate. The Company’s tax rate in 2008 differs from the Canadian statutory rate of 29.5% primarily due to a $47.0 million charge for unfavorable permanent differences of
51
Table of Contents
which $43.0 million relates to non-deductible amortization and $4.3 million to in-process R&D, $1.8 million related to Canadian deferred items, a $0.4 million charge for non-U.S. withholding taxes, a $1.1 million increase in the Company’s liability for uncertain tax positions, $0.5 million increase in valuation allowance in the U.S., and a $1.6 million increase in valuation allowance due to restatement and impairment in the U.K. The aforementioned charges were partially offset by benefits derived from $0.2 million benefit from R&D tax credits, $0.5 million decrease in valuation allowance in Hong Kong, $1.7 million related to the release of valuation allowances in Canada due to the utilization of net operating losses against the current year income in Canada and $13.9 million benefit due to international rate differences.
In connection with the Chapter 11 Cases described in Note 1 of Notes to Consolidated Financial Statements, the IRS has filed amended proofs of claim aggregating approximately $7.7 million for amounts it claims the Company owes for 2002 through 2008. The IRS has provided no information to substantiate its claims. The Company believes the IRS claims are without merit and intends to vigorously object to them in Bankruptcy Court. Consequently, the Company believes no adjustment of its estimated tax liabiliity pursuant to FIN 48 is required.
Income from Discontinued Operations, Net of Tax
On October 8, 2008, we completed the sale of our U.S. Optics Business, located in Moorpark, California, which was a part of our Precision Technology Segment, for proceeds of $21.6 million. The net gain of $8.7 million on the sale of the U.S. Optics Business is reported as Gain on Disposal of Discontinued Operations, net of tax, in our consolidated statements of operations for the year ended December 31, 2008. The operating results of this business have been reclassified and reported as income from discontinued operations in our consolidated statements of operations for fiscal years 2008, 2007 and 2006.
Years Ended December 31, 2007 and 2006
Sales
The following table sets forth sales by business segment for 2007 and 2006 in dollars (dollars in thousands) and percentage change:
| 2007 | 2006 | Increase (Decrease) |
Percentage Change |
|||||||||||
| (As Restated) | (As Restated) | |||||||||||||
| Precision Technology |
$ | 184,509 | $ | 179,565 | $ | 4,944 | 2.8 | % | ||||||
| Semiconductor Systems |
111,515 | 90,170 | 21,345 | 23.7 | % | |||||||||
| Intersegment sales eliminations(1) |
(4,943 | ) | (10,705 | ) | 5,762 | (53.8 | )% | |||||||
| Total |
$ | 291,081 | $ | 259,030 | $ | 32,051 | 12.4 | % | ||||||
| (1) | Sales of the Precision Technology Segment’s products to the Semiconductor Systems Segment. |
The increase in sales of our Precision Technology Segment was primarily attributable to our PCB spindles product line, and our Optics product line, which includes revenue from the beryllium mirror and structures business of the U.K.-based Thales Optronics that we acquired in June 2007. Additionally, in 2007 we recognized $7.3 million relating to shipments that we made to a customer from 2004 to 2007. Those shipments were only able to be recognized as revenue upon finalization of our arrangement with that customer. These increases in revenue for the Precision Technology Segment were partially offset by (i) a reduction in sales of our Thermal Printer products due to reduced shipments to a large medical defibrillator customer that voluntarily suspended U.S. shipments to address quality systems issues in their manufacturing facility and (ii) reductions in sales of our Scanner and Laser product lines.
The increase in Semiconductor Systems sales were primarily attributable to aggressive semiconductor capital spending by our customers that began in 2006 and continued into early 2007. In particular, we experienced strong demand for our WaferMark equipment, particularly from the manufacturers of semiconductor products who increased production capacity to meet consumer demand for DRAM and Flash memory, as well as increased demand for our WaferRepair equipment, including orders for our M450 series in 2006, and our M550 series that became available in early 2007. In many cases, the orders for the M450 series of WaferRepair systems were fulfilled, installed and then recognized as revenue in 2007. Despite the volume of new orders in 2007 for our M550 series equipment, most of these M550 series equipment orders were not able to be fully deployed in 2007 and had undelivered commitments against some aspect of the equipment ordered. As a result, many of these orders were included in our deferred revenue as of December 31, 2007. Our worldwide deferred revenue is primarily related to sales in our Semiconductor Systems, and increased from $80.3 million at December 31, 2006 to $101.6 million at December 31, 2007, due in large part to the deferral of revenue related to orders for our M550 series products.
We track the sales to our customers based on the geographic location of each customer. Based on these locations, $79.2 million and $82.7 million, or 27.2% and 31.9% of our total sales were made to customers in the United States in 2007 and 2006, respectively. Our sales to customers outside of the United States represented $211.9 million and $176.3 million, or 72.8% and 68.1% of our total
52
Table of Contents
sales in 2007 and 2006, respectively. The proportional increase in customer sales outside of the United States was primarily due to our 2007 increase in sales to Semiconductor Systems customers, which customers are largely located outside of the United States, where their production factories are primarily located.
Gross Profit
The following table sets forth gross profit and gross profit percentage, by our business segments for 2007 and 2006 (dollars in thousands):
| 2007 | 2006 | |||||||
| (As Restated) | (As Restated) | |||||||
| Gross profit: |
||||||||
| Precision Technology |
$ | 66,877 | $ | 68,224 | ||||
| Semiconductor Systems |
45,958 | 34,198 | ||||||
| Intersegment sales elimination and other |
298 | (24 | ) | |||||
| Total |
$ | 113,133 | $ | 102,398 | ||||
| Gross profit percentage: |
||||||||
| Precision Technology |
36.2 | % | 38.0 | % | ||||
| Semiconductor Systems |
41.2 | % | 37.9 | % | ||||
| Intersegment sales elimination and other |
(6.0 | )% | 0.2 | % | ||||
| Total |
38.9 | % | 39.5 | % | ||||
Gross profit as a percentage of sales can be influenced by a number of factors including product mix, pricing, volume, costs for raw materials and outsourced manufacturing, warranty costs and charges related to excess and obsolete inventory, at any particular time.
The decline in gross profit of our Precision Technology Segment of 1.8 percentage points was largely due to changes in product mix, as gross profit varies among the product lines in this segment. The Semiconductor Systems Segment saw gross profit increase by 3.3 percentage points in 2007. This increase in gross profit in the Semiconductor Systems Segment is largely the result of fixed costs being absorbed into a larger revenue base in 2007, as compared to 2006.
Research and Development and Engineering Expenses
Research and development and engineering (“R&D”) expenses are primarily comprised of labor and other employee-related expenses. R&D expenses were $29.9 million in 2007, representing 10.3% of sales, compared to $30.1 million, or 11.6%, of sales in 2006. Although R&D expenses were relatively consistent in 2007 and 2006, R&D expenses as a percentage of revenue decreased in 2008 because sales in 2007 increased relative to sales in 2006, thereby spreading the relatively unchanged dollars dedicated to R&D over a larger base of sales.
Selling, General and Administrative Expenses
Selling, general and administrative (“SG&A”) expenses includes costs for sales and marketing, sales administration, finance, human resources, legal, information systems, facilities and executive management, and includes personnel related costs, commissions, advertising, legal, tax, accounting and other professional fees. SG&A expenses were $59.5 million in 2007, representing 20.5% of sales, compared to $62.9 million, or 24.3%, of sales in 2006. The SG&A expenses decreased in 2007 relative to 2006, primarily due to us having recorded a $2.0 million reduction to our SG&A expenses as a result of the settlement for legal claims, for which the settlement represented a recovery of previously expensed amounts.
Amortization of Purchased Intangible Assets
Amortization of intangible assets is discussed below in “Critical Accounting Policies and Estimates”. Amortization of purchased intangible assets in 2007 and 2006 was charged to our Precision Technology Segment. Amortization of purchased intangible assets, excluding the amortization for core technology that is included in cost of goods sold, was $2.2 million in 2007 and $2.1 million in 2006, and was derived from acquisitions that we consummated prior to 2006.
Restructuring and other
We recorded restructuring charges of $6.7 million in 2007, which are discussed above in the comparison of 2008 and 2007 charges. We had no such charges in 2006.
53
Table of Contents
Interest Income
Interest income was $6.6 million in 2007, compared to $4.6 million in 2006. The $2.0 million increase in 2007 is due to an increase in our invested cash balances in 2006 as compared to 2007, along with a more favorable yield on those balances.
Interest Expense
Interest expense was $0.1 million in 2007 and $0.6 million in 2006. The interest expense booked in 2006 was primarily composed of a charge of $0.5 million relating to a payment to the German tax authorities in 2006 in connection with the closure of a 2005 tax audit.
Foreign Exchange Transaction Gains (Losses)
Foreign exchange currency transaction gains were $0.6 million in 2007, compared to a $1.4 million loss in 2006. These amounts arise primarily from transactions denominated in currencies other than the functional currency. The currencies that the gains and losses are primarily derived from are the British Pound, the Japanese Yen and the Canadian Dollar. The U.S. dollar had relative strength to the currencies in 2007 as compared to 2006.
Other Income (Expense), Net
Other income (expense), net, was not significant in either 2007 or 2006, providing $0.2 million of income and ($0.1) million of expense, respectively.
Income Taxes
We recorded a tax provision of $7.5 million during 2007. The effective tax rate for 2007 was 33.8% of income before taxes, compared to an effective tax rate of 29.8% for 2006. Our tax rate in 2007 differs from the Canadian statutory rate of 32.1% due to a $0.3 million charge for state taxes, a $0.8 million charge for non-U.S. withholding taxes, a $0.9 million increase in our liability for uncertain income tax positions, the recording of a $1.0 million additional valuation allowance in the United Kingdom, the recording of a $0.7 million additional valuation allowance in the United States. The aforementioned charges were partially offset by a $0.3 million benefit from research and development tax credits, a $0.7 million adjustment to prior years’ benefits claimed for the extraterritorial income exclusion, and a $1.3 million release of valuation allowance in Canada due to the utilization of net operating losses against the current year income in Canada.
Liquidity and Capital Resources
On November 20, 2009, GSIG, together with two of its subsidiaries, voluntarily filed petitions for relief under Chapter 11 of the United States Bankruptcy Code. Under the Bankruptcy Code, GSIG’s status as a bankruptcy debtor automatically accelerates the payment of all of its debt, including the debt arising under the Senior Notes. Accordingly, this debt has been classified as current. These conditions raise substantial doubt about our ability to continue as a going concern, including uncertainty with respect to the realization of the value of our assets, and our ability to discharge our liabilities. The consolidated financial statements do not include any adjustments to reflect the possible future effects on the recoverability and classification of assets or the amounts and classification of liabilities that may result from the outcome of this uncertainty.
Cash and cash equivalents totaled $69.0 million at December 31, 2008, compared to $172.4 million at December 31, 2007. The decrease in cash and cash equivalents is primarily related to the cash on hand that we used to fund our acquisition of Excel in August 2008.
As of December 31, 2008 we also held auction rate securities, recorded at fair value of $25.1 million and with a par value of $32.3 million, which we obtained in connection with our acquisition of Excel. These auction rate securities are student loans backed by the federal government and are privately insured. Current capital market conditions have impacted our ability to liquidate certain auction rate securities. Liquidity for these auction rate securities is typically provided by an auction process that resets the applicable interest rate at pre-determined intervals, usually every 7, 28, 35 or 90 days. In the past, the auction process has allowed investors to roll over their holdings or obtain immediate liquidity by selling the securities at par. Due to the current capital market conditions, auctions have not had sufficient bidders to allow investors to complete a sale of some auction rate securities. Due to the uncertainty in the market as to when these auction rate notes will be refinanced or the auctions will resume, we have classified these instruments as
54
Table of Contents
long-term assets available for sale. We have had some success in liquidating these holdings during 2009. Through December 31, 2009, of the $32.3 million in par value securities that we held as of December 31, 2008, we sold $19.3 million of the securities, and recorded net realized gains of $2.4 million on our sales of these securities. As of December 31, 2009, the Company continues to hold auction rate securities with a par value of $13.0 million.
Cash Flows for the Year Ended December 31, 2008 and December 31, 2007
Cash provided by operations in 2008 was $38.9 million, compared to $37.6 million in 2007, a difference of $1.3 million or 3.5%. The increase in cash flow was primarily attributable to the following factors:
| • | In 2008, we recorded a net loss of $203.8 million, compared with net income of $15.2 million in 2007, before non-cash adjustments to reconcile net income (loss) to net cash from operating activities. |
| • | Non-cash adjustments to reconcile net income (loss) to cash flows from operations, including the following material items: |
| • | In 2008, we recorded an impairment charge of $215.1 million to write down our goodwill, other intangible assets and property, plant and equipment to their fair value as of December 31, 2008, and we also recorded an acquisition related in-process research and development charge of $12.1 million in connection with our acquisition of Excel. There were no such charges recorded in 2007; |
| • | Other non-cash charges, such as depreciation and amortization of fixed assets and intangible assets, non-cash restructuring charges, share-based compensation, and non-cash interest accretion charges, were $27.1 million in 2008 and $20.3 million in 2007. The $6.8 million increase in non-cash charges was primarily attributed to an increase in depreciation and amortization of $4.4 million, and $1.9 million of non-cash interest expense in 2008; and |
| • | In 2008, we recorded a $33.7 million increase in deferred income taxes, compared with a $1.1 million decrease in 2007. |
| • | Changes in our operating assets and liabilities provided $31.0 million in cash in 2008, as compared to having provided $1.6 million in 2007. The significant increase is primarily attributable to the following items: |
| • | A decrease in our accounts receivable balances in 2008 provided $37.8 million, as compared to having used cash of $20.2 million in 2007; |
| • | Inventory balances decreased $19.9 million in 2008, compared with a $5.4 million decrease in 2007; |
| • | In 2008, the net change to deferred revenue and related deferred cost of goods sold used $10.2 million, compared to a net increase of $7.3 million in 2007; and |
| • | In 2008, the net cash flows used in accounts payable and accrued expenses was $8.0 million, as compared to cash flow provided from these activities of $4.1 million in 2007. |
Cash used in operating activities of discontinued operations in 2008 was $1.0 million compared with $1.3 million in 2007.
Cash used in investing activities in 2008 was $338.4 million, compared to $8.0 million in 2007, a difference of $330.4 million. The increase in cash used in investing activities was primarily attributable to the following factors:
| • | Cash used to purchase Excel, net of cash acquired, was $358.3 million in 2008. This compares to $3.0 million used for our acquisition of the U.K. optics business in 2007; |
| • | We used $18.0 million to purchase property and equipment in 2008, compared to $4.6 million in 2007, the majority of which related to our newly leased Bedford, MA facility; |
| • | Proceeds from the sale of discontinued operations in 2008 was $21.6 million, and there were no such proceeds in 2007; |
| • | Change in long term assets and liabilities of $12.1 million in 2008, compared to $0.1 million in 2007; and |
| • | We generated $3.2 million in 2008 from the sale of property, plant, and equipment as a result of our restructuring efforts with the U.K. and China operations. There were no such proceeds in 2007. |
Cash provided by investing activities of discontinued operations was $1.0 million compared with a $0.5 million of cash used in 2007.
Cash provided by financing activities in 2008 was $196.9 million, compared to $0.8 million in 2007, a difference of $196.2 million. The increase was primarily attributable to the following factors:
| • | In 2008, we received cash proceeds, net of issuance costs, of $203.5 million from the issuance of our Senior Notes that were used to fund a portion of our acquisition of Excel. We did not issue any debt in 2007; |
55
Table of Contents
| • | In 2008, we received $0.1 million primarily from the exercise of stock options, whereas in 2007 we received approximately $8.2 million; and |
| • | The cash we used to repurchase shares was $6.4 million in 2008, compared to $7.8 million in 2007. |
In addition to cash flows from operating, investing and financing activities, exchanges rate changes resulted in a decrease of $0.8 million in our cash balances, compared to an increase of $3.7 million in 2007.
Cash Flows for the Year Ended December 31, 2007 and December 31, 2006
Cash provided by operations in 2007, was $37.6 million, compared to $35.2 million in 2006, a difference of $2.4 million, or 6.8%. The increase was primarily attributable to the following factors:
| • | In 2007, we recorded net income of $15.2 million, compared to net income of $7.5 million in 2006; |
| • | Other non-cash charges, such as depreciation and amortization of fixed assets and intangible assets, non-cash related restructuring charges, and share based compensation were $20.3 million in 2007 and $13.9 million in 2006. The increase in 2007 was primarily composed of $3.4 million in non-cash restructuring charges that did not exist in 2006, and a $2.5 million share based compensation charge in 2007 compared with a $0.7 million charge in 2006; |
| • | A $20.2 million increase in our accounts receivable balances in 2007, as compared to $1.5 million decrease in 2006; |
| • | Inventory balances in 2007 provided cash of $5.4 million, as compared to using $5.0 million of cash in 2006; and |
| • | The net change in deferred revenue and the related deferred cost of goods sold provided $7.3 million in 2007, and in 2006 those same accounts provided $19.6 million in cash; and in 2007, the net cash flows generated from accounts payable and accrued expenses were $4.1 million, as compared to cash flow used from these activities of $12.0 million in 2007. |
Cash used in the operations of discontinued operations was $1.3 million in 2007 compared with an immaterial cash flow impact in 2006.
Cash used in investing activities in 2007 was $8.0 million, compared to cash provided by investing activities of $33.0 million in 2006, a difference of $41.0 million. The change was primarily attributable to the following factors:
| • | In 2006, we had a net sale of investments of $26.7 million, and we sold property, plant and equipment for $6.3 million. We had no such activity in 2007; |
| • | We used 4.6 million of cash to purchase property, plant and equipment in 2007, as compared to $1.1 million of purchases in 2006; and |
| • | We used $3.0 million in 2007 to purchase our U.K. optics business. No such purchases occurred in 2006. |
Cash used in investing activities of discontinued operations was $0.5 million and $0.6 million in 2007 and 2006, respectively.
Cash provided by financing activities in 2007 was $0.8 million, compared to $2.1 million in 2006, a difference of $1.3 million. The decrease was primarily attributable to the following factors:
| • | Cash received from the exercise of stock options, which provided $8.2 million in 2007 and $4.9 million in 2006; and |
| • | Cash we used to repurchase our common shares, which was $7.8 million in 2007 and $3.8 million in 2006. |
In addition to cash flows from operating, investing and financing activities, cash generated from exchange rate changes resulted in an increase of $3.7 million in our cash balances compared to decreasing cash balances by $1.2 million in 2006.
Other Liquidity Matters
Debt
On August 20, 2008 (the “Closing Date”), we issued to various investors $210.0 million of unsecured senior notes (the “Senior Notes”), along with detachable warrants (the “Warrants”) for the purchase of 5,882,520 of our common shares, for collective net proceeds to us of $203.5 million. The proceeds were used to fund a portion of our acquisition of Excel. The Senior Notes carry a fixed interest rate of 11.0%. The Warrants were net exercised by the holders in October 2008, in exchange for 5,858,495 of our common shares. We ascribed a fair value to the Warrants in the amount of $26.3 million as of the Closing Date. The fair value was based upon the Black-Scholes option pricing model, assuming a risk-free interest rate of 3.0%, an expected term of 5.0 years, a volatility rate of 85.0% and no dividends.
56
Table of Contents
The Senior Notes pay interest semi-annually and mature in August 2013. After the first year anniversary of the Closing Date, we may redeem up to 50% of the Senior Notes with no penalty or premium. After the third anniversary of the Closing Date, we may redeem all remaining Senior Notes, again with no penalty or premium. The Senior Notes require us to comply with certain covenants that restrict the Company from taking on additional debt, repurchasing equity, making investments or selling certain assets. Under the Bankruptcy Code, our status as a bankruptcy debtor automatically accelerates the payment of all of our debt, including that arising under the Senior Notes. Accordingly, we have classified this debt as current in our December 31, 2008 consolidated financial statements. As further discussed above under “The Third Modified Joint Chapter 11 Plan of Reorganization” the holders of the Senior Notes have agreed to exchange their Senior Note Claims in exchange for: (i) approximately 53.8% of GSIG’s post-consummation outstanding shares, (ii) new secured notes in the aggregate amount of $110 million, (iii) excess cash available under the Plan to the extent certain allowed claims exceed $22.5 million, and (iv) their pro rata portion of the Cash Payment.
The $26.3 million value of the Warrants was recorded as a discount against the debt. This discount is being amortized to interest expense using the effective interest method over the life of the Senior Notes. In connection with the issuance of the Senior Notes, we incurred $6.5 million in issuance fees, which have been capitalized as debt issuance costs, and are included in other current assets. These issuance fees are being amortized to interest expense on the effective interest method over the contractual term of the Senior Notes. As of December 31, 2008, the unamortized portion of the valuation of the Warrants was $24.9 million, and the unamortized debt issuance costs were $6.0 million. The Senior Notes, net of the value of the Warrants and net of the debt issuance costs, constitute a net carrying value of $185.1 million at December 31, 2008. There was no debt outstanding as of December 31, 2007. For the year ended December 31, 2008, the total amount recorded to interest expense, including the accretion of the Warrant value, and of the debt issuance costs, was $10.2 million.
As discussed further at Note 2 of Notes to Consolidated Financial Statements, in connection with the Revenue Review, we failed to timely file our annual and quarterly reports. In connection with the issuance of the Warrants, the Company and the Warrant holders entered into a Registration Rights Agreement (the “RRA”), dated as of August 20, 2008, pursuant to which we agreed to register the common shares issuable upon exercise of the Warrants. We filed that registration statement on Form S-3 in October 2008, simultaneously with the exercise of the Warrants. As a result of our failure to file our Quarterly Report on Form 10-Q for the period ended September 26, 2008, on November 12, 2008 we notified the former Warrant holders that we were indefinitely suspending the Company’s registration statement on Form S-3. Pursuant to the RRA , the Company is obligated to maintain the effectiveness of the registration statement until the earlier of (i) the date which is twelve (12) months after the Effective Time (October 23, 2008) and (ii) the date on which there are no registrable securities (the “Maintenance Period”). Under the RRA, monetary penalties accrue and are payable to the former Warrant holders for failure to maintain an effective registration statement during the Maintenance Period, subject to certain terms and conditions more specifically set forth therein. In 2008, we incurred penalties under the RRA and have accordingly recorded expenses and corresponding accrued liability of $0.8 million in 2008. We have continued to incur penalties under the RRA into 2009. The maximum penalty payments payable under these provisions is approximately $4.0 million.
As disclosed above, on November 20, 2009, the Debtors filed for voluntary petitions for relief under Chapter 11 of the Bankruptcy Code of the Bankruptcy Court. For additional information regarding our liquidity and capital resources see Item 7, “Management’s Discussions and Analysis of Financial Condition and Results of Operation – Overview – Chapter 11 Bankruptcy Filings.”
Pension Plans
We maintain two plans that are considered to be defined benefit plans under the provisions of SFAS 158, a plan in the U.K., and a plan in Japan. As of December 31, 2008, based on the provisions of SFAS 158, the value of the U.K. Plan’s assets was $18.0 million, and the projected benefit obligations were $20.8 million, resulting in a liability of $2.8 million. The Japan pension plan has assets of $0.8 million, and a projected benefit obligation of $2.1 million, resulting in a liability of $1.3 million at December 31, 2008.
Our funding policy is to fund pensions and other benefits based on actuarial methods as permitted by regulatory authorities. The results of funding valuations depend on the assumptions that we make with regard to attributes such as asset returns, rates of members’ benefits increases, mortality, retail price inflation and other market driven changes. The assumptions used represent one estimate of a possible future outcome. The final cost to us will be determined by events as they actually become known. Because of the underfunded positions that our pension plans currently have and potential changes in the actual outcomes relative to our assumptions, we may have to increase payments to fund these plans in the future.
57
Table of Contents
In the U.K., funding valuations are conducted every three years, based on the last completed funding valuation on November 30, 2006, the Company and the Plan Trustees agree to a schedule of contributions under which the Company is contributing approximately $48,000 per month until March 2018. We have since changed our U.K. plan year end to December 31, and so we are required to conduct a funding valuation sooner than the previously scheduled date of November 30, 2009. Accordingly, we have begun a funding valuation as of December 31, 2008. Upon the completion of this valuation, these monthly contributions may change. The Japanese plan includes a guarantee of return of principal and yearly interest 0.75%; therefore, there are no significant fluctuations in this plan.
See Note 11 of Notes to Consolidated Financial Statements for further information about these plans.
Off-Balance Sheet Arrangements, Contractual Obligations
Contractual Obligations
The following table summarizes our contractual obligations at December 31, 2008 and the effect such obligations are expected to have on liquidity and cash flow in future years. The Company has excluded the future cash payments for FIN 48 tax liabilities because the timing of the settlement of these liabilities can not be estimated by year. However, these FIN 48 liabilities have been classified as long-term on the consolidated balance sheets.
Our contractual obligations may be affected by the filing of voluntary petitions for relief under Chapter 11 of the Bankruptcy Code by the Debtors and therefore may not be paid in full, or in accordance with the original contractual terms, as a result.
| Contractual Obligations |
Total | 2009 | 2010-2011 | 2012-2013 | Thereafter | ||||||||||
| (In thousands) | |||||||||||||||
| 11.0% Unsecured Senior Notes (1) |
$ | 210,000 | $ | 210,000 | $ | — | $ | — | $ | — | |||||
| Interest on 11.0% Unsecured Senior Notes (2) |
106,838 | 23,100 | 46,200 | 37,538 | — | ||||||||||
| Penalty relating to warrants (3) |
4,040 | — | 4,040 | — | |||||||||||
| Operating leases (4) |
28,993 | 5,440 | 8,985 | 5,159 | 9,409 | ||||||||||
| Purchase commitments (5) |
11,235 | 9,178 | 2,036 | 21 | — | ||||||||||
| Deferred compensation (5) |
702 | 702 | — | — | — | ||||||||||
| U.K. pension plan (6) |
5,328 | 576 | 1,152 | 1,152 | 2,448 | ||||||||||
| Total contractual cash obligations |
$ | 367,136 | $ | 248,996 | $ | 62,413 | $ | 43,870 | $ | 11,857 | |||||
| (1) | The $210 million of 11% Unsecured Senior Notes are outstanding as of the date of this report and represent a contractual obligation of the Company. The 11% Unsecured Senior Notes are not shown as a contractual obligation after 2009 due to the voluntary petition filed by GSI Group, Inc and two of its United States subsidiaries for relief under chapter 11 of the United States Bankruptcy Code. See Note 8 of Notes to Consolidated Financial Statements and “Significant Recent Events – Chapter 11 Bankruptcy Filing” in “Item 1, Business” of this Annual Report on Form 10-K for additional information. |
| (2) | Interest on the 11% Unsecured Senior Notes is shown through the currently scheduled maturity date in 2013. The actual amount of interest paid in 2010 through 2013 may be different from the amounts shown in the table depending on the outcome of the Chapter 11 bankruptcy proceedings. Interest is due and payable semi-annually. |
| (3) | Estimated penalties incurred as a result of our inability to maintain the effectiveness of our registration statement on Form S-3, filed in October 2008, relating to the resale of our common shares issued upon the exercise of the Warrants. See Note 14 of Notes to Consolidated Financial Statements. |
| (4) | These amounts represent the gross payments payable for facilities that we lease. These amounts do not reflect anticipated sub-lease income of approximately $0.7 million, in total, from 2009 to 2013. See Note 14 of Notes to Consolidated Financial Statements. |
| (5) | See Note 14 of Notes to Consolidated Financial Statements. |
| (6) | Represents the contractual obligation of payments equivalent to $48,000 per month through March 2018. |
58
Table of Contents
Off-Balance Sheet Arrangements
Through December 31, 2008, we have not entered into any off-balance sheet arrangements or material transactions with unconsolidated entities or other persons.
Critical Accounting Policies and Estimates
The preparation of financial statements in conformity with generally accepted accounting principles requires us to make estimates and assumptions that affect the reported amounts of assets and liabilities and disclosure of contingent assets and liabilities at the dates of the financial statements and the reported amounts of sales and expenses during the reporting periods. On an ongoing basis, we evaluate our estimates, assumptions and judgments, including those related to revenue recognition, fair value measurements, allowance for doubtful accounts, inventory costing and reserves, the assessment of the valuation of goodwill, intangible assets and tangible long-lived assets, accounting for business combinations, employee benefit plans, accounting for restructuring activities; accounting for income taxes and related valuation allowances, and accounting for loss contingencies. Actual results could differ significantly from our estimates.
We believe that the following critical accounting policies most significantly affect the portrayal of our financial condition and results of operations and require the most difficult and subjective judgments.
Revenue Recognition. We recognize revenue when persuasive evidence of an arrangement exists, delivery has occurred, the price is fixed or determinable, risk of loss has passed to the customer and collection of the resulting receivable is reasonably assured. Revenue recognition requires judgment and estimates, which may affect the amount and timing of revenue recognized in any given period.
We follow the provisions of Emerging Issues Task Force (“EITF”) 00-21, “Revenue Arrangements with Multiple Deliverables” for all multiple element arrangements. Under EITF 00-21, we assess whether the deliverables specified in a multiple element arrangement should be treated as separate units of accounting for revenue recognition purposes and whether objective and reliable evidence of fair value exists for these separate units of accounting. We apply the residual method when objective and reliable evidence of fair value exists for all of the undelivered elements in a multiple element arrangement. When objective and reliable evidence of fair value does not exist for all of the undelivered elements in a multiple element arrangement, we recognize revenue under the multiple units shipped methodology, whereby revenue is recognized in each period based upon the lowest common percentage of the products shipped in the period. This approximates a proportional performance model of revenue recognition. This generally results in a partial deferral of revenue to a later reporting period. No revenue is recognized unless one unit of each product has been delivered.
Although certain of our products contain operating and application software, we have determined the software element is incidental in accordance with the AICPA’s Statement of Position (“SOP 97-2”) and EITF 03-05, “Applicability of AICPA Statement of Position 97-2 to Non-Software Deliverables in an Arrangement Containing More-Than-Incidental Software.”
We determine the unit of accounting for certain transactions based on the guidance in TPA 5100.39. In particular, multiple purchase orders may be deemed to be interrelated and considered to constitute a multiple element arrangement for accounting purposes.
Semiconductor Systems transactions are generally multiple element arrangements which may include hardware, software, installation, training, an initial standard warranty, and optional extended warranty arrangements. We generally design, market and sell these products as standard configurations. For those standard configurations where acceptance criteria, if any, exist and are demonstrated prior to shipment, revenue is recorded at the time of shipment. For those cases where acceptance criteria cannot be demonstrated prior to shipment of a product or if a significant amount of fees are due upon acceptance, we recognize revenue upon customer acceptance. Acceptance is generally required for sales of Semiconductor Systems Segment products to Japanese customers, sales of “New Products”, which are considered by us, for purposes of revenue recognition determination, to be either (a) a product that is newly released to all customers, including a product which may have been existing previously, but which has been substantially upgraded with respect to its features or functionality; or, (b) the sale of an existing product to a customer who has not previously purchased that product. We follow a set of predetermined criteria when changing the classification of a New Product to a standard configuration whereby acceptance criteria are considered to be demonstrated at the time of shipment.
Precision Technology Segment and Excel Segment transactions include both single element and multiple element transactions. Multiple element transactions may include two or more products and occasionally also contain installation, training or preventative maintenance plans. Revenue is generally recognized under the multiple units shipped methodology described above.
59
Table of Contents
Our Semiconductor Systems Segment also sells spare parts and consumable items, which are not subject to acceptance criteria. Revenue for these spare parts and consumable items is generally recognized under the multiple units shipped methodology described above.
Installation is generally a routine process that occurs within a short period of time from delivery and we have concluded that this obligation is inconsequential and perfunctory. As such, for transactions that include installation, and for which customer acceptance has not been deemed necessary in order to record the revenue, the cost of installation is accrued at the time product revenue is recorded and no related revenue is deferred. Historically, the costs of installation have not been significant.
The initial standard warranty for product sales is accounted for under the provisions of SFAS 5, “Accounting for Contingencies,” as we have the ability to ascertain the probable likelihood of the liability, and can estimate the amount of the liability. A provision for the estimated cost related to warranty is recorded to cost of goods sold at the time revenue is recognized. Our estimate of costs to service the warranty obligations are based on historical experience and expectations of future conditions. To the extent we experience increased warranty claims or increased costs associated with servicing those claims, revisions to the estimated warranty liability are recorded as increases or decreases to the accrual at that time, with an offsetting entry recorded to cost of goods sold.
We also sell optional extended warranty services, and preventative maintenance contracts, at the time of their product purchase. We account for these agreements in accordance with provisions of FASB Technical Bulletin (“FTB”) 90-1 “Accounting for Separately Priced Extended Warranty and Product Maintenance Contracts” under which we recognize the separately priced extended warranty and preventative maintenance fees over the associated period.
We, at the request of our customers, may at times perform professional services for our customers, generally for the maintenance and repairs of products previously sold to those customers. These services are usually in the form of time and materials based contracts which are short in their duration. Revenue for time and material services is recorded at the completion of services requested under a customer’s purchase order. Customers may, at times subsequent to the initial product sale, purchase a service contract whereby services, including preventative maintenance plans, are provided over a defined period, generally one year. Revenue for such service contracts are recorded ratably over the period of the contract.
We typically negotiate trade discounts and agreed terms in advance of order acceptance and record any such items as a reduction of revenue. Our revenue recognition policy allows for revenue to be recognized under arrangements where the payment terms are 180 days or less, presuming all other revenue recognition criteria have been met. From time to time, based on our review of customer creditworthiness and other factors, we may provide our customers with payment terms that exceed 180 days. To the extent all other revenue recognition criteria have been met, we recognize revenue for these extended payment arrangements as the payments become due.
We have significant deferred revenue included in our accompanying consolidated balance sheets, with balances (including both current and long-term amounts) of $84.2 million and $101.6 million as of December 31, 2008 and 2007, respectively. A significant majority of these amounts relate to arrangements whereby the entire arrangement has been accounted for as deferred revenue, as there is no fair value for the undelivered elements. Upon the final delivery of the undelivered element(s) of the arrangement, the revenue will be recorded for that arrangement. To a lesser extent, the deferred revenue balances relate to either: (a) the unrecognized portion of a multiple element arrangements that is being recognized into revenue over a ratable basis as associated services are performed; (b) arrangements not currently recognizable due to the arrangement not being fixed and determinable at its inception; (c) the future amortization to revenue of extended warranty contracts and preventative maintenance plans; (d) revenue deferrals for product shipments with FOB destination shipping terms; and (e) deposits from customers against future orders. The classification of deferred revenue, and deferred cost of goods sold, is based on our expectations relative to when the revenue will be recognized, based on facts known to us as of the date our financial statements are released.
Fair Value Measurements. On January 1, 2008, we adopted SFAS 157, “Fair Value Measurements,” with no impact on our consolidated results and financial position. SFAS 157 defines fair value, establishes a framework for measuring fair value, and enhances disclosures about fair value measurements. Fair value is defined as the price that would be received for an asset, or paid to transfer a liability, in an orderly transaction between market participants at the measurement date. Valuation techniques must maximize the use of observable inputs and minimize the use of unobservable inputs. SFAS 157 establishes a value hierarchy based on three levels of inputs, of which the first two are considered observable and the third is considered unobservable.
Included in our financial assets with fair value measurements are $32.3 million in par value auction rate securities that we acquired in connection with our purchase of Excel. These auction rate securities are level 3 assets for which no observable market value exists, and for which we have valued based on assumptions the market participants might use in their estimates of fair value. As of December 31, 2008, the auction rate securities have a fair value of $25.1 million.
60
Table of Contents
Included in our financial liabilities with fair value measurements are $210.0 million of Senior Notes. These senior notes have a fair value of $145.0 million, based on quoted prices for similar liabilities, or similar liabilities traded as assets.
Allowances for Doubtful Accounts. We are required to estimate the collectability of our trade receivables. A considerable amount of judgment is required in assessing the ultimate realization of receivables, including the current credit-worthiness of each customer. We maintain an allowance for doubtful accounts for estimated losses resulting from the inability of our customers to make required payments. If the financial condition of our customers were to deteriorate, resulting in an impairment of their ability to make payments, additional allowances may be required. The collectability of accounts receivable is evaluated based on a combination of factors. In circumstances where we are aware of a specific customer’s inability to meet its financial obligations (e.g., bankruptcy filings), a specific reserve for bad debts is recorded against amounts due, to reduce the net recognized receivable to the amount we reasonably believe will be collected. For all other customers, we estimate an allowance for bad debts based upon the total accounts receivable balance and the percentage expected to be realized through subsequent cash collections. If circumstances change (i.e., higher than expected defaults or an unexpected material adverse change in a major customer’s ability to meet its financial obligations to us), our estimates of the recoverability of amounts due to us could be reduced by a material amount.
Inventories. Inventories are stated at the lower of cost or market, after provisions for excess and obsolete inventory salable at prices below cost. Costs are determined using first-in, first-out method.
We write down inventory for estimated obsolescence or unmarketable inventory equal to the difference between the cost of inventory and the estimated market value based upon assumptions about future demand and market conditions. If actual market conditions are less favorable than those projected by us, additional inventory write-downs may be required.
Business Combinations. In accordance with SFAS 141, “Business Combinations,” we allocate the purchase price of acquired companies to the tangible and intangible assets acquired and liabilities assumed as well as to in-process research and development based upon their estimated fair values at the acquisition date. The purchase price allocation process requires management to make significant estimates and assumptions, especially at acquisition date with respect to intangible assets, support obligations assumed, estimated restructuring liabilities and pre-acquisition contingencies.
Although we believe the assumptions and estimates we have made in the past have been reasonable and appropriate, they are based in part on historical experience and information obtained from the management of the acquired companies and are inherently uncertain. Examples of critical estimates in valuing certain of the intangible assets we have acquired or may acquire in the future include but are not limited to:
| • | future expected cash flows from sales of acquired product lines, developed technologies and patents; |
| • | expected costs to develop in-process research and development projects into commercially viable products and the estimated cash flows from the projects when completed; |
| • | the acquired company’s brand and competitive position, as well as assumptions about the period of time the acquired brand will continue to be used in the combined company’s product portfolio; and |
| • | discount rates. |
Unanticipated events and circumstances may occur which may affect the accuracy or validity of such assumptions, estimates or actual results.
Effective January 1, 2009, we adopted SFAS 141 (revised 2007), “Business Combinations.” Refer to Recent Accounting Pronouncements below for additional information.
Goodwill, Intangible Assets and Impairment Assessment. As discussed above, in “Business Combinations,” our goodwill and intangible assets generally arise from business combinations. Our most significant intangible assets are acquired technology, customer relationships, and trademarks and trade names. The purchase price we pay for acquired companies is allocated first to the acquired tangible assets and liabilities at their fair value. Any excess purchase price is then allocated to identifiable intangible assets and the remainder, if any, is assigned to goodwill. We make various assumptions and estimates in order to assign fair value to acquired tangible and intangible assets and liabilities, including those associated with our business plans and related cash flow forecasts, as well as discount rates and terminal values, among others. Actual cash flows may vary from forecasts used to value the intangible assets at the time of the business combination.
61
Table of Contents
Our most significant intangible assets are acquired technology, customer relationships, and trademarks and trade names. In addition to our review of the carrying values of each asset, the useful life assumptions for each asset, including the classification of certain intangible assets as ‘indefinite lived’, are reviewed on a periodic basis to determine if changes in circumstances warrant revisions to them. All definite-lived intangible assets are amortized over the periods in which their economic benefits are expected to be realized.
We test our goodwill for impairment on an annual basis in accordance with SFAS 142, “Goodwill and Other Intangible Assets,” which first requires a comparison of the carrying value of each of our reporting units’ net assets to their fair value. If the carrying value of a reporting unit exceeds its fair value, we calculate the implied fair value of the reporting unit’s goodwill and compare it to the goodwill’s carrying value. If the carrying value of goodwill exceeds its implied fair value, an impairment charge is recorded for the difference. The implied fair value of goodwill is calculated by performing a fair value assessment of the assets and liabilities of the reporting unit, in a manner consistent with the discussion above with respect to the initial fair value allocation performed in a business combination. The carrying value of each reporting unit’s assets and liabilities are predominantly specifically identifiable. Additionally, reporting units that benefit from corporate assets or liabilities are allocated a portion of those corporate assets and liabilities on a systematic, proportional basis.
Our indefinite-lived intangible assets represent trade names that were acquired in the August 2008 Excel acquisition. The Company will assess these indefinite-lived intangible assets for impairment on an annual basis and periodically reassess their continuing classification as indefinite-lived. Discounted cash flow forecasts for each indefinite-lived intangible asset are used to fair value them. Impairment exists if the fair value of the intangible asset is less than its carrying value. An impairment charge equal to the difference is recorded to reduce the carrying value to its fair value.
We evaluate amortizable intangible assets and other long-lived assets for impairment, in accordance with SFAS 144, “Accounting for the Impairment or Disposal of Long-lived Assets,” whenever changes in events or circumstances indicate carrying values may exceed their undiscounted cash flow forecasts. If undiscounted cash flow forecasts indicate the carrying value of a definite-lived intangible asset may not be recoverable, a fair value assessment is performed. Fair value estimates are derived from discounted cash flow forecasts for the intangible asset. If fair value is less than carrying value, an impairment charge equal to the difference is recorded, thereby reducing the intangible asset’s carrying value to its fair value. We also review the useful life assumptions for definite-lived intangible assets on a periodic basis to determine if changes in circumstances warrant revisions to them. All definite-lived intangible assets are amortized over the periods in which their economic benefits are expected to be realized.
Factors which may trigger an impairment of our goodwill, intangible assets and other long-lived assets include the following:
| • | underperformance relative to historical or projected future operating results; |
| • | changes in the manner of our use of acquired assets or the strategy for our overall business; |
| • | negative industry or economic trends; |
| • | interest rate changes; |
| • | technological changes or developments; |
| • | changes in competition; |
| • | loss of key customers or personnel; |
| • | adverse judicial or legislative outcomes or political developments; |
| • | declines in our stock price for a sustained period; and |
| • | the decline of our market capitalization below net book value. |
62
Table of Contents
The occurrence of any of these events or any other unforeseeable event or circumstance that materially affects future results or cash flows may cause an impairment that is material to our results of operations or financial position in the reporting period in which it occurs or is identified.
The significant downturn in the global economy experienced in 2008, and most notably in the fourth quarter of 2008, negatively impacted our estimated future revenues and cash flows, as compared to our prior estimates, including those estimates made at the time we acquired Excel. Excel’s 2009 unaudited actual revenues were approximately 32% lower than Excel’s 2009 projected revenues at the time of the acquisition in August 2008. From the acquisition in August 2008 to December 2008, when the impairment analysis was performed, we reduced Excel’s annual revenue projections by $50.1 to $54.5 million per year, or on average approximately 26% per year, compared to the projections used to initially value the intangible assets in Excel’s purchase price allocation. During this same period of time, the Company’s cost of capital increased significantly, primarily due to the increase in risk associated with an investment in the Company’s equity securities. Our estimated cost of capital increased in the fourth quarter of 2008 after we announced the delayed filing of our financial results, as further discussed in Note 2 of the Company’s Notes to Consolidated Financial Statements. The announcement increased our risk profile and made financing more expensive, as a result of the decline in the Company’s stock price, the receipt by the Company of default notices from its noteholders, and the severe economic downturn. Our weighted average cost of capital forms the basis of the rates used to discount our cash flow forecasts which are integral to our fair value estimates. The discount rates utilized to initially value the intangible assets in the purchase price allocation ranged from 10.0% to 13.0%, while the discount rates utilized in the December 31, 2008 impairment analyses of the goodwill and other intangible assets ranged from 16.5% to 17.5%. Consequently, we undertook an impairment review of our goodwill, intangible assets and other long-lived assets (property, plant and equipment) as of December 31, 2008. This review led to us recording a charge to reduce the carrying value of these assets by an aggregate of $215.1 million. The results of the impairment review are summarized in the following table (in thousands):
| Pre-impairment Net Carrying Value |
Impairment Charge |
Post-impairment Net Carrying Value | ||||||||
| Goodwill |
$ | 176,232 | $ | (131,169 | ) | $ | 45,063 | |||
| Indefinite-lived intangible assets |
34,341 | (21,314 | ) | 13,027 | ||||||
| Definite-lived intangible assets |
115,563 | (57,130 | ) | 58,433 | ||||||
| Property, plant and equipment |
59,877 | (5,438 | ) | 54,439 | ||||||
| $ | 386,013 | $ | (215,051 | ) | $ | 170,962 | ||||
No impairment charges were recorded in 2007 or 2006. Following our 2008 impairment charge, we continue to maintain a significant balance in our goodwill, intangible assets and other long-lived assets. The following table shows the December 31, 2008 breakdown of goodwill, intangibles and property, plant and equipment by reportable segment:
| Goodwill | Intangible Assets |
Property, Plant & Equipment | |||||||
| Precision Technology |
$ | 9,245 | $ | 10,460 | $ | 7,816 | |||
| Semiconductor Systems |
– | – | 1,236 | ||||||
| Excel |
35,818 | 61,000 | 30,273 | ||||||
| Corporate |
– | – | 15,114 | ||||||
| $ | 45,063 | $ | 71,460 | $ | 54,439 | ||||
To the extent that our assumptions used to value the assets as of December 31, 2008 should adversely change or there is a further deterioration of the markets we serve, the broader worldwide economy, or the performance of our business relative to our expectations as of December 31, 2008, we may be required to record additional impairment charges in the future.
63
Table of Contents
Restructuring and Other Charges. In accounting for our restructuring activities, we follow the provisions of SFAS 146, “Accounting for Costs Associated with Exit or Disposal Activities.” In accounting for these obligations, we make assumptions related to the amounts of employee severance, benefits, and related costs and to the time period over which facilities will remain vacant, sublease terms, sublease rates and discount rates. Estimates and assumptions are based on the best information available at the time the obligation has arisen. These estimates are reviewed and revised as facts and circumstances dictate; changes in these estimates could have a material effect on the amount previously expensed against our earnings, and currently accrued on our consolidated balance sheet. The costs incurred to third parties, including attorneys, forensic accountants, and other advisors that related to the Company’s Revenue Review have been included in the Company’s 2008 restructuring and other charges. These costs are charged to expense as incurred.
Pension Plans. Two of our subsidiaries, located in the United Kingdom and Japan, maintain retirement plans that are accounted for as defined benefit plans. In 2006, the Company implemented accounting statement SFAS 158, “Employers’ Accounting for Defined Benefit Pension and Other Postretirement Plans.” The impact of the adoption of the measurement date provision of SFAS 158 was not material.
Our United Kingdom pension plan was closed to new membership in 1997 and we curtailed our sponsorship in 2002, limiting our obligation to benefits earned through that date. Benefits under this plan were based on the employees’ years of service and compensation. We continue to follow our policy to fund this pension plan based on widely accepted actuarial methods. At December 31, 2008, the market value of the plan assets was $2.8 million less than the projected benefit obligation.
The accounting rules applicable to our United Kingdom pension plan require amounts recognized in financial statements be determined on an actuarial basis, rather than as contributions are made to the plan. Since the market value of our pension assets is less than the accumulated pension benefit obligation, we recorded a $0.7 million non-cash charge to other comprehensive income in stockholders’ equity and an accrued long-term pension liability in 2008. At December 31, 2008, the cumulative balance of this non-cash charge amounted to $2.8 million. These charges to equity did not affect our net income. In 2008, we funded $0.6 million to the plan.
Our Japanese pension plan is a tax qualified plan that covers substantially all Japanese employees. Benefits are based on years of service and the employee’s compensation at retirement. We fund the plan sufficient to meet current benefits as well as fund a certain portion of future benefits as permitted in accordance with regulatory authorities. Since this is an active plan, a significant portion of the pension benefit obligation is determined based on the rate of future compensation increases. We deposit funds under various fiduciary-type arrangements and/or purchase annuities under group insurance contracts. At December 31, 2008, the market value of the plan assets was $1.3 million less than the projected benefit obligation.
Given both pension plans’ current under-funded status, changes in economic and market conditions may require us to increase cash contributions in future years.
Accounting for Income Taxes. As part of the process of preparing its consolidated financial statements, the Company is required to estimate its income tax provision (benefit) in each of the jurisdictions in which the Company operates. This process involves estimating its current income tax provision (benefit) together with assessing temporary differences resulting from differing treatment of items for tax and accounting purposes. These differences result in deferred tax assets and liabilities, which are included within its consolidated balance sheet
The Company records a valuation allowance to reduce its deferred tax assets to an amount that more likely than not will be realized. While the Company has considered future taxable income and ongoing prudent and feasible tax planning strategies in assessing the need for the valuation allowance, in the event the Company determines that it will be able to realize its deferred tax assets in the future in excess of its net recorded amount, a reduction to the valuation allowance for the deferred tax assets would increase income in the period such determination was made. Likewise, should the Company determine that it would not be able to realize all or part of its net deferred tax assets in the future, an adjustment to the valuation allowance for the deferred tax assets would decrease income in the period such determination was made.
The amount of income taxes the Company pays is subject to ongoing audits by federal, state and foreign tax authorities, which often results in proposed assessments. Its estimate for the potential outcome for any uncertain tax issue is highly judgmental. The Company believes that it has adequately provided for any reasonably foreseeable outcome related to these matters. However, its future results may include favorable or unfavorable adjustments to its estimated tax liabilities in the period that the assessments are made or resolved, or when the statute of limitations for certain periods expires. As a result, its effective tax rate may fluctuate significantly on a quarterly basis.
64
Table of Contents
Undistributed earnings of the Company’s non Canadian subsidiaries amounted to approximately $81.0 million as of December 31, 2008. The Company has not provided any additional federal or state income taxes or foreign withholding taxes on the undistributed earnings as such earnings have been indefinitely reinvested in the business as defined in the provisions of SFAS 109 as well as Accounting Principles Board (“APB”) 23. The determination of the amount of the unrecognized deferred tax liability related to the undistributed earnings is not practicable because of the complexities associated with its hypothetical calculation.
Effective January 1, 2007, the Company adopted FASB Interpretation (“FIN”) 48, Accounting for Uncertainty in Income Taxes— an interpretation of FASB Statement No. 109. FIN 48 prescribes a recognition threshold and a measurement attribute for the financial statement recognition and measurement of tax positions taken or expected to be taken in a tax return. For those benefits to be recognized, a tax position must be more likely than not to be sustained upon examination by taxing authorities.
The Company assessed all material positions taken in any income tax return, including all significant uncertain positions, in all tax years that are still subject to assessment or challenge by relevant taxing authorities. Assessing an uncertain tax position begins with the initial determination of the position’s sustainability and is measured at the largest amount of benefit that is greater than 50 percent likely of being realized upon ultimate settlement. As of each balance sheet date, unresolved uncertain tax positions must be reassessed, and the Company will determine whether (i) the factors underlying the sustainability assertion have changed and (ii) the amount of recognized tax benefit is still appropriate. The recognition and measurement of tax benefits requires significant judgment. Judgments concerning the recognition and measurement of a tax benefit might change as new information becomes available.
Loss Contingencies. We are subject to legal proceedings, lawsuits and other claims relating to labor, service and other matters arising in the ordinary course of business. Quarterly, we review the status of each significant matter and assess our potential financial exposure. If the potential loss from any claim or legal proceeding is considered probable and the amount can be reasonably estimated, we accrue a liability for the estimated loss. Significant judgment is required in both the determination of probability and the determination as to whether an exposure is reasonably estimable. Because of uncertainties related to these matters, accruals are based only on the best information available at the time. As additional information becomes available, we reassess the potential liability related to our pending claims and litigation and may revise our estimates. Such revisions in the estimates of the potential liabilities could have a material impact on our results of operations and financial position.
Recent Accounting Pronouncements
See Note 3 of Notes to Consolidated Financial Statements for recent accounting pronouncements that could have an effect on us.
| Item 7A. | Quantitative and Qualitative Disclosures about Market Risk |
We are exposed to market risk from changes in foreign currency exchange rates and interest rates, which could affect operating results, financial position and cash flows. We manage our exposure to these market risks through our regular operating and financing activities and, when appropriate, through the use of derivative financial instruments.
Foreign Currency Exchange Rate Risk and Sensitivity
We are exposed to changes in foreign currency exchange rates. Any foreign currency transaction, defined as a transaction denominated in a currency other than the U.S. dollar, will be reported in U.S. dollars at the applicable exchange rate. Assets and liabilities are translated into U.S. dollars at exchange rates in effect at the balance sheet date and income and expense items are translated at average rates for the period. The primary foreign currency denominated transactions include revenue and expenses and the resulting accounts receivable and accounts payable balances reflected on our balance sheet. Therefore, the change in the value of the U.S. dollar compared to foreign currencies will have either a positive or negative effect on our financial position and results of operations. Historically, our primary exposure has related to transactions denominated in the Japanese Yen, Euro, British Pound and Canadian Dollar.
A hypothetical change of 10% in appreciation or depreciation in foreign currency exchange rates from the quoted foreign currency exchange rates at December 31, 2008 would not have a material impact on our revenue, operating results or cash flows.
65
Table of Contents
Periodically, we enter into forward exchange contracts to hedge against foreign currency fluctuations. The Company’s primary objective for holding derivative financial instruments is to manage currency risk. In accordance with SFAS 133, “Accounting for Derivative Instruments and Hedging Activities,” the Company’s accounting policies for these instruments are based on whether they meet the criteria for designation as hedging transactions, including cash flow, or net investment hedges.
The Company did not have any derivative instruments that qualify for hedge accounting under SFAS 133, “Accounting for Derivative Instruments and Hedging Activities” at December 31, 2008 or 2007. The Company records all derivatives at fair value as assets or liabilities in the consolidated balance sheet and any changes are recognized in other income and expense.
When the Company enters into foreign currency derivative contracts, the contracts are generally for less than six months duration with the purpose of hedging foreign currency risk on sales transactions. At December 31, 2008, the Company held no derivative contracts. At December 31, 2007, the Company held forward contracts to: sell Japanese yen for the equivalent of $7.9 million; settle U.S. dollar / Japanese yen average strike option with an underlying currency amount of 400 million Japanese yen (equivalent $3.5 million); and buy British pound for the equivalent of $4.2 million.
Interest Rate Risk and Sensitivity
The Company’s exposure to market risk associated with changes in interest rates relates primarily to its cash and cash equivalents, short-term investments, long-term investments and debt obligations. At December 31, 2008, the Company had $69.0 million invested in cash and cash equivalents, as compared to $172.4 million at December 31, 2007. Due to the average maturities and the nature of the cash portfolio at December 31, 2008, a one percent change in interest rates could have a $0.7 million impact on interest income on an annual basis. The Company does not actively trade derivative financial instruments, but may use them to manage interest rate positions associated with its debt instruments. The Company did not hold interest rate derivative contracts as of December 31, 2008.
66
Table of Contents
| Item 8. | Financial Statements and Supplementary Data |
GSI GROUP INC.
INDEX TO CONSOLIDATED FINANCIAL STATEMENTS
67
Table of Contents
REPORT OF INDEPENDENT REGISTERED PUBLIC ACCOUNTING FIRM
To the Board of Directors and Shareholders of GSI Group Inc.
We have audited the accompanying consolidated balance sheets of GSI Group Inc. as of December 31, 2008 and 2007, and the related consolidated statements of operations, stockholders’ equity, and cash flows for each of the three years in the period ended December 31, 2008. These financial statements are the responsibility of the Company’s management. Our responsibility is to express an opinion on these financial statements based on our audits.
We conducted our audits in accordance with the standards of the Public Company Accounting Oversight Board (United States). Those standards require that we plan and perform the audit to obtain reasonable assurance about whether the financial statements are free of material misstatement. An audit includes examining, on a test basis, evidence supporting the amounts and disclosures in the financial statements. An audit also includes assessing the accounting principles used and significant estimates made by management, as well as evaluating the overall financial statement presentation. We believe that our audits provide a reasonable basis for our opinion.
In our opinion, the financial statements referred to above present fairly, in all material respects, the consolidated financial position of GSI Group Inc. at December 31, 2008 and 2007, and the consolidated results of its operations and its cash flows for each of the three years in the period ended December 31, 2008, in conformity with U.S. generally accepted accounting principles.
As discussed in Note 2 to the consolidated financial statements, the Company has restated its financial statements for the years ended December 31, 2007 and 2006 to correct certain errors in the area of revenue recognition and the effects on other accounts.
The accompanying financial statements have been prepared assuming that GSI Group Inc. will continue as a going concern. As more fully described in Note 1 to the consolidated financial statements, on November 20, 2009, the Company voluntarily filed petitions on behalf of the Parent and two subsidiaries for relief under Chapter 11 of the United States Bankruptcy Code. This filing caused the Company to be in default with covenants under its loan agreement. These conditions raise substantial doubt about the Company’s ability to continue as a going concern, given the uncertainty with respect to the realization of the value of its assets, and its ability to discharge its liabilities. Management’s plans in regard to these matters also are described in Note 1. The 2008 consolidated financial statements do not include any adjustments to reflect the possible future effects on the recoverability and classification of assets or the amounts and classification of liabilities that may result from the outcome of this uncertainty.
We have audited, in accordance with the standards of the Public Company Accounting Oversight Board (United States), GSI Group Inc.’s internal control over financial reporting as of December 31, 2008, based on criteria established in Internal Control-Integrated Framework issued by the Committee of Sponsoring Organizations of the Treadway Commission and our report dated April 13, 2010 expressed an adverse opinion thereon.
| /s/ ERNST & YOUNG LLP |
| Boston, Massachusetts | ||
| April 13, 2010 |
68
Table of Contents
CONSOLIDATED BALANCE SHEETS
(In thousands of U.S. dollars, except share data)
| December 31, 2008 | December 31, 2007 | ||||||
| (As Restated) | |||||||
| ASSETS | |||||||
| Current Assets |
|||||||
| Cash and cash equivalents |
$ | 69,001 | $ | 172,387 | |||
| Accounts receivable, net of $1,687 and $374, respectively |
50,494 | 71,631 | |||||
| Income taxes receivable |
30,038 | 21,790 | |||||
| Inventories |
78,508 | 64,139 | |||||
| Deferred tax assets |
11,106 | 8,541 | |||||
| Deferred cost of goods sold |
20,507 | 37,194 | |||||
| Deferred debt financing costs |
5,999 | — | |||||
| Other current assets |
9,569 | 7,120 | |||||
| Current assets of discontinued business held for sale |
— | 3,864 | |||||
| Total current assets |
275,222 | 386,666 | |||||
| Property, plant and equipment, net of accumulated depreciation and amortization |
54,439 | 28,382 | |||||
| Deferred tax assets |
23,802 | 16,589 | |||||
| Deferred cost of goods sold |
23,133 | 12,758 | |||||
| Investments in auction rate securities |
25,065 | — | |||||
| Other assets |
2,133 | 1,566 | |||||
| Intangible assets, net |
71,460 | 29,775 | |||||
| Goodwill |
45,063 | 26,291 | |||||
| Noncurrent assets of discontinued business held for sale |
— | 5,618 | |||||
| Total assets |
$ | 520,317 | $ | 507,645 | |||
| LIABILITIES AND STOCKHOLDERS’ EQUITY | |||||||
| Current Liabilities |
|||||||
| Debt (Note 8) |
$ | 185,115 | $ | — | |||
| Accounts payable |
20,286 | 17,905 | |||||
| Income taxes payable |
— | 1,546 | |||||
| Accrued compensation and benefits |
7,894 | 9,848 | |||||
| Deferred revenue |
45,061 | 79,462 | |||||
| Deferred tax liabilities |
486 | 286 | |||||
| Other accrued expenses |
23,814 | 8,980 | |||||
| Current liabilities of discontinued business held for sale |
— | 1,577 | |||||
| Total current liabilities |
282,656 | 119,604 | |||||
| Deferred revenue |
39,164 | 22,101 | |||||
| Deferred tax liabilities |
30,131 | 10,124 | |||||
| Accrued restructuring, net of current portion |
1,072 | 1,015 | |||||
| Income taxes payable |
5,166 | 3,966 | |||||
| Accrued pension liability |
4,104 | 4,481 | |||||
| Other liabilities |
5,127 | 676 | |||||
| Minority interest |
220 | — | |||||
| Total liabilities |
367,640 | 161,967 | |||||
| Commitments and contingencies (Note 14) |
|||||||
| Stockholders’ equity: |
|||||||
| Common shares, no par value; Authorized shares: unlimited; Issued and outstanding: 47,567,874 and 42,161,592, respectively |
330,896 | 310,970 | |||||
| Additional paid-in capital |
10,733 | 8,191 | |||||
| Retained earnings (accumulated deficit) |
(184,716 | ) | 19,131 | ||||
| Accumulated other comprehensive income (loss) |
(4,236 | ) | 7,386 | ||||
| Total stockholders’ equity |
152,677 | 345,678 | |||||
| Total liabilities and stockholders’ equity |
$ | 520,317 | $ | 507,645 | |||
The accompanying notes are an integral part of these financial statements.
69
Table of Contents
CONSOLIDATED STATEMENTS OF OPERATIONS
(In thousands of U.S. dollars, except per share data)
| Year Ended December 31, | ||||||||||||
| 2008 | 2007 | 2006 | ||||||||||
| (As Restated) | (As Restated) | |||||||||||
| Sales |
$ | 288,468 | $ | 291,081 | $ | 259,030 | ||||||
| Cost of goods sold |
190,850 | 177,948 | 156,632 | |||||||||
| Gross profit |
97,618 | 113,133 | 102,398 | |||||||||
| Operating expenses: |
||||||||||||
| Research and development and engineering |
33,449 | 29,861 | 30,130 | |||||||||
| Selling, general and administrative |
65,904 | 59,545 | 62,893 | |||||||||
| Amortization of purchased intangible assets |
5,714 | 2,213 | 2,131 | |||||||||
| Impairment of goodwill, intangible assets and other long-lived assets |
215,051 | — | — | |||||||||
| Restructuring and other |
10,485 | 6,655 | — | |||||||||
| Acquisition related in-process research and development charge |
12,142 | — | — | |||||||||
| Total operating expenses |
342,745 | 98,274 | 95,154 | |||||||||
| Income (loss) from operations |
(245,127 | ) | 14,859 | 7,244 | ||||||||
| Interest income |
3,310 | 6,637 | 4,627 | |||||||||
| Interest expense |
(10,388 | ) | (128 | ) | (597 | ) | ||||||
| Foreign exchange transaction gains (losses) |
928 | 589 | (1,441 | ) | ||||||||
| Other income (expense), net |
(604 | ) | 215 | (63 | ) | |||||||
| Income (loss) from continuing operations before income taxes |
(251,881 | ) | 22,172 | 9,770 | ||||||||
| Income tax provision (benefit) |
(39,032 | ) | 7,484 | 2,914 | ||||||||
| Income (loss) from continuing operations |
(212,849 | ) | 14,688 | 6,856 | ||||||||
| Income from discontinued operations, net of tax |
270 | 467 | 645 | |||||||||
| Gain on disposal of discontinued operations, net of tax |
8,732 | — | — | |||||||||
| Net income (loss) |
$ | (203,847 | ) | $ | 15,155 | $ | 7,501 | |||||
| Net income (loss) from continuing operations per common share: |
||||||||||||
| Basic |
$ | (4.94 | ) | $ | 0.35 | $ | 0.16 | |||||
| Diluted |
$ | (4.94 | ) | $ | 0.34 | $ | 0.16 | |||||
| Net income from discontinued operations per common share: |
||||||||||||
| Basic |
$ | 0.21 | $ | 0.01 | $ | 0.02 | ||||||
| Diluted |
$ | 0.21 | $ | 0.01 | $ | 0.02 | ||||||
| Net income (loss) per common share: |
||||||||||||
| Basic |
$ | (4.73 | ) | $ | 0.36 | $ | 0.18 | |||||
| Diluted |
$ | (4.73 | ) | $ | 0.35 | $ | 0.18 | |||||
| Weighted average common shares outstanding – basic |
43,125 | 42,364 | 41,896 | |||||||||
| Weighted average common shares outstanding - diluted |
43,125 | 42,645 | 42,251 | |||||||||
The accompanying notes are an integral part of these financial statements.
70
Table of Contents
CONSOLIDATED STATEMENTS OF STOCKHOLDERS’ EQUITY
(In thousands of U.S. dollars)
| Capital Stock | Additional Paid-In-Capital |
Retained Earnings (Accumulated Deficit) |
Accumulated Other Comprehensive Income (Loss) |
Total | Comprehensive Income (Loss) |
||||||||||||||||||||||
| # Shares | Amount | ||||||||||||||||||||||||||
| Balance, December 31, 2005 (As Originally Reported) |
41,628 | $ | 309,545 | $ | 3,339 | $ | 7,688 | $ | (14,016 | ) | $ | 306,556 | |||||||||||||||
| Cumulative effect of restatement |
264 | (11,067 | ) | (10,803 | ) | ||||||||||||||||||||||
| Balance, December 31, 2005 (As Restated) |
41,628 | 309,545 | 3,603 | (3,379 | ) | (14,016 | ) | 295,753 | |||||||||||||||||||
| Net income |
7,501 | 7,501 | $ | 7,501 | |||||||||||||||||||||||
| Exercise of stock options and warrants |
643 | 4,863 | 4,863 | ||||||||||||||||||||||||
| Repurchase of treasury shares |
(381 | ) | (3,773 | ) | (3,773 | ) | |||||||||||||||||||||
| Share based compensation |
676 | 676 | |||||||||||||||||||||||||
| Excess tax benefit of stock options |
1,035 | 1,035 | |||||||||||||||||||||||||
| Unrealized loss on investments, net of tax of $0 |
(9 | ) | (9 | ) | (9 | ) | |||||||||||||||||||||
| Pension liability, net of tax of $244 |
1,786 | 1,786 | 1,786 | ||||||||||||||||||||||||
| SFAS 158 Employer’s Accounting for Defined Benefit Pension and Other Retirement Plans Transition Adjustment |
(483 | ) | (483 | ) | |||||||||||||||||||||||
| Foreign currency translation adjustments |
10,327 | 10,327 | 10,327 | ||||||||||||||||||||||||
| Balance, December 31, 2006 (As Restated) |
41,890 | 310,635 | 5,314 | 4,122 | (2,395 | ) | 317,676 | $ | 19,605 | ||||||||||||||||||
| Net income |
15,155 | 15,155 | $ | 15,155 | |||||||||||||||||||||||
| Exercise of stock options and warrants |
955 | 8,179 | 8,179 | ||||||||||||||||||||||||
| Issuance of restricted stock |
134 | — | — | ||||||||||||||||||||||||
| Repurchase of treasury shares |
(817 | ) | (7,844 | ) | (7,844 | ) | |||||||||||||||||||||
| Share based compensation |
2,454 | 2,454 | |||||||||||||||||||||||||
| Excess tax benefit of stock options |
423 | 423 | |||||||||||||||||||||||||
| Pension liability, net of tax of $20 |
4,172 | 4,172 | 4,172 | ||||||||||||||||||||||||
| Cumulative effect of adoption of FIN48 |
(146 | ) | (146 | ) | |||||||||||||||||||||||
| Foreign currency translation adjustments |
5,609 | 5,609 | 5,609 | ||||||||||||||||||||||||
| Balance, December 31, 2007 (As Restated) |
42,162 | 310,970 | 8,191 | 19,131 | 7,386 | 345,678 | $ | 24,936 | |||||||||||||||||||
| Net loss |
(203,847 | ) | (203,847 | ) | $ | (203,847 | ) | ||||||||||||||||||||
| Exercise of stock options and warrants |
5,875 | 26,365 | 26,365 | ||||||||||||||||||||||||
| Issuance of restricted stock |
305 | — | — | ||||||||||||||||||||||||
| Repurchase of treasury shares |
(774 | ) | (6,439 | ) | (6,439 | ) | |||||||||||||||||||||
| Share based compensation |
2,761 | 2,761 | |||||||||||||||||||||||||
| Excess tax expense of stock options and restricted stock |
(219 | ) | (219 | ) | |||||||||||||||||||||||
| Unrealized gain on investments, net of tax of $0 |
80 | 80 | 80 | ||||||||||||||||||||||||
| Pension liability, net of tax of $0 |
797 | 797 | 797 | ||||||||||||||||||||||||
| Foreign currency translation adjustments |
(12,499 | ) | (12,499 | ) | (12,499 | ) | |||||||||||||||||||||
| Balance, December 31, 2008 |
47,568 | $ | 330,896 | $ | 10,733 | $ | (184,716 | ) | $ | (4,236 | ) | $ | 152,677 | $ | (215,469 | ) | |||||||||||
The accompanying notes are an integral part of these financial statements.
71
Table of Contents
CONSOLIDATED STATEMENTS OF CASH FLOWS
(In thousands of U.S. dollars)
| Year Ended December 31, | ||||||||||||
| 2008 | 2007 | 2006 | ||||||||||
| (As Restated) | (As Restated) | |||||||||||
| Cash flows from operating activities: |
||||||||||||
| Net income (loss) |
$ | (203,847 | ) | $ | 15,155 | $ | 7,504 | |||||
| Adjustments to reconcile net income (loss) to net cash from operating activities: |
||||||||||||
| Income from operations of discontinued operations |
(270 | ) | (467 | ) | (645 | ) | ||||||
| Gain on disposal of discontinued operations |
(8,732 | ) | — | — | ||||||||
| Depreciation and amortization |
18,906 | 14,463 | 13,256 | |||||||||
| Impairment of goodwill, intangible assets and property, plant and equipment |
215,051 | — | — | |||||||||
| Acquisition related in-process research and development charge |
12,142 | — | — | |||||||||
| Step-up value of acquired inventory sold |
1,240 | — | — | |||||||||
| Share based compensation |
2,761 | 2,454 | 676 | |||||||||
| Deferred income taxes |
(33,670 | ) | 1,057 | 7,357 | ||||||||
| Earnings from equity investments |
56 | (156 | ) | — | ||||||||
| Unrealized (gain) loss on derivatives |
— | 102 | (97 | ) | ||||||||
| Gain on disposal of property and assets |
(1,208 | ) | — | (187 | ) | |||||||
| Non-cash interest expense |
1,890 | — | — | |||||||||
| Non-cash restructuring charges |
3,563 | 3,401 | — | |||||||||
| Changes in current assets and liabilities, net of effects from business acquired: |
||||||||||||
| Accounts receivable |
37,759 | (20,190 | ) | 1,480 | ||||||||
| Inventories |
19,898 | 5,403 | (4,980 | ) | ||||||||
| Deferred costs |
5,724 | (7,033 | ) | (24,205 | ) | |||||||
| Other current assets |
(7,412 | ) | 6,380 | 3,224 | ||||||||
| Deferred revenue |
(15,924 | ) | 14,297 | 43,770 | ||||||||
| Accounts payable, accruals and taxes receivable and payable |
(8,020 | ) | 4,072 | (11,952 | ) | |||||||
| Cash used in operating activities of discontinued operations |
(1,005 | ) | (1,346 | ) | (33 | ) | ||||||
| Cash provided by operating activities |
38,902 | 37,592 | 35,168 | |||||||||
| Cash flows from investing activities: |
||||||||||||
| Acquisition of Excel |
(368,711 | ) | — | — | ||||||||
| Cash received in acquisition of Excel |
10,430 | — | — | |||||||||
| Acquisition of other business |
— | (3,006 | ) | — | ||||||||
| Purchases of property, plant and equipment |
(17,951 | ) | (4,639 | ) | (1,055 | ) | ||||||
| Proceeds from the sale and maturity of short-term and other investments |
— | — | 49,271 | |||||||||
| Purchase of short-term and other investments |
— | — | (22,602 | ) | ||||||||
| Proceeds from the sale of property, plant and equipment |
3,211 | — | 6,293 | |||||||||
| Proceeds from sale of discontinued operations |
21,593 | — | — | |||||||||
| Changes in other assets and liabilities |
12,064 | 146 | 1,625 | |||||||||
| Cash provided by (used in) investing activities from discontinued operations |
965 | (467 | ) | (552 | ) | |||||||
| Cash provided by (used in) investing activities |
(338,399 | ) | (7,966 | ) | 32,980 | |||||||
| Cash flows from financing activities: |
||||||||||||
| Proceeds from issuance of debt |
210,000 | — | — | |||||||||
| Payments for debt issuance costs |
(6,472 | ) | — | — | ||||||||
| Purchases of the Company’s common shares |
(6,439 | ) | (7,844 | ) | (3,773 | ) | ||||||
72
Table of Contents
| Year Ended December 31, | |||||||||||
| 2008 | 2007 | 2006 | |||||||||
| Net proceeds from the issuance of share capital |
63 | 8,179 | 4.863 | ||||||||
| Excess tax (expense) / benefit of stock options |
(219 | ) | 423 | 1,035 | |||||||
| Cash provided by financing activities |
196,933 | 758 | 2,125 | ||||||||
| Cash provided by discontinued operations |
|||||||||||
| Effect of exchange rates on cash and cash equivalents |
(822 | ) | 3,688 | (1,245 | ) | ||||||
| Increase (decrease) in cash and cash equivalents |
(103,386 | ) | 34,072 | 69,028 | |||||||
| Cash and cash equivalents, beginning of period (1) |
172,387 | 138,315 | 69,287 | ||||||||
| Cash and cash equivalents, end of period (1) |
$ | 69,001 | $ | 172,387 | $ | 138,315 | |||||
| Supplemental disclosure of cash flow information: |
|||||||||||
| Cash paid for interest expense |
156 | 918 | 521 | ||||||||
| Cash paid for income taxes |
1,345 | 11,689 | 10,921 | ||||||||
| Supplemental disclosure of non cash financing activity: |
|||||||||||
| Issuance of warrants |
26,302 | — | — | ||||||||
| Supplemental disclosure of non cash investing activity: |
|||||||||||
| Auction rate securities |
80 | — | — | ||||||||
| (1) | The Consolidated Statements of Cash Flows include cash and cash equivalent balances (in thousands) of $0, $1 and $1,814 of the discontinued operations for the years ended December 31, 2008, 2007, and 2006, respectively. |
The accompanying notes are an integral part of these financial statements.
73
Table of Contents
NOTES TO CONSOLIDATED FINANCIAL STATEMENTS
As of December 31, 2008
1. Organization, Presentation and Significant Events
GSI Group Inc. (“GSIG”) and its subsidiaries (collectively “the Company”) designs, develops, manufactures and sells photonics-based solutions (consisting of lasers, laser systems and electro-optical components), precision motion devices, associated precision motion control technology and systems. Its customers incorporate its technology into their products or manufacturing processes, for a wide range of applications in a variety of markets, including: industrial, scientific, electronics, semiconductor, medical and aerospace. The Company operates in three segments: Precision Technology, Semiconductor Systems, and Excel Technology, Inc. (“Excel”). The Company’s principal markets are in North America, Europe, Japan and Asia-Pacific. The Company exists under the laws of New Brunswick, Canada.
Acquisition of Excel Technology, Inc.
In August 2008, the Company acquired Excel, a designer, manufacturer and marketer of photonics-based solutions consisting of lasers, laser-based systems, precision motion devices and electro-optical components, primarily for industrial and scientific applications. Excel, which was headquartered in East Setauket, New York, manufactures its products in plants located in the United States and Germany, and sells its products to customers worldwide, both directly and indirectly through resellers and distributors. The Company acquired Excel in exchange for a cash payment of $368.7 million, including transaction costs, a portion of which was financed by entering into a loan agreement for $210.0 million. This loan is further discussed in the section below titled ‘Chapter 11 Bankruptcy Filing’, and in Note 8 of Notes to Consolidated Financial Statements. Subsequent to the acquisition of Excel, the Company established a third segment which is comprised solely of the operations of the newly acquired entity. See Note 4 of Notes to Consolidated Financial Statements for further details regarding the Excel transaction.
Divestiture of U.S. General Optics Business
On October 8, 2008, the Company completed the sale of its General Optics business, located in Moorpark, California, (the “U.S. Optics Business”) for a sale price of $21.6 million, which represented a gain of $8.7 million, net of tax. The sale of the U.S. Optics Business is reported as Gain on Disposal of Discontinued Operations in our consolidated statements of operations for the year ended December 31, 2008. This business was part of the Company’s Precision Technology Segment. The results of operations of the U.S. Optics Business have been reclassified and reported as income from discontinued operations in our consolidated statements of operations. See Note 5 of Notes to Consolidated Financial Statements for further details regarding the sale of the U.S. Optics Business.
NASDAQ Delisting Determination
On November 3, 2009, the NASDAQ Hearing Panel (the “Panel”) of the NASDAQ Stock Market (“NASDAQ”) notified the Company that it had determined to delist the Company’s common shares from the NASDAQ Global Select Market and to suspend trading in the Company’s common shares effective at the open of market on November 5, 2009. The Panel’s determination was made in connection with the Company’s non-compliance with the filing requirements set forth in Listing Rule 5250(c)(1) due to the delayed filing of certain of our periodic reports. As permitted by NASDAQ rules, the Company timely appealed the Panel’s determination to the NASDAQ Listing and Hearing Review Council (the “Listing Council”). On January 15, 2010, the Listing Council notified the Company that it affirmed the Panel’s decision to delist the Company’s securities. On March 15, 2010, the Company received notification from the NASDAQ Stock Market, LLC Board of Directors (the “NASDAQ Board”) that the NASDAQ Board has declined to call for review the January 15, 2010 decision of the Listing Council. Accordingly, pursuant to Listing Rule 5825, the Listing Council’s decision represents the final decision of NASDAQ. In accordance with Listing Rule 5830 and Rule 12d2-2 under the Securities Exchange Act of 1934, NASDAQ filed an application on Form 25 with the SEC on April 5, 2010, to delist the Company’s securities from NASDAQ. The application will become effective ten days after filing.
74
Table of Contents
GSI GROUP INC.
NOTES TO CONSOLIDATED FINANCIAL STATEMENTS—(Continued)
As of December 31, 2008
The Company’s common shares are currently quoted on the Pink OTC Markets Inc., continuing under the trading symbol “GSIGQ.” The Company intends to seek relisting of its common shares on a national exchange as soon as possible once it becomes current in its reporting obligations.
75
Table of Contents
GSI GROUP INC.
NOTES TO CONSOLIDATED FINANCIAL STATEMENTS—(Continued)
As of December 31, 2008
Chapter 11 Bankruptcy Filing
In connection with the Company’s failure to file the 2008 Q3 Report, as described in the Explanatory Note, on December 12, 2008, the Company announced that it had received four letters from certain noteholders of the 11% Senior Notes due in 2013, in the principal amount of $210.0 million (the “Senior Notes”), issued by GSI Group Corporation (“GSI US”), alleging that the Company had failed to comply with a covenant in the Senior Note Indenture (the “Indenture”), relating to the Senior Notes, as a result of the Company’s failure to file its 2008 Q3 Report within the time period specified by the rules and regulations of the SEC. These noteholders further alleged that, if such failure continued for 60 days from the date that the Company received notices of failure from holders comprising at least 25% of the aggregate principal amount of Senior Notes then outstanding, then such failure would constitute an event of default. Although the Company asserted that the letters did not constitute proper notice as required pursuant to the terms of the Indenture, and notified the trustee under the Indenture as such, the Company continued to work diligently to complete the review by its Audit Committee and to file its 2008 Q3 Report to avoid any claim of an “Event of Default” from occurring under the Indenture. Upon receipt of the letters from the noteholders, the Company commenced discussions with certain of the noteholders. On February 11, 2009, the Company announced that it entered into forbearance agreements with certain noteholders holding greater than 75% of the outstanding aggregate principal amount of the Senior Notes, pursuant to which such noteholders agreed to forebear from taking any action or exercising any remedies under the Indenture as a result of the Company’s delayed periodic reports until February 27, 2009, pursuant to other terms and conditions more specifically set forth therein. On June 30, 2009, the Company announced that it reached an agreement on a non-binding term sheet with certain noteholders to consensually restructure the Company’s outstanding obligations under the Senior Notes.
Following negotiations between the Company and certain noteholders about the restructuring, on November 20, 2009 (the “Petition Date”), GSIG and two of its United States subsidiaries, GSI US and MES International, Inc. (“MES” and, collectively with GSIG and GSI US, the “Debtors”), filed voluntary petitions for relief (the “Chapter 11 Petitions”) under Chapter 11 of the United States Bankruptcy Code (the “Bankruptcy Code”) in the United States Bankruptcy Court for the District of Delaware (the “Court”) (the “Chapter 11 Cases”). Following the Petition Date, the Debtors will continue to operate their business as “debtors-in-possession” under the jurisdiction of the Court and in accordance with the applicable provisions of the Bankruptcy Code and orders of the Court.
On November 19, 2009, in anticipation of filing the Chapter 11 Petitions, the Debtors entered into a Noteholder Restructuring Support Agreement with eight of ten of the beneficial holders (the “Consenting Noteholders”) of the Senior Notes, representing Consenting Noteholders holding approximately 88.1% of the outstanding principal amount of the Senior Notes. Pursuant to the Noteholder Restructuring Support Agreement, the Consenting Noteholders have agreed, subject to certain conditions, to support the Joint Chapter 11 Plan of Reorganization proposed by the Debtors, which was filed with the Chapter 11 Petitions.
On March 16, 2010, the Debtors entered into an Amended and Restated Plan Noteholder Restructuring Support Agreement (as amended, the “Plan Support Agreement”) with Consenting Noteholders holding approximately 88.1% of the outstanding principal amount of the Senior Notes. Pursuant to the Plan Support Agreement, the Consenting Noteholders have agreed to support a modified plan, in substantially the form of the Second Modified Joint Chapter 11 Plan of Reorganization for the Debtors as filed with the Court on March 16, 2010, and attached as Exhibit A to the Amended Plan Support Agreement (the “ Second Modified Plan”).
On April 9, 2010, the Debtors filed their Third Modified Joint Chapter 11 Plan of Reorganization (as modified, the “Plan”) with the Court, which reflected further modifications to the Second Modified Plan. The terms of the Plan are hereafter described under the heading “The Third Modified Joint Chapter 11 Plan of Reorganization.”
The Third Modified Joint Chapter 11 Plan of Reorganization
Pursuant to the Plan, which is subject to Court approval, the holders of claims under the Senior Notes (the “Senior Note Claims”) would, in exchange for the Senior Note Claims, receive their pro rata share of (i) shares of new convertible preferred stock of GSIG (the “Preferred Shares”), which, on an as-converted basis, would represent approximately 53.8% of GSIG’s post-consummation outstanding shares, (ii) new secured notes in the aggregate amount of $110 million, (iii) excess cash available under the Plan to the extent certain allowed claims exceed $22.5 million and (iv) a cash payment (the “Cash Payment”) in an amount of $69,315 for each day from and including the Petition Date until the date the plan distribution date. Under the terms of the Plan and because the Debtors commenced the Chapter 11 Cases by November 20, 2009, this Cash Payment would be reduced by $2.1 million. On the effective date of the Plan, GSIG would also pay any and all interest accrued on the Senior Note Claims until the Petition Date. As of the Petition Date, there is approximately $6.03 million in
76
Table of Contents
GSI GROUP INC.
NOTES TO CONSOLIDATED FINANCIAL STATEMENTS—(Continued)
As of December 31, 2008
accrued and unpaid interest with respect to the Senior Notes. The Preferred Shares would have a 1x liquidation preference and be mandatorily redeemable after 8 years for cash or, if certain circumstances are met, common shares of GSIG. The Preferred Shares would be voted on an as-converted basis together with GSIG’s common shares and share pari passu in any dividend declared on common shares, but not have any guaranteed fixed dividend rights. The interest rate on the new secured notes would be 12.25% and, at GSI US’s option, subject to GSIG’s compliance with a fixed charge coverage ratio defined in the indenture for the new secured notes to be entered into upon the effective date of the Plan, would be payable in kind at a compounded rate of 13%. The new secured notes would be issued by GSI US, guaranteed by GSIG, ten of GSI US’s United States subsidiaries, and two of GSIG’s Canadian subsidiaries and secured by substantially all the assets of GSI US and the guarantors.
As part of the Plan, GSIG’s wholly owned subsidiary, GSI Group Limited, would, in exchange for claims under an unsecured note in the principal amount (as fixed pursuant to the Plan) of $20 million, payable by GSI US to GSI Group Limited (the “GSI UK Note Claim”), receive (i) Preferred Shares, which, on an as-converted basis, would represent approximately 5.1% of GSIG’s post-consummation outstanding shares, (ii) approximately $10.5 million of the new secured notes, (iii) its pro rata share of the excess cash available under the Plan to the extent certain allowed claims exceed $22.5 million and (iv) its pro rata share of the Cash Payment, as adjusted. On the effective date of the Plan, GSIG would also pay interest accrued on the GSI UK Note Claim until the Petition Date.
As contemplated by the Plan, existing shareholders would (i) retain 41.1% of GSIG’s post-consummation outstanding shares, which would be issued in common shares and (ii) receive one series of three-year warrants to purchase a number of common shares equal to 10% of 111% of the post consummation outstanding shares of GSIG (that is, the number of shares of GSIG that would equal 10% of the shares of GSIG, including the Preferred Shares on an as-converted basis, before taking into account the number of shares represented by such warrants) at a strike price of $2.50 per share.
Under the proposed Plan, all classes of claims, including all claims by vendors and suppliers, would be unimpaired and paid in full, except for the Senior Note Claims, the GSI UK Note Claim and the equity interest in GSIG.
The Plan provides that its effectiveness is subject to customary conditions, including, without limitation, that the effective date occurs on or before May 20, 2010, unless such date is extended pursuant to the Plan Support Agreement.
The Plan contemplates that the Debtors will continue to operate their businesses in substantially their current form. On November 23, 2009, the Debtors obtained the Court’s approval of so-called first day motions providing for the continued payment of vendors and suppliers under normal terms in the ordinary course of business for goods and services provided to the Debtors prior to and after the Petition Date. On December 18, 2009, the Court approved the Plan Support Agreement. The Court further approved the Debtors’ Disclosure Statement with respect to the Plan on January 8, 2010, and set a date for consideration of confirmation of the Plan for April 16, 2010.
The Plan provides that, following the effective date of the Plan, GSIG’s Board of Directors would be comprised of seven directors, to include its Chief Executive Officer, three members to be appointed by the beneficial holders of the Senior Notes, two members to be appointed by the current shareholders of GSIG and one member to be appointed by the current board of directors of GSIG, which member will be selected from the members of GSIG’s current board of directors as of the date of the Plan. The Plan anticipates that the current officers of GSIG would continue as officers of GSIG following the effective date of the Plan.
The recoveries summarized above and the other terms of GSIG’s restructuring are more fully described in the Plan, which forms a part of the Plan Support Agreement.
The Plan Support Agreement
The Debtors’ proposed financial restructuring, as set forth in the Plan, has the support of Consenting Noteholders holding approximately 88.1% of the principal amount of the outstanding Senior Notes, representing 80% of all holders of the Senior Notes. The Plan Support Agreement was approved by the Court on December 18, 2009, and, as noted above, was amended and restated on March 16, 2010.
The Plan Support Agreement requires the Consenting Noteholders, and their successors and assigns, (i) to timely file a notice with the Court indicating that the votes previously submitted by the Consenting Noteholders with respect to the Plan shall constitute and be deemed votes accepting and in favor of the Plan, (ii) not to object to confirmation of the Plan and not to object to, or otherwise commence, any proceeding to oppose or alter the Plan or support an alternative restructuring, (iii) not to withdraw, change or revoke their votes with respect to the Plan, except as otherwise permitted in the Plan Support
77
Table of Contents
GSI GROUP INC.
NOTES TO CONSOLIDATED FINANCIAL STATEMENTS—(Continued)
As of December 31, 2008
Agreement, and (iv) except as otherwise permitted in the Plan Support Agreement, not to take any other action, including commencing any legal proceeding, that is inconsistent with, or that would materially prevent, hinder or delay the consummation of, the restructuring.
The support of the Consenting Noteholders under the Plan Support Agreement will terminate under certain circumstances, including, without limitation, if (i) the Debtors are in material breach of any obligations under the Plan Support Agreement, (ii) the Debtors file any motion or pleading with the Court that is inconsistent in a material respect with the Plan Support Agreement or the Plan, (iii) the Court grants relief that is materially inconsistent with the Plan Support Agreement or the Plan, (iv) the Debtors fail to achieve certain deadlines with respect to the approval of the Plan Support Agreement or the disclosure statement or confirmation or effectiveness of the Plan, (v) a trustee is appointed in the Chapter 11 Cases or any of the Chapter 11 Cases is dismissed or converted to a case under Chapter 7 of the Bankruptcy Code or if the Debtors make a motion for such appointment, dismissal or conversion, (vi) the Court enters an order invalidating, disallowing, subordinating, recharacterizing or limiting the principal and interest components of the Senior Note Claims or disgorging any amounts paid prior to the Petition Date from any holder of the Senior Note Claims or (vii) there is a Material Adverse Change to GSIG (as defined in the Plan Support Agreement).
The Plan Support Agreement provides that GSIG shall use its best efforts to (i) support and complete the restructuring and all transactions contemplated by the Plan, (ii) take any and all necessary and appropriate actions in furtherance of the restructuring, (iii) complete the restructuring and all transactions contemplated under the Plan within set time-frames, (iv) obtain any and all required regulatory and/or third-party approvals for the restructuring, and (v) not directly or indirectly seek, solicit, support, consent to, or participate in the negotiation or formulation of alternate plans of reorganization, certain other corporate transactions, such as mergers, dissolutions, or a sale of substantially all of GSIG’s assets or any other action that is inconsistent with the reorganization as contemplated by the Plan Support Agreement.
Subsequent to the Petition Date, the provisions in Financial Accounting Standards Board (“FASB”) Staff Position (“FSP”) 90-7-1, “Financial Reporting by Entities in Reorganization under the Bankruptcy Code,” apply to the Debtors’ financial statements while the Debtors operate under the provisions of Chapter 11. FSP 90-7-1 does not change the application of generally accepted accounting principles in the preparation of financial statements. However, FSP 90-7-1 does require that the financial statements, for periods including and subsequent to the filing of the Chapter 11 petition, distinguish transactions and events that are directly associated with the reorganization from the ongoing operations of the business.
Companies’ Creditors Arrangement Act
On April 8, 2010, the Debtors commenced certain parallel proceedings to the Chapter 11 Cases before the Court of Queen’s Bench of New Brunswick (the “NB Court”), pursuant to section 46 of the Companies’ Creditors Arrangement Act, for an order of the NB Court recognizing the “foreign main proceeding” constituting the Chapter 11 Cases and seeking relief from certain actions by the NB Court.
Going Concern
Operating in bankruptcy imposes significant risks and uncertainties on our business. See Item 1A — “Risk Factors — Risks Relating to Bankruptcy” for a discussion of the risks and uncertainties relating to our business and investing in the Company’s securities as a result of the Chapter 11 Cases.
The Company believes that when it emerges from bankruptcy, it will be sufficiently capitalized. The Company expects that it will have assets that exceed its liabilities, and that those assets, as well as the net assets derived from its continuing operations, will be sufficient to meet the Company’s obligations, including the obligations with respect to the payment of interest, and repayment of principal under the New Term Loan. Notwithstanding the Company’s expectation upon its emergence from bankruptcy, uncertainties inherent in the bankruptcy process raise substantial doubt about the Company’s ability to continue as a going concern. In particular, until the terms of the Plan are confirmed by the Court, the Company may be required to pay the Senior Note Claims under the original terms of the Senior Notes. The consolidated financial statements do not include any adjustments to reflect the possible future effects on the recoverability and classification of assets or the amounts and classification of liabilities that may result from the outcome of this uncertainty.
2. Restatement of Previously Issued Financial Statements
In August 2008, the Company completed its acquisition of Excel. Delays in the integration of the financial accounting systems of the Company and Excel following the acquisition initially led to a delay of several weeks in the preparation of the Company’s
78
Table of Contents
GSI GROUP INC.
NOTES TO CONSOLIDATED FINANCIAL STATEMENTS—(Continued)
As of December 31, 2008
Quarterly Report on Form 10-Q for the quarterly period ended September 26, 2008 (the “2008 Q3 Report”). Shortly thereafter and prior to filing the 2008 Q3 Report, the Company initiated an internal review of certain potential errors in the recognition of revenue related to sales to a customer in the first and second fiscal quarters of 2008 in the Company’s Semiconductor Systems Segment, which were brought to the attention of the Audit Committee of the Company’s Board of Directors (the “Audit Committee”) by Company management. Following this initial internal review, the Audit Committee, in consultation with the Company’s outside legal counsel, determined that it was appropriate to undertake an independent review of the potential revenue recognition issues brought to its attention.
On or about November 25, 2008, the Audit Committee initiated a broader independent review of sales transactions in the Semiconductor Systems Segment, along with certain other sales transactions that contain arrangements with multiple deliverables for fiscal years 2007 and 2008. The review was subsequently expanded to include fiscal year 2006. To assist in its review, the Audit Committee retained independent legal counsel and forensic accounting experts.
On December 4, 2008, the Company announced that it identified errors in the recognition of revenue related to sales to a customer in the first and second fiscal quarters of 2008 in the Semiconductor Systems Segment and that the previously issued financial statements contained in the Company’s Quarterly Reports on Form 10-Q for the periods ended March 28, 2008 and June 27, 2008 should no longer be relied upon.
Subsequently, the Company announced that it had identified additional revenue recognition errors related to the timing of revenue recognition from sales to certain Semiconductor Systems Segment customers during fiscal year 2007. The Audit Committee concluded, upon the recommendation of Company management, that the range of potential adjustments resulting from the identified errors is material to the financial statements of the Company for the periods indicated and as a result, the Audit Committee determined that the previously issued interim and annual historical financial statements for 2007 should no longer be relied upon. The Audit Committee thereafter expanded the scope of its investigation to include fiscal year 2006.
On March 30, 2009, the Company announced that it had identified additional revenue recognition errors related to the timing of revenue recognition from sales to certain Semiconductor Systems Segment customers during fiscal year 2006. The Audit Committee concluded, upon the recommendation of Company management, that the range of potential adjustments resulting from the identified errors is material to the financial statements of the Company for the periods indicated and as a result, the Audit Committee determined that the previously issued interim and annual historical financial statements for 2006 should no longer be relied upon.
The Audit Committee’s advisors reported the results of the investigation to the Audit Committee on April 24, 2009. The Company voluntarily reported the investigation results to the SEC on April 30, 2009. Thereafter, on June 30, 2009, the Company announced that it was undertaking a preliminary review of the timing of revenue recognized in connection with multiple element arrangements in its Precision Technology Segment from 2004 through 2008 to determine if adjustments need to be made to those periods (collectively with the Audit Committee’s review of transactions in the Semiconductor Systems Segment and any other related Company reviews of transactions in the Semiconductor Systems Segment and Precision Technology Segment, the “Revenue Review”).
As part of its Revenue Review procedures, the Company assessed historic revenue transactions back to 2002. Transactions prior to 2004 were reviewed to the extent that the Company had reason to believe such transactions could materially affect the consolidated financial statements for 2004, or any period after 2004. The restated consolidated financial statements include a number of adjustments primarily related to the timing of revenue recognition which impacts revenue, cost of goods sold, deferred revenue, and deferred cost of goods sold.
Adjustments arising from the Revenue Review resulted in sales and their related costs being deferred and recognized in subsequent periods, once all revenue recognition criteria have been met. In addition, these adjustments did not affect the Company’s cash balances. As of December 31, 2008, a substantial portion of the revenue identified in the Revenue Review remains deferred, pending the finalization of all deliverables under the terms of the customer arrangements. The corresponding costs have also been deferred and are included as deferred cost of goods sold as a component of other deferred assets in the accompanying financial statements. All the deferred revenue and the deferred cost of goods sold have been classified as current or long-term, based on the Company’s assessment of when each particular transaction is anticipated to be recognized into revenue.
As discussed further below, the majority of adjustments from the Revenue Review were derived from the Company’s incorrect accounting for multiple element arrangements, the determination of fixed and determinable consideration, and the determination of customer acceptance. The Company found inconsistent and incorrect application of these policies. The transactions that are being restated as a result of the Revenue Review include transactions for which the complete facts required to make the appropriate
79
Table of Contents
GSI GROUP INC.
NOTES TO CONSOLIDATED FINANCIAL STATEMENTS—(Continued)
As of December 31, 2008
assessment with respect to the timing of the revenue recognition were not communicated to the finance department at the time the initial revenue was booked. Refer to Note 3 of Notes to Consolidated Financial Statements for discussion of the Company’s revenue recognition policy.
In addition to adjustments from the Revenue Review, the Company has also recorded the impact of certain adjustments which, due to their materiality, were not previously recorded. Certain of these adjustments affect revenue, cost of good sold, the provision for income taxes, and, to a lesser extent, operating expenses.
The net effects of all of the restatement adjustments on the statements of operations for 2007 and 2006 are as follows (in thousands, except per share data):
| Year Ended December 31, 2007 | Year Ended December 31, 2006 | |||||||||||||||||||
| As Reported |
Adjustments | As Restated |
As Reported |
Adjustments | As Restated | |||||||||||||||
| Sales |
$ | 306,067 | $ | (14,986 | ) | $ | 291,081 | $ | 302,083 | $ | (43,053 | ) | $ | 259,030 | ||||||
| Cost of goods sold |
182,821 | (4,873 | ) | 177,948 | 175,442 | (18,810 | ) | 156,632 | ||||||||||||
| Gross profit |
123,246 | (10,113 | ) | 113,133 | 126,641 | (24,243 | ) | 102,398 | ||||||||||||
| Operating expenses |
101,446 | (3,172 | ) | 98,274 | 99,345 | (4,191 | ) | 95,154 | ||||||||||||
| Income from operations |
21,800 | (6,941 | ) | 14,859 | 27,296 | (20,052 | ) | 7,244 | ||||||||||||
| Interest income (expense), other income (expense), and foreign exchange transaction gains (losses), net |
7,114 | 199 | 7,313 | 2,385 | 141 | 2,526 | ||||||||||||||
| Income from continuing operations before income taxes |
28,914 | (6,742 | ) | 22,172 | 29,681 | (19,911 | ) | 9,770 | ||||||||||||
| Income tax provision (benefit) |
10,389 | (2,905 | ) | 7,484 | 8,839 | (5,925 | ) | 2,914 | ||||||||||||
| Income from continuing operations |
18,525 | (3,837 | ) | 14,688 | 20,842 | (13,986 | ) | 6,856 | ||||||||||||
| Income from discontinued operations, net of tax |
519 | (52 | ) | 467 | 898 | (253 | ) | 645 | ||||||||||||
| Net income |
$ | 19,044 | $ | (3,889 | ) | $ | 15,155 | $ | 21,740 | $ | (14,239 | ) | $ | 7,501 | ||||||
| Net income per share - basic |
$ | 0.45 | $ | (0.09 | ) | $ | 0.36 | $ | 0.52 | $ | (0.34 | ) | $ | 0.18 | ||||||
| Net income per share - diluted |
$ | 0.45 | $ | (0.09 | ) | $ | 0.35 | $ | 0.51 | $ | (0.33 | ) | $ | 0.18 | ||||||
The net effects of all of the restatement adjustments on selected balance sheet accounts as of December 31, 2007, and on the balance of the stockholders equity as of December 31, 2006 are as follows (in thousands):
| Year Ended December 31, 2007 | ||||||||||
| As Reported |
Adjustments | As Restated | ||||||||
| Assets: |
||||||||||
| Cash and cash equivalents |
$ | 171,713 | $ | 674 | $ | 172,387 | ||||
| Accounts receivable, net |
71,403 | 228 | 71,631 | |||||||
| Inventories |
64,002 | 137 | 64,139 | |||||||
| Deferred cost of goods sold: |
||||||||||
| Current |
429 | 36,765 | 37,194 | |||||||
| Long-term |
— | 12,758 | 12,758 | |||||||
| Total deferred cost of goods sold |
429 | 49,523 | 49,952 | |||||||
| Income tax receivable and deferred tax assets |
30,378 | 16,542 | 46,920 | |||||||
| All other assets not listed above |
102,286 | 330 | 102,616 | |||||||
| Total assets |
$ | 440,211 | $ | 67,434 | $ | 507,645 | ||||
| Liabilities and Stockholders Equity: |
||||||||||
| Deferred revenue: |
||||||||||
| Current |
$ | 9,949 | $ | 69,513 | $ | 79,462 | ||||
| Long-term |
— | 22,101 | 22,101 | |||||||
| Total deferred revenue |
9,949 | 91,614 | 101,563 | |||||||
| Income taxes payable and deferred tax liabilities |
12,846 | 3,076 | 15,922 | |||||||
| All other liabilities not listed above |
43,298 | 1,184 | 44,482 | |||||||
| Total liabilities |
66,093 | 95,874 | 161,967 | |||||||
| Stockholders’ equity |
374,118 | (28,440 | ) | 345,678 | ||||||
| Liabilities and stockholders’ equity |
$ | 440,211 | $ | 67,434 | $ | 507,645 | ||||
80
Table of Contents
GSI GROUP INC.
NOTES TO CONSOLIDATED FINANCIAL STATEMENTS—(Continued)
As of December 31, 2008
| Year Ended December 31, 2006 | ||||||||||
| As Reported |
Adjustments | As Restated | ||||||||
| Stockholders’ equity |
$ | 343,073 | $ | (25,397 | ) | $ | 317,676 | |||
The following table presents the impact of the restatement adjustments to the Company’s beginning retained earnings (accumulated deficit) balance, cumulatively to reflect adjustments booked to all periods prior to January 1, 2006 (in thousands):
| Amount | ||||
| Retained earnings, December 31, 2005 (as previously reported) |
$ | 7,688 | ||
| Adjustments from: |
||||
| Semiconductor Systems Segment Revenue Review, before income tax effect |
(10,348 | ) | ||
| Precision Technology Segment Revenue Review, before income tax effect |
(4,961 | ) | ||
| Income tax adjustments |
4,930 | |||
| All other revenue and non-income tax adjustments |
(688 | ) | ||
| Total adjustments |
(11,067 | ) | ||
| Retained earnings (accumulated deficit), December 31, 2005 (as restated) |
$ | (3,379 | ) | |
81
Table of Contents
GSI GROUP INC.
NOTES TO CONSOLIDATED FINANCIAL STATEMENTS—(Continued)
As of December 31, 2008
The net effects of all of the restatement adjustments on the condensed cash flow statements for 2007 and 2006 are as follows (in thousands):
| Year Ended December 31, 2007 | Year Ended December 31, 2006 | |||||||||||||||||||||||
| As Reported |
Adjustments | As Restated |
As Reported |
Adjustments | As Restated |
|||||||||||||||||||
| Net income |
$ | 19,044 | $ | (3,889 | ) | $ | 15,155 | $ | 21,743 | $ | (14,239 | ) | $ | 7,504 | ||||||||||
| Adjustments to reconcile net income to net cash provided by operating activities |
27,157 | (6,303 | ) | 20,854 | 19,062 | 1,298 | 20,360 | |||||||||||||||||
| Changes in assets and liabilities |
(8,713 | ) | 10,296 | 1,583 | (5,549 | ) | 12,853 | 7,304 | ||||||||||||||||
| Cash flows from operating activities |
37,488 | 104 | 37,592 | 35,256 | (88 | ) | 35,168 | |||||||||||||||||
| Cash flows from investing activities |
(7,637 | ) | (329 | ) | (7,966 | ) | 32,804 | 176 | 32,980 | |||||||||||||||
| Cash flows from financing activities |
758 | — | 758 | 2,125 | — | 2,125 | ||||||||||||||||||
| Effect of exchange rates on cash and cash equivalents |
2,790 | 899 | 3,688 | (1,156 | ) | (89 | ) | (1,245 | ) | |||||||||||||||
| Net increase to cash and cash equivalents |
33,399 | 674 | 34,072 | 69,029 | (1 | ) | 69,028 | |||||||||||||||||
| Cash and cash equivalents, beginning of year (1) |
138,315 | — | 138,315 | 69,286 | 1 | 69,287 | ||||||||||||||||||
| Cash and cash equivalents, end of year(1) |
$ | 171,714 | $ | 674 | $ | 172,387 | $ | 138,315 | $ | — | $ | 138,315 | ||||||||||||
| (1) | The Consolidated Statements of Cash Flows include cash and cash equivalent balances (in thousands) of $0, $1 and $1,814 of the discontinued operations for the years ended December 31, 2008, 2007, and 2006, respectively. |
The following discussion provides additional information regarding the adjustments that were identified during the Revenue Review. Certain transactions may have been restated for multiple reasons but have been included in the most applicable category.
Semiconductor Systems Segment
The Company’s product sales to customers of its Semiconductor Systems Segment are typically multiple element arrangements. These arrangements generally include: hardware components, software components, installation services, an initial warranty period and training on the use of the product. Certain of these arrangements may also include other elements including specified product or software upgrades, product performance commitments and may also include separately priced extended warranty services.
Multiple Element Arrangements without Objective and Reliable Evidence of Fair Value for Undelivered Elements
The Revenue Review identified certain arrangements whereby there were undelivered elements for which objective and reliable evidence of fair value did not exist at the time that the revenue was initially recorded. The Company has deferred the revenue under these arrangements, and recognizes the revenue at the point in time when such undelivered elements are resolved. These undelivered elements include undelivered hardware, delivered hardware not functioning to specifications, and undelivered future software features or functionality committed as part of the arrangement. Additionally, the Company evaluated the unit of accounting for certain transactions based on the guidance in AICPA’s Technical Practice Aid (“TPA”) 5100.39, “Software Revenue Recognition for Multiple Element Arrangements.” As a result, certain multiple customer orders that were originally accounted for as separate transactions are accounted for as one transaction in the restatement.
The Determination of Customer Acceptance
Under the Company’s policy, sales to customers in Japan, sales to new customers, and sales of new products to existing customers, as defined in its policy, are required to be recorded upon the customer having installed, tested and accepted the product at the customer’s site. Without acceptance for these types of sales, the Company is unable to conclude that the delivery has been achieved in accordance with the criteria in the SEC’s Staff Accounting Bulletin (“SAB”) 104, “Revenue Recognition.” The Revenue Review noted instances whereby the criteria required under its policy to record revenue at the time of shipment had not be achieved; therefore revenue was improperly recognized in an earlier period. In such cases, the Company has deferred revenue recognition until the appropriate customer acceptance was received. Additionally, the Company noted instances where there were two documents representing customer acceptance; one form on a format provided by the Company, and another on a customer-specific form. Often these forms were provided from the customer on separate dates. In these cases of “dual acceptance”, the Company has performed
82
Table of Contents
GSI GROUP INC.
NOTES TO CONSOLIDATED FINANCIAL STATEMENTS—(Continued)
As of December 31, 2008
procedures to assess when all deliverables were made, and then reviewed that against the multiple customer acceptance forms. As a result of these procedures, revenue has been generally recorded on the later of the two acceptance forms’ dates.
Determination that the Fees are not Fixed or Determinable
Under the Company’s policy, arrangements with extended payment terms are not considered to be fixed or determinable. Accordingly, revenue is recognized as the payments become due. The Revenue Review noted instances whereby the arrangements with extended payment terms were not properly identified and revenue was improperly recognized in an earlier period. The revenue, as restated, reflects revenue being recorded as the payments have become due.
Other
The Revenue Review also identified certain other revenue adjustments which were not individually, nor in the aggregate, significant. These adjustments have been reflected in the restated consolidated financial statements and primarily relate to the accounting for separately priced extended warranty contracts. In certain arrangements, the amount deferred for extended warranty contracts differed from the stated price of the extended warranty contracts. In such cases, the Company has adjusted the amount of deferred revenue to equal the stated price of the extended warranty contracts, with the recognition of the adjusted amount recorded over the appropriate period of the extended warranty.
Precision Technology Segment
The Company’s product sales to customers of its Precision Technology Segment generally represent customer orders for a large volume of one or more types of components and occasionally include services such as installation, training and preventative maintenance plans. In order to meet customer production and inventory requirements, these arrangements frequently provide for the delivery of the components over several quarters.
Multiple Element Arrangements without Objective and Reliable Evidence of Fair Value for Undelivered Elements
The Revenue Review identified certain arrangements whereby there were undelivered elements for which objective and reliable evidence of fair value did not exist at the time that the revenue was initially recorded. Additionally, the Company evaluated the unit of accounting for certain transactions based on the guidance in TPA 5100.39. As a result, certain multiple customer orders that were originally accounted for as separate transactions are accounted for as one transaction in the restatement.
A typical order includes a variety of products shipped over several reporting periods. These transactions were historically recognized based on the invoice price of each product shipped. The restated revenue is recognized under the multiple units shipped methodology, whereby revenue is recognized in each period based upon the lowest common percentage of the products shipped in the period. This approximates a proportional performance model of revenue recognition. This generally results in a partial deferral of revenue to a later reporting period. No revenue is recognized unless one unit of each product has been delivered.
Determination that the Fees are not Fixed or Determinable
The Revenue Review identified certain customer arrangements that included customer rights to adjust the product quantity mix or otherwise involved uncertainty regarding the terms of the arrangement. In such cases, the Company has determined that the arrangement fees are not fixed or determinable and revenue is recognized when the order is completely fulfilled.
Summary of Sales Adjustments
As discussed above, sales transactions from 2002 through 2008 were assessed in connection with the Company’s Revenue Review. In general, revenue was deferred to later periods for those transactions which were adjusted as part of the Revenue Review. The following table reconciles revenue that was originally reported for 2007 and 2006 to the restated amounts for those years. The effect of certain of these adjustments is the result of the impact of years prior to 2006. Amounts in the table are shown in thousands.
83
Table of Contents
GSI GROUP INC.
NOTES TO CONSOLIDATED FINANCIAL STATEMENTS—(Continued)
As of December 31, 2008
| Year Ended December 31, | ||||||||
| 2007 | 2006 | |||||||
| Sales, as previously reported |
$ | 306,067 | $ | 302,083 | ||||
| Revenue Restatement Adjustments: |
||||||||
| Semiconductor Systems Segment: |
||||||||
| Multiple element arrangements |
(26,169 | ) | (37,181 | ) | ||||
| Determination of customer acceptance |
4,315 | (1,444 | ) | |||||
| Determination that fees are not fixed or determinable |
(654 | ) | 350 | |||||
| Other |
(371 | ) | 839 | |||||
| Subtotal Semiconductor Systems Segment |
(22,879 | ) | (37,436 | ) | ||||
| Precision Technology Segment: |
||||||||
| Multiple element arrangements |
163 | (573 | ) | |||||
| Determination that fees are not fixed or determinable |
7,907 | (4,977 | ) | |||||
| Other |
(177 | ) | (67 | ) | ||||
| Subtotal Precision Technology Segment |
7,893 | (5,617 | ) | |||||
| Total revenue restatement adjustments |
(14,986 | ) | (43,053 | ) | ||||
| Sales, as restated |
$ | 291,081 | $ | 259,030 | ||||
Expense Adjustments
In connection with its Revenue Review, the Company has deferred the corresponding direct costs associated with the deferred revenue. These deferred costs have been recorded as deferred cost of goods sold, in the current and long-term sections of the accompanying balance sheets, as appropriate, and are reflected in the statements of operations as cost of goods sold when the related revenue is recognized. These costs represent the direct and incremental costs that are attributable to the product whose revenue is being deferred.
The following table reflects the adjustments to cost of goods sold and operating expenses that were identified as a result of the Company’s Revenue Review, as well as from the recording of previously unrecorded immaterial adjustments. The table presents a reconciliation of previously reported amounts to amounts as restated for the periods indicated (in thousands):
| Year Ended December 31, | ||||||||
| 2007 | 2006 | |||||||
| Cost of goods sold, as previously stated |
$ | 182,821 | $ | 175,442 | ||||
| Semiconductor Systems Segment adjustments |
(13,220 | ) | (19,434 | ) | ||||
| Precision Technology Segment adjustments |
4,760 | (3,028 | ) | |||||
| Reclassification of amortization of intangible assets (core technology) |
3,587 | 3,652 | ||||||
| Cost of goods sold, as restated |
$ | 177,948 | $ | 156,632 | ||||
| Operating expenses, as previously stated |
$ | 101,446 | $ | 99,345 | ||||
| Reclassification of amortization of intangible assets (core technology) |
(3,587 | ) | (3,652 | ) | ||||
| All other operating expense adjustments |
415 | (539 | ) | |||||
| Operating expenses, as restated |
$ | 98,274 | $ | 95,154 | ||||
Income Taxes
In connection with its Revenue Review, the Company has reassessed it provision for income taxes. As part of its assessment of its provision for income taxes, the Company has recorded two primary adjustments.
84
Table of Contents
GSI GROUP INC.
NOTES TO CONSOLIDATED FINANCIAL STATEMENTS—(Continued)
As of December 31, 2008
In connection with the Revenue Review, the Company reassessed the probability of realization of deferred tax assets in certain jurisdictions taking into account the effect of the restatement. This assessment, while conducted currently in connection with the restatement activities, was performed using only those facts that were known or expected to be knowable at the time in which each accounting period would have been initially closed. Pursuant to SFAS 109 the Company only recognizes a deferred tax asset when it is more likely than not of recovery, considering future reversal of deferred tax liabilities, available taxable income in carryback periods, the probability of future taxable income after a pattern of generating income in the jurisdiction or tax planning strategies that the Company can implement. Accordingly, adjustments have been reflected to the beginning balance sheet to reduce the deferred tax assets, and the corresponding beginning retained earnings balance.
The provision for income taxes has been further adjusted to reflect the statutory rate, adjusted by timing items and other appropriate current period tax credits, as applied against the ‘as adjusted’ income and loss of the Company in various periods. See Note 12 of the Notes to Consolidated Financial Statements for further disclosure of income tax provision (benefit) characteristics for each of 2006, 2007 and 2008.
3. Summary of Significant Accounting Policies
Basis of presentation
These consolidated financial statements have been prepared by the Company in U.S. dollars and in accordance with U.S. generally accepted accounting principles, applied on a consistent basis.
Basis of consolidation
The consolidated financial statements include the accounts of GSI Group Inc. and its wholly owned subsidiaries, including the accounts of Excel since August 20, 2008. The accounts of Excel include its 50% owned joint venture, Excel Laser Technology Private Limited (Excel SouthAsia JV), since it is a variable interest entity and the Company is the primary beneficiary of the joint venture. Financial information related to the joint venture is not considered material to the consolidated financial statements. Intercompany accounts and transactions have been eliminated.
Comparative amounts
In addition to the adjustments from the restatement, certain prior year amounts have been reclassified to conform to the current year presentation in the financial statements and notes as of and for the year ended December 31, 2008. These reclassifications primarily relate to the Company’s discontinued operations, which have been presented separately in the accompanying consolidated financial statements, as further described in Note 5. These reclassifications also include an adjustment to reflect the amortization of core technology in cost of goods sold. Since these costs had previously been included in selling, general and administrative expenses, the adjustment for this reclassification is included as a separate line in the restatement schedules in Note 2 that present the nature of the changes to the cost of goods sold and operating expenses. These reclassifications had no effect on the Company’s previously reported results of operations, or financial position.
Use of estimates
The preparation of financial statements in conformity with generally accepted accounting principles requires management to make estimates and assumptions that affect the reported amounts of assets and liabilities and disclosure of contingent assets and liabilities at the dates of the financial statements and the reported amounts of sales and expenses during the reporting periods. On an ongoing basis, the Company evaluates its estimates, assumptions and judgments, including those related to revenue recognition; allowance for doubtful accounts; inventory costing and reserves; the assessment of warranty reserves; the valuation of goodwill, intangible assets and other long-lived assets; accounting for business combinations; share-based payments; employee benefit plans; accounting for restructuring activities; accounting for income taxes and related valuation allowances; and, accounting for loss contingencies. Actual results could differ significantly from those estimates.
Cash and Cash Equivalents
Cash equivalents consist principally of money market funds invested in U.S. Treasury Securities and repurchase agreements of U.S. Treasury Securities that have original maturities of 90 days or less. The Company does not believe it is exposed to any significant credit risk related to its cash equivalents.
85
Table of Contents
GSI GROUP INC.
NOTES TO CONSOLIDATED FINANCIAL STATEMENTS—(Continued)
As of December 31, 2008
Financial Instruments and Fair Value Measurements
Financial instruments with remaining maturities that are payable within one year from the balance sheet date are classified as current. Financial instruments with remaining maturities that are payable more than one year from the balance sheet date are classified as long-term.
Long-term Investments
As of December 31, 2008, the Company held auction rate securities, recorded at a fair value of $25.1 million, and with a par value of $32.3 million. These securities were acquired as part of the Company’s purchase of Excel in 2008. These auction rate notes are student loans backed by the federal government and are privately insured. Current capital market conditions have impacted the Company's ability to liquidate certain auction rate securities. Liquidity for these auction rate securities is typically provided by an auction process that resets the applicable interest rate at pre-determined intervals, usually every 7, 28, 35 or 90 days. In the past, the auction process has allowed investors to roll over their holdings or obtain immediate liquidity by selling the securities at par. Due to the current capital market conditions, auctions have not had sufficient bidders to allow investors to complete a sale of some auction rate securities. Due to the uncertainty in the market as to when these auction rate notes will be refinanced or the auctions will resume, the Company has classified these instruments as long-term assets available for sale. If the credit ratings of the issuer, the bond insurers or the collateral deteriorates further, or if the issuers of these auction rate securities are unable to successfully close further auctions, the Company may further reduce the carrying value of these investments and may in the future be required to record impairment charges against these investments, some of which may be considered other-than-temporary impairment charges. From the date of the Company’s acquisition of Excel, through December 31, 2008, the Company has recorded an unrealized gain on these investments of $0.1 million and has recorded that gain within other comprehensive income. See Note 18 of the Notes to Consolidated Financial Statements for discussion of sales of auction rate securities after December 31, 2008.
At December 31, 2008 and December 31, 2007 the Company had a 25.1% equity investment in a privately held company located in the United Kingdom, valued at $0.8 million and $0.9 million at December 31, 2008 and 2007, respectively, and included in Other Assets in the accompanying consolidated balance sheets. The Company uses the equity method to record the results of this entity. In relation to this investment, the Company recognized a loss of $56,000 in 2008 and income of $156,000 in 2007 which are shown in other income and expense in the consolidated financial statements. There was no other income or expense recorded in 2006 related to this investment.
Fair Value Measurements
On January 1, 2008, the Company adopted Statement of Financial Accounting Standards (“SFAS”) 157, “Fair Value Measurements,” with no impact on its consolidated results and financial position. SFAS 157 defines fair value, establishes a framework for measuring fair value, and enhances disclosures about fair value measurements. Fair value is defined as the price that would be received for an asset, or paid to transfer a liability, in an orderly transaction between market participants at the measurement date. Valuation techniques must maximize the use of observable inputs and minimize the use of unobservable inputs.
SFAS 157 establishes a value hierarchy based on three levels of inputs, of which the first two are considered observable and the third is considered unobservable:
| • | Level 1. Quoted prices for identical assets or liabilities in active markets which we can access. |
| • | Level 2. Observable inputs other than those described in Level 1. |
| • | Level 3. Unobservable inputs. |
The following table summarizes the financial assets, as of December 31, 2008, that are measured at fair value on a recurring basis (in thousands):
| December 31, 2008 | Quoted Prices in Active Markets for Identical Assets (Level 1) |
Significant Other Observable Inputs (Level 2) |
Significant Other Unobservable Inputs (Level 3) | |||||||||
| Cash equivalents (a) |
$ | 36,324 | $ | 36,324 | $ | — | $ | — | ||||
| Auction rate securities (b) |
25,065 | — | — | 25,065 | ||||||||
| Total |
$ | 61,389 | $ | 36,324 | $ | — | $ | 25,065 | ||||
| (a) | Cash equivalents are valued at quoted market prices in active markets. |
86
Table of Contents
GSI GROUP INC.
NOTES TO CONSOLIDATED FINANCIAL STATEMENTS—(Continued)
As of December 31, 2008
| (b) | Auction rate securities are valued based on assumptions that market participants might use in their estimates of fair value (including, among other factors, underlying collateral and lack of liquidity). |
The following table summarizes the activity with respect to the auction rate securities during 2008 (in thousands):
| Balance at December 31, 2007 |
$ | — | |
| Added in connection with Excel acquisition |
24,985 | ||
| Unrealized gains |
80 | ||
| Balance at December 31, 2008 |
$ | 25,065 | |
See Note 8 of the Notes to Consolidated Financial Statements for discussion of the estimated fair value of our Senior Notes.
Accounts receivable and allowance
Trade accounts receivable are recorded at the invoiced amount. The Company generally does not require collateral for trade accounts receivable. The Company maintains an allowance for doubtful accounts. The allowance for doubtful accounts is based on the Company’s best estimate of the amount of probable credit losses resulting from the inability of the Company’s customers to make required payments. The Company determines the allowance based on a variety of factors including the age of amounts outstanding relative to their contractual due date, specific customer factors, and other known risks and economic trends in industries. Charges booked to the allowances for doubtful accounts are recorded as selling, general and administrative expenses, and are recorded in the period that they are determined to be uncollectible.
For the years ended December 31, 2008, 2007 and 2006, the allowance for accounts receivable was as follows:
| Year Ended December 31, | ||||||||||||
| 2008 | 2007 | 2006 | ||||||||||
| (In thousands) | ||||||||||||
| Balance at beginning of period |
$ | 374 | $ | 911 | $ | 1,592 | ||||||
| Assumed in Excel acquisition |
1,221 | — | — | |||||||||
| Increase (decrease) charged to SG&A expense |
297 | 46 | (129 | ) | ||||||||
| Write-offs, net of recoveries of amounts previously reserved |
(131 | ) | (580 | ) | (595 | ) | ||||||
| Exchange rate changes |
(74 | ) | (3 | ) | 43 | |||||||
| Balance at end of period |
$ | 1,687 | $ | 374 | $ | 911 | ||||||
Inventories
Inventories, which include materials and conversion costs, are stated at the lower of cost or market, using the first-in, first-out method. Market is defined as replacement cost for raw materials and net realizable value for other inventories. Demo inventory is recorded at the lower of cost or its net realizable value.
Property, plant and equipment
Property, plant and equipment are stated at cost, adjusted for any impairment, less accumulated depreciation. The Company uses the straight-line method to calculate the depreciation of our fixed assets over their estimated useful lives. Estimated useful lives for buildings and improvements range from 3 to 60 years and for machinery and equipment from 1 to 13 years. Leasehold improvements are amortized over the lesser of their useful lives or lease terms, including any renewal period options that are expected to be exercised. Repairs and maintenance are expensed as incurred.
The Company undertakes a review of its property, plant and equipment carrying values whenever events or circumstances indicate that the carrying amounts many not be recoverable. The Company relies on the guidance included in SFAS 144, “Accounting for the Impairment or Disposal of Long-lived Assets,” when conducting these reviews.
87
Table of Contents
GSI GROUP INC.
NOTES TO CONSOLIDATED FINANCIAL STATEMENTS—(Continued)
As of December 31, 2008
As a result of the severity of the global economic downturn in 2008, notably during the fourth quarter, which negatively impacted the Company’s revenue and cash flow forecasts, the Company conducted an impairment review of its property, plant and equipment as of December 31, 2008. Impairment was measured as the difference between estimated fair value and carrying value for property, plant and equipment whose carrying value was not deemed recoverable. For personal property (machinery and equipment, furniture and fixtures, computers, software, and automobiles), the Company estimated the fair value of the assets using either a sales comparison or a replacement cost approach. The sales comparison approach utilized input from used equipment vendors and auction sites to estimate fair value. The replacement cost approach started with an estimate of the cost to replace a given asset at current prices and converted it to a fair value estimate. Fair value estimates reflected the physical deterioration, utilization rates and estimated remaining economic lives of the underlying assets. For real property, the Company engaged real estate professionals to help estimate fair value. A combination of the assumed sale of owned real estate and its value under a sale-and-leaseback arrangement were options considered in assessing the fair value of real property. When utilizing the sales of owned real estate, fair value was derived from recent transactions of comparable properties or the asking prices of competing properties on the market. The fair value of leasehold improvements was based on estimated changes in construction costs in the relevant market.
Property, plant and equipment impairments totaling $5.4 million were recorded in 2008, of which approximately $2.7 million pertained to assets in the Precision Technology Segment, approximately $2.1 million pertained to assets in the Excel Segment, and approximately $0.7 million related to corporate assets. No impairment charges were recorded in 2007 or 2006.
Business combinations
The Company determines and allocates the purchase price of an acquired company to the tangible and intangible assets acquired and liabilities assumed as well as to in-process research and development as of the business combination date in accordance with SFAS 141, “Business Combinations.” The purchase price allocation process requires the Company to use significant estimates and assumptions, including fair value estimates, as of the business combination date including:
| • | estimated fair values of intangible assets; |
| • | expected costs to complete any in-process research and development projects; |
| • | estimated income tax assets and liabilities assumed from the acquiree; and |
| • | estimated fair value of pre-acquisition contingencies assumed from the acquiree. |
While the Company uses its best estimates and assumptions as a part of the purchase price allocation process to accurately value assets acquired and liabilities assumed at the business combination date, its estimates and assumptions are inherently uncertain and subject to refinement. As a result, during the purchase price allocation period, the Company records adjustments to the assets acquired and liabilities assumed, with a corresponding offset to goodwill. Generally, with the exception of unresolved income tax matters, any adjustment to assets acquired or liabilities assumed subsequent to the purchase price allocation period is included in operating results in the period in which the adjustment is determined.
In-process research and development costs are expensed when acquired and represent the estimated fair value as of the dates of acquisition of in-process projects acquired that have not yet reached technological feasibility and have no alternative future uses.
In fiscal 2009, the Company will adopt SFAS 141 (revised 2007), “Business Combinations.” Refer to Recent Accounting Pronouncements (below) for additional information.
Goodwill and intangible assets
Goodwill represents the excess of the purchase price in a business combination over the fair value of the acquired tangible and intangible net assets. In connection with its acquisition of Excel, the Company has certain trade names that are classified as intangible assets with indefinite lives, which are not amortized but are required to be evaluated at least annually to ensure their current fair values exceed their carrying values.
The Company also has certain intangible assets that are amortized based on their estimated lives. These assets were acquired in connection with historic business combinations of the Company. The Company’s most significant intangible assets are acquired technology, customer relationships, and trademarks and trade names. All definite-lived intangible assets are amortized over the
88
Table of Contents
GSI GROUP INC.
NOTES TO CONSOLIDATED FINANCIAL STATEMENTS—(Continued)
As of December 31, 2008
periods in which their economic benefits are expected to be realized. In addition to the Company’s review of the carrying values of intangible assets, discussed below, the Company also reviews the useful life assumptions, including the classification of certain intangible assets as ‘indefinite-lived’, on a periodic basis to determine if changes in circumstances warrant revisions to them.
Our product lines generally correspond with our reporting units which is the level at which we evaluate our goodwill, intangible assets and other long-lived assets for impairment. All of the Company’s goodwill and intangible assets reside in the Precision Technology and Excel Segments.
Impairment charge
Impairment analyses of goodwill and indefinite-lived intangible assets are conducted in accordance with SFAS 142, “Goodwill and Other Intangible Assets.” We test our goodwill balances annually in the beginning of the second quarter or more frequently if indicators are present or changes in circumstances suggest that impairment may exist. In performing the test, we utilize the two-step approach which requires a comparison of the carrying value of each of the Company’s reporting units to the fair value of these reporting units. If the carrying value of a reporting unit exceeds its fair value, we calculate the implied fair value of the reporting unit’s goodwill and compare it to the goodwill’s carrying value. If the carrying value of goodwill exceeds its implied fair value, an impairment charge is recorded for the difference. The fair value of a reporting unit is based on the discounted cash flow forecast for the reporting unit. Those forecasts are derived from a set of assumptions similar to those discussed above with respect to the initial assessment of the fair value of intangible assets acquired in a business combination. The carrying values of each reporting unit include assets and liabilities which relate to the reporting unit’s operations. Additionally, reporting units that benefit from corporate assets or liabilities are allocated a portion of those corporate assets and liabilities on a systematic, proportional basis.
As mentioned above, the Company’s indefinite-lived intangible assets represent trade names that were acquired in the August 2008 Excel acquisition. The Company will assess these indefinite-lived intangible assets for impairment on an annual basis beginning of the second quarter of 2009, and more frequently if indicators are present or changes in circumstances suggest that impairment may exist. The Company will also periodically reassess these indefinite-lived intangible assets’ continuing classification as indefinite-lived. The fair values of our indefinite-lived intangible assets are based upon discounted cash flow forecasts. If the fair value of an intangible asset is less than its carrying value, an impairment charge is recorded to reflect the difference between the carrying value and the fair value of the impaired asset.
Intangible assets with definite lives are amortized over their estimated useful lives. The carrying amounts of definite-lived intangible assets and other long-lived assets are reviewed for impairment whenever changes in events or circumstances indicate their carrying values may not be recoverable. The impairment analyses are conducted in accordance with SFAS 144, “Accounting for the Impairment or Disposal of Long-lived Assets.” The recoverability of carrying value is determined by comparison of the reporting unit’s carrying value to its future undiscounted cash flows. When this test indicates the potential for impairment, a fair value assessment is performed. The fair values are derived from discounted cash flow forecasts for the particular intangible asset and are derived from a set of assumptions similar to those discussed above with respect to the initial assessment of fair value of intangible assets acquired in a business combination.
Once impairment is determined and measured, an impairment charge is recorded to reflect the difference between the carrying value and the fair value of the impaired asset. In addition to evaluating the impairment of goodwill and intangible assets, the Company also assesses its other long-lived assets for impairment in accordance with the provisions of SFAS 144. This process is discussed above under “Property, plant and equipment.”
The significant downturn in the global economy experienced in 2008, and most notably in the fourth quarter of 2008, negatively impacted the Company’s estimated future revenues and cash flows. The Company had performed its annual goodwill impairment test in the beginning of the second quarter noting no impairment. However, the downturn in the global economy and its effect on the Company’s business, including its revenues, suggested that an impairment might exist as of December 31, 2008. Consequently, the Company undertook an impairment review of its goodwill, intangible assets and other long-lived assets (property, plant and equipment) at the end of 2008. This review led the Company to record an impairment charge of $215.1 million to reduce the carrying values of these assets to their fair value. Goodwill was impaired by $131.2 million. Intangible assets and property, plant and equipment were impaired by $78.5 million and $5.4 million, respectively. No impairments of these assets were recorded in 2007 or 2006. The impairments of intangible assets and property, plant and equipment have been reflected as reductions in their gross carrying amounts. See the Impairment Charges section of Note 6 of Notes to Consolidated Financial Statements for further details.
89
Table of Contents
GSI GROUP INC.
NOTES TO CONSOLIDATED FINANCIAL STATEMENTS—(Continued)
As of December 31, 2008
Revenue recognition
The Company recognizes revenue when persuasive evidence of an arrangement exists, delivery has occurred, the price is fixed or determinable, risk of loss has passed to the customer and collection of the resulting receivable is reasonably assured. Revenue recognition requires judgment and estimates, which may affect the amount and timing of revenue recognized in any given period.
The Company follows the provisions of Emerging Issues Task Force (“EITF”) 00-21, “Revenue Arrangements with Multiple Deliverables” for all multiple element arrangements. Under EITF 00-21, the Company assesses whether the deliverables specified in a multiple element arrangement should be treated as separate units of accounting for revenue recognition purposes and whether objective and reliable evidence of fair value exists for these separate units of accounting. The Company applies the residual method when objective and reliable evidence of fair value exists for all of the undelivered elements in a multiple element arrangement. When objective and reliable evidence of fair value does not exist for all of the undelivered elements in a multiple element arrangement, the Company recognizes revenue under the multiple units shipped methodology, whereby revenue is recognized in each period based upon the lowest common percentage of the products shipped in the period. This approximates a proportional performance model of revenue recognition. This generally results in a partial deferral of revenue to a later reporting period. No revenue is recognized unless one unit of each product has been delivered.
Although certain of the Company’s products contain operating and application software, the Company has determined the software element is incidental in accordance with the AICPA’s Statement of Position (“SOP 97-2”) and EITF 03-05, “Applicability of AICPA Statement of Position 97-2 to Non-Software Deliverables in an Arrangement Containing More-Than-Incidental Software.”
The Company determines the unit of accounting for certain transactions based on the guidance in TPA 5100.39. In particular, multiple purchase orders may be deemed to be interrelated and considered to constitute a multiple element arrangement for accounting purposes.
Semiconductor Systems transactions are generally multiple element arrangements which may include hardware, software, installation, training, an initial standard warranty, and optional extended warranty arrangements. The Company generally designs, markets and sells these products as standard configurations. For those standard configurations where acceptance criteria, if any, exist and are demonstrated prior to shipment, revenue is recorded at the time of shipment. For those cases where acceptance criteria cannot be demonstrated prior to shipment of a product or if a significant amount of fees are due upon acceptance, the Company recognizes revenue upon customer acceptance. Acceptance is generally required for sales of Semiconductor Systems Segment products to Japanese customers, sales of “New Products”, which are considered by the Company, for purposes of revenue recognition determination, to be either (a) a product that is newly released to all customers, including a product which may have been existing previously, but which has been substantially upgraded with respect to its features or functionality; or, (b) the sale of an existing product to a customer who has not previously purchased that product. The Company follows a set of predetermined criteria when changing the classification of a New Product to a standard configuration whereby acceptance criteria are considered to be demonstrated at the time of shipment.
Precision Technology and Excel transactions include both single element and multiple element transactions. Multiple element transactions may include two or more products and occasionally also contain installation, training or preventative maintenance plans. Revenue is generally recognized under the multiple units shipped methodology described above.
The Company’s Semiconductor Systems Segment also sells spare parts and consumable items, which are not subject to acceptance criteria. Revenue for these spare parts and consumable items is generally recognized under the multiple units shipped methodology described above.
Installation is generally a routine process that occurs within a short period of time from delivery and the Company has concluded that this obligation is inconsequential and perfunctory. As such, for transactions that include installation, and for which customer acceptance has not been deemed necessary in order to record the revenue, the cost of installation is accrued at the time product revenue is recorded and no related revenue is deferred. Historically, the costs of installation have not been significant.
The initial standard warranty for product sales is accounted for under the provisions of SFAS 5, “Accounting for Contingencies,” as the Company has the ability to ascertain the probable likelihood of the liability, and can estimate the amount of the liability. A provision for the estimated cost related to warranty is recorded to cost of goods sold at the time revenue is recognized. The Company’s estimate of costs to service the warranty obligations are based on historical experience and expectations of future conditions. To the extent the Company experiences increased warranty claims or increased costs associated with servicing those claims, revisions to the estimated warranty liability are recorded as increases or decreases to the accrual at that time, with an offsetting entry recorded to cost of goods sold.
The Company also sells optional extended warranty services, and preventative maintenance contracts, at the time of their product purchase. The Company accounts for these agreements in accordance with provisions of FASB Technical Bulletin (“FTB”) 90-1 “Accounting for Separately Priced Extended Warranty and Product Maintenance Contracts” under which it recognizes the separately priced extended warranty and preventative maintenance fees over the associated period.
90
Table of Contents
GSI GROUP INC.
NOTES TO CONSOLIDATED FINANCIAL STATEMENTS—(Continued)
As of December 31, 2008
The Company, at the request of its customers, may at times perform professional services for its customers, generally for the maintenance and repairs of products previously sold to those customers. These services are usually in the form of time and materials based contracts which are short in their duration. Revenue for time and material services is recorded at the completion of services requested under a customer’s purchase order. Customers may, at times subsequent to the initial product sale, purchase a service contract whereby services, including preventative maintenance plans, are provided over a defined period, generally one year. Revenue for such service contracts are recorded ratably over the period of the contract.
The Company typically negotiates trade discounts and agreed terms in advance of order acceptance and records any such items as a reduction of revenue. The Company’s revenue recognition policy allows for revenue to be recognized under arrangements where the payment terms are 180 days or less, presuming all other revenue recognition criteria have been met. From time to time, based on the Company’s review of customer creditworthiness and other factors, the Company may provide its customers with payment terms that exceed 180 days. To the extent all other revenue recognition criteria have been met, the Company recognizes revenue for these extended payment arrangements as the payments become due.
The Company has significant deferred revenue included in its accompanying consolidated balance sheets, with balances (including both current and long-term amounts) of $84.2 million and $101.6 million as of December 31, 2008 and 2007, respectively. A significant majority of these amounts relate to arrangements whereby the entire arrangement has been accounted for as deferred revenue, as there is no fair value for the undelivered elements. Upon the final delivery of the undelivered element(s) of the arrangement, the revenue will be recorded for that arrangement. To a much lesser extent, the deferred revenue balances relate to either: (a) the unrecognized portion of a multiple element arrangements that is being recognized into revenue over a ratable basis as associated services are performed; (b) arrangements not currently recognizable due to the arrangement not being fixed and determinable at its inception; (c) the future amortization to revenue of extended warranty contracts and preventative maintenance plans; (d) revenue deferrals for product shipments with FOB destination shipping terms; and (e) deposits from customers against future orders. The classification of deferred revenue, and deferred cost of goods sold, is based on the Company’s expectations relative to when the revenue will be recognizable, based on facts known to the Company as of the date its financial statements are released.
Deferred cost of goods sold
The Company defers the corresponding direct costs associated with the deferred revenue. These deferred costs have been recorded as deferred cost of goods sold, in the current and long-term sections of the accompanying balance sheets, as appropriate, and are reflected in the statements of operations as cost of goods sold when the related revenue is recognized. These costs represent the direct and incremental costs that are attributable to the product whose revenue is being deferred.
Research and development and engineering costs
Internal costs relating to research and development and engineering costs incurred for new products and enhancements to existing products are expensed as incurred.
Product warranty
The Company generally warrants its products for material and labor to repair and service the system. The standard warranty is generally a period of up to 12 months, with the exception of two product lines, DRC Encoders and JK lasers, both being product lines that are included in the Precision Technology Segment, and which have a warranty period of 24 months. The accounting for warranty provisions is discussed in the “Revenue Recognition” section of this Note 3.
Share-based compensation
The Company has stock-based compensation plans which are more fully described in Note 10. The Company adopted SFAS 123(R) “Accounting for Share-Based Payment” on a modified prospective basis effective January 1, 2006.
Shipping & handling costs
Shipping and handling costs are recorded in cost of goods sold and totaled $4.2 million, $5.0 million and $4.2 million in 2008, 2007 and 2006, respectively.
91
Table of Contents
GSI GROUP INC.
NOTES TO CONSOLIDATED FINANCIAL STATEMENTS—(Continued)
As of December 31, 2008
Advertising costs
Advertising costs are expensed as incurred. Advertising expenses were $0.8 million, $1.0 million and $1.0 million in 2008, 2007 and 2006, respectively.
Foreign currency translation
The financial statements of the Company and its subsidiaries outside the United States have been translated into United States dollars in accordance with the SFAS 52, “Foreign Currency Translation.” Assets and liabilities of foreign operations are translated from foreign currencies into United States dollars at the exchange rates in effect on the balance sheet date. Sales and expenses are translated at the average exchange rate in effect for the period. Accordingly, gains and losses resulting from translating foreign currency financial statements are reported as a separate component of other comprehensive income in stockholders’ equity. Foreign currency transaction gains and losses are included in net income on the accompanying consolidated statements of operations. Foreign exchange transaction gains, net were $0.9 million in 2008 and $0.6 million in 2007, and a net loss of $1.4 million in 2006. These amounts arose primarily from transactions denominated in currencies other than the functional currency, as well as from gains or (losses) on derivative contracts.
Restructuring and other charges
In accounting for its restructuring activities, the Company follows the provisions of SFAS 146, "Accounting for Costs Associated with Exit or Disposal Activities." In accounting for these obligations, the Company makes assumptions related to the amounts of employee severance, benefits, and related costs and to the time period over which facilities will remain vacant, sublease terms, sublease rates and discount rates. Estimates and assumptions are based on the best information available at the time the obligation has arisen. These estimates are reviewed and revised as facts and circumstances dictate; changes in these estimates could have a material effect on the amount previously expensed against the Company’s earnings, and currently accrued on the Company’s consolidated balance sheet.
The costs incurred to third parties, including attorneys, forensic accountants, and other advisors that related to the Company’s Revenue Review have been included in the Company’s 2008 restructuring and other charges. These costs are charged to expense as incurred.
Accumulated other comprehensive income (loss)
The following table provides the details of accumulated other comprehensive income (loss):
| Year Ended December 31, |
||||||||
| 2008 | 2007 | |||||||
| (In thousands) | ||||||||
| Accumulated foreign currency translations |
$ | (839 | ) | $ | 11,660 | |||
| Unrealized gain on available for sale investments |
80 | — | ||||||
| Pension liability, net of tax (1) |
(3,477 | ) | (4,274 | ) | ||||
| Total |
$ | (4,236 | ) | $ | 7,386 | |||
| (1) | Tax benefit (loss) as of December 31, 2008 and 2007 was $0 and immaterial, respectively. |
The accumulated foreign currency translations changed significantly in 2008 due primarily to the revaluation of the intercompany loans with fixed interest rates which were entered into during 2008, after which time the U.S. dollar deteriorated relative to the foreign currencies. These loan balances will continue to change in future periods as the U.S. dollar strengthens or weakens relative to these foreign currencies.
Derivative financial instruments
The Company’s primary objective for holding derivative financial instruments is to manage currency risk. In accordance with SFAS 133, “Accounting for Derivative Instruments and Hedging Activities,” the Company’s accounting policies for these instruments are based on whether they meet the criteria for designation as hedging transactions, including cash flow, or net investment hedges. The Company did not have any derivative instruments that qualify for hedge accounting under SFAS 133 at December 31, 2008 or 2007. In cases when the Company does have derivative contracts, it records all derivatives at fair value as assets or liabilities in the consolidated balance sheet and any changes are recognized in other income and expense.
92
Table of Contents
GSI GROUP INC.
NOTES TO CONSOLIDATED FINANCIAL STATEMENTS—(Continued)
As of December 31, 2008
When the Company enters into foreign currency derivative contracts, the contracts are generally for less than six months duration with the purpose of hedging foreign currency risk on sales transactions. At December 31, 2008, the Company held no derivative contracts. At December 31, 2007, the Company held forward contracts to: sell Japanese yen for the equivalent of $7.9 million; settle U.S. dollar / Japanese yen average strike option with an underlying currency amount of 400 million yen (U.S. equivalent of $3.5 million); and buy British pound for the equivalent of $4.2 million.
Net income (loss) per common share
Basic net income (loss) per common share is computed by dividing net income (loss) by the weighted-average number of common shares outstanding during the period. For diluted net income (loss) per common share, the denominator also includes any dilutive outstanding stock options, restricted stock and warrants determined using the treasury stock method. Common and common share equivalent disclosures are (in thousands):
| Year Ended December 31, | ||||||
| 2008 | 2007 | 2006 | ||||
| Weighted average common shares outstanding |
43,125 | 42,364 | 41,896 | |||
| Dilutive potential common shares (1) |
— | 281 | 355 | |||
| Diluted common shares |
43,125 | 42,645 | 42,251 | |||
| Excluded from diluted common shares calculation—stock options, restricted stock and warrants that are anti-dilutive |
1,394 | 1,049 | 802 | |||
| (1) | Due to the Company’s net loss position for year ended December 31, 2008, all dilutive shares are excluded as their effect would also have been anti-dilutive. |
Accounting for income taxes
The liability method is used to account for income taxes. Deferred tax assets and liabilities are recognized for the future tax consequences of temporary differences between the financial statement carrying amounts and the tax bases of assets and liabilities. Deferred tax assets and liabilities are measured using enacted tax rates in effect for the year in which the differences are expected to be recovered or settled. A valuation allowance is established to reduce the deferred tax assets if it is “more likely than not” that the related tax benefits will not be realized in the future.
Recent Accounting Pronouncements
Disclosures about Derivative Instruments and Hedging Activities
In March 2008, the FASB issued SFAS 161, “Disclosures about Derivative Instruments and Hedging Activities-an amendment of FASB statement No. 133.” SFAS 161 requires enhanced disclosures about an entity’s derivative and hedging activities and thereby improves the transparency of financial reporting. SFAS 161 is effective for financial statements issued for fiscal years and interim periods beginning after November 15, 2008, with early application encouraged. At initial adoption, SFAS 161 encourages, but does not require, comparative disclosures for earlier periods. The Company does not expect that this new pronouncement will have a material impact on the Company’s financial statements in future periods.
Business Combinations
In December 2007, the FASB issued SFAS 141 (revised 2007), “Business Combinations.” SFAS 141R establishes principles and requirements for the method in which the acquirer of a business recognizes and measures in its financial statements the identifiable assets acquired, the liabilities assumed, and any noncontrolling interest in the acquiree. SFAS 141R also provides guidance for recognizing and measuring the goodwill acquired in the business combination and determines what information to disclose to enable users of the financial statements to evaluate the nature and financial effects of the business combination. The guidance applies prospectively to business combinations for which the acquisition date is on or after the beginning of the first annual reporting period beginning on or after December 15, 2008. The Company believes that this new pronouncement, once adopted, will have an impact on its accounting for future business combinations, however, the effect will be dependent upon the particular acquisition(s) that may be made in the future.
The Fair Value Option for Financial Assets and Financial Liabilities
In February 2007, the FASB issued SFAS 159, “The Fair Value Option for Financial Assets and Financial Liabilities — Including an Amendment of SFAS 115.” SFAS 159 provides businesses with the option to measure financial instruments and certain other items at fair market value. Unrealized gains and losses on items for which the fair market value option has been elected
93
Table of Contents
GSI GROUP INC.
NOTES TO CONSOLIDATED FINANCIAL STATEMENTS—(Continued)
As of December 31, 2008
are reported in earnings. SFAS 159 is effective for fiscal years beginning after November 15, 2007, provided that the entity also elects to apply the provisions of SFAS 157, “Fair Value Measurements,” as discussed below. The Company adopted SFAS 159 on January 1, 2008 with no impact on its consolidated results and financial position.
Fair Value Measurements
In September 2006, the FASB issued SFAS 157. SFAS 157 defines fair value, establishes a framework for measuring fair value under generally accepted accounting principles, and expands disclosures about fair value measurements. SFAS 157 does not require any new fair value measurements, but provides guidance on how to measure fair value by providing a fair value hierarchy to classify the source of the information. This statement is effective for the Company beginning January 1, 2008. The Company adopted SFAS 157 with no impact on its consolidated results and financial position.
In February 2008, the FASB issued FSP 157-2, “Effective Date of FASB Statement No. 157,” which delays the effective date of SFAS 157 for all nonrecurring fair value measurements of nonfinancial assets and nonfinancial liabilities until fiscal years beginning after November 15, 2008. The nonfinancial assets and nonfinancial liabilities to which SFAS 157 was not applied are included in the Company’s accompanying consolidated balance sheets under the captions: property, plant and equipment, net; other assets; goodwill; and, intangible assets, net. The Company has not determined the effect on its consolidated financial statements from the application of SFAS 157 for all nonrecurring fair value measurements of nonfinancial assets and liabilities. The partial adoption of SFAS 157 for financial assets and financial liabilities did not impact the Company’s consolidated results of operations or financial condition.
In October 2008, the FASB issued FSP 157-3, “Determining the Fair Value of a Financial Asset in a Market That Is Not Active,” which clarifies the application of Statement 157 when the market for a financial asset is inactive. Specifically, FSP 157-3 clarifies how (1) management’s internal assumptions should be considered in measuring fair value when observable data are not present, (2) observable market information from an inactive market should be taken into account, and (3) the use of broker quotes or pricing services should be considered in assessing the relevance of observable and unobservable data to measure fair value. The guidance of FSP 157-3 was effective immediately for financial statements that have not been issued, accordingly we have adopted its provisions with respect to our financial assets and liabilities since June 28, 2008.
In April 2009, the FASB issued FSP 157-4, “Determining Fair Value When the Volume and Level of Activity for the Asset or Liability Have Significantly Decreased and Identifying Transactions That Are Not Orderly”, which provides additional guidance for estimating fair value in accordance with SFAS 157 when the volume and level of activity for the asset or liability have significantly decreased. This FSP re-emphasizes that regardless of market conditions the fair value measurement is an exit price concept as defined in SFAS 157. This FSP clarifies and includes additional factors to consider in determining whether there has been a significant decrease in market activity for an asset or liability and provides additional clarification on estimating fair value when the market activity for an asset or liability has declined significantly. The scope of this FSP does not include assets and liabilities measured under level 1 inputs. FSP 157-4 is applied prospectively to all fair value measurements where appropriate and is effective for interim and annual periods ending after June 15, 2009. The Company will adopt FSP 157-4 during its quarter ended October 2, 2009, and does not anticipate that the adoption will have a material impact on its consolidated results of operations or financial condition.
In April 2009, the FASB issued FSP 107-1 and Accounting Principles Board (“APB”) 28-1, “Interim Disclosures about Fair Value of Financial Instruments.” FSP 107-1 and APB 28-1 amend SFAS 107, “Disclosures about Fair Value of Financial Instruments,” to require publicly-traded companies, as defined in APB 28, “Interim Financial Reporting,” to provide disclosures on the fair value of financial instruments in interim financial statements. FSP 107-1 and APB 28-1 are effective for interim periods ending after June 15, 2009. The Company will adopt FSP 107-1 and APB28-1 during its quarter ended October 2, 2009, and expects that the adoption will require expanded disclosure, but will not have a material impact on its consolidated results of operations or financial condition.
In April 2009, the FASB issued FSP 115-2 and 124-2 “Recognition and Presentation of Other-Than-Temporary Impairments.” This FSP amends the requirements for the recognition and measurement of other-than-temporary impairments for debt securities by modifying the pre-existing “intent and ability” indicator. Under FSP 115-2, for impaired debt securities, an other-than-temporary impairment is triggered when there is intent to sell the security, it is more likely than not that the security will be required to be sold before recovery, or the security is not expected to recover the entire amortized cost basis of the security. Additionally, FSP 115-2 changes the presentation of other-than-temporary impairments in the income statement for those impairments attributed to credit losses. FSP 115-2 is effective for interim and annual reporting periods ending after June 15, 2009. The Company will adopt FSP 115-2 during its quarter ended October 2, 2009, and expects that the adoption will not have a material impact on its consolidated results of operations or financial condition.
94
Table of Contents
GSI GROUP INC.
NOTES TO CONSOLIDATED FINANCIAL STATEMENTS—(Continued)
As of December 31, 2008
Non-Controlling Interests in Consolidated Financial Statements
In December 2007, the FASB issued SFAS 160 “Noncontrolling Interests in Consolidated Financial Statements—an amendment of ARB No. 51.” SFAS 160 establishes accounting and reporting standards for the noncontrolling interest in a subsidiary and for the deconsolidation of a subsidiary. The guidance applies prospectively to business combinations for which the acquisition date is on or after the beginning of the first annual reporting period beginning on or after December 15, 2008. An entity may not apply the pronouncement before that date. Upon the adoption of this SFAS 160, the Company will reclassify the existing amount attributable to its 50% noncontrolling interest in Excel SouthAsia JV from liabilities into stockholders equity.
Determination of the Useful Life of Intangible Assets
In April 2008, the FASB issued FSP 142-3, “Determination of the Useful Life of Intangible Assets,” which amends the factors that must be considered in developing renewal or extension assumptions used to determine the useful life over which to amortize the cost of a recognized intangible asset under SFAS 142. FSP 142-3 amends paragraph 11(d) of SFAS 142 to require an entity to consider its own assumptions about renewal or extension of the term of the arrangement, consistent with its expected use of the asset.
FSP 142-3 also requires the following incremental disclosures for renewable intangible assets: the weighted-average period prior to the next renewal or extension (whether explicit and implicit) for each major intangible asset class; the entity’s accounting policy for the treatment of costs incurred to renew or extend the term of a recognized intangible asset; and, for intangible asset renewed or extended during the period: (1) for entities that capitalize renewal or extension costs, the costs incurred to review or extend the asset, for each major intangible asset class; and, (2) the weighted-average period prior to the next renewal or extension (whether explicit and implicit) for each major intangible asset class.
FSP 142-3 is effective for financial statements for fiscal years beginning after December 15, 2008. The guidance for determining the useful life of a recognized intangible asset must be applied prospectively to intangible assets acquired after the effective date. Early adoption is prohibited. Accordingly, FSP 142-3 would not serve as a basis to change the useful life of an intangible asset that was acquired prior to the effective date. However, the incremental disclosure requirements described above would apply to all intangible assets, including those recognized in periods prior to the effective date of FSP 142-3. The Company is currently evaluating the impact that the adoption of FSP 142-3 will have on its consolidated financial statements.
Revenue Recognition
In September 2009, the FASB’s Emerging Issues Task Force issued EITF 08-1 “Revenue Arrangements with Multiple Deliverables.” EITF 08-1 requires revenue to be allocated to multiple elements using relative fair value based on vendor-specific-objective-evidence, third party evidence or estimated selling price. The residual method becomes obsolete under this guidance. This guidance is effective for arrangements entered into, or materially modified, in periods beginning on or after June 15, 2010, with earlier adoption permitted. The Company is evaluating the impact that its adoption of EITF 08-1 may have on its financial position, results of operations and cash flows.
In September 2009, FASB’s Emerging Issues Task Force issued EITF 09-3 “Certain Revenue Arrangements That Include Software Elements.” EITF 09-3 addresses certain revenue arrangements that include software elements. This guidance states that tangible products with hardware and software components that work together to deliver the product functionality are considered non-software products, and the accounting guidance under the revenue arrangements with multiple deliverables is to be followed. This guidance is effective for arrangements entered into, or materially modified, in periods beginning on or after June 15, 2010, with earlier adoption permitted. The Company does not expect EITF 09-3 to have any impact on its financial position, results of operations and cash flows.
Subsequent Events
In May 2009, the FASB issued SFAS 165, “Subsequent Events” which establishes general standards of accounting for, and disclosure of, events that occur after the balance sheet date but before financial statements are issued or are available to be issued. The provisions of SFAS 165 are effective for interim and annual reporting periods ending after June 15, 2009, and are not expected to have any impact on the Company’s financial position, results of operations, or cash flows.
Recodification of Accounting Standards
In June 2009, the FASB issued authoritative guidance to establish the FASB Accounting Standards Codification as the source of authoritative accounting principles and the framework for selecting the principles used in the preparation of
95
Table of Contents
financial statements of nongovernmental entities that are presented in conformity with generally accepted accounting principles in the United States. This guidance is effective for the Company’s interim reporting period ended on October 2, 2009 and only impacts references for accounting guidance.
Accounting for Entities in Bankruptcy and Coming out of Bankruptcy
In April 2008, the FASB issued FSP 90-7-1, “An Amendment of AICPA Statement of Position 90-7”. FSP 90-7-1 nullifies certain requirements regarding changes in accounting principles that will be applicable to the financial statements of an entity emerging from bankruptcy. Any changes in accounting principles required within the twelve months following the implementation of fresh start accounting by such an entity are no longer required to be adopted at the time fresh start accounting is implemented. Entities emerging from bankruptcy that implement fresh start accounting should only follow accounting standards in effect at the date fresh start accounting is implemented, including any standards eligible for early adoption. The Company will assess the impact of the application of this standard when and if fresh start accounting is required upon resolution of its bankruptcy proceedings.
4. Business Combinations
Acquisition of Excel Technology, Inc.
On August 20, 2008, the Company acquired 78.6% of the outstanding common shares of Excel. Thereafter, the Company commenced a tender offering for all remaining Excel common shares. On August 27, 2008, the Company had obtained 92.8% of Excel’s outstanding shares and performed a short form merger to acquire Excel’s remaining outstanding shares. On August 29, 2008, the Company completed its acquisition of Excel for a cash purchase price of $368.7 million, including: a payment of $32.00 per outstanding common share of Excel; a payment of $32.00 less the strike price of each outstanding option for the purchase of common stock and restricted share of common stock; and transaction costs. In addition to these payments, employee termination costs totaling $18.4 million were paid to the chief executive officer and chief financial officer of Excel; these costs have not been included in the purchase price, but are included in the allocation of the purchase consideration. Excel provides complementary products, technologies, and distribution channels. The Company believes that the combined Company will provide its customers a significantly broader product offering. The Company has initiated the integration of key operating units, and those activities are either complete or well underway. These synergistic efforts have enabled substantial cost savings initiatives. Certain integration activities have been delayed due to the Company’s Revenue Review and the Chapter 11 Cases. The Company plans to finalize its integration activities in 2010.
The Company accounted for the acquisition as a purchase. The Company has included Excel’s results of operations with the Company’s results beginning August 20, 2008. Subsequent to the acquisition of Excel, the Company established a third segment which is comprised solely of the operations of the newly acquired entity. The Company has recorded the assets purchased and liabilities assumed (collectively, the “net assets”) based on their estimated fair values at the date of acquisition. Under the provisions of SFAS 141, the excess of the total purchase consideration over the fair value of net assets is recorded to goodwill. The goodwill recognized on the Excel acquisition reflects synergies and other benefits expected to be realized from the combination of the two businesses following the acquisition. The goodwill recorded in connection with this acquisition is not deductible for tax purposes.
A summary of the purchase price allocation is as follows (in thousands):
| Total Purchase Consideration: |
|||
| Cash paid to shareholders |
$ | 347,730 | |
| Cash paid to option holders and restricted stockholders |
12,674 | ||
| Transaction fees |
8,307 | ||
| Total Purchase Consideration |
$ | 368,711 | |
| Allocation of the Purchase Consideration: |
|||
| Cash and cash equivalents |
10,430 | ||
| Long-term investments (auction rate securities) |
24,985 | ||
| Accounts receivable |
20,435 | ||
| Inventories |
37,690 | ||
| Income tax receivable |
7,002 | ||
| Deferred tax assets |
3,442 | ||
| Property, plant and equipment |
33,050 | ||
| Identifiable intangible assets |
132,685 | ||
| In-process research and development charge |
12,142 | ||
| Goodwill |
149,941 | ||
| Other assets |
2,292 | ||
| Total assets acquired |
434,094 | ||
| Accounts payable and accrued expenses |
15,554 | ||
| Income taxes payable |
348 | ||
| Deferred tax liabilities, non-current |
47,541 | ||
| Other liabilities |
1,940 | ||
| Total liabilities assumed |
65,383 | ||
| Net assets acquired |
$ | 368,711 | |
96
Table of Contents
The deferred tax liability primarily relates to the tax impact of future tax amortization associated with the identified intangible assets acquired, the adjustment in fair value of certain tangible assets acquired, and the difference between book and tax basis for original issue discount on the debt. The estimated taxes are based on an expected effective tax rate of 36.35%.
The Company used the income approach to determine fair value of the intangible assets. This approach calculates fair value by discounting the after-tax cash flows back to a present value. The baseline data for this analysis were based on the cash flow estimates used to price the transaction. Cash flows were forecasted for each intangible asset, and then discounted based on an appropriate discount rate. In estimating the useful life of the amortizable intangible assets, the Company considered paragraph 11 of SFAS 142, which lists the pertinent factors to be considered when estimating the useful life of an intangible asset. These factors included a review of the expected use by the combined company of the assets acquired; the expected useful life of any other asset (or group of assets) related to the acquired assets; legal, regulatory or other contractual provisions that may limit the useful life of an acquired asset or may enable the extension of the useful life of an acquired asset without substantial cost; the effects of obsolescence, demand, competition and other economic factors; and the level of maintenance expenditures required to obtain the expected future cash flows from the asset. Definite-lived intangible assets are being amortized on a straight-line basis.
The value assigned to in-process research and development was determined using an income approach by estimating the costs to develop the acquired technology into commercially viable products, estimating the resulting net cash flows from the projects, and discounting the net cash flows to their present value. At the date of acquisition, the development of these projects had not yet reached technological feasibility, and had no alternative future uses. Accordingly, the Company has expensed the value of this research and development at the acquisition date. Due to the nature of the forecasts and the risks associated with the developmental projects, a discount rate of 15.0% was used to discount the net cash flows to their present value. The Company anticipates costs to complete the development of these projects will be $4.4 million, and will be completed between December 2008 and December 2010. The successful development of new products and product enhancements is subject to numerous risks and uncertainties, both known and unknown, including unanticipated delays, access to capital, budget overruns, technical problems and other difficulties that could result in the abandonment or substantial change in the design, development and commercialization of these new products and enhancements. Given the uncertainties inherent with product development and introduction, there can be no assurance that any of the combined Company’s product development efforts will be successful on a timely basis or within budget, if at all. The failure of the combined Company to develop new products and product enhancements on a timely basis or within budget could harm the combined Company’s results of operations and financial condition.
The following assets are the identifiable intangible assets acquired and their respective weighted average lives (dollars in thousands):
| Amount | Weighted Average Life (Years) | ||||
| Amortizable intangible assets: |
|||||
| Core technology |
$ | 42,355 | 9.9 | ||
| Customer relationships |
44,764 | 11.9 | |||
| Customer backlog |
3,186 | 1.0 | |||
| Non-compete agreements |
8,040 | 2.9 | |||
| Amortizable intangible assets |
98,345 | 10.0 | |||
| Non-amortizable intangible assets: |
|||||
| Trade names |
34,340 | ||||
| Total identifiable intangible assets |
$ | 132,685 | |||
97
Table of Contents
As discussed in further detail in Note 6 of Notes to Consolidated Financial Statements, the Company undertook an impairment review of its goodwill, intangible assets and other long-lived assets (property, plant and equipment) at December 31, 2008 due to the significant downturn in the global economy in 2008, particularly in the fourth quarter. Included in the impairment charge recorded as of December 31, 2008 were impairments of the goodwill, intangible assets and fixed assets from the Company’s acquisition of Excel. These assets were reduced by $114.1 million, $66.5 million and $2.1 million, respectively.
Acquisition of the U.K. Beryllium Business
On June 1, 2007, the Company acquired the beryllium mirror and structures business of U.K.-based Thales Optronics (Taunton) Ltd, (the “U.K. Beryllium Business”) for $3.0 million, consisting of $2.5 million in payments to former shareholders, plus $0.5 million in acquisition related expenses. The acquisition helped strengthen the Company’s market position in optical scanning. The acquisition was accounted for under SFAS 141. The Company allocated the costs of acquisition to the assets acquired and liabilities assumed based on the fair values at the acquisition date. In performing this analysis, the fair value of the net assets acquired was greater than the purchase price. In accordance with SFAS 141, the excess of the fair value of the acquired net assets over the purchase cost was allocated on a pro rata basis to the acquired long term assets, which consisted of property, plant and equipment and intangible assets. The results of operations of this business are included in the Precision Technology Segment of the Company’s consolidated financial statements from the acquisition date. Total assets acquired were $3.8 million and liabilities assumed were $0.8 million.
Supplementary Pro Forma Information (Unaudited)
The following unaudited pro forma information presents a summary of consolidated results of operations of the Company and Excel as if the acquisition had occurred at the beginning of each of the periods presented with pro forma adjustments to give effect to amortization of intangible assets, an increase in interest expense on acquisition financing and certain other adjustments together with related tax effects. The unaudited pro forma financial information excludes the material, non-recurring charge for the purchased in-process research and development charge of $12.1 million. No pro-forma information has been presented for the acquisition of the U.K. Beryllium Business, because such information is not material to the Company’s financial results. The unaudited pro forma condensed consolidated financial information is presented for informational purposes only. The pro forma information is not necessarily indicative of what the financial position or results of operations actually would have been had the merger been completed at the dates indicated. In addition, the unaudited pro forma condensed consolidated financial information does not purport to project the future financial position or operating results of the combined Company after completion of the acquisition (in thousands, except per share amounts):
| Year Ended December 31, | |||||||
| 2008 | 2007 | ||||||
| Sales |
$ | 387,255 | $ | 451,104 | |||
| Income (loss) from continuing operations |
(216,181 | ) | 1,256 | ||||
| Income from discontinued operations, net of tax |
270 | 467 | |||||
| Gain on disposal of discontinued operations, net of tax |
8,732 | — | |||||
| Net income (loss) |
$ | (207,179 | ) | $ | 1,723 | ||
| Income (loss) from continuing operations per share – basic and diluted |
$ | (5.01 | ) | $ | 0.03 | ||
| Income from discontinued operations per share – basic and diluted |
0.21 | 0.01 | |||||
| Net income (loss) per share – basic and diluted |
$ | (4.80 | ) | $ | 0.04 | ||
98
Table of Contents
5. Discontinued Operations
The Company evaluates its businesses and product lines periodically for strategic fit within its operations. On July 3, 2008, the Company entered into a definitive agreement to sell its U.S. Optics Business located in Moorpark, California and part of the Company’s Precision Technology Segment for $21.6 million. The sale was closed on October 8, 2008. The net gain of $8.7 million is reported as Gain on Disposal of Discontinued Operations, net of tax, in the Company’s consolidated statement of operations for the year ended December 31, 2008.
In accordance with SFAS 144, the following amounts related to the U.S. Optics Business have been segregated from continuing operations and included in discontinued operations, net of tax, in the consolidated statements of operations (in thousands).
| Year Ended December 31, | ||||||||||||
| 2008 | 2007 | 2006 | ||||||||||
| Sales of discontinued business |
$ | 10,188 | $ | 11,502 | $ | 11,337 | ||||||
| Pre-tax income of discontinued business |
495 | 763 | 1,037 | |||||||||
| Provision for taxes on income of discontinued business |
(225 | ) | (296 | ) | (392 | ) | ||||||
| Income from operations of discontinued business – net of tax |
270 | 467 | 645 | |||||||||
| Pre-tax gain on discontinued business |
13,412 | — | — | |||||||||
| Provision for taxes on gain |
(4,680 | ) | — | — | ||||||||
| Gain on discontinued business – net of tax |
8,732 | — | — | |||||||||
| Income from discontinued business – net of tax |
$ | 9,002 | $ | 467 | $ | 645 | ||||||
The assets and liabilities relating to the U.S. Optics Business have been segregated from other of the Company’s assets and liabilities in the accompanying consolidated balance sheets. Net cash flows of the Company’s discontinued operations from each of the categories of operating, investing and financing were not significant for the years ended December 31, 2008, 2007 and 2006.
6. Goodwill, Intangible Assets and Impairment Charges
Goodwill
Goodwill is recorded when the consideration for an acquisition exceeds the fair value of net tangible and identifiable intangible assets acquired. The change in the carrying amount of goodwill during the year ended December 31, 2008 is as follows (in thousands):
| Balance at December 31, 2006 and 2007, as restated |
$ | 26,291 | ||
| Acquisition of Excel |
149,941 | |||
| Impairment of goodwill |
(131,169 | ) | ||
| Balance at December 31, 2008 |
$ | 45,063 | ||
99
Table of Contents
Intangible Assets
Intangible assets consist of the following (in thousands):
| December 31, 2008 | ||||||||||||
| Gross Carrying Amount |
Accumulated Amortization |
Net Carrying Amount |
Weighted Average Remaining Life (Years) | |||||||||
| Amortizable intangible assets: |
||||||||||||
| Patents and acquired technology |
$ | 60,940 | $ | (35,593 | ) | $ | 25,347 | 7.3 | ||||
| Customer relationships |
33,681 | (8,779 | ) | 24,902 | 10.1 | |||||||
| Customer backlog |
2,355 | (1,155 | ) | 1,200 | 0.7 | |||||||
| Non-compete agreements |
4,870 | (1,010 | ) | 3,860 | 2.6 | |||||||
| Trademarks, trade names and other |
5,589 | (2,465 | ) | 3,124 | 10.2 | |||||||
| Amortizable intangible assets |
107,435 | (49,002 | ) | 58,433 | 8.2 | |||||||
| Non-amortizable intangible assets: |
||||||||||||
| Trade names |
13,027 | n/a | 13,027 | |||||||||
| Totals |
$ | 120,462 | $ | (49,002 | ) | $ | 71,460 | |||||
| December 31, 2007 | ||||||||||||
| Gross Carrying Amount |
Accumulated Amortization |
Net Carrying Amount |
Weighted Average Remaining Life (Years) | |||||||||
| Amortizable intangible assets: |
||||||||||||
| Patents and acquired technology |
$ | 49,755 | $ | (32,797 | ) | $ | 16,958 | 5.7 | ||||
| Customer relationships |
15,258 | (6,410 | ) | 8,848 | 5.1 | |||||||
| Trademarks, trade names and other |
6,161 | (2,192 | ) | 3,969 | 10.9 | |||||||
| Totals |
$ | 71,174 | $ | (41,399 | ) | $ | 29,775 | 6.2 | ||||
All definite-lived intangible assets are amortized on a straight-line basis over their remaining life. Amortization expense for customer relationships, trademarks and definite-lived trademarks, trade names and other are included in operating expenses and were $5.7 million, $2.2 million and $2.1 million in 2008, 2007 and 2006, respectively. Amortization expense for patents and acquired technology are included in the cost of goods sold in the accompanying statements of operations and were $4.7 million, $3.6 million and $3.7 million in 2008, 2007 and 2006, respectively.
Estimated amortization expense for each of the five succeeding years as of December 31, 2008, is as follows (in thousands):
| Cost of Goods Sold |
Operating Expenses |
Total | |||||||
| 2009 |
$ | 3,819 | $ | 5,794 | $ | 9,613 | |||
| 2010 |
3,819 | 4,499 | 8,318 | ||||||
| 2011 |
3,781 | 3,579 | 7,360 | ||||||
| 2012 |
3,165 | 2,710 | 5,875 | ||||||
| 2013 |
3,165 | 2,710 | 5,875 | ||||||
| Thereafter |
7,598 | 13,794 | 21,392 | ||||||
| Total |
$ | 25,347 | $ | 33,086 | $ | 58,433 | |||
100
Table of Contents
Impairment Charges
The significant downturn in the global economy experienced in 2008, and most notably in the fourth quarter of 2008, negatively impacted the Company’s estimated future revenues and cash flows. The Company had performed its annual goodwill impairment test in the beginning of the second quarter noting no impairment. However, the downturn in the global economy and its effect on the Company’s business, including its revenues, suggested that an impairment might exist as of December 31, 2008. Consequently, the Company undertook an impairment review of its goodwill, intangible assets and other long-lived assets (property, plant and equipment) at the end of 2008. This review led the Company to record an impairment charge of $215.1 million to reduce the carrying values of these assets to their fair value. The impairments of intangible assets and property, plant and equipment have been reflected as reductions in their gross carrying amounts. The impairment charge by segment is as follows:
| • | Precision Technology: $17.1 million for goodwill, $11.9 million for definite-lived intangible assets and $2.7 million for property, plant and equipment. Total impairment: $31.7 million. |
| • | Excel : $114.1 million for goodwill, $21.3 million for indefinite-lived intangible assets, $45.2 million for definite-lived intangible assets and $2.1 million for property, plant and equipment. Total impairment: $182.7 million. |
| • | Corporate: $0.7 million for property, plant and equipment. |
The results of the impairment review are summarized in the following table (in thousands):
| Pre-impairment Net Carrying Value |
Impairment Charge |
Post-impairment Net Carrying Value | ||||||||
| Goodwill |
$ | 176,232 | $ | (131,169 | ) | $ | 45,063 | |||
| Indefinite-lived intangible assets |
34,341 | (21,314 | ) | 13,027 | ||||||
| Definite-lived intangible assets |
115,563 | (57,130 | ) | 58,433 | ||||||
| Property, plant and equipment |
59,877 | (5,438 | ) | 54,439 | ||||||
| $ | 386,013 | $ | (215,051 | ) | $ | 170,962 | ||||
Revenue and the resulting cash flows, as well as the applied discount rate that is associated with risk and the Company’s cost of capital, are significant inputs in the calculation of the fair value of goodwill and intangible assets. The deterioration of these, and other factors, resulted in the decrease in the fair value of the Company’s goodwill and intangible assets.
The downward revision in the Company’s estimated future cash flows and the increase in the rates used to discount them account for most of the impairment recorded on our goodwill and intangible assets in 2008. No impairment charges were recorded in 2007 or 2006. Following the Company’s 2008 impairment charge, it continues to maintain a significant balance in its goodwill, intangible assets and other long-lived assets. To the extent that the Company’s assumptions used to value the goodwill and other intangible assets as of December 31, 2008 should adversely change, due to a further deterioration of the markets that the Company serves, the broader worldwide economy, or the performance of the Company’s business relative to its expectations as of December 31, 2008, the Company may be required to record additional impairment charges in the future.
The Company’s impairment charge recorded on December 31, 2008 included a significant charge against the goodwill, intangible assets and other long-lived assets that it acquired in connection with its business combination of Excel on August 20, 2008. Specifically, the impairment charges noted above included a reduction in the acquired goodwill, intangible assets and other long-lived assets of Excel of $114.1 million, $66.5 million and $2.1 million, respectively. These impairment charges represent 76%, 50% and 6% of the respective amounts acquired in August 2008.
The Company’s acquisition of Excel was finalized on August 20, 2008 pursuant to a merger agreement that was entered into as of July 9, 2008. Inherent in the Company’s purchase price valuation of Excel were estimates of the future
101
Table of Contents
performance of Excel, including revenue and expense projections. In September 2008, shortly after the acquisition, the worldwide economies began a dramatic period in which credit was tightened and international trade declined dramatically. The significant downturn in the global economy experienced in 2008, and most notably in the fourth quarter of 2008, negatively impacted our estimated future revenues and cash flows, as compared to our prior estimates, including those estimates made at the time we acquired Excel. Excel’s 2009 unaudited actual revenues were approximately 32% lower than Excel’s 2009 projected revenue at the time of the acquisition in August 2008. From the acquisition in August 2008 to December 2008, when the impairment analysis was performed, we reduced Excel’s annual revenue projections by $50.1 to $54.5 million per year, or on average approximately 26% per year, compared to the projections used to initially value the intangible assets in Excel’s purchase price allocation. During this same period of time, the Company’s cost of capital increased significantly, primarily due to the increase in risk associated with an investment in the Company’s equity securities. Our estimated cost of capital increased in the fourth quarter of 2008 after we announced the delayed filing of our financial results, as further discussed in Note 2 of the Company’s Notes to Consolidated Financial Statements. The announcement increased our risk profile and made financing more expensive, as a result of the decline in the Company’s stock price, the receipt by the Company of default notices from its noteholders, and the severe economic downturn. Our weighted average cost of capital forms the basis of the rates used to discount our cash flow forecasts which are integral to our fair value estimates. The discount rates utilized to initially value the intangible assets in the purchase price allocation ranged from 10.0% to 13.0%, while the discount rates utilized in the December 31, 2008 impairment analyses of the goodwill and other intangible assets ranged from 16.5% to 17.5%.
7. Supplementary Balance Sheet Information
The following tables provide the details of selected balance sheet items as of December 31, 2008 and 2007:
Inventories
| December 31, | ||||||
| 2008 | 2007 | |||||
| (In thousands) | ||||||
| Raw materials |
$ | 41,406 | $ | 28,431 | ||
| Work-in-process |
17,548 | 13,776 | ||||
| Finished goods |
14,486 | 17,626 | ||||
| Demo inventory |
4,282 | 4,084 | ||||
| Consigned inventory |
786 | 222 | ||||
| Total inventories |
$ | 78,508 | $ | 64,139 | ||
Property, Plant and Equipment, net
| December 31, | ||||||||
| 2008 | 2007 | |||||||
| (In thousands) | ||||||||
| Cost: |
||||||||
| Land, buildings and improvements |
$ | 48,602 | $ | 26,519 | ||||
| Machinery and equipment |
51,146 | 57,904 | ||||||
| Total cost |
99,748 | 84,423 | ||||||
| Accumulated depreciation and amortization |
(45,309 | ) | (56,041 | ) | ||||
| Net property, plant and equipment |
$ | 54,439 | $ | 28,382 | ||||
Depreciation expense was $8.5 million, $8.7 million and $7.5 million for 2008, 2007 and 2006, respectively. The costs noted in the table above have been reduced by the $5.4 million impairment charge that was recorded on December 31, 2008. See the Impairment Charges section of Note 6 above for further details.
102
Table of Contents
Other Current Assets
| December 31, | ||||||
| 2008 | 2007 | |||||
| (In thousands) | ||||||
| Prepaid expenses |
$ | 4,411 | $ | 4,573 | ||
| U.K. buildings held for sale |
3,376 | 1,814 | ||||
| Other current assets |
1,782 | 733 | ||||
| Total |
$ | 9,569 | $ | 7,120 | ||
At December 31, 2008 and 2007, the Company had certain of its properties in the U.K. available for sale. At December 31, 2008, there were two properties with net book value of $0.2 and $3.3 million, respectively. The Company completed the sale of these buildings in February 2009 for $0.5 million, and in October 2009 for $3.6 million, respectively, and recorded a gain on sale of assets of $0.1 million and $0.1 million, respectively.
At December 31, 2007, the Company had another property in the U.K. available for sale, with a net book value of $1.5 million, which building was sold in 2008 for $3.2 million. The Company recorded a net gain of $1.7 million.
Other Accrued Expenses
| December 31, | ||||||
| 2008 | 2007 | |||||
| (In thousands) | ||||||
| Accrued interest |
$ | 8,342 | $— | |||
| Accrued penalty to warrant holders (Note 8) |
805 | — | ||||
| Accrued warranty |
3,793 | 4,216 | ||||
| Accrued professional fees |
2,076 | 1,236 | ||||
| Accrued third party sales commissions |
604 | 612 | ||||
| Customer deposits |
484 | 35 | ||||
| Accrued restructuring, current portion |
2,969 | 327 | ||||
| Other |
4,741 | 2,554 | ||||
| Total |
$ | 23,814 | $ | 8,980 | ||
Accrued Warranty
| December 31, | ||||||||
| 2008 | 2007 | |||||||
| (In thousands) | ||||||||
| Balance at beginning of the year |
$ | 4,216 | $ | 4,814 | ||||
| Assumed in Excel acquisition |
1,214 | — | ||||||
| Charged to costs and expenses |
6,618 | 4,283 | ||||||
| Use of provision |
(7,948 | ) | (4,888 | ) | ||||
| Foreign currency exchange rate changes |
(307 | ) | 7 | |||||
| Balance at end of the year |
$ | 3,793 | $ | 4,216 | ||||
8. Debt
On August 20, 2008 (the “Closing Date”), the Company issued to various investors $210.0 million of unsecured senior notes (the “Senior Notes”), along with detachable warrants (the “Warrants”) for the purchase of 5,882,520 of the Company’s common shares, for collective net proceeds to the Company of $203.5 million. The proceeds were used to fund a portion of the Company’s acquisition of Excel, and the Senior Notes carry a fixed interest rate of 11.0%. The Warrants were net exercised by the holders in October 2008, in exchange for 5,858,495 common shares of the Company. The Company
103
Table of Contents
ascribed a fair value to the Warrants in the amount of $26.3 million as of the Closing Date. The fair value was based upon the Black-Scholes option pricing model, assuming a risk-free interest rate of 3.0%, an expected term of 5.0 years, a volatility rate of 85.0% and no dividends.
The Senior Notes pay interest semi-annually and mature in August 2013. After the first year anniversary of the Closing Date, the Company may redeem up to 50% of the Senior Notes with no penalty or premium. After the third anniversary of the Closing Date, the Company may redeem all remaining Senior Notes, again with no penalty or premium. The Senior Notes require the Company to comply with certain covenants that restrict the Company from taking on additional debt, repurchasing equity, making investments or selling certain assets. Under the Bankruptcy Code, our status as a bankruptcy debtor automatically accelerates the payment of all of the Company’s debt, including that arising under the Senior Notes. Accordingly, the Company has classified this debt as current in its December 31, 2008 consolidated financial statements. As further discussed in Note 1, under “The Third Modified Joint Chapter 11 Plan of Reorganization” the holders of the Senior Notes have agreed to exchange their Senior Note Claims in exchange for: (i) approximately 53.8% of GSIG’s post-consummation outstanding shares, (ii) new secured notes in the aggregate amount of $110 million, (iii) excess cash available under the Plan to the extent certain allowed claims exceed $22.5 million, and (iv) their pro rata portion of the Cash Payment.
The $26.3 million value of the warrants was recorded as a discount against the debt. This discount is being amortized to interest expense using the effective interest method over the life of the Senior Notes. In connection with the issuance of the Senior Notes, the Company incurred $6.5 million in issuance fees which are included in other current assets. These issuance fees are being amortized to interest expense over the contractual term of the Senior Notes. As of December 31, 2008, the unamortized portion of the valuation of the warrants was $24.9 million, and the unamortized debt issuance costs were $6.0 million. The Senior Notes, net of the value of the warrants and net of the debt issuance costs, constitute a net carrying value of $185.1 million at December 31, 2008. There was no debt outstanding as of December 31, 2007. For the year ended December 31, 2008, the total amount recorded to interest expense, including the accretion of the warrant value, and of the debt issuance costs, was $10.2 million.
As discussed further at Note 2 of Notes to Consolidated Financial Statements, in connection with the Revenue Review, the Company failed to timely file its annual and quarterly reports. In connection with the issuance of the Warrants, the Company and the Warrant holders entered into a Registration Rights Agreement (the “RRA”), dated as of August 20, 2008, pursuant to which the Company agreed to register the common shares issuable upon exercise of the Warrants. The Company filed that registration statement on Form S-3 in October 2008, simultaneously with the exercise of the Warrants. As a result of its failure to file its Quarterly Report on Form 10-Q for the period ended September 26, 2008, on November 12, 2008 the Company notified the former Warrant holders that it was indefinitely suspending its registration statement on Form S-3. Pursuant to the RRA , the Company is obligated to maintain the effectiveness of the registration statement until the earlier of (i) the date which is twelve (12) months after the Effective Time (October 23, 2008) and (ii) the date on which there are no registrable securities (the “Maintenance Period”). Under the RRA, monetary penalties accrue and are payable to the former Warrant holders for failure to maintain an effective registration statement during the Maintenance Period, subject to certain terms and conditions more specifically set forth therein. In 2008, the Company incurred penalties under the RRA, and as a result has recorded an expense and corresponding accrued liability of $0.8 million in 2008. The Company has continued to incur penalties under the RRA into 2009. The maximum penalty payments payable under these provisions is approximately $4.0 million.
Chapter 11 Bankruptcy Filing
On November 20, 2009 the Debtors filed voluntary petitions for relief under Chapter 11 of the Bankruptcy Code. The filing by the Debtors constitutes a “pre-arranged” proposed joint plan of reorganization (the “Plan”), which was supported by 88.1% of the holders of the Senior Notes. As proposed, the Plan, among other things, would allow the Company to (a) restructure the currently outstanding Senior Notes, and (b) restructure currently outstanding intercompany debt of $20.0 million that is owed from GSI US to GSI Group Limited.
Refer to Note 1 for further discussion of the “Chapter 11 Bankruptcy Filing”, “The Third Modified Joint Chapter 11 Plan of Reorganization”, and “The Plan Support Agreement.”
Fair Value of Debt
The estimated fair value of the Company’s Senior Notes approximated $145.0 million at December 31, 2008. This fair value estimate represents the value at which the Company estimates the lenders could trade our debt within the financial markets, and do not represent the settlement value of these long-term debt liabilities to the Company. The fair value of these
104
Table of Contents
long-term debt issues will continue to fluctuate each period based on fluctuations in market interest rates, and these fluctuations may have little to no correlation to the Company’s outstanding debt balances. Our Senior Notes are not publicly traded, but private party sales may occur. The fair value of our Senior Notes is based on quoted prices for similar liabilities, or similar liabilities traded as assets.
9. Stockholders’ Equity
Capital stock
The authorized capital of the Company consists of an unlimited number of common shares without nominal or par value. Holders of common shares are entitled to one vote per share. Holders of common shares are entitled to receive dividends, if and when declared by the Board of Directors, and to share ratably in its assets legally available for distribution to the stockholders in the event of liquidation. Holders of common shares have no redemption or conversion rights.
Warrants
As discussed in Note 8, in August 2008 the Company issued Warrants which were later net exercised in October 2008 for an aggregate of 5,858,495 common shares.
Shareholders Rights Plan
At the annual meeting of shareholders held on May 15, 2008, shareholders approved a resolution approving the continuation, amendment and restatement of the Company’s shareholders rights plan.
Prior to the 2008 annual meeting of shareholders, the board of directors of the Company approved an amended and restated shareholder rights plan agreement to be dated May 15, 2008, if approved by shareholders at such meeting. The rights plan was originally approved by the Company’s shareholders on May 26, 2005 and its continued existence had to be approved and confirmed by independent shareholders on or before the date of the Company’s 2008 annual meeting of shareholders or the rights plan would expire.
The amended and restated shareholder rights plan continues to create a right (which is only triggered if a person or a control group acquires 20% or more of the Company’s issued and outstanding publicly traded common shares) for each shareholder, other than the acquiring person or its associates or affiliates, to acquire additional common shares of the Company at one-half of the then market price at the time of exercise. The net effect of an exercise is to dilute the prospective acquirer’s share position, and inhibits a change of control event unless the rights plan has been withdrawn or the buyer makes a bid that is permitted by the terms of the plan.
The rights plan is intended to give the Company’s Board of Directors more time and control over any sale process and increase the likelihood of maximizing shareholder value.
Stock Repurchase Plan
In December 2005, the Company’s Board of Directors authorized a stock repurchase program providing for the repurchase of up to $15.0 million in shares of the Company’s common shares. In February 2008, the Company’s Board of Directors authorized an increase in the Stock Repurchase Program up to a total of $40.0 million. The Company repurchased and retired 772,467 shares, 816,830 shares, and 381,300 shares in 2008, 2007, and 2006, respectively, at an aggregate cost of $6.4 million, $7.8 million, and $3.8 million, respectively. The program was suspended in May 2008 as a result of the Company’s decision to acquire Excel. At December 31, 2008, $21.9 million remains available for future Company purchases under this program.
10. Share-Based Compensation
The Company has several share-based compensation plans, including the 2006 Equity Incentive Plan, under which stock-based grants may be issued and several other plans under which no new grants will be made. The 2006 Equity Incentive Plan provides for grants of various stock-based awards including, but not limited to, stock options, stock appreciation rights and restricted stock. Since 2006, the Company has issued only restricted stock in the form of time and performance-based grants to senior executives, key employees and directors.
105
Table of Contents
2006 Equity Incentive Plan
On May 15, 2006, shareholders of the Company approved the 2006 Equity Incentive Plan which provides for the sale or grant of various awards of, or the value of, the Company’s common shares including stock options, stock appreciation rights, restricted stock and performance shares and units, performance-based awards, and stock grants, to officers, directors, employees and certain consultants to the Company. The maximum number of shares of the Company’s common shares which may be issued pursuant to the 2006 Equity Incentive Plan is 9,406,000 shares, including a 2.5 million share increase as approved by the Company’s shareholders at the May 2008 annual meeting, and subject to adjustment in the event of certain corporate events and reduced by the number of shares already issued pursuant to awards under the Company’s 1992 and 1995 Equity Incentive Plans. The plan has a ten year term. As of December 31, 2008, there were 4,004,789 common shares available for future issuance under this plan.
The Company recorded compensation expense related to restricted stock awards issued under the 2006 Equity Incentive Plan totaling $2.8 million, $2.5 million and $0.7 million for the years 2008, 2007 and 2006, respectively. Stock compensation expense is primarily included in selling, general, and administrative expenses, and as an increase to additional paid-in capital on the Company’s consolidated balance sheets. Earnings before income taxes were reduced by these amounts. As the restricted stock is issuable to the holder, subject to vesting provisions, with no consideration payable by the holder, the grant date fair value per share is based on the quoted stock price on the date of the grant.
It is the Company’s policy to issue new shares for equity awards. The Company recognizes compensation expense on fixed awards on a straight-line basis over the requisite service period, which is generally from the grant of the awards through the end of the vesting period. Restricted stock awards have generally been issued with a three-year vesting period. The Company reduces the compensation expense by an estimated forfeiture rate which is based on actual experience. The Company assesses the likelihood that performance-based shares will be earned based on the probability of meeting the performance criteria. For those performance-based awards that are deemed probable of achievement, an expense is recorded, and for those awards that are deemed not probable of achievement no expense is recorded. The Company assesses the probability of achievement each quarter.
The table below summarizes activity relating to restricted stock awards issued under the 2006 Equity Incentive Plan:
| Restricted Stock Awards (In thousands) |
Weighted- Average Grant Date Fair Value | |||||
| Nonvested restricted stock at December 31, 2005 |
— | $ | — | |||
| Granted |
626 | $ | 9.30 | |||
| Vested |
— | $ | — | |||
| Forfeited |
(20 | ) | $ | 9.78 | ||
| Nonvested restricted stock at December 31, 2006 |
606 | $ | 9.28 | |||
| Granted |
782 | $ | 10.07 | |||
| Vested |
(134 | ) | $ | 9.14 | ||
| Forfeited |
(87 | ) | $ | 9.95 | ||
| Nonvested restricted stock at December 31, 2007 |
1,167 | $ | 9.78 | |||
| Granted |
805 | $ | 7.91 | |||
| Vested |
(305 | ) | $ | 9.67 | ||
| Forfeited |
(907 | ) | $ | 8.95 | ||
| Nonvested restricted stock at December 31, 2008 |
760 | $ | 8.84 | |||
The Company’s restricted stock awards consist of both time-based and performance-based awards. Based on the Company’s estimates of forfeitures of time-based awards, and estimates relative to performance-based awards’ vesting and forfeitures, the Company would record aggregate compensation expense of $2.7 million subsequent to December 31, 2008, over a weighted average life of 1.6 years.
The total intrinsic value of restricted stock awards that vested in 2008 and 2007, based on the market price of the underlying stock on the day of vesting, was $2.3 million and $1.3 million, respectively.
106
Table of Contents
Other Incentive Compensation Plans
The Company has several stock option plans and a warrant plan with outstanding grants that pre-date the 2006 Equity Incentive Plan. In 2005, the unvested options were accelerated. No new options will be granted under pre-2006 equity plans as all future equity grants will be issued exclusively under the 2006 Equity Incentive Plan Stock option and warrant activity under these plans is presented below:
| Number
of Shares (in thousands) |
Weighted Average Exercise Price |
Weighted Average Remaining Term in Years |
Aggregate Intrinsic Value | ||||||||
| Outstanding at December 31, 2005 |
3,565 | $ | 8.21 | ||||||||
| Granted |
— | — | |||||||||
| Exercised |
(643 | ) | $ | 7.61 | |||||||
| Forfeited and expired |
(580 | ) | $ | 17.96 | |||||||
| Outstanding at December 31, 2006 |
2,342 | $ | 9.73 | ||||||||
| Granted |
— | — | |||||||||
| Exercised |
(954 | ) | $ | 8.59 | |||||||
| Forfeited and expired |
(160 | ) | $ | 10.83 | |||||||
| Outstanding at December 31, 2007 |
1,228 | $ | 10.46 | ||||||||
| Granted |
— | — | |||||||||
| Exercised |
(16 | ) | $ | 3.89 | |||||||
| Forfeited and expired |
(782 | ) | $ | 11.13 | |||||||
| Outstanding at December 31, 2008 |
430 | $ | 9.49 | 1.46 years | $ | — | |||||
| Exercisable at December 31, 2008 |
430 | $ | 9.49 | 1.46 years | $ | — | |||||
The aggregate intrinsic value is calculated as the difference between the exercise price of the underlying options and warrants and the quoted price of common shares for the options and warrants that were in the money at December 31, 2008. There were no in the money shares at December 31, 2008. The intrinsic values of exercised options and warrants, under the incentive compensation plans, in the years ended December 31, 2008, 2007 and 2006 was $0.0 million, $1.3 million and $3.1 million, respectively.
The following summarizes outstanding and exercisable options and warrants as of December 31, 2008:
| Exercise Prices |
Number of Shares (in thousands) |
Weighted Average Remaining Life (Years) |
Weighted Average Exercise Price | ||||
| $ 4.31 |
22 | 0.30 | $ | 4.31 | |||
| $ 4.45 |
10 | 0.33 | $ | 4.45 | |||
| $ 8.83 |
60 | 2.85 | $ | 8.83 | |||
| $ 9.36 |
11 | 2.14 | $ | 9.36 | |||
| $10.00 |
80 | 2.57 | $ | 10.00 | |||
| $10.09 |
207 | 0.73 | $ | 10.09 | |||
| $10.60 |
40 | 1.72 | $ | 10.60 | |||
| 430 | 1.46 | $ | 9.49 | ||||
2006 Stock Option Review
During the fourth quarter of 2006, the Company and its Audit Committee, assisted by outside counsel, conducted a review of its historical stock option granting practices during the period from 2000 to 2005 (the “Stock Option Review”). Based on the results of the Stock Option Review, the Company had previously recorded a $0.3 million expense to selling, general and administrative expenses in 2006 to reflect the cumulative impact of accounting errors due to the use of incorrect measurement dates. These restated financial statements include the impact of recording the impact of the Stock Option Review to their appropriate periods. The Company historically concluded that the use of incorrect measurement dates was not the result of intentional wrongdoing and had previously taken steps to improve the controls over its equity award granting process.
107
Table of Contents
11. Employee Benefit Plans
U.K. Defined Benefit Pension Plan
The Company maintains a pension plan in the United Kingdom that consists of two components: the Final Salary Plan (the “U.K. Plan”), which is a defined benefit plan, and the Retirement Savings Plan, which is a defined contribution plan. In 1997, membership to the U.K. Plan was closed and in 2003 the Company was allowed to stop accruing additional benefits to the participants. Benefits under the U.K. Plan were based on the employees’ years of service and compensation. Most of the beneficiaries of this plan are no longer employed by the Company. The Company follows a pension funding policy based on widely used actuarial methods as permitted by regulatory authorities. The funded amounts reflect actuarial assumptions regarding compensation, interest and other projections. The assets of the U.K. Plan consist primarily of equity, real estate and fixed income securities of U.K. and foreign issuers.
Pension and other benefit costs reflected in the consolidated statements of operations are based on the projected benefit method of valuation. Within the consolidated balance sheets, pension plan benefit liabilities are included in accrued compensation and benefits. In 2006, the Company adopted SFAS 158 “Employer’s Accounting for Defined Benefit Pension and Other Postretirement Plans”. This adoption had minimal impact on the accounting for the U.K. Plan as the Company’s prior year underfunded status was recognized as a liability with changes recorded to other comprehensive income. The Company used measurement dates of December 31, for 2008, 2007 and 2006.
The net periodic benefit cost for the U.K. Plan was determined as follows:
| 2008 | 2007 | 2006 | ||||||||||
| (In thousands) | ||||||||||||
| Service cost |
$ | — | $ | — | $ | — | ||||||
| Interest cost |
1,609 | 1,637 | 1,557 | |||||||||
| Premiums and expenses |
— | — | 84 | |||||||||
| Expected return on plan assets |
(1,814 | ) | (1,800 | ) | (1,295 | ) | ||||||
| Recognized losses |
90 | 293 | 472 | |||||||||
| Net Periodic Benefit Cost |
$ | (115 | ) | $ | 130 | $ | 818 | |||||
The assumptions used to determine the net periodic benefit cost for the U.K. Plan were as follows:
| 2008 | 2007 | 2006 | |||||||
| Weighted-average discount rate |
5.8 | % | 5.1 | % | 4.9 | % | |||
| Weighted-average rate of compensation increase |
— | — | — | ||||||
| Weighted-average long-term rate of return on plan assets |
7.3 | % | 7.3 | % | 6.4 | % |
The assumptions used to determine the accrued pension benefits (obligations) for the U.K. Plan were as follows:
| 2008 | 2007 | |||||
| Weighted-average discount rate |
6.0 | % | 5.8 | % | ||
| Weighted-average rate of compensation increase |
— | — | ||||
| Rate of inflation |
3.1 | % | 3.4 | % | ||
| Weighted-average long-term rate of return on plan assets |
6.7 | % | 7.3 | % |
The key assumptions used to determine the pension accounting liabilities with respect to the U.K. Plan are the discount rate and the assumed rate of retail price inflation. As of December 31, 2008, the assumed discount rate was 6.0% and the assumed rate of retail price inflation was 3.1%.
Historically the discount rate has been set at the yield on the iBoxx Sterling Corporate Bond Index for AA rated stocks with a term greater than 15 years (the “Index”), that is with redemption dates more than 15 years in the future. The yield on the Index at December 31, 2008 was 6.7% compared to 7.3% as of December 31, 2007. Further, as of December 31, 2007, the yields on corporate bonds did not vary as significantly with the term of the bond as they did as of December 31, 2008.
108
Table of Contents
During 2008, the credit crunch resulted in the yields on corporate bonds (particularly in the financial sector) being pushed up to historically high levels when compared with the yields on fixed-interest gilts. For example, at December 31, 2007, the difference between the yield available on the Index and the 15 year U.K. government bond yield was 1.25%. As of December 31, 2008, this difference stood at just under 3.0%.
Many of the issuers of corporate bonds, particularly of shorter durations, are financial institutions, who have been hit very hard by the credit crisis. Over the year, there has been an increase in corporate bond yields at shorter durations, with less change at the longer durations, resulting in a downward sloping yield curve. Furthermore, as different companies have varying exposure to the credit crisis, there is a very wide spread in yields. As a result, the following were taken in account when setting the discount rate: the range of yields has increased significantly so that at any particular duration there is a wide range of yields on individual bonds; and, the yield on corporate bonds varies significantly with duration. In view of these factors, the discount rate was determined by reference to: extrapolating the yields available on corporate bonds; the yields available on interest rate swaps; and, the yields available on other fixed interest or index linked bonds.
The liabilities were determined by adjusting the value of the plan liabilities as of December 31, 2007 and 2008 rather than undertaking a full valuation. A full actuarial valuation may have led to results that would be different from the approximate roll forward method. However, any differences in the calculations compared with those of a full valuation are not expected to be material and will emerge as an actuarial gain or loss in future years. The estimates are based on actuarially computed best estimates of pension asset long-term rates of return and long-term rate of obligation escalation. Variances between these estimates and actual experience are amortized over the employees’ average remaining service life.
The actuarial present value of the pension benefit obligation; the net assets available to provide for these benefits, at market value; and the funded status of the plan were as follows:
| 2008 | 2007 | |||||||
| (In thousands) | ||||||||
| Change in benefit obligation: |
||||||||
| Projected benefit obligation at beginning of year |
$ | 30,340 | $ | 31,639 | ||||
| Interest cost |
1,609 | 1,637 | ||||||
| Actuarial changes in assumptions and experience |
(2,792 | ) | (2,794 | ) | ||||
| Benefits paid |
(591 | ) | (457 | ) | ||||
| Foreign currency exchange rate changes |
(7,747 | ) | 315 | |||||
| Projected benefit obligation at end of year |
$ | 20,819 | $ | 30,340 | ||||
| Accumulated benefit obligation |
$ | 20,819 | $ | 30,340 | ||||
| Change in plan assets: |
||||||||
| Fair value of plan assets at beginning of year |
$ | 26,778 | $ | 23,679 | ||||
| Actual return on plan assets |
(2,003 | ) | 1,986 | |||||
| Employer contributions |
643 | 1,383 | ||||||
| Benefits paid |
(591 | ) | (457 | ) | ||||
| Foreign currency exchange rate changes |
(6,758 | ) | 187 | |||||
| Other |
— | — | ||||||
| Fair value of plan assets at end of year |
$ | 18,069 | $ | 26,778 | ||||
| Funding status at end of year |
$ | (2,750 | ) | $ | (3,562 | ) | ||
| Net Amounts Recognized in the Financial Statements: |
||||||||
| Unrecognized actuarial loss reported within long term liabilities and accumulated other comprehensive loss |
$ | (2,750 | ) | $ | (3,562 | ) | ||
| Accrued pension liability |
2,750 | 3,562 | ||||||
| Amounts included in other accumulated comprehensive income not yet recognized in periodic pension cost |
(736 | ) | 3,234 | |||||
| Amounts expected to be amortized from accumulated comprehensive income into net periodic pension costs over the next fiscal year consists of net actuarial gain or loss |
134 | 104 | ||||||
109
Table of Contents
The measurement dates are December 31, 2008 and December 31, 2007. The impact of the adoption of the measurement date provision of SFAS 158 was not material.
The U.K. Plan’s asset allocations at December 31, 2008 and 2007 were as follows:
| 2008 | 2007 | |||||
| Asset Category: |
||||||
| Equity securities |
73 | % | 63 | % | ||
| Debt securities |
6 | 13 | ||||
| Real estate |
20 | 20 | ||||
| Other |
1 | 4 | ||||
| Total |
100 | % | 100 | % | ||
The investment policy of the plan is to diversify globally across major investment categories. The Company has assumed that the overall return on bonds will be 4.6% per year. Equities and real estate are assumed to outperform U.K. government bonds by 3.25%, and cash will produce a return in line with the Bank of England Base Rate, which was 2.0% as of December 31, 2008. Based on these assumptions and on the asset distribution, the expected rate of return on assets at December 31, 2008 is 7.3%.
The following table reflects the total expected benefit payments to the U.K. Plan participants. These payments have been estimated based on the same assumptions used to measure the Company’s benefit obligation at year end (in thousands):
| 2009 |
$ | 404 | |
| 2010 |
372 | ||
| 2011 |
564 | ||
| 2012 |
430 | ||
| 2013 |
454 | ||
| Thereafter |
4,414 |
The Company anticipates the total expected contribution to the U.K. Plan in 2009 to be $0.6 million. It is the Company’s practice to fund the U.K. Plan sufficient to meet the benefits while also allowing for future U.K. price inflation. The Company also funds the plan to meet the minimum required by U.K. laws.
Japan Defined Benefit Pension Plan
The Company maintains a tax qualified pension plan in Japan that covers substantially all Japanese employees. The Company deposits funds in various fiduciary-type arrangements and/or purchases annuities. Benefits are based on years of service and the employee’s compensation at retirement. Employees with less than twenty years of service to the Company receive a lump sum benefit payout. Employees with twenty or more years of service to the Company receive a benefit that is guaranteed for a certain number of years. Participants may, under certain circumstances, receive a benefit upon termination of employment.
The assumptions that are used to value the costs and obligations of the plan reflect the Japanese economic environment. The Company continues to fund the plan sufficient to meet current benefits as well as fund a portion of future benefits as permitted by regulatory authorities. An actuarial valuation of the plan was conducted as of December 31, 2008, 2007 and 2006.
110
Table of Contents
The net periodic benefit cost for the defined benefit pension plan was determined as follows:
| 2008 | 2007 | 2006 | ||||||||||
| (In thousands) | ||||||||||||
| Service cost |
$ | 214 | $ | 162 | $ | 165 | ||||||
| Interest cost |
26 | 22 | 29 | |||||||||
| Expected return on plan assets |
(5 | ) | (3 | ) | (4 | ) | ||||||
| Recognized losses |
— | — | — | |||||||||
| Gain due to settlement |
— | — | (52 | ) | ||||||||
| Amortization of the unrecognized transaction obligation or asset |
72 | 57 | 64 | |||||||||
| Net periodic benefit cost |
$ | 307 | $ | 238 | $ | 202 | ||||||
The assumptions used to determine the net periodic benefit cost were as follows:
| 2008 | 2007 | 2006 | |||||||
| Weighted-average discount rate |
1.7 | % | 1.9 | % | 2.0 | % | |||
| Weighted-average rate of compensation increase |
3.0 | % | 3.0 | % | 3.6 | % | |||
| Weighted-average long-term rate of return on plan assets |
0.8 | % | 0.8 | % | 0.8 | % |
The assumptions used to determine the accrued pension benefit obligations were as follows:
| 2008 | 2007 | |||||
| Weighted-average discount rate |
1.6 | % | 1.7 | % | ||
| Weighted-average rate of compensation increase |
3.0 | % | 3.0 | % | ||
| Weighted-average long-term rate of return on plan assets |
0.8 | % | 0.8 | % |
The estimates are based on actuarially computed best estimates of pension asset long-term rates of return and long-term rate of obligation escalation. Variances between these estimates and actual experience are amortized over the employees’ average remaining service life.
111
Table of Contents
The most recent actuarial valuation of the plan was performed as of December 31, 2008. This valuation includes the actuarial present value of the pension benefit obligation. The net assets available to provide for these benefits, at market value; and the funded status of the plan were as follows (in thousands):
| 2008 | 2007 | |||||||
| Change in benefit obligation: |
||||||||
| Projected benefit obligation at beginning of year |
$ | 1,490 | $ | 1,194 | ||||
| Service cost |
214 | 162 | ||||||
| Interest cost |
26 | 22 | ||||||
| Actuarial changes in assumptions and experience |
92 | 54 | ||||||
| Benefits paid |
(91 | ) | (19 | ) | ||||
| Foreign currency exchange rate changes |
381 | 77 | ||||||
| Projected benefit obligation at end of year |
$ | 2,112 | $ | 1,490 | ||||
| Accumulated benefit obligation |
$ | 1,678 | $ | 1,174 | ||||
| Change in plan assets: |
||||||||
| Fair value of plan assets at beginning of year |
$ | 551 | $ | 337 | ||||
| Actual return on plan assets |
(1 | ) | — | |||||
| Employer contributions |
229 | 203 | ||||||
| Benefits paid |
(91 | ) | (19 | ) | ||||
| Foreign currency exchange rate changes |
148 | 30 | ||||||
| Fair value of plan assets at end of year |
$ | 836 | $ | 551 | ||||
| Funding status at end of year |
$ | (1,276 | ) | $ | (939 | ) | ||
| Net Amounts Recognized in the Financial Statements: |
||||||||
| Unrecognized actuarial gains |
$ | — | $ | — | ||||
| Unamortized amount |
— | — | ||||||
| Net accrued pension liability recognized |
$ | 1,276 | $ | 939 | ||||
| Amount recognized in the financial statements consists of: |
||||||||
| Accrued compensation and benefits |
$ | 1,276 | $ | 939 | ||||
| Intangible asset |
— | — | ||||||
| Accrued benefit liability |
$ | 1,276 | $ | 939 | ||||
| Accumulated other comprehensive income |
(794 | ) | (620 | ) | ||||
| Amounts included in other accumulated comprehensive income not yet recognized in periodic pension cost |
794 | 620 | ||||||
| Amounts expected to be amortized from accumulated comprehensive income into net periodic pension costs over the next fiscal year consists of: |
||||||||
| Net actuarial (gain) |
$ | — | $ | — | ||||
| Net transition obligation |
82 | 63 | ||||||
The Company’s pension plan asset allocations at December 31, 2008 and 2007 were as follows:
| 2008 | 2007 | |||||
| Asset Category: |
||||||
| Equity securities |
— | % | — | % | ||
| Debt securities |
— | — | ||||
| Real estate |
— | — | ||||
| Insurance contracts |
100.0 | 100.0 | ||||
| Total |
100.0 | % | 100.0 | % | ||
The following table reflects the total expected benefit payments to plan participants. These payments have been estimated based on the same assumptions used to measure the Company’s benefit obligation at year end (in thousands):
| 2009 |
$ | 131 | |
| 2010 |
217 | ||
| 2011 |
149 | ||
| 2012 |
159 | ||
| 2013 |
168 | ||
| Thereafter |
1,232 |
112
Table of Contents
The Company anticipates that contributions to the plan in 2009 will be $259,000. The plans investment strategy is low risk with preservation of principal as the primary objective. Plan assets are held in insurance related investments. There was no significant change in the investment strategy of this plan during 2008, 2007 or 2006.
Defined Contribution Plans
The Company has defined contribution employee savings plans in the United Kingdom, the United States and Canada. In the United Kingdom the Company offers a retirement savings plan. The United States employees can make contributions to a 401(k) plan. The Company matches the contributions of participating employees on the basis of percentages specified in each plan. Company matching contributions to the plans were $3.7 million, $4.0 million and $3.7 million in 2008, 2007 and 2006, respectively.
12. Income Taxes
The Company recorded a tax benefit of $39.0 million during the 2008 fiscal year. The effective tax rate for 2008 was (15.5%) of income before taxes, compared to an effective tax rate of 33.8% of income before taxes for 2007. The Company is incorporated in Canada and therefore uses the Canadian statutory rate. The Company’s tax rate in 2008 differs from the Canadian statutory rate of 29.5% due to a $47.0 million charge for unfavorable permanent differences of which $43.0 million relates to non-deductible amortization and $4.3 million to in-process R&D, $1.8 million related to Canadian deferred items, a $0.4 million charge for non-U.S. withholding taxes, a $1.1 million increase in the Company’s liability for uncertain tax positions, $0.5 million increase in valuation allowance in the U.S., and a $1.6 million increase in valuation allowance due to restatement and impairment in the U.K. The aforementioned charges were partially offset by benefits derived from $0.2 million benefit from R&D tax credits, $0.5 million decrease in valuation allowances in Hong Kong, $1.7 million related to the release of valuation allowances in Canada due to the utilization of net operating losses against the current year income in Canada and $13.9 million benefit due to international rate differences.
| 2008 | 2007 | 2006 | ||||||||||
| (In thousands) | ||||||||||||
| Income (loss) from continuing operations before income taxes: |
||||||||||||
| Canadian |
$ | 4,664 | $ | 6,947 | $ | 4,987 | ||||||
| U.S. |
(252,754 | ) | 7,001 | 2,185 | ||||||||
| Other |
(3,791 | ) | 8,223 | 2,598 | ||||||||
| Total |
$ | (251,881 | ) | $ | 22,171 | $ | 9,770 | |||||
| Details of the income tax provision (benefit) are as follows: |
||||||||||||
| 2008 | 2007 | 2006 | ||||||||||
| Current |
||||||||||||
| Canadian |
$ | 388 | $ | 850 | $ | 770 | ||||||
| U.S. |
(5,518 | ) | 3,448 | (7,312 | ) | |||||||
| Other |
837 | 988 | 3,512 | |||||||||
| (4,293 | ) | 5,286 | (3,030 | ) | ||||||||
| Deferred |
||||||||||||
| Canadian |
1,332 | 608 | (2,235 | ) | ||||||||
| U.S. |
(36,151 | ) | (783 | ) | 5,115 | |||||||
| Other |
80 | 2,373 | 3,064 | |||||||||
| (34,739 | ) | 2,198 | 5,944 | |||||||||
| Income tax provision (benefit) |
$ | (39,032 | ) | $ | 7,484 | $ | 2,914 | |||||
113
Table of Contents
The reconciliation of the statutory Canadian income tax rate related to income from continuing operations before income taxes to the effective rate is as follows:
| 2008 | 2007 | 2006 | ||||||||||
| (In thousands, except percentages) | ||||||||||||
| Reconciliation of effective tax rate in the statement of operations |
||||||||||||
| Expected Canadian tax rate |
29.5 | % | 32.1 | % | 36.1 | % | ||||||
| Expected income tax provision (benefit) |
$ | (74,305 | ) | $ | 7,124 | $ | 3,530 | |||||
| Permanent differences |
47,004 | (165 | ) | (1,217 | ) | |||||||
| International tax rate differences |
(13,776 | ) | (163 | ) | (337 | ) | ||||||
| Change in valuation allowance |
(23 | ) | 358 | (4,863 | ) | |||||||
| Provision to Return |
1,927 | (939 | ) | 4,143 | ||||||||
| Extraterritorial income exclusion |
— | (689 | ) | (2,432 | ) | |||||||
| Contingencies |
1,165 | 910 | 2,858 | |||||||||
| Tax credits |
(244 | ) | (322 | ) | 13 | |||||||
| State income tax net |
(1,647 | ) | (255 | ) | 396 | |||||||
| Withholding tax |
388 | 850 | 770 | |||||||||
| Amended Returns and prior filings |
363 | — | — | |||||||||
| Other |
116 | 775 | 53 | |||||||||
| Reported income tax provision (benefit) |
$ | (39,032 | ) | $ | 7,484 | $ | 2,914 | |||||
| Effective tax rate (benefit) |
(15.5 | )% | 33.8 | % | 29.8 | % | ||||||
Judgment is required in determining the Company’s worldwide income tax expense provision. In the ordinary course of global business, there are many transactions and calculations where the ultimate tax outcome is uncertain. Although the Company believes its estimates are reasonable, no assurance can be given that the final tax outcome of these matters will not be different from that which is reflected in its historical income tax provisions and accruals. Such differences could have a material impact on its income tax provision and operating results in the period in which such determination is made.
Deferred income taxes result principally from temporary differences in the recognition of certain revenue and expense items and operating loss carryforwards for financial and tax reporting purposes. Significant components of the Company’s deferred tax assets and liabilities as of December 31, 2008 and 2007 are as follows:
| 2008 | 2007 | |||||||
| (In thousands) | ||||||||
| Deferred tax assets |
||||||||
| Operating tax loss carryforwards |
$ | 13,597 | $ | 16,385 | ||||
| Compensation related deductions |
3,674 | 4,590 | ||||||
| Tax credits |
4,327 | 3,163 | ||||||
| Restructuring accrued liabilities |
4,110 | 2,656 | ||||||
| Deferred revenue |
6,384 | 5,456 | ||||||
| Inventory |
5,296 | 2,970 | ||||||
| Depreciation |
193 | 1,316 | ||||||
| Amortization |
6,519 | 1,839 | ||||||
| Original Issue Discount |
1,577 | — | ||||||
| Total deferred tax assets |
45,677 | 38,375 | ||||||
| Valuation allowance for deferred tax assets |
(10,769 | ) | (13,245 | ) | ||||
| Net deferred income tax assets |
$ | 34,908 | $ | 25,130 | ||||
| Deferred tax liabilities |
||||||||
| Depreciation |
$ | (4,868 | ) | $ | (1,066 | ) | ||
| Amortization |
(25,068 | ) | (9,344 | ) | ||||
| Prepaids and other |
(681 | ) | — | |||||
| Total deferred tax liabilities |
$ | (30,617 | ) | $ | (10,410 | ) | ||
| Allocated as follows: |
||||||||
| Net deferred income tax assets—short-term |
$ | 11,106 | 8,541 | |||||
| Net deferred income tax liabilities—short-term |
(486 | ) | (286 | ) | ||||
| Net deferred income tax assets—long-term |
23,802 | 16,589 | ||||||
| Net deferred income tax liabilities—long-term |
(30,131 | ) | (10,124 | ) | ||||
| Net deferred income tax assets |
$ | 4,291 | $ | 14,720 | ||||
114
Table of Contents
In determining its fiscal 2008, 2007, and 2006 tax provisions under SFAS 109, “Accounting for Income Taxes”, management determined the deferred tax assets and liabilities for each separate tax entity. Management then considered a number of factors, including the positive and negative evidence regarding the realization of its deferred tax assets to determine whether a valuation allowance should be recognized with respect to its deferred assets. In accordance with SFAS 109, the Company has recorded valuation allowances to reduce its deferred tax assets to the amount that is more likely than not to be realized. The Company has considered future market growth, forecasted earnings, future taxable income, the mix of earnings in the jurisdictions in which the Company operates, and prudent and feasible tax planning strategies in determining the need for valuation allowances. The Company will continue to evaluate its deferred tax position on a quarterly basis and will record any increase or decrease to the amount currently reflected as appropriate in the period of change in evaluation.
The Company has provided valuation allowances in the amount of $10.8 million and $13.2 million at December 31, 2008 and December 31, 2007, respectively. The change in valuation allowance is due to activities in numerous jurisdictions. In both the United States and the United Kingdom, the valuation allowances were increased as the Company determined that it is more likely than not that it will not realize its certain deferred tax assets. In Canada, the valuation allowance was decreased due to the utilization of the net operating losses against the current year income in Canada.
At December 31, 2008, the Company had loss carryforwards of $9.4 million (tax effected) available to reduce future years’ income for tax purposes. Of this amount, approximately $1.5 million relates to the United States and expires between 2009 and 2023, $3.1 million relates to Canada, of which $3.0 million expires between 2009 and 2010, and $0.1 million can be carried forward indefinitely, $3.7 million relates to the United Kingdom and can be carried forward indefinitely, and $0.5 million relates to Germany which can be carried forward indefinitely and $0.1 million in Japan and $0.4 million in France. At December 31, 2008, the Company had a section 163(j) carryforward of $4.2 million (tax effected) available to reduce future years’ income for tax purposes.
At December 31, 2008, the Company had tax credits of approximately $4.3 million available to reduce future years’ income for tax purposes. Of this amount, approximately $1.6 million relates to the United States and expires between 2016 and 2023 and $2.7 million relates to Canada of which $1.4 million expires between 2010 and 2013 and, $1.3 million can be carried forward indefinitely.
Income taxes paid during 2008 and 2007 were $1.3 and $11.7 million, respectively.
Undistributed earnings of the Company’s non-Canadian subsidiaries amounted to approximately $81.0 million as of December 31, 2008. The Company has not provided any additional federal or state income taxes or foreign withholding taxes on the undistributed earnings as such earnings have been indefinitely reinvested in the business as defined in the provisions of SFAS 109 as well as APB 23 “Accounting for Income Taxes – Special Areas”. The determination of the amount of the unrecognized deferred tax liability related to the undistributed earnings is not practicable because of the complexities associated with its hypothetical calculation.
In July 2006, the FASB issued FIN 48, “Accounting for Uncertainty in Income Taxes—An Interpretation of FASB Statement No. 109.” FIN 48 clarifies the accounting for uncertainty in income taxes recognized in an enterprise’s financial statements in accordance with SFAS 109. FIN 48 also prescribes a recognition threshold and measurement attribute for the financial statement recognition and measurement of a tax position taken or expected to be taken in a tax return and provides guidance on de-recognition, classification, interest and penalties, and accounting in interim periods, disclosure, and transition. FIN 48 is effective for fiscal years beginning after December 31, 2006.
115
Table of Contents
In addition, in May 2007, the FASB issued FIN 48-1, “Definition of Settlement in FASB Interpretation No. 48” to amend FIN 48 by providing that previously unrecognized tax benefits can be recognized when the tax positions are effectively settled upon examination by a taxing authority. According to FIN 48-1, an enterprise’s tax position will be considered effectively settled if the taxing authority has completed its examination, the enterprise does not plan to appeal, and the possibility is remote that the taxing authority would reexamine the tax position in the future. The Company believes that it has appropriately accounted for the effect of FIN 48-1 in its financial statements.
The Company adopted the provisions of FIN 48 on January 1, 2007. The provisions of FIN 48 are to be applied to all tax positions upon initial adoption of this standard. Only tax positions that meet the more-likely-than-not recognition threshold at the effective date may be recognized or continue to be recognized upon adoption of FIN 48. On January 1, 2007, the Company recorded the cumulative effect of applying the provisions of FIN 48, which resulted in the recording of a $0.1 million increase to the opening balance of the Company’s retained earnings.
As of the date of adoption, the total amount of unrecognized tax benefits totaled approximately $2.4 million, of which $2.4 million, if recognized, would favorably affect its effective tax rate in any future period. As of December 31, 2007 the total amount of unrecognized tax benefits increased to $3.5 million. As of December 31, 2008, the amount of unrecognized tax benefits totaled approximately $5.2 million, of which $5.2 million, if recognized would favorably affect its effective tax rate. Given the uncertainty regarding when the authorities will complete their examinations and the possible outcomes of their examinations, a current estimate of the range of reasonably possible significant increases or decreases in income tax that may occur within the next twelve months cannot be made. However, the Company expects that the changes in the unrecognized benefits within the next twelve months would not be material. In addition the Company has settled its Canadian audit after the balance sheet date and this settlement will have no significant effect on the Company’s uncertain tax positions.
The reconciliation of the total amounts of unrecognized tax benefits at the beginning and the end of 2008 and 2007 is as follows (in thousands):
| Balance at December 31, 2006 |
$ | 2,440 | ||
| Additions based on tax positions related to the current year |
1,751 | |||
| Additions for tax positions of prior years |
487 | |||
| Settlements |
(1,141 | ) | ||
| Balance at December 31, 2007 |
3,537 | |||
| Additions based on tax positions related to the current year |
819 | |||
| Additions for tax positions of prior years |
362 | |||
| Excel acquisition |
448 | |||
| Balance at December 31, 2008 |
$ | 5,166 | ||
The Company recognizes interest and penalties related to uncertain tax positions in income tax expense. As of December 31, 2008 and 2007, the Company had approximately $0.8 million and $0.3 million, respectively, of accrued interest and penalties related to uncertain tax positions.
The Company files income tax returns in the U.S. federal, states, and foreign jurisdictions. Generally, the Company is no longer subject to U.S. federal, state or local, or foreign income tax examinations by tax authorities for the years before 2002 as these years have been effectively settled as described in FIN 48-1. During 2007, the Company settled an audit with the Internal Revenue Service for tax years 1999 – 2002. Furthermore, the Company closed an audit with the Japanese tax authorities for tax years 2004 -2006 resulting in no adjustments. Currently, the Company is under audit in the United States for tax years 2004 and 2005 and in Canada for tax years 2002 – 2004. The Company’s income tax returns may be reviewed in the following countries and for the following periods under the appropriate statutes of limitations: United States (2005-present), Canada (2002-present), United Kingdom (2005-present), and Germany (2005-present).
In connection with the Chapter 11 Cases described in Note 1 of Notes to Consolidated Financial Statements, the IRS has filed amended proofs of claim aggregating approximately $7.7 million for amounts it claims the Company owes for 2002 through 2008. The IRS has provided no information to substantiate its claims. The Company believes the IRS claims are without merit and intends to vigorously object to them in Bankruptcy Court. Consequently, the Company believes no adjustment of its estimated tax liabiliity pursuant to FIN 48 is required.
116
Table of Contents
13. Restructuring and other
The following table summarizes restructuring and other expense in the consolidated statements of operations:
| Year Ended December 31, | ||||||||||
| 2008 | 2007 | 2006 | ||||||||
| (In thousands) | ||||||||||
| United Kingdom restructuring |
$ | 3,628 | $ | 6,713 | $ | — | ||||
| Munich restructuring |
187 | (58 | ) | — | ||||||
| Novi restructuring |
1,390 | — | — | |||||||
| Bedford restructuring |
3,338 | — | — | |||||||
| 8,543 | 6,655 | — | ||||||||
| Revenue Review costs |
1,942 | — | — | |||||||
| $ | 10,485 | $ | 6,655 | $ | — | |||||
United Kingdom Restructuring
In 2007, the Company implemented a plan to expand its manufacturing operations in China and restructure its manufacturing operations in the United Kingdom. These actions are part of the Precision Technology Segment’s overall plan to expand its presence in Asia and increase profitability. The restructuring expense in 2007 related to this plan was $6.7 million. The charge was composed of $2.6 million in employee termination benefits, $3.1 million in inventory write-offs, $0.7 million in direct costs associated with the manufacturing transition to China, and $0.3 million related to facility consolidations. The inventory write-offs were charged to restructuring and other charges as they related to discontinued product offerings, and not recurring activities. These restructuring efforts were largely completed in 2007.
On February 29, 2008 and June 27, 2008, the Company executed agreements to sell assets related to its otherwise discontinued Impact product line, and certain assets related to its Laser Mark and Excimer laser product lines. The majority of the assets sold in the transaction represent inventory that had already been written off and were included as part of the restructuring charges recorded in 2007. The results of the sales resulted in a restructuring benefit of $0.3 million for the year ended December 31, 2008. Payments received on asset sales that are due beyond one year will be recorded as restructuring benefits when they are received.
In December 2008, the Company announced the transfer of all volume related manufacturing from its Rugby, U.K. facility, to the Company’s facilities in China and newly acquired Excel manufacturing sites. These activities have been completed in 2009, at a total cost of $5.0 million, which is composed of non-cash land and building impairment charges of $3.6 million, employee severance costs of $1.1 million, and facility related charges of $0.3 million. In December 2008, the Company recorded $3.9 million of this total to restructuring expense. It was composed of $3.6 million of non-cash land and building charges, and $0.3 million of employee severance costs. In addition to the amount recorded to restructuring and other expense, the Company recorded a charge of $0.6 million for inventory write-offs against cost of goods sold in 2008. The remaining portion of this restructuring activity has been recorded to restructuring and other expense in 2009. Additionally, in October 2009, the Company sold the Rugby, U.K. facility for proceeds of $3.6 million. The Company recorded a gain of $0.1 million on sale of the Rugby, U.K. facility in 2009.
Munich Restructuring
As a result of restructuring programs undertaken in 2000 through 2004, and the subsequent sublease of the Company’s Munich, Germany facility, in May 2007 through the end of its lease term, the Company historically carried a $1.1 million accrual for the cost of this lease. The Company regularly reviews its assumptions with respect to this excess space, including contractual lease payments and proceeds from the sublease. Following this review, the Company has booked adjustments to the lease restructuring in each of 2008 and 2007, and as of December 31, 2008, cumulative expense related to this restructuring program is $2.8 million. The remaining accrual will be paid ratably over the remaining term of the lease, which expires in January 2013.
Novi Restructuring
In the second quarter of 2008, the Company implemented a plan to close its Novi, Michigan facility, which provided U.S. sales, applications and service support to a product line included in the Company’s Precision Technology Segment. The Novi facility was consolidated within the Company’s Bedford, MA facility. In connection with this action, the Company
117
Table of Contents
recorded a restructuring charge of $1.4 million, consisting of $0.7 million for employee severance and $0.7 million in lease abandonment and related costs. The majority of these employee severance payments were made in 2008, and the remaining amounts have been paid in 2009. The lease costs are being paid ratably over the duration of the lease, which ends in 2012.
Bedford Restructuring
In September 2008, the Company consolidated its operations and facilities in Massachusetts to a new facility in Bedford, Massachusetts. At that time, the Company implemented a plan to reduce its United States workforce by approximately 50 people and took a restructuring charge in the third quarter of 2008 of $3.0 million for severance costs. $1.2 million of this amount was charged to the Semiconductor Systems Segment; $0.7 million was charged to the Precision Technology Segment; and $1.1 million was charged against corporate operations. The workforce reduction is expected to save the Company $6.8 million in annual salary and related costs. In December 2008, in connection with its consolidation of the historic Scanner business with the newly acquired Scanner business of Excel, Cambridge Technology, the Company recorded a restructuring charge of $0.3 million relating to employee severance costs. The $0.3 million restructuring charge was charged to the Precision Technology Segment. The majority of these employee severance payments were made in 2008, and the remaining amount have been paid in 2009.
Other Charges – Revenue Review Costs
The costs incurred to third parties, including attorneys, forensic accountants, and other advisors that related to the Company’s Revenue Review have been included in the Company’s 2008 restructuring and other charges. These costs are charged to expense as incurred. In 2008, these costs were $1.9 million. The Revenue Review costs, including costs relating to the restatement of historic financial statements, has continued for periods subsequent to 2008, and will be included in future ‘restructuring and other’ charges.
Rollforward of Accrued Expenses related to Restructuring and Other
The following table summarizes the aggregate balance of the activity relating to the Company’s restructuring and other charges recorded on the accompanying consolidated balance sheets (in thousands):
| Balance at December 31, 2005 |
$ | 1,502 | ||
| Restructuring charges (benefits), net |
— | |||
| Cash payments |
(165 | ) | ||
| Balance at December 31, 2006 |
1,337 | |||
| Restructuring charges (benefits), net |
6,655 | |||
| Cash payments |
(3,249 | ) | ||
| Non-cash write-offs or other adjustments |
(3,401 | ) | ||
| Balance at December 31, 2007 |
1,342 | |||
| Restructuring charges (benefits), net |
10,485 | |||
| Cash payments |
(4,223 | ) | ||
| Non-cash write-offs or other adjustments |
(3,563 | ) | ||
| Balance at December 31, 2008 |
$ | 4,041 | ||
As of December 31, 2008 and 2007, $1.1 million and $1.0 million, respectively, of accrued restructuring charges were included in long-term liabilities; the current portion is included in accrued expenses (see Note 7 of Notes to Consolidated Financial Statements).
14. Commitments and Contingencies
Operating leases
The Company leases certain equipment and facilities under operating lease agreements. Most of these lease agreements expire between 2009 and 2020. In the United Kingdom, where longer lease terms are more common, the Company has land leases that extend through 2078. Under the terms of the facility leases, the Company is responsible to pay real estate taxes and other operating costs. In connection with its acquisition of Excel in 2008, the Company assumed fourteen new facility leases used in manufacturing, research and development, sales and administration. The rent on certain leases is subject to escalation clauses in future years.
118
Table of Contents
In 2007, the Company signed a 12-year lease for a 147,000 square foot facility in Bedford, Massachusetts. The terms of the lease provide the Company with two renewal options for periods of five years each. The Company consolidated its Natick, Massachusetts, Billerica, Massachusetts and Wilmington, Massachusetts operations into this facility. The consolidation was completed in the second quarter of 2008. Under the terms of the lease agreement, the landlord waived the first 5.5 months rent (representing a savings of $0.7 million). This savings is being amortized as a reduction to rent expense over the life of the lease, and is included in other liabilities. The Company incurred the $14.3 million in expenditures to fit-up and occupy the Bedford facility, of which the landlord provided $4.0 million in allowances. The landlord allowance has been included in the Company’s accompanying consolidated balance sheets in property, plant and equipment, and in other liabilities. The property, plant and equipment balance being amortized to depreciation expense ratably over this life of the lease, and the landlord allowance is being offset as a reduction to rent expense, ratably over the life of the lease.
In February 2010, the Company entered into an Amended Lease Agreement with 125 Middlesex Turnpike, LLC to reduce the term of its current lease at 125 Middlesex Turnpike, Bedford, Massachusetts from 12 years (of which approximately 10 years were remaining) to 3 years from the new effective date of March 12, 2010. The rental payment will continue at $0.1 million per month.
For the years ended December 31, 2008, 2007 and 2006 lease expense was $4.8 million, $4.9 million and $4.4 million, respectively. Future minimum lease payments under operating leases expiring subsequent to December 31, 2008 are (in thousands):
| 2009 |
$ | 5,440 | |
| 2010 |
4,850 | ||
| 2011 |
4,135 | ||
| 2012 |
3,625 | ||
| 2013 |
1,534 | ||
| Thereafter |
9,409 | ||
| Total minimum lease payments |
$ | 28,993 | |
The Company has sublease agreements on its Novi, Michigan, Munich, Germany and Rugby, U.K. facilities and expects that it will receive aggregate proceeds of $0.7 million from 2009 to 2013 in connection with these agreements. The payments presented in the table above do not include assumptions relative to the receipt of these sub-lease payments.
Purchase Commitments
As of December 31, 2008, the Company had purchase commitments for inventory and services of $11.2 million. These purchase commitment are expected to be incurred as follows: $9.2 million in 2009 and $2.0 million in 2010.
Deferred Compensation
As of December 31, 2008 and 2007, the Company had deferred compensation due to certain officers and employees of $0.7 million. Certain officers and employees have deferred payment of a portion of their compensation until termination of employment or later. Interest on the outstanding balance is credited quarterly, based on prime rate, which averaged 5.1%, 8.0% and 8.0% during the years ended December 31, 2008, 2007 and 2006, respectively. The portion of deferred compensation estimated to be due within one year is included in accrued compensation and benefits.
Legal proceedings and disputes
The Company’s French subsidiary, GSI Lumonics SARL (“Lumonics”), is subject to a claim by a customer, SCGI, that a Laserdyne 890 system delivered in 1999 had unresolved technical problems. During the third quarter of 2005, GSI France, parent of Lumonics, filed for bankruptcy protection, which was granted by the French court on July 7, 2005. On April 18, 2006, the court fixed SCGI’s claim against Lumonics at 598,079 Euros, plus court costs and expert fees of 85,945 Euros. SCGI accepted the court’s determination. SCGI is now demanding that the Liquidator bring an action in the United Kingdom against GSI Group Ltd., the parent corporation of GSI France. The Company is not aware of any facts to support a claim. The Company’s French counsel is addressing these points directly with the Liquidator. At this time, the Company does not believe it will be required to make any payments regarding this action. Accordingly, nothing has been accrued in the Company’s accompanying consolidated financial statements.
119
Table of Contents
On August 6, 2008, a purported stockholder of Excel Technology, Inc., a subsidiary of the Company, filed a complaint seeking certification of a class action lawsuit in the Supreme Court of the State of New York, County of New York, docketed as Joseph Choquette, v. Antoine Dominic, Steven Georgiev, Donald E. Weeden, Ira J. Lamel, J. Donald Hill and Excel Technology, Inc., Index No. 08/602294 (the “Choquette Action”) against Excel and each of its directors. The Choquette Action purports to be brought individually and on behalf of all public stockholders of Excel. The Choquette Action alleges that Excel’s director defendants breached their fiduciary duties to Excel’s stockholders in connection with the proposed tender offer by the Company and that each of the defendants aided and abetted such alleged breach of Excel’s director defendants’ fiduciary duties. Based on these allegations, the Choquette Action seeks, among other relief, an order declaring the action to be a class action, enjoining preliminarily and permanently the tender offer and the merger with the Company, rescinding, to the extent already implemented, the tender offer and the merger with the Company or any of the terms thereof or awarding rescissory damages, directing that the defendants account to plaintiff and other members of the class for all damages caused by them and account for all profits and any special benefits obtained as a result of a breach of their fiduciary duties to the purported stockholder and other members of the class, awarding plaintiff the costs of the Choquette Action including a reasonable allowance for the expenses of plaintiff’s attorneys and experts and granting plaintiff and other members of the class such further relief as the court deems just and proper. On August 14, 2008, Excel and the individual defendants in the Choquette Action filed a motion to dismiss the lawsuit. On August 18, 2008, the plaintiff in the Choquette Action filed a motion seeking a preliminary injunction to enjoin consummation of the tender offer and to require Excel to issue additional and supplementary disclosures in Excel’s Schedule 14D-9 filing. On August 19, 2008, the court denied plaintiff’s motion for a preliminary injunction. On April 15, 2009, the court granted defendants’ motion to dismiss and entered judgment dismissing the complaint with prejudice.
On December 12, 2008, in connection with the delayed filing of its results for the quarter ended September 26, 2008, and the announcement of a review of revenue transactions, a putative shareholder class action alleging federal securities violations was filed in the United States District Court for the District of Massachusetts against us, a former officer and a current officer and director. Specifically, the complaint alleges that the Company and the individual defendants violated Sections 10(b) and 20(a) of the Securities Exchange Act of 1934 and Rule 10b-5 promulgated thereunder, and seeks recovery of damages in an unspecified amount. The action was brought on behalf of a putative class of shareholders who purchased the Company’s stock between April 30, 2008 and December 3, 2008. A lead plaintiff, Mason Tenders District Council Trust Funds, was appointed on May 8, 2009. On July 1, 2009, the Court ordered lead plaintiff to file a consolidated or amended complaint within 30 days of the Company’s filing of restatements for certain of its historical financial results with the SEC. During the last several months, the parties have been in settlement discussions and the parties have reached an agreement in principle to settle this lawsuit. The settlement would, in general, cover purchasers of the common stock of the Company between February 27, 2007 and June 30, 2009. The agreement in principle is subject to a number of contingencies including confirmatory discovery by the Lead Plaintiff, after which Lead Plaintiff may affirm or void the agreement in principle, preliminary and final approval by the District Court, and to the extent required by law, approval by the Bankruptcy Court. Although the agreement in principle is not final, the total settlement amount is well within the Company’s insurance policy limits; the Company’s contribution to the settlement amount would be limited to the balance of the company’s self-insured retention.
The Company is also subject to various legal proceedings and claims that arise in the ordinary course of business. The Company does not believe that the outcome of these claims will have a material adverse effect upon the Company’s financial conditions or results of operations but there can be no assurance that any such claims, or any similar claims, would not have a material adverse effect upon the Company’s financial condition or results of operations.
Chapter 11 Bankruptcy Filing
On November 20, 2009, the Debtors filed voluntary petitions for relief under Chapter 11 of the Bankruptcy Code in the United States Bankruptcy Court for Delaware, as discussed in Note 1 of Notes to Consolidated Financial Statements.
SEC Investigation
As discussed in the Explanatory Note to the Annual Report on Form 10-K, we have conducted a Revenue Review of certain of our historic revenue transactions. On May 14, 2009, we received a notice from the SEC indicating that the SEC is conducting a formal investigation relating to our historical accounting practices and the restatement of our historical consolidated financial statements. The Company is cooperating fully with the SEC’s investigation. The Company cannot predict the outcome of the investigation at this time.
120
Table of Contents
Issuance of Unregistered Securities
The Company inadvertently issued unregistered shares of common stock under its 2006 Plan as a result of its inadvertent failure to file with the SEC a registration statement on Form S-8. The 2006 Plan was approved by the Company’s shareholders in May 2006. From March 2007 through March 2010, the Company issued approximately 773,037 duly authorized common shares with a total fair market value at the date of issuance of approximately $3,889,796 to fifty-two employees and directors under its 2006 Plan. As a result, the Company may be subject to civil litigation, enforcement proceedings, fines, sanctions and/or penalties.
The Company may also be subject to claims by participants in the 2006 Plan for rescission of their acquisitions of common shares under the 2006 Plan under federal securities laws until the expiration of the applicable statute of limitations period, which is one year under federal law from the date of transaction. If applicable, such participants may have the right to rescind their purchases for an amount equal to the purchase price for the shares (or if the shares have been disposed of, claims for any damages with respect to any loss on such disposition) plus interest from the date of purchase. However, under applicable provisions of federal law (including section 510(b) of the Bankruptcy Code (11 U.S.C. § 510(b)), and in connection with our Chapter 11 Cases, if the Company’s proposed Plan is confirmed, the holders of any such damage claims and related rescission or other rights would, the Company believes, be entitled to receive a distribution under the Plan of common shares of the reorganized Company only. The Company believes that the most likely result is that any such claims, if allowed, would result in the holder receiving that quantity of common shares in the reorganized Company that are determined by a court to result in equal treatment of such claim holders and existing equity holders. Furthermore, rescission or damages claims of a shareholder who holds the above described unregistered shares, but receives new shares, as contemplated by the Plan, would be discharged upon the Company’s emergence from the bankruptcy proceedings. Such new shares would be issued pursuant to an exemption from registration under §1145 of the Bankruptcy Code and be freely tradable by holders who are not deemed to be underwriters. The Company cannot predict the outcome of this matter at this time and the effect it may have on the Company’s financial condition or results of operations.
Guarantees and Indemnifications
In the normal course of its operations, the Company executes agreements that provide for indemnification and guarantees to counterparties in transactions such as business dispositions, the sale of assets, sale of products and operating leases. Additionally, the by-laws of the Company require it to indemnify certain current or former directors, officers, and employees of the Company against expenses incurred by them in connection with each proceeding in which he or she is involved as a result of serving or having served in certain capacities. Indemnification is not available with respect to a proceeding as to which it has been adjudicated that the person did not act in good faith in the reasonable belief that the action was in the best interests of the Company. On June 5, 2009, the board of directors of the Company approved a form of indemnification agreement to be implemented by the Company with respect to its directors and officers. The form of indemnification agreement provides, among other things, that each director and officer of the Company who signs the indemnification agreement shall be indemnified to the fullest extent permitted by applicable law against all expenses, judgments, fines and amounts paid in settlement actually and reasonably incurred by such officer or director in connection with any proceeding by reason of his or her relationship with the Company. In addition, the form of indemnification agreement provides for the advancement of expenses incurred by such director or officer in connection with any proceeding covered by the indemnification agreement, subject to the conditions set forth therein and to the extent such advancement is not prohibited by law. The indemnification agreement also sets out the procedures for determining entitlement to indemnification, the requirements relating to notice and defense of claims for which indemnification is sought, the procedures for enforcement of indemnification rights, the limitations on and exclusions from indemnification, and the minimum levels of directors’ and officers’ liability insurance to be maintained by the Company.
Credit Risks and Other Uncertainties
The Company maintains financial instruments such as cash and cash equivalents, trade receivables and financial instruments used in hedging activities. From time to time, certain of these instruments may subject the Company to concentrations of credit risk whereby one institution may hold a significant portion of the cash and cash equivalents, or one customer may compose a large portion of the accounts receivable balances.
At December 31, 2007, there was a concentration of credit risk related to the Company’s position in trade accounts receivable. At that time, one customer, Rexchip Electronics Corporation, represented 21% of the outstanding accounts receivable. There was no such concentration of credit risk as of December 31, 2008. Credit risk with respect to trade accounts receivables is generally minimized because of the diversification of the Company’s operations, as well as its large customer base and its geographical dispersion.
The Company acquired certain auction rate securities in connection with its purchase of Excel. In current markets, the fair value of these auction rate securities is not able to be ascertained by observable inputs. See Note 3 of the Notes to Consolidated Financial Statements for further discussion.
121
Table of Contents
Certain of the components and materials included in the Company’s laser systems and optical products are currently obtained from single source suppliers. There can be no assurance that a disruption of this outside supply would not create substantial manufacturing delays and additional cost to the Company.
The Company’s operations involve a number of other risks and uncertainties including, but not limited to, the cyclicality of the semiconductor and electronics markets, the effects of general economics conditions, rapidly changing technology, and international operations.
15. Segment Information
As a result of the Company’s acquisition of Excel, it reassessed its segment reporting based on the operating and reporting structure of the combined company. The Company has concluded that the acquisition of Excel has resulted in the establishment of a third segment which is comprised solely of the operations of the newly acquired entity. The Company’s segments and their principal activities consist of the following:
Precision Technology
This segment’s products include technologies for precision motion, linear and rotary motion control, medical printers, lasers, electro-optical components and precision optics used in a broad range of commercial and semiconductor applications. These products are used in the electronics, aerospace, materials processing, data storage, imaging and other light industrial markets. The products are designed and manufactured at the Company’s facilities in the United States, Europe and Asia.
Semiconductor Systems
The Company’s Semiconductor Systems Segment’s products are designed and manufactured at its facility in the United States. Specific applications include laser repair to improve yields in the production of memory chips; laser marking systems for work-in-process management and traceability of silicon wafers; laser trimming of linear and mixed signal integrated circuits and chip resistors; and inspection of solder paste and component placement on printed circuit boards. The Semiconductor Systems Segment also derives significant revenues from parts and service to its installed base.
Excel
This segment’s products include lasers, electro-optical components, precision optics and photonics-based solutions primarily consisting of laser systems used in a broad range of commercial and scientific research applications. These products are used in the electronics, aerospace, materials processing, data storage, imaging and other light industrial markets. The products are designed and manufactured at the Company’s facilities in the United States and Europe.
Reportable Segment Financial Information
| Year Ended December 31, | ||||||||||||
| 2008 | 2007 | 2006 | ||||||||||
| (In thousands) | ||||||||||||
| (As Restated) | (As Restated) | |||||||||||
| Sales |
||||||||||||
| Precision Technology |
$ | 146,616 | $ | 184,509 | $ | 179,565 | ||||||
| Semiconductor Systems |
88,494 | 111,515 | 90,170 | |||||||||
| Excel |
55,612 | — | — | |||||||||
| Intersegment sales elimination |
(2,254 | ) | (4,943 | ) | (10,705 | ) | ||||||
| Total |
$ | 288,468 | $ | 291,081 | $ | 259,030 | ||||||
| Year Ended December 31, | ||||||||||||
| 2008 | 2007 | 2006 | ||||||||||
| (In thousands) | ||||||||||||
| (As Restated) | (As Restated) | |||||||||||
| Gross Profit |
||||||||||||
| Precision Technology |
$ | 49,092 | $ | 66,877 | $ | 68,224 | ||||||
| Semiconductor Systems |
27,523 | 45,958 | 34,198 | |||||||||
| Excel |
20,669 | — | — | |||||||||
| Intersegment sales elimination |
334 | 298 | (24 | ) | ||||||||
| Total |
$ | 97,618 | $ | 113,133 | $ | 102,398 | ||||||
122
Table of Contents
The Company reports operating expenses and its assets on a consolidated basis to the chief operating decision maker.
Geographic segment information
The Company attributes sales to geographic areas on the basis of the customer location where products are shipped. Sales to these customers are as follows (in thousands):
| Year Ended December 31, | ||||||||||||||||||
| 2008 | 2007 | 2006 | ||||||||||||||||
| Sales | % of Total | Sales | % of Total | Sales | % of Total | |||||||||||||
| (As Restated) | (As Restated) | |||||||||||||||||
| United States |
$ | 88,533 | 30.7 | % | $ | 79,229 | 27.2 | % | $ | 82,700 | 31.9 | % | ||||||
| Asia-Pacific |
62,008 | 21.5 | 100,562 | 34.5 | 81,907 | 31.6 | ||||||||||||
| Japan |
73,646 | 25.5 | 63,630 | 21.9 | 47,982 | 18.5 | ||||||||||||
| Europe |
59,653 | 20.7 | 47,014 | 16.2 | 45,142 | 17.5 | ||||||||||||
| Latin and South America, other |
4,628 | 1.6 | 646 | 0.2 | 1,299 | 0.5 | ||||||||||||
| Total |
$ | 288,468 | 100.0 | % | $ | 291,081 | 100.0 | % | $ | 259,030 | 100.0 | % | ||||||
Long-lived assets, which include property, plant and equipment, intangibles and goodwill, but excludes other assets, long-term investments and deferred tax assets, are attributed to geographic areas in which the Company’s assets are located. A summary of these long-lived assets is as follows (in thousands):
| As of December 31, | ||||||
| 2008 | 2007 | |||||
| (As Restated) | ||||||
| United States |
$ | 157,598 | $ | 52,969 | ||
| Europe |
7,842 | 27,017 | ||||
| Japan |
540 | 479 | ||||
| Asia-Pacific, other |
4,982 | 3,983 | ||||
| Total |
$ | 170,962 | $ | 84,448 | ||
Significant Customers
There was no individual customer in 2008, 2007 or 2006 that accounted for 10% or more of the Company’s sales. At December 31, 2008, no customer accounted for 10% or more of the Company’s accounts receivable balance. At December 31, 2007, there was one customer, Rexchip Electronics Corporation, which accounted for 21% of the Company’s accounts receivable balance.
16. Related Party Transactions
Richard B. Black, the Chairman of the Company, is also the President and Chief Executive Officer of ECRM, Inc., a company which manufactures laser systems equipment for the printing and publishing industry and which is a customer of the Company. All sales to ECRM, Inc. were made pursuant to the Company’s standard contract terms and conditions. The Nominating and Governance Committee of the Company’s Board of Directors has reviewed and confirmed that ECRM, Inc. received no favored commercial treatment.
123
Table of Contents
The Company recorded sales and raw material purchases from Sumitomo Heavy Industries Ltd., a significant shareholder. The amounts and terms of these transactions were equivalent to similar third-party transactions.
The following table summarizes related party transactions in the consolidated statements of operations (in thousands):
| Year Ended December 31, | |||||||||
| 2008 | 2007 | 2006 | |||||||
| Sales to ECRM, Inc. |
$ | 514 | $ | 711 | $ | 540 | |||
| Sales to Sumitomo Heavy Industries Ltd. |
3,329 | 3,573 | 5,626 | ||||||
| Purchases from Sumitomo Heavy Industries Ltd. |
108 | 108 | 320 | ||||||
The following table summarizes the related party transactions on the consolidated balance sheets (in thousands):
| As of December 31, | ||||||
| 2008 | 2007 | |||||
| Accounts receivable from ECRM, Inc. |
$ | 162 | $ | 211 | ||
| Accounts receivable from Sumitomo Heavy Industries Ltd. |
204 | 461 | ||||
| Accounts payable to Sumitomo Heavy Industries Ltd. |
— | — | ||||
124
Table of Contents
17. Quarterly Financial Information (unaudited)
The Company’s interim financial statements are prepared on a quarterly basis ending on the last Friday closest to the end of the calendar quarter.
| Three Months Ended | ||||||||
| December 31, 2008 | September 26, 2008 | |||||||
| Actual | Actual | |||||||
| (in thousands, except per share data) | ||||||||
| Sales |
$ | 96,331 | $ | 71,443 | ||||
| Cost of Good sold |
66,764 | 48,557 | ||||||
| Gross profit |
29,567 | 22,886 | ||||||
| Operating expenses |
252,908 | 42,409 | ||||||
| Income (loss) from operations |
(223,341 | ) | (19,523 | ) | ||||
| Interest income (expense) and other income (expense), net |
(7,013 | ) | (2,287 | ) | ||||
| Income (loss) from continuing operations |
(230,354 | ) | (21,810 | ) | ||||
| Provision for (benefit from) income taxes |
(31,951 | ) | (7,600 | ) | ||||
| Net income (loss) before discontinued operations |
(198,403 | ) | (14,210 | ) | ||||
| Income (loss) from discontinued operations, net of tax |
(40 | ) | (19 | ) | ||||
| Gain from sale of discontinued operations, net of tax |
8,732 | — | ||||||
| Net income (loss) |
$ | (189,711 | ) | $ | (14,229 | ) | ||
| Net income (loss) from continuing operations per common share: |
||||||||
| Basic |
$ | (4.30 | ) | $ | (0.34 | ) | ||
| Diluted |
$ | (4.30 | ) | $ | (0.34 | ) | ||
| Net income (loss) from discontinued operations per common share: |
||||||||
| Basic |
$ | 0.19 | $ | — | ||||
| Diluted |
$ | 0.19 | $ | — | ||||
| Net income (loss) per common share: |
||||||||
| Basic |
$ | (4.11 | ) | $ | (0.34 | ) | ||
| Diluted |
$ | (4.11 | ) | $ | (0.34 | ) | ||
125
Table of Contents
| Three Months Ended | ||||||||||||||||||||||||
| June 27, 2008 | March 28, 2008 | |||||||||||||||||||||||
| As reported | Adjustments | As restated | As reported | Adjustments | As restated | |||||||||||||||||||
| (in thousands, except per share data) | ||||||||||||||||||||||||
| Sales |
$ | 62,772 | $ | (3,303 | ) | $ | 59,469 | $ | 69,028 | $ | (7,803 | ) | $ | 61,225 | ||||||||||
| Cost of Good sold |
38,340 | (1,479 | ) | 36,861 | 42,456 | (3,788 | ) | 38,668 | ||||||||||||||||
| Gross profit |
24,432 | (1,824 | ) | 22,608 | 26,572 | (4,015 | ) | 22,557 | ||||||||||||||||
| Operating expenses |
24,520 | (983 | ) | 23,537 | 24,795 | (904 | ) | 23,891 | ||||||||||||||||
| Income (loss) from operations |
(88 | ) | (841 | ) | (929 | ) | 1,777 | (3,111 | ) | (1,334 | ) | |||||||||||||
| Interest income (expense) and other income (expense), net |
1,138 | — | 1,138 | 1,329 | 79 | 1,408 | ||||||||||||||||||
| Income (loss) from continuing operations |
1,050 | (841 | ) | 209 | 3,106 | (3,032 | ) | 74 | ||||||||||||||||
| Provision for (benefit from) income taxes |
94 | 165 | 259 | 997 | (737 | ) | 260 | |||||||||||||||||
| Net income (loss) before discontinued operations |
956 | (1,006 | ) | (50 | ) | 2,109 | (2,295 | ) | (186 | ) | ||||||||||||||
| Income (loss) from discontinued operations, net of tax |
138 | (28 | ) | 110 | (2 | ) | 221 | 219 | ||||||||||||||||
| Gain from sale of discontinued operations, net of tax |
— | — | — | — | — | — | ||||||||||||||||||
| Net income (loss) |
$ | 1,094 | $ | (1,034 | ) | $ | 60 | $ | 2,107 | $ | (2,074 | ) | $ | 33 | ||||||||||
| Net income (loss) from continuing operations per common share: |
||||||||||||||||||||||||
| Basic |
$ | 0.02 | $ | (0.01 | ) | $ | 0.01 | $ | 0.05 | $ | (0.05 | ) | $ | — | ||||||||||
| Diluted |
$ | 0.02 | $ | (0.01 | ) | $ | 0.01 | $ | 0.05 | $ | (0.05 | ) | $ | — | ||||||||||
| Net income (loss) from discontinued operations per common share: |
||||||||||||||||||||||||
| Basic |
$ | 0.01 | $ | (0.01 | ) | $ | — | $ | — | $ | — | $ | — | |||||||||||
| Diluted |
$ | 0.01 | $ | (0.01 | ) | $ | — | $ | — | $ | — | $ | — | |||||||||||
| Net income (loss) per common share: |
||||||||||||||||||||||||
| Basic |
$ | 0.03 | $ | (0.02 | ) | $ | 0.01 | $ | 0.05 | $ | (0.05 | ) | $ | — | ||||||||||
| Diluted |
$ | 0.03 | $ | (0.02 | ) | $ | 0.01 | $ | 0.05 | $ | (0.05 | ) | $ | — | ||||||||||
| Three Months Ended | ||||||||||||||||||||||||
| December 31, 2007 | September 28, 2007 | |||||||||||||||||||||||
| As reported | Adjustments | As restated | As reported | Adjustments | As restated | |||||||||||||||||||
| (in thousands, except per share data) | ||||||||||||||||||||||||
| Sales |
$ | 83,453 | $ | (16,071 | ) | $ | 67,382 | $ | 81,076 | $ | 3,001 | $ | 84,077 | |||||||||||
| Cost of Good sold |
51,748 | (8,738 | ) | 43,010 | 47,194 | 4,182 | 51,376 | |||||||||||||||||
| Gross profit |
31,705 | (7,333 | ) | 24,372 | 33,882 | (1,181 | ) | 32,701 | ||||||||||||||||
| Operating expenses |
25,215 | (967 | ) | 24,248 | 25,889 | (886 | ) | 25,003 | ||||||||||||||||
| Income (loss) from operations |
6,490 | (6,366 | ) | 124 | 7,993 | (295 | ) | 7,698 | ||||||||||||||||
| Interest income (expense) and other income (expense), net |
1,940 | (80 | ) | 1,860 | 2,383 | — | 2,383 | |||||||||||||||||
| Income (loss) from continuing operations |
8,430 | (6,446 | ) | 1,984 | 10,376 | (295 | ) | 10,081 | ||||||||||||||||
| Provision for (benefit from) income taxes |
3,921 | (3,295 | ) | 626 | 2,713 | 725 | 3,438 | |||||||||||||||||
| Net income (loss) before discontinued operations |
4,509 | (3,151 | ) | 1,358 | 7,663 | (1,020 | ) | 6,643 | ||||||||||||||||
| Income (loss) from discontinued operations, net of tax |
242 | (41 | ) | 201 | 109 | (97 | ) | 12 | ||||||||||||||||
| Gain from sale of discontinued operations, net of tax |
— | — | — | — | — | — | ||||||||||||||||||
| Net income (loss) |
$ | 4,751 | $ | (3,192 | ) | $ | 1,559 | $ | 7,772 | $ | (1,117 | ) | $ | 6,655 | ||||||||||
| Net income (loss) from continuing operations per common share: |
||||||||||||||||||||||||
| Basic |
$ | 0.11 | $ | (0.08 | ) | $ | 0.02 | $ | 0.18 | $ | (0.02 | ) | $ | 0.16 | ||||||||||
| Diluted |
$ | 0.11 | $ | (0.08 | ) | $ | 0.03 | $ | 0.18 | $ | (0.02 | ) | $ | 0.15 | ||||||||||
| Net income (loss) from discontinued operations per common share: |
||||||||||||||||||||||||
| Basic |
$ | — | $ | 0.01 | $ | 0.01 | $ | — | $ | — | $ | — | ||||||||||||
| Diluted |
$ | — | $ | 0.01 | $ | 0.01 | $ | — | $ | — | $ | — | ||||||||||||
| Net income (loss) per common share: |
||||||||||||||||||||||||
| Basic |
$ | 0.11 | $ | (0.08 | ) | $ | 0.03 | $ | 0.18 | $ | (0.03 | ) | $ | 0.16 | ||||||||||
| Diluted |
$ | 0.11 | $ | (0.06 | ) | $ | 0.04 | $ | 0.18 | $ | (0.03 | ) | $ | 0.16 | ||||||||||
126
Table of Contents
| Three Months Ended | ||||||||||||||||||||
| June 29, 2007 | March 30, 2007 | |||||||||||||||||||
| As reported | Adjustments | As restated | As reported | Adjustments | As restated | |||||||||||||||
| (in thousands, except per share data) | ||||||||||||||||||||
| Sales |
$ | 70,266 | $ | 3,634 | $ | 73,900 | $ | 71,272 | $ | (5,550 | ) | $ | 65,722 | |||||||
| Cost of Good sold |
41,271 | 1,992 | 43,263 | 42,608 | (2,309 | ) | 40,299 | |||||||||||||
| Gross profit |
28,995 | 1,642 | 30,637 | 28,664 | (3,241 | ) | 25,423 | |||||||||||||
| Operating expenses |
25,294 | (919 | ) | 24,375 | 25,046 | (398 | ) | 24,648 | ||||||||||||
| Income (loss) from operations |
3,701 | 2,561 | 6,262 | 3,618 | (2,843 | ) | 775 | |||||||||||||
| Interest income (expense) and other income (expense), net |
1,627 | — | 1,627 | 1,164 | 279 | 1,443 | ||||||||||||||
| Income (loss) from continuing operations |
5,328 | 2,561 | 7,889 | 4,782 | (2,564 | ) | 2,218 | |||||||||||||
| Provision for (benefit from) income taxes |
2,088 | 389 | 2,477 | 1,667 | (724 | ) | 943 | |||||||||||||
| Net income (loss) before discontinued operations |
3,240 | 2,172 | 5,412 | 3,115 | (1,840 | ) | 1,275 | |||||||||||||
| Income (loss) from discontinued operations, net of tax |
83 | 24 | 107 | 85 | 62 | 147 | ||||||||||||||
| Gain from sale of discontinued operations, net of tax |
— | — | — | — | — | — | ||||||||||||||
| Net income (loss) |
$ | 3,323 | $ | 2,196 | $ | 5,519 | $ | 3,200 | $ | (1,778 | ) | $ | 1,422 | |||||||
| Net income (loss) from continuing operations per common share: |
||||||||||||||||||||
| Basic |
$ | 0.08 | $ | 0.04 | $ | 0.12 | $ | 0.07 | $ | (0.04 | ) | $ | 0.03 | |||||||
| Diluted |
$ | 0.08 | $ | 0.04 | $ | 0.12 | $ | 0.07 | $ | (0.04 | ) | $ | 0.03 | |||||||
| Net income (loss) from discontinued operations per common share: |
||||||||||||||||||||
| Basic |
$ | — | $ | 0.01 | $ | 0.01 | $ | 0.01 | $ | (0.01 | ) | $ | — | |||||||
| Diluted |
$ | — | $ | 0.01 | $ | 0.01 | $ | 0.01 | $ | (0.01 | ) | $ | — | |||||||
| Net income (loss) per common share: |
||||||||||||||||||||
| Basic |
$ | 0.08 | $ | 0.05 | $ | 0.13 | $ | 0.08 | $ | (0.05 | ) | $ | 0.03 | |||||||
| Diluted |
$ | 0.08 | $ | 0.05 | $ | 0.13 | $ | 0.08 | $ | (0.05 | ) | $ | 0.03 | |||||||
127
Table of Contents
18. Subsequent Events
Bankruptcy Proceedings
Refer to Note 1 of Notes to Consolidated Financial Statements for further discussion of the “Chapter 11 Bankruptcy Filing”, “The Third Modified Joint Chapter 11 Plan of Reorganization”, and “The Plan Support Agreement.”
NASDAQ Delisting Determination
On November 3, 2009, the NASDAQ Hearing Panel of NASDAQ notified the Company that it had determined to delist the Company’s common shares from the NASDAQ Global Select Market and to suspend trading in the Company’s common shares. In accordance with Listing Rule 5830 and Rule 12d2-2 under the Securities Exchange Act of 1934, NASDAQ filed an application on Form 25 with the SEC on April 5, 2010, to delist the Company’s securities from NASDAQ. The application will become effective ten days after filing. See Note 1 “NASDAQ Delisting Determination” of the Notes to Consolidated Financial Statements for further discussion.
SEC Investigation
As discussed in the Explanatory Note to the Annual Report on Form 10-K, we have conducted a Revenue Review of certain of our historic revenue transactions. On May 14, 2009, we received a notice from the SEC indicating that the SEC is conducting a formal investigation relating to our historical accounting practices and the restatement of our historical consolidated financial statements. The Company is cooperating fully with the SEC’s investigation.
Costs Associated with Exit or Disposal Activities
The Company has undertaken a number of cost reduction initiatives, including a workforce reduction of approximately 214 employees in fiscal 2009. The total approximate severance paid in 2009 by the Company in connection with these initiatives was approximately $3.9 million.
Auction Rate Securities
As discussed in Note 3, the Company has holdings in auction rate securities for which market stability does not currently exist. The Company has had some success in liquidating these holdings during 2009. Of the $32.3 million in par value securities that the Company held as of December 31, 2008, it sold $19.3 million in 2009, and recorded net realized gains of approximately $2.4 million on its sales of these securities. As of December 31, 2009, the Company continues to hold remaining securities with a par value of $13.0 million. If the credit ratings of the issuer, the bond insurers or the collateral deteriorate further of if the issuers of these auction rate securities are unable to successfully close further auctions, the Company may further reduce the carrying value of these investments and may in the future be required to record impairment charges against these investments, some of which may be considered other-than-temporary impairment charges. The Company may be required to wait until market stability is restored for these instruments or until the final maturity of the underlying notes (up to 30 years) to recover its investment.
Amended Lease Agreement
In February 2010, the Company entered into an Amended Lease Agreement with 125 Middlesex Turnpike, LLC to reduce the term of its current lease at 125 Middlesex Turnpike, Bedford, Massachusetts from 12 years (of which approximately 10 years were remaining) to 3 years from the new effective date of March 12, 2010. The rental payment will continue at $0.1 million per month. The landlord has the right to terminate upon a written notice of termination (the “Termination Notice”) setting forth the new date on which the term of the lease shall expire (the “Early Termination Date”), which date shall be (a) no less than nine (9) months after the date of the Termination Notice, and (b) in any event, no earlier than June 1, 2011.
128
Table of Contents
| Item 9. | Changes In and Disagreements with Accountants on Accounting and Financial Disclosure |
None.
| Item 9A. | Controls and Procedures. |
Evaluation of Controls and Procedures
Our principal executive officer and principal financial officer evaluated the effectiveness of our disclosure controls and procedures (as defined in Rule 13a-15(e) under the Securities Exchange Act of 1934 (the Exchange Act)) as of December 31, 2008. The term disclosure controls and procedures means controls and other procedures that are designed to ensure that information required to be disclosed in the reports that we file or submit under the Exchange Act is recorded, processed, summarized and reported, within the time periods specified in the SEC’s rules and forms. Because of the material weaknesses in our internal control over financial reporting as described below, our principal executive officer and principal financial officer have concluded that our disclosure controls and procedures were not effective as of December 31, 2008.
Management Report on Internal Control Over Financial Reporting
Management is responsible for establishing and maintaining adequate internal control over financial reporting, as defined in Rules 13a-15(f) and 15d-15(f) under the Securities Exchange Act of 1934. Internal control over financial reporting is designed to provide reasonable assurance regarding the reliability of financial reporting and the preparation of financial statements for external reporting purposes in accordance with generally accepted accounting principles. Internal control over financial reporting includes those policies and procedures that:
| • | pertain to the maintenance of records that, in reasonable detail, accurately and fairly reflect the transactions and dispositions of the assets of the Company; |
| • | provide reasonable assurance that transactions are recorded as necessary to permit preparation of financial statements in accordance with generally accepted accounting principles, and that receipts and expenditures of the Company are being made only in accordance with authorizations of management and directors of the Company; and |
| • | provide reasonable assurance regarding prevention or timely detection of unauthorized acquisition, use or disposition of the Company’s assets that could have a material effect on the financial statements. |
Because of its inherent limitations, a system of internal control over financial reporting may not prevent or detect misstatements. Also, projections of any evaluation of effectiveness to future periods are subject to the risk that controls may become inadequate because of changes in conditions and that the degree of compliance with the policies or procedures may deteriorate.
Our principal executive officer and principal financial officer assessed the effectiveness of our internal control over financial reporting as of December 31, 2008. In making its assessment, our principal officers utilized the criteria set forth in Internal Control — Integrated Framework issued by the Committee of Sponsoring Organizations (“COSO”) of the Treadway Commission.
As of December 31, 2008, our principal officers identified four material weaknesses in our internal control over financial reporting. A material weakness is a significant deficiency (within the meaning of Public Company Accounting Oversight Board Auditing Standard No. 5), or combination of significant deficiencies, that results in there being more than a remote likelihood that a material misstatement of the annual or interim financial statements will not be prevented or detected on a timely basis by employees in the normal course of their assigned functions. Each material weakness is discussed below.
129
Table of Contents
1. Inadequate and ineffective controls over the corporate financial statement close process
As a result of ineffective procedures and controls, our December 31, 2008 year end financial statement close process was not completed in an accurate and timely manner and resulted in material post-closing adjustments which have been reflected in our consolidated financial statements for the year ended December 31, 2008. The ineffective procedures and controls occurred within our corporate accounting and finance group and involved account reconciliations and manual journal entries that were not properly prepared and/or reviewed and approved. The corporate accounting and finance group has relied on a set of complex systems and procedures that required significant knowledge and experience. The weaknesses in our procedures and controls were compounded by a significant loss of personnel from the corporate accounting and finance department starting in the fourth quarter of 2008 and through the second quarter of 2009. During that period, the Chief Financial Officer, Corporate Controller, Senior Director of Financial Planning, Director of Taxes, three accounting managers, and five additional employees in that department left the Company. Many of the employees who left had substantial historical knowledge of our particular accounting systems and procedures. The Company intends to continue to rely on consulting professionals as needed until a permanent finance team is appointed. These weaknesses resulted in the material post-closing adjustments identified by the current accounting staff and/or our independent registered public accounting firm.
2. Inadequate and ineffective controls over the recognition of revenue
We did not have adequate controls to ensure that revenue was recorded in accordance with generally accepted accounting principles. Specifically, we noted the following with respect to our accounting for revenue transactions:
| • | our sales and operations teams did not communicate to our accounting staff all of the information necessary to make accurate revenue recognition determinations; |
| • | we did not have adequate procedures in place to validate the completeness and accuracy of the information that was provided to our accounting team by our sales and operations teams; |
| • | we did not have a sufficient number of qualified personnel in our corporate accounting organization with the expertise necessary to make accurate revenue recognition determinations; and |
| • | the procedures performed relative to the evaluation of accounting criteria of arrangements with our customers were not adequate. The inadequate procedures include: |
| • | improper classification of elements of arrangements, resulting from incorrect identification of elements within an individual contract, and from erroneous or missing identification of contracts that should have been viewed as one arrangement; |
| • | inadequate or insufficient determination of fair value of undelivered element(s) of multiple-element arrangements; |
| • | inconsistent classification of sales of products with standard configurations, where acceptance criteria are met at the time of shipment, as compared to those sales where acceptance criteria could not be demonstrated prior to shipment; |
| • | improper identification of contracts with extended payment terms, such that arrangements that should have been deemed to not be fixed and determinable were not identified; |
| • | incomplete assessment of revenue transactions, and incomplete documentation necessary to support the Company’s accounting conclusions. |
These weaknesses led to our review of the historic accounting for revenue transactions, and the restatement of our financial results for previously announced interim periods from 2008, and to the financial statements of all periods prior to 2008 that are included in this Annual Report on Form 10-K.
3. Inadequate and ineffective controls over the impairment assessment for goodwill, intangible assets and other long-lived assets.
During the fourth quarter of 2008, we identified certain impairment indicators that led us to perform procedures to assess the possible impairment of our goodwill, intangible assets and other long-lived assets. These procedures were incremental to the goodwill impairment test we perform annually as of the first day of our second quarter. While we correctly identified these impairment indicators, we did not have adequate procedures and controls in place, or sufficiently qualified staff with the technical expertise to ensure that the requisite analysis to determine the amount of impairment could be conducted in a timely, accurate and complete manner, and as a result further post-closing analysis and adjustments were required.
130
Table of Contents
4. Inadequate and Ineffective Controls over the Accounting for Income Taxes
We did not have an adequate system of controls to provide reasonable assurance that the accounting for income taxes and related disclosures were prepared in accordance with generally accepted accounting principles. Specifically, we did not have sufficient qualified staffing and technical expertise in the tax function to perform an adequate review of and exercise appropriate control over the calculation of our income tax provision and deferred income tax accounts. This material weakness contributed to material post-closing adjustments to our financial statements for the quarters ended September 26, 2008 and December 31, 2008. These adjustments were identified by our independent registered public accounting firm during their review of the accounting records for these quarters, and we have evaluated and recorded adjustments in our consolidated 2008 financial statements to correct for these errors.
As a result of the material weaknesses described above, our management has determined that, as of December 31, 2008, we did not maintain effective internal control over financial reporting based on the COSO criteria.
As permitted by SEC guidance, the scope of management’s assessment excludes the internal controls over financial reporting of the acquired operations of Excel which was has been included in our financial statements since August 20, 2008.
Changes in Internal Control Over Financial Reporting
There were no changes in the Company’s internal controls over financial reporting during the fourth quarter of 2008. While there was no change in the Company’s overall control structure, information came to light during the closing process for the third and fourth quarters of 2008 that led the Company to conclude that some of its internal controls over financial reporting were not operating effectively. The ineffective controls resulted in the material weaknesses described above.
Remediation plans
Management plans to put in place the following measures to strengthen internal controls over financial reporting and address the material weaknesses described above. Our remediation efforts involve numerous business and accounting process improvements. The improvements are generally designed to: (1) enhance the number of persons within the corporate accounting group with the technical experience to properly evaluate and account for complex accounting transactions, as well as to provide appropriate managerial oversight to our accounting staff, (2) standardize business practices, including a broad-based understanding and adherence to general corporate governance, ethics and public company matters, and (3) improve the timeliness and access to information that is required by the accounting team in order to make appropriate assessments of transactions in accordance with generally accepted accounting principles. We began implementing certain of these measures prior to the filing of this Annual Report on Form 10-K. For example, during 2009, we implemented enhanced revenue recognition procedures and controls. Additionally, our principal financial officer joined the Company in the first quarter of 2009, and led the staffing of a team of temporary and consulting professionals with requisite finance and revenue recognition skills. We expect the implementation of the additional remedial actions to be substantially completed in 2010. Until we are able to remediate the weaknesses, we intend to rely on the continued use of outside professionals in order to perform procedures and reviews deemed appropriate and necessary for us to perform accounting procedures and report timely and accurate financial results.
The remediation plans that we have undertaken, or plan to undertake, include the following measures:
Plans with respect to accounting personnel
| • | Appoint a permanent Chief Financial Officer and enhance the number and quality of the composition of our corporate finance team. This will include the Company conducting an assessment of the current skill set to support the staffing of a finance group with the requisite expertise. We will review the composition of our team of salaried accounting professionals, in terms of skills, technical expertise and overall experience level. |
| • | To this end, and subject to the constraints of the Bankruptcy process, we will endeavor to recruit and retain qualified accounting professionals necessary to help ensure the accountability and effective implementation of key controls and remedial actions designed in the areas that material weaknesses have been identified. |
| • | Until such time as the review and hiring of salaried accounting professionals is finalized, we have engaged outside professionals to assist us in finalizing our accounting and related SEC reporting for the periods included in this Annual Report on Form 10-K. We have also utilized outside professionals to assist with similar activities in connection with our activities in closing the accounting records for periods in 2009 and 2010. The Company plans to continue to rely on outside professionals as needed until a permanent staff is deployed. |
131
Table of Contents
| • | Increase the amount and frequency of the training of our accounting staff. This training is focused on the following matters: |
| • | Technical accounting matters that are to be performed by certain staff, and upon whose expertise we will rely to ensure timely, complete and accurate accounting procedures have been performed and documented. |
| • | Reviews of current, and yet to be updated, processes and controls will be conducted to ensure that our accounting staff understand requirements and procedures. Additionally, this training will be conducted to ensure that our accounting personnel with managerial responsibilities are capable of supervising the required accounting work, including all necessary reviews, to ensure complete, timely and accurate financial information. |
| • | Education with respect to our product offerings, including related services, will be provided by our sales and operational groups in order to ensure that our accounting personnel are aware of current product and service offerings. |
| • | Review and redesign of our tax accounting function, including processes and related controls to ensure that our tax provisions, and related balance sheet accounts can be completed accurately and in a timely manner, including ensuring that qualified managerial personnel are able to oversee, review and approve the work performed by tax team’s staff. |
Plans with respect to organization-wide personnel
| • | Reinforce the “message from the top” with respect to the Company’s policies, and corporate responsibilities. Provide continued reinforcement of these standards and expectations from the executive level officers. |
| • | Provide training to our sales, operations and accounting teams with respect to certain corporate governance and public company matters. The training will include guidelines and procedures to ensure that relevant information is promptly and completely communicated to the accounting team, or other senior management representatives, as appropriate. The training will also educate our sales, operations and accounting teams with respect to revenue recognition implications of certain activities, including discussions or other communications between our personnel and customers. |
| • | Develop procedures whereby the consistent application of our policies for revenue recognition are understood and are able to be applied. In particular, the procedures will include guidance as to what constitutes a multiple element arrangement, and how fair value is determined for each element of an arrangement. Additionally, training will be given to ensure that all involved personnel understand and can universally apply the evaluation as to what is a standard product (as defined in our policies), as compared to a product that is not standard. |
| • | Enhance the cross-functional reviews and approvals of transactions, including policies with respect to electronic approvals, and with respect to the downstream performance of activities that mandate prior approvals or actions. |
| • | Develop enhanced procedures with respect to the review of facts, assumptions and other related information that has been reviewed or considered when reaching accounting conclusions. These procedures will be further enhanced by improved documentation, review and approvals of material facts and assumptions by management within the accounting function, and outside of the accounting function when deemed appropriate or necessary. |
Plans with respect to organization-wide processes and information systems
| • | Review our information systems to assess which processes can be further automated including, as appropriate, the configuration of our information systems to allow for tracking of certain information that is not routinely captured currently. The accounting processes will be reviewed, and expanded as deemed necessary, to review and assess non-accounting information that is captured in our enterprise wide information systems, as certain of this information can assist the evaluation and documentation of accounting conclusions. |
| • | Redesign our key accounting processes with respect to our accounting team management’s oversight and review of accounting records, source documentation and related assumptions that form the basis for conclusions. |
132
Table of Contents
If the remedial measures described above are insufficient to address any of the identified material weaknesses or are not implemented effectively, or additional deficiencies arise in the future, material misstatements in our interim or annual financial statements may occur in the future and we may continue to be delinquent in our filings. We are currently working to improve and simplify our internal processes and implement enhanced controls, as discussed above, to address the material weaknesses in our internal control over financial reporting and to remedy the ineffectiveness of our disclosure controls and procedures. While this implementation phase is underway, we are relying on extensive manual procedures including the use of qualified external consultants and incremental management oversight and reviews, to assist us with meeting the objectives otherwise fulfilled by an effective internal control. A key element of our remediation effort is the ability to recruit and retain qualified individuals to support our remediation efforts as well as to complete the significant backlog of work required for us to become current with our SEC filings. Despite our efforts to continually improve our control procedures and environment, we can not provide assurance that our remediation measures will be completed or become effective by any given date after 2008. Among other things, any unremediated material weaknesses could result in material post-closing adjustments in future financial statements and in the Company’s inability to file future financial statements with the SEC in a timely manner. Furthermore, any such unremediated material weaknesses could have the effects described in “Item 1A. Risk Factors - Our Audit Committee, management and independent auditors have identified material weaknesses in our internal procedures and controls, and we may be unable to develop, implement and maintain appropriate procedures and controls in future periods” in Part I of this Annual Report on Form 10-K.
The Company’s independent registered public accounting firm, Ernst & Young LLP, has issued an attestation report on the Company’s internal control over financial reporting as of December 31, 2008, which is included herein.
133
Table of Contents
Report of Independent Registered Public Accounting Firm
To the Board of Directors and Shareholders of GSI Group Inc.
We have audited GSI Group Inc.’s internal control over financial reporting as of December 31, 2008, based on criteria established in Internal Control—Integrated Framework issued by the Committee of Sponsoring Organizations of the Treadway Commission (the COSO criteria). GSI Group Inc.’s management is responsible for maintaining effective internal control over financial reporting, and for its assessment of the effectiveness of internal control over financial reporting included in the accompanying Management Report on Internal Controls over Financial Reporting. Our responsibility is to express an opinion on the company’s internal control over financial reporting based on our audit.
We conducted our audit in accordance with the standards of the Public Company Accounting Oversight Board (United States). Those standards require that we plan and perform the audit to obtain reasonable assurance about whether effective internal control over financial reporting was maintained in all material respects. Our audit included obtaining an understanding of internal control over financial reporting, assessing the risk that a material weakness exists, testing and evaluating the design and operating effectiveness of internal control based on the assessed risk, and performing such other procedures as we considered necessary in the circumstances. We believe that our audit provides a reasonable basis for our opinion.
A company’s internal control over financial reporting is a process designed to provide reasonable assurance regarding the reliability of financial reporting and the preparation of financial statements for external purposes in accordance with generally accepted accounting principles. A company’s internal control over financial reporting includes those policies and procedures that (1) pertain to the maintenance of records that, in reasonable detail, accurately and fairly reflect the transactions and dispositions of the assets of the company; (2) provide reasonable assurance that transactions are recorded as necessary to permit preparation of financial statements in accordance with generally accepted accounting principles, and that receipts and expenditures of the company are being made only in accordance with authorizations of management and directors of the company; and (3) provide reasonable assurance regarding prevention or timely detection of unauthorized acquisition, use, or disposition of the company’s assets that could have a material effect on the financial statements.
Because of its inherent limitations, internal control over financial reporting may not prevent or detect misstatements. Also, projections of any evaluation of effectiveness to future periods are subject to the risk that controls may become inadequate because of changes in conditions, or that the degree of compliance with the policies or procedures may deteriorate.
As indicated in the accompanying Management’s Report on Internal Control over Financial Reporting, management’s assessment of and conclusion on the effectiveness of internal control over financial reporting did not include internal controls of Excel Technology, Inc, which is included in the 2008 consolidated financial statements of GSI Group Inc. and constituted approximately $144 million and $127 million of total and net assets, respectively, excluding the impact of purchase accounting adjustments, as of December 31, 2008 and approximately $56 million and $5 million of sales and net income, respectively, excluding the impact of purchase accounting adjustments, for the year then ended. Our audit of internal control over financial reporting of GSI Group Inc. also did not include an evaluation of the internal control over financial reporting of Excel Technology, Inc.
A material weakness is a deficiency, or combination of deficiencies, in internal control over financial reporting, such that there is a reasonable possibility that a material misstatement of the company’s annual or interim financial statements will not be prevented or detected on a timely basis. The following material weaknesses have been identified and included in management’s assessment. Management has identified material weaknesses in controls related to the corporate financial statement close process, the recognition of revenue, the impairment assessment for goodwill, intangible assets and other long-lived assets, and the accounting for income taxes. We have also audited, in accordance with the standards of the Public Company Accounting Oversight Board (United States), the consolidated balance sheets of GSI Group, Inc. as of December 31, 2008 and 2007, and the related consolidated statements of operations, shareholders’ equity, and cash flows for each of the three years in the period ended December 31, 2008. These material weaknesses were considered in determining the nature, timing and extent of audit tests applied in our audit of the 2008 financial statements and this report does not affect our report dated April 13, 2010, which expressed an unqualified opinion, with an explanatory paragraph regarding GSI Group Inc.’s ability to continue as a going concern on those financial statements.
134
Table of Contents
In our opinion, because of the effect of the material weaknesses described above on the achievement of the objectives of the control criteria, GSI Group Inc. has not maintained effective internal control over financial reporting as of December 31, 2008, based on the COSO criteria.
| /S/ ERNST & YOUNG LLP |
Boston, Massachusetts
April 13, 2010
135
Table of Contents
| Item 9B. | Other Information |
Not Applicable.
136
Table of Contents
PART III
| Item 10. | Directors, Executive Officers and Corporate Governance |
The following table sets forth the name, age and position of each director and executive officer of GSI Group, Inc. during the fiscal year ended December 31, 2008:
| Name |
Director Since |
Age | Position | |||
| Directors |
||||||
| Richard B. Black |
1999 | 75 | Chairman of the Board of Directors | |||
| Garrett A. Garrettson, Ph.D. |
2005 | 65 | Director | |||
| Phillip A. Griffiths, Ph.D. |
2001 | 70 | Director | |||
| Marina Hatsopoulos |
2005 | 43 | Director | |||
| Byron O. Pond |
2000 | 72 | Director | |||
| Benjamin J. Virgilio |
1998 | 69 | Director | |||
| Executive Officers |
||||||
| Sergio Edelstein, Ph.D. |
2006 | 54 | President and Chief Executive Officer, Director | |||
| Anthony Bellantuoni |
— | 57 | Vice President, Human Resources | |||
| Philippe Brak |
— | 48 | Vice President and General Manager | |||
| Stephen Webb |
— | 48 | Managing Director | |||
| Former Executive Officers |
||||||
| Robert Bowen (1) |
— | 59 | Vice President and Chief Financial Officer | |||
| Nino Federico (2) |
— | 58 | Vice President, Global Manufacturing Operations | |||
| Felix Stukalin (3) |
— | 47 | Vice President, Business Development | |||
| (1) | Employment terminated effective October 27, 2008. |
| (2) | Employment terminated effective August 29, 2008. |
| (3) | Employment terminated effective August 29, 2008. |
The following table sets forth the Board committee membership as of December 31, 2008:
| Name |
Audit Committee (2) |
Compensation Committee (2) |
Technology Committee (2) |
Nominating
and Corporate Governance Committee (2) | ||||
| Richard B. Black |
X (1) | |||||||
| Garrett A. Garrettson, Ph.D. |
X | X (1) | ||||||
| Phillip A. Griffiths, Ph.D. |
X | X | ||||||
| Marina Hatsopoulos |
X (1) | X | ||||||
| Byron O. Pond |
X | X (1) | ||||||
| Benjamin J. Virgilio |
X | X | ||||||
| Sergio Edelstein, Ph.D. |
X |
| (1) | Chairperson |
| (2) | Committee membership reflects changes to the composition which occurred in July 2008 as follows: Mr. Virgilio was no longer a member of the Audit Committee and became a member of the Technology Committee; Dr. Griffiths was no longer the Chairperson or a member of the Technology Committee and became a member of the Audit Committee and Dr. Garrettson became Chairperson of the Technology Committee. |
137
Table of Contents
The following table sets forth the name, age and position of each director and executive officer of GSI Group, Inc. as of December 31, 2009:
| Name |
Director Since |
Age | Position | |||
| Directors |
||||||
| Richard B. Black |
1999 | 76 | Chairman of the Board of Directors | |||
| Garrett A. Garrettson, Ph.D. |
2005 | 66 | Director | |||
| Phillip A. Griffiths, Ph.D. |
2001 | 71 | Director | |||
| Marina Hatsopoulos |
2005 | 44 | Director | |||
| Byron O. Pond |
2000 | 73 | Director | |||
| Benjamin J. Virgilio |
1998 | 70 | Director | |||
| Executive Officers |
||||||
| Sergio Edelstein, Ph.D. |
2006 | 55 | President and Chief Executive Officer, Director | |||
| Anthony Bellantuoni |
— | 58 | Vice President, Corporate Resources | |||
| Philippe Brak |
— | 49 | Vice President and General Manager | |||
| Stephen Webb |
— | 49 | Managing Director | |||
The following table sets forth the Board committee membership as of December 31, 2009:
| Name |
Audit Committee (2) |
Compensation Committee (2) |
Technology Committee (2) |
Nominating
and Corporate Governance Committee (2) | ||||
| Richard B. Black |
X (1) | |||||||
| Garrett A. Garrettson, Ph.D. |
X | X (1) | ||||||
| Phillip A. Griffiths, Ph.D. |
X | X | ||||||
| Marina Hatsopoulos |
X | X (1) | ||||||
| Byron O. Pond |
X | X (1) | ||||||
| Benjamin J. Virgilio |
X | X | ||||||
| Sergio Edelstein, Ph.D. |
X |
| (1) | Chairperson |
| (2) | Committee membership reflects changes to the composition which occurred in July 2009 as follows: Ms. Hatsopoulos was no longer a member of the Nominating and Corporate Governance Committee and became a member of the Audit Committee; Dr. Garrettson was no longer a member of the Audit Committee and became a member of the Compensation Committee and Dr. Griffiths was no longer a member of the Compensation Committee and became a member of the Nominating and Corporate Governance Committee. |
The following information is submitted based upon information received by the Company from such persons:
Directors
Richard B. Black has been a Director of the Company since 1999 and Chairman of the Board of Directors since 2005. He is the President and Chief Executive Officer of ECRM, Inc., a manufacturer of laser systems equipment for the printing and publishing industry. He served as Chairman of ECRM from August 1983 until March 2002. Mr. Black also served as a General Partner for OpNet Partners, L.P., a technology investment fund from 2001 through December 31, 2007. He served as Vice Chairman of Oak Technology, Inc. from March 1999 until the company was merged with Zoran Corporation in August 2003. He served as President of Oak Technology from January 1998 to March 1999, and was a director at Oak Technology from 1988 to 2003. From 1987 to 1997, Mr. Black served as a General Partner for KBA Partners, L.P., a technology venture capital fund. Prior to that time, he served as president and CEO of AM International, Inc., Alusuisse of America, Inc. and Maremont Corporation. From 1963 to 1966 Mr. Black was an Adjunct Professor of Accounting at Beloit College. In addition to ECRM, he currently serves as a director of the following companies: Allied Fiber Optic Products, Inc., Applied Optoelectronics, Inc. and Trex Enterprises Inc.
Garrett A. Garrettson, Ph.D. has been a Director of the Company since 2005. He has been the President of G. Garrettson Consulting LLC, a management consulting company since 2004 and a Managing Director of daVinci Capital Group since 2006. From December 2005 to January 2008, he was President and CEO of Fresco Technologies, a private digital imaging company. From November 2001 to September 2004, he was the Chief Executive Officer of Clairvoyante, Inc., a provider of flat panel display technology and related intellectual property. From April 2000 to December 2002, he was Chairman of the Board and, from April 1996 to April 2000, the Chief Executive Officer of Spectrian Corporation, a public telecommunications infrastructure equipment company. From April 1993 until April 1996, he was President and Chief Executive Officer of Censtor, a private magnetic recording head and media company. Dr. Garrettson is currently the Chairman of the Board of Directors of Iridex Corporation and Giga-Tronics Incorporated, each a publicly held company.
138
Table of Contents
Phillip A. Griffiths, Ph.D. has been a Director of the Company since 2001. He is a faculty member (emeritus since 2009) in the School of Mathematics at the Institute for Advanced Study in Princeton, New Jersey. He is also currently serving as the Chairman of the Board of the Science Initiative Group, an international team of scientific leaders and supporters dedicated to fostering science in developing countries, and Chairman of the Board of the Mathematical Sciences Research Institute in Berkeley, California. He was, from 1991 to 2004, Director of the Institute of Advanced Study, where he was responsible for managing the Institute’s various research activities. Prior to joining the Institute in 1991, Dr. Griffiths was Provost and James B. Duke Professor of Mathematics at Duke University for eight years. He has also taught at Harvard University, Princeton University and the University of California, Berkeley. He currently serves as a director of Oppenheimer Funds, Inc.
Marina Hatsopoulos has been a Director of the Company since 2005. She is the founder of and was the Chief Executive Officer of Z Corporation, a provider of technology and products to the 3D printing market, from December 1994 until 2005. Z Corporation was sold to Contex Scanning Technology (Contex) in 2005. From August 2005 to September 2007, Ms. Hatsopoulos was a director of Contex, a leading manufacturer of large-format scanners. Ms. Hatsopoulos is currently a director of Tea Forte, a high-growth manufacturer and retailer of premium tea products and Cynosure, Inc., a leading manufacturer of laser-based aesthetic systems. She is also a principal of Windy Street, Inc.
Byron O. Pond has been a Director of the Company since 2000. From August 2006 through December 2006, Mr. Pond served as Interim Chief Executive Officer of Cooper Tire & Rubber Company, an automotive supply company. In February 2001, Mr. Pond joined Amcast Industrial Corporation. During his tenure he served as President, CEO and Chairman before retiring on his contract termination date in February 2004. After retirement, Mr. Pond remained as an Amcast director and also became non-executive Chairman. On November 1, 2004, Mr. Pond was asked to reassume the positions of Amcast Chairman, President and CEO. Amcast filed for protection under Chapter 11 of the U.S. Bankruptcy Code on November 30, 2004. From 1990, Mr. Pond was a senior executive with Arvin Industries, Inc., serving as its President and Chief Executive Officer from 1993 to 1996 and as its Chairman and Chief Executive Officer from 1996 to 1998. He retired as Chairman of Arvin Industries, Inc. in 1999. Mr. Pond currently serves on the Board of Directors of EMCON Technologies and ECRM, Inc.
Benjamin J. Virgilio has been a Director of the Company since 1998. He is currently the President and Chief Executive Officer of BKJR, Inc. of Toronto, Canada. He was previously, from July 2000 until February 2001, the Chairman of Robotic Technology Systems, Inc. Mr. Virgilio was the President and Chief Executive Officer of Rea International Inc., an automotive fuel systems manufacturer, from May 1995 to July 2000. Prior to May 1995, Mr. Virgilio was a business consultant. From February 1981 to November 1993, he was President and Chief Executive Officer of A.G. Simpson Limited. Mr. Virgilio currently serves as a director of Numatech Industries, and Jacob’s Ladder, a charitable research foundation.
Executive Officers
Sergio Edelstein, Ph.D. has been President, Chief Executive Officer, and a member of the Board of Directors of the Company since July 2006. He also serves on the Board of Directors of MES International, Inc., a subsidiary of the Company. From 2004 until joining the Company in July 2006, he served as Group Vice President of the E-Beam & Films Product Group at KLA-Tencor Corporation. From 2000 to 2004, Dr. Edelstein held the position of Vice President and General Manager of KLA-Tencor Corporation’s Film and Surface Technology Division. Prior to joining KLA-Tencor Corporation, Dr. Edelstein served as the General Manager of the Tungsten Systems Division at Applied Materials, Inc.
Anthony Bellantuoni joined the Company in September of 2007 as Vice President of Human Resources. He assumed the role of Vice President of Corporate Resources in October 2009. He also serves as Secretary of the Company and as Vice President, Secretary and a director of MES International Inc., a subsidiary of the Company. Prior to joining the Company, Mr. Bellantuoni was employed at Dassault Systemes where he served as Vice President of Human Resources for their ENOVIA Division until September of 2007. Prior to that, he was Vice President, Human Resources and Administration for the SIMULIA Division of Dassault Systemes, formerly privately held ABAQUS, Inc. Before joining ABAQUS, Inc. in January of 2005, Mr. Bellantuoni was Senior Vice President of Human Resources at ePresence, formerly Banyan Systems, from July of 1997 until June of 2004, and held various human resources management roles over the course of more than 17 years at Wang Laboratories, Inc. including assignments in Hawaii, Sydney, Australia and Brussels, Belgium.
Philippe Brak joined the Company on January 2, 2008 as Vice President and General Manager for the Company’s lasers business. Prior to joining the Company, Mr. Brak was President and CEO of NP Photonics, Inc., a fiber laser company, where he served initially as Vice President, Sales and Marketing. Before joining NP Photonics, Inc., Mr. Brak was employed at Gigabit Optics, where he established its worldwide distribution networks. Prior to that, he spent 16 years at Spectra-Physics Lasers, Inc. in various General Management and Sales and Services Management roles in Europe and in the USA, including Vice President and General Manager for the company’s worldwide OEM business.
139
Table of Contents
Stephen Webb became Managing Director of Westwind Air Bearings Ltd. (Westwind) in February 2003. Westwind was acquired by the Company in December 2003. From 2001 to 2003, Mr. Webb was Operations Director at Oxford Instruments Analytical Ltd., a maker of subsystems for electron microscopes and NMR equipment. Prior to 2001, he was Operations Director at EEV Ltd., a maker of semiconductor and microwave components used in a broad range of niche applications from gas sensing to satellites.
Former Executive Officers
Robert Bowen was named Vice President and Chief Financial Officer of the Company effective December 16, 2005. Prior to joining the Company, Mr. Bowen was, from November 2003 to December 2005, an independent consultant and co-founder of Graystone Capital Partners LLC. From December 2000 to October 2003, Mr. Bowen was Vice President and Chief Financial Officer of Cytyc Corporation, a maker of cancer diagnostic and other medical devices, and prior to that, Chief Financial Officer for the European Region for Case Corporation. Mr. Bowen’s employment with the Company terminated effective October 27, 2008.
Nino Federico was named Vice President, Global Manufacturing Operations in January 2008. Prior to that, he has been the General Manager of the Laser Systems group at the Company since September 2002. Prior to this position, he was the Director of Operations of the Laser Systems group from June through August of 2002. Mr. Federico joined the Company in January 2002 as the Director of Global Service Logistics and Marketing for the Laser Systems group. Mr. Federico’s employment with the Company terminated effective August 29, 2008.
Felix Stukalin joined the Company in November 1994. Mr. Stukalin was General Manager of the Components Product Group from 1999 to 2000 and of Wave Precision from 2000 to 2002. In May 2002, Mr. Stukalin assumed the role of Vice President of Business Development. Mr. Stukalin’s employment with the Company terminated effective August 29, 2008.
Legal Proceedings Involving the Company’s Executive Officers
As previously disclosed and as earlier described in this Annual Report on Form 10-K, on November 20, 2009, the Company filed a voluntary petition for relief under chapter 11 of the United States Bankruptcy Code in the United States Bankruptcy Court for the District of Delaware. Each of the Company’s named executive officers and current executive officers served as executive officer of the Company at the time of such filing or within two years prior to such filing.
Code of Ethics and Business Conduct
All of the Company’s directors, officers and employees must act in accordance with the Code of Ethics and Business Conduct, which has been adopted by the Company’s Board of Directors. A copy of the Code of Ethics and Business Conduct is available on the Company’s website at http://www.gsig.com at http://www.gsig.com/process_careers/default.html. The Company will provide to any person without charge, upon request, a copy of the Code of Ethics and Business Conduct. Such a request should be made in writing and addressed to GSI Group Inc., Attention: Investor Relations, 125 Middlesex Turnpike; Bedford, MA 01730. The Company intends to satisfy the disclosure requirement under Item 5.05 of Form 8-K regarding disclosure of an amendment to, or waiver from, a provision of this Code of Ethics and Business Conduct with respect to its principal executive officer, principal financial officer, principal accounting officer or controller, or persons performing similar functions, by posting such information on the Company’s website, unless a Form 8-K is otherwise required by law or applicable listing rules.
Section 16(a) Beneficial Ownership Reporting Compliance
Section 16(a) of the Securities Exchange Act of 1934 (the “Exchange Act”) requires the executive officers, directors and persons who own more than 10% of the common shares to file reports of ownership and changes in ownership with the SEC. These executive officers, directors and 10% stockholders are also required by SEC rules to furnish the Company with copies of all Section 16(a) reports they file. Based solely on a review of copies of Forms 3, 4 or 5 filed by the Company on behalf of its directors and executive officers or otherwise provided to the Company and copies of Schedule 13Gs and other than as set forth in detail below, the Company believes that during the year ended December 31, 2008, its executive officers, directors and greater than 10% stockholders complied with all applicable Section 16(a) filing requirements.
| • | Late Reports: Mr. Black filed a Form 4 related to a July 28, 2008 restricted stock grant one day after the required filing date; Dr. Garrettson filed a Form 4 related to a July 28, 2008 restricted stock grant one day after the required |
140
Table of Contents
| filing date; Dr. Griffiths filed a Form 4 related to a July 28, 2008 restricted stock grant one day after the required filing date; Ms. Hatsopoulos filed a Form 4 related to a July 28, 2008 restricted stock grant one day after the required filing date; Mr. Pond filed a Form 4 related to a July 28, 2008 restricted stock grant one day after the required filing date; Mr. Virgilio filed a Form 4 related to a July 28, 2008 restricted stock grant one day after the required filing date; Dr. Edelstein filed a Form 4 related to a March 14, 2008 restricted stock grant one day after the required filing date; Mr. Brak filed a Form 4 related to a March 14, 2008 restricted stock grant three days after the required filing date; Mr. Webb filed a Form 4 related to a March 14, 2008 restricted stock grant one day after the required filing date; Mr. Bellantuoni filed a Form 4 related to shares earned on February 15, 2008 with respect to a October 22, 2007 restricted stock grant more than a year after the required filing date and Form 4 related to a March 14, 2008 restricted stock grant one day after the required filing date; Mr. Bowen filed a Form 4 related to a March 14, 2008 restricted stock grant one day after the required filing date; Mr. Federico filed a Form 4 related to a March 14, 2008 restricted stock grant one day after the required filing date; and Mr. Stukalin filed a Form 4 related to a July 11, 2008 stock option exercise one day after the required filing date. |
Audit Committee
The Company’s Board of Directors has a separately designated standing audit committee in accordance with Section 3(a) (58)(A) of the Exchange Act. The audit committee operates under a charter that has been approved by the Board of Directors. A copy of the audit committee’s charter, including any updates thereto, can be found on the Company’s website, www.gsig.com., at http://www.gsig.com/investors. As of December 31, 2008, the members of the audit committee were: Richard B. Black, Garrett A. Garrettson, Ph.D., and Phillip A. Griffiths, Ph.D.
The Company’s Board of Directors has determined that all of the members of the audit committee are independent as defined under the rules of the NASDAQ Stock Market, including the independence requirements contemplated by Rule 10A-3 under the Exchange Act. The Company’s Board of Directors has determined that Mr. Black is an “audit committee financial expert” as defined in Item 401(h) of Regulation S-K of the Securities Exchange Act of 1934, as amended. Mr. Black’s relevant experience includes serving as President and Chief Executive Officer of ECRM, Inc., a manufacturer of laser systems equipment for the printing and publishing industry since 2002, his experience as an adjunct professor of accounting at Beloit College from 1963 to 1966, his experience as a general partner of technology investment funds and his experience as a director of various other companies.
Director Nominations
No material changes have been made to the procedures by which security holders may recommend nominees to the Company’s Board of Directors.
| Item 11. | Executive Compensation |
COMPENSATION COMMITTEE REPORT
The Compensation Committee has reviewed and discussed with management the following Compensation Discussion and Analysis section of this Annual Report on Form 10-K. Based on its review and discussions with management, the Compensation Committee recommended to the Board of Directors that the Compensation Discussion and Analysis be included in the Company’s Annual Report on Form 10-K for the year-ended December 31, 2008.
The Compensation Committee:
Ms. Marina Hatsopoulos (Chairperson)
Mr. Phillip Griffiths, Ph.D.
Mr. Byron Pond
COMPENSATION DISCUSSION & ANALYSIS
The following discussion and analysis contains statements regarding future individual and Company performance targets and goals. These targets and goals are disclosed in the limited context of the Company’s compensation programs and should not be understood to be statements of management’s expectations or estimates of results or other guidance. The Company specifically cautions investors not to apply these statements to other contexts.
The following details the Company’s philosophy and policies regarding executive compensation, the process that is used to set executive compensation within the Company, the elements of the executive compensation program, and the role
141
Table of Contents
of the Compensation Committee of the Board of Directors of GSI Group Inc. (the “Committee”) and the executive staff in setting executive compensation. In this section, the use of the terms, “we”, “our”, “us” and the “Committee” refers to the Compensation Committee unless otherwise specified.
Committee Members and Independence
In 2008, the Committee was comprised of three independent directors: Marina Hatsopoulos (Chair), Byron O. Pond and Phillip A. Griffiths, Ph.D. None of the members were, at any time, officers or employees of the Company or its subsidiaries. The Board of Directors has determined that each member of the Committee is an independent director under the applicable rules of NASDAQ and following an annual independence review performed by the Company’s Nominating and Governance Committee in October 2008.
Role of the Committee
The Committee is responsible for setting, implementing and monitoring the Company’s executive compensation policy. The Committee receives advice and input from the CEO and, where appropriate, outside consultants and legal counsel on compensation issues. The Company’s compensation policy seeks to build long-term shareholder value by targeting compensation to financial performance and important strategic Company goals, and by incentivizing and retaining a highly qualified executive team. Strategic goals may vary for each fiscal year depending on overall business plan goals for that year and may consist of: increasing market share percent by product line; new product development; new product revenue growth; organizational development; and M&A initiatives. In 2008, as in prior years, the Committee established strategic goals dependent on individual roles and objectives. In 2008, the strategic goals the Committee focused on included, in the cases of Corporate Executives, restructuring efforts and M&A activities and, in the cases of Operating Executives, generation of new product revenues, new product revenue growth and retention of or increase in specific product market share. Individual goals are discussed in detail under “Executive Compensation Program Elements – Annual Cash Bonus Incentive.”
The Committee operates pursuant to a written charter (the “Charter”). The Charter sets forth the Committee’s purpose, authority, responsibilities, and procedures. The Charter is reviewed and approved by the Compensation Committee and is available at the Investor Relations page of the Company’s website (http://www.gsig.com/investors/). In summary, the Committee has been established by the Board to determine the appropriate compensation of the Company’s senior management. The Committee meets as often as the chair of the Committee deems appropriate, but not less than four times per year. In 2008, the Committee met seven times, including two telephonic meetings. The Committee reports its actions and recommendations to the full Board of Directors at each quarterly meeting of the Board of Directors. The Committee meets in executive session, and, where appropriate, with members of management, including the CEO, outside consultants, HR representatives and the Company’s outside legal counsel.
The Committee establishes all elements of compensation paid to the CEO and reviews and approves all elements of compensation paid to the other executive officers, including all of the other executive officers named in the Summary Compensation Table (these executive officers, together with the CEO are referred to herein as the “Named Executive Officers” or “NEOs”). The CEO is authorized by the Committee to evaluate senior executive performance against annual goals and then report his findings to the Committee, together with his recommendations for senior executive compensation for the coming year. The Committee then meets with the CEO to discuss his evaluations and recommendations; however, the Committee retains responsibility and authority for executive officer compensation.
Executive Compensation Philosophy
The executive compensation program is intended to align the interests of management and the shareholders by rewarding performance against strategic objectives that will help to build long-term shareholder value. The following principles guide the Company’s executive compensation program.
1. Executives who perform should expect to receive a salary that is commensurate with market conditions. Historically, the Company has looked to establish salary structures around the mean of the Company’s peers.
2. Bonuses and equity grants are intended to reflect, in large part, a pay-for-performance culture. The Company uses restricted stock grants that have performance-based and time-based elements for executives in order to provide an appropriate balance between long-term incentives that are focused on performance and retention.
142
Table of Contents
3. Performance should be measured against a mix of absolute measures (e.g., profitability goals) and relative measures (e.g., market share, performance relative to peers, etc.), as well as individual performance against MBOs (as defined below).
4. Equity grant metrics should not be revised after the grant date.
5. Equity grant metrics should fairly account for the effects of non-recurring events such as individual acquisitions and reorganizations.
6. Total compensation is a function of individual responsibility within the Company, and the ability to contribute meaningfully to the Company’s success.
7. Total compensation should allow the Company to attract the best possible candidates and to motivate them to meet or exceed performance metrics that will build long-term shareholder value.
8. Equity-based performance metrics should not target short-term goals or short-term financial enhancements unless those goals are also congruent with building long-term shareholder value.
In applying the above principles, the Committee seeks to maintain the highest quality management team possible, and to build management’s long-term commitment to the Company through a compensation program that provides appropriate short and long-term incentives built around concrete, objective business and financial goals.
Since the scheduled timing for determination of the executive annual cash incentive bonuses for 2008 occurred prior to the conclusion of the Revenue Review and it was not clear at that time when the investigation would be completed, the Committee measured such results without giving effect to the results of the Revenue Review or the restatement of financials, as set forth in this Annual Report on Form 10-K. Such calculations yielded the result that no executives would earn cash incentive bonus awards related to the Company’s financial performance in 2008. Similarly, the calculations yielded the result that no executives would earn the performance-based portion of the equity-based compensation awards granted in 2008 as a result of the Company’s financial performance in 2008. Accordingly, all such awards were forfeited effective December 31, 2008. The Committee believed it was reasonable and appropriate to use the unadjusted financial results as the basis on which to calculate the cash incentive bonuses, and as such no cash incentive bonus awards were earned or received based on the financial results for 2008. Additionally, given the ongoing Revenue Review and delay in filing its restatement of financials, the Company decided that the payment of any and all cash bonuses earned by executives in 2008 (i.e., those based on non-financial measures) would be deferred until the Company’s restated financial statements are successfully filed and the Company has timely filed all reports required. This action was recommended by the CEO and approved by the Committee at a meeting held on February 23, 2009. The Committee considered but did not adopt a specific claw-back policy regarding executive compensation in view of the ongoing Revenue Review at that time, and instead determined to rely upon the Company’s Code of Ethics and Business Conduct Policy to address any instances of employee misconduct or suspected or actual violations of such Company policies.
External Peer and Survey Data
The Committee may retain the services of advisors and it has the budgetary authority to hire such advisors as it deems necessary. In order to determine the competitiveness of the Company’s overall compensation for executive officers, the Company reviews the compensation for comparable positions within its industry, the historical compensation levels of the executive officers and the individual performance of executive officers evaluated against their individual objectives established for the preceding year. In 2008, the Committee utilized the group of peer companies identified below for benchmarking purposes because such companies are direct competitors of one or more of the Company’s product line businesses or they operate in similar market segments to the Company. The Committee uses data that it obtains from these companies through surveys, proxy statements and other public filings. In addition, this data is supplemented by survey data provided by an independent third-party compensation consulting firm. The Committee generally benchmarks overall cash compensation between the 50 – 75th percentile of the competitive market. This means that the base salary and annual cash bonus incentive, at target, for executives should fall within the 50 – 75th percentile of the market benchmarks for their respective positions. Equity-based compensation is also targeted at the 50 – 75th percentile of market but may vary depending on the relative number of shares awarded to other executives in order to maintain internal equity amongst executives as well as considering the total number of shares available for grant to executives in a given year. The Committee annually reviews the companies in the Company’s peer group and makes changes as necessary to ensure that its peer group comparisons are appropriate. For fiscal 2008, the Committee determined that the companies listed below were appropriate for inclusion in the Company’s peer group based on several factors, including that the peer companies the Company uses (i) continue to operate in the same general industry and markets in which the Company operates, (ii) are still recognized as competitors from a market share and labor standpoint and, (iii) in some instances, share the same customers as the Company.
143
Table of Contents
The Committee retained a compensation consulting firm in late 2007 to advise on executive compensation and provide survey data from a list of peer group companies. For competitive compensation and employment practices purposes, in 2007 the compensation consulting firm identified the following 14 peer group companies:
| • | Axsys Technologies (later acquired by General Dynamics Advanced I.S. on June 4, 2009) |
| • | CyberOptics |
| • | Electro Scientific Industries |
| • | II-VI Incorporated |
| • | MRV Communication |
| • | Rofin-Sinar Technologies |
| • | Zygo Corporation |
| • | Coherent |
| • | Cymer |
| • | FEI Company |
| • | Keithley Instruments |
| • | Newport Corporation |
| • | Veeco Instruments |
| • | Excel Technology, Inc. (later acquired by the Company on August 20, 2008) |
Certain companies included in the Company’s peer group for fiscal 2007 such as Axsys Technologies and Excel Technology, Inc. were eliminated for fiscal 2008 because they were acquired.
In 2007, the compensation consulting firm provided the Committee with information from their survey and market perspective on selected compensation topics, including executive stock ownership and disposition guidelines, non-qualified deferred compensation practices, equity vesting practices, executive severance practices and claw-back practices. This work was done as part of the Committee’s general practice of reviewing compensation trends on a periodic basis. The Committee relied upon this same information in 2008.
The Committee did not engage its own outside consultant in 2008 because its members felt the information obtained in 2007 was recent enough to be used in combination with supplemental benchmarking data from the Radford Executive Compensation Survey of October 2007 and other supporting information provided by the Company’s management and believed they were adequately experienced and equipped to address the relevant issues. The Committee also believed that outside consultants were unnecessary at that time because its executive officers’ compensation was primarily composed of base salary, bonus and restricted stock grants, and did not include more complex elements such as deferred compensation plans.
The Committee does not believe it is appropriate to set executive compensation levels based exclusively on compensation surveys and benchmarking. Rather, the Committee uses these surveys and benchmarking as tools for internally confirming that the Company’s executive compensation program is, in the aggregate, reasonable in scope, market-competitive, and consistent from year to year. Other important factors that drive compensation decisions include individual qualifications and expertise, responsibility, annual individual performance, particular industry and market conditions of a business segment (e.g. Semiconductor Systems, Precision Technology or Excel Technology, Inc.), and executive performance as a group against both annual and long-term goals, such as the Company Operating Income goal in the 2008 annual cash bonus incentive plans which are described in more detail below under the heading of Annual Cash Bonus Incentive. Finally, the Committee measures performance against the executive team’s success in building shareholder value.
144
Table of Contents
2008 Executive Compensation Overview
Prior to the start of fiscal 2008, the Company’s 2008 financial performance goal was set at $33 million of annual operating income (defined as income before interest income/(expense), other income/(expense) and foreign currency gains and losses excluding restructuring charges) with an established minimum threshold set at $27 million. The Company failed to meet the minimum threshold of $27 million. Consequently, no cash incentive bonuses tied to the attainment of the Company’s 2008 financial performance goal were earned and none were paid.
The aggregate of the annual cash incentive bonus target amount for the NEOs, including the CEO, for 2008 was $1,202,623. The actual bonus amounts earned by the NEOs, including the CEO, were $337,649 or 28.1% of target.
The aggregate of the target number of shares of restricted stock under the 2008 Equity Incentive Plan for NEOs, including the CEO, was 330,000. The actual number of shares granted to NEOs, including the CEO, was 165,000 or 50% of target, after giving effect to the forfeiture of performance-based grants.
Executive Compensation Program Elements
Executive compensation at the Company includes base salary, annual cash bonus incentive compensation, equity-based compensation and, depending on the individual, perquisites and severance benefits. Compensation benefits vary between executives based on the Committee’s determination as to what is appropriate under the policies set forth above.
In fiscal 2008, the compensation for the NEOs was comprised of the following elements, each of which is discussed in greater detail below:
| • | Base salary; |
| • | Annual cash bonus incentive; |
| • | Equity-based compensation; and |
| • | Perquisites and retirement benefits. |
Base Salary
Base salary is compensation for services rendered in the job that the executive was hired to perform. In setting base salary, the Committee considers qualifications and experience, prior employment (including historical compensation), industry knowledge, scope of responsibilities (including potential growth in responsibilities), individual performance, quality of leadership, internal pay equity, survey data, and tax deductibility. No specific weighting is applied to the factors. Salaries are set once per year as part of the compensation review process. Annual increases to salaries, when approved and implemented, are based on individual performance, peer group data and cost of living adjustments. Due to business conditions, there were no annual increases to base salary program implemented in 2009.
Annual Cash Bonus Incentive
Annual cash bonuses are intended to reward executive officers for the achievement of Company financial and/or product line financial performance and performance against MBOs (as hereafter defined) tailored to the executive’s role in the Company. To determine whether, and to what extent, annual cash bonuses are to be paid to the Company’s executive officers, the Company prepares individual Executive Incentive Compensation Plans for executive officers (each, an “Incentive Plan”). Incentive Plans are approved by the Committee each year at its regularly scheduled February or March meeting.
The Incentive Plans for 2008 covered the period from January 1 through December 31 (the “Incentive Period”). The Incentive Plans are designed to establish the financial, operating and qualitative objectives for determining bonus payments to the executive officers if the Company and the executive achieve certain performance goals during the Incentive Period. The target bonuses for the NEOs are tied to a percentage of such executive’s base salary. Target bonus percentages for the NEOs were as follows: Dr. Edelstein, 85%; Mr. Bellantuoni, 40%; Mr. Webb, 40%; Mr. Bowen, 50%; Mr. Stukalin, 50%;
145
Table of Contents
Mr. Federico, 50%; and Mr. Brak, 60%. These target bonus levels were developed based on a number of factors specific to individuals, including reference to historical bonus amounts (both with respect to the executive’s employment with the Company and, in the case of new hires, with respect to the executive’s employment with prior employers), consistency and competitive positioning with respect to other similarly situated Company executives and executives at companies in the Company’s peer group.
For purposes of the Incentive Plans and determining eligibility for target bonuses, various performance goals are established on an individual basis for each executive, and consist of two or more categories. The first category is comprised of the corporate financial goals related to overall profitability, as approved by the Board of Directors in connection with establishing the Company’s annual budget. For 2008, the pre-tax Operating Income threshold of performance in order for an executive to receive a bonus payout in this category was $27 million, excluding restructuring charges. Since the Company’s full year Operating Income achieved was below $27 million, no bonus was payable to any Company executive based on this category and each executive received zero points for this category. If the Company had achieved an Operating Income of $33 million, or 100% of the target level of performance in this category, then the executive would have been awarded 100 points. For Operating Income results of between $27 million and $33 million, the executive would have received a bonus on a pro rata basis using a linear interpolation between 0 points and 100 points. For Operating Income results of greater than $33 million, the executive would receive a bonus on a pro rata basis using a linear extrapolation from 100 points to an uncapped level such that the executive would earn a bonus of one additional point for every $1 million of additional Operating Income above $33 million.
The second category is comprised of the revenue and gross margin goals of individual product lines. This second category is only used in the case of executives having operational or product line business responsibilities.
A third category is comprised of personal objectives, or “MBOs,” which are quantitative or qualitative strategic goals related to areas such as customer success, target market leadership, operational excellence, development of personnel, product development, product revenue goals, and management of product inventory, or, for those executives who work in other functional areas of the Company, Days Sales Outstanding goals, organizational restructuring or specific staffing goals. Specific strategic MBOs for 2008 included: market share improvement or retention for Semiconductor Systems product lines; new product development for Lasers, Scanners and Encoders; new product revenue growth for all Precision Technology product lines; organizational restructuring for Lasers and Spindles product lines; and M&A initiatives for corporate functions, including the successful acquisition of Excel.
Lastly, a discretionary bonus component may be included in an executive’s Incentive Plan weighted not more than 30% of the total Incentive Plan bonus target. This discretionary bonus component is to be determined by the CEO, subject to Committee approval, at the end of the measurement period based on overall contribution by such executive to the Company’s results and other factors considered in the execution of their responsibilities not otherwise specified or quantified in the individual’s Incentive Plan. The Committee has the authority to award a discretionary bonus to the CEO with supporting justification. In 2008, there was no discretionary bonus award made to the CEO.
Cash bonuses are intended to be earned based on performance against goals which enhance shareholder value by ensuring a substantial portion of the bonus plan is based upon the achievement of Company financial goals which are set at levels the Committee feels are challenging to achieve, but fair. For Executives with responsibility for an operating division, the combination of Company Operating Profit and Product Line financials represents 60 – 70% of their target bonus. The Company Operating Profit goal for Division Executives is generally set between 5% and 15% higher than the Company’s operating plan based on business conditions, market conditions and other economic factors. For non-operating division Executives, the Company Operating Profit goal generally represents between 30 – 50% of their target bonus. Additionally, MBOs are created to achieve goals over and above an NEO’s core position requirements. The establishment of MBOs is based on an agreed upon set of priorities between the CEO and the executive, approved by the Committee, that support the Company’s overall business priorities for a particular plan year.
The table below describes the structure of the 2008 executive incentive plans for the Company’s NEOs. For actual bonus amounts paid under these plans in 2008, refer to the Summary Compensation Table.
| Name |
Company Operating Profit (1) |
Product Line Revenue & Gross Margin |
Personal Objectives/ MBOs |
Discretionary | Other | Total Potential (2) | ||||||||||
| Executive Officers |
||||||||||||||||
| Sergio Edelstein, Ph.D. |
60 | % | — | 40%(3) or 30%(3) |
— | — | 100% or 90% | |||||||||
| Philippe Brak |
20 | % | 80 | %(4) | 20% | 20 | % | — | 140% | |||||||
| Stephen Webb |
20 | % | 100 | %(5) | 10% | 20 | % | — | 150% | |||||||
| Anthony Bellantuoni |
30 | % | — | 50% | 20 | % | — | 100% | ||||||||
| Former Executive Officers |
||||||||||||||||
| Robert Bowen |
60 | % | — | 20% | 20 | % | 30 | %(6) | 130% | |||||||
| Felix Stukalin |
— | — | 20% | 30 | % | 250 | %(7) | 300% | ||||||||
| Nino Federico |
60 | % | — | 20% | 20 | % | — | 100% | ||||||||
146
Table of Contents
| (1) | The maximum potential payouts under the Company operating profit bonus objective in 2008 were unlimited to the extent the Company’s actual operating profit exceeded the target. Irrespective of the unquantifiable nature of the maximum estimated possible payout, the operating profit target was not met in 2008. Accordingly, the percentages reflected represent the targeted achievement level. |
| (2) | Based on respective annual cash target incentive bonus opportunity. |
| (3) | Dr. Edelstein could earn up to 40% of his target bonus for the successful completion of the Excel acquisition. To the extent that the Board of Directors approved a decision not to proceed with the Excel acquisition during 2008 and/or the Excel acquisition was not completed due to factors external to the Company’s control, then Dr. Edelstein could instead earn up to 30% of his target bonus by securing approval by the Board of Directors for an alternate strategy that maximizes return to the Company’s shareholders and starting such strategy by the end of 2008. |
| (4) | Mr. Brak could earn up to 80% of his target bonus based on product line performance of the Company’s Lasers business. |
| (5) | Mr. Webb could earn up to 100% of his target bonus based on product line performance of the Company’s Spindles business. |
| (6) | Mr. Bowen could earn an additional bonus opportunity of 30% of his target bonus for the successful completion of the Excel acquisition. |
| (7) | This target is dependent on the successful completion of the Excel acquisition and any other planned strategic actions involving mergers and acquisitions, joint ventures and divestitures. |
Furthermore, specific personal objectives/MBOs and bonus awards earned under the personal objectives/MBOs and discretionary components for NEOs in 2008 were as follows:
Sergio Edelstein:
Personal Objectives/MBOs – representing 40%/30% of Target Annual Cash Bonus Incentive Plan
Dr. Edelstein was awarded 100% achievement for the successful acquisition of Excel Technology, Inc. Acting on Dr. Edelstein’s recommendation, the Committee postponed the payment of the bonus, as explained below.
Discretionary component – There was no discretionary component included in Dr. Edelstein’s 2008 Annual Cash Bonus Incentive Plan.
Philippe Brak:
Personal Objectives/MBOs –representing 20% of Target Annual Cash Bonus Incentive Plan
| 1. | New Product sales growth with focus on Fiber laser sales. |
| 2. | Sell Excimer, Impact, and Impact 3000 product lines. |
| 3. | Secure CEO approval for restructuring plan to streamline Rugby organization based on product line reduction. |
| 4. | Execute Restructuring Plan. |
Mr. Brak was awarded 75% achievement of this category representing 15% of total target bonus amount for the successful sale of select laser product lines, for the restructuring and reduction of staff in the Novi, Michigan facility, for the overall Rugby, UK restructuring effort and execution of the plan, for supporting the Company’s integration of certain Excel Technology product lines in Europe and Japan and for his efforts in supporting other Company-wide initiatives.
Discretionary component – representing 20% of Target Annual Cash Bonus Incentive Plan
Mr. Brak was awarded 50% achievement for this item representing 10% of total target bonus amount for his efforts and contributions in restructuring the organization and effecting cost reductions during a significant industry market
147
Table of Contents
downturn followed by the worldwide economic recession. When Mr. Brak joined the Company in January 2008, he inherited an organization that required significant rebuilding of customer, supplier and employee relationships. He was instrumental in establishing a plan to right size the organization, eliminate unnecessary inventory, identify products no longer viable in the market and executing this plan. He also began the process of relocating certain laser products from the UK to China where they could be manufactured closer to the customer base and at a lower overall cost.
Stephen Webb:
Personal Objectives/MBOs –representing 10% of Target Annual Cash Bonus Incentive Plan
| 1. | Transform Westwind culture from manufacturing-centric to one centered on technology innovation and end-user applications. |
| 2. | Meet quarterly Company forecasting accuracy metrics. |
| 3. | Support and/or lead all key Company-wide initiatives. |
Mr. Webb was awarded 50% achievement toward item 1 above representing 2% of total target bonus amount for making good progress in the culture transformation, for additional applications work completed with several examples of new technology and for successfully hiring an individual to assume the vacated position of Technical Director.
Discretionary component – representing 20% of Target Annual Cash Bonus Incentive Plan
Mr. Webb was awarded 50% achievement for this item representing 10% of total target bonus amount for his efforts and contributions in restructuring the organization and effecting cost reductions during a significant industry market downturn followed by the worldwide economic recession. He also provided valuable support in the process of relocating certain laser products from the UK to China.
Anthony Bellantuoni:
Personal Objectives/MBOs –representing 50% of Target Annual Cash Bonus Incentive Plan
| 1. | Leadership Development: develop a Leadership Pipeline by: Conducting Hogan Leadership Forecast Challenge Report and Hogan Personality inventory for all Senior Management. |
| 2. | Develop a Succession Planning tool. |
| 3. | College Recruitment: Establish new college graduate hiring program. |
| 4. | Compensation and Benefits: Build a total compensation plan profile for all employees from the new HRIS system. |
| 5. | Investigate Stock option plan use and employee stock purchase/ownership plans. |
| 6. | Conduct an employee benefits analysis for all current and planned International locations. |
Mr. Bellantuoni was not awarded a bonus under this category. Based on the unanticipated and significant change in the Company’s priorities due to market downturn, business deterioration and economic conditions, Mr. Bellantuoni’s focus shifted to organization restructuring, cost reduction and containment and managing a worldwide Reduction in Force. Therefore, although MBOs, in large part, were not met, the Committee determined that it would be more appropriate to consider awarding Mr. Bellantuoni a bonus within the discretionary component.
Discretionary component – representing 20% of Target Annual Cash Bonus Incentive Plan
Mr. Bellantuoni was awarded 50% achievement for this item representing 10% of total target bonus amount for his efforts and contributions completing leadership surveys for Senior Management, implementing a worldwide HRIS system and shifting focus and priorities from staffing, recruiting, employee development and benefits audits to the Company’s priorities of restructuring the organization and effecting cost reductions during a significant industry market downturn followed by the worldwide economic recession.
Robert Bowen:
Personal Objectives/MBOs –representing 20% of Target Annual Cash Bonus Incentive Plan
| 1. | Ensure 100% accuracy, integrity, and timeliness of all Company’s periodic reports and all other financial statements, and 100% compliance to SOX and other regulatory requirements. |
| 2. | Support, lead and/or co-lead Company’s M&A initiatives, as needed (shared). |
148
Table of Contents
| 3. | Meet quarterly Company forecasting accuracy metrics (shared): |
| 4. | Support and/or lead all key Company-wide initiatives. |
Mr. Bowen was awarded 100% achievement for this item representing 20% of total target bonus amount based on centralizing the finance and accounting functions, cost reduction initiatives for the Company on a global scale as well as within the finance and accounting departments, his role in divesting the US Optics division in Moorpark, CA and his efforts in the annual budget planning process.
Discretionary component – representing 20% of Target Annual Cash Bonus Incentive Plan
Mr. Bowen was not awarded a bonus under this category. Based on Mr. Bowen’s overall performance during 2008, the Company’s financial performance and the fact that he terminated from the Company effective October 2008, the Committee determined that it was not appropriate to award Mr. Bowen any bonus based on this component.
Other
In addition to the other components of his 2008 Annual Cash Bonus Incentive Plan, Mr. Bowen was eligible to receive a bonus representing 30% of the total target bonus amount for the successful acquisition of Excel, which was achieved in 2008.
Felix Stukalin:
Personal Objectives/MBOs –representing 20% of Target Annual Cash Bonus Incentive Plan
| 1. | Implement, track and report new key metrics for revenue derived from new products and a metric for design wins achieved for precision technology components product lines. |
| 2. | Establish a formal Company-wide patent review process that supports the creation of unique differentiated IP to enable market leadership in key segments. |
| 3. | Support and/or lead all key Company-wide initiatives. |
Mr. Stukalin was not awarded a bonus under this category.
Discretionary component – representing 30% of Target Annual Cash Bonus Incentive Plan
Mr. Stukalin was not awarded a bonus under this category. Based on Mr. Stukalin’s overall performance during 2008, the Company’s financial performance and the fact that he terminated from the Company effective August 2008, the Committee determined that it was not appropriate to award Mr. Stukalin any bonus based on the discretionary component.
Other
In addition to the other components of his 2008 Annual Cash Bonus Incentive Plan, Mr. Stukalin was eligible to receive a bonus representing up to 200% of the total target bonus amount for identifying and securing Board of Director approval of a new acquisition, joint venture or merger, newly conceived by him that has a very significant positive impact on the Company’s strategic future direction. This was not achieved in 2008 and no bonus was awarded to Mr. Stukalin for this element.
Nino Federico:
Personal Objectives/MBOs –representing 20% of Target Annual Cash Bonus Incentive Plan
| 1. | Establish and organize world-class manufacturing operation in new Bedford facility. |
| 2. | Ensure Product Line Managers meet their financial and strategic objectives. |
| 3. | Meet quarterly Company forecasting accuracy metrics. |
| 4. | Support and/or lead all key Company-wide initiatives. |
Mr. Federico did not achieve his MBOs and was not awarded a bonus under this category.
149
Table of Contents
Discretionary component – representing 20% of Target Annual Cash Bonus Incentive Plan
Mr. Federico was not awarded a bonus under this category. Based on Mr. Federico’s overall performance during 2008, the Company’s financial performance and the fact that he terminated from the Company effective August 2008, the Committee determined that it was not appropriate to award Mr. Federico any bonus based on the discretionary component.
The CEO recommends to the Committee executive incentive compensation for subordinate officers, and the Committee determines the CEO’s incentive compensation. The Committee determines performance against goals, based in part on input from the CEO for officers other than the CEO.
The CEO assesses each executive officer’s contribution to the overall operational plan and to the executive officer’s specific functional unit. The CEO periodically reviews each executive officer’s progress towards achieving his or her individual goals with the other members of the Company’s senior management team and with the Board of Directors. Prior to making a final recommendation regarding the attainment or non-attainment of each executive officer’s individual goals, the CEO consults with the Committee.
In 2008, the CEO assessed and recommended, and the Committee approved, the bonus amounts earned for executive officers using a score card designed to assist in this process by listing the specific bonus elements for each executive, each bonus element’s weighting in the Incentive Plan and a section to score performance of each bonus component. The Committee used this same mechanism to assess and determine the CEO’s bonus amount earned. In 2008, the Company did not achieve the minimum threshold of $27 million established for the Company’s Operating Income. Accordingly, no portion of the bonuses was earned for achievement of this element.
For 2009, the Committee has approved a Management Bonus Plan that applies to Operating Business Unit General Managers (i.e. Stephen Webb for the Spindles Business and Philippe Brak for the Lasers Business) that pays quarterly bonuses that correlate with contributed profits, plus a discretionary factor taking into account strategic initiatives, new products, and potential of the team and of the business unit. The Committee has delegated authority to the CEO to administer the 2009 Management Bonus Plan and to determine appropriate discretionary factors. The general terms of such Management Bonus Plan are as follows:
| • | Bonuses will be payable to the operating divisions that generate and contribute profits for a particular business quarter. |
| • | A range of approximately 1.5% to 5% of the division’s profits will be allocated to a bonus pool to be paid to that division’s key managers/contributors, including the General Manager, with a range of 25% to 60% of that amount to be paid to the General Manager based on the size and nature of the division’s business, the amount of profits generated, consistency of achieving quarterly profitability and positive cash flow from operations at the determination of the CEO. |
| • | The variations of these percentage allocations may vary by operating division and by quarter as they also take into account the strategic role and complexity of the businesses, the growth potential, the progress made on new product development and team building, the Division President/GM’s individual role and impact, historical bonus data, and other factors. |
| • | Target bonus pool amounts for each division are determined mostly from historical performance results. When a division has sustained a consistent level of profitability, a similar percentage of profits may be allocated for bonus payouts. In the case of a division that has not participated in this program in the past, the CEO will apply the factors mentioned above to determine an appropriate level of bonus pool to allocate to the division. |
Equity-Based Compensation
The Company uses equity-based compensation to align executive compensation with long-term goals that enhance shareholder value. Equity grants are also intended to promote executive retention with the Company by extending vesting periods over several years. Since 2006, the Company has not granted any stock options, opting instead to issue time- and performance-based restricted stock grants. Time-based restricted stock grants are intended to permit an executive to build equity in the Company in exchange for continuous service during the vesting period. Performance-based restricted stock grants are intended to reward the executive team as a whole for accomplishing financial goals that enhance shareholder value. Restricted stock grants deliver to the recipient a right to receive a specified number of shares of the Company’s common stock upon vesting. The Company values its restricted stock grants at the fair value of its common stock on the grant date, which is the closing price of the Company’s common stock on that date.
In 2008, NEOs received 50% of their total target equity grant value in the form of performance-based restricted shares to further the Company’s pay-for-performance philosophy based on achievement of Company Operating Income goals established at the beginning of each business plan year and 50% in the form of time-based restricted shares. The performance-based restricted shares, if earned, would have vested in equal annual installments over three years, subject to
150
Table of Contents
achievement of the performance goals. Restricted shares granted as time-based awards will automatically vest in equal installments over a three year period upon each yearly anniversary of the grant date. The Company did not meet the financial targets in 2008 and all performance-based shares were forfeited as of December 31, 2008.
Details of the 2008 Restricted Stock Award structure and vesting schedule are provided below. In this example, the Company granted to the recipient an aggregate of up to thirty-four thousand five hundred (34,500) shares of Common Stock in consideration of his/her performance of future services, and on the terms and conditions of a specific Restricted Stock Agreement and all other applicable terms and conditions of the 2006 GSI Equity Incentive Plan.
Total Share Grant: Up to 34,500 restricted shares (depending on 2008 financial performance)
Allocation of Time-Based vs. Performance-Based Shares:
| Time-Based Restricted Shares:
|
12,500 or 50% of Total Base Grant | |
| Performance-Based Restricted Shares:
|
12,500 or 50% of Total Base Grant | |
| Total Base Share Grant:
|
25,000 | |
| Contingent Performance Kicker (OP > 10.4%)
|
9,500 | |
| Total Available Grant |
34,500 |
The number of performance-based restricted shares earned by participants was determined according to the following table where Operating Profit achievement of 10.3% equals 100% performance.
| Operating Profit % |
% of Total Base Shares Granted | |
| 11.5% |
88% | |
| 11.4% |
85% | |
| 11.3% |
82% | |
| 11.2% |
79% | |
| 11.1% |
75% | |
| 11.0% |
72% | |
| 10.9% |
69% | |
| 10.8% |
66% | |
| 10.7% |
63% | |
| 10.6% |
60% | |
| 10.5% |
56% | |
| 10.4% |
53% | |
| 10.3% |
50% | |
| 4.6%<OP<10.3% |
(1) | |
| Under 4.6% |
0% |
| (1) | From 4.6% Operating Profit to 10.3% Operating Profit, the percentage of Total Base Shares Granted shall be determined by linear interpolation starting at 25% (at 4.6% Operating Profit) and ending at 50% (at 10.3% Operating Profit). |
| Vesting Schedule |
Grant Date March 14, 2008 |
First Anniversary (1) |
Second Anniversary |
Third Anniversary | ||||
| Time-Based Shares |
Escrow | 4,166 (if employed) |
4,167 (if employed) |
4,167 (if employed) | ||||
| Performance-Based Shares |
Escrow | Up to 7,333 (if earned) |
Up to 7,333 (if earned) |
Up to 7,334 (if earned) |
| (1) | Shares will vest 1/3 annually commencing on March 14, 2009 provided all other conditions to vesting are met. |
151
Table of Contents
When establishing equity grant levels for 2008, the Committee considered general corporate performance, number of shares available for distribution under the relevant Equity Incentive Plan, individual performance, regulatory changes affecting the Company’s cost and accounting for granting equity, prior grants, if any, to executives, competitive conditions with respect to key talent and comparable company grants to comparable executives using information obtained from the compensation consulting firm in their 2007 report and other sources such as the Radford Executive Compensation Survey and Equilar, executive seniority and experience, the dilutive impact of the grants, previous grant history for each executive, vesting schedules of outstanding equity-based grants, the current stock price and individual contributions to the Company’s financial, operational and strategic objectives and, with respect to grants made to individuals other than the CEO, the CEO’s recommendations.
It is the Company’s practice to make an initial equity-based grant to all executives at the time they commence employment in an amount that is consistent with those granted to executive officers within the Company and in the industry at similar levels of seniority using information obtained from the compensation consulting firm in their 2007 report and other sources such as the Radford Executive Compensation Survey, Culpepper Executive Compensation benchmark data and Equilar. In addition, the Company typically makes an annual grant of equity-based compensation to executives during the first fiscal quarter of each year.
Perquisites and Retirement Benefits
In addition to the elements of compensation discussed above, the Company offers the executive officers contributions towards health, dental, life, accidental death and dismemberment, and disability insurance premiums. The Company does not offer a deferred compensation program, nor does it offer retirement benefits other than a 401(k) defined contribution plan for US-based executives and comparable local country competitive retirement savings benefits for non-US-based executives. In 2008, the Company matched 100% of contributions made by executive officers to the 401(k) plan up to a maximum of 5% of the executive officer’s earnings as defined in the 401(k) plan document, not to exceed $8,500. In 2008, the Company matched 100% of contributions made by executive officers to the retirement savings benefits plan in the United Kingdom up to a maximum of 8% of the executive officer’s earnings as defined in the associated plan document. Executives may also receive perquisites including, in various cases, a car allowance, tax preparation fee reimbursement, supplemental disability insurance, and other benefits, all of which are detailed in the Summary Compensation Table below.
Use of Tally Sheets
To facilitate the Committee’s review of each of the elements of the compensation paid to the executive officers, management provided the Committee with “tally sheets” detailing each executive officer’s total compensation, including salary, bonus and long-term equity incentive grants. Tally sheets also set forth relevant compensation plan terms, individual performance goals and stock vesting terms. Finally, tally sheets include executive compensation survey data, generally obtained from the annual Radford Executive Compensation Survey, as well as the executive’s then current stock ownership position in the Company. The Committee uses these tally sheets to ensure that the total amount of compensation paid to the executive officers is consistent with the Company’s compensation philosophy, rather than focusing only on the base salaries and bonuses of the executive officers.
2008 Executive Compensation
The amounts paid to NEOs in the fiscal year ended December 31, 2008 are detailed in the compensation tables that follow this section. This section should be read in conjunction with the Executive Compensation Program Elements section above.
2008 NEO salaries were set based on individual performance, scope of responsibility and experience, tenure and peer pay data. Base salaries generally fell around the mean paid by peers in comparable positions based on the Radford Executive Compensation Survey data, where a comparable benchmark position was included in the survey and consequently data was available for the position in question. If no comparable benchmark position was available for comparison, salaries were determined based on prior compensation plus salary movement in the market generally, as well as internal equity amongst other GSI peers. The Committee used comparable peer data for CFO, VP, Human Resources, General Counsel, VP, Business Development and Business Unit Leader or Subsidiary Manager benchmarks for similar positions in connection with its determination of the respective 2008 NEO salaries. Base salary is not contingent upon overall Company-wide financial performance, although projected financial performance can affect the timing or amount of any subsequent salary increases.
2008 NEO cash incentive plan bonuses were paid based on the achievement of financial and individual performance against MBOs, as detailed above. For purposes of the Incentive Plans, the 2008 overall Company financial performance goal was set at $33 million of annual Operating Income (defined as income before interest income/(expense), other
152
Table of Contents
income/(expense) and foreign currency gains and losses excluding restructuring charges) with an established minimum threshold set at $27 million. Points towards target bonuses would be awarded on a linear interpolation scale between $27 million of Operating Income and $33 million of Operating Income, and the ability to earn points above $33 million was uncapped. For the fiscal year ended December 31, 2008, and prior to giving effect to the restatement of the Company’s financial statements as set forth in this Annual Report on Form 10-K, the Company had an operating loss of $17.6 million based on unaudited results as provided by the corporate finance department, resulting in a weighted score of 0% for financial goals. As a result, no bonuses or equity awards were awarded for financial performance in 2008. For purposes of determining achievement of cash incentive plan bonuses, the Company’s 2008 operating income, product line revenue and gross margin were all calculated prior to completion of the Revenue Review and without giving effect to the restatement of the Company’s financial statements because it was not clear at that time when the Revenue Review would be completed. No bonuses to executives were earned in these categories in 2008 and any other bonus payments earned under the Incentive Plans were deferred for payment until the successful filing of the Company’s financial statements.
The remaining portion of the available cash incentive bonus opportunity was based on achievement of individual MBOs, with the Committee retaining the discretion to award additional cash bonuses for exceptional individual performance or in consideration of specific achievements not planned or anticipated at the time the bonus objectives were established. For the fiscal year ended December 31, 2008, the Committee only exercised discretion as discussed above with respect to the discretionary portion of the cash incentive awards, where applicable. Executives that had principal responsibility for a product group were given MBOs that were heavily skewed towards product group financial and market share performance. For example, Steven Webb’s and Philippe Brak’s MBOs included meeting quarterly forecasting accuracy metrics, execution of an organizational restructuring plan for their respective product line groups and new product introduction and/or growth. Executives without direct product line responsibility were given non-financial MBOs that advanced their particular areas of responsibility. These included, but were not limited to, timely closing of monthly financials, accuracy of forecasting, reduction of worldwide inventory, support of Company-wide initiatives and support of M&A activities.
Under the Company’s 2008 long term incentive plan (“LTIP”), NEOs, including the CEO, were granted restricted stock following the Committee’s approval. The grants of restricted stock to NEOs during 2008 (as detailed in the table below) were subject to vesting as follows: 50% of the restricted stock grants were subject to time-based vesting and 50% of the restricted stock grants were subject to performance-based vesting. The time-based restricted share grants vest equally over three years, beginning with the first anniversary of the grant, which is consistent with the Committee’s belief that time-based grants are intended to incentivize participants for continuing service to the Company, and to insure that individuals develop an ownership interest in the Company. The 2008 performance-based restricted share grants were dependent on meeting a minimum performance level of the Company’s Operating Income, as described above, which was not achieved. Earned awards vest one-third annually over three years, beginning with the first anniversary of the year in which the award is granted. Operating profit was calculated exclusive of amortization charges associated with acquisitions, acquired in-process R&D and non-recurring restructuring charges. The Committee retained discretion to adjust operating profit targets in the event of a business disposition, but did not invoke its discretion during 2008. The Company did not meet the financial targets in 2008 and all performance-based shares were forfeited as of December 31, 2008.
The Company made the following awards of restricted shares to its NEOs during the year-ended December 31, 2008:
3/14/08 Grant
| Total Number of Shares Granted |
Total Number of Shares Vested (1) |
Total Number of Shares Forfeited |
Total Number of Shares Earned but not Vested (2) | |||||||||||||||
| Name |
Time Based |
Performance Based |
Time Based |
Performance Based |
Time Based |
Performance Based |
Time Based |
Performance Based | ||||||||||
| Executive Officers |
||||||||||||||||||
| Sergio Edelstein, Ph.D. |
75,000 | 132,000 | — | — | — | 132,000 | (3) | 75,000 | — | |||||||||
| Philippe Brak |
25,000 | 44,000 | — | — | — | 44,000 | (3) | 25,000 | — | |||||||||
| Stephen Webb |
12,500 | 22,000 | — | — | — | 22,000 | (3) | 12,500 | — | |||||||||
| Anthony Bellantuoni |
12,500 | 22,000 | — | — | — | 22,000 | (3) | 12,500 | — | |||||||||
| Former Executive Officers |
||||||||||||||||||
| Robert Bowen |
22,500 | 39,600 | — | — | 22,500 | (4) | 39,600 | (4) | — | — | ||||||||
| Felix Stukalin |
— | — | — | — | — | — | — | — | ||||||||||
| Nino Federico |
17,500 | 30,800 | — | — | 17,500 | (5) | 30,800 | (5) | — | — | ||||||||
153
Table of Contents
| (1) | As of December 31, 2008, no restricted shares granted on March 14, 2008 have vested. |
| (2) | All restricted shares in this column vest in three equal installments on March 14, 2009, March 14, 2010 and March 14, 2011 provided that the executive remains employed at the Company on the vesting dates. |
| (3) | These restricted shares were forfeited on December 31, 2008. |
| (4) | These restricted shares were forfeited on October 27, 2008 upon termination of employment. |
| (5) | These restricted shares were forfeited on August 29, 2008 upon termination of employment. |
Executive Severance Practice
In a letter report dated February 1, 2008, an independent third-party compensation consulting firm provided the Committee with competitive data with respect to security arrangements in change-in-control (CIC) and separation situations for CEOs and NEOs for use in considering executive severance matters in 2008. The consulting firm gathered peer group data from recently filed proxy statements, employment agreements and/or offer letters and CIC documents with respect to severance matters, including amounts and structure of severance payments, treatment of equity awards (including acceleration of vesting), benefits continuation, and payments in connection with termination without cause or upon CIC. In the case of the CEO, the Committee used this information and subsequently reviewed with the Board of Directors a proposal to clarify, via an updated Termination and Change-In-Control Agreement, the terms and conditions of Dr. Edelstein’s severance arrangement, which were originally contained in his employment offer letter dated June 1, 2006. The Board of Directors and the Committee approved and implemented, effective February 3, 2009, a Termination and Change-In-Control Agreement for Dr. Edelstein, as described below, which contained terms aimed at providing Dr. Edelstein with a severance package similar to that of his peers. In establishing Dr. Edelstein’s revised severance arrangement, the Committee approximated the midrange of the parameters from the consulting firm’s competitive report.
2008 CEO Compensation
The Committee approved a 2008 compensation package for Dr. Sergio Edelstein on February 5, 2008. The package included the following components: (1) Base Salary: $520,000; (2) Annual incentive cash bonus opportunity: 85% of Base Salary; and (3) 2008 LTIP base share grant of 150,000 restricted stock shares. Dr. Edelstein’s LTIP grant includes a 75,000 time-based restricted stock grant that vests in three annual installments, beginning on March 14, 2009. The remaining 75,000 performance-based restricted stock grant vests based on the Company meeting operating income targets in 2008. The maximum number of performance-based shares that could be earned in this grant including the maximum contingent performance kicker is 132,000 shares. Any shares earned will then vest in three equal annual installments, beginning on March 14, 2009. The Committee reviewed the Company’s 2008 operating income from unaudited results (without giving effect to the restatement of the Company’s financial results), against approved goals and Dr. Edelstein’s performance against his 2008 individual MBO, which was the successful acquisition of Excel Technology, Inc. Based on this assessment of performance against goals, since the Company did not achieve the minimum Operating Income performance level for bonus payment achievement, the Committee awarded Dr. Edelstein 0% for the corporate financial performance bonus component and 100% of his individual MBO opportunity as a result of the successful acquisition of Excel Technology, Inc. in 2008. Acting on Dr. Edelstein’s recommendation, the Committee postponed the payment of the bonus. On February 23, 2009, as later clarified in January 2010, the Committee approved the payment of the bonus to Dr. Edelstein to occur on the earlier of the following dates:
| 1. | The date upon which all of the Company’s delayed periodic reports have been filed with the SEC, provided that such filings are completed in 2009, in which case the bonus monies earned by Dr. Edelstein in 2008 will be paid together in 2010 not later than March 15, 2010; or |
| 2. | The date upon which a Change-In-Control (as defined in the Termination and Change-In-Control Agreement, dated February 3, 2009, which shall include, for the avoidance of doubt, the Effective Date (as defined in the Third Modified Joint Chapter 11 Plan of Reorganization for MES International, Inc., GSI Group Corporation and the Company, dated April 9, 2010, as may be modified) of the Company’s chapter 11 plan of reorganization) occurs, whenever such event occurs, in which case the bonus monies earned by Dr. Edelstein in 2008 will be paid on such date. |
The Committee has reviewed Dr. Edelstein’s level of compensation compared to the compensation of other chief executive officers using information provided by an independent compensation consulting firm and the 2007 Radford Executive Compensation Survey and determined that it is reasonable since the Committee conducted an extensive search and obtained relevant competitive compensation information in the process leading up to hiring Dr. Edelstein in July 2006. In establishing Dr. Edelstein’s compensation level for 2008, the Committee relied upon the information provided by the compensation consulting firm, market salary movements and the 2007 Radford Executive Compensation Survey.
154
Table of Contents
The Compensation Calendar
The standard compensation cycle calls for the CEO to present a draft strategic plan presentation to the Committee at the October Committee meeting. The presentation includes a draft three-year strategic plan and LTIP. Based on Committee feedback, a final strategic plan and LTIP proposal is submitted for approval at the December Board of Directors meeting. Starting in January, the Committee solicits private CEO performance feedback from each Board member with respect to the CEO’s performance evaluation for the prior year. The CEO submits a self evaluation which is circulated and discussed by the Committee members. At the February Committee meeting, the CEO provides the Committee with a detailed executive team compensation proposal, including performance reviews for the prior year, proposed bonus payouts based on performance, new objectives for the coming year and proposed LTIP grants. In advance of the meeting, the Committee is provided with individual compensation tally sheets, individual performance reviews, and annual compensation survey data. Based on Committee approval and recommendation, individual compensation packages for the coming year are then approved and presented at the February Board of Directors meeting. As part of this process, management completes individual performance reviews in January, which are used to calculate bonus and incentive compensation payments. Those recommendations are presented to the Committee in February for approval. In the event that payments are contingent upon meeting a financial goal, payments are made only after the audited year-end financial results are released in March.
Tax and Accounting Implications
The Company’s compensation programs are affected by each of the following:
| • | Accounting for Stock-Based Compensation: The Company accounts for stock-based compensation in accordance with the requirements of Statement of Financial Accounting Standards No. 123 (Revised 2004), Share-Based Payment (SFAS No. 123 (R)). The Company also takes into consideration SFAS No. 123 (R) and other generally accepted accounting principles in determining changes to policies and practices for its stock-based compensation programs. |
| • | Section 162(m) of the Internal Revenue Code (IRC): This section limits the deductibility of compensation for the Company’s chief executive officer and its four other most highly compensated named executive officers unless the compensation is less than $1 million during any fiscal year or is “performance-based” under Section 162(m). The Company periodically reviews the potential consequences of IRC Section 162(m), and it generally intends to structure the performance-based portion of executive compensation, where feasible, to comply with exemptions in IRC Section 162(m) so that the compensation remains tax deductible to the Company. The Committee in its judgment may; however, authorize compensation payments that do not comply with the exemptions in IRC Section 162(m) when it believes that such compensation is appropriate and in the best interests of the stockholders after taking various factors into consideration, including business conditions and the performance of such executive officer. |
EXECUTIVE OFFICER COMPENSATION
Summary Compensation Table
The following table sets forth information regarding the compensation earned during the fiscal years ended December 31, 2008, 2007 and 2006 by each of the Company’s NEOs. The NEO’s consist of: (i) the individuals who served as the Chief Executive Officer and Chief Financial Officer during the year ended December 31, 2008, (ii) the three most highly compensated executive officers other than the Chief Executive Officer and Chief Financial Officer who were serving as of December 31, 2008 and (iii) two additional former executive officers for whom disclosure would have been provided pursuant to subsection (ii) above but for the fact that those individuals were not serving as executive officers of the Company as of December 31, 2008.
155
Table of Contents
| Name and Principal Position (a) |
Year (b) |
Salary ($) (c) |
Bonus ($)(1) (d) |
Stock Awards ($)(2) (e) |
Non-Equity Incentive Plan Compensation ($)(3) (g) |
All
Other Compensation ($)(8) (i) |
Total ($) (j) | |||||||||
| Executive Officers |
||||||||||||||||
| Sergio Edelstein, Ph.D. |
2008 | 514,000 | — | 1,261,290 | (9) | 176,800 | (4) | 21,997 | 1,974,087 | |||||||
| 2007 | 495,385 | — | 1,188,698 | 333,937 | 141,445 | 2,159,465 | ||||||||||
| 2006 | 219,231 | — | 292,979 | 201,044 | 104,723 | 817,977 | ||||||||||
| Philippe Brak |
2008 | 250,962 | 25,000 | 54,000 | (10) | 37,500 | (5) | 461,855 | 829,317 | |||||||
| Stephen Webb |
2008 | 251,417 | — | 145,854 | (11) | 12,762 | (6) | 37,476 | 447,509 | |||||||
| 2007 | Not a NEO | |||||||||||||||
| 2006 | Not a NEO | |||||||||||||||
| Anthony Bellantuoni |
2008 | 215,880 | — | 162,298 | (12) | 8,736 | (7) | 24,575 | 411,489 | |||||||
| 2007 | Not a NEO | |||||||||||||||
| Former Executive Officers |
||||||||||||||||
| Robert Bowen |
2008 | 253,350 | — | 36,406 | (13) | — | 450,216 | 739,972 | ||||||||
| 2007 | 300,641 | 100,000 | 177,094 | 117,543 | 27,706 | 722,984 | ||||||||||
| 2006 | 290,000 | — | 69,591 | 142,535 | 31,039 | 533,165 | ||||||||||
| Felix Stukalin |
2008 | 167,549 | — | 24,756 | (14) | — | 443,178 | 635,483 | ||||||||
| 2007 | 246,497 | 100,000 | 116,465 | 74,730 | 20,746 | 558,438 | ||||||||||
| 2006 | Not a NEO | |||||||||||||||
| Nino Federico |
2008 | 171,974 | — | 31,796 | (15) | — | 428,311 | 632,081 | ||||||||
| 2007 | 251,742 | 100,000 | 156,609 | 124,113 | 8,500 | 640,964 | ||||||||||
| 2006 | 240,000 | — | 63,264 | 181,200 | 8,500 | 492,964 | ||||||||||
| (1) | Amounts shown exclude performance-based incentive payments which are included in “Non-Equity Incentive Plan Compensation”. Amount shown for Mr. Brak in 2008 represents a one-time signing bonus earned by and paid to Mr. Brak in 2008. Amounts shown for Messrs. Bowen, Stukalin and Federico in 2007 represent a $100,000 retention bonus offered to executives in connection with the 2006 CEO transition which was paid on July 10, 2007. The associated retention agreements provided for the payment of $100,000 if the executive remained in their position through July 10, 2007, or twelve months following the commencement of Dr. Edelstein’s employment on July 10, 2006. |
| (2) | Amounts shown represent share-based compensation expense recognized for financial statement reporting purposes (disregarding an estimate of forfeitures related to service-based vesting conditions) under Statement of Financial Accounting Standards No. 123 (Revised 2004), Share-Based Payment (SFAS No. 123 (R)). Amounts shown include compensation cost recognized in the Company’s financial statements with respect to awards granted in previous fiscal years and the current fiscal year and are based on the stock price on the date of grant. Amounts shown do not correspond to the actual value that will be recognized by the Named Executive Officers. The stock price as of December 31, 2008 was $0.57. With regard to individuals whose employment was terminated, the amounts shown in the year of termination reflect the impact to cumulative compensation expense associated with awards actually vested through the date of termination. For restricted stock awards, the amount shown is based on the total value of the shares granted based on the closing stock price on the grant date. The Company has not granted options to purchase shares of the Company’s common stock since January 1, 2006. Since the commencement of his employment with the Company, Dr. Edelstein was awarded stock grants totaling 580,794 restricted shares. All of the grants were awarded prior to the Company’s determination to restate its financial results. Of the 580,794 restricted shares, 358,794 restricted shares have vested (excluding 47,000 restricted shares that vested on March 26, 2010 but for which no common shares were issued due to the Company’s ongoing Chapter 11 proceedings) and 175,000 remain unvested as of the time of this filing. During his tenure with the Company, Dr. Edelstein has not sold any restricted shares and, therefore, at the time of this filing, he holds 358,794 outstanding common shares. Upon vesting of the awards, Dr. Edelstein made personal payments to cover taxes on the awards totaling $507,998 as of the time of this filing. For further discussion regarding the assumptions used in the estimation of the fair value of these awards and details regarding the associated calculation of compensation cost related thereto, refer to Note 10 of the Notes to Consolidated Financial Statements. The amount of compensation expense recognized for financial statement reporting purposes under SFAS No. 123(R) in 2008 is derived from the following awards: |
156
Table of Contents
| Name |
Grant Date |
Type |
Number of Shares Granted (#) |
Grant Date Fair Value per Share ($) |
Aggregate Grant Date Fair Value ($) | |||||||
| Executive Officers |
||||||||||||
| Sergio Edelstein, Ph.D. |
||||||||||||
| 2008 |
March 14, 2008 | RSA | 75,000 | $ | 8.10 | $ | 607,500 | |||||
| 2007 |
March 26, 2007 | RSA | 75,000 | $ | 9.96 | $ | 747,000 | |||||
| March 26, 2007 | PRSA | 66,000 | $ | 9.96 | $ | 657,360 | ||||||
| 2006 |
July 10, 2006 | RSA | 174,057 | $ | 8.52 | $ | 1,482,966 | |||||
| July 10, 2006 | PRSA | 40,737 | $ | 8.52 | $ | 347,079 | ||||||
| 430,794 | $ | 3,841,905 | ||||||||||
| Philippe Brak |
||||||||||||
| 2008 |
March 14, 2008 | RSA | 25,000 | $ | 8.10 | $ | 202,500 | |||||
| 25,000 | $ | 202,500 | ||||||||||
| Stephen Webb |
||||||||||||
| 2008 |
March 14, 2008 | RSA | 12,500 | $ | 8.10 | $ | 101,250 | |||||
| 2007 |
March 26, 2007 | RSA | 10,000 | $ | 9.96 | $ | 99,600 | |||||
| March 26, 2007 | PRSA | 8,800 | $ | 9.96 | $ | 87,648 | ||||||
| 2006 |
May 18, 2006 | RSA | 6,000 | $ | 9.78 | $ | 58,680 | |||||
| May 18, 2006 | PRSA | 10,160 | $ | 9.78 | $ | 99,365 | ||||||
| 47,460 | $ | 446,543 | ||||||||||
| Anthony Bellantuoni |
||||||||||||
| 2008 |
March 14, 2008 | RSA | 12,500 | $ | 8.10 | $ | 101,250 | |||||
| 2007 |
October 22, 2007 | RSA | 15,000 | $ | 10.66 | $ | 159,900 | |||||
| October 22, 2007 | PRSA | 13,200 | $ | 10.66 | $ | 140,712 | ||||||
| 40,700 | $ | 401,862 | ||||||||||
| Former Executive Officers |
||||||||||||
| Robert Bowen |
||||||||||||
| 2007 |
March 26, 2007 | RSA | 17,500 | $ | 9.96 | $ | 174,300 | |||||
| March 26, 2007 | PRSA | 15,400 | $ | 9.96 | $ | 153,384 | ||||||
| 2006 |
May 18, 2006 | RSA | 9,900 | $ | 9.78 | $ | 96,822 | |||||
| May 18, 2006 | PRSA | 16,764 | $ | 9.78 | $ | 163,952 | ||||||
| 59,564 | $ | 588,458 | ||||||||||
| Felix Stukalin |
||||||||||||
| 2007 |
March 26, 2007 | RSA | 12,500 | $ | 9.96 | $ | 124,500 | |||||
| March 26, 2007 | PRSA | 11,000 | $ | 9.96 | $ | 109,560 | ||||||
| 2006 |
May 18, 2006 | RSA | 6,000 | $ | 9.78 | $ | 58,680 | |||||
| May 18, 2006 | PRSA | 10,160 | $ | 9.78 | $ | 99,365 | ||||||
| 39,660 | $ | 392,105 | ||||||||||
| Nino Federico |
||||||||||||
| 2007 |
March 26, 2007 | RSA | 15,000 | $ | 9.96 | $ | 149,400 | |||||
| March 26, 2007 | PRSA | 13,200 | $ | 9.96 | $ | 131,472 | ||||||
| 2006 |
May 18, 2006 | RSA | 9,000 | $ | 9.78 | $ | 88,020 | |||||
| May 18, 2006 | PRSA | 15,240 | $ | 9.78 | $ | 149,047 | ||||||
| 52,440 | $ | 517,939 | ||||||||||
| (3) | Amounts shown consist of awards earned during the period based on performance under the Annual Cash Bonus Incentive Plan. With the exception of amounts earned in 2008, amounts earned under the Company’s Annual Cash Bonus Incentive Plan are typically payable by their terms at a later date in the year following the year in which they are earned, subject to continued employment through the date of payment. Amounts shown for 2008 were payable by their terms in March 2009, subject to continued employment through the date of payment. In February 2009, the Company deferred payment of the amounts earned in 2008 pursuant to the Annual Cash Bonus Incentive Plan, with the exception of amounts earned by Dr. Edelstein, until successful completion of the Company’s restatement upon filing of the Form 10-K for the year-ended December 31, 2008. |
| (4) | In February 2009, as later clarified in January 2010, the Company deferred payment of the amounts earned pursuant to the Annual Cash Bonus Incentive Plan by Dr. Edelstein in 2008 until the earlier to occur of the following: (i) the date upon which all of the Company’s delayed periodic reports have been filed with the SEC, provided that such filings were completed in 2009, in which case the amounts earned by Dr. Edelstein in 2008 would have been paid together with amounts earned by Dr. Edelstein in 2009 during fiscal year 2010, not later than March 15, 2010; or (ii) the date upon which a Change-In-Control (as defined in the Termination and Change-In-Control Agreement, dated February 3, 2009, which includes, for the avoidance of doubt, the Effective Date (as defined in the First Modified Joint Chapter 11 Plan of Reorganization for MES International, Inc., GSI Group Corporation and the Company, dated January 8, 2010, as may be modified) of the Company’s chapter 11 plan of reorganization) occurs, whenever such event occurs, in which case the amounts earned by Dr. Edelstein in 2008 will be paid on such date. The amount shown for Dr. Edelstein in 2008 represents 40% of his overall target bonus which is comprised entirely of the full achievement of the individual MBO component of his respective 2008 bonus objectives. |
157
Table of Contents
| (5) | Amount shown for Mr. Brak in 2008 represents 25% of his overall target bonus which is comprised of 50% achievement of the discretionary component of his respective 2008 bonus objectives (or 10% of his overall target bonus) and 75% achievement of the individual MBO component of his respective 2008 bonus objectives (or 15% of his overall target bonus). |
| (6) | Amount shown for Mr. Webb in 2008 represents 12% of his overall target bonus which is comprised of 50% achievement of the discretionary component of his respective 2008 bonus objectives (or 10% of his overall target bonus) and 20% achievement of the individual MBO component of his respective 2008 bonus objectives (or 2% of his overall target bonus). |
| (7) | Amount shown for Mr. Bellantuoni in 2008 represents 10% of his overall target bonus which is comprised entirely of 50% achievement of the discretionary component of his respective 2008 bonus objectives. |
| (8) | Includes the following for 2008: |
| Executive Officers | Former Executive Officers | ||||||||||||||||||||
| Dr. Edelstein ($) |
Mr. Brak ($) |
Mr. Webb ($) |
Mr. Bellantuoni ($) |
Mr. Bowen ($) |
Mr. Stukalin ($) |
Mr. Federico ($) | |||||||||||||||
| Car Allowance |
$ | 12,000 | $ | — | $ | 13,394 | $ | 8,700 | $ | 9,481 | $ | 5,689 | $ | — | |||||||
| Defined Contribution Plan Match |
8,500 | 8,500 | 20,861 | 8,500 | 8,500 | 8,500 | 8,500 | ||||||||||||||
| Life Insurance Premiums |
966 | 630 | 3,221 | 1,806 | 1,928 | 436 | 1,181 | ||||||||||||||
| Tax Preparation Fees |
531 | — | — | 5,569 | 6,037 | 3,322 | — | ||||||||||||||
| Severance: Salary1 |
— | — | — | — | 315,172 | 381,123 | 396,864 | ||||||||||||||
| Severance: Bonus2 |
— | — | — | — | 78,793 | 23,058 | — | ||||||||||||||
| Vacation Payout |
— | — | — | — | 30,305 | 21,050 | 21,766 | ||||||||||||||
| Relocation Costs3 |
— | 452,725 | — | — | — | — | — | ||||||||||||||
| $ | 21,997 | $ | 461,855 | $ | 37,476 | $ | 24,575 | $ | 450,216 | $ | 443,178 | $ | 428,311 | ||||||||
| 1 | Amount for Mr. Bowen represents salary continuation of 12 months in accordance with the January 23, 2009 Separation Agreement. Amounts for Messrs. Stukalin and Federico represent salary continuation of 18 months pursuant to their respective Separation Agreements, both entered into August 28, 2008 and the associated Executive Retirement and Severance Benefits Agreements, both entered into January 17, 2005. |
| 2 | Amounts for Messrs. Bowen and Stukalin represent amounts paid pursuant to their respective Separation Agreements related to the Company’s Annual Cash Bonus Incentive Plan. Eligibility under the Company’s 2008 Annual Cash Bonus Incentive Plan is typically conditioned upon the individual being employed on the date such bonuses are paid; however, the Company granted and paid cash bonuses to Messrs. Bowen and Stukalin irrespective of their employment status. Amount shown for Mr. Bowen represents 50% of his overall target bonus which is comprised of the full achievement of the individual MBO component of his respective 2008 bonus objectives (or 20% of his overall target bonus) and the full achievement of the extra bonus opportunity component of his respective 2008 bonus objectives (or 30% of his overall target bonus). Pursuant to his Separation Agreement, the payout made to Mr. Bowen under the Annual Cash Bonus Incentive Plan is calculated as if he was employed by the Company through December 31, 2008. Amount shown for Mr. Stukalin represents 27.5% of his overall target bonus which is comprised entirely of 55% achievement of the M&A component of his respective 2008 bonus objectives. Pursuant to his Separation Agreement, the payout made to Mr. Stukalin under the Annual Cash Bonus Incentive Plan was prorated for the number of days actually employed in 2008 through the effective date of termination. |
| 3 | Amount relates to relocation costs incurred in connection with Mr. Brak’s relocation from California, USA to Rugby, UK. |
| (9) | The following awards were forfeited during the year-ended December 31, 2008: 66,000 restricted shares related to March 26, 2007 performance-based restricted stock award and 132,000 restricted shares related to March 14, 2008 performance-based restricted stock award. |
| (10) | The following awards were forfeited during the year-ended December 31, 2008: 44,000 restricted shares related to March 14, 2008 performance-based restricted stock award. |
158
Table of Contents
| (11) | The following awards were forfeited during the year-ended December 31, 2008: 8,800 restricted shares related to March 26, 2007 performance-based restricted stock award and 22,000 restricted shares related to March 14, 2008 performance-based restricted stock award. |
| (12) | The following awards were forfeited during the year-ended December 31, 2008: 13,200 restricted shares related to October 22, 2007 performance-based restricted stock award and 22,000 restricted shares related to March 14, 2008 performance-based restricted stock award. |
| (13) | The following awards were forfeited during the year-ended December 31, 2008: 3,300 restricted shares related to May 18, 2006 time-based restricted stock award; 5,588 restricted shares related to May 18, 2006 performance-based restricted stock award; 11,666 restricted shares related to March 26, 2007 time-based restricted stock award; 25,666 restricted shares related to March 26, 2007 performance-based restricted stock award; 22,500 restricted shares related to March 14, 2008 time-based restricted stock award and 39,600 restricted shares related to March 14, 2008 performance-based restricted stock award. |
| (14) | The following awards were forfeited during the year-ended December 31, 2008: 2,000 restricted shares related to May 18, 2006 time-based restricted stock award; 3,386 restricted shares related to May 18, 2006 performance-based restricted stock award; 8,333 restricted shares related to March 26, 2007 time-based restricted stock award and 18,333 restricted shares related to March 26, 2007 performance-based restricted stock award. |
| (15) | The following awards were forfeited during the year-ended December 31, 2008: 3,000 restricted shares related to May 18, 2006 time-based restricted stock award; 5,080 restricted shares related to May 18, 2006 performance-based restricted stock award; 10,000 restricted shares related to March 26, 2007 time-based restricted stock award; 22,000 restricted shares related to March 26, 2007 performance-based restricted stock award; 17,500 restricted shares related to March 14, 2008 time-based restricted stock award and 30,800 restricted shares related to March 14, 2008 performance-based restricted stock award. |
Grants of Plan-Based Awards
The following table sets forth information regarding all plan-based awards granted to the Company’s Named Executive Officers during the year-ended December 31, 2008.
| Estimated Possible Payouts Under Non-Equity Incentive Plan Awards (1) |
Estimated Possible Payouts
Under Equity Incentive Plan Awards (2) |
|||||||||||||||||||||
| Name (a) |
Type |
Grant Date (b) |
Threshold ($) (c) |
Target ($) (d) |
Maximum ($) (e) |
Threshold (#) (f) |
Target (#) (g) |
Maximum (#) (h) |
Grant Date Fair Value of Stock Awards ($)(4)(5) (l) |
|||||||||||||
| Executive Officers |
||||||||||||||||||||||
| Sergio Edelstein, Ph.D. |
Bonus | 3/14/08 | 0 | (3) | 442,000 | 442,000 | (8) | |||||||||||||||
| RSA | 3/14/08 | 75,000 | 75,000 | 75,000 | 607,500 | |||||||||||||||||
| PRSA | 3/14/08 | 0 | (3) | 75,000 | 132,000 | 607,500 | (6) | |||||||||||||||
| Philippe Brak |
Bonus | 3/14/08 | 0 | (3) | 150,000 | 210,000 | (8) | |||||||||||||||
| RSA | 3/14/08 | 25,000 | 25,000 | 25,000 | 202,500 | |||||||||||||||||
| PRSA | 3/14/08 | 0 | (3) | 25,000 | 44,000 | 202,500 | (6) | |||||||||||||||
| Stephen Webb |
Bonus | 3/14/08 | 0 | (3) | 106,348 | 159,522 | (8) | |||||||||||||||
| RSA | 3/14/08 | 12,500 | 12,500 | 12,500 | 101,250 | |||||||||||||||||
| PRSA | 3/14/08 | 0 | (3) | 12,500 | 22,000 | 101,250 | (6) | |||||||||||||||
| Anthony Bellantuoni |
Bonus | 3/14/08 | 0 | (3) | 87,360 | 87,360 | (8) | |||||||||||||||
| RSA | 3/14/08 | 12,500 | 12,500 | 12,500 | 101,250 | |||||||||||||||||
| PRSA | 3/14/08 | 0 | (3) | 12,500 | 22,000 | 101,250 | (6) | |||||||||||||||
| Former Executive Officers |
||||||||||||||||||||||
| Robert Bowen |
Bonus | 3/14/08 | 0 | (3) | 157,586 | 204,862 | (8) | |||||||||||||||
| RSA | 3/14/08 | 22,500 | 22,500 | 22,500 | 182,250 | (7) | ||||||||||||||||
| PRSA |
3/14/08 | 0 | (3) | 22,500 | 39,600 | 182,250 | (6)(7) | |||||||||||||||
| Felix Stukalin |
Bonus | 3/14/08 | 0 | (3) | 127,041 | 381,123 | ||||||||||||||||
| Nino Federico |
Bonus | 3/14/08 | 0 | (3) | 132,288 | 132,288 | (8) | |||||||||||||||
| RSA | 3/14/08 | 17,500 | 17,500 | 17,500 | 141,750 | (7) | ||||||||||||||||
| PRSA |
3/14/08 | 0 | (3) | 17,500 | 30,800 | 141,750 | (6)(7) | |||||||||||||||
| (1) | Amounts in these columns reflect threshold, target and maximum payout levels under the Annual Cash Bonus Incentive Plan. Amounts earned pursuant to the Annual Cash Bonus Incentive Plan are determined based on the achievement of the individual’s respective objectives and corporate performance. Individuals were to receive no cash payouts to the extent no objectives were satisfied. Individuals with amounts that are the same for target and maximum payout levels were not eligible to earn more than their targeted bonus pursuant to their associated Annual Cash Bonus Incentive Plan. Certain individuals were eligible for an additional bonus amount in excess of their targeted bonus pursuant to their associated Annual Cash Bonus Incentive Plan conditioned on the achievement of specific mergers and acquisitions objectives or |
159
Table of Contents
| product line performance. With the exception of Messrs. Bowen, Stukalin and Federico, the actual amount earned is reported under the Non-Equity Incentive Plan Compensation column in the Summary Compensation Table. The actual amount earned by Messrs. Bowen, Stukalin and Federico is reported under the All Other Compensation column of the Summary Compensation Table since the amounts were paid in connection with the termination of their employment. |
| (2) | Number of shares in these columns reflect threshold, target and maximum payout levels under the Long Term Incentive Plan (LTIP). All restricted shares were granted pursuant to the 2006 Equity Incentive Plan at the closing price of the Company‘s common stock on NASDAQ on the date of the grant. All 2008 LTIP awards were structured such that 50% of the overall target was comprised of a time-based award (RSA) and 50% of the overall target was comprised of a performance-based award (PRSA). Also, all 2008 LTIP awards contained an additional performance incentive such that individuals could earn up to 176% of the target performance-based portion of the award to the extent the Company exceeded the target operating profit percentage objective. Amounts reflected for time-based restricted stock awards are the same for threshold, target and maximum payout levels since the number of shares issuable under the respective award is not contingent or variable. The time-based restricted stock awards vest one-third annually on each of the first, second and third anniversaries of the date of grant, subject to continued employment on the date of vesting and accelerated vesting under specified circumstances as described in the 2006 Equity Incentive Plan. Amounts reflected for performance-based restricted stock awards represent the threshold, target and maximum payout levels under the respective award. The performance-based restricted stock awards were subject to the achievement of performance measurements tied to the Company’s internal metrics for operating profit percentage and were variable, so that the number of shares that could be earned ranged from 0% to 176% of the performance-based restricted stock award target. The target operating profit percentage was 10.3%. Individuals were to receive no shares related to the performance-based portion of the award to the extent the Company’s operating profit percentage did not exceed 4.6%. From 4.6% operating profit percentage to 10.3% operating profit percentage, the number of shares earned was to be determined by linear interpolation. At operating profit percentage levels exceeding 10.3%, individuals earned more than the targeted number of shares up to a maximum of 176% of the target performance-based portion of the award. The performance-based restricted stock awards vest one-third annually on each of the first, second and third anniversaries of the date of grant, subject to continued employment on the date of vesting and accelerated vesting under specified circumstances as described in the 2006 Equity Incentive Plan. |
| (3) | Failure to meet a minimum level of performance will result in no vesting of the performance-based restricted stock awards (PRSA) and no bonus earned or paid out pursuant to the Annual Cash Bonus Incentive Plan. |
| (4) | Amounts shown reflect the aggregate grant date fair value of the awards for financial statement reporting purposes (disregarding an estimate of forfeitures related to service-based vesting conditions) as determined in accordance with SFAS No. 123 (R) for 2008 and includes only grants made in 2008 and reflected in the table. Amounts shown do not correspond to the actual value that will be recognized by the Named Executive Officers. For further discussion regarding the assumptions used in the estimation of the fair value of these awards and details regarding the associated calculation of compensation cost related thereto, refer to Note 10 of the Notes to Consolidated Financial Statements. |
| (5) | Grant date fair value of restricted stock awards was calculated by multiplying the number of restricted shares granted by the market price of the Company’s common stock on the date of grant. |
| (6) | Grant date fair value of performance-based restricted stock awards was calculated based on the associated target payout level under the Company’s LTIP. However, the Compensation Committee determined that the performance metrics outlined in the LTIP were not met in 2008. Accordingly, no performance-based restricted stock awards were earned and consequently, all such shares were forfeited. |
| (7) | Mr. Bowen’s and Mr. Federico’s employment terminated effective October 27, 2008 and August 29, 2008, respectively. Accordingly, all unvested time-based restricted stock awards and unvested performance-based restricted stock awards previously granted were forfeited upon termination. |
| (8) | The maximum payouts reflected represent the targeted achievement level for the operating profit bonus objective and assumes the full achievement of all other bonus objectives. However, the maximum potential payouts under the Company operating profit bonus objective in 2008 were unlimited to the extent the Company’s actual operating profit exceeded the target. Accordingly, the maximum potential payouts under the Company’s non-equity incentive plan in 2008 were unlimited. Irrespective of the unquantifiable nature of the maximum estimated possible payout, the operating profit target was not met in 2008. |
160
Table of Contents
Outstanding Equity Awards at Fiscal Year-End
The following table sets forth information regarding unexercised options and stock that has not yet vested for each of the Company’s Named Executive Officers outstanding as of December 31, 2008.
| Option Awards | Stock Awards | ||||||||||||||||||||
| Name (a) |
Grant Date |
Number
of Securities Underlying Unexercised Options Exercisable (#) (b) |
Option Exercise Price ($) (e) |
Option Expiration Date (f) |
Number of Shares or Units of Stock That Have Not Vested (#) (g) |
Market Value of Shares or Units of Stock That Have Not Vested ($)(1) (h) |
Equity Incentive Plan Awards: Number of Unearned Shares, Units or Other Rights That Have Not Vested (#) (i) |
Equity Incentive Plan Awards: Market or Payout Value of Unearned Shares, Units or Other Rights That Have Not Vested ($)(1) (j) | |||||||||||||
| Executive Officers |
|||||||||||||||||||||
| Sergio Edelstein, Ph.D. |
7/10/06 | 58,019 | (2) | 33,071 | — | — | |||||||||||||||
| 7/10/06 | — | — | 150,000 | (3) | 85,500 | ||||||||||||||||
| 7/10/06 | 13,579 | (3) | 7,740 | — | — | ||||||||||||||||
| 3/26/07 | 50,000 | (4) | 28,500 | — | — | ||||||||||||||||
| 3/26/07 | 44,000 | (5) | 25,080 | — | — | ||||||||||||||||
| 3/14/08 | 75,000 | (6) | 42,750 | — | — | ||||||||||||||||
| Philippe Brak |
3/14/08 | 25,000 | (6) | 14,250 | — | — | |||||||||||||||
| Stephen Webb |
9/3/04 | 10,000 | $ | 10.09 | 9/3/2010 | ||||||||||||||||
| 5/18/06 | 2,000 | (10) | 1,140 | — | — | ||||||||||||||||
| 5/18/06 | 3,386 | (11) | 1,930 | — | — | ||||||||||||||||
| 3/26/07 | 6,666 | (4) | 3,800 | — | — | ||||||||||||||||
| 3/26/07 | 5,866 | (5) | 3,344 | — | — | ||||||||||||||||
| 3/14/08 | 12,500 | (6) | 7,125 | — | — | ||||||||||||||||
| Anthony Bellantuoni |
10/22/07 | 10,000 | (7) | 5,700 | — | — | |||||||||||||||
| 10/22/07 | 8,800 | (8) | 5,016 | — | — | ||||||||||||||||
| 3/14/08 | 12,500 | (6) | 7,125 | — | — | ||||||||||||||||
| Former Executive Officers |
|||||||||||||||||||||
| Robert Bowen |
— | (9) | — | (9) | — | — | — | (9) | — | — | (9) | — | |||||||||
| Felix Stukalin |
— | (9) | — | (9) | — | — | — | (9) | — | — | (9) | — | |||||||||
| Nino Federico |
— | (9) | — | (9) | — | — | — | (9) | — | — | (9) | — | |||||||||
| (1) | Represents the product of the shares in column (g) or column (i) multiplied by $0.57, the closing market price of the Company’s common stock on NASDAQ as of December 31, 2008. |
| (2) | Represents time-based restricted shares granted on July 10, 2006. These shares vested in full on July 10, 2009. |
| (3) | Represents two performance-based restricted share awards granted on July 10, 2006. The achievement of the 150,000 restricted share award will not be measured until audited financial statements are completed for the year-ended December 31, 2009. Any shares earned under the 150,000 restricted share award will immediately vest. The 13,579 shares vested in full on July 10, 2009. |
| (4) | Represents time-based restricted shares granted on March 26, 2007. These shares vested in full in two equal installments on March 26, 2009 and March 26, 2010. No common shares were issued in connection with the shares that vested on March 26, 2010 due to restrictions on the issuance of equity awards in connection with the Company’s ongoing Chapter 11 proceedings. |
| (5) | Represents performance-based restricted shares granted on March 26, 2007. These shares vested in full in two equal installments on March 26, 2009 and March 26, 2010. No common shares were issued in connection with the shares that vested on March 26, 2010 due to restrictions on the issuance of equity awards in connection with the Company’s ongoing Chapter 11 proceedings. |
| (6) | Represents time-based restricted shares granted on March 14, 2008. These shares were scheduled to vest in three equal installments on March 14, 2009, March 14, 2010 and March 14, 2011, provided that the executive remains employed by the Company on the vesting dates. The first and second installments vested on March 14, 2009 and March 14, 2010, respectively. |
| (7) | Represents time-based restricted shares granted on October 22, 2007. These shares vested in full in two equal installments on March 26, 2009 and March 26, 2010. No common shares were issued in connection with the shares that vested on March 26, 2010 due to restrictions on the issuance of equity awards in connection with the Company’s ongoing Chapter 11 proceedings. |
| (8) | Represents performance-based restricted shares granted on October 22, 2007. These shares vested in full in two equal installments on March 26, 2009 and March 26, 2010. No common shares were issued in connection with the shares that vested on March 26, 2010 due to restrictions on the issuance of equity awards in connection with the Company’s ongoing Chapter 11 proceedings. |
| (9) | All unvested options and restricted shares were forfeited and all vested, but unexercised options were cancelled upon termination of employment prior to December 31, 2008 as follows: |
161
Table of Contents
| Name |
Grant Date | Type | Option Exercise Price ($) |
Number of Shares Cancelled/Forfeited (#) | |||||
| Robert Bowen |
December 16, 2005 | Option | $ | 10.93 | 50,000 | ||||
| May 18, 2006 | RSA | N/A | 3,300 | ||||||
| May 18, 2006 | PRSA | N/A | 5,588 | ||||||
| March 26, 2007 | RSA | N/A | 11,666 | ||||||
| March 26, 2007 | PRSA | N/A | 10,266 | ||||||
| March 14, 2008 | RSA | N/A | 22,500 | ||||||
| March 14, 2008 | PRSA | N/A | 39,600 | ||||||
| 142,920 | |||||||||
| Felix Stukalin |
April 29, 2003 | Option | $ | 4.31 | 15,000 | ||||
| September 3, 2004 | Option | $ | 10.09 | 40,000 | |||||
| May 18, 2006 | RSA | N/A | 2,000 | ||||||
| May 18, 2006 | PRSA | N/A | 3,386 | ||||||
| March 26, 2007 | RSA | N/A | 8,333 | ||||||
| March 26, 2007 | PRSA | N/A | 7,333 | ||||||
| 76,052 | |||||||||
| Nino Federico |
April 29, 2003 | Option | $ | 4.31 | 15,000 | ||||
| September 3, 2004 | Option | $ | 10.09 | 40,000 | |||||
| May 18, 2006 | RSA | N/A | 3,000 | ||||||
| May 18, 2006 | PRSA | N/A | 5,080 | ||||||
| March 26, 2007 | RSA | N/A | 10,000 | ||||||
| March 26, 2007 | PRSA | N/A | 8,800 | ||||||
| March 14, 2008 | RSA | N/A | 17,500 | ||||||
| March 14, 2008 | PRSA | N/A | 30,800 | ||||||
| 130,180 | |||||||||
| (10) | Represents time-based restricted shares granted on May 18, 2006. These shares vested in full on March 10, 2009. |
| (11) | Represents performance-based restricted shares granted on May 18, 2006. These shares vested in full on March 10, 2009. |
Option Exercises and Stock Vested
The following table sets forth information regarding all stock options exercised and the value realized upon exercise and all restricted stock awards that vested and the value realized upon vesting by each of the Company’s Named Executive Officers during the year-ended December 31, 2008.
| Option Awards | Stock Awards | |||||||
| Name (a) |
Number of Shares Acquired on Exercise (#) (b) |
Value Realized on Exercise ($)(1) (c) |
Number of Shares Acquired on Vesting (#) (d) |
Value Realized on Vesting ($)(2) (e) | ||||
| Executive Officers |
||||||||
| Sergio Edelstein, Ph.D. |
— | — | 118,598 | 849,759 | ||||
| Philippe Brak |
— | — | — | — | ||||
| Stephen Webb |
— | — | 11,655 | 94,420 | ||||
| Anthony Bellantuoni |
— | — | 9,400 | 78,020 | ||||
| Former Executive Officers |
||||||||
| Robert Bowen |
— | — | 19,856 | 160,983 | ||||
| Felix Stukalin |
6,735 | 11,032 | 13,221 | 107,418 | ||||
| Nino Federico |
— | — | 17,480 | 141,610 | ||||
| (1) | Value realized on exercise is computed by multiplying the number of shares obtained upon exercise by the difference between the closing market price of the Company’s common stock on the applicable exercise date and the exercise price of the associated options. |
| (2) | Value realized on vesting is computed by multiplying the number of shares of stock vested by the closing market price of the Company’s common stock on the applicable vesting date. |
Potential Payments Upon Termination or Change of Control
The following table sets forth estimated compensation that the Company would be obligated to provide to each of the Company’s Named Executive Officers upon termination of employment or change in control pursuant to the terms of individualized employment agreements. Other than these agreements, there are no other plans or other contractual obligations triggered upon termination of employment or change in control related to the Company’s Named Executive Officers. The amounts reflected in the
162
Table of Contents
following table assume that the termination of employment or change in control occurred on December 31, 2008, with the exception of Messrs. Bowen, Federico and Stukalin. Mr. Bowen’s employment terminated effective October 27, 2008 and Messrs. Federico and Stukalins’ employment terminated effective August 29, 2008. Accordingly, the amounts reflected in the following table for Messrs. Bowen, Federico and Stukalin represent actual amounts paid pursuant to their respective Separation Agreements. With the exception of Messrs. Bowen, Federico and Stukalin, there can be no assurance that a triggering event would produce the same or similar results as those estimated below if such event occurs on any other date or at any other price, or if any other assumption used to estimate potential payments and benefits is not correct. Due to the number of factors that affect the nature and amount of any potential payments or benefits, any actual payments or benefits may be different.
| Name |
Event |
Salary ($) |
Bonus ($) |
Health
& Dental Benefits ($) |
Vacation Payout ($) |
Immediate Vesting of Outstanding Stock ($) |
Total ($) | ||||||||||||||
| Executive Officers |
|||||||||||||||||||||
| Sergio Edelstein, Ph.D. (10) |
Position eliminated due to change in control | $
|
1,040,000 (24 months |
(1) ) |
884,000 (24 months |
(2) ) |
14,000 (24 months |
(3) ) |
— | 222,641 | (4) | $ | 2,160,641 | ||||||||
|
Termination other than “for cause” |
$
|
780,000 (18 months |
(1) ) |
663,000 (18 months |
(2) ) |
10,000 (18 months |
(3) ) |
— |
|
— |
|
$ |
1,453,000 | ||||||||
| Philippe Brak |
No agreement. | ||||||||||||||||||||
| Stephen Webb |
No agreement. | ||||||||||||||||||||
| Anthony Bellantuoni |
No agreement. | ||||||||||||||||||||
| Former Executive Officers |
|||||||||||||||||||||
| Robert Bowen |
— | $
|
315,172 (12 months |
(5) ) |
78,793 | (6) | — | 30,305 | (7) | — | $ | 424,270 | |||||||||
| Felix Stukalin |
— | $
|
381,123 (18 months |
(8) ) |
23,058 | (9) | 6,356 (6 months |
(3) ) |
21,050 | (7) | — | $ | 431,587 | ||||||||
| Nino Federico |
— | $
|
396,864 (18 months |
(8) ) |
— | 2,499 (2 months |
(3) ) |
21,766 | (7) | — | $ | 421,129 | |||||||||
| (1) | Amounts based on the executive’s annual base salary for the year-ended December 31, 2008. |
| (2) | Amounts based on 100% of bonus potential for the year-ended December 31, 2008 or 85% of annual base salary. |
| (3) | Amounts based on a continuation of the executive’s health and dental benefits at the election level in which the individual is enrolled as of December 31, 2008. |
| (4) | Represents the outstanding number of shares of 390,598 multiplied by $0.57, the closing market price of the Company’s common stock as of December 31, 2008. |
| (5) | Amount represents 12 months of salary continuation pursuant to Mr. Bowen’s Separation Agreement executed January 23, 2009. Of the total amount, $60,500 was paid in bi-weekly installments from the effective date of employment termination on October 27, 2008 through January 23, 2009, while the remaining $254,672 was paid in a lump sum upon execution of the Separation Agreement. |
| (6) | Amount represents 50% of Mr. Bowen’s overall target bonus calculated pursuant to the Annual Cash Bonus Incentive Plan as if he were employed by the Company through December 31, 2008 and paid in 2009, pursuant to Mr. Bowen’s Separation Agreement executed January 23, 2009. |
| (7) | Amounts represent payments for earned, but unused vacation time accrued through the respective date of termination, pursuant to the terms of the respective Separation Agreements. The amounts were paid following the execution of the associated Separation Agreement. |
| (8) | Amount represents 18 months of salary continuation pursuant to Mr. Stukalin’s and Mr. Federico’s respective Separation Agreements which were executed effective September 17, 2008 and October 7, 2008, respectively and their associated Executive Retirement and Severance Benefits Agreements, both executed January 17, 2005. The amounts were paid in 2008 following the execution of the associated Separation Agreement. |
| (9) | Amount represents 27.5% of Mr. Stukalin’s overall target bonus calculated pursuant to the Annual Cash Bonus Incentive Plan and prorated for the number of days actually employed in 2008 through the effective date of termination. The amount was paid in 2009 pursuant to Mr. Stukalin’s Separation Agreement executed September 17, 2008. |
| (10) | Amounts for Dr. Edelstein represent those payable upon termination of employment or change in control pursuant to the letter agreement effective July 10, 2006, such agreement was superseded by the Termination and Change-In-Control Agreement by and between the Company and Dr. Edelstein effective February 3, 2009. |
163
Table of Contents
Impact of Change of Control on Equity Compensation Arrangements
Pursuant to the terms of the Company’s 2006 Equity Incentive Plan, in the event of a Change of Control, as defined, the vesting of any equity compensation awards granted to any employees and directors, including the Named Executive Officers, with the exception of Dr. Edelstein, is subject to the terms contained in such plan. As defined by the 2006 Equity Incentive Plan, a Change of Control means the occurrence of any of the following:
1. An acquisition, as defined, unless securities possessing more than 50% of the total combined voting power of the survivor’s or acquiror’s outstanding securities (or the securities of any parent thereof) are held by a person or persons who held securities possessing more than 50% of the total combined voting power of the Company’s outstanding securities immediately prior to that transaction, or
2. Any person or group of persons (within the meaning of Section 13(d)(3) of the Securities Exchange Act of 1934, as amended) directly or indirectly acquires, including but not limited to by means of a merger or consolidation, beneficial ownership (determined pursuant to Securities and Exchange Commission Rule 13d-3 promulgated under said Exchange Act) of securities possessing more than 20% of the total combined voting power of the Company’s outstanding securities pursuant to a tender or exchange offer made directly to the Company’s shareholders that the Board does not recommend such shareholders accept, other than (i) the Company or an Affiliate, as defined; (ii) an employee benefit plan of the Company or any of its Affiliates, as defined; (iii) a trustee or other fiduciary holding securities under an employee benefit plan of the Company or any of its Affiliates, as defined, or (iv) an underwriter temporarily holding securities pursuant to an offering of such securities, or
3. Over a period of 36 consecutive months or less, there is a change in the composition of the Board of Directors (the “Board”) such that a majority of Board members (rounded up to the next whole number, if a fraction) ceases, by reason of one or more proxy contests for the election of Board members, to be composed of individuals who either (i) have been Board members continuously since the beginning of that period, or (ii) have been elected or nominated for election as Board members during such period by at least a majority of the Board members described in the preceding clause (i) who were still in office at the time that election or nomination was approved by the Board, or
4. A majority of the Board votes in favor of a decision that a Change of Control has occurred.
Pursuant to the 2006 Equity Incentive Plan, upon a Change of Control, as defined:
1. Any and all Options and Stock Appreciation Rights not already excercisable in full shall continue to vest and become exercisable after the Change of Control in accordance with the terms of the 2006 Equity Incentive Plan and the applicable Award Agreement, as defined; provided, however, that such Options and Stock Appreciation Rights shall accelerate in full upon any termination by the Company or any Affiliate, as defined, of an individual’s employment or other association with the Company and its Affiliates (or any successor thereto), as defined, other than on dismissal for cause, within one year following the Change of Control; and
2. Any Restricted Stock and Restricted Stock Units still subject to a risk of forfeiture at the date of the Change of Control which risk is not based on achievement of performance goals shall continue to vest after the Change of Control in accordance with the terms of the 2006 Equity Incentive Plan and the applicable Award Agreement, as defined; provided, however, that such Restricted Stock or Restricted Stock Units shall accelerate in full upon any termination by the Company or an Affiliate, as defined, of an individual’s employment or other association with the Company and its Affiliates (or any successor thereto), as defined, other than on dismissal for cause, within one year following the Change of Control; and
3. All outstanding Awards of Restricted Stock and Restricted Stock Units conditioned on the achievement of performance goals and the target payout opportunities attainable under outstanding Performance Units shall be deemed to have been satisfied as of the effective date of the Change of Control as to a pro rata number of shares based on the assumed achievement of all relevant performance goals and the length of time within the performance period which has elapsed prior to the Change of Control and the balance forfeited. All such awards of Performance Units and Restricted Stock Units shall be paid to the extent earned to individuals in accordance with their terms within 30 days following the effective date of the Change of Control.
None of the foregoing shall apply, however, (i) in the case of a Qualified Performance-Based Award, as defined, specifically designated as such by the Compensation Committee at the time of the grant (except to the extent allowed by Section 162(m) of the Internal Revenue Code of 1986), (ii) in the case of any Award pursuant to an Award Agreement, as defined, requiring other or additional terms upon a Change of Control (or similar event), or (iii) if specifically prohibited under applicable laws, or by the rules and regulations of any governing governmental agencies or national securities exchanges.
164
Table of Contents
As of December 31, 2008, the only unvested equity compensation awards were comprised entirely of restricted stock awards, as all of the Company’s previously granted stock option awards were accelerated on December 31, 2005. Thereafter, the Company has only issued restricted stock awards. As of December 31, 2008, with the exception of Dr. Edelstein, for whom the Change of Control provisions pursuant to the 2006 Equity Incentive Plan do not apply, all unvested performance-based restricted stock awards granted to date were either: (i) earned, and will vest in 1/3 annual increments, or (ii) were forfeited. Accordingly, as of December 31, 2008, there were no unvested restricted stock awards conditioned on the achievement of performance goals.
As discussed in Item 1. Business - Significant Recent Events - The Third Modified Joint Chapter 11 Plan of Reorganization, pursuant to the Company’s Third Modified Joint Chapter 11 Plan of Reorganization (i) holders of the Senior Note Claims would, in exchange for the Senior Note Claims, receive approximately 53.8% of the Company’s post-consummation outstanding shares, (ii) the Company’s wholly owned subsidiary, GSI Group Limited, would, in exchange for the GSI UK Note Claim receive approximately 5.1% of the Company’s post-consummation outstanding shares, and (iii) the Company’s existing shareholders would retain approximately 41.1% of the Company’s post-consummation outstanding shares.
Termination Agreements for Sergio Edelstein
On June 3, 2006, the Company entered into an employment arrangement with Dr. Edelstein effective July 10, 2006. Pursuant to the terms of the employment arrangement, in the event of a change of control in which Dr. Edelstein’s position was eliminated, he would receive the equivalent of two years salary, two years bonus calculated at 100% achievement of objectives, and all outstanding stock would immediately vest. Furthermore, the Company agreed that if his employment is terminated for reasons other than “for cause”, Dr. Edelstein will receive the equivalent of 18 months salary and a bonus calculated at 100% achievement of objectives for that same period. No benefits would be payable to Dr. Edelstein in the event of death, disability, resignation, retirement, change in responsibilities, a change in control which did not result in a termination, or for termination “for cause”. The agreement with Dr. Edelstein did not have an expiration date; however, the termination provisions of the employment arrangement were superseded by the Termination and Change-in-Control Agreement executed February 3, 2009.
On February 3, 2009, the Company entered into a Termination and Change-In-Control Agreement (the “Termination Agreement”) with Dr. Edelstein. The Termination Agreement is intended to capture all previous oral and written arrangements, understandings and agreements between the Company and Dr. Edelstein with respect to certain terms and conditions of Dr. Edelstein’s employment with the Company as Chief Executive Officer and supersedes all prior agreements, understandings and arrangements with respect to such terms.
Pursuant to the terms of the Termination Agreement, upon any termination of Dr. Edelstein’s employment by the Company for cause, disability or death, or by Dr. Edelstein without good reason, Dr. Edelstein shall be entitled to receive all amounts earned or accrued through such date of termination, including: (i) base salary then in effect, (ii) reimbursement for certain monies advanced in connection with employment, (iii) vacation pay, (iv) any bonuses for the prior fiscal year which would have been eligible for payment but for such termination, and (v) any previous compensation which Dr. Edelstein previously deferred (collectively, the “Accrued Compensation”). In addition, in the event Dr. Edelstein is terminated by reason of death or disability, the Company shall pay to Dr. Edelstein or his beneficiaries an amount equal to the bonus award he would have been entitled to receive in respect of the fiscal year in which such termination occurred had he continued to be employed until the end of such fiscal year, calculated as if all performance targets and goals had been fully met and pro rated for the number of days elapsed in such fiscal year through the termination date (the “Pro Rata Bonus”).
Upon any termination of Dr. Edelstein’s employment by the Company prior to a change in control of the Company, other than for cause, death or disability, or by Dr. Edelstein for good reason, Dr. Edelstein shall be entitled to receive: (i) all Accrued Compensation, (ii) a Pro Rata Bonus, (iii) a lump sum severance payment in an amount equal to 1.5 times (x) his annual base salary then in effect plus (y) 100% of his target bonus amount, calculated as if all performance targets and goals had been fully met, and (iv) a continuation of certain Company benefits for a period of eighteen months following his termination; provided, however, that if such termination occurs within twenty-four months of a change in control of the Company, Dr. Edelstein shall be entitled to receive 2.0 times (x) his annual base salary then in effect plus (y) 100% of his target bonus amount, calculated as if all performance targets and goals had been fully met, a continuation of certain Company benefits for a period of twenty-four months following his termination, and the vesting of all equity-based compensation awards issued to Dr. Edelstein prior to the date of termination shall fully accelerate. In the event that any of the foregoing payments to Dr. Edelstein are deemed “parachute payments” within the meaning of Section 280G of the Internal Revenue Code of 1986, as amended, the Company shall either pay the full parachute payment, subject to the excise tax, or, at Dr. Edelstein’s election, a payment reduced to 2.99 times Dr. Edelstein’s Section 280G “base amount” that is not subject to the excise tax.
165
Table of Contents
The Termination Agreement also provides that in the event Dr. Edelstein is made a party, or is threatened to be made a party, to any action, suit or proceeding, whether civil, criminal, administrative or investigative, by reason of the fact that he is or was a director, officer, employee or agent of the Company, the Company will indemnify Dr. Edelstein for all costs, expenses, liabilities, losses, judgments, fines, attorneys’ fees and settlement amounts reasonably incurred by Dr. Edelstein in his capacity as a director, officer, employee or agent of the Company, whether or not Dr. Edelstein is then serving as a director, officer, employee or agent of the Company, to the fullest extent authorized or permitted under applicable law. In addition, the Company agrees to advance to Dr. Edelstein all reasonable costs and expenses to be incurred by him in connection with the foregoing proceedings, under certain circumstances. The Company further agrees to continue and maintain a directors and officers’ liability insurance policy covering Dr. Edelstein to the extent that such a policy is provided to the Company’s other executive officers. Further, pursuant to the Termination Agreement, Dr. Edelstein has agreed to a non-competition and non-solicitation covenant during the period beginning on February 3, 2009 and ending twelve months following termination of his employment; provided, however, that in the case of termination by the Company without cause or by Dr. Edelstein for good reason, the non-competition covenant shall terminate coterminous with the period for which Dr. Edelstein receives payment.
The Termination Agreement has a term of three years from the effective date of February 3, 2009, with annual renewals thereafter at the Company’s discretion or as otherwise extended pursuant to the terms of the Termination Agreement; provided, however, that if a Change in Control, as defined, event occurs during the term, then the terms of the Termination Agreement will not expire prior to the second anniversary of the associated Change in Control event.
Executive Retirement and Severance Benefits Agreement for Messrs. Federico and Stukalin
Each of Messrs. Federico and Stukalin executed an Executive Retirement and Severance Benefits Agreement (the “Agreement”) with the Company on January 17, 2005. This Agreement provides the following benefits:
1. If the Executive reaches the age of sixty (60) and has a minimum of fifteen (15) years service with the Company, then such Executive can elect to retire, provided a notice to such effect is provided to the CEO not less than one (1) year prior to the date of retirement specified in the notice. In such an event, the Executive will receive the following retirement benefits, provided that the Executive continues to comply with any post-retirement obligations such Executive has to the Company: 1) the Executive may elect for the Company to retain the Executive for part-time employment for up to three (3) years from the Executive’s retirement date, and such part-time employment shall not be more than fifty percent (50%) of full-time; 2) continued health and dental group benefits to the Executive and the Executive’s family at the same level as was provided to the Executive as of the Executive’s retirement date; and 3) all stock options granted to the Executive prior to such retirement shall continue to vest during the period of such part-time employment. If the Executive retires and chooses any of these retirement benefits, such Executive will not be eligible for termination benefits (as described below).
2. If the Executive is terminated by the Company for any reason other than death, disability, or Cause (all as defined in the Agreement) or the Executive terminates his or her employment with the Company for Good Reason (as defined in the Agreement), then the Executive shall receive the following termination benefits: 1) eighteen (18) months of base salary; 2) pro-rated bonus under the applicable bonus plan; and 3) continued health and dental group benefits to the Executive and the Executive’s family at the same level as was provided to the Executive as of the Executive’s termination date for the earlier of two (2) years or employment by another company which provides health and dental insurance benefits to the Executive. These termination benefits are conditioned upon the Executive signing a release of claims and compliance with all post-termination obligations the Executive has to the Company. No such benefits are available upon the resignation (other than for good cause) or retirement of the Executive.
3. Upon the death of the Executive, the Executive’s heirs will be entitled to receive the Executive’s termination benefits in point 2 above provided such heirs sign a release of claims as described in the Agreement.
4. During either: (i) the Executive’s part-time employment and for a period of one year thereafter, or (ii) during the period that the Executive is eligible to receive termination benefits and for a period of one year thereafter, the Executive is prohibited, without the Company’s prior written consent, from competing with the Company or soliciting employees from the Company.
5. All claims for any benefits under the Agreement shall be determined by the Board of Directors of the Company. All disputes shall be settled exclusively by binding arbitration in Boston, Massachusetts, U.S.A.
In the event of the death of either of Messrs. Federico or Stukalin, their heirs would be entitled to receive these same benefits. No benefits would be payable to either Messrs. Federico or Stukalin in the event of disability, resignation, retirement, change in responsibilities, a change in control which did not result in termination, or termination for Cause.
166
Table of Contents
Separation Agreement for Messrs. Stukalin and Federico
Mr. Stukalin’s and Mr. Federico’s employment with the Company terminated effective August 29, 2008. The Company entered into a Separation Agreement with Mr. Stukalin effective September 17, 2008. The Company entered into a Separation Agreement with Mr. Federico effective October 7, 2008. The terms of the associated Separation Agreements with Messrs. Stukalin and Federico contained terms consistent with their respective Executive Retirement and Severance Benefits Agreement. Pursuant to the Separation Agreements, Messrs. Stukalin and Federico each executed a release in favor of the Company in exchange for certain separation benefits. More specifically, the Separation Agreements with Messrs. Stukalin and Federico provided for payment of the following benefits:
| • | All salary and wages earned through the termination date; |
| • | Payment for unused, earned vacation time accrued though the termination date; |
| • | 18 months of salary continuation; |
| • | Health benefits comparable to those provided as of the termination date until the earlier of (i) the 24-month anniversary of the Termination Date or (ii) the date the employee and family become eligible to receive health and dental benefits under the plans of a subsequent employer; and |
| • | Bonus equal to the amount earned pursuant to the terms of the applicable bonus plan in effect on the termination date, prorated based on the number of days actually worked in the calendar year of the termination. |
Actual amounts paid pursuant to the Separation Agreements with Messrs. Stukalin and Federico are reflected in the preceding table.
Separation Agreement for Mr. Bowen
Mr. Bowen’s employment with the Company terminated effective October 27, 2008. The Company entered into a Separation Agreement with Mr. Bowen effective January 23, 2009. Pursuant to the Separation Agreement, Mr. Bowen executed a release in favor of the Company in exchange for certain separation benefits. More specifically, the Separation Agreement with Mr. Bowen provided for payment of the following benefits:
| • | All salary and wages earned through the termination date; |
| • | Payment for unused, earned vacation time accrued through the termination date; |
| • | 12 months of salary continuation; and |
| • | A non-prorated bonus equal to 50% of Mr. Bowen’s target bonus. |
Actual amounts paid pursuant to the Separation Agreement with Mr. Bowen are reflected in the preceding table.
DIRECTOR COMPENSATION
The Company uses a combination of cash and equity-based compensation to attract and retain candidates to serve on the Company’s Board of Directors. The Company does not compensate directors who are also employees for their service on the Board of Directors. As a result, Dr. Edelstein, the Company’s President and Chief Executive Officer, does not receive any compensation for his service on the Board of Directors. The Board of Director compensation is overseen by the Nominating and Corporate Governance Committee rather than the Compensation Committee, which focuses on employee compensation. The Nominating and Corporate Governance Committee periodically reviews its cash and equity-based compensation for non-employee directors and makes recommendations to the Boards of Directors for any adjustments.
Each director receives an annual retainer and per meeting fees for service on the Board of Directors. In addition, each director serving as chairperson of a committee of the Board of Directors receives an additional annual retainer. Each director receives an annual director fee of $16,500, and an annual grant of $50,000 of time-based restricted stock that vests annually in equal increments over three years, beginning on the first anniversary of the grant date. The Chairman of the Board receives an additional annual fee of $40,500. The chairperson for the Audit Committee receives an additional annual fee of $6,000. The chairperson for the Compensation Committee and the chairperson for the Nominating and Corporate Governance Committee each receive an additional annual fee of $3,000. The chairperson for the Technology Committee receives an additional annual fee of $2,000. In addition, fees for each in-person individual meeting are $1,500, while fees for each individual teleconference meeting are $750.
In February 2009, the Nominating and Corporate Governance Committee approved a reduction of all Board of Directors annual retainers and per meeting fees by 20%. In addition, in February 2009, the Nominating and Corporate Governance Committee enacted a change in the director compensation structure such that annual retainers and per meeting fees would be payable in shares of the Company’s common stock, subject to selling restrictions for a period of 12 months.
167
Table of Contents
Furthermore, in February 2009, the Nominating and Corporate Governance Committee approved a reduction in the annual grant of time-based restricted stock from $50,000 to $40,000. Otherwise, the terms and conditions of the annual grant of time-based restricted stock remain unchanged such that the award vests annually in equal increments over three years, beginning on the first anniversary of the grant date. In May 2009, the Nominating and Corporate Governance Committee deferred the implementation of the director compensation changes until after the July 2009 Board of Directors meeting. In July 2009, the Board of Directors agreed that no shares would be issued as compensation to the members of the Board of Directors prior to the completion of the Company’s restatement efforts and the conclusion of the matters with the Company’s noteholders.
Director Compensation Table
The following table sets forth information regarding the compensation earned during the fiscal year ended December 31, 2008 by the Company’s non-employee directors.
| Name (a) |
Fees Earned Paid in Cash ($)(1) (b) |
Stock Awards ($)(2)(3) (c) |
Total ($) (h) | |||
| Richard Black (4) (5) |
86,250 | 40,546 | 126,796 | |||
| Garrett Garrettson, Ph.D. (4) (5) |
49,750 | 40,546 | 90,296 | |||
| Phillip Griffiths, Ph.D. (4) (5) |
47,500 | 40,546 | 88,046 | |||
| Marina Hatsopoulos (4) (5) |
51,000 | 40,546 | 91,546 | |||
| Byron Pond (4) (5) |
51,000 | 40,546 | 91,546 | |||
| Benjamin Virgilio (4) (5) |
46,500 | 40,546 | 87,046 |
| (1) | All fees earned by the Company’s Board of Directors during the year-ended December 31, 2008 were paid in full prior to January 31, 2009. |
| (2) | Amounts shown do not reflect compensation actually received. Rather, amounts shown represent share-based compensation expense recognized for financial statement reporting purposes (disregarding an estimate of forfeitures related to service-based vesting conditions) under SFAS No. 123 (R). Amounts shown include compensation cost recognized in the financial statements with respect to awards granted in previous fiscal years and the current fiscal year and are based on the stock price on the date of grant. The stock price as of December 31, 2008 was $0.57. For further discussion regarding the assumptions used in the estimation of the fair value of these awards and details regarding the associated calculation of compensation cost related thereto, refer to Note 10 of the Notes to Consolidated Financial Statements. |
| (3) | All restricted shares were granted pursuant to the 2006 Equity Incentive Plan at the closing price of the Company’s common stock on NASDAQ on the date of grant. Accordingly, the restricted share award granted in 2008 was issued at $5.36 per share, resulting in an aggregate grant date fair value of approximately $50,000 for each director. All restricted stock awards vest one-third annually on each of the first, second and third anniversaries on the date of grant, subject to continued service on the date of vesting. Each of the directors holds 14,099 unvested restricted shares as of December 31, 2008 as follows: |
| Grant Date |
Total Number of Shares Granted to Each Director |
Number of Unvested Shares as of 12/31/08 |
Vesting Schedule |
Vesting Date(s) | ||||
| September 22, 2006 |
5,400 | 1,800 | 1/3 annually | September 22, 2009 | ||||
| July 24, 2007 |
4,457 | 2,971 | 1/3 annually | July 24, 2009, July 24, 2010 | ||||
| July 28, 2008 |
9,328 | 9,328 | 1/3 annually | July 28, 2009, July 28, 2010, July 28, 2011 | ||||
| 19,185 | 14,099 |
| (4) | Starting in 2006, the Company no longer grants awards of options to purchase shares of the Company’s common stock. Furthermore, the vesting associated with all outstanding options to purchase shares of the Company’s common stock was accelerated on December 31, 2005. Therefore, the previously unrecognized expense associated with all awards of options to purchase shares of the Company’s common stock was recognized on that date. As of December 31, 2008, the directors hold the following outstanding fully vested stock option awards: |
| Grant Date |
Mr. Black |
Dr. Garrettson |
Dr. Griffiths |
Ms. Hatsopoulos |
Mr. Pond |
Mr. Virgilio | ||||||
| April 29, 2003 |
10,000 | — | 10,000 | — | — | 10,000 | ||||||
| September 21, 2004 |
10,000 | — | 10,000 | — | 10,000 | 10,000 | ||||||
| July 28, 2005 |
— | 40,000 | — | 40,000 | — | — | ||||||
| November 8, 2005 |
10,000 | 10,000 | 10,000 | 10,000 | 10,000 | 10,000 | ||||||
| 30,000 | 50,000 | 30,000 | 50,000 | 20,000 | 30,000 |
168
Table of Contents
| (5) | The following options and warrants to purchase shares of the Company’s common stock expired unexercised during the year-ended December 31, 2008: |
| Grant Date |
Mr. Black |
Dr. Garrettson |
Dr. Griffiths |
Ms. Hatsopoulos |
Mr. Pond |
Mr. Virgilio | ||||||
| May 15, 1998 |
2,694 | — | — | — | — | — | ||||||
| July 16, 2002 |
10,000 | — | 10,000 | — | 10,000 | 10,000 | ||||||
| 12,694 | — | 10,000 | — | 10,000 | 10,000 |
DIRECTORS’ AND OFFICERS’ LIABILITY INSURANCE
The Company maintains entity and director and officers’ liability insurance in the aggregate principal amount of $27,000,000 subject to a $500,000 deductible per loss for SEC claims and $250,000 for all other claims that are indemnifiable by the Company. For claims that are not indemnifiable, there is no deductible. The Company is obligated to pay all deductibles. For the coverage as of December 31, 2008, the premium for the insurance was $282,300 per year which is paid by the Company. The insurance policy typically renews annually in May; however, the Company extended the then-existing policy in May 2009 through November 2009 for an insurance premium of approximately $155,000. In November 2009, the Company renewed the director and officers’ liability insurance policy on substantially the same terms, until November 6, 2010, for an extension premium of approximately $362,000. The Company also obtained additional A-side director coverage of $10,000,000 for an additional annual policy cost of approximately $90,000.
COMPENSATION COMMITTEE INTERLOCKS AND INSIDER PARTICIPATION
During the year-ended December 31, 2008, the members of the Company’s Compensation Committee of the Board of Directors were Messrs. Griffiths, Ph.D. and Pond and Ms. Hatsopoulos. None of the members of the Compensation Committee is or has at any time in the past been an officer or employee of the Company or any of its subsidiaries. No executive officer of the Company served as a member of the compensation committee (or other board committee performing equivalent functions) or as a member of the board of directors of an entity whose executive officers served on the Company’s Compensation Committee or on its Board of Directors during the year-ended December 31, 2008.
INDEBTEDNESS OF DIRECTORS AND OFFICERS
Since the beginning of the year ended December 31, 2008 there has been no indebtedness to the Company by any Director or officer or the family members or associates of any such person, other than amounts owing for purchases, subject to usual trade terms, for ordinary travel and expense advances and for other transactions in the ordinary course of business.
| Item 12. | Security Ownership of Certain Beneficial Owners and Management and Related Stockholder Matters |
SECURITY OWNERSHIP OF CERTAIN BENEFICIAL OWNERS AND MANAGEMENT
The following table sets forth certain information regarding the beneficial ownership of the Company’s common shares as of March 23, 2010, for: (1) each person (or group of affiliated persons) who is known by the Company to own beneficially more than 5% of the Company’s outstanding common shares; (2) each of the Company’s directors; (3) each of the Company’s Named Executive Officers employed as of December 31, 2008; and (4) all directors and executive officers of the Company as a group, based on information available to the Company as of the filing date of this Form 10-K.
Beneficial ownership is determined in accordance with SEC rules and includes voting or investment power with respect to securities. Except as indicated by the footnotes below, the Company believes, based on the information furnished to it, that the persons and entities named in the table below have sole voting and investment power with respect to all common shares that they beneficially own, subject to applicable community property laws. All common shares subject to options or warrants exercisable within 60 days of March 23, 2010 and all restricted shares that vest within 60 days of March 23, 2010 are deemed to be outstanding and beneficially owned by the persons holding those options, warrants or restricted shares for the purpose of computing the number of shares beneficially owned and the percentage ownership of that person. They are not, however, deemed to be outstanding and beneficially owned for the purpose of computing the percentage ownership of any other person.
Percentage ownership of outstanding shares is based on 47,901,978a common shares outstanding as of March 23, 2010.
| a | Excludes 199,734 shares of restricted stock which were unvested as of March 23, 2010. Such shares are subject to a risk of forfeiture in favor of the Company and do not carry voting rights or the right to receive dividends until vested. These shares were not issued due to an administrative oversight, but should have been issued on the date of the award pursuant to terms contained in the 2006 Equity Incentive Plan. Of the 199,734 unvested shares of restricted stock, 83,806 shares vested on March 26, 2010 but no common shares were issued in connection therewith due to restrictions on the issuance of equity awards in connection with the Company’s ongoing Chapter 11 proceedings. |
169
Table of Contents
| Name and Address of Beneficial Owner (1) |
Amount and Nature of Beneficial Ownership (2) |
Percentage of Common Shares |
|||
| 5% Stockholders |
|||||
| Stephen W. Bershad (3) |
6,251,806 | 13.05 | % | ||
| JEC II Associates, LLC (4) |
4,766,972 | 9.95 | % | ||
| Sumitomo Heavy Industries, Ltd. |
4,078,238 | 8.51 | % | ||
| Howson Tattersall Investment Counsel Limited |
3,210,974 | 6.70 | % | ||
| Mittleman Brothers, LLC (5) |
2,742,317 | 5.72 | % | ||
| Royce & Associates, LLC |
2,638,914 | 5.51 | % | ||
| Directors and Executive Officers |
|||||
| Sergio Edelstein, Ph.D. (6) |
358,794 | * | |||
| Benjamin J. Virgilio (7) |
59,882 | * | |||
| Byron O. Pond (8) |
52,824 | * | |||
| Richard B. Black (9) |
45,007 | * | |||
| Phillip A. Griffiths, Ph.D. (10) |
37,362 | * | |||
| Garrett A. Garrettson, Ph.D. (11) |
61,482 | * | |||
| Marina Hatsopoulos (12) |
61,482 | * | |||
| Philippe Brak (13) |
16,667 | * | |||
| Stephen Webb (14) |
64,093 | * | |||
| Anthony Bellantuoni (15) |
21,335 | * | |||
| All Directors and executive officers as a group (10 persons) |
778,928 | 1.62 | % | ||
170
Table of Contents
| * | Represents less than 1% of the outstanding common shares. |
| (1) | Unless otherwise indicated, the address of each stockholder is c/o GSI Group, Inc., 125 Middlesex Turnpike; Bedford, Massachusetts 01730. |
| (2) | The information provided in this table is based on the Company’s records, information supplied to the Company by its executive officers, directors and principal stockholders and information contained in Schedules 13D and 13G filed with the SEC. |
| (3) | Pursuant to a Schedule 13D/A filed with the SEC on December 3, 2009 by Stephen W. Bershad, Robert G. Deuster, R. Douglas Norby, Robert G. Stevens and Eliot M. Fried, Messrs. Bershad, Deuster, Norby, Stevens and Fried may comprise a “group” within the meaning of Section 13(d)(3) of the Securities and Exchange Act of 1934, as amended. The number of shares does not include 5,000 shares held by Mr. Deuster, with respect to which Mr. Deuster has sole voting and dispositive power. Messrs. Deuster, Norby, Stevens and Fried disclaim beneficial ownership in the 6,251,806 shares held by Mr. Bershad, with respect to which Mr. Bershad has sole voting and dispositive power. |
| (4) | Heidi Shippell-Heiland and K. Peter Heiland are the managers of JEC II Associates, LLC. Each of Ms. Shippell-Heiland and Mr. Heiland disclaim beneficial ownership in the securities, except to the extent of their pecuniary interest therein. |
| (5) | Pursuant to a Schedule 13G filed with the SEC on February 1, 2010, the reported shares include 2,542,317 shares held by Mittleman Investment Management LLC (“MIM”) and 200,000 shares held by Mittleman Master Fund L.P. (“MMF”). MIM is a wholly-owned subsidiary of Mittleman Brothers, LLC (“Mittleman Brothers”). Additionally, Mittleman Brothers owns 100% of Mittleman Fund Management LLC, which is the general partner of MMF. Mittleman Brothers has the sole power to vote or direct the vote of, and the sole power to dispose or direct the disposition of, all 2,742,317 reported shares. Mittleman Brothers disclaims any beneficial ownership of, or pecuniary interest in, any of the shares owned by MIM or MMF. |
| (6) | Excludes 47,000 shares that vested on March 26, 2010 but for which no common shares were issued due to the Company’s ongoing Chapter 11 proceedings. Excludes 175,000 shares of restricted stock, which are subject to a risk of forfeiture in favor of the Company and for which Dr. Edelstein does not have voting rights or the right to receive dividends until vested. |
| (7) | Includes options to purchase 20,000 common shares that are exercisable within 60 days of March 23 2010. Excludes 7,703 shares of restricted stock, which are subject to a risk of forfeiture in favor of the Company and for which Mr. Virgilio does not have voting rights or the right to receive dividends until vested. |
| (8) | Includes options to purchase 20,000 common shares that are exercisable within 60 days of March 23, 2010. Excludes 7,703 shares of restricted stock, which are subject to a risk of forfeiture in favor of the Company and for which Mr. Pond does not have voting rights or the right to receive dividends until vested. |
| (9) | Includes options to purchase 20,000 common shares that are exercisable within 60 days of March 23, 2010. Excludes 7,703 shares of restricted stock, which are subject to a risk of forfeiture in favor of the Company and for which Mr. Black does not have voting rights or the right to receive dividends until vested. |
| (10) | Includes options to purchase 20,000 common shares that are exercisable within 60 days of March 23, 2010. Excludes 7,703 shares of restricted stock, which are subject to a risk of forfeiture in favor of the Company and for which Dr. Griffiths does not have voting rights or the right to receive dividends until vested. |
| (11) | Includes options to purchase 50,000 common shares that are exercisable within 60 days of March 23, 2010. Excludes 7,703 shares of restricted stock, which are subject to a risk of forfeiture in favor of the Company and for which Dr. Garrettson does not have voting rights or the right to receive dividends until vested. |
| (12) | Includes options to purchase 50,000 common shares that are exercisable within 60 days of March 23, 2010. Excludes 7,703 shares of restricted stock, which are subject to a risk of forfeiture in favor of the Company and for which Ms. Hatsopoulos does not have voting rights or the right to receive dividends until vested. |
| (13) | Excludes 8,333 shares of restricted stock, which are subject to a risk of forfeiture in favor of the Company and for which Mr. Brak does not have voting rights or the right to receive dividends until vested. |
| (14) | Includes options to purchase 10,000 common shares that are exercisable within 60 days of March 23, 2010. Excludes 6,266 shares that vested on March 26, 2010 but for which no common shares were issued due to the Company’s ongoing Chapter 11 proceedings. Excludes 4,166 shares of restricted stock, which are subject to a risk of forfeiture in favor of the Company and for which Mr. Webb does not have voting rights or the right to receive dividends until vested. |
| (15) | Excludes 9,400 shares that vested on March 26, 2010 but for which no common shares were issued due to the Company’s ongoing Chapter 11 proceedings. Excludes 4,166 shares of restricted stock, which are subject to a risk of forfeiture in favor of the Company and for which Mr. Bellantuoni does not have voting rights or the right to receive dividends until vested. |
171
Table of Contents
EQUITY COMPENSATION PLAN INFORMATION
The following table sets forth information regarding the Company’s common shares that may be issued upon the exercise of options and rights under all of its existing equity compensation plans as of December 31, 2008:
| Plan Category |
Number of Securities to be Issued Upon Exercise of Outstanding Options |
Weighted- Average Exercise Price of Outstanding Options |
Number of Securities Remaining Available for Future Issuance Under Equity Compensation Plans (Excluding Securities Reflected in First Column) | |||||
| Equity Compensation Plans approved by security holders (1) |
430,377 | (2) | $ | 9.49 | 4,004,789 | |||
| (1) | Options outstanding as of December 31, 2008 were originally issued pursuant to the 1995 Award Plan, which was approved by the Company’s shareholders. In May 2006, the Company’s shareholders approved the adoption of the 2006 Equity Incentive Plan. The Company intends for all future equity grants to proceed under the 2006 Equity Incentive Plan. Shares issuable upon exercise of the outstanding options as of December 31, 2008 will proceed under the 2006 Equity Incentive Plan. Furthermore, pursuant to the terms of the 2006 Equity Incentive Plan, any shares reserved for issuance under the 1995 Award Plan related to options will return to the 2006 Equity Incentive Plan pool to the extent the associated options expire unexercised. Accordingly, the securities available for future issuance at December 31, 2008 relate exclusively to the 2006 Equity Incentive Plan. |
| (2) | Excludes 760,524 shares of unvested restricted common stock issued under the 2006 Equity Incentive Plan. |
All of the equity compensation plans listed above or described in the table have been approved by the Company’s shareholders. Refer to Note 10 of the Notes to Consolidated Financial Statements for further discussion regarding the Company’s equity compensation plans.
CHANGE IN CONTROL AGREEMENTS
As discussed in Item 1. Business—Significant Recent Events—The Third Modified Joint Chapter 11 Plan of Reorganization, pursuant to the Company’s Third Modified Joint Chapter 11 Plan of Reorganization (i) holders of the Senior Note Claims would, in exchange for the Senior Note Claims, receive approximately 53.8% of the Company’s post-consummation outstanding shares, (ii) the Company’s wholly owned subsidiary, GSI Group Limited, would, in exchange for the GSI UK Note Claim receive approximately 5.1% of the Company’s post-consummation outstanding shares, and (iii) the Company’s existing shareholders would retain approximately 41.1% of the Company’s post-consummation outstanding shares. As a result, if the Third Modified Joint Chapter 11 Plan of Reorganization as described in Item 1 above is confirmed by the Bankruptcy Court and becomes effective, which effectiveness is subject to customary conditions, a change in control of the Company will occur.
| Item 13. | Certain Relationships and Related Transactions, and Director Independence |
RELATED PARTY TRANSACTIONS
The Company’s written Code of Ethics and Business Conduct sets forth the general principle that the Company’s directors, officers and employees must act in the best interests of the Company and its shareholders and must refrain from engaging in any activity that presents a conflict of interest or having a personal interest that presents a conflict of interest. The Code of Ethics and Business Conduct generally provides that a conflict of interest is an interest that might impair or even appear to impair an individual’s ability to make objective and fair decisions while performing his or her duties and responsibilities to the Company honestly, objectively and effectively. There may be times when a commercial relationship involving the Company’s directors, officers or employees or their family members is beneficial to the Company and is not likely to raise material conflict of interest issues, but those situations should be disclosed to the Company for further review. The Company’s policy is to review periodically, but not less than annually, all related party transactions for potential conflict of interest situations. The Nominating and Corporate Governance Committee of the Board of Directors performs this review and determines if any transaction creates a conflict of interest.
172
Table of Contents
Richard B. Black is the Chairman of the Company’s Board of Directors. Mr. Black is also the President and Chief Executive Officer of ECRM, Inc. (ECRM). ECRM manufactures laser systems equipment for the printing and publishing industry. During the year-ended December 31, 2008, the Company recognized approximately $0.5 million in sales revenue related to purchases of equipment from the Company by ECRM. All sales to ECRM were made pursuant to the Company’s standard contract terms and conditions. The Nominating and Governance Committee of the Company’s Board of Directors has reviewed and confirmed that ECRM received no favored commercial treatment. In April 2009, Mr. Pond, a member of the Company’s Board of Directors, joined the Board of Directors of ECRM. The Board of Directors has determined that Messrs. Black and Pond are “independent directors” as defined in NASDAQ Listing Rule 5605(a)(2).
As it relates to other related party transactions during the year-ended December 31, 2008, the Company recorded sales and raw materials purchases from Sumitomo Heavy Industries Ltd. (Sumitomo), a significant shareholder of the Company. During the year-ended December 31, 2008, the Company recorded sales revenue from Sumitomo of approximately $3.1 million and purchased approximately $0.1 million of raw materials from Sumitomo. The amounts and terms of these transactions were equivalent to similar third-party transactions.
BOARD DETERMINATION OF INDEPENDENCE
The Company’s Board of Directors uses the definition of independence established by The NASDAQ Stock Market. The Company’s Board of Directors has determined that, with the exception of Sergio Edelstein, Ph.D., the Company’s President and Chief Executive Officer, all of the members of its Board of Directors as of December 31, 2008 do not have any relationship that would interfere with the exercise of independent judgment in carrying out the responsibilities of a director of the Company. Accordingly, each of Messrs. Black, Garrettson, Ph.D., Griffiths, Ph.D., Pond and Virgilio and Ms. Hatsopoulos is an “independent director” as defined in NASDAQ Listing Rule 5605(a)(2).
| Item 14. | Principal Accountant Fees and Services |
PRINCIPAL ACCOUNTANT FEES AND SERVICES
The following table sets forth the fees for professional audit services rendered by Ernst & Young LLP, the Company’s independent registered public accounting firm, for the audit of the Company’s consolidated annual financial statements for the years-ended December 31, 2008 and 2007, and fees for other services rendered by Ernst & Young LLP during those periods.
| 2008 | 2007 | |||||
| Audit Fees (1) |
$ | 4,980,000 | $ | 1,705,000 | ||
| Audit-Related Fees (2) |
572,000 | 34,000 | ||||
| Tax Fees (3) |
423,000 | 470,000 | ||||
| All Other Fees (4) |
2,000 | 1,000 | ||||
| Total |
$ | 5,977,000 | $ | 2,210,000 | ||
173
Table of Contents
| (1) | Consists of fees billed for professional services rendered for the audit of the Company’s annual consolidated financial statements and review of the Company’s interim consolidated financial statements included in quarterly reports, audit of the Company’s effectiveness of internal control over financial reporting required by Section 404 of the Sarbanes-Oxley Act of 2002 and services that are normally provided by Ernst & Young LLP in connection with statutory and regulatory filings or engagements. In 2008, audit fees increased approximately $1.5 million due to services rendered in connection with the Company’s revenue recognition investigation and financial statement restatement. Additional audit fees were incurred for the 2008 audit as the result of the change of the audit scope due to the revenue recognition errors. |
| (2) | Consists of fees billed for assurance and related services that are reasonably related to the performance of the audit and review of the Company’s consolidated financial statements and are not reported under “Audit Fees”. In 2008, such fees related to services performed by Ernst & Young LLP in connection with the Company’s acquisition of Excel Technology, Inc. |
| (3) | Consists of fees billed for professional services rendered for tax compliance, tax advice and tax planning. |
| (4) | Represents fees billed for Ernst & Young LLP’s online research tool. |
PRE-APPROVAL POLICIES AND PROCEDURES
The Audit Committee has adopted policies and procedures relating to the approval of all audit and non-audit services that are to be performed by the Company’s independent registered public accounting firm. This policy generally provides that the Company will not engage its independent registered public accounting firm to render audit or non-audit services unless the Audit Committee specifically approves the service in advance, or the engagement is entered into pursuant to the pre-approval procedure described below.
From time to time, the Audit Committee may pre-approve specified types of services that are expected to be provided to the Company by its independent registered public accounting firm during the next twelve months. An example of pre-approved services would be assistance to the Company in filing foreign statutory accounts or preparing foreign tax returns. Any such pre-approval is detailed as to the particular service or type of services to be provided and is also generally subject to a maximum dollar amount. Additionally, de minimis non-audit services may instead be approved in accordance with applicable SEC rules. The prior approval of the Audit Committee was obtained for all services provided by Ernst & Young LLP in fiscal 2008.
174
Table of Contents
PART IV
| Item 15. | Exhibits and Financial Statement Schedules |
| (a) | Documents filed as part of this report: |
1. List of Financial Statements
The financial statements required by this item are listed in Item 8, “Financial Statements and Supplementary Data” herein.
2. List of Financial Statement Schedules
All schedules are omitted because they are not applicable, not required or the required information is shown in the consolidated financial statements or notes thereto.
3. List of Exhibits
See the Company’s SEC filings on Edgar at: http://www.sec.gov/ for all Exhibits.
| Incorporated by Reference | ||||||||||||
| Exhibit Number |
Exhibit Description |
Form |
File No. |
Exhibit |
Filing Date |
Filed Herewith | ||||||
| 2.1 |
Amended and Restated Agreement and Plan of Merger, by and among Lumonics Inc., Grizzly Acquisition Corp., New Grizzly Acquisition Corp. and General Scanning, Inc., dated October 27, 1998. | S-4/A | 333-71449 | Annex A | 2/11/99 | |||||||
| 2.2 |
Asset Purchase Agreement, by and among GSI Lumonics Life Science Trust, GSI Lumonics Trust, Inc. and Packard BioScience Company, dated August 19, 2000. | 8-K | 000-25705 | 2.1 | 10/16/00 | |||||||
| 2.3 |
Purchase and Sale Agreement and Joint Escrow Instructions, by and between Alexandria Real Estate Equities, Inc., and General Scanning, Inc., dated February 29, 2000, including amendments. | 10-K | 000-25705 | 2.2 | 3/23/01 | |||||||
| 2.4 |
Agreement for the sale and purchase of the whole of the issued share capital of Westwind Air Bearings Limited and Westwind Air Bearings Inc., by and among Cobham plc, FR Holdings Inc., Lockman Investments Limited, GSI Lumonics Limited and GSI Lumonics, Corporation, dated December 10, 2003. | 8-K | 000-25705 | 2.1 | 12/10/03 | |||||||
| 2.5 |
Agreement and Plan of Merger, by and among GSI Lumonics Inc., Motion Acquisition Corporation and MicroE Systems Corp., dated April 12, 2004. | 8-K | 000-25705 | 2.1 | 4/13/04 | |||||||
| 2.6 |
Agreement and Plan of Merger, by and among the Registrant, Eagle Acquisition Corporation, and Excel Technology, Inc. dated July 9, 2008. | 8-K | 000-25705 | 2.1 | 7/11/08 | |||||||
| 2.7 |
Definitive Agreement, by and between the Registrant and Gooch & Housego plc., dated July 3, 2008. | 10-Q | 000-25705 | 2.1 | 4/13/10 | |||||||
| 3.1 |
Certificate and Articles of Continuance of the Registrant, dated March 22, 1999. | S-4/A | 333-71449 | Annex H | 2/11/99 | |||||||
| 3.2 |
By-Laws of the Registrant, as amended | 10-Q | 000-25705 | 3.2 | 4/13/10 | |||||||
| 4.1 |
Securities Purchase Agreement, by and among the Registrant, GSI Group Corporation and the purchasers set forth therein, pursuant to the Agreement and Plan of Merger by and between the Registrant, Eagle Acquisition Corporation, and Excel Technology, Inc., dated July 10, 2008. | 8-K | 000-25705 | 10.1 | 7/11/08 | |||||||
175
Table of Contents
| Incorporated by Reference | ||||||||||||
| Exhibit Number |
Exhibit Description |
Form |
File No. |
Exhibit |
Filing Date |
Filed Herewith | ||||||
| 4.2 |
Indenture, by and among GSI Group Corporation, as issuer, the Registrant and Eagle Acquisition Corporation, as Guarantors, and The Bank of New York Mellon Trust Company, N.A. as trustee, dated August 20, 2008. | 8-K | 000-25705 | 10.1 | 8/21/08 | |||||||
| 4.3 |
Warrant Agreement, by and among the Registrant and the initial holders set forth therein, dated August 20, 2008. | 8-K | 000-25705 | 10.2 | 8/21/08 | |||||||
| 4.4 |
Second Supplemental Indenture, by and among the Registrant, GSI Group Corporation, Excel Technology, Inc. and Bank of New York Mellon Trust Company, N.A., as trustee, dated March 5, 2009. | 8-K | 000-25705 | 10.1 | 3/11/09 | |||||||
| 10.1 |
Registration Rights Agreement, by and among the Registrant and the signatories thereto, dated August 20, 2008. | 8-K | 000-25705 | 10.3 | 8/21/08 | |||||||
| 10.2 |
Tender and Support Agreement, by and among the Registrant and the signatories thereto, dated July 9, 2008. | 8-K | 000-25705 | 99.1 | 7/11/08 | |||||||
| 10.3 |
Amended and Restated Shareholder Rights Plan Agreement, by and between the Registrant and Computer Share Investor Services, dated May 15, 2008. | * | ||||||||||
| 10.4 |
Form of Forbearance Agreement. | 8-K | 000-25705 | 10.1 | 2/11/09 | |||||||
| 10.5 |
Form of Indemnification Agreement. | 8-K | 000-25705 | 10.1 | 6/10/09 | |||||||
| 10.6 |
Noteholder Restructuring Plan Support Agreement, by and among the Registrant, GSI Group Corporation, MES International, Inc. and Liberty Harbor Master Fund I, L.P., Tinicum Capital Partners II, L.P., Highbridge International LLC, Special Value Continuation Partners, L.P., Special Value Expansion Fund, LLC, Tennenbaum Opportunities Partners V, LP, Special Value Opportunities Fund, LLC, and Hale Capital Partners, LP., dated November 19, 2009. | 8-K | 000-25705 | 10.1 | 11/20/09 | |||||||
| 10.7 |
Amended Noteholder Restructuring Plan Support Agreement, by and among the Registrant, GSI Group Corporation, MES International, Inc. and Liberty Harbor Master Fund I, L.P., Tinicum Capital Partners II, L.P., Highbridge International LLC, Special Value Continuation Partners, L.P., Special Value Expansion Fund, LLC, Tennenbaum Opportunities Partners V, LP, Special Value Opportunities Fund, LLC, and Hale Capital Partners, LP., dated March 16, 2010. | 8-K | 000-25705 | 10.1 | 3/19/10 | |||||||
| 10.8 |
1992 Stock Option Plan of GSIG. | S-1 | 33-95718 | Appendix B | 8/11/95 | |||||||
176
Table of Contents
| Incorporated by Reference | ||||||||||||
| Exhibit Number |
Exhibit Description |
Form |
File No. |
Exhibit |
Filing Date |
Filed Herewith | ||||||
| 10.9 |
1995 Directors’ Warrant Plan of GSIG. | S-1 | 33-95718 | 10.3 | 8/11/95 | |||||||
| 10.10 |
1994 Key Employees and Directors Stock Option Plan of Lumonics Inc. | S-4 | 333-71449 | 99.1 | 1/29/99 | |||||||
| 10.11 |
Second Restatement of GSI Lumonics Inc. 1995 Equity Incentive Plan. | S-8 | 333-118320 | 4.1 | 8/18/04 | |||||||
| 10.12 |
Form of Non-Qualified Stock Option Agreement Pursuant to the Second Restatement of GSI Lumonics Inc. 1995 Equity Incentive Plan. | 10-Q | 000-25705 | 10.1 | 11/10/04 | |||||||
| 10.13 |
2006 Equity Incentive Plan | DEF 14/A | 000-25705 | Schedule B | 4/14/06 | |||||||
| 10.14 |
GSI Lumonics Inc. Employee Stock Purchase Plan. | S-8 | 333-73666 | 4.1 | 11/16/01 | |||||||
| 10.15 |
Form of Restricted Stock Grant Agreement. | 8-K | 000-25705 | 10.1 | 3/30/07 | |||||||
| 10.16 |
Agreement of Purchase and Sale, by and between GSI Lumonics Inc. and Marcomm Fibre Optics, Inc., dated March 7, 2003. | 10-K | 000-25705 | 10.32 | 3/31/03 | |||||||
| 10.17 |
Agreement of Purchase and Sale, by and between GSI Lumonics Inc. and NegotiArt Inc., dated June 20, 2003. | 10-K | 000-25705 | 10.13 | 3/15/04 | |||||||
| 10.18 |
First Amending Agreement to the Agreement Purchase and Sale, by and between GSI Lumonics Inc. and NegotiArt Inc., dated October 1, 2003. | 10-K | 000-25705 | 10.14 | 3/15/04 | |||||||
| 10.19 |
Lease, by and between GSI Group Corporation and 123 Middlesex Turnpike, LLC, dated November 2, 2007. | * | ||||||||||
| 10.20 |
Lease Agreement, by and between GSI Lumonics Corporation and SEWS-DTC, INC., dated February 11, 2005. | 8-K | 000-25705 | 10.2 | 2/16/05 | |||||||
| 10.21 |
Agreement of Purchase and Sale of Property, by and between GSI Lumonics Inc. and Ottawa Community Housing Corporation, dated March 17, 2005. | 8-K | 000-25705 | 10.1 | 3/21/05 | |||||||
| 10.22 |
Real Estate Purchase and Sale Agreement, by and between GSI Lumonics Corporation and STAG Capital Partners, LLC, dated June 8, 2005. | 8-K | 000-25705 | 10.1 | 7/13/05 | |||||||
| 10.23 |
First Amendment to the Real Estate Purchase and Sale Agreement, by and between GSI Lumonics Corporation and STAG Capital Partners, LLC, dated July 7, 2005. | 8-K | 000-25705 | 10.2 | 7/13/05 | |||||||
| 10.24 |
Sublease Agreement, by and between GSI Lumonics GmbH and MotorVison Film, dated March 17, 2006. | 8-K | 000-25705 | 10.1 | 3/23/06 | |||||||
| 10.25 |
Real Estate Purchase and Sale Agreement, by and between the GSI Group Corporation and SAgE Aggregation, LLC, dated November 14, 2005. | 8-K | 000-25705 | 10.1 | 1/10/06 | |||||||
| 10.26 |
Amendment to Real Estate Purchase and Sale Agreement, by and between the GSI Group Corporation and SAgE Aggregation, LLC, dated December 26, 2005. | 8-K | 000-25705 | 10.2 | 1/10/06 | |||||||
177
Table of Contents
| Incorporated by Reference | ||||||||||||
| Exhibit Number |
Exhibit Description |
Form |
File No. |
Exhibit |
Filing Date |
Filed Herewith | ||||||
| 10.27 |
Second Amendment to Real Estate Purchase and Sale Agreement, by and between the GSI Group Corporation and Stag II Maple Grove LLC (successor to SAgE Aggregation, LLC), dated December 29, 2005. | 8-K | 000-25705 | 10.3 | 1/10/06 | |||||||
| 10.28 |
Settlement Agreement, by and between GSI and Robotic Vision Systems, Inc., dated June 12, 1998. | S-4 | 000-25705 | 10.31 | 1/29/99 | |||||||
| 10.29 |
OEM Supply Agreement, by and between the Registrant and Sumitomo Heavy Industries, Ltd., dated August 31, 1999. | 10-K | 000-25705 | 10.21 | 3/22/00 | |||||||
| 10.30 |
Form of Executive Retirement And Severance Benefits Agreement. | 8-K | 000-25705 | 10.1 | 2/16/05 | |||||||
| 10.31 |
Form of Executive Retention Agreement. | 8-K | 000-25705 | 10.1 | 6/9/06 | |||||||
| 10.32 |
Interim Incentive Program, dated May 18, 2006. | 10-Q | 000-25705 | 10.1 | 8/9/06 | |||||||
| 10.33 |
Transition Agreement with Mr. Charles Winston, dated July 24, 2006. | 8-K | 000-25705 | 10.1 | 7/28/06 | |||||||
| 10.34 |
Incentive Compensation Agreement by and between Registrant and Charles D. Winston, dated December 1, 2005. | 10-Q | 000-25705 | 10.1 | 5/9/06 | |||||||
| 10.35 |
Employment Agreement, by and between the Registrant and Charles D. Winston, dated January 1, 2004. | 10-K | 000-25705 | 10.5 | 3/15/04 | |||||||
| 10.36 |
Termination and Change-In-Control Agreement with Dr. Sergio Edelstein, dated February 3, 2009. | 8-K | 000-25705 | 10.1 | 2/9/09 | |||||||
| 10.37 |
Separation Agreement with Robert L. Bowen, dated January 23, 2009. | 8-K | 000-25705 | 10.1 | 1/29/09 | |||||||
| 10.38 |
Employment Agreement, by and between the Registrant and Robert L. Bowen, dated November 10, 2005. | 10-K | 000-25705 | 10.20 | 3/14/06 | |||||||
| 10.39 |
Separation Agreement with Daniel J. Lyne, dated January 23, 2009. | 8-K | 000-25705 | 10.1 | 1/29/09 | |||||||
| 10.40 |
Executive Retirement and Severance Benefits Agreement with Kurt Pelsue, dated April 22, 2005. | 8-K | 000-25705 | 10.2 | 4/27/05 | |||||||
| 10.41 |
Written Resolution of the Compensation Committee, dated August 28, 2006. | 10-Q | 000-25705 | 10.1 | 11/6/06 | |||||||
| 10.42 |
Written Resolution of the Compensation Committee, dated September 22, 2006. | 10-Q | 000-25705 | 10.2 | 11/6/06 | |||||||
| 21.1 |
Subsidiaries of the Registrant. | * | ||||||||||
| 23.1 |
Consent of Independent Registered Public Accounting Firm. | * | ||||||||||
| 31.1 |
Chief Executive Officer Certification pursuant to Section 302 of the Sarbanes-Oxley Act of 2002. | * | ||||||||||
178
Table of Contents
| Incorporated by Reference | ||||||||||||
| Exhibit Number |
Exhibit Description |
Form |
File No. |
Exhibit |
Filing Date |
Filed Herewith | ||||||
| 31.2 |
Chief Financial Officer Certification pursuant to Section 302 of the Sarbanes-Oxley Act of 2002. | * | ||||||||||
| 32.1 |
Chief Executive Officer Certification pursuant to 18 U.S.C. Section 1350, as adopted pursuant to Section 906 of the Sarbanes-Oxley Act of 2002. | * | ||||||||||
| 32.2 |
Chief Financial Officer Certification pursuant to 18 U.S.C. Section 1350, as adopted pursuant to Section 906 of the Sarbanes-Oxley Act of 2002. | * | ||||||||||
179
Table of Contents
Pursuant to the requirements of Section 13 or 15(d) of the Securities Exchange Act of 1934, the Registrant, GSI Group Inc., has duly caused this Form 10-K to be signed on its behalf by the undersigned, thereunto duly authorized.
| GSI GROUP INC. | ||
| By: | /S/ SERGIO EDELSTEIN | |
| Dr. Sergio Edelstein | ||
| President and Chief Executive Officer | ||
Date: April 13, 2010
KNOW ALL MEN BY THESE PRESENTS, that each person whose signature appears below hereby constitutes and appoints Dr. Sergio Edelstein and Glenn E. Davis, and each of them, his true and lawful proxies, attorneys-in-fact and agents, with full power of substitution and re-substitution, for him and in his name, place and stead, in any and all capacities, to (i) act on, sign and title with the SEC any and all amendments to this Annual Report on Form 10-K, together with all exhibits thereto, (ii) act, sign and file such certificates, instruments, agreements and other documents as may be necessary or appropriate in connection therewith, and (iii) take any and all actions which may be necessary or appropriate in connection therewith, granting unto such agents, proxies and attorneys-in-fact, and each of them and his and their substitute or substitutes, full power and authority to do and perform each and every act and thing necessary or appropriate to be done in connection therewith, as fully for all intents and purposes as he might or could do in person, hereby approving, ratifying and confirming all that such agents, proxies and attorneys-in-fact, any of them or any of his or their substitute or substitutes may lawfully do or cause to be done by virtue hereof.
Pursuant to the requirements of the Securities Exchange Act of 1934, this report has been signed below by the following person on behalf of the registrant and in the capacities and on the dates indicated.
| Signature |
Title |
Date | ||
| /S/ SERGIO EDELSTEIN Dr. Sergio Edelstein |
Director, President and Chief Executive Officer (Principal Executive Officer) |
April 13, 2010 | ||
| /S/ GLENN E. DAVIS Glenn E. Davis |
Principal Financial Officer and Principal Accounting Officer |
April 13, 2010 | ||
| /S/ RICHARD B. BLACK |
Chairman of the Board of Directors |
April 13, 2010 | ||
| Richard B. Black | ||||
| /S/ PHILLIP A. GRIFFITHS |
Director | |||
| Phillip A. Griffiths | April 13, 2010 | |||
| /S/ BYRON O. POND |
Director | |||
| Byron O. Pond | April 13, 2010 | |||
| /S/ BENJAMIN J. VIRGILIO |
Director | |||
| Benjamin J. Virgilio | April 13, 2010 | |||
| /S/ GARRETT A. GARRETTSON |
Director | |||
| Garrett A. Garrettson | April 13, 2010 | |||
| /S/ MARINA HATSOPOULOS |
Director | |||
| Marina Hatsopoulos | April 13, 2010 | |||
180