Attached files
| file | filename |
|---|---|
| 8-K - FORM 8-K - VERINT SYSTEMS INC | d655350d8k.htm |
 Verint Systems Inc.
Making
Big
Data
Actionable
TM
Presentation to Lenders
January 2014
THE
COMPANY
ACKNOWLEDGES
THAT
THE
RECIPIENT
OF
THIS
PRESENTATION
HAS
STATED
THAT
IT
DOES
NOT
WISH
TO
RECEIVE
MATERIAL NON-PUBLIC INFORMATION WITH RESPECT TO THE COMPANY OR ITS SECURITIES.
NEITHER THE COMPANY NOR THE ARRANGERS TAKE ANY RESPONSIBILITY FOR THE
RECIPIENT'S DECISION TO LIMIT THE SCOPE OF THE INFORMATION IT HAS OBTAINED IN
CONNECTION WITH ITS EVALUATION OF THE COMPANY AND THE FACILITIES.
Exhibit 99.1 |
 1
Forward-Looking Statements
This document contains forward-looking statements, including statements
regarding expectations, predictions, views, opportunities, plans,
strategies, beliefs, and statements
of
similar
effect
relating
to
Verint
and
the
expected
benefits
of
the
KANA
acquisition. Forward-looking statements are often identified by future or
conditional words such as "will", "would", "plans",
"expects", "intends", "believes", "seeks",
"estimates", or "anticipates", or by variations of such words
or by similar
expressions. These forward-looking statements are not guarantees of future
performance and they are based on management’s expectations that
involve a number of risks, uncertainties, and assumptions, any of which
could cause actual results or events to differ materially from those
expressed in or implied by the forward-looking statements, including
risks associated with the KANA acquisition, such as uncertainties regarding
the closing of the KANA acquisition or the ability to realize the expected
benefits of the transaction, as well as risks associated with related system
integrations. For a detailed discussion of risk factors impacting Verint,
see Verint’s Annual Report on Form 10-K for the year ended January 31,
2013, its Quarterly Report on Form 10-Q for the quarter ended October 31, 2013,
and other filings Verint makes with the SEC. The forward-looking
statements contained in this document are made as of the date of this
document, and Verint assumes no obligation to revise or update any
forward-looking statement, except as otherwise required by law.
|
 2
Management Presenters
Dan Bodner
President and Chief Executive Officer
Doug Robinson
Chief Financial Officer
Alan Roden
SVP, Corporate Development |
 3
Table of Contents
Credit Suisse
Dan Bodner
Doug Robinson
Alan Roden
Credit Suisse
5.
Syndication Overview and Timing
4.
Key Credit Highlights
3.
Financial Overview
2.
Verint Overview
1.
Transaction Overview |
 1.
Transaction Overview |
 5
Transaction Overview
On
January
6,
2014,
Verint
Systems
Inc.
(“Verint”
or
the
“Company”)
signed
a
definitive
purchase
agreement
to
acquire
KANA Software (“KANA”
or the “Target”) from Accel-KKR for $514 million in cash (the
“Transaction”) KANA is a leader in customer service solutions
delivered both on-premises and in the cloud with ~900 customers The
Transaction is expected to be financed with: ~$100 million Verint cash from
balance sheet $300 million incremental term loan on the Company’s
existing senior secured term loan facility ~$126 million revolver draw
Pro forma LTM non-GAAP revenue of $1,020 million and non-GAAP EBITDA of
$258 million Pro forma LTM gross and net leverage of 4.2x and 3.1x,
respectively Verint expects to delever through a combination of EBITDA
growth, free cash flow generation and debt paydown Verint has a track record
of successfully delevering, having reduced net leverage from 5.7x to 2.0x within two years
after acquiring Witness in FY’08
The
Company
is
also
seeking
an
amendment
to
increase
its
incremental
debt
capacity
as
well
as
amend
the
conditionality
requirements
for
future
incremental
borrowings
in
connection
with
permitted
acquisitions
Existing
lenders
should
submit
signature
pages
for
the
amendment
to
LendAmend.
Instructions
will
be
posted
to
SyndTrak
Note:
LTM based on 10/31/13 results for Verint and the midpoint of 12/31/13E estimates for
KANA. KANA has not closed its financials for 12/31/13. Preliminary estimates
for LTM 12/31/13E are non-GAAP revenue of $135–$139 million and non-GAAP EBITDA of $35–$37 million. |
 6
Sources & Uses and Pro Forma Capitalization
($ in millions)
Sources
Uses
Revolver Draw
$126
24.0%
Purchase Price
$514
Incremental Senior Secured Term Loan
300
57.0%
Estimated Transaction Expenses
12
Verint Cash from Balance Sheet
100
19.0%
Total Sources
$526
100.0%
Total Uses
$526
Note:
Based on current expectations regarding financing structure.
(1)
KANA non-GAAP EBITDA reflects the midpoint of estimated LTM 12/31/13E results of
$35–$37 million. Sources & Uses
Pro Forma Capitalization
($ in millions)
Existing
Pro Forma
10/31/2013
Adjustment
10/31/2013
Unrestricted Cash and Short-Term Investments
$376
($100)
$276
$200mm Revolving Credit Facility
–
126
126
Senior Secured Term Loan
645
300
945
Total Debt
$645
$426
$1,071
Financial summary:
$222
$36
$258
Credit statistics:
Total Debt / LTM 10/31/13 Non-GAAP EBITDA
2.9x
4.2x
Net Debt / LTM 10/31/13 Non-GAAP EBITDA
1.2x
3.1x
LTM
10/31/13
Non-GAAP
EBITDA
(1) |
 2.
Verint Overview |
 8
The Big Data Analytics Opportunity
Intelligent organizations are differentiating themselves and driving
competitive advantage through big data analytics |
 9
Helping Customers Collect Big Data -
Examples
Enterprise Case Study
Enterprise Case Study
More than 50 million customer telephony
interactions per year
More than 300 million customer text
related interactions per year -
emails,
surveys and unstructured text
Security Case Study
Security Case Study
Tens of millions of communications per
day -
phone, email, chat, SMS, web
session, social media, etc.
Requires multiple Petabytes of storage
Objective: Extract intelligence from customer
interactions for customer-centric operations
Objective: Extract intelligence from
communications to fight crime and terrorism |
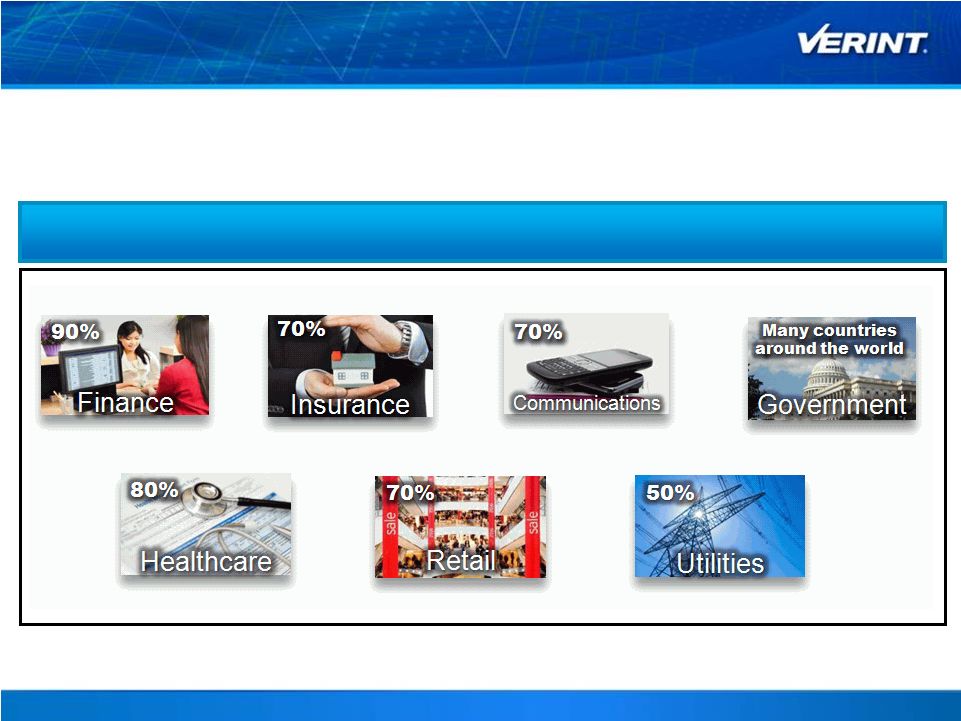 10
Large and Diversified Customer Base
Note:
%
represents
percentage
of
Global
Fortune
500
companies
that
are
Verint
customers.
Calculations based on 2012 data.
Large base of more than 10,000 customers provides Verint the opportunity to
deliver analytical applications across multiple markets
Strong Presence Across Global Fortune 500 Companies |
 11
Enterprise Intelligence
Discover
Business
Trends
Optimize
the
Workforce
Our solutions enable customer service operations to enhance the customer
experience while increasing revenue and improving profitability
We are expanding from our strong position in the contact center into branch,
back-office and customer experience functions
Understand
Customer
Sentiment |
 12
Security Intelligence
Optimize Public
Safety Call Centers
Improve Physical
Security Cost
Effectively
Generate
Intelligence
and Collect Evidence
Our
solutions
enable
security
organizations
to
leverage
big
data
from
a
Migration to IP networks creates new challenges and new opportunities
for law enforcement and security organizations
wide range of communications, video and data sources to enhance
security and prevent crime and terrorism |
 13
Go-to-Market Strategy
Growing sales force and channel partners
Verticalized direct sales force with subject matter expertise
~800 professionals in sales and marketing
Partner strategy broadens market coverage
~50% of business through channel partners: OEMs, SIs and regional resellers
Flexible business models
Perpetual, software-as-a-service, managed services
Business models reflect customer preferences
Enterprise, typical software model
Security, prefer turnkey solutions |
 14
Creating a New Leader for
Customer Engagement
To Empower Organizations to
Optimize and Transform Customer Engagements
Combination Helps Organizations Enhance Loyalty,
Mitigate Risk and Better Manage Operational Costs
The complementary solution set would enable
organizations worldwide to implement a single-vendor
solution
that helps optimize and align customer
engagement strategy |
 15
Complementary Solutions
Case Management
NLP Knowledge Management
Agent Desktop
Web Self-Service & Secure Portal
Business Process Management
Inbound Routing and Queuing
Live Chat and Co-Browsing
Text Analytics
Email & Whitemail Management
Mobile and Social
WFO and WFM
Performance Management
Desktop and Process Analytics
Enterprise Feedback Management
Customer Feedback Management
Quality Monitoring
Recording
Speech Analytics
eLearning and Coaching
Video and Situation Intelligence |
 3.
Financial Overview |
 $139
$213
$200
$192
$205
$220–$223
21%
30%
28%
24%
24%
~24%
FY'09
FY'10
FY'11
FY'12
FY'13
FY'14E
Non-GAAP EBITDA
% Margin
17
Track Record of Strong Financial Performance
Outlook
Non-GAAP Revenue
Non-GAAP EBITDA and % Margin
FYE 1/31 ($ in millions)
FYE 1/31 ($ in millions)
$675
$704
$727
$796
$848
$903–$911
FY'09
FY'10
FY'11
FY'12
FY'13
FY'14E
Note:
Guidance relates to non-GAAP revenue, EPS and EBITDA.
FYE 2014
FYE 2015
FYE 2014
FYE 2015
Guidance
from
Q3
Conference
Call
Revenue Growth: 6.5% to 7.5% from the prior year
Diluted EPS: $2.75 to $2.80
Revenue to increase between 7.0% and 9.0% compared
to the year ending January 31, 2014
Update
from
1/6/14
Conference
Call
Verint reaffirmed prior guidance
Verint guidance expected to be updated after KANA
transaction closes
CY 2014E KANA Revenue: $140 to $150 million
CY 2014E KANA EBITDA: $40 to $45 million |
 18
Pro Forma Financial Summary
LTM Non-GAAP EBITDA Contribution
LTM Non-GAAP Revenue Contribution
($ in millions)
($ in millions)
LTM Revenue by Segment Breakdown
Verint
KANA
Pro Forma
Note:
LTM financials based on 10/31/13 results for Verint and the midpoint of 12/31/13E
estimates for KANA. KANA has not closed its financials for 12/31/13.
Preliminary estimates for LTM 12/31/13E are non-GAAP revenue of $135–$139 million and non-GAAP EBITDA of $35–$37 million.
Enterprise
Intelligence
58%
Communications
Intelligence
29%
Video
Intelligence
13%
Enterprise
Intelligence
63%
Communications
Intelligence
25%
Video
Intelligence
12%
Enterprise
Intelligence
100%
$883
$137
$1,020
Verint
KANA
Pro Forma
$222
$36
$258
Verint
KANA
Pro Forma |
 19
Track Record of De-levering and Ability to
Maintain Efficient Leverage Levels
($ in millions)
Net Debt
(1)
Key Highlights
Net Debt
(1)
/ Non-GAAP EBITDA
Verint generates good free cash flow and has
demonstrated an ability to de-lever
The Company has a number of positive cash flow
characteristics
–
Operating margins greater than 20%
–
Capex of less than 2%–3% of revenue
–
Minimal working capital needs
–
Low effective tax rate due to NOLs
(2)
(1)
Total debt less unrestricted cash and short-term investments.
(2)
Cash and debt balance as of 10/31/13. Unadjusted for current transaction.
(3)
Capital
expenditures
includes
cash
paid
for
capitalized
software
development
costs.
(2)
Low Capex Needs
($ in millions)
(3)
$527
$509
$437
$413
$447
$353
$268
FY'08
FY'09
FY'10
FY'11
FY'12
FY'13
LTM
10/31/13
5.7x
3.6x
2.0x
2.1x
2.3x
1.7x
1.2x
FY'08
FY'09
FY'10
FY'11
FY'12
FY'13
LTM
10/31/13
$16
$8
$11
$16
$20
$19
2%
1%
2%
2%
2%
2%
FY'09
FY'10
FY'11
FY'12
FY'13
LTM
10/31/13
Capex
% of Revenue |
 4.
Key Credit Highlights |
 21
Verint Key Credit Highlights
Highly Diversified Business
3
Significant Free Cash Flow Generation to Support Deleveraging
4
Experienced Management Team
5
Compelling Combination
2
Strong Financial Performance Underpinned by Attractive Industry Fundamentals
1 |
 22
Strong Financial Performance Underpinned by
Attractive Industry Fundamentals
1
Enterprise Intelligence Growth Drivers
Integration of WFO applications
Greater insight through customer interaction analytics
to improve the performance of customer service
operations
Adoption of WFO across the enterprise
Migration to VoIP technologies
$139
$213
$200
$192
$205
$220–$223
21%
30%
28%
24%
24%
~24%
FY'09
FY'10
FY'11
FY'12
FY'13
FY'14E
Non-GAAP EBITDA
% Margin
Non-GAAP Revenue
Non-GAAP EBITDA and % Margin
($ in millions)
($ in millions)
$675
$704
$727
$796
$848
$903–$911
FY'09
FY'10
FY'11
FY'12
FY'13
FY'14E
Security Intelligence Growth Drivers
Growing demand for advanced intelligence and
investigative solutions
Terrorism, crime and other security threats around the
world are generating demand for advanced video
security solutions
Increasingly complex communications networks and
growing network traffic
Transition to IP networks and web and cyber security
Legal and regulatory compliance requirements |
 23
Compelling Combination
Favorable Industry Reaction to the Transaction….
…And Industry Experts
…From Wall Street Analysts…
“
Kana enhances VRNT's SaaS capabilities and call center
technologies and deepens its reach into customer experience and
workforce optimization solutions.
”
“
We believe this acquisition is a significant enhancement for
Verint, as it augments the company's existing solution suite to include
significant online/e-business capabilities, such as response
management for e-mail, chat, and social media, as well as KANA's
agent desktop solution.
”
“
We like the transaction as it could accelerate the adoption of
customer engagement suites through the deployment of a solution set
from a single vendor and increase the company's importance as a
strategic
supplier.
KANA
Software
should
add
~800
employees
(200
in
R&D) and ~900 customers to Verint. We believe the move could be an
important part in helping the overall growth rate accelerate into the
double-digits.
”
“
We like this acquisition as it is expected to be accretive to FY
2015 earnings (FYE January) and see it expanding the Company’s
service
suite
in
its
fastest
growing
area
–
actionable
intelligence.
”
“
Big data and analytics meet customer experience. Verint expects
to expand its customer engagement optimization offering with the
acquisition of Kana. Verint's core capabilites, Vovici's voice of the
customer assets, and Kana's multichannel customer experience
solutions allow customers to move from data to information to insight to
action or decisions.
”
“
The acquisition provides greater gains than just complementary
product lines, and a venue for both companies to expand their current
footprints by cross-and upselling into their respective installed base.
The acquisition provides a vision for deeply personalized customer
service
interactions
which
are
delivered
with
maximum
efficiency
for
a
contact center.
”
“
By offering a ‘best of breed’
customer support suite, with pre-
integrated EFM capabilities, Verint should not only be able to sell the
entire stack, and have infinite upsell opportunities with existing
customers, but they also can better partner with companies to create a
vision for EFM, and then enable the entire vision from phone calls to
final analysis.
”
“
Kana enhances VRNT's SaaS capabilities and call center
technologies and deepens its reach into customer experience and
workforce optimization solutions.
” |
 24
24
LTM Pro Forma Revenue by Segment
LTM Pro Forma Revenue by Type
(1)
More than 10,000 Customers in Over 150 Countries
Finance and Insurance
Communications
Government
Enterprise
Retail & Hospitality
Health Care
Utilities
Transportation
Note:
LTM pro forma revenue based on 10/31/13 results for Verint and the midpoint of
12/31/13E estimates for KANA. KANA has not closed its financials for 12/31/13.
Preliminary estimate for LTM 12/31/13E non-GAAP revenue of $135–$139 million.
(1)
KANA revenue by type estimates based on historical results; Product revenue includes
KANA License revenue; Service and Support revenue includes all other KANA revenue.
LTM Pro Forma Revenue by Region
Highly Diversified Business
3
Product Revenue
41%
Service and
Support
Revenue
59%
Americas
54%
EMEA
24%
APAC
22%
Enterprise
Intelligence
63%
Communications
Intelligence
25%
Video
Intelligence
12% |
 25
Significant Free Cash Flow Generation to
Support Deleveraging
Net Debt
(1)
Net Debt
(1)
/ Non-GAAP EBITDA
Capital Structure Highlights
Favorable debt structure
No maturities until 2018
Efficient capital structure with ability to prepay all debt without
incurring prepayment penalties
Significant free cash flow generation to support deleveraging
The Company has a number of positive cash flow characteristics
–
Operating margins greater than 20%
–
Capex of less than 2%–3% of revenue
–
Minimal working capital needs
–
Low effective tax rate due to NOLs
Proven ability to delever following an acquisition
–
Acquired Witness in FY’08 and reduced net leverage to 2.0x
by the end of FY’10
Strong liquidity
10/31/13 pro forma unrestricted cash and short-term investments
balance of $276 million
Pro forma revolver availability of ~$75 million
(1)
Total debt less unrestricted cash and short-term investments.
(2)
Calculated as CFO less capex and cash paid for capitalized software development
costs. $527
$509
$437
$413
$447
$353
$268
FY'08
FY'09
FY'10
FY'11
FY'12
FY'13
LTM
10/31/13
5.7x
3.6x
2.0x
2.1x
2.3x
1.7x
1.2x
FY'08
FY'09
FY'10
FY'11
FY'12
FY'13
LTM
10/31/13
4
Free Cash Flow
(2)
NM
$38
$93
$59
$90
$103
$154
FY'08
FY'09
FY'10
FY'11
FY'12
FY'13
LTM
10/31/13
($ in millions)
($ in millions) |
 26
Experienced Management Team
Years at Verint
Multi-
disciplinary
expertise
Significant
industry
background
Significant
M&A execution
and integration
track record
Strong
public
company
experience
Long
tenure
Professional
Experience
Dan Bodner
Chief Executive Officer and President
19
33
Doug Robinson
Chief Financial Officer
7
30
Elan Moriah
President of Verint Enterprise Intelligence Solutions and
Verint Video Intelligence Solutions
13
24
Hanan Gino
President, Communications and Cyber Intelligence
1
27
Meir Sperling
Chief Strategy Officer
13
38
Peter Fante
Chief Legal Officer and Chief Compliance Officer
11
20
Alan Roden
SVP, Corporate Development
11
20
Jane O’Donnell
SVP, Global Human Resources
12
33
5 |
 5.
Syndication Overview and Timing |
 28
Indicative Terms
Incremental Senior Secured Term Loan
(1)
Credit
agreement
terms
include
a
cap
on
cash
netting
of
$150mm.
Accordingly,
pro
forma
for
this
transaction,
the
1
lien
net
leverage
ratio
is
approximately
3.6x.
Borrower:
Verint Systems Inc.
Joint Lead Arrangers:
Credit Suisse Securities (USA) LLC, Deutsche Bank Securities Inc., RBC
Capital Markets, Barclays, HSBC Securities (USA) Inc.
Issue:
Maturity:
September 6, 2019 (same as existing TL-B)
LIBOR margin:
L + 300 bps (-25 bps step-down at BB-
/ Ba3)
LIBOR floor:
1.00%
Issue price:
99.75
Guarantors:
Same as existing, but will include all of KANA Software’s domestic
subsidiaries Amortization
:
1.00% per annum (adjusted to be fungible with existing term loans); payable
quarterly, with balance due at maturity
Incremental facility
:
Call protection:
Security:
Same as under existing facilities, with inclusion of assets of U.S.
subsidiaries of Kay Technology Holdings, Inc., including KANA Software, as
new guarantors Mandatory
prepayments:
Same as existing TL-B
Financial
covenants:
None
$200mm
plus
an
unlimited
amount
subject
to
3.5x
1st
lien
net
leverage
(1)
101 repricing protection through 3/6/2014 (same as existing TL-B)
st
$300
million
Incremental
Senior
Secured
Term
Loan
(fungible
with
existing
TL-B) |
 29
Timetable
January 13
Lender conference call
January 17
Commitments due from lenders
February 3
Close and fund
S
M
T
W
T
F
S
1
2
3
4
5
6
7
8
9
10
11
12
13
14
15
16
17
18
19
20
21
22
23
24
25
26
27
28
29
30
31
January 2014
Holiday
Key date
Date
S
M
T
W
T
F
S
1
2
3
4
5
6
7
8
9
10
11
12
13
14
15
16
17
18
19
20
21
22
23
24
25
26
27
28
February 2014
Event
(1)
(1) Closing is subject to the expiration of applicable regulatory waiting periods
and the satisfaction or waiver of the other closing conditions. |
 30
Transaction Contacts
Verint
Alan Roden
Senior Vice President, Corporate Development
(631) 962-9304
alan.roden@verint.com
Credit Suisse
Jeff Cohen
Managing Director,
Co-Head of US Syndicated Loan Capital Markets
(212) 325-7455
jeffrey.a.cohen@credit-suisse.com
Ryan Williams
Vice President,
Syndicated Loan Capital Markets
(212) 538-9568
ryan.williams@credit-suisse.com
Michael Speller
Managing Director,
Leveraged Finance Origination
(212) 538-8769
michael.speller@credit-suisse.com
Judy Smith
Managing Director,
Corporate Banking
(212) 538-2178
judy.smith@credit-suisse.com
Michael D’Onofrio
Associate,
Corporate Banking
(212) 325-6098
suisse.com
Raghu Velamati
Vice President,
Diversified Industrials and Services Investment Banking
(312) 750-3059
raghu.velamati@credit-suisse.com
Brett Kornblatt
Associate,
Diversified Industrials and Services Investment Banking
(312) 750-3043
brett.kornblatt@credit-suisse.com
Chris O’Keeffe
Analyst,
Diversified Industrials and Services Investment Banking
(312) 750-2921
christopher.okeeffe@credit-
suisse.com
michael.d’onofrio@credit-
Title
Phone
Email |
 Appendix |
 32
About Non-GAAP Financial Measures
The following tables include a reconciliation of certain financial measures
prepared in accordance with Generally Accepted Accounting Principles
(“GAAP”) to the most directly comparable financial measures not prepared
in accordance with GAAP (“non-GAAP”). Non-GAAP financial
measures should not be considered in isolation or as a substitute for comparable
GAAP financial measures. The non-GAAP financial measures we
present
in
the
following
tables
have
limitations
in
that
they
do
not
reflect
all
of
the
amounts
associated
with
our
results
of
operations
as
determined in accordance with GAAP, and these non-GAAP financial measures
should only be used to evaluate our results of operations in conjunction
with the corresponding GAAP financial measures. These non-GAAP financial measures do not represent discretionary cash available
to
us
to
invest
in
the
growth
of
our
business,
and
we
may
in
the
future
incur
expenses
similar
to
the
adjustments
made
in
these
non-GAAP
financial measures.
We believe that the non-GAAP financial measures we present in the following
tables provide meaningful supplemental information regarding our operating
results primarily because they exclude certain non-cash charges or items that we do not believe are reflective of our ongoing operating
results when budgeting, planning and forecasting, determining compensation and when
assessing the performance of our business with our individual operating
segments or our senior management. We believe that these non-GAAP financial measures also facilitate the comparison by
management and investors of results between periods and among our peer
companies. However, those companies may calculate similar non- GAAP
financial measures differently than we do, limiting their usefulness as comparative measures.
Our
non-GAAP
financial
measures
reflect
adjustments
to
the
corresponding
GAAP
financial
measure
based
on
the
items
set
forth
below.
The
purpose of these adjustments is to give an indication of our performance exclusive
of certain non-cash charges and other items that are considered
by
our
senior
management
to
be
outside
of
our
ongoing
operating
results.
The
non-GAAP
financial
measures
Verint
presents
have
limitations
in
that
they
do
not
reflect
all
of
the
amounts
associated
with
Verint’s
or
KANA’s results of operations as determined in accordance with GAAP, and these
non-GAAP financial measures should only be used to evaluate
Verint’s or KANA’s results of operations in conjunction with the
corresponding GAAP financial measures. These non-GAAP financial measures do
not represent discretionary cash available to Verint or KANA to invest in the
growth of its business, and Verint or KANA may in the future incur expenses
similar to or in addition to the adjustments made in these non-GAAP financial measures.
Because we do not predict special items that might occur in the future, and our
outlook is developed at a level of detail different than that used to
prepare GAAP financial measures, we are not providing a reconciliation to GAAP of
forward-looking financial measures for the fiscal years ending January
31, 2014 and January 31, 2015. Estimates for KANA’s non-GAAP
measures presented in this document were prepared in a manner similar to Verint’s non-GAAP measures.
KANA defines EBITDA as earnings (or loss) from continuing operations before
interest expense, income taxes, depreciation and amortization, and
amortization of non-cash stock-based compensation, non-recurring acquisition and restructuring expenses and the goodwill impairment
charges. |
 33
About Non-GAAP Financial Measures |
 34
Verint GAAP to Non-GAAP Reconciliation
($ in millions)
FY
FY
FY
FY
FY
FY
FY 2014
LTM
FYE 1/31
2008A
2009A
2010A
2011A
2012A
2013A
Q1A
Q2A
Q3A
10/31/2013
Revenue Reconciliation
GAAP revenue
$535
$670
$704
$727
$783
$840
$205
$222
$224
$881
Revenue Adjustments Related to Acquisitions
37
6
–
–
14
9
1
0
0
3
Non-GAAP revenue
$572
$675
$704
$727
$796
$848
$205
$223
$225
$883
EBIT Reconciliation
GAAP Operating Income
($115)
($15)
$66
$73
$86
$100
$14
$31
$38
$118
Revenue Adjustments Related to Acquisitions
37
6
–
–
14
9
1
0
0
3
Amortization and Impairment of Acquired Technology and Backlog
8
9
8
9
12
15
4
2
2
12
Amortization of Other Acquired Intangible Assets
20
25
22
21
23
24
6
6
6
24
Restructuring Costs
3
6
0
–
–
–
–
–
–
–
Stock-Based Compensation Expenses
31
36
44
47
28
25
6
9
10
32
M&A and Other Adjustments
–
–
1
5
12
17
6
2
0
17
Expenses Related to Restatement and Extended Filing Delay
41
29
55
29
1
–
–
–
–
–
Impairments of Goodwill and Other Acquired Intangible Assets
23
26
–
–
–
–
–
–
–
–
In-process Research and Development
7
–
–
–
–
–
–
–
–
–
Integration Costs
11
3
–
–
–
–
–
–
–
–
Other Legal Expenses (Recoveries)
9
(4)
–
–
–
–
–
–
–
–
Non-GAAP Operating Income
$75
$120
$196
$185
$177
$189
$37
$51
$56
$205
Non-GAAP Depreciation and Amortization
18
19
18
15
15
16
4
4
4
17
Non-GAAP EBITDA
$93
$139
$213
$200
$192
$205
$41
$55
$61
$222 |