Attached files
| file | filename |
|---|---|
| EX-99.1 - CONSENT OF CBRE, INC. - KBS Real Estate Investment Trust II, Inc. | kbsriiex991cbre.htm |
| 8-K - FORM 8-K - KBS Real Estate Investment Trust II, Inc. | kbsrii8k.htm |
| EX-99.2 - CONSENT OF DUFF & PHELPS, LLC - KBS Real Estate Investment Trust II, Inc. | kbsriiex992duffphelps.htm |

Exhibit 99.3 1

KBS REIT II Valuation & Portfolio Update December 20, 2013

Forward-Looking Statements The information contained herein should be read in conjunction with, and is qualified by, the information in KBS Real Estate Investment Trust II’s (“KBS REIT II”) Annual Report on Form 10-K for the year ended December 31, 2012, filed with the Securities and Commission Exchange (the “SEC”) on March 8, 2013, and in KBS REIT II’s Quarterly Report on Form 10-Q for the quarter ended September 30, 2013 (the “Quarterly Report”), filed with the SEC on November 8, 2013, including the “Risk Factors” contained in each such filing. For a full description of the limitations, methodologies and assumptions used to value KBS REIT II’s assets and liabilities in connection with the calculation of KBS REIT II’s estimated value per share, see KBS REIT II’s Current Report on Form 8-K, filed with the SEC on December 19, 2013. Forward-Looking Statements Certain statements contained herein may be deemed to be forward-looking statements within the meaning of the Federal Private Securities Litigation Reform Act of 1995. KBS REIT II intends that such forward-looking statements be subject to the safe harbors created by Section 27A of the Securities Act of 1933, as amended, and Section 21E of the Securities Exchange Act of 1934, as amended. These statements include statements regarding the intent, belief or current expectations of KBS REIT II and members of its management team, as well as the assumptions on which such statements are based, and generally are identified by the use of words such as “may,” “will,” “seeks,” “anticipates,” “believes,” “estimates,” “expects,” “plans,” “intends,” “should” or similar expressions. Further, forward-looking statements speak only as of the date they are made, and KBS REIT II undertakes no obligation to update or revise forward-looking statements to reflect changed assumptions, the occurrence of unanticipated events or changes to future operating results over time, unless required by law. Actual results may differ materially from those contemplated by such forward-looking statements. The valuation methodology for KBS REIT II’s real estate properties assumes the properties realize the projected cash flows and expected exit cap rates and that investors would be willing to invest in such properties at yields equal to the expected discount rates. Though the valuation estimates used in calculating the estimated value per share are CBRE’s, Duff & Phelps’, or KBS REIT II’s and/or the Advisor’s best estimates as of December 18, 2013, KBS REIT II can give no assurance in this regard. These statements also depend on factors such as: future economic, competitive and market conditions; KBS REIT II’s ability to maintain occupancy levels and lease rates at its real estate properties; the borrowers under KBS REIT II’s loan investments continuing to make required payments under the loan documents; the ability of certain borrowers to maintain occupancy levels and lease rates at the properties securing KBS REIT II’s real estate-related investments; and other risks identified in Part I, Item IA of KBS REIT II’s Annual Report on Form 10-K for the year ended December 31, 2012, as filed with the SEC. Actual events may cause the value and returns on KBS REIT II’s investments to be less than that used for purposes of KBS REIT II’s estimated value per share. 3

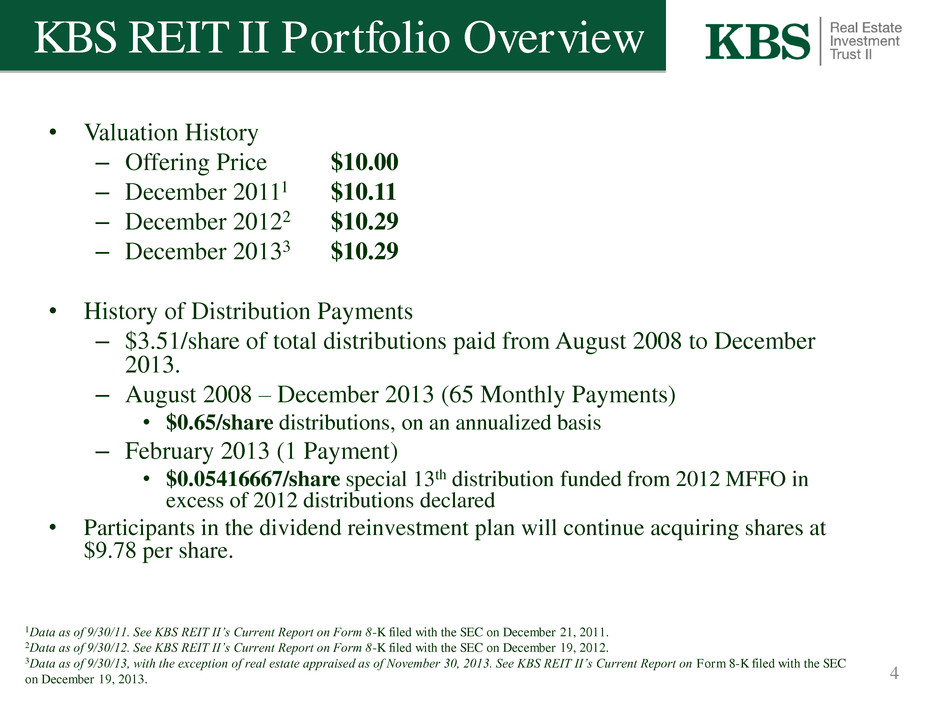
• Valuation History – Offering Price $10.00 – December 20111 $10.11 – December 20122 $10.29 – December 20133 $10.29 • History of Distribution Payments – $3.51/share of total distributions paid from August 2008 to December 2013. – August 2008 – December 2013 (65 Monthly Payments) • $0.65/share distributions, on an annualized basis – February 2013 (1 Payment) • $0.05416667/share special 13th distribution funded from 2012 MFFO in excess of 2012 distributions declared • Participants in the dividend reinvestment plan will continue acquiring shares at $9.78 per share. 4 1Data as of 9/30/11. See KBS REIT II’s Current Report on Form 8-K filed with the SEC on December 21, 2011. 2Data as of 9/30/12. See KBS REIT II’s Current Report on Form 8-K filed with the SEC on December 19, 2012. 3Data as of 9/30/13, with the exception of real estate appraised as of November 30, 2013. See KBS REIT II’s Current Report on Form 8-K filed with the SEC on December 19, 2013. KBS REIT II Portfolio Overview

• KBS REIT II followed the IPA Valuation Guidelines, which included independent third-party appraisals of its properties this year. All property values are equal to their appraised values. • All real estate properties except one had an appraisal performed by CBRE.1 • Real estate-related investments, cash, other assets, mortgage debt and other liabilities were valued by the Advisor, similar to prior years. The estimated values of the real estate-related investments and mortgage debt are equal to the GAAP fair values as disclosed in the footnotes to KBS REIT II’s 10-Q for the period ended September 30, 2013. • The estimated values of cash and a majority of other assets and other liabilities are equal to their carrying values which will approximate their fair values due to their short maturities or liquid nature. • The estimated value of KBS REIT II’s assets less the estimated value of KBS REIT II’s liabilities was then divided by the number of shares outstanding as of September 30, 2013 to arrive at the estimated value per share. Valuation Information 5 Third Party Valuation 1 CBRE was engaged as the leasing agent for one of KBS REIT II’s real estate properties in New Jersey and was not able to provide an appraisal in accordance with New Jersey law. As a result, KBS REIT II engaged Duff & Phelps to appraise this property. The appraisals were performed in accordance with the Code of Ethics and the Uniform Standards of Professional Appraisal Practice, or USPAP, as well as the requirements of the state where each real estate property is located. Each appraisal was reviewed, approved and signed by an individual with the professional designation of MAI.

KBS REIT II Portfolio Overview Estimated Value of Current Portfolio2 As of December 18, 2013 Assets: $3.649 Billion – Real Estate • 27 Assets • $3.197 Billion (87%) – Loan Investments • 7 Assets • $389.5 Million (11%) – Other Assets3 • $62.9 Million (2%) Liabilities: $1.666 Billion – Loans Payable: $1.589 Billion – Other Liabilities4: $77 Million Net Equity at Estimated Value: $1.983 Billion Occupancy: 95%5 6 1Includes assets acquired after initial offering period. 2Values as of September 30, 2013, with the exception of real estate appraised as of November 30, 2013. 3Includes cash and cash equivalents, restricted cash, rents and other receivables and prepaid expenses. 4Includes accounts payable, accrued liabilities, distributions payable, security deposits, prepaid rent and interest rate swap liability. 5As of September 30, 2013 for real estate portfolio. • Raised $1.8 billion of equity in initial offering. • Acquired or originated $3.2 billion portfolio of 28 properties and 8 loan investments.1

On December 18, 2013 the Board approved an estimated value per share of $10.29. Although there was no change to KBS REIT II’s estimated value per share from the previous estimate, below is a summary of changes within each asset and liability group. Valuation Information 7 1The changes are not equal to the change in values of each asset and liability group due to asset sales, new investments, loan payments, refinancings and other factors, which caused the value of certain asset or liability groups to change with no impact to KBS REIT II’s fair value of equity or the overall estimated value per share. 2The decrease in real estate loans receivable is primarily due to the fact that the loans are one year closer to maturity, resulting in the loan values decreasing towards the face values of the loans, as the loans are currently valued above their face values as a result of the contractual yields being greater than the current estimated market yields on similar loans. The decrease is also due to a slight increase in market interest rates assumed in valuing the real estate loans receivable compared to prior year. 3Shares sold under KBS REIT II’s dividend reinvestment plan are sold at a price equal to 95% of the most recent estimated value per share. Additionally, shares were redeemed at an average price that is slightly lower than $10.29 in accordance with KBS REIT II’s share redemption program. In general, shares sold under KBS REIT II’s dividend reinvestment plan would result in a decrease to the estimated value per share and shares redeemed pursuant to the share redemption program at a price less than the estimated value per share would result in an increase to the estimated value per share. The activities related to the dividend reinvestment plan and the share redemption program resulted in a net decrease of $0.02 to the estimated value per share. 4“Other changes, net” consists of various unrelated insignificant items For more information, see KBS REIT II’s Current Report on Form 8-K filed with the SEC on December 19, 2013. Change in Estimated Value Change in (in thousands) 1 Estimated Value Per Share December 2012 Estimated Value Per Share 10.29$ Change in value due to a special distribution declared on January 16, 2013 (10,350)$ (0.05) Change in value due to operating cash flows in excess of monthly distributions declared 13,306 0.07 Real estate 47,902 0.25 Capital expenditures on real estate (38,025) (0.20) Real estate loans receivable (7,539) (0.04) 2 Notes payable 1,041 0.01 Share price discount on dividend reinvestment plan shares, net of redemptions (3,234) (0.02) 3 Other changes, net (3,088) (0.02) 4 Total Change 13$ -$ December 2013 Estimated Value Per Share 10.29$

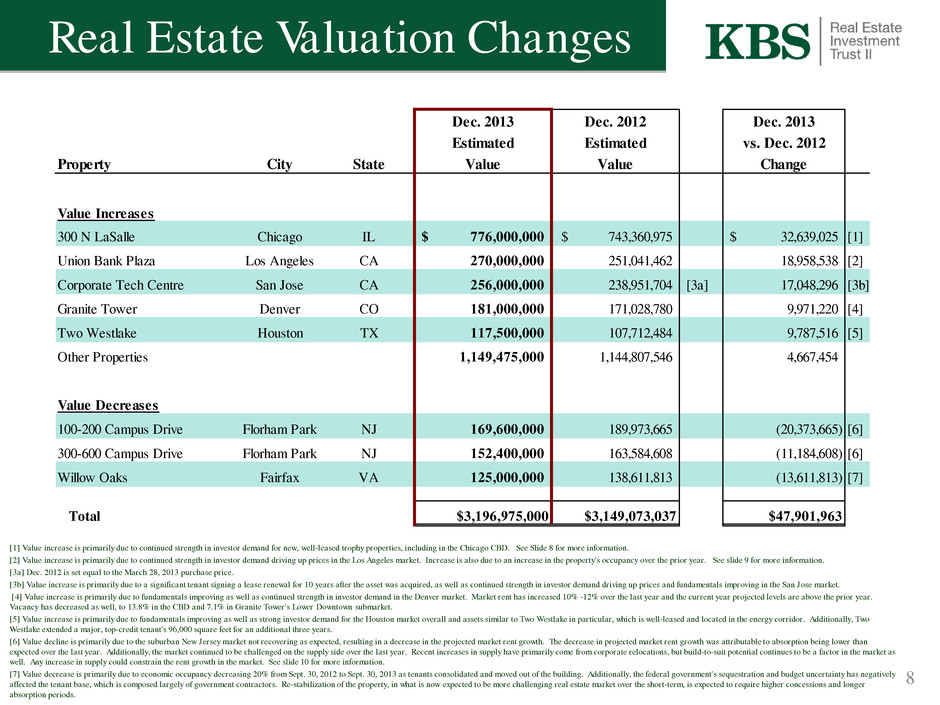
Real Estate Valuation Changes 8 [1] Value increase is primarily due to continued strength in investor demand for new, well-leased trophy properties, including in the Chicago CBD. See Slide 8 for more information. [2] Value increase is primarily due to continued strength in investor demand driving up prices in the Los Angeles market. Increase is also due to an increase in the property's occupancy over the prior year. See slide 9 for more information. [3a] Dec. 2012 is set equal to the March 28, 2013 purchase price. [3b] Value increase is primarily due to a significant tenant signing a lease renewal for 10 years after the asset was acquired, as well as continued strength in investor demand driving up prices and fundamentals improving in the San Jose market. [4] Value increase is primarily due to fundamentals improving as well as continued strength in investor demand in the Denver market. Market rent has increased 10% -12% over the last year and the current year projected levels are above the prior year. Vacancy has decreased as well, to 13.8% in the CBD and 7.1% in Granite Tower's Lower Downtown submarket. [5] Value increase is primarily due to fundamentals improving as well as strong investor demand for the Houston market overall and assets similar to Two Westlake in particular, which is well-leased and located in the energy corridor. Additionally, Two Westlake extended a major, top-credit tenant's 96,000 square feet for an additional three years. [6] Value decline is primarily due to the suburban New Jersey market not recovering as expected, resulting in a decrease in the projected market rent growth. The decrease in projected market rent growth was attributable to absorption being lower than expected over the last year. Additionally, the market continued to be challenged on the supply side over the last year. Recent increases in supply have primarily come from corporate relocations, but build-to-suit potential continues to be a factor in the market as well. Any increase in supply could constrain the rent growth in the market. See slide 10 for more information. [7] Value decrease is primarily due to economic occupancy decreasing 20% from Sept. 30, 2012 to Sept. 30, 2013 as tenants consolidated and moved out of the building. Additionally, the federal government's sequestration and budget uncertainty has negatively affected the tenant base, which is composed largely of government contractors. Re-stabilization of the property, in what is now expected to be more challenging real estate market over the short-term, is expected to require higher concessions and longer absorption periods. Dec. 2013 Dec. 2012 Dec. 2013 Estimated Estimated vs. Dec. 2012 Property City State Value Value Change Value Increases 300 N LaSalle Chicago IL 776,000,000$ 743,360,975$ 32,639,025$ [1] Union Bank Plaza Los Angeles CA 270,000,000 251,041,462 18,958,538 [2] Corporate Tech Centre San Jose CA 256,000,000 238,951,704 [3a] 17,048,296 [3b] Granite Tower Denver CO 181,000,000 171,028,780 9,971,220 [4] Two Westlake Houston TX 117,500,000 107,712,484 9,787,516 [5] Other Properties 1,149,475,000 1,144,807,546 4,667,454 Value Decreases 100-200 Campus Drive Florham Park NJ 169,600,000 189,973,665 (20,373,665) [6] 300-600 Campus Drive Florham Park NJ 152,400,000 163,584,608 (11,184,608) [6] Willow Oaks Fairfax VA 125,000,000 138,611,813 (13,611,813) [7] Total $3,196,975,000 $3,149,073,037 $47,901,963

300 North LaSalle • 1,302,901 SF Class A office tower in CBD Chicago • Acquired July 2010 for $655.0 million plus closing costs • $776.0 million estimated value as of December 18, 2013 represents 4.4% increase from estimated value as of December 18, 2012 and 18.5% from purchase price. • 99% leased as of September 30, 2013 Value increase is primarily due to continued strength in investor demand for new, well-leased trophy properties, including in the Chicago CBD. 9

Union Bank Plaza • 627,334 SF Class A office tower in Los Angeles • Acquired September 2010 for $208.0 million plus closing costs • $270.0 million estimated value as of December 18, 2013 represents 7.6% increase from estimated value as of December 18, 2012 and 29.8% from purchase price. • 90% leased as of September 30, 2013 Value increase is primarily due to continued strength in investor demand driving up prices in the Los Angeles market in addition to an increase in the property's occupancy over the prior year. 10

100-200, 300-600 Campus Drive • 1,147,507 SF Class A office park in Florham Park, NJ • Acquired as two investments in September and October 2008 for a cumulative $365.0 million plus closing costs • Suburban New Jersey market recovery is muted (absorption lower than expected over the last year with market rents not increasing), resulting in a decrease in the projected market rent growth. • The market continues to be challenged from a supply side. Recent increases have primarily come from corporate relocations and build-to-suit projects. • KBS REIT II is responding to the challenge these properties pose with a number of strategies in an attempt to grow the values with an emphasis on long-term returns for investors. These strategies include: – Changing leasing agents to reinvigorate leasing efforts. – Enriching the amenities offered in order to improve connectivity and tenant experience. These include a shuttle service to the local train station and retailers, a food delivery service, a new athletic facility and conference facility. – Exploring becoming the first property in the market to offer back-up generator power. Costs would potentially be passed through to the tenants, who may view this capability as important given the weather and storm issues in recent years. These properties are still considered best-in-class for suburban New Jersey and management aims to implement the strategies above to allow the investment to achieve its full potential. 11

One Liberty Plaza Sale On October 11, 2013, KBS REIT II sold its debt investment in the One Liberty Plaza Notes to harvest gains and maximize the return of this investment above initial expectations at acquisition. • The gains were entirely accounted for in the December 2013 estimated value per share. • $20 million of the net proceeds were used to provide additional funding under the share redemption program. Acquired: February 2009 Par Value (at Time of Sale): $112.5 Million Purchase Price: $66.7 Million (42% discount) Sales Price: $114.3 Million (2% premium) Net Economic Gain on Sale:1 $48.6 Million (73% of purchase price) Interest Income Received: $33.0 Million (49% of purchase price) Total Return: $81.6 Million (122% of purchase price) (Gain Plus Interest Received) 12 $66.7 $66.7 $48.6 $33.0 $0 $50 $100 $150 Outflows Inflows Breakdown of One Liberty Plaza Cash Flows ($MM) Interest Income Received Net Gain on Sale Purchase Price (Cost Basis) 1The economic gain on sale shown is equivalent to the net sales price after closing costs less total purchase cost as reduced by principal payments

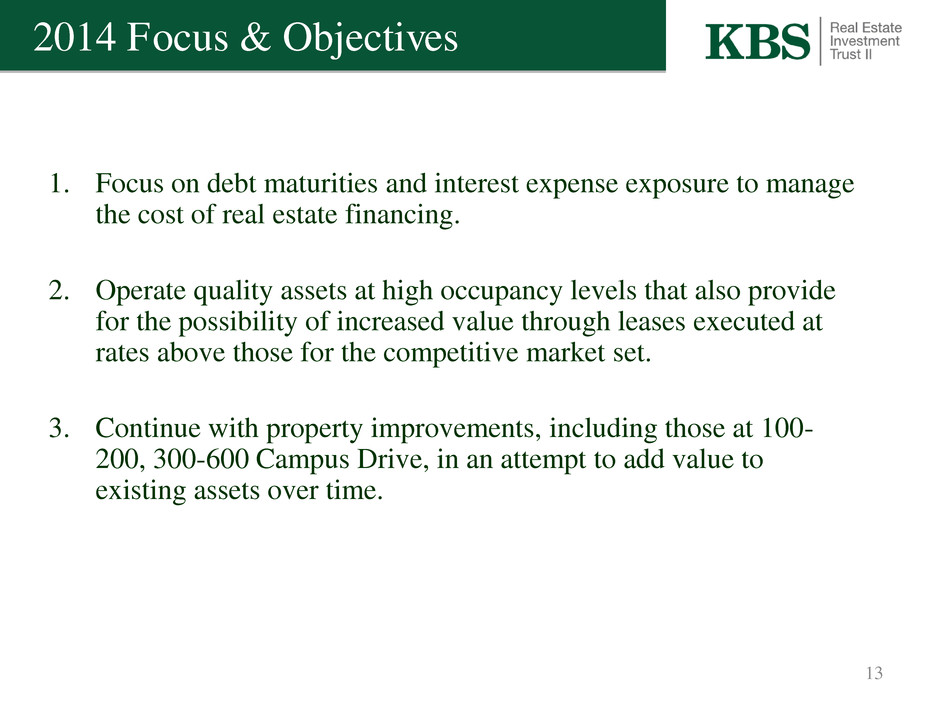
2014 Focus & Objectives 1. Focus on debt maturities and interest expense exposure to manage the cost of real estate financing. 2. Operate quality assets at high occupancy levels that also provide for the possibility of increased value through leases executed at rates above those for the competitive market set. 3. Continue with property improvements, including those at 100- 200, 300-600 Campus Drive, in an attempt to add value to existing assets over time. 13

Thank You. Q&A 14
