Attached files
| file | filename |
|---|---|
| 8-K - FORM 8-K - Lumber Liquidators Holdings, Inc. | v362560_8k.htm |
| EX-99.1 - EXHIBIT 99.1 - Lumber Liquidators Holdings, Inc. | v362560_ex99-1.htm |
Exhibit 99.2

1 Credit Suisse Hardline Retail Roundup December 10, 2013
2 Safe Harbor Statement The following information contains forward - looking statements . These forward looking statements are based on management’s expectations and beliefs concerning future events, and are subject to uncertainties, risks and factors relating to management’s operations and business environments, all of which are difficult to predict and many of which are outside management’s control, that could cause actual results to differ materially from those matters expressed or implied in the forward - looking statements . You are cautioned not to put undue reliance on such forward - looking statements because actual results may vary materially from those expressed or implied . All forward - looking statements are based on information available to management on this date, and Lumber Liquidators Holdings, Inc . assumes no obligation to, and expressly disclaims any obligation to, update or revise any forward - looking statements, whether as a result of new information, future events or otherwise . Please refer to the financial statements and notes and management discussion included in our annual reports on Form 10 - K and our quarterly reports on Form 10 - Q for definitions of key terms including comparable store net sales, average sale, comparable store traffic and cannibalization .
3 Lumber Liquidators Overview ● Growth Retailer – Largest Specialty Retailer of Flooring ● Differentiated Value Proposition ● Significant Opportunity to Expand in a Highly Fragmented Market ● Unique Store Model with Enhanced Showroom Format ● Continuous Improvement and Reinvestment in our Business Our Goal: Cumulative, multi - year growth of sales and operating margin

4 Guidance & 2014 Initiatives
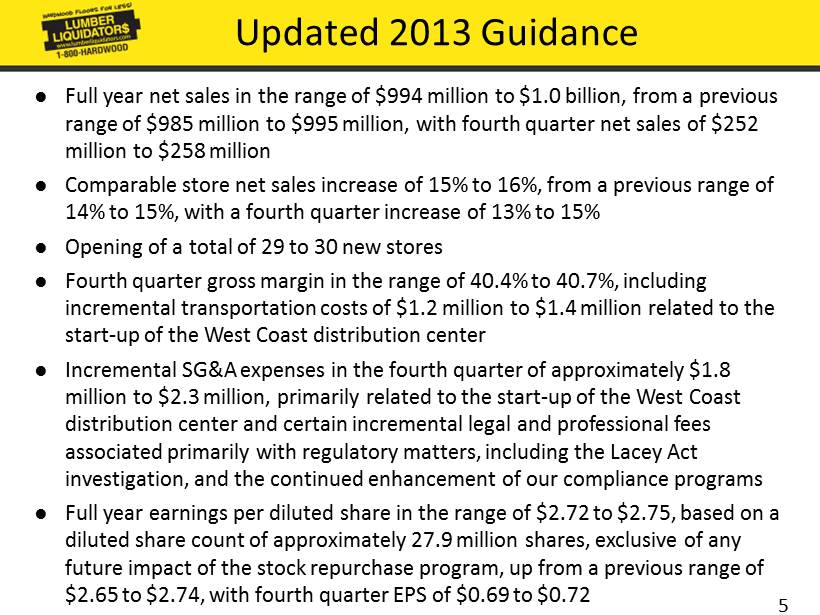
5 Updated 2013 Guidance ● Full year net sales in the range of $ 994 million to $1.0 billion, from a previous range of $985 million to $995 million, with fourth quarter net sales of $ 252 million to $258 million ● Comparable store net sales increase of 15% to 16%, from a previous range of 14% to 15%, with a fourth quarter increase of 13% to 15% ● Opening of a total of 29 to 30 new stores ● Fourth quarter gross margin in the range of 40.4% to 40.7%, including incremental transportation costs of $1.2 million to $1.4 million related to the start - up of the West Coast distribution center ● Incremental SG&A expenses in the fourth quarter of approximately $ 1.8 million to $2.3 million, primarily related to the start - up of the West Coast distribution center and certain incremental legal and professional fees associated primarily with regulatory matters, including the Lacey Act investigation, and the continued enhancement of our compliance programs ● Full year earnings per diluted share in the range of $ 2.72 to $ 2.75, based on a diluted share count of approximately 27.9 million shares, exclusive of any future impact of the stock repurchase program, up from a previous range of $2.65 to $ 2.74, with fourth quarter EPS of $ 0.69 to $ 0.72

6 2014 Key Initiatives ● Increase expanded showroom format throughout the chain through the opening of new locations and remodeling existing stores » Expect to end 2013 with 317 to 318 stores in operation; 49 to 52 with expanded showrooms ▪ In 2014, open 30 to 40 new stores, all in the expanded showroom format ▪ In 2014, r emodel 25 to 35 existing stores to the expanded showroom format, either in place or combined with relocation within primary trade area » Anticipate ending 2014 with 347 to 358 stores, 104 to 127 with expanded showrooms ● Continue to broaden the reach and frequency of our advertising to aggressively pursue market share » Expect a 25% to 35% increase in advertising expenses
7 2014 Key Initiatives cont’d ● Continued gross margin expansion from increased attachment of moldings & accessories, sales mix shifts, retail price discipline and sourcing initiatives » Expect to continue our sourcing strategy of direct sourcing with international and domestic mills to control product cost and quality, enhance forecasting and broaden our product assortment ● Supply chain optimization with the opening of both West Coast (Q1) and East Coast (Q4) distribution centers » Expect operating margin to benefit from each opening approximately six months after each is fully operational ● Develop the best people to serve our customers » Expect to lever compensation expenses while increasing investment in Best People initiative
8 Initial 2014 Guidance ● Full year net sales in the range of $1.15 billion to $ 1.20 billion, an increase of approximately 15% to 20% ● Comparable store net sales increase of 7% to 12% ● SG&A Expenses up 16% to 18% compared to 2013, including increases in legal and professional fees associated primarily with regulatory matters, including the Lacey Act investigation, and the continued enhancement of our compliance programs » Capital expenditures in the range of $65 million to $75 million ● Operating margin in the range of 13.0% to 13.8% ● Full year earnings per diluted share in the range of $3.25 to $ 3.60, based on a diluted share count of approximately 28.2 million shares, exclusive of any future impact of the stock repurchase program ● Detailed 2014 guidance to be provided in conjunction with Q4 2013 earnings release

9 Strategic Initiatives

10 Driving Continuous Improvement in Everything We Do ● Grow revenue ● Drive traffic through advertising reach and frequency ● Enhance margin through sourcing initiatives ● Optimize our supply chain – operationally then structurally ● Develop the best people to serve our customers Strategy: Generate the Fuel to Drive Operating Margin Expansion and Reinvest in our Value Proposition

11 Growth Retailer – Largest Specialty Retailer of Flooring $681.6 $813.3 $997.0 2011 2012 2013E ($ in millions) (Guidance Midpoint) Total % 9.9% 20.8% 22.2 % - 23.0 % Comp % (2.0%) 11.4% 15.0% - 16.0% Store Count 263 288 317 - 318 Store Growth% 17.9% 9.5% 10.1% - 10.4% ● Store base expansion ● Driving traffic through advertising ● World class sales force ● Ranked #1 of the top 50 flooring retailers; larger than #3 - #7 combined (1) (1) Floor Covering Weekly May 6, 2013 Issue

12 Highly skilled flooring experts with training to identify and serve both knowledgeable DIY and casual consumers needing greater assistance World class, highly motivated sales force Coordinated store support infrastructure focused on service and continuous improvement Availability Product specifications for industry - leading quality and performance Significant investment in quality control and assurance around the world, including 60 professionals in the US, China and South America monitoring daily, most often at the mill Differentiated Value Proposition Price Selection Source direct from the mills, often purchasing the majority of our mill - partners’ capacity Lowest prices in the market with greatest price advantages in premium products of each merchandise category; Proprietary brands provide Price Point for everyone Broadest assortment of 25 wood species and over 340 varieties The complete purchase (moldings, accessories, tools) Quality Entire assortment generally available in no more than 2 weeks Best sellers are in - stock, in stores People
13 Significant Opportunity to Expand in a Highly Fragmented Market ● 133 million housing units in the US with 75 million owner - occupied homes ● Since our IPO in 2007, we believe we have penetrated less than 3% of those owner - occupied homes ● Annual flooring sales of both hard and soft surfaces estimated at over $50 billion, with over $30 billion in residential replacement ● Hard surfaces including wood, laminate, bamboo and resilient gaining share as technology improves product performance with retail price points competitive with carpet ● Hard surface market highly fragmented with more than 11,000 independents representing over 60% of the market

14 Store Base Expansion Estimate the United States can support at least 600 store locations and Canada at least 30 store locations ● Improved real estate approach focusing on total market results ● Do not believe any primary or secondary markets are saturated ● Continuous improvement in our four - wall contribution, impact of Store of the Future rollout and normalization of residential replacement market may increase potential store count (1) A cannibalized market has at least one comparable store and one non - comparable store
15 Portfolio of Initiatives Driving Store Performance ● There is a portfolio of initiatives driving store performance: » Market - based approach versus per unit » Improved real estate locations (retail - centric vs. industrial) » Market size (emphasis on major metro markets) » Strength in residential remodeling » Advertising reach and frequency » Best people and continuous improvement in operations » Store of the Future – showroom and assortment 50.8% 55.0% 57.1% 68.7% 78.5% 2009 2010 2011 2012 2013E New Store Productivity
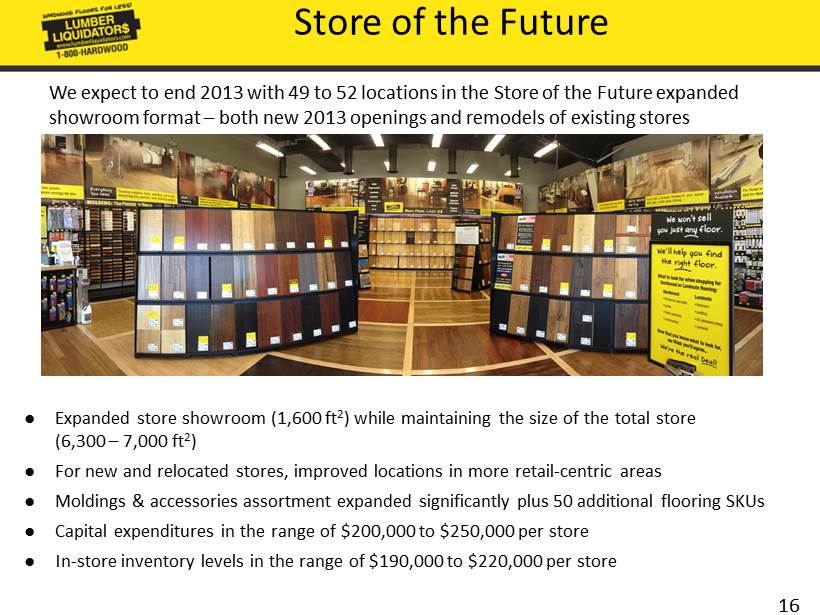
16 Store of the Future ● Expanded store showroom (1,600 ft 2 ) while maintaining the size of the total store ( 6,300 – 7,000 ft 2 ) ● For new and relocated stores, improved locations in more retail - centric areas ● Moldings & accessories assortment expanded significantly plus 50 additional flooring SKUs ● Capital expenditures in the range of $ 200,000 to $250,000 per store ● In - store inventory levels in the range of $190,000 to $220,000 per store We expect to end 2013 with 49 to 52 locations in the Store of the Future expanded showroom format – both new 2013 openings and remodels of existing stores

17 - 1.1% 5.5% 9.1% 14.4% 16.3% 22.3% 2010 2011 2012 1H 2013 Q3 2013 Net Sales % Increase Total Company over 36 ms Remodeled SOTF Non - cannibals Stores Open for 36+ Months ● Net sales for more mature stores (stores in operation for more than 36 months) continue to gain strength ● Additionally, though a short duration, remodeled Store of the Future locations (non - cannibals) in aggregate were up 22.3% in Q3 versus an increase of 16.3% for all stores in operation for more than 36 months Note: The 14 remodeled stores only averaged 5 months of operation
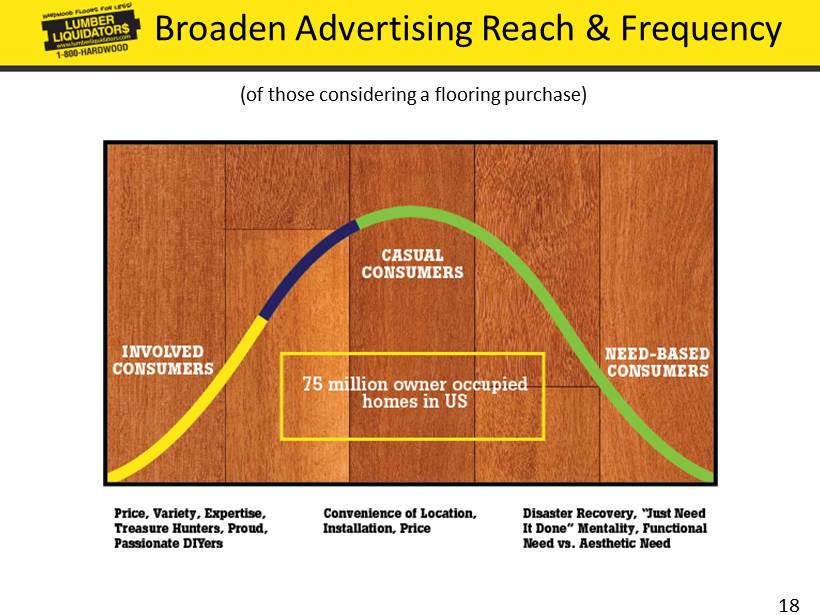
18 Broaden Advertising Reach & Frequency (of those considering a flooring purchase)
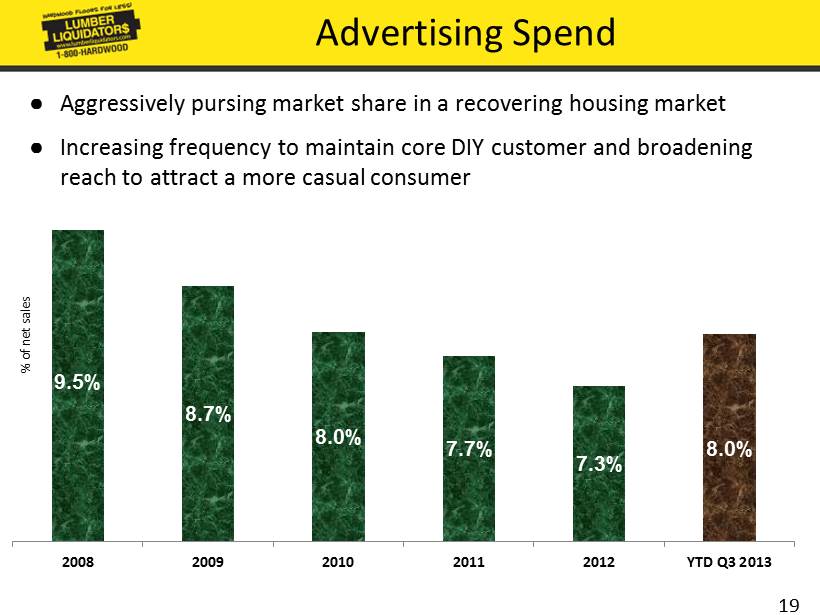
19 Advertising Spend % of net sales 9.5% 8.7% 8.0% 7.7% 7.3% 8.0% 2008 2009 2010 2011 2012 YTD Q3 2013 ● Aggressively pursing market share in a recovering housing market ● Increasing frequency to maintain core DIY customer and broadening reach to attract a more casual consumer

20 35.10% 41.20% YTD Q3 2010 Gross Margin Sequoia Acquisition (eliminate markup on one-third of Total Sales Mix) Sourcing Initiatives -Eliminate Middlemen -Vendor Allowances -Line Reviews Increased Sales Mix of Moldings, Accessories, & Tools ASP & Sales Mix -Premium Product Conversion -Store Training -POS Discipline -Expansion of Customer Base Investment in Quality & Related Costs Transportation -International -Domestic -Customs charges -Duty charges -Fuel charges YTD Q3 2013 Gross Margin 50 to 100 bps 200 to 300 bps 150 to 200 bps (40) bps Portfolio of Gross Margin Drivers For the three years ended September 30, 2013 (50) bps 610 bps Increase 100 to 150 bps

21 ● Direct sourcing is key to our value proposition ● Strong relationships with more than 150 domestic and international vendors, primarily mill s ● Top 20 suppliers account for 65% of supply purchases » No single supplier provides more than 4% of our hardwood purchases » No single hardwood product represents more than 1% of our sales mix » SKUs are produced by multiple mills, with the most significant ones in an A - B structure ● Mills go through an on - boarding process and regular reviews of performance » Since the fourth quarter of 2011, we have replaced 50% of the Asian mills existing at that time, yet doubled the net total number of mills to reduce risk by diversifying our supply base » In any given year, we expect mill turnover to range from 15% to 30%, yet continue to broaden the number of mills supplying flooring products Our Sourcing

22 43% 39% 18% Solid & Engineered Hardwood Laminates, Bamboo, Resilient & Cork Moldings, Accessories & Other 64% 24% 12% Sales Mix – 2008 vs. 2013 2008 2013 ● We have expanded and improved our assortment of laminates, bamboo and resilient » Improvements in technology resulting in more realistic - looking and attractive products » Customers migrating to these lower priced products » Hardwoods, primarily solid and to a lesser degree, engineered, yielding share to these products » These products are generally sourced out of Asia, either because they are native to Asia or labor is a higher component of total cost ● We have been emphasizing moldings, accessories and tools to provide the customer a complete flooring solution ● These changes have driven our geographic sourcing mix
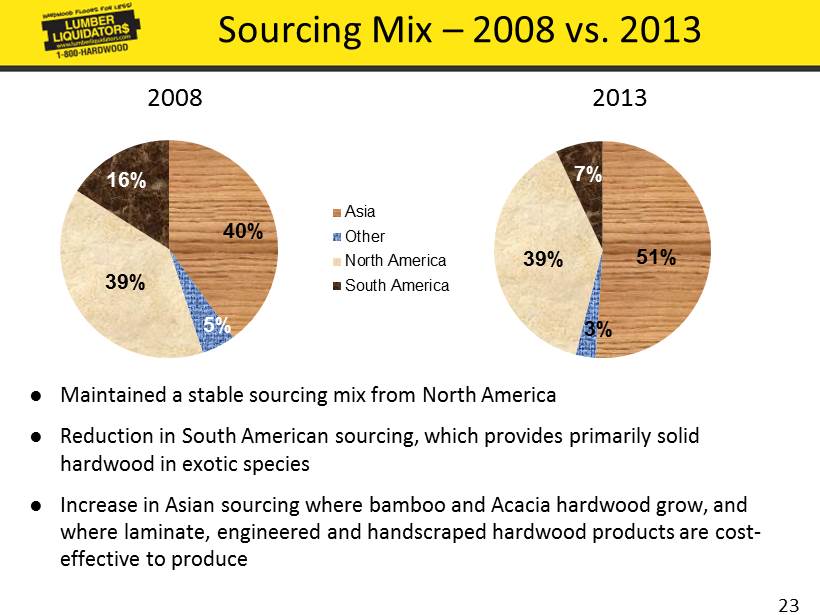
23 51% 3% 39% 7% Asia Other North America South America Sourcing Mix – 2008 vs. 2013 2008 2013 40% 5% 39% 16% ● Maintained a stable sourcing mix from North America ● Reduction in South American sourcing, which provides primarily solid hardwood in exotic species ● Increase in Asian sourcing where bamboo and Acacia hardwood grow, and where laminate, engineered and handscraped hardwood products are cost - effective to produce
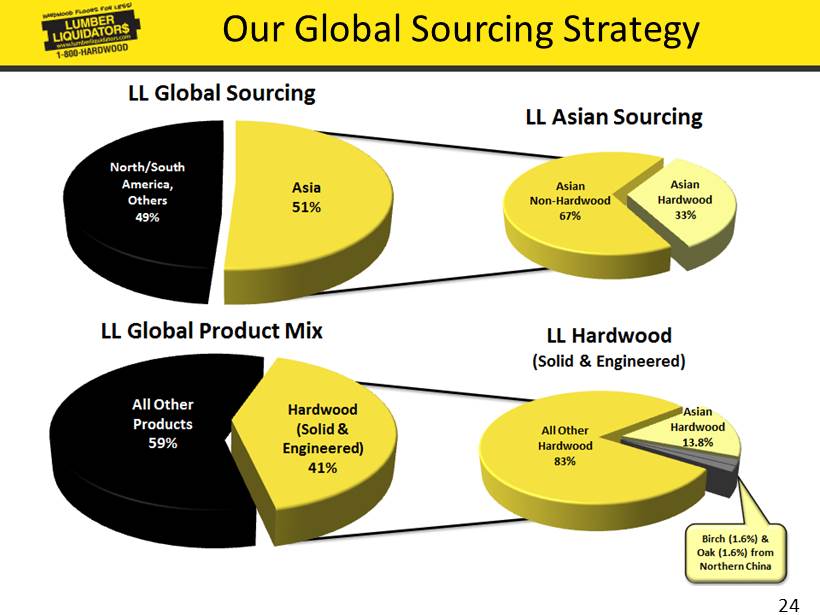
24 Our Global Sourcing Strategy
25 ● In 2008, the California Air Resources Board (“CARB”) enacted a measure that limits formaldehyde emissions from composite wood products. This includes the platform on which most laminate and engineered hardwood floors are produced. ● CARB regulates only product sold in California; although the EPA is addressing the matter and may adopt national standards, there are currently no Federal regulations limiting wood product formaldehyde emissions. ● Our emissions compliance policies and procedures are designed to go above and beyond regulatory requirements and make our products, whether sold in California or any other state/country, compliant with CARB’s wood product formaldehyde emission standards. » We require all of our suppliers of applicable products to comply with these CARB standards, regardless of whether we intend to sell the products in California or any other state/country. » Our laminate and engineered products have platforms that are manufactured using production methods certified to meet CARB standards by a third - party approved by the State of California. The third - party also provides ongoing oversight to validate platform manufacturers’ compliance and manufacturers must be periodically re - certified. » We randomly select products from all our suppliers producing products subject to these CARB standards and submit them for third - party testing on a quarterly basis. » We intend to be an industry leader as formaldehyde emissions standards continue to evolve. CARB Emissions Standards

26 Supply Chain Optimization • All expenditures to get both DC’s fully operational to be funded using existing cash and operating cash flow • After becoming fully operational, expect a net benefit to operating income as our value proposition is strengthened, operations are more efficient and certain costs are lowered East Coast Distribution Center West Coast Distribution Center Purpose To consolidate and enhance existing operations To strengthen the availability of our products to Western consumers Location Henrico County, Virginia Pomona, California Size Construct 1 million sq. ft. building Lease 500,000 sq. ft. Capital Expenditures ~$53 million to ~$57 million ~$4 million Q4 2013 Impact None Transportation Costs: $1.2 - $1.4 million SG&A Expenses: $0.9 - $1.1 million Target Opening Q4 2014 Q1 2014

27 Financial Details

28 Single Family Home Sales & US Floor Coverings Sales (1) Annual Homes Sold % Inc (Dec) US Floor Coverings' Sales % Inc (Dec) LL Comp % Annual Homes Sold % Inc (Dec) US Floor Coverings' Sales % Inc (Dec) LL Comp % 2013E*: 8.8% 6.3% 15.0% - 16.0% 2008: (17.2%) (8.6%) 1.6% 2012: 9.0% 4.8% 11.4% 2007: (9.4%) (9.6%) 8.6% 2011: 2.1% 2.5% (2.0%) 2006**: (8.1%) 1.0% 17.2% 2010: (4.2%) 4.1% 2.1% 2005**: n/a 5.3% 19.0% 2009: 5.7% (21.6%) 0.0% *2013E EHS estimate as of Oct 31, 2013. LL Comp estimate based on Updated Guidance ** 2005 and 2006 EHS estimate based on re-benchmarked 2007-2011 data (14% reduction from prior reported EHS) (1) Catalina July 2013 Report: U.S. Floor Coverings - Industry Trends and End-Use Market Analysis Actual Homes Sold, US Floor Coverings Sales, LL Comp % Annual % Change

29 Average Sale and Traffic – Comparable Stores 5.7% 12.4% 4.5% - 4.7% 8.6% 8.7% -10.0% -5.0% 0.0% 5.0% 10.0% 15.0% 2008 2009 2010 2011 2012 YTD Q3 2013 Traffic – % Change Traffic Drivers: ● Advertising reach & frequency ● Market awareness/visibility ● Strength in residential remodeling ● Customer satisfaction/referral ● Social media ● Web presence/search 2008 2009 2010 2011 2012 YTD Q3 2013 Average Sale % Inc (Dec) - 3.8% - 11.0% - 2.4% 2.8% 2.5% 6.5% Comp Traffic % Inc (Dec) 5.7% 12.4% 4.5% - 4.7% 8.6% 8.7% Comp Sales % Inc (Dec) 1.6% 0.0% 2.1% - 2.0% 11.4% 15.8%

30 Average Sale and Traffic – Comparable Stores $1,750 $1,560 $1,520 $1,560 $1,600 $1,745 $1,500 $1,550 $1,600 $1,650 $1,700 $1,750 $1,800 2008 2009 2010 2011 2012 YTD Q3 2013 Average Sale Average Sale Drivers: ● Moldings & accessories ● Sales mix – premium products conversion ● Retail price discipline ● Best People initiative/store training 2008 2009 2010 2011 2012 YTD Q3 2013 Average Sale % Inc (Dec) - 3.8% - 11.0% - 2.4% 2.8% 2.5% 6.5% Comp Traffic % Inc (Dec) 5.7% 12.4% 4.5% - 4.7% 8.6% 8.7% Comp Sales % Inc (Dec) 1.6% 0.0% 2.1% - 2.0% 11.4% 15.8%

31 Operating Margin Expansion (Management’s Key Performance Metric) 7.7% 8.0% 6.8% 6.2% 9.6% 12.4% 2008 2009 2010 2011 2012 2013E SAP Implementation in August 2010: Full Productivity Restored in 2H 2011 (Guidance Midpoint)

32 Net Income ($ in millions) $22.1 $26.9 $26.3 $26.3 $47.1 $76.4 2008 2009 2010 2011 2012 2013E (Guidance Midpoint) % of net sales 4.6 % 4.9 % 4.2% 3.9 % 5.8% 7.7% Diluted EPS $ 0.82 $0.97 $0.93 $0.93 $1.68 $2.72 - $ 2.75
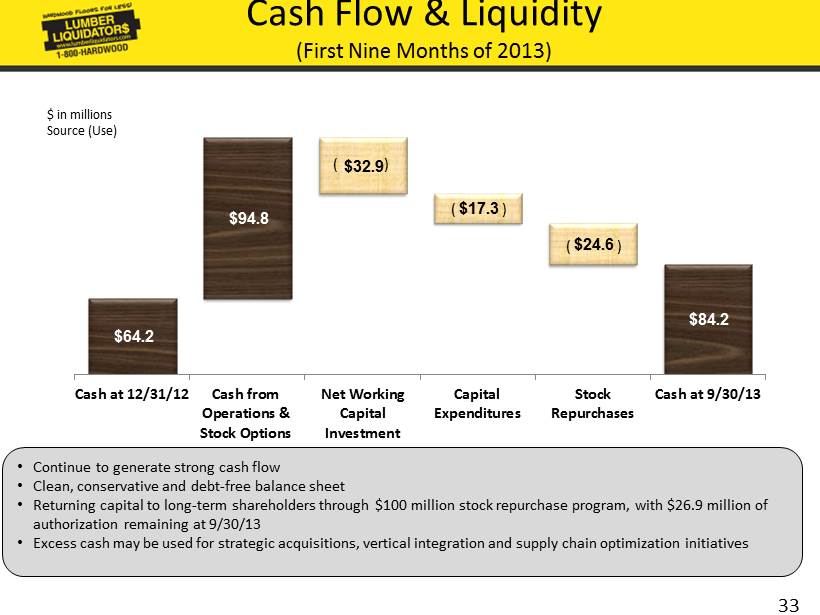
33 $64.2 $94.8 $32.9 $17.3 $24.6 $84.2 Cash at 12/31/12 Cash from Operations & Stock Options Net Working Capital Investment Capital Expenditures Stock Repurchases Cash at 9/30/13 Cash Flow & Liquidity (First Nine Months of 2013) • Continue to generate strong cash flow • Clean, conservative and debt - free balance sheet • Returning capital to long - term shareholders through $100 million stock repurchase program, with $26.9 million of authorization remaining at 9/30/13 • Excess cash may be used for strategic acquisitions, vertical integration and supply chain optimization initiatives ( ) ( ) ( ) $ in millions Source (Use)

34
