Attached files
Table of Contents
UNITED STATES
SECURITIES AND EXCHANGE COMMISSION
Washington, D.C. 20549
FORM 10-K
| x | ANNUAL REPORT PURSUANT TO SECTION 13 OR 15(d) OF THE SECURITIES EXCHANGE ACT OF 1934 |
For the fiscal year ended December 31, 2010
OR
| ¨ | TRANSITION REPORT PURSUANT TO SECTION 13 OR 15(d) OF THE SECURITIES EXCHANGE ACT OF 1934 |
For the transition period from to
Commission file number: 001-33767
Lumber Liquidators Holdings, Inc.
(Exact Name of Registrant as Specified in its Charter)
| Delaware | 27-1310817 | |
| (State or other jurisdiction of incorporation or organization) | (I.R.S. Employer Identification No.) | |
| 3000 John Deere Road, Toano, Virginia | 23168 | |
| (Address of principal executive offices) | (Zip Code) | |
(757) 259-4280
(Registrant’s telephone number, including area code)
Securities registered pursuant to Section 12(b) of the Act:
| Title of each class |
Name of each exchange on which registered | |
| Common Stock, par value $0.001 per share | New York Stock Exchange |
Securities registered pursuant to Section 12(g) of the Act: None
Indicate by check mark if the registrant is a well-known seasoned issuer, as defined in Rule 405 of the Securities Act. Yes ¨ No x
Indicate by check mark if the registrant is not required to file reports pursuant to Section 13 or Section 15(d) of the Act. Yes ¨ No x
Indicate by check mark whether the Registrant (1) has filed all reports required to be filed by Section 13 or 15(d) of the Securities Exchange Act of 1934 during the preceding 12 months (or for such shorter period that the Registrant was required to file such reports), and (2) has been subject to such filing requirements for the past 90 days. Yes x No ¨
Indicate by check mark whether the registrant has submitted electronically and posted on its corporate Web site, if any, every Interactive Data File required to be submitted and posted pursuant to Rule 405 of Regulation S-T (§232.405 of this chapter) during the preceding 12 months (or for such shorter period that the registrant was required to submit and post such files). Yes ¨ No ¨
Indicate by check mark if disclosure of delinquent filers pursuant to Item 405 of Regulation S-K is not contained herein, and will not be contained, to the best of Registrant’s knowledge, in definitive proxy or information statements incorporated by reference in Part III of this Form 10-K or any amendment to this Form 10-K. ¨
Indicate by check mark whether the registrant is a large accelerated filer, an accelerated filer, a non-accelerated filer, or a smaller reporting company. See definitions of “large accelerated filer,” “accelerated filer” and “smaller reporting company” in Rule 12b-2 of the Exchange Act. (Check one):
| ¨ Large Accelerated Filer |
x Accelerated Filer | ¨ Non-accelerated Filer (do not check if a smaller reporting company) |
¨ Smaller Reporting Company |
Indicate by check mark whether the registrant is a shell company (as defined in Rule 12b-2 of the Act). Yes ¨ No x
At June 30, 2010, the last business day of the Registrant’s most recently completed second fiscal quarter, the aggregate market value of the voting and non-voting common equity held by non-affiliates of the Registrant (based upon the closing sale price of such shares on New York Stock Exchange on June 30, 2010) was approximately $401.1 million. Shares of Registrant’s common stock held by each executive officer and director and by each entity or person that, to the Registrant’s knowledge, owned 5% or more of Registrant’s outstanding common stock as of June 30, 2010 have been excluded in that such persons may be deemed to be affiliates of the Registrant. This determination of affiliate status is not necessarily a conclusive determination for other purposes.
Indicate the number of shares outstanding of each of the Registrant’s classes of common stock as of February 22, 2011:
| Title of Class |
Number of Shares | |
| Common Stock, $0.001 par value | 27,612,266 |
DOCUMENTS INCORPORATED BY REFERENCE
Part III incorporates certain information by reference from the Registrant’s proxy statement for the 2011 annual meeting of stockholders, which will be filed no later than 120 days after the close of the Registrant’s fiscal year ended December 31, 2010.
Table of Contents
LUMBER LIQUIDATORS HOLDINGS, INC.
ANNUAL REPORT ON FORM 10-K
2
Table of Contents
Overview
Lumber Liquidators is the largest specialty retailer of hardwood flooring in the United States, based on industry sources and our experience. We believe we have achieved a reputation for offering great value, superior service and a broad selection of high-quality hardwood flooring products. We offer an extensive selection of premium hardwood flooring products under multiple proprietary brands at everyday low prices designed to appeal to a diverse customer base. We generally purchase our products directly from mills or associated brokers. We believe that our vertically integrated business model enables us to offer a broad assortment of high-quality products to our customers at a lower cost than our competitors.
Our company was founded in 1994 by Tom Sullivan, the current chairman of our board of directors, and in 1996, he opened the first Lumber Liquidators store near Boston, Massachusetts. Tom believed that traditional home improvement and flooring retailers underserved the homeowner in terms of selection, quality, price and product availability, presenting an opportunity to sell hardwood flooring at “liquidator” prices. Tom established relationships directly with vendors and mills to provide customers with broad, high-quality assortments at attractive prices. He also identified the opportunity to better serve customers by employing knowledgeable sales staff to educate the customer about the product and provide advice on self-installation or working with contractors. Tom opened the second Lumber Liquidators store in Hartford, Connecticut, starting our company’s national expansion, and as of December 31, 2010, we sold our products through 223 Lumber Liquidators stores in 46 states, our call center, our website and catalogs, operating as a single business segment.
We believe that our brands, value proposition and integrated multi-channel approach are important competitive advantages in a hardwood flooring market that is highly fragmented. We have invested significant resources developing our national brands, including our name and proprietary products, which include our flagship Bellawood brand, and expect to continue to invest resources in our advertising and marketing at a percentage of net sales greater than our competitors. We believe Lumber Liquidators is now recognized across the United States as a destination for high-quality hardwood flooring at everyday low prices, while our Bellawood brand is known as a premium flooring brand within the industry.
Our corporate headquarters is in Toano, Virginia, where we also operate our distribution and finishing facility and our call center. In August 2007, we reincorporated from Massachusetts to Delaware, and in November 2007, we completed our initial public offering. We reorganized effective December 31, 2009, creating a new holding company structure, and as a result, a new parent company named Lumber Liquidators Holdings, Inc. was formed. Unless otherwise stated, references to “we,” “our” and “Lumber Liquidators” generally refers to Lumber Liquidators Holdings, Inc. and its consolidated subsidiaries. Our stock trades on the New York Stock Exchange under the symbol “LL.”
Our Value Proposition
Our value proposition to the customer is a key driver of our business. Important components include:
| • | Price. A fundamental part of our founding philosophy is to provide quality hardwood flooring at everyday low prices. We are able to maintain these prices across our product range because we purchase flooring directly from mills and brokers. In addition, we operate a low-cost store model with locations in industrial or commercial areas that carry lower rent expense than many retail stores. |
| • | Selection. We have developed a broad product assortment of solid and engineered hardwoods, laminates, resilient, bamboo and cork flooring products, moldings and flooring accessories sold under proprietary brands that help us to differentiate our products from those of our competitors. We offer products across a range of price points and quality levels that allow us both to target discrete market segments and to appeal to diverse groups of customers. |
| • | Quality. We believe that we have achieved a reputation for quality, and that our proprietary brands are recognized for excellence by our customers. We work directly with our supplier mills and brokers to source and produce flooring that will meet our high quality standards and we also currently finish approximately 76% of our premium Bellawood products at our Toano facility. We maintain an in-house inspection and quality control function and enforce strict certification requirements for Bellawood supplier mills. |
| • | Availability. Since our founding, we have made it a priority to build long-term relationships with our key supplier mills and brokers. We believe that these direct supplier relationships are relatively unique in our industry, and as |
3
Table of Contents
| we have grown, we believe our relationships with our suppliers have strengthened. We believe our commitment to merchandise inventory throughout our distribution network allows us to meet the delivery needs of our customers better than our competitors. |
Our Growth Strategy
We intend to continue to increase net sales and profitability by strengthening our position as a leading provider of hardwood flooring. In recent years, home-related discretionary spending has been weakened by a difficult economic environment. As a result, we have grown primarily through share gains in the highly fragmented hardwood flooring market. We expect to continue to gain market share, and specific elements of our strategy for continued growth include the following:
| • | Improve Market Breadth and Profitability. We believe there is a significant opportunity to expand our store base in both existing markets and new domestic and international markets. We expect store base growth will drive market productivity and operational efficiencies. We plan to open between 40 and 50 new stores during each of the next several years, including our first Canadian stores in the first quarter of 2011. |
| • | Commitment to Merchandise Inventories. We believe our commitment to merchandise inventories enhances our value proposition and further distances us from the smaller, independent flooring retailers, thereby increasing our market share. We expect net sales growth will continue to benefit from a strengthened commitment to in-stock positions of our top selling products and an effective logistics network. We believe our profitability will increase from a continued investment in merchandise planning and allocation on a regional and store-level basis, coupled with further development of logistic initiatives. |
| • | Leverage Brand Marketing Across Multiple Channels. We use our advertising and marketing activities and our multiple sales channels to help educate potential customers about hardwood flooring. As customers learn more about hardwood flooring and how best to shop for it, they also learn more about our products and value proposition, which we believe drives customer store visits and purchases of our products. We believe that as we continue to leverage our multi-channel strategy, we will drive repeat customer traffic. We have made a significant advertising and marketing investment to link our brands to our value proposition. We believe our marketing and branding activities will become more efficient and targeted as we grow, and our customer acquisition costs will decline on both a per-customer and per-store basis. |
| • | Expertise and Customer Service. We position ourselves as hardwood flooring experts and believe our high level of customer service reflects this positioning. Key elements of our service include product education on species and construction so that our customers can select flooring that is best aligned with the use of the room, site conditions at the house and local climate factors. Our regional and store managers, supported by a call center staff, are trained to understand the characteristics and installation method for the broad range of hardwood flooring and accessories that we offer. Residential customers are generally less familiar with the range of products available and with the purchase process itself. As a result, we believe our attention to service provides a competitive advantage. |
Our Brands
We believe both Lumber Liquidators and Bellawood are well-known national brands. We have positioned Lumber Liquidators to represent an attractive value proposition to the customer, and believe we offer superior service and hardwood flooring expertise. We are committed to supporting our brands and products through diverse national marketing campaigns that reach a wide variety of potential customers.
We offer a large selection of hardwood flooring year-round at everyday low prices primarily under our proprietary brands, ranging in quality from our premium Bellawood brand to our more economical brands.
Our Integrated Multi-Channel Sales Model
We have an integrated multi-channel sales model that enables our national store network, call center, website and catalogs to work together in a coordinated manner. We believe that due to the average size of the sale and the general infrequency of a hardwood flooring purchase, many of our customers conduct extensive research using multiple channels before making a purchase decision. Our sales strategy emphasizes customer service by providing superior convenience and
4
Table of Contents
education tools for our customers to learn about our products and the installation process. Our website contains a broad range of information regarding our floors and accessories. We hire store associates who often have relevant industry experience and our call center is staffed by more than 60 flooring experts. Customers can order samples or catalogs and access product research and information through any of our sales channels.
Customers can purchase our complete assortment of products in our stores, or through our call center or website. The prices available on our website and from our call center are the same as the prices in our stores. Once an order is placed, customers may have their purchases delivered or pick them up at a nearby store location. We strive to use our various sales channels to make our customers’ transactions easy and efficient. Our average sale was approximately $1,520 in 2010. We define “average sale” as the average invoiced sale per customer, measured on a monthly basis and excluding transactions of less than $250 (which are generally sample orders, or add-ons or fill-ins to previous orders) and of more than $30,000 (which are usually contractor orders).
Our Stores and Store Model
Our stores are designed to emphasize our products in a visually appealing showroom format, yet reflect our low-cost approach to doing business. As of December 31, 2010, we operated 223 stores in 46 states, and we plan to open approximately 40 to 50 stores during each of the next several years in an approximately equal mix of new and existing markets. We have opened approximately 50% of our total store base in the past three years, including 37 stores in 2010.
We look for new store locations that are approximately 6,000 to 7,000 square feet, with approximately 1,000 to 1,200 square feet dedicated to the showroom selling area. With our significant brand marketing, we believe our store locations are a “must visit” destination for customers shopping for wood flooring. Our stores are typically located in industrial or commercial areas that have lower rents than traditional retail locations, are accessible from major roadways and have significant visibility to passing traffic. We can adapt to a range of existing buildings, whether free-standing or in shopping centers. We enter into short leases, generally for base terms of five years, with renewal options to maximize our real estate flexibility. Most of our store showrooms have wall racks holding one-foot by two-foot display boards of our flooring products and larger sample squares serving as the showroom floor. We believe that our store design and locations reinforce our customers’ belief that they get a good deal when they buy from us.
A typical store staff consists of a manager and two to three associates, with a compensation structure generally weighting sales-driven bonuses over a relatively low base salary. The store manager is responsible both for store operations and for overseeing our customers’ shopping experience. A store’s warehouse is stocked with a combination of that store’s most popular products and high-volume items, as well as customer-specific merchandise inventory waiting to be picked up or delivered. By generally requiring a 50% deposit when an order is placed for product not taken home that day, we reduce store-level working capital requirements.
Across our markets, our average new store has historically become profitable within months of beginning operations and generally returned its initial cash investment within the first year.
Installation
Although we do not provide flooring installation, we have a national installation arrangement with The Home Service Store, Inc. (“HSS”), allowing us to make consistent installation services available in virtually every store in our chain. HSS manages fully insured and licensed providers of professional installation services that measure, deliver, and install flooring at competitive prices. This arrangement allows us to increase service offerings to our customers, and we benefit from cross-promotional opportunities. Furthermore, we minimize risk associated with installation services and reduce time spent by store managers on installation service issues.
Financing
We offer our residential customers a financing alternative through a proprietary credit card, the Lumber Liquidators credit card, underwritten by GE Money Bank at no recourse to us. We generally utilize the credit program for promotional opportunities, including programs for up to 18 months of deferred interest with payments. Our customers may also use their Lumber Liquidators credit card to tender installation services provided by HSS.
5
Table of Contents
We began offering our commercial customers a financing alternative in the second half of 2010 through the Lumber Liquidators Commercial Credit Program, A Credit Line for Pros. This program is underwritten by BlueTarp Financial, Inc., generally at no recourse to us. The commercial credit program also provides our professional customers a range of additional services that we believe add efficiency to their businesses.
Call Center, Website and Social Media
Our call center is staffed by flooring experts cross-trained in sales, customer service and product support. In addition to receiving telephone calls, our call center staff chats online with visitors to our website, responds to e-mails from our customers and engages in telemarketing activities. Customers can contact our call center to place an order to be delivered directly to their home or picked up at a nearby store, to make an inquiry or to order a catalog. Our website serves both to educate consumers and to generate sales, whether through a store, our call center or directly via the website itself. Visitors to our website can search through a comprehensive knowledge base of tools on wood flooring, including browsing product reviews, frequently asked questions and an extensive “before and after” gallery from previous customers, as well as research detailed product information and how-to videos that explain the installation process.
Flooring samples of all the products we offer are available in our stores, our call center and our website. In addition, our iPhone app, The Floor Finder, gives consumers access to nearly 200 digital samples as well as a variety of tools designed to facilitate flooring purchase decisions. The app also gives consumers flooring specifications, such as hardness and installation information. We are active in social media in order to connect to our consumers with the newest technology as well as build social networks with our satisfied customers. We have an active presence on Facebook, YouTube and three unique Twitter accounts.
Catalogs and Other Mailings
Our direct mail strategy focuses on regular contact with our customers and the targeting of prospective purchasers. We have a healthy and growing database that we utilize to drive our direct mail and overall marketing strategies. We distribute our catalogs, as well as other direct mailings, to key consumer and commercial segments around specific store locations. Copies of our catalogs can also be obtained through our stores, our call center and our website. In addition, we utilize direct mail for call-to-action promotions. We believe these mailings contribute to increases in store traffic and call center volumes that lead to more sales. We expect to continue expanding our direct mailing efforts to prospective customers in markets where we have stores.
Our Marketing and Advertising
Our marketing strategy emphasizes product credibility, value, brand awareness, customer education and direct selling. We have structured our marketing and advertising strategy to correspond with our understanding of the hardwood flooring purchase cycle. We increase brand awareness in a variety of ways, including advertising and demonstration of our value proposition to customers. We have invested significantly to build awareness and demand for all of our proprietary brands.
We believe that our Lumber Liquidators brand is positioned based on value, selection, price and service, while our Bellawood brand is known as a premium flooring brand within the marketplace. We establish and maintain our credibility primarily through the strength of our product and the attractiveness of our pricing. We believe that we have achieved a reputation for quality and low prices, and that our proprietary brands are recognized for excellence by our customers. We try to avoid being perceived as a volume-driven discounter, so while our promotional calendar focuses on particular buying cycles, we generally try to hold our sales around events where we can create some excitement among customers.
Our brand credibility also benefits from celebrity endorsements and product placement opportunities. We have long-term relationships with respected, well-known home improvement celebrities Bob Vila and Ty Pennington. Bob Vila, in particular, has been associated specifically with our Bellawood proprietary brand for several years. We work with Ty Pennington on a proprietary line of flooring branded as the Ty Pennington Collection.
To increase brand awareness, we conduct ad campaigns on both a national and local level using both traditional and new media. We work with shows such as “Extreme Makeover: Home Edition” and HGTV’s “Dream Home Sweepstakes,” which use our products and enable potential customers to see both what our flooring will look like after installation and the relative
6
Table of Contents
ease with which it can be installed. In addition, we use targeted television advertising on cable networks such as Discovery Channel, HGTV, TLC, DIY Network and A&E Network. We engage in sports marketing by participating in opportunities with, among others, Major League Baseball and National Basketball Association teams and sponsoring the Lumber Liquidators Professional Bowlers Association Tour. On the Internet, our advertising efforts include the use of banner advertising, sponsoring links on well-known search engines, having storefronts with large e-tailers and having a large network of online affiliate partners.
We believe our national advertising campaigns have been successful, and we expect to see greater returns on our investment in national advertising as more stores open near people who have already been introduced to our brands.
Our Customers
We seek to appeal to customers who desire a high-quality product at an attractive value, and are willing to travel to less convenient locations to get it. We sell our products principally to existing homeowners, who we believe represent over 90% of our consumer count. Historically, these homeowners are in their mid-30’s or older, are well-educated and have been living in their homes for at least several years. According to industry sources, over half of hardwood flooring purchases are made by households with incomes levels above the average domestic household. We have found that homeowners prefer various characteristics of wood floors, including appearance and durability, ease of installation, renewability of resources and specific aspects of engineered, resilient and laminate flooring. Most of our other sales are to contractors, who are primarily small businesses that are either building a small number of new homes or have been hired by an owner to put in a new floor.
Our Products
We offer a complete assortment of wood flooring that includes prefinished premium domestic and exotic hardwoods, engineered hardwoods, unfinished hardwoods, bamboo, cork and laminates, as well as resilient flooring. Our product offering is substantially comprised of our proprietary brands, led by our flagship Bellawood brand. Our hardwood flooring products are generally available in various widths and lengths. They are generally differentiated in terms of quality and price based on the species, grade of the hardwood and quality of finishing, in addition to the length of the warranty. Prefinished floors are finished in factories under controlled conditions and are ready to be enjoyed immediately after they are installed. We also offer a broad assortment of flooring enhancements and installation accessories, including moldings, noise-reducing underlay and adhesives, that complement our assortment of floor offerings. In total, we offer nearly 350 different flooring product stock-keeping units.
| 2010 | 2009 | 2008 | ||||||||||
| Percentage of Net Sales: | ||||||||||||
| Solid Hardwood |
43 | % | 47 | % | 54 | % | ||||||
| Engineered Hardwood |
11 | % | 10 | % | 10 | % | ||||||
| Laminates |
21 | % | 18 | % | 13 | % | ||||||
| Moldings and Accessories |
14 | % | 13 | % | 11 | % | ||||||
| Bamboo and Cork |
10 | % | 11 | % | 11 | % | ||||||
| Other |
1 | % | 1 | % | 1 | % | ||||||
| Total |
100 | % | 100 | % | 100 | % | ||||||
Solid Hardwood. Our proprietary solid hardwood products are milled from one thick piece of wood, which can be sanded and refinished numerous times. We offer flooring products made from more than 25 wood species, including both domestic woods, such as ash, beech, birch, hickory, northern hard maple, northern red oak, pine and American walnut, and exotic woods, such as bloodwood, cherry, cypress, ebony, koa, mesquite, mahogany, rosewood and teak. We sell these products either prefinished or unfinished. Our prefinished hardwoods typically carry a wear warranty from 25 to 50 years.
Engineered Hardwood. Our proprietary engineered hardwood products are produced by bonding a layer of hardwood to a plywood or high-density fiber board backing. Like our solid hardwood floors, our engineered hardwood floors are offered in domestic and exotic wood species, and in either glue down or floating application. All of our engineered hardwood products are prefinished. Engineered flooring is designed primarily to be installed in areas where traditional hardwood is not conducive, such as slab construction, basements and areas where moisture may be a factor. Our engineered assortment typically carries a wear warranty of 30 to 50 years.
7
Table of Contents
Laminates. Our proprietary laminate flooring is typically constructed with a high-density fiber board core, inserted between a melamine laminate backing and high-quality photographic paper displaying an image of wood and a ceramic finish, abrasion-resistant laminate top. Our laminate flooring brands allow for easy-click installation, and some include a pre-glued undersurface, moisture repellent, soundproofing, single-strip format or a handscraped textured finish. Our laminates carry wear warranties ranging from 10 to 30 years.
Moldings and Accessories. We offer a wide variety of wood flooring moldings and accessories. Moldings are a required finishing detail to every floor and we sell a complete selection that matches virtually all of our floors or can complement them. We also sell stair treads and risers in both finished and unfinished versions. Accessories include underlays that are placed between the new floor and the sub-floor, insulating sound and cushioning the floors. In addition, we sell installation supplies (such as sealers, adhesives and trowels), floor cleaning supplies and butcher-block kitchen countertops.
Bamboo and Cork. Our proprietary bamboo products, harvested from the fast growing bamboo plant, are offered as a prefinished or stained solid wood or engineered floor. Our proprietary cork flooring is produced by harvesting the outer bark of the cork oak tree, and it is durable, acoustical and acts as an insulator. Our bamboo and cork flooring products carry wear warranties ranging from 10 to 30 years.
Finishing
In 2010, we finished approximately 76% of our Bellawood products at our finishing facility in Toano, Virginia, and we obtained the balance from qualified finishing suppliers in North America and South America. Bellawood products have one of the highest scuff resistant finishes in the industry as measured by the Taber Abrasion Test, an abrasion testing method designed to measure the abrasion resistance of protective floor finishes. We also finish small quantities of certain of our other products at our Toano facility. We continually invest in improving our process controls and product quality, and we believe that our existing finishing infrastructure at our Toano facility can support our planned growth over at least the next three years with limited capital expenditures to increase capacity.
Our Suppliers
We work directly with a select group of vendors and mills with whom we have cultivated long-standing relationships that provide for a consistent supply of high-quality product at the lowest prices. As part of ensuring the high-quality nature of our brands, we have developed demanding product standards. As we have grown, we believe our supplier relationships have strengthened, which we believe helps to ensure our access to a broad selection of products. Many suppliers have expanded to support our business. We select suppliers based on a variety of factors, including their ability to supply products that meet industry grading standards and our specifications.
We currently purchase products from approximately 90 domestic and international vendors, which are primarily mills or trading companies. Trading companies contract with mills, located primarily in China, to produce quality products to our specifications, work on our behalf to control quality at the mill locations and handle certain other matters. In 2010, one of the trading companies, Sequoia Floorings, provided services on approximately 40% of our merchandise purchases, primarily in Asia. Our top 10 suppliers accounted for approximately 72% of our supply purchases in 2010. We believe that we are the largest customer for most of our suppliers, which we believe enables us to obtain better prices in some circumstances. We believe that alternative and competitive suppliers are available for most of our products. In 2010, approximately 46% of our product was sourced from Asia, 41% from North America, 10% from South America and 3% from other locations, including Europe and Australia. All of our foreign purchases are negotiated and paid for in U.S. dollars.
Distribution and Order Fulfillment
We operate a central distribution center located in Toano, Virginia, supplemented by a facility we lease in Hampton, Virginia. In addition, we will operate a facility in Toronto, Canada, which will be both a store front and a small warehouse for that metropolitan market. In 2010, approximately 81% of our purchases were received by central distribution and 19% were received directly at a store location, shipped from either a vendor-mill or our leased consolidation center in China. The China consolidation center allows certain quantities of designated products produced in Asia to be shipped in bulk to the consolidation center in Shanghai, where our product allocation department determines an appropriate mix of a number of products to be packed in a single container and shipped directly to a store location.
8
Table of Contents
We ship our products to our stores over the road by truck or over rail using an intermodal service. We expect each store to receive a truckload of product at least once per week. Further, we now work closely with certain suppliers to ship selected key product, including moldings and accessories, directly to our stores.
We continue to evaluate logistics alternatives to best service our store base. We believe that our existing facilities will continue to play an integral role in our strategy, and expect future expansion of alternatives, if any, to be leased locations, with related expense no earlier than 2012.
Our Market
According to industry sources, the hardwood flooring market represents approximately 9% – 10% of the overall U.S. floor coverings market, which includes carpet and area rugs, hardwood and softwood flooring, ceramic floor and wall tile, resilient sheet and floor tile and laminate flooring. In its December 2009 Wood Flooring report, Catalina Research, Inc. (“Catalina”) estimated that the retail value of U.S. hardwood flooring had decreased to approximately $3.1 billion from $4.0 billion in 2007. Considering our sales mix of hardwood flooring, we estimate our 2010 market share at approximately 12% – 13%, up from 11% – 12% in 2009 and 8% – 10% in 2008.
The laminate flooring market is estimated to represent approximately 5% of the overall U.S. floor coverings market. In its December 2010 Floor Covering Industry report, Catalina estimated that the wholesale value of U.S. laminate flooring in 2009 was approximately $900 million. Considering our sales mix of laminate flooring, we estimate our 2010 market share at approximately 8%, up from approximately 6% in 2009 and 3% in 2008.
The wood flooring market for homeowners is highly fragmented. Catalina estimates that Lumber Liquidators, Home Depot and Lowes together represent approximately 35% of the hardwood flooring retail sales with the remaining sales coming predominantly from regional and local independent retailers and smaller national chains. The wood flooring market for homeowners is dependent on home-related discretionary spending, which is impacted by a number of complex economic and demographic factors that may vary locally, regionally and nationally. We are impacted by, among other things, home remodeling activity, employment levels, housing turnover, real estate prices, new housing starts, consumer confidence, credit availability and the general health of consumer discretionary spending. Many of the economic indicators associated with the wood flooring market and generally associated with consumer discretionary spending remain weak. Catalina projects the hardwood flooring market will only average annual growth of 3% per year 2011 – 2015.
We believe the number of retailers serving the homeowner-based segment of the wood flooring market continues to shrink under the difficult macroeconomic pressures. We believe our results have benefited from our gain of market share in this environment and that we will continue to gain market share, primarily through new store openings. We continue to believe that the longer term trends for our market remain favorable, including customer perception of hardwood flooring as an attractive alternative to other floor coverings, the evolution of the hardwood flooring market, overall home improvement spending, and certain demographic trends.
Our Competition
We are the largest specialty retailer of hardwood flooring in the United States, and compete in a hardwood flooring market that is highly fragmented. The market includes both national and regional home improvement chains which specialize in the lower-end, higher-volume flooring market and offer a wide range of home improvement products other than flooring. We also compete against smaller national specialty flooring chains, some of which have an Internet presence, and a large number of local and regional independent flooring retailers, including a large number of privately-owned single-site enterprises. Most of these retailers purchase their hardwood flooring from domestic manufacturers or distributors, and typically do not stock hardwood flooring, but order it only when the customer makes a purchase. As a result, we believe it takes these retailers longer than us to deliver their product to customers, and their prices tend to be higher than ours. We also compete against companies that sell other types of floor coverings, such as carpet, vinyl sheet and tile, ceramic tile, natural stone and others.
Seasonality and Quarterly Results
Our quarterly results of operations fluctuate depending on the timing of our advertising expenses and the timing of, and income contributed by, our new stores. Our net sales also fluctuate slightly as a result of seasonal factors. We experience
9
Table of Contents
slightly higher net sales in spring and fall, when more home remodeling and home building activities are taking place, and slightly lower net sales in holiday periods and during the hottest summer months. These seasonal fluctuations, however, are minimized to some extent by our national presence, as markets experience different seasonal characteristics.
Our Employees
As of December 31, 2010, we had 1,191 employees, 97% of whom were full-time and none of whom were represented by a union. Of these employees, 68% work in our stores, 17% work in corporate store support infrastructure or similar functions (including our call center employees) and 15% work either on our finishing line or in our distribution center. We believe that we have good relations with our employees.
Intellectual Property and Trademarks
We have a number of marks registered in the United States, including Lumber Liquidators®, Bellawood®, 1-800-HARDWOOD®, 1-800-FLOORING®, Dura-Wood®, Blutec®, Quickclic®, Virginia Mill Works Co. Hand Scraped and Distressed Floors®, Morning Star Bamboo Flooring®, Dream Home Laminate Floors®, Builder’s Pride®, Schön Engineered Floors®, Casa de Colour Collection® and other product line names. We have also registered certain marks in jurisdictions outside the United States, including the European Union, Canada, Australia and Japan. We regard our intellectual property as having significant value and these names are an important factor in the marketing of our brands. Accordingly, we take steps intended to protect our intellectual property including, where necessary, the filing of lawsuits and administrative actions to enforce our rights. We are not aware of any facts that could be expected to have a material adverse effect on our intellectual property.
Government Regulation
We are subject to extensive and varied federal, state and local government regulation, including laws and regulations relating to our relationships with our employees, public health and safety, zoning and fire codes. We operate each of our stores, finishing facility and distribution center in accordance with standards and procedures designed to comply with applicable laws, codes and regulations.
Our operations and properties are also subject to federal, state and local laws and regulations relating to the use, storage, handling, generation, transportation, treatment, emission, release, discharge and disposal of hazardous materials, substances and wastes and relating to the investigation and cleanup of contaminated properties, including off-site disposal locations. We do not incur significant costs complying with environmental laws and regulations. However, we could be subject to material environmental costs, liabilities or claims in the future, especially in the event of changes in existing laws and regulations or in their interpretation.
Our suppliers are subject to the laws and regulations of their home countries, including in particular laws regulating forestry and the environment. We consult with our suppliers as appropriate to ensure that they are in compliance with their applicable home country laws. We also support social and environmental responsibility among our supplier community and our major suppliers agree to comply with a code of conduct regarding our expectations concerning environmental, labor and health and safety matters. Among its guidelines, that code of conduct includes a provision that our suppliers must comply with the laws, rules and regulations of the countries in which they operate.
Products that we import into the United States are subject to laws and regulations imposed in conjunction with such importation, including those issued and/or enforced by U.S. Customs and Border Protection. In addition, certain of our products are subject to laws and regulations relating to the importation, acquisition or sale of illegally harvested plants and plant products and the emissions of hazardous materials. We work closely with our suppliers to ensure compliance with the laws and regulations in these areas.
We believe that we currently conduct, and in the past have conducted, our activities and operations in substantial compliance with applicable laws and regulations relating to the environment and protection of natural resources, and believe that any costs arising from such laws and regulations will not have a material adverse effect on our financial condition or results of operations. However, there can be no assurance that such laws will not become more stringent in the future or that we will not incur costs in the future in order to comply with such laws.
10
Table of Contents
Available Information
We maintain a website at www.lumberliquidators.com. The information on or available through our website is not, and should not be considered, a part of this report. You may access our annual reports on Form 10-K, quarterly reports on Form 10-Q, current reports on Form 8-K and amendments to those reports, as well as other reports relating to us that are filed with or furnished to the Securities and Exchange Commission (or “SEC”) free of charge at our website as soon as reasonably practicable after such material is electronically filed with, or furnished to, the SEC. In addition, you may read and copy any materials we file with the SEC at the SEC’s Public Reference Room at 100 F Street, NE, Washington, DC 20549. Information on the operation of the Public Reference Room may be obtained by calling the SEC at 1-800-SEC-0330. The SEC also maintains an Internet site, www.sec.gov, which contains reports, proxy and information statements, and other information that we file electronically with the SEC.
Cautionary Note Regarding Forward-Looking Statements
This report includes statements of our expectations, intentions, plans and beliefs that constitute “forward-looking statements” within the meaning of Section 27A of the Securities Act of 1933 and Section 21E of the Securities Exchange Act of 1934 and are intended to come within the safe harbor protection provided by those sections. These statements, which involve risks and uncertainties, relate to matters such as sales growth, comparable store net sales, impact of cannibalization, price changes, earnings performance, stock-based compensation expense, margins, return on invested capital, strategic direction, the demand for our products and store openings. We have used words such as “may,” “will,” “should,” “expects,” “intends,” “plans,” “anticipates,” “believes,” “thinks,” “estimates,” “seeks,” “predicts,” “could,” “projects,” “potential” and other similar terms and phrases, including references to assumptions, in this report to identify forward-looking statements. These forward-looking statements are made based on expectations and beliefs concerning future events affecting us and are subject to uncertainties, risks and factors relating to our operations and business environments, all of which are difficult to predict and many of which are beyond our control, that could cause our actual results to differ materially from those matters expressed or implied by these forward-looking statements. These risks and other factors include those listed in this Item 1A. “Risk Factors,” and elsewhere in this report.
When considering these forward-looking statements, you should keep in mind the cautionary statements in this report and the documents incorporated by reference. New risks and uncertainties arise from time to time, and we cannot predict those events or how they may affect us. There may also be other factors that we cannot anticipate or that are not described in this report that could cause results to differ materially from our expectations. Forward-looking statements speak only as of the date they are made and we assume no obligation to update them after the date of this report as a result of new information, future events or subsequent developments, except as required by the federal securities laws.
Risks Related to Our Business and Industry
Deterioration in economic conditions may adversely impact demand for our products, reduce access to credit and cause our customers and others with which we do business to suffer financial hardship, all of which could adversely impact our business, results of operations, financial condition and cash flows.
Our business, financial condition and results of operations have and may continue to be affected by various economic factors. Deterioration in the current economic environment could lead to reduced consumer and business spending, including by our customers. It may also cause customers to shift their spending to products we either do not sell or do not sell as profitably. Further, reduced access to credit has and may continue to adversely affect the ability of consumers to purchase our products. This potential reduction in access to credit may include our ability to offer customers credit card financing through third-party credit providers on terms similar to those offered previously, or at all. In addition, economic conditions, including decreased access to credit, may result in financial difficulties leading to restructurings, bankruptcies, liquidations and other unfavorable events for our customers, suppliers and other service providers. If such conditions deteriorate in 2011, our industry, business and results of operations may be severely impacted.
The hardwood flooring industry depends on the economy, home remodeling activity, the homebuilding industry and other important factors.
The hardwood flooring industry is highly dependent on the remodeling of existing homes and new home construction. In turn, remodeling and new home construction depend on a number of factors which are beyond our control, including
11
Table of Contents
interest rates, tax policy, employment levels, consumer confidence, credit availability, real estate prices, demographic trends, weather conditions, natural disasters and general economic conditions. For example, discretionary consumer spending could be limited, spending on remodeling of existing homes could be reduced and purchases of new homes could decline further if:
| • | the national economy or any regional or local economy where we operate weakens; |
| • | interest rates rise; |
| • | credit becomes less available; |
| • | regions where we operate experience unfavorable demographic trends; |
| • | fuel costs or utility expenses increase; or |
| • | home-price depreciation continues; |
Any one or a combination of these factors could result in decreased demand for hardwood flooring, in remodeled and new homes, which would harm our business and operating results.
Increasing our net sales and profitability depends substantially on our ability to open new stores and is subject to many unpredictable factors.
As of December 31, 2010, we had 223 stores throughout the United States, 132 of which we opened after January 1, 2007. We plan to open a significant number of new stores during each of the next several years. This growth strategy and the investment associated with the development of each new store may cause our operating results to fluctuate and be unpredictable or decrease our profits. Our future results will depend on various factors, including the following:
| • | the successful selection of new markets and store locations, |
| • | our ability to negotiate leases on acceptable terms, |
| • | management of store opening costs, |
| • | the quality of our operations, |
| • | consumer recognition of the quality of our products, |
| • | our ability to meet customer demand, |
| • | the continued popularity of hardwood flooring, and |
| • | general economic conditions. |
In addition, the following may impact the sales and performance of our new stores compared to prior years:
| • | as we open more stores, our rate of expansion relative to the size of our store base will decline, |
| • | we may not be able to identify suitable store locations in markets into which we seek to expand and may not be able to open as many stores as planned, |
| • | consumers in new markets may be less familiar with our brands, and we may need to increase brand awareness in that market through additional investments in advertising, |
| • | stores opened in new markets may have higher construction, occupancy or operating costs, or may have lower average store net sales, than stores opened in the past, |
| • | we may incur higher maintenance costs associated with our strategy of seeking out low-cost store locations than in the past, |
| • | newly opened stores may not succeed or may reach profitability more slowly than we expect, and the ramp-up to profitability may become longer in the future as we enter more mid-sized and smaller markets and add stores to larger markets where we already have a presence, |
| • | future markets and stores may not be successful and, even if we are successful, our average store net sales and our comparable store net sales may not increase at historical rates, and |
12
Table of Contents
Finally, our progress in opening new stores from quarter to quarter may occur at an uneven rate, which may result in quarterly net sales and profit growth falling short of market expectations in some periods.
Our net sales and profit growth could be adversely affected if comparable store net sales are less than we expect.
While future net sales growth will depend substantially on our plans for new store openings, the level of comparable store net sales (which represent the change in period-over-period net sales for stores beginning their thirteenth full month of operation) will also affect our sales growth and business results. Among other things, increases in our baseline store volumes and the number of new stores opened in existing markets, which tend to open at a higher base level of net sales, will impact our comparable store net sales. As a result, it is possible that we will not achieve our targeted comparable store net sales growth or that the change in comparable store net sales could be negative. If this were to happen, net sales and profit growth would be adversely affected.
The implementation of our integrated information technology solution may continue to impact our operational efficiency and productivity.
On August 22, 2010, we implemented the most significant phase of our integrated business solution from SAP. The implementation had a pervasive impact on our information systems and across all of our operations, including store operations, merchandising, technology and finance. Although we were near pre-implementation productivity at the close of the fourth quarter of 2010 and expect to resolve any remaining adverse impacts in the first quarter of 2011, the implementation may still affect our operational efficiency and effectiveness. Further, as we continue to utilize the system, other issues may arise that could impact our operations and results. In such circumstances, there may be additional adverse effects on our capital resources, financial condition, results of operations and liquidity.
Although the most significant phase of the SAP system was implemented in August 2010, we anticipate that there will be subsequent phases. Such subsequent phases are significantly smaller in scope, but difficulties relating to their implementation may negatively impact our operations and results.
Our ability to produce hardwood flooring, particularly products made of more exotic species, depends on the continued availability of sufficient suitable hardwood.
Our business strategy depends on offering a wide assortment of hardwood flooring to our customers. We sell flooring made from species ranging from domestic maple, oak and pine to imported cherry, ebony, mahogany and teak. Some of these species are scarce, and we cannot be assured of their continued availability, especially of exotic hardwoods that comprise a significant portion of our more profitable products. Our ability to obtain an adequate volume and quality of hard-to-find species depends on our suppliers’ ability to furnish those species, which, in turn, could be affected by many things including events such as forest fires, insect infestation, tree diseases, prolonged drought and other adverse weather and climate conditions. Government regulations relating to forest management practices also affect our suppliers’ ability to harvest or export timber, and changes to regulations and forest management policies, or the implementation of new laws or regulations, could impede their ability to do so. If our suppliers cannot deliver sufficient hardwood and we cannot find replacement suppliers, we would need to curtail finishing of the relevant product lines, which could cause our operating results to deteriorate.
Our dependence on certain suppliers makes us vulnerable to the extent we rely on them.
We rely on a concentrated number of suppliers for the majority of our supply needs. In 2010, one of our trading companies, Sequoia Floorings, provided services on approximately 40% of our merchandise purchases, primarily in Asia. Our top 10 suppliers accounted for approximately 72% of our supply purchases in 2010. We generally do not have long-term contracts with our suppliers, and we typically obtain our hardwood supplies on an order-by-order basis, writing orders for future deliveries from 90 to 180 days before delivery. Our suppliers may be unable to supply us in the future due to various factors, which could include political instability in the supplier’s country, a supplier’s financial instability, inability or refusal to comply with applicable laws, trade restrictions or tariffs, duties, insufficient transport capacity and other factors beyond our control. If we can no longer obtain merchandise from our major suppliers, or they refuse to continue to supply us on commercially reasonable terms or at all, and we cannot find replacement suppliers, we could experience deterioration in our net sales and operating results.
13
Table of Contents
If we fail to identify and develop relationships with a sufficient number of qualified mills, our ability to obtain hardwood products that meet our high quality standards could be harmed.
We purchase flooring directly from mills located around the world. We believe that these direct supplier relationships are relatively unique in our industry. In order to retain the competitive advantage that we believe results from these relationships, we need to continue to identify, develop and maintain relationships with qualified mills that can satisfy our high standards for quality and our requirements for hardwood in a timely and efficient manner. The need to develop new relationships will be particularly important as we seek to expand our operations in the future. Any inability to do so could reduce our competitiveness, slow our plans for further expansion and cause our net sales and operating results to deteriorate.
If our suppliers do not use ethical business practices or comply with applicable laws and regulations, our reputation could be harmed due to negative publicity.
While our suppliers agree to operate in compliance with applicable laws and regulations, including those relating to environmental and labor practices, we do not control our suppliers. Accordingly, we cannot guarantee that they comply with such laws and regulations or operate in a legal, ethical, and responsible manner. Violation of environmental, labor or other laws by our suppliers or their failure to operate in a legal, ethical and responsible manner, could reduce demand for our products if, as a result of such violation or failure, we were to attract negative publicity.
Our ability to obtain products from abroad and the operations of many of our international suppliers are subject to risks that are beyond our control and that could harm our operations.
We rely on a select group of international suppliers to provide us with flooring products that meet our specifications. In 2010, approximately 46% of our product was sourced from Asia, approximately 10% was sourced from South America and approximately 3% was sourced from other locations outside of North America. As a result, we are subject to risks associated with obtaining products from abroad, including:
| • | political unrest, terrorism and economic instability resulting in the disruption of trade from foreign countries where our products originate; |
| • | currency exchange fluctuations; |
| • | the imposition of new laws and regulations, including those relating to environmental matters and climate change issues; labor conditions; quality and safety standards; trade restrictions; and restrictions on funds transfers; |
| • | the imposition of new or different duties (including antidumping and countervailing duties), taxes and/or other charges on exports or imports; |
| • | disruptions or delays in production or shipments; and |
| • | changes in local economic conditions in countries where our suppliers are located. |
These and other factors beyond our control could disrupt the ability of our suppliers to ship certain products to us cost-effectively or at all, which could harm our operations.
Increased hardwood costs could harm our results of operations.
The cost of the various species of hardwood that are used in our products is important to our profitability. Hardwood lumber costs fluctuate because of changes in domestic and international supply and demand, labor costs, competition, market speculation, product availability, environmental restrictions, government regulation and trade policies, duties, weather conditions, processing and freight costs and delivery delays. We generally do not have long-term supply contracts or guaranteed purchase amounts. As a result, we may not be able to anticipate or react to changing hardwood costs by adjusting our purchasing practices, and we may not always be able to increase the selling prices of our products in response to increases in supply costs. If we cannot address changing hardwood costs appropriately, it could cause our operating results to deteriorate.
Increased delivery costs, particularly those relating to the cost of fuel, could harm our results of operations.
The efficient transportation of our products through our supply chain is a critical component of our operations. If the cost of fuel or other costs, such as import tariffs, rise, it could result in increases in our cost of sales and selling, general and
14
Table of Contents
administrative expenses due to additional delivery charges and in the fees transportation companies charge us to transport our products to our stores and customers. We may be unable to increase the price of our products to offset increased delivery charges, which could cause our operating results to deteriorate.
Damage, destruction or disruption of our Toano facility could significantly impede our ability to finish and distribute our products.
We currently finish approximately 76% of all Bellawood products at our Toano facility. In 2010, Bellawood flooring accounted for approximately one-sixth of our net sales. We also finish small quantities of certain of our other products there. In addition, the Toano facility serves as our primary distribution center, and approximately 81% of our merchandise passes through this facility before we move it to our stores. The Toano facility also houses our primary computer systems, which control our management information and inventory management systems, and our corporate headquarters. If the Toano facility or our inventory held there were damaged or destroyed by fire, wood infestation or other causes, our entire finishing and distribution processes would be disrupted, which could cause significant lost production and delays in delivery. This could impede our ability to stock our stores and deliver products to our customers, and cause our net sales and operating results to deteriorate.
If our management information systems experience disruptions, it could disrupt our business and reduce our net sales.
We depend on our management information systems to integrate the activities of our stores, website and call center, to process orders, to respond to customer inquiries, to manage inventory, to purchase merchandise and to sell and ship goods on a timely basis. We may experience operational problems with our information systems as a result of system failures, viruses, computer “hackers” or other causes. Any significant disruption or slowdown of our systems could cause information, including data related to customer orders, to be lost or delayed, which could result in delays in the delivery of products to our stores and customers or lost sales. Moreover, our entire corporate network, including our telephone lines, is on an Internet-based network. Accordingly, if our network is disrupted, we may experience delayed communications within our operations and between our customers and ourselves, and may not be able to communicate at all via our network, including via telephones connected to our network.
Any disruption of our website or our call center could disrupt our business and lead to reduced net sales and reputational damage.
Our website and our call center are integral parts of our integrated multi-channel strategy. Customers use our website and our call center as information sources on the range of products available to them and to order our products, samples or catalogs. Our website, in particular, is vulnerable to certain risks and uncertainties associated with the Internet, including changes in required technology interfaces, website downtime and other technical failures, security breaches and consumer privacy concerns. If we cannot successfully maintain our website and call center in good working order, it could reduce our net sales and damage our reputation.
Failure to manage our growth effectively could harm our business and operating results.
Our plans call for a significant number of new stores, and increased orders from our website, call center and catalogs. Our existing management information systems, including our store management systems and financial and management controls, may be unable to support our expansion. Managing our growth effectively will require us to continue to enhance these systems, procedures and controls and to hire, train and retain regional managers, store managers and store staff. We may not respond quickly enough to the changing demands that our expansion will impose on our management, staff and existing infrastructure. Any failure to manage our growth effectively could harm our business and operating results.
Our success depends substantially upon the continued retention of certain key personnel.
We believe that our success has depended and continues to depend to a significant extent on the efforts and abilities of our senior management team. The loss, for any reason, of the services of any of these key individuals and any negative market or industry perception arising from such loss, could damage our business and harm our reputation.
15
Table of Contents
Our success depends upon our ability to attract, train and retain highly qualified managers and staff.
Our success depends in part on our ability to attract, hire, train and retain qualified managers and staff. Buying hardwood flooring is an infrequent event, and typical consumers have very little knowledge of the range, characteristics and suitability of the products available to them before starting the purchasing process. Therefore, consumers in the hardwood flooring market expect to have sales associates serving them who are knowledgeable about the entire assortment of products offered by the retailer and the process of choosing and installing hardwood flooring. As a result, competition for qualified store managers and sales associates among flooring retailers is intense. We may not succeed in attracting and retaining the personnel we require to conduct our current operations and support our potential future growth. In addition, as we expand into new markets, we may find it more difficult to hire, motivate and retain qualified employees.
Increased competition could cause price declines, decrease demand for our products and decrease our market share.
We operate in the hardwood flooring industry, which is highly fragmented and competitive. We face significant competition from multinational home improvement chains, national and regional flooring specialty chains, Internet-based companies and privately-owned single-site enterprises. We compete on the basis of price, customer service, store location and range, quality and availability of hardwood flooring we offer our customers. Our competitive position is also influenced by the availability, quality and cost of merchandise, labor costs, finishing, distribution and sales efficiencies and our productivity compared to that of our competitors. As we expand into new and unfamiliar markets, we may experience different competitive conditions than in the past.
Some of our competitors are larger organizations, have existed longer, are more diversified in the products they offer and have a more established market presence with substantially greater financial, marketing, personnel and other resources than we have. In addition, our competitors may forecast market developments more accurately than we do, develop products that are superior to ours or produce similar products at a lower cost, or adapt more quickly to new technologies or evolving customer requirements than we do. Intense competitive pressures from one or more of our competitors could cause price declines, decrease demand for our products and decrease our market share.
Hardwood flooring may become less popular as compared to other types of floor coverings in the future. For example, our products are made using various hardwood species, including rare exotic hardwood species harvested from rainforests, and concern over the environmental impact of tree harvesting could shift consumer preference towards synthetic or inorganic flooring. In addition, hardwood flooring competes against carpet, vinyl sheet, vinyl tile, ceramic tile, natural stone and other types of floor coverings. If consumer preferences shift towards types of floor coverings other than hardwood flooring, we may experience decreased demand for our products.
All of these competitive factors may harm us and reduce our net sales and profits.
Our success depends on the continued effectiveness of our advertising strategy.
We believe that our past success was achieved in part through our successful investment in local and national advertising. We typically locate our stores in industrial or commercial areas that have lower rents than traditional retail locations, but that are generally set some distance from population centers and downtown urban areas. To support this real estate strategy, we have used extensive advertising to encourage customers to drive to our stores. We may need to increase our advertising expense to support our business strategy in the future. In addition, we continue to transition our toll-free telephone number from 1-800-FLOORING, which we lease under a contract with indefinite renewal rights, to 1-800-HARDWOOD, the rights to which we own. We may experience increased costs until the transition is complete or in the event that our existing lease is terminated. If our advertisements fail to draw customers in the future, or if the cost of advertising or other marketing materials increases significantly, we could experience declines in our net sales and operating results.
Failure to maintain relevant product endorsement agreements and product placement arrangements could harm our reputation and cause our net sales to deteriorate.
We have established relationships with well-known and respected home improvement celebrities to evaluate, promote and help establish with consumers the high-quality nature of our products. If these individuals were to stop promoting our products, if we were unable to renew our endorsement contracts with them or if we could not find other endorsers of a similar
16
Table of Contents
caliber, our net sales and reputation could be harmed. Similarly, any actions that persons endorsing our products may take, whether or not associated with our products, which harm their or our reputations could also harm our brand image with consumers and our reputation, and cause our net sales to deteriorate. We also have a number of product placement arrangements with home improvement-related television shows. We rely on these arrangements to increase awareness of our brands, and to enable potential customers to see both what our flooring will look like after installation and the relative ease with which it can be installed. Any failure to continue these arrangements could cause our brands to become less well-known and cause our net sales to deteriorate.
We have entered into a number of lease agreements with companies controlled by our founder and this concentration of leases may pose certain business risks.
As of December 31, 2010, we lease our Toano facility, which includes a store location, and 26 of our other store locations from entities owned, in whole or in part, by Tom Sullivan. Although our percentage of total stores leased from such entities has decreased over the last few years, this concentration of leases subjects us to risk in the event action or inaction by Tom or such entities impacts our leasehold interests in the locations.
We may not be able to adequately protect our intellectual property, which could harm the value of our brands and harm our business.
Our intellectual property is material to the conduct of our business. Our ability to implement our business plan successfully depends in part on our ability to further build brand recognition using our trademarks, service marks and other proprietary intellectual property, including our name and logo and the names and logos of our brands. We may incur significant costs and expenses relating to our efforts to enforce our intellectual property rights. If our efforts to protect our intellectual property are inadequate, or if any third party infringes on or misappropriates our intellectual property, the value of our brands may be harmed, which could adversely affect our business and might prevent our brands from achieving or maintaining market acceptance. We may also encounter claims from prior users of similar intellectual property in locales where we operate or intend to operate. This could harm our image, brand or competitive position and cause us to incur significant penalties and costs.
Federal, state or local laws and regulations, or our failure to comply with such laws and regulations, could increase our expenses, restrict our ability to conduct our business and expose us to legal risks.
We are subject to a wide range of general and industry-specific laws and regulations imposed by federal, state and local authorities including those related to customs, foreign operations (such as the Foreign Corrupt Practices Act), truth-in-advertising, consumer protection, privacy, zoning and occupancy matters as well as the operation of retail stores and warehouse, production and distribution facilities. In addition, various federal and state laws govern our relationship with and other matters pertaining to our employees, including wage and hour laws, requirements to provide meal and rest periods or other benefits, family leave mandates, requirements regarding working conditions and accommodations to certain employees, citizenship or work authorization and related requirements, insurance and workers’ compensation rules and anti-discrimination laws. If we fail to comply with these laws and regulations, we could be subject to legal risk, our operations could be impacted negatively and our reputation could be damaged. Likewise, if such laws and regulations should change, our costs of compliance may increase, thereby impacting our results and hurting our profitability.
Certain portions of our operations are subject to laws and regulations governing the use, storage, handling, generation, treatment, emission, release, discharge and disposal of certain hazardous materials and wastes, the remediation of contaminated soil and groundwater and the health and safety of employees. If we are unable to extend or renew a material approval, license or permit required by such laws, or if there is a delay in renewing any material approval, license or permit, that may cause our sales and operating results to deteriorate or otherwise harm our business.
With regard to our products, we may spend significant time and resources to ensure compliance with applicable advertising, importation, exportation, environmental, health and safety laws and regulations. If we should violate these laws and regulations, we could experience delays in shipments of our goods, be subject to fines or penalties, or suffer reputational harm, which could reduce demand for our merchandise and hurt our business and results of operations. Further, if such laws and regulations should change, we may experience increased costs or incur decreased efficiency in order to adhere to the new standards.
17
Table of Contents
We may incur costs resulting from security risks we face in connection with our electronic processing, transmission and storage of confidential customer information.
We accept electronic payment cards for payment in our stores and through our call center. In addition, our online operations depend upon the secure transmission of confidential information over public networks, including information permitting cashless payments. As a result, we may become subject to claims for purportedly fraudulent transactions arising out of the actual or alleged theft of credit or debit card information, and we may also be subject to lawsuits or other proceedings relating to these types of incidents. Further, a compromise of our security systems that results in our customers’ personal information being obtained by unauthorized persons could adversely affect our reputation with our customers and others, as well as our operations, results of operations and financial condition, and could result in litigation against us or the imposition of penalties. A security breach could also require that we expend significant additional resources related to the security of information systems and could result in a disruption of our operations, particularly our online sales operations.
Additionally, privacy and information security laws and regulations change, and compliance with them may result in cost increases due to necessary systems changes and the development of new administrative processes. If we fail to comply with these laws and regulations or experience a data security breach, our reputation could be damaged, possibly resulting in lost future business, and we could be subjected to additional legal risk as a result of non-compliance.
The expansion of our store base to Canada may present increased risks due to our limited familiarity with that market.
In 2011, we plan to open store locations in Canada. The Canadian market may have different competitive conditions, consumer tastes and discretionary spending patterns than our existing markets. As a result, new stores in that market may be less successful than our stores in the United States. Additionally, consumers in the Canadian market may not be familiar with our brand, and we may need to build brand awareness in that market through greater investments in advertising and promotional activity than we originally planned. Furthermore, we have limited experience with the legal and regulatory environments and market practices outside of the United States and cannot guarantee that we will be able to penetrate or successfully operate in the Canadian market. We may also incur additional costs in complying with applicable Canadian laws and regulations as they pertain to both our products and our operations.
Changes in accounting standards and subjective assumptions, estimates and judgments by management related to complex accounting matters could significantly affect our financial results.
Generally accepted accounting principles and related accounting pronouncements, implementation guidelines and interpretations with regard to a wide range of matters that are relevant to our business, including but not limited to, revenue recognition, stock-based compensation, lease accounting, sales returns reserves, inventories, self-insurance, income taxes, unclaimed property laws and litigation, are highly complex and involve many subjective assumptions, estimates and judgments by our management. Changes in these rules or their interpretation or changes in underlying assumptions, estimates or judgments by our management could significantly change our reported or expected financial performance.
Our insurance coverage and self-insurance reserves may not cover future claims.
We maintain various insurance policies for employee health, workers’ compensation, general liability and property damage. We are self-insured on certain health insurance plans and are responsible for losses up to a certain limit for these respective plans. We continue to be responsible for losses up to a certain limit for general liability and property damage insurance.
For policies under which we are responsible for losses, we record a liability that represents our estimated cost of claims incurred and unpaid as of the balance sheet date. Our estimated liability is not discounted and is based on a number of assumptions and factors, including historical trends, actuarial assumptions and economic conditions, and is closely monitored and adjusted when warranted by changing circumstances. Our history of claims experience is not extensive and our significant growth rate could affect the accuracy of estimates based on historical experience. Should a greater amount of claims occur compared to what was estimated or medical costs increase beyond what was expected, our accrued liabilities might not be sufficient and we may be required to record additional expense. Unanticipated changes may produce materially different amounts of expense than that reported under these programs, which could adversely impact our results of operations.
18
Table of Contents
Risks Relating to Our Common Stock
Tom Sullivan has the ability to exercise significant influence over us and his interests in our business may be different than yours.
At December 31, 2010, Tom controlled approximately 13% of our outstanding common stock. Accordingly, he is able to exercise significant influence over our business policies and affairs and all matters requiring a stockholders’ vote, including the composition of our board of directors, the adoption of amendments to our certificate of incorporation and the approval of mergers or sales of all or substantially all of our assets. This concentration of ownership could also delay, defer or even prevent a change in control of our company and may make some transactions more difficult or impossible without his support. Tom’s interests may conflict with yours, and he may seek to cause us to take courses of action that, in his judgment, could enhance his investment in us, but which might involve risks to holders of our common stock or be harmful to our business or other investors. In addition, the timing and volume of any transactions involving our common stock by Tom may, among other things, cause fluctuations in the price of our common stock.
Our anti-takeover defense provisions may cause our common stock to trade at market prices lower than it might absent such provisions.
Our certificate of incorporation and bylaws contain several provisions that may make it more difficult or expensive for a third party to acquire control of us without the approval of our board of directors. These provisions include a staggered board, the availability of “blank check” preferred stock, provisions restricting stockholders from calling a special meeting of stockholders or requiring one to be called or from taking action by written consent and provisions that set forth advance notice procedures for stockholders’ nominations of directors and proposals of topics for consideration at meetings of stockholders. Our certificate of incorporation also provides that Section 203 of the Delaware General Corporation Law, which relates to business combinations with interested stockholders, applies to us. These provisions may delay, prevent or deter a merger, acquisition, tender offer, proxy contest or other transaction that might otherwise result in our stockholders receiving a premium over the market price for their common stock. In addition, these provisions may cause our common stock to trade at a market price lower than it might absent such provisions.
Our common stock price may be volatile and you may lose all or part of your investment.
The market price of our common stock could fluctuate significantly. Those fluctuations could be based on various factors in addition to those otherwise described in this report, including:
| • | our operating performance and the performance of our competitors; |
| • | the public’s reaction to our press releases, our other public announcements and our filings with the SEC; |
| • | changes in earnings estimates or recommendations by research analysts who follow Lumber Liquidators or other companies in our industry; |
| • | variations in general economic conditions; |
| • | actions of our current stockholders, including sales of common stock by our directors and executive officers; |
| • | the arrival or departure of key personnel; and |
| • | other developments affecting us, our industry or our competitors. |
In addition, the stock market may experience significant price and volume fluctuations. These fluctuations may be unrelated to the operating performance of particular companies but may cause declines in the market price of our common stock. The price of our common stock could fluctuate based upon factors that have little or nothing to do with our company or its performance.
Our quarterly operating results may fluctuate significantly and could fall below the expectations of research analysts and investors due to various factors.
Our quarterly operating results may fluctuate significantly because of various factors, including:
| • | changes in comparable store net sales and customer visits, including as a result of declining consumer confidence or the introduction of new products; |
19
Table of Contents
| • | the timing of new store openings and related sales and expenses; |
| • | profitability of our stores, especially in new markets; |
| • | the impact of inclement weather, natural disasters and other calamities; |
| • | variations in general economic conditions, including the impact of interest rates on our interest income; |
| • | the timing and scope of sales promotions and product introductions; |
| • | changes in consumer preferences and discretionary spending; |
| • | fluctuations in supply prices; and |
| • | tax expenses, impairment charges and other non-operating costs. |
Due to these factors, results for any one quarter are not necessarily indicative of results to be expected for any other quarter or for any year. Average store net sales or comparable store net sales in any particular future period may decrease. In the future, operating results may fall below the expectations of research analysts and investors, which could cause the price of our common stock to fall.
Item 1B. Unresolved Staff Comments.
None.
As of February 23, 2011, we operated 230 stores located in 46 states, including seven opened since December 31, 2010. We lease all of our stores and our corporate headquarters located in Toano, Virginia, which includes our call center, corporate offices, and distribution and finishing facility. In addition, we lease 515,486 square feet in Hampton, Virginia, near the port, to supplement our distribution facility. Our corporate headquarters has 307,784 square feet, of which approximately 32,000 square feet are office space, and is located on a 74-acre plot.
The table below sets forth the locations (alphabetically by state) of our U.S. stores in operation as of February 23, 2011.
| State |
Stores | State |
Stores | State |
Stores | State |
Stores | |||||||
| Alabama |
5 | Iowa | 3 | Nevada | 2 | Rhode Island | 1 | |||||||
| Arizona |
4 | Kansas | 2 | New Hampshire | 4 | South Carolina | 4 | |||||||
| Arkansas |
2 | Kentucky | 3 | New Jersey | 7 | South Dakota | 1 | |||||||
| California |
19 | Louisiana | 4 | New Mexico | 1 | Tennessee | 5 | |||||||
| Colorado |
5 | Maine | 2 | New York | 12 | Texas | 20 | |||||||
| Connecticut |
3 | Maryland | 4 | North Carolina | 8 | Utah | 2 | |||||||
| Delaware |
3 | Massachusetts | 6 | North Dakota | 1 | Vermont | 1 | |||||||
| Florida |
16 | Michigan | 6 | Ohio | 7 | Virginia | 9 | |||||||
| Georgia |
7 | Minnesota | 5 | Oklahoma | 2 | Washington | 7 | |||||||
| Idaho |
2 | Mississippi | 2 | Oregon | 2 | West Virginia | 2 | |||||||
| Illinois |
8 | Missouri | 3 | Pennsylvania | 9 | Wisconsin | 3 | |||||||
| Indiana |
4 | Nebraska | 2 |
As of February 23, 2011, 27 of our store locations are leased from related parties. See discussion of properties leased from related parties in Note 5 to the consolidated financial statements included in Item 8 of this report and within Certain Relationships, Related Transactions and Director Independence in Item 13 of this report.
On September 3, 2009, a former store manager and a current assistant store manager at the time (together, the “Plaintiffs”) filed a putative class action suit against Lumber Liquidators, Inc. (“LLI”) in the Superior Court of California in and for the County of Alameda. The Plaintiffs allege that with regard to certain groups of current and former employees in LLI’s California stores, LLI violated California law by failing to calculate and pay overtime wages properly, provide meal
20
Table of Contents
breaks, compensate for unused vacation time, reimburse for certain expenses and maintain required employment records. The Plaintiffs also claim that LLI did not calculate and pay overtime wages properly for certain of LLI’s non-exempt employees, both in and out of California, in violation of federal law. In their suit, the Plaintiffs seek compensatory damages, certain statutory penalties, costs, attorney’s fees and injunctive relief. LLI removed the case to the United States District Court for the Northern District of California. No class has been certified with regard to any of the alleged causes of action. LLI is vigorously defending the claims in this suit including class certification. While there is a reasonable possibility that a material loss may be incurred, we cannot estimate the loss or range of loss, if any, to us at this time.
On or about September 7, 2010, a former store manager filed an action against LLI in the United States District Court for the Middle District of Florida. In the complaint, the former store manager alleges that LLI breached an alleged contract for the payment of a commission and violated the Fair Labor Standards Act (“FLSA”) by failing to pay him for overtime hours worked. In addition, he asserts a purported collective action on behalf of similarly situated LLI employees alleging that LLI denied them overtime wages in violation of the FLSA. No class has been certified with regard to the purported collective action. LLI intends to defend the claims in this suit vigorously including collective action certification. While there is a reasonable possibility that a material loss may be incurred, we cannot estimate the loss or range of loss, if any, to us at this time.
We also are, from time to time, subject to claims and disputes arising in the normal course of business. In the opinion of management, while the outcome of any such claims and disputes cannot be predicted with certainty, our ultimate liability in connection with these matters is not expected to have a material adverse effect on our results of operations, financial position or cash flows.
Item 4. (Removed and Reserved).
21
Table of Contents
| Item 5. | Market for Registrant’s Common Equity, Related Stockholder Matters and Issuer Purchases of Equity Securities. |
Market Information
Our common stock trades on the New York Stock Exchange (“NYSE”) under the trading symbol “LL.” We are authorized to issue up to 35,000,000 shares of common stock, par value $0.001. Total shares of common stock outstanding at February 22, 2011 were 27,612,266, and we had 15 stockholders of record.
The following table shows the high and low sales prices per share as reported by the NYSE for each quarter during the last two fiscal years.
| Price Range | ||||||||
| High | Low | |||||||
| 2010: |
||||||||
| Fourth Quarter |
$ | 27.05 | $ | 21.09 | ||||
| Third Quarter |
25.49 | 19.33 | ||||||
| Second Quarter |
33.41 | 22.97 | ||||||
| First Quarter |
28.53 | 21.85 | ||||||
| 2009: |
||||||||
| Fourth Quarter |
$ | 28.93 | $ | 20.42 | ||||
| Third Quarter |
22.74 | 14.85 | ||||||
| Second Quarter |
17.15 | 11.90 | ||||||
| First Quarter |
12.95 | 7.02 | ||||||
Dividend Policy
We have never paid any dividends on our common stock. Any future decision to pay cash dividends will be at the discretion of our board of directors and will be dependent on our results of operations, financial condition, contractual restrictions and other such factors that the board of directors considers relevant.
Securities Authorized for Issuance Under Equity Compensation Plans
See Item 12. “Security Ownership of Certain Beneficial Owners and Management and Related Stockholder Matters” for information regarding securities authorized for issuance under our equity compensation plans.
22
Table of Contents
Performance Graph
The following graph compares the performance of our common stock during the period beginning November 9, 2007, our initial public offering date, through December 31, 2010, to that of the total return index for the NYSE Composite, the Dow Jones US Furnishings Index and the S&P SmallCap 600 Index (which includes Lumber Liquidators) assuming an investment of $100 on November 9, 2007. In calculating total annual stockholder return, reinvestment of dividends, if any, is assumed. The indices are included for comparative purpose only. They do not necessarily reflect management’s opinion that such indices are an appropriate measure of the relative performance of our common stock.
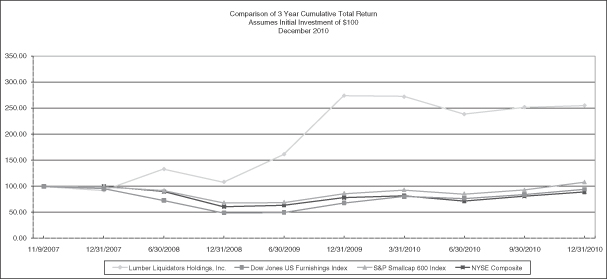
| 11/9/2007 | 12/31/2007 | 6/30/2008 | 12/31/2008 | 6/30/2009 | 12/31/2009 | 3/31/2010 | 6/30/2010 | 9/30/2010 | 12/31/2010 | |||||||||||||||||||||||||||||||
| Lumber Liquidators, Inc. |
$ | 100.00 | $ | 92.11 | $ | 133.20 | $ | 108.20 | $ | 161.48 | $ | 274.60 | $ | 273.26 | $ | 239.04 | $ | 251.74 | $ | 255.23 | ||||||||||||||||||||
| NYSE Stock Market.(US) |
$ | 100.00 | $ | 100.42 | $ | 90.58 | $ | 61.11 | $ | 63.83 | $ | 78.57 | $ | 81.92 | $ | 71.71 | $ | 81.17 | $ | 89.28 | ||||||||||||||||||||
| Dow Jones US Furnishings Index |
$ | 100.00 | $ | 95.99 | $ | 73.00 | $ | 48.75 | $ | 49.70 | $ | 67.93 | $ | 80.98 | $ | 76.70 | $ | 84.44 | $ | 94.45 | ||||||||||||||||||||
| S&P SmallCap 600 Index |
$ | 100.00 | $ | 98.96 | $ | 91.95 | $ | 68.21 | $ | 68.67 | $ | 85.66 | $ | 93.03 | $ | 84.90 | $ | 93.07 | $ | 108.19 | ||||||||||||||||||||
23
Table of Contents
Item 6. Selected Financial Data.
The selected statements of income data for the years ended December 31, 2010, 2009 and 2008 and the balance sheet data as of December 31, 2010 and 2009 have been derived from our audited consolidated financial statements included in Item 8. “Consolidated Financial Statements and Supplementary Data” of this report. This information should be read in conjunction with those audited financial statements, the notes thereto, and Item 7. “Management’s Discussion and Analysis of Financial Condition and Results of Operations” of this report.
We completed our initial public offering in November 2007. We reorganized effective December 31, 2009, creating a new holding company structure, and as a result, a new parent company named Lumber Liquidators Holdings, Inc. was formed. Outstanding shares of the common stock of the former parent company, which was named Lumber Liquidators, Inc., were automatically converted, on a share for share basis, into identical shares of common stock of the new holding company. We operate as a single segment.
The selected balance sheet data set forth below as of December 31, 2008, 2007 and 2006, and income data for the years ended December 31, 2007 and 2006 are derived from our audited consolidated financial statements contained in reports previously filed with the SEC, not included herein. Our historical results are not necessarily indicative of our results for any future period.
| Year Ended December 31, | ||||||||||||||||||||
| 2010 | 2009 | 2008 | 2007 | 2006 | ||||||||||||||||
| (in thousands, except share and per share amounts) | ||||||||||||||||||||
| Statement of Income Data |
||||||||||||||||||||
| Net sales |
$ | 620,281 | $ | 544,568 | $ | 482,179 | $ | 405,307 | $ | 332,060 | ||||||||||
| Cost of sales |
404,451 | 349,891 | 314,501 | 270,193 | 221,931 | |||||||||||||||
| Gross profit |
215,830 | 194,677 | 167,678 | 135,114 | 110,129 | |||||||||||||||
| Selling, general and administrative expenses |
173,667 | 151,070 | 130,693 | 116,308 | 88,716 | |||||||||||||||
| Operating income |
42,163 | 43,607 | 36,985 | 18,806 | 21,413 | |||||||||||||||
| Interest expense |
— | 2 | 27 | 722 | 722 | |||||||||||||||
| Other (income) expense(1) |
(579 | ) | (500 | ) | (834 | ) | (413 | ) | (368 | ) | ||||||||||
| Income before income taxes |
42,742 | 44,105 | 37,792 | 18,497 | 21,059 | |||||||||||||||
| Provision for income taxes |
16,476 | 17,181 | 15,643 | 7,171 | 8,161 | |||||||||||||||
| Net income |
$ | 26,266 | $ | 26,924 | $ | 22,149 | $ | 11,326 | $ | 12,898 | ||||||||||
| Net income per common share: |
||||||||||||||||||||
| Basic |
$ | 0.96 | $ | 1.00 | $ | 0.83 | $ | 0.68 | $ | 0.86 | ||||||||||
| Diluted |
$ | 0.93 | $ | 0.97 | $ | 0.82 | $ | 0.48 | $ | 0.56 | ||||||||||
| Weighted average common shares outstanding: |
||||||||||||||||||||
| Basic |
27,384,095 | 26,983,689 | 26,772,288 | 16,646,674 | 15,000,100 | |||||||||||||||
| Diluted |
28,246,453 | 27,684,547 | 27,090,593 | 23,634,995 | 22,989,403 | |||||||||||||||
| (1) | Includes interest income. |
| As of December 31, | ||||||||||||||||||||
| 2010 | 2009 | 2008 | 2007 | 2006 | ||||||||||||||||
| (in thousands) | ||||||||||||||||||||
| Balance Sheet Data |
||||||||||||||||||||
| Cash and cash equivalents |
$ | 34,830 | $ | 35,675 | $ | 35,139 | $ | 33,168 | $ | 3,965 | ||||||||||
| Merchandise inventories |
155,131 | 133,342 | 88,731 | 72,024 | 51,758 | |||||||||||||||
| Total assets |
242,290 | 205,880 | 152,405 | 128,424 | 78,020 | |||||||||||||||
| Customer deposits and store credits |
12,039 | 9,805 | 10,418 | 9,609 | 6,804 | |||||||||||||||
| Total debt and capital lease obligations, including current maturities |
— | — | — | 122 | 9,603 | |||||||||||||||
| Stock compensation liability |
— | — | — | — | 9,132 | |||||||||||||||
| Redeemable preferred stock(1) |
— | — | — | — | 34,795 | |||||||||||||||
| Total stockholders’ equity (deficit) |
180,505 | 148,434 | 114,397 | 92,188 | (5,468 | ) | ||||||||||||||
| Working capital(2) |
146,118 | 124,100 | 96,245 | 77,875 | 30,297 | |||||||||||||||
| (1) | In 2004, a private investment group purchased 7,952,018 shares of Series A Convertible Preferred Stock (the “Redeemable Preferred Stock”); all shares of Redeemable Preferred Stock were converted into shares of common stock on a one-to-one basis on November 8, 2007. |
| (2) | Working capital is defined as current assets minus current liabilities. |
24
Table of Contents
Item 7. Management’s Discussion and Analysis of Financial Condition and Results of Operations.
Overview and Trends
Lumber Liquidators is the largest specialty retailer of hardwood flooring in the United States, based on industry sources and our experience. We believe we have achieved a reputation for offering great value, superior service and a broad selection of high-quality hardwood flooring products. We offer our products through multiple, complementary channels, including 223 Lumber Liquidators stores in 46 states at December 31, 2010, a full-service call center in Toano, Virginia, our website and our catalog. We seek to appeal to customers who desire a high-quality product at an attractive value and are willing to travel to less convenient locations to get it. We sell our products principally to existing homeowners, who we believe represent over 90% of our customer count. Historically, these homeowners are in their mid-30’s or older, are well-educated and have been living in their homes for at least several years.
We offer an extensive selection of premium hardwood flooring products under multiple proprietary brands at everyday low prices designed to appeal to a diverse customer base. Substantially all of our products are purchased directly from mills or associated brokers with whom we have cultivated long-standing relationships to ensure a consistent supply of high-quality product at the lowest prices. Our mill partners are located primarily in North America, South America, Asia and Australia. We believe that our vertically integrated business model enables us to offer a broad assortment of high-quality products to our customers at a lower cost than our competitors.
We believe that our brands, value proposition and integrated multi-channel approach are important competitive advantages in a hardwood flooring market that is highly fragmented. We compete on the basis of price, quality, selection and availability of the wood flooring that we offer our customers, as well as the level of customer service we can provide. We position ourselves as hardwood flooring experts and believe our high level of customer service reflects this positioning.
The wood flooring market for homeowners is dependent on home-related discretionary spending, which is influenced by a number of complex economic and demographic factors that may vary locally, regionally and nationally. In 2006, many of the economic indicators associated with the wood flooring market weakened, and in the latter half of 2008, consumer discretionary spending came under pressure. We expect the weakness to continue in 2011 with only gradual improvement throughout the year when comparing 2011 to 2010. We believe general discretionary spending will improve prior to home-related discretionary spending. We expect to capture share in our market primarily through store base expansion.
We continue to invest in the infrastructure supporting our store growth and operations. In recent years, our focus has been on product assortment, in-stock inventory position, international and domestic logistics, store management training, and an integrated technology solution to support our future growth. We expect to continue to focus in these areas.
We implemented the first, and most significant, phase of our integrated technology solution in August 2010. This implementation included an enhanced point-of-sale solution across our entire store base, a warehouse management and inventory control system serving our entire distribution network, an integrated merchandising and product allocation system, and certain related management reporting functionality. We continued to conduct our business without interruption, but the implementation had a pervasive impact across our operations, primarily resulting in reduced productivity in our store and warehouse operations, adversely impacting our results in the second half of 2010. By the end of the fourth quarter of 2010, we believe our overall productivity was very close to the pre-implementation level, reaching that level in the first quarter of 2011. We remain confident in the long-term benefits of the integrated solution, and we believe our operations will ultimately benefit from enhancements not available through our previous information system.
We have grown our store base rapidly with approximately 50% of our total store locations opened in the past three years, including 37 new store locations in 2010. We believe our existing primary and secondary metropolitan markets will benefit from additional stores, and in 2010, we opened 23 new store locations in these markets. Our experience has shown that our store model is well suited for markets smaller than the primary and secondary metropolitan areas, and going forward, the majority of our new market stores will be located in these smaller markets. We expect to open 40 to 50 new store locations in each of the next few years, including new store locations in Canada, with an approximately equal mix of new markets and existing markets.
25
Table of Contents
Our recent store opening activity is as follows:
| 2010 | 2009 | 2008 | ||||||||||
| Number of stores at January 1 |
186 | 150 | 116 | |||||||||
| New stores |
37 | 36 | 34 | |||||||||
| Number of stores at December 31 |
223 | 186 | 150 | |||||||||
Net sales at our comparable stores have been driven by increases in our total sales volume, primarily measured in square footage, partially offset by decreases in our average sale. We generally consider a store comparable on the first day of the 13th month of operation. Sales volume increases have come from demand for our expanded assortment of products and the maturation of our store base. Macroeconomic pressures have generally shifted consumer demand towards certain key product lines which have a lower than average retail price. Changes to comparable prior year results are as follows:
| For the year
ended December 31, |
||||||||||||
| 2010 | 2009 | 2008 | ||||||||||
| increase (decrease) | ||||||||||||
| Comparable Stores: |
||||||||||||
| Net sales |
2.1 | % | 0.0 | % | 1.6 | % | ||||||
| Customers invoiced1 |
4.5 | % | 12.4 | % | 5.7 | % | ||||||
| Average sale2 |
(2.4 | %) | (11.0 | %) | (3.8 | %) | ||||||
| Average retail price per unit sold3 |
(3.7 | %) | (10.5 | %) | (4.4 | %) | ||||||
| 1 | Approximated by applying our average sale to total net sales at comparable stores |
| 2 | Average sale is calculated on a total company basis |
| 3 | Average retail price per unit sold is calculated on a total company basis and excludes certain service revenue, which consists primarily of freight charges for in-home delivery |
Our cost of sales is driven primarily by the cost of acquiring the products we sell from our suppliers, but also includes international and domestic transportation costs, customs and duty charges, transportation charges from our distribution center to our stores and the cost of delivering product purchases to the customer. Our gross margin is impacted by the cost of sales, the mix of products sold and the average retail price per unit sold. In 2010, 2009 and 2008, our gross margin has been 34.8%, 35.7% and 34.8%, respectively. Significant changes in transportation costs have been the primary driver of the changes in gross margin.
Labor costs and advertising expenses have historically been our most significant SG&A expenses. Our total labor costs have increased as a percentage of net sales over the last three years due primarily to our store base growth and investment in support infrastructure. Our annual advertising costs have increased as we continue to promote our brand and implement direct sales generation programs in support of our growth, but we continue to leverage national advertising across a larger store base and commit greater resources to our most effective media channels. Our SG&A expenses as a percentage of net sales have been 28.0%, 27.7% and 27.1% in 2010, 2009 and 2008, respectively. We expect to expand annual operating margins as we continue to grow our net sales. In 2010, however, our operating margin decreased to 6.8% from 8.0% in 2009, primarily due to certain adverse impacts from the implementation of our integrated technology solution.
Our most significant asset is our merchandise inventory. Merchandise inventory is considered either “available for sale” or “inbound in-transit,” based on whether we have physically received and inspected the products. We launched our initiative to strengthen our in-stock commitment to our top selling products in the fourth quarter of 2009. The increase in 2010 available inventory per store is primarily a result of the adverse impact of our reduced productivity. Merchandise inventories and available inventory per store in operation on December 31 were as follows:
| 2010 | 2009 | 2008 | ||||||||||
| (in thousands) | ||||||||||||
| Inventory—Available for Sale |
$ | 136,179 | $ | 109,369 | $ | 75,521 | ||||||
| Inventory—Inbound In-Transit |
18,952 | 23,973 | 13,210 | |||||||||
| Total Merchandise Inventories |
$ | 155,131 | $ | 133,342 | $ | 88,731 | ||||||
| Available Inventory Per Store |
$ | 611 | $ | 588 | $ | 503 | ||||||
26
Table of Contents
SAP Implementation
Overview. In June 2009, we signed a software license agreement with SAP Retail, Inc. (“SAP”) for a broad scope of SAP retail software products to implement an integrated business solution in multiple phases. On August 21, 2010, we implemented the first, and most significant, phase, which included:
| • | An enhanced point-of-sale solution across our entire store base, |
| • | A warehouse management and inventory control system serving our entire distribution network, |
| • | An integrated merchandising and product allocation system, and |
| • | Related management reporting functionality. |
These new management information solutions were fully integrated with our website, call center and customer service systems.
All critical information was converted from our previous information system and we have continued to operate our business without interruption since the conversion. However, the implementation of this system had a pervasive impact across our operations that resulted, primarily, in reduced productivity in our store and warehouse operations, which adversely impacted our results in the second half of 2010. This reduction in productivity included:
| • | The effectiveness of our store operations to satisfy existing customer orders and generate new demand, |
| • | The efficiency of our product allocation and distribution, and |
| • | Greater allocation of resources required to operate our business. |
As additional resources were allocated to address specific areas with reduced productivity, operational efficiency and effectiveness improved. In addition, general operating familiarity improved with continued execution.
Expectations for 2011. We expect to return to pre-implementation productivity during the first quarter of 2011, and any remaining adverse impacts from the recovery of productivity are expected to be confined to the first half of 2011. At the close of the fourth quarter of 2010, we were very near pre-implementation productivity. Our open customer demand, as measured by customer deposits on open orders, had nearly returned to historic norms at December 31, 2010, and certain metrics which indicate better servicing of customer interest, including catalog and flooring sample requests, returned to pre-implementation levels in December 2010.
During 2011, functional areas are expected to begin benefitting from the integrated technology solution, though our results of operations may not reflect those benefits until 2012. Further, we expect certain selling, general administrative (“SG&A”) expenses, including maintenance contracts and professional fees, to increase at a percentage rate greater than our net sales in 2011 as we support our new solution.
We remain confident in the long-term benefits of the integrated solution, and we believe our operations will ultimately benefit from enhancements not available through our previous information system. We expect the SAP system to provide support for our future domestic and international growth, allow for complexity in our supply chain, and enhance the information used by our product planning and allocation functions. We continue to believe these benefits will positively impact net sales and operating margin in future years.
Impact on 2010 Results. Reduced productivity related to our SAP implementation impacted both our results of operations for the year ended December 31, 2010 and our financial position at that date.
| • | Customer Service, Demand and Conversion: We believe our net sales were adversely impacted by the SAP implementation due to our lack of productivity. |
| ¡ | Net sales in both the third and fourth quarter of 2010 were adversely impacted by our inconsistent servicing of new demand subsequent to implementation. Though we saw little decline post implementation in the earliest stages of consumer interest, including traffic to our website, we experienced significant monthly decreases in in-store catalog and flooring sample requests across our store base. These in-store metrics did not return to pre-implementation levels until the month of December 2010. |
27
Table of Contents
| ¡ | Customer orders that were placed in the weeks subsequent to implementation, combined with orders outstanding at implementation, resulted in a significant build of both open demand and related customer deposits at the end of the third quarter of 2010. Further, low productivity across the supply chain and in our stores resulted in us invoicing that demand over a longer period of time. We estimated that the build in our customer deposits at the end of the third quarter of 2010 equated approximately $12.0 million to $14.0 million in unrealized net sales. We believe we realized a substantial portion of that build through net sales in the fourth quarter of 2010 and refunded a small portion of the deposits to customers. However, those net sales were not able to overcome the adverse impact of our inconsistent servicing of new customers in the fourth quarter. |
| • | Efficient product movement: Our gross margin was adversely impacted, primarily in the third quarter of 2010, by inefficient product flow immediately before and after the implementation. Prior to implementation, we built in-store inventory levels to establish a greater level of safety stock, then significantly reduced product flow in preparation for a physical inventory at points within our distribution network, including our central warehouse operation. In the first few weeks following implementation, we were not able to re-establish the product flow as quickly as expected. Though we returned to anticipated levels of product distribution in September, the unit count shipped during the third quarter of 2010 was significantly lower than our expectations. In addition, delays in shipping products necessary to fulfill orders resulted in our usage of more expedited modes of transportation, generally at higher costs. The reduction in warehousing and merchandising productivity also impacted our finishing operations for the first few weeks following implementation. We finished fewer units per hour in comparison to historic norms due to the physical inventory procedures and slower ramp up of operations after implementation. We estimate these costs reduced gross margin by approximately 10 to 12 basis points for the full year 2010. |
| • | Additional supporting resources: We allocated a greater amount of internal and external resources than expected to stabilize our system after implementation, support operations and address the loss of productivity in certain key areas. As a result, our implementation costs increased, and certain SG&A expenses were higher than expected. We believe these non-recurring costs were approximately $0.9 million and included certain warehousing costs, support for store point-of-sale functionality, additional customer service and certain professional fees. |
External Factors Impacting Our Business
The wood flooring market for homeowners is highly fragmented and dependent on home-related discretionary spending, which is influenced by a number of complex economic and demographic factors that may vary locally, regionally and nationally. We are impacted by home remodeling activity, employment levels, housing turnover, real estate prices, new housing starts, consumer confidence, credit availability and the general health of consumer discretionary spending. Many of the economic indicators associated with the wood flooring market and more generally associated with consumer discretionary spending are weak. Though we believe we have seen signs of stabilization in 2010, the wood flooring market is likely to remain in a weakened state during 2011, with only gradual recovery throughout the year. We believe the number of independent retailers serving the homeowner-based segment of the wood flooring market will continue to decline, however, presenting us with an opportunity for market share growth, primarily through store base expansion. We also believe that the longer term trends for our industry remain favorable, including customer perception of hardwood flooring as an attractive alternative to other floor coverings, evolution of the hardwood flooring market, overall home improvement spending, and certain demographic trends. See “Item 1A. Risk Factors—Risks Related to Our Business and Industry.”
In October 2010, a conglomeration of domestic manufacturers of multilayered wood flooring filed a Petition for the Imposition of Antidumping and Countervailing Duties (the “Petition”) with the United States Department of Commerce (the “DOC”) and the United States International Trade Commission (the “ITC”) seeking the imposition of antidumping and countervailing duties on multilayered wood flooring imported from China. We, along with a number of entities involved in various aspects of the industry, are opposing the Petition. In December 2010, the ITC made a preliminary determination that there is a reasonable indication that imports of multilayered wood flooring from China have caused injury to the domestic suppliers. As a result, the DOC continues to conduct its countervailing and antidumping duty investigations, with preliminary duty determinations currently expected in March 2011. Although the scope of products that may be subject to the countervailing and antidumping duties has yet to be determined, approximately 7% – 9% of our net sales in 2010 were products manufactured in China that may fall within the scope proposed by the conglomeration. Our suppliers of multilayered wood flooring have been actively participating in the ITC and DOC proceedings. The preliminary duty determinations are expected in March. At the time of the preliminary determinations, importers of multilayered wood
28
Table of Contents
flooring from China will be required to pay the applicable duty into escrow pending final determinations by the ITC. Until the time of the ITC’s final determinations, which are expected later this year, the DOC may make adjustments to its preliminary duty calculations. See “Item 1A. Risk Factors—Risks Related to Our Business and Industry.”
Results of Operations
The following tables set forth components of our results of operations for the periods indicated, both in dollars and as a percentage of net sales.
| Year Ended December 31, | ||||||||||||
| 2010 | 2009 | 2008 | ||||||||||
| (in millions, except percentages and number of stores) |
||||||||||||
| Net sales |
$ | 620.3 | $ | 544.6 | $ | 482.2 | ||||||
| Comparable store net sales increase |
2.1 | % | 0.0 | % | 1.6 | % | ||||||
| Number of stores opened in period |
37 | 36 | 34 | |||||||||
| Cost of sales |
404.5 | 349.9 | 314.5 | |||||||||
| Gross profit |
215.8 | 194.7 | 167.7 | |||||||||
| SG&A expenses |
173.7 | 151.1 | 130.7 | |||||||||
| Operating income |
42.2 | 43.6 | 37.0 | |||||||||
| Net income |
26.3 | 26.9 | 22.1 | |||||||||
| Year Ended December 31, | ||||||||||||
| 2010 | 2009 | 2008 | ||||||||||
| (% of net sales) | ||||||||||||
| Net sales |
100.0 | % | 100.0 | % | 100.0 | % | ||||||
| Cost of sales |
65.2 | % | 64.3 | % | 65.2 | % | ||||||
| Gross profit |
34.8 | % | 35.7 | % | 34.8 | % | ||||||
| SG&A expenses |
28.0 | % | 27.7 | % | 27.1 | % | ||||||
| Operating income |
6.8 | % | 8.0 | % | 7.7 | % | ||||||
| Net income |
4.2 | % | 4.9 | % | 4.6 | % | ||||||
Year Ended December 31, 2010 Compared to Year Ended December 31, 2009
Net Sales.
| For the year
ended December 31, |
||||||||
| 2010 | 2009 | |||||||
| (dollars in thousands) | ||||||||
| Net sales |
$ | 620,281 | $ | 544,568 | ||||
| Comparable store net sales increase |
2.1 | % | 0.0 | % | ||||
Net sales for 2010 increased $75.7 million, or 13.9%, over 2009 due to an increase of $64.2 million in non-comparable store net sales and an $11.5 million increase in comparable store net sales. Net sales were impacted by the following:
| • | The loss of productivity following our SAP implementation weakened net sales at comparable stores in the second half of 2010. As a result, we reversed a trend in quarterly net sales, which had gradually strengthened each quarter since the beginning of 2009. In the first six months 2010, our net sales in comparable stores increased 6.7% compared to the six months ended June 30, 2009. In contrast, when comparing the third and fourth quarters of 2010 to the same six months in 2009, our net sales at comparable stores decreased 2.3%. On a quarterly basis, net sales at comparable stores decreased 5.7% in comparing the third quarters of 2010 and 2009, and increased 1.2% when comparing the fourth quarters of 2010 and 2009. |
| • | Net sales for 2010 benefited from an increase in the number of customers invoiced in our comparable stores. We believe the increases in the number of customers invoiced resulted from strengthening consumer demand for our expanded assortment of products, and the incremental traffic generated by certain promotional pricing. As discussed above, the loss of productivity following the SAP implementation significantly impacted the number of |
29
Table of Contents
| 2010 customers invoiced compared to 2009. The number of customers invoiced at our comparable stores in the first half of 2010 increased 13.1% compared to the first half of 2009. However, in comparing the second half of the years, the number of customers invoiced decreased 3.6% from 2009 to 2010. Our monthly comparisons of customers invoiced in comparable stores were negative from August through November and returned positive in December, where 2010 increased 1.8% over 2009. |
| • | Our average sale in 2010 declined in comparison to 2009. We believe the decrease in our average sale for the full year is a result of consumer demand shifting our mix of products sold, or sales mix, to certain key product lines which generally have a lower than average retail price per unit. We believe we have grown our market share in these product lines. However, the average sale increased each quarter in 2010, from a low of $1,440 in the first quarter to $1,560 in the fourth quarter. In 2009, the average sale had fallen each quarter, from $1,600 in the first quarter to $1,510 in the fourth quarter. The fourth quarter comparison of $1,560 in 2010 to $1,510 in 2009 represented the first year-over-year increase since the second quarter of 2008. The gradual strengthening of our average sale in 2010 is also a result of changes in our sales mix, including demand for our hardwood products. |
| • | Net sales benefited from more consistent in-stock positions of certain key product lines, including product lines customers expect to be in-stock at a store location, such as laminates, moldings and accessories. Our sales mix of moldings and accessories increased to 13.7% of total net sales in 2010, from 12.7% in 2009. These benefits were partially offset by full year decreases in certain hardwood product lines. |
| • | Comparable store net sales benefited from the continued maturation of stores in operation for 13 to 36 months at December 31, 2010, where net sales increased 12.1%. Net sales at these comparable stores generally increase faster than at our stores in operation for more than 36 months, which decreased 0.4% in 2010. We believe our stores in operation for more than 36 months are more likely to be adversely impacted by the opening of non-comparable stores in an existing market. Excluding the net sales of markets which include a non-comparable store and at least one comparable store older than 36 months, net sales at these more mature stores increased 3.1%. |
Gross Profit and Gross Margin.
| For the year
ended December 31, |
||||||||
| 2010 | 2009 | |||||||
| (dollars in thousands) | ||||||||
| Net Sales |
$ | 620,281 | $ | 544,568 | ||||
| Cost of Sales |
404,451 | 349,891 | ||||||
| Gross Profit |
$ | 215,830 | $ | 194,677 | ||||
| Gross Margin |
34.8 | % | 35.7 | % | ||||
Gross profit in 2010 increased $21.2 million, or 10.9%, to $215.8 million in 2010 from $194.7 million in 2009. Gross margin decreased 95 basis points in 2010 as compared to 2009. This decrease was primarily due increased product costs resulting primarily from the following:
| • | Our loss of productivity subsequent to the SAP system implementation resulted in less efficient unit flow, including expedited transportation, and reduced gross margin by approximately 10 to 12 basis points. |
| • | Transportation costs of moving our products from our warehouse in Toano to the store locations, between store locations, and to the customer from our store locations are charged to cost of sales as incurred. These costs increased due to both a per mile increase, primarily due to increases in fuel surcharges, and an increase in the number of miles driven, primarily due to a greater number of units shipped. The increase in units shipped primarily resulted from a combination of our increase in sales volume, including the sales mix shift to a lower average retail price, and generally higher in-store average inventory levels. |
| • | Inbound transportation costs capitalized into the unit cost of products sold were generally higher in 2010 than in 2009. International container rates reached a low point against our historic norm in the second half of 2009, rose to a peak well above our historic norm in the summer of 2010 and fell back to approximate our historic norm thereafter. |
Partially offsetting these transportation cost increases were increased direct shipments received by our stores, either through our China consolidation center or direct from the mill to the store. In 2010, 19.1% of our unit purchases
30
Table of Contents
were received directly at the store, up from 16.4% in 2009. In the second half of 2010, these direct shipments represented 23.8% of our unit purchases, up from 14.7% in the second half of 2009.
| • | Our efforts to expand and regionalize our assortment of Bellawood products resulted in 2010 per unit finishing costs generally higher than those in 2009, primarily due to greater demand for products which are less efficient to finish. |
In aggregate, sales mix shifts were neutral to gross margin, including:
| • | Gross margin benefited from our continued efforts to broaden the assortment and strengthen the in-stock positions of moldings and accessories, as well as laminates and certain engineered hardwoods, particularly the premium products. These product lines generally carry a higher than average gross margin. |
| • | Gross margin was adversely impacted by a strengthening in consumer demand for certain hardwoods, particularly those at the entry level, which generally carry higher than average retail price points, but lower than average gross margins. |
| • | Liquidation deals, used as promotional opportunities to generate incremental traffic, have generally yielded lower gross margins in 2010 than in 2009, and in each year, those gross margins have been lower than average. |
Operating Income and Operating Margin.
| For the year
ended December 31, |
||||||||
| 2010 | 2009 | |||||||
| (dollars in thousands) | ||||||||
| Gross Profit |
$ | 215,830 | $ | 194,677 | ||||
| SG&A Expenses |
173,667 | 151,070 | ||||||
| Operating Income |
$ | 42,163 | $ | 43,607 | ||||
| Operating Margin |
6.8 | % | 8.0 | % | ||||
Operating income for 2010 decreased $1.4 million, or 3.3%, over 2009 as the $21.2 million increase in gross profit was offset by a $22.6 million increase in SG&A expenses. The increase in SG&A expenses was principally due to the following factors:
| • | Approximately $0.9 million in incremental expenses related to the SAP system implementation. |
| • | Salaries, commissions and benefits increased $10.7 million in 2010 from the prior year, and as a percentage of net sales, were 11.2% of net sales for 2010 and 10.8% of net sales for 2009. These increases were primarily due to: |
| ¡ | Growth in our store base, a greater commitment to in-store management and staffing at certain smaller stores, as well as an expanded store training program; |
| ¡ | Labor costs for our distribution, warehousing and finishing functions due primarily to increased sales volume and higher in-stock positions of merchandise inventories; and |
| ¡ | Expanded corporate store-support infrastructure, partially offset by a significant reduction in accrued executive bonuses. |
| • | Advertising expenses increased $2.5 million from 2009 to $49.8 million in 2010, but as a percentage of net sales, declined to 8.0% for 2010, from 8.7% for 2009. National advertising campaigns were leveraged across a larger store base in comparing 2010 to 2009, and in general, both national advertising and direct sales generation programs benefited from lower unit prices. We continue to believe the overall effectiveness of our advertising spend improved through increases in direct mail, television and internet search. |
| • | Occupancy costs increased to $22.2 million, or 3.6% of net sales for 2010, from $18.4 million, or 3.4% of net sales for 2009. The increase was primarily due to our store base expansion, partially offset by leverage at comparable stores. |
| • | Depreciation and amortization increased $0.9 million but remained a constant 0.9% of net sales. Depreciation on the new SAP system began in August 2010. |
31
Table of Contents
| • | Stock-based compensation expense related to the grant of stock options and restricted shares to employees and directors was $3.1 million in 2010 and $3.0 million in 2009. As a percentage of net sales, stock-based compensation expense remained constant at 0.5%. |
| • | Certain other expenses, including legal and professional fees, increased $4.5 million in 2010 and as a percentage of net sales increased to 3.8% compared to 3.5% in 2009. The increase was primarily due to higher information technology expenses subsequent to the SAP implementation, store-base growth and certain bankcard discount rate fees that increased due to greater consumer preference for certain extended-term promotional programs. |
Provision for Income Taxes.
| For the year
ended December 31, |
||||||||
| 2010 | 2009 | |||||||
| (dollars in thousands) | ||||||||
| Provision for Income Taxes |
$ | 16,476 | $ | 17,181 | ||||
| Effective Tax Rate |
38.5 | % | 39.0 | % | ||||
The effective tax rate reduction in 2010 is primarily due to reductions in tax-exempt interest income, state income taxes and excess tax benefits on stock option exercises.
Net Income.
| For the year
ended December 31, |
||||||||
| 2010 | 2009 | |||||||
| (dollars in thousands) | ||||||||
| Net Income |
$ | 26,266 | $ | 26,924 | ||||
| As a percentage of net sales |
4.2 | % | 4.9 | % | ||||
Net income decreased 2.4% for the year ended December 31, 2010 in comparison to the year ended December 31, 2009.
Year Ended December 31, 2009 Compared to Year Ended December 31, 2008
Net Sales.
| For the year
ended December 31, |
||||||||
| 2009 | 2008 | |||||||
| (dollars in thousands) | ||||||||
| Net sales |
$ | 544,568 | $ | 482,179 | ||||
| Comparable store net sales increase |
0.0 | % | 1.6 | % | ||||
Net sales for 2009 increased $62.4 million, or 12.9%, over 2008 due to an increase of $62.6 million in non-comparable store net sales offset by a $0.2 million decrease in comparable store net sales. Net sales increased due principally to the following factors:
| • | Net sales benefited from more consistent in-stock positions of certain key product lines, including product lines customers expect to be in-stock at a store location, such as laminates, moldings and accessories. Our sales mix of moldings and accessories increased to 12.7% of total net sales in 2009, from 11.0% in 2008. These benefits were partially offset by decreased net sales in certain hardwood product lines, including Bellawood, engineered and unfinished. |
| • | Comparable store net sales benefited from the continued maturation of stores in operation for 13 to 36 months at December 31, 2009, where net sales increased 15.7%. Net sales at these comparable stores generally increase faster than at our stores in operation for more than 36 months, which decreased 3.9%. We believe our stores in operation for more than 36 months are more likely to be adversely impacted by the opening of non-comparable stores in an |
32
Table of Contents
| existing market. Excluding the net sales of markets which include a non-comparable store and at least one comparable store older than 36 months, net sales at these more mature stores increased 0.6%. |
Gross Profit and Gross Margin.
| For the year
ended December 31, |
||||||||
| 2009 | 2008 | |||||||
| (dollars in thousands) | ||||||||
| Net Sales |
$ | 544,568 | $ | 482,179 | ||||
| Cost of Sales |
349,891 | 314,501 | ||||||
| Gross Profit |
$ | 194,677 | $ | 167,678 | ||||
| Gross Margin |
35.7 | % | 34.8 | % | ||||
Gross profit in 2009 increased $27.0 million, or 16.1%, to $194.7 million in 2009 from $167.7 million in 2008. Gross margin improved 90 basis points in 2009 as compared to 2008 primarily due to the following:
| • | We continued our investment in infrastructure initiatives within key functional areas impacting our product assortment, product flow and commitment to in-stock positions, including product planning, allocation and logistics. As a result, we believe this drove certain sales mix changes, shortened the distance the product travels between the vendor-mill and the final sales floor, and reduced the cost of our products and the related transportation. |
| • | Our efforts to broaden our assortment of moldings and accessories while remaining committed to an available in-stock position increased the sales mix of this key product line, which generally carries gross margins higher than our average. |
| • | In addition to our efforts to drive sales mix increases in certain key product lines and the premium products within those product lines, we believe the weakness in the macroeconomic environment throughout 2009 also resulted in a shift away from certain hardwood product lines that generally carry higher than average retail prices per unit sold, but slightly lower than average gross margins. |
| • | Together with our logistics initiatives to reduce both domestic and international transportation costs, gross margin in the second half of 2009 benefited from favorable international container rates in comparison to the rates impacting 2008. We believe lower international container rates in the second half of 2009 in comparison to our historic average container rates resulted in up to 60 basis points of gross margin benefit in the third and fourth quarters. |
| • | Our gross margin in 2008 included the net impact of certain special liquidation deals and the retroactive rebate of a bamboo tariff. In 2008, those special liquidation deals, unique in their unit count, quality and cost, added approximately 20 basis points to gross margin in 2008. Gross margin for 2008 also benefited from the retroactive rebate by approximately 20 basis points. |
Operating Income and Operating Margin.
| For the year
ended December 31, |
||||||||
| 2009 | 2008 | |||||||
| (dollars in thousands) | ||||||||
| Gross Profit |
$ | 194,677 | $ | 167,678 | ||||
| SG&A Expenses |
151,070 | 130,693 | ||||||
| Operating Income |
$ | 43,607 | $ | 36,985 | ||||
| Operating Margin |
8.0 | % | 7.7 | % | ||||
33
Table of Contents
Operating income for 2009 increased $6.6 million, or 17.9%, over 2008 as the $27.0 million increase in gross profit was partially offset by a $20.4 million increase in SG&A expenses. SG&A expenses in 2008 were reduced by $2.96 million in the fourth quarter 2008 as a reserve related to the final accounting for the Variable Plan was reversed, lowering stock-based compensation expense. Increases in SG&A expenses were principally due to the following factors:
| • | Salaries, commissions and benefits increased $10.3 million for 2009 from the prior year, and as a percentage of net sales, were 10.8% of net sales for 2009 and 10.1% of net sales for 2008. These increases were primarily due to the growth in our store base, but also included increased employee benefit costs, continued investment in store support infrastructure and generally higher incentive bonuses. |
| • | Advertising expenses increased $1.5 million from 2008 to $47.3 million in 2009, but as a percentage of net sales, declined to 8.7% for 2009, from 9.5% for 2008. Our national advertising campaigns were leveraged across a larger store base in comparing 2009 to 2008, and in general, both national advertising and direct sales generation programs benefited from lower unit prices in 2009. We believe the effectiveness of our advertising spend was improved through increases in direct mail, internet search and promotional television. |
| • | Occupancy costs increased $3.3 million to $18.4 million, or 3.4% of net sales for 2009, from $15.1 million, or 3.1% of net sales for 2008. Overall, the increase was primarily due to the 36 new stores opened in 2009. |
| • | Depreciation and amortization increased $0.4 million but remained a constant 0.9% of net sales. |
| • | Stock-based compensation expense related to the grant of stock options and restricted shares to employees and directors was $3.0 million in both 2009 and 2008. Stock-based compensation expense in 2008 was reduced to $0.01 million by the benefit of a reserve reversal related to the final accounting for a certain equity plan. |
| • | Certain other expenses, including legal and professional fees, increased $1.9 million in 2009 and remained at a constant 3.5% of net sales. Legal and professional fees in 2009 included $1.4 million related to a trademark infringement action against a competitor that we initiated, litigated and eventually settled. In 2008, legal and professional fees related to the Variable Plan were approximately $0.7 million, net of insurance proceeds. |
Provision for Income Taxes.
| For the year
ended December 31, |
||||||||
| 2009 | 2008 | |||||||
| (dollars in thousands) | ||||||||
| Provision for Income Taxes |
$ | 17,181 | $ | 15,643 | ||||
| Effective Tax Rate |
39.0 | % | 41.4 | % | ||||
The effective tax rate decreased to 39.0% for 2009 primarily due to reductions in tax-exempt interest income, state income taxes and excess tax benefits on stock option exercises. The effective tax rate of 41.4% for 2008 included a first quarter charge of approximately $0.7 million for nondeductible deferred taxes related to the Variable Plan.
Net Income.
| For the year
ended December 31, |
||||||||
| 2009 | 2008 | |||||||
| (dollars in thousands) | ||||||||
| Net Income |
$ | 26,924 | $ | 22,149 | ||||
| As a percentage of net sales |
4.9 | % | 4.6 | % | ||||
Net income increased 21.6% for the year ended December 31, 2009 in comparison to the year ended December 31, 2008.
Liquidity and Capital Resources
Our principal liquidity requirements have been to meet our working capital and capital expenditure needs. Our principal sources of liquidity are $34.8 million of cash and cash equivalents at December 31, 2010, our cash flow from operations, and
34
Table of Contents
$25.0 million of availability under our revolving credit facility. We expect to use this liquidity for general corporate purposes, including providing additional long-term capital to support the growth of our business (primarily through opening new stores) and maintaining our existing stores. We believe that our cash flow from operations, together with our existing liquidity sources, will be sufficient to fund our operations and anticipated capital expenditures over at least the next 24 months.
In 2011, we expect capital expenditures to total between $16 million and $18 million. In addition to general capital requirements, we intend to:
| • | open between 40 and 50 new store locations; |
| • | continue to invest in our integrated technology solution; |
| • | continue to remodel existing store showrooms; |
| • | invest in our finishing line; and |
| • | continue to enhance the online customer experience through our website. |
Cash and Cash Equivalents
In 2010, cash and cash equivalents decreased $0.8 million to $34.8 million. The decrease in cash and cash equivalents was primarily due to the use of $20.5 million in capital expenditures, including software and hardware related to our integrated technology solution, partially offset by $17.0 million in cash provided by operating activities and $2.7 million of proceeds received from stock option exercises. In 2009, cash and cash equivalents increased $0.5 million to $35.7 million, as $7.8 million of cash provided by operating activities and $4.1 million of proceeds received from stock option exercises, were partially offset by the use of $11.4 million to purchase property and equipment. During 2008, cash and cash equivalents increased $2.0 million to $35.1 million, as operating activities provided $9.4 million of cash, partially offset by the use of $6.6 million to purchase property and equipment and $0.8 million to purchase the phone number 1-800-HARDWOOD and related internet domain names.
Cash Flows
Operating Activities. Net cash provided by operating activities was $17.0 million for 2010, $7.8 million for 2009, and $9.4 million for 2008. The $9.2 million increase comparing 2010 to 2009 is due primarily to a lower build in merchandise inventories net of the change in accounts payable, the timing of certain tax items, and an increase in customer deposits outstanding, partially offset by net changes in certain other working capital items, including prepaid expenses. The $1.6 million decrease comparing 2009 to 2008 is due primarily to a larger build in inventory net of accounts payable, partially offset by more profitable operations.
Investing Activities. Net cash used in investing activities was $20.5 million for 2010, $11.4 million for 2009, and $7.4 million for 2008. Net cash used in investing activities included capital expenditures related to our integrated technology solution of $11.3 million in 2010 and $3.9 million in 2009. In addition, net cash used in investing activities in each year included capital purchases of store fixtures, equipment and leasehold improvements for the new stores and major remodeling of existing stores, investment in certain equipment including our finishing line and forklifts, routine capital purchases of computer hardware and software, and certain leasehold improvements in our Corporate Headquarters.
Financing Activities. Net cash provided by financing activities was $2.7 million and $4.2 million in 2010 and 2009, respectively, primarily due to equity activity, including the exercise of stock options. In 2008, the first full year following our November 2007 IPO, financing activities were cash neutral.
Revolving Credit Agreement
A revolving credit agreement (the “Revolver”) providing for borrowings up to $25.0 million is available to us through expiration on August 10, 2012. During 2010 and 2009, we did not borrow against the Revolver and at December 31, 2010 and 2009, there were no outstanding commitments under letters of credit. The Revolver is primarily available to fund inventory purchases, including the support of up to $5.0 million for letters of credit, and for general operations. The Revolver is secured by our inventory, has no mandated payment provisions and we pay a fee of 0.125% per annum, subject to
35
Table of Contents
adjustment based on certain financial performance criteria, on any unused portion of the Revolver. Amounts outstanding under the Revolver would be subject to an interest rate of LIBOR (reset on the 10th of the month) plus 0.50%, subject to adjustment based on certain financial performance criteria. The Revolver has certain defined covenants and restrictions, including the maintenance of certain defined financial ratios. We were in compliance with these financial covenants at December 31, 2010.
Related Party Transactions
See the discussion of related party transactions in Note 5 and Note 10 to the consolidated financial statements included in Item 8 of this report and within Certain Relationships, Related Transactions and Director Independence in Item 13 of this report.
Contractual Commitments and Contingencies
Our significant contractual obligations and commitments as of December 31, 2010 are summarized in the following table:
| Payments Due by Period | ||||||||||||||||||||
| Total | Less Than 1 Year |
1 to 3 Years |
3 to 5 Years |
5+ Years | ||||||||||||||||
| (in thousands) | ||||||||||||||||||||
| Contractual obligations |
||||||||||||||||||||
| Operating lease obligations(1) |
$ | 71,402 | $ | 15,078 | $ | 24,982 | $ | 16,511 | $ | 14,831 | ||||||||||
| Total contractual obligations |
$ | 71,402 | $ | 15,078 | $ | 24,982 | $ | 16,511 | $ | 14,831 | ||||||||||
| (1) | Included in this table is the base period or current renewal period for our operating leases. The operating leases generally contain varying renewal provisions. |
Off-Balance Sheet Arrangements
We do not have any off-balance sheet arrangements or other financing activities with special-purpose entities.
Inflation
Inflationary factors such as increases in the cost of our product and overhead costs may adversely affect our operating results. Although we do not believe that inflation has had a material impact on our financial position or results of operations to date, a high rate of inflation in the future may have an adverse effect on our ability to maintain current levels of gross profit and selling, general and administrative expenses as a percentage of net sales if the selling prices of our products do not increase with these increased costs.
Critical Accounting Policies and Estimates
Critical accounting policies are those that we believe are both significant and that require us to make difficult, subjective or complex judgments, often because we need to estimate the effect of inherently uncertain matters. We base our estimates and judgments on historical experiences and various other factors that we believe to be appropriate under the circumstances. Actual results may differ from these estimates, and we might obtain different estimates if we used different assumptions or conditions. We believe the following critical accounting policies affect our more significant judgments and estimates used in the preparation of our financial statements:
Recognition of Net Sales
We recognize net sales for products purchased at the time the customer takes possession of the merchandise. We recognize service revenue, which consists primarily of freight charges for in-home delivery, when the service has been rendered. We report revenue net of sales and use taxes collected from customers and remitted to governmental taxing authorities. Net sales are reduced by an allowance for anticipated sales returns that we estimate based on historical sales
36
Table of Contents
trends and experience. Any reasonably likely changes that may occur in the assumptions underlying our allowance estimates would not be expected to have a material impact on our financial condition or operating performance. In addition, customers who do not take immediate delivery of their purchases are generally required to leave a deposit of up to 50% of the retail sales amount with the balance payable when the products are delivered. These customer deposits benefit our cash flow and return on investment capital, since we receive partial payment for our customers’ purchases immediately. We record these deposits as a liability on our balance sheet under the line item “Customer Deposits and Store Credits” until the customer takes possession of the merchandise.
Merchandise Inventories
We value our merchandise inventories at the lower of merchandise cost or market value. We determine merchandise cost using the average cost method. All of the hardwood flooring we purchase from suppliers is either prefinished or unfinished, and in immediate saleable form. To the extent that we finish and box unfinished products, we include those costs in the average unit cost of related merchandise inventory. In determining market value, we make judgments and estimates as to the market value of our products, based on factors such as historical results and current sales trends. Any reasonably likely changes that may occur in those assumptions in the future may require us to record charges for losses or obsolescence against these assets, but would not be expected to have a material impact on our financial condition or operating performance.
Stock-Based Compensation
We currently maintain a single equity incentive plan under which we may grant non-qualified stock options, incentive stock options and restricted shares to employees and non-employee directors. We recognize expense for our stock-based compensation based on the fair value of the awards that are granted. Measured compensation cost is recognized ratably over the service period of the related stock-based compensation award.
The fair value of stock options was estimated at the date of grant using the Black-Scholes-Merton valuation model. In order to determine the related stock-based compensation expense, we used the following assumptions for stock options granted during 2010:
| • | Expected life of 3.5 to 7.5 years; |
| • | Expected stock price volatility of 45%; |
| • | Risk-free interest rates from 1.9% to 3.2%; and |
| • | Dividends are not expected to be paid in any year. |
The expected stock price volatility range is based on the historical volatilities of companies included in a peer group that was selected by management whose shares or options are publicly available. The volatilities are estimated for a period of time equal to the expected life of the related option. The risk-free interest rate is based on the implied yield of U.S. Treasury zero-coupon issues with an equivalent remaining term. The expected term of the options represents the estimated period of time until exercise and is determined by considering the contractual terms, vesting schedule and expectations of future employee behavior. Had we arrived at different assumptions of stock price volatility or expected lives of our options, our stock-based compensation expense and result of operations could have been different.
Item 7A. Quantitative and Qualitative Disclosures About Market Risk.
Interest Rates.
We are exposed to interest rate risk through the investment of our cash and cash equivalents. We invest our cash in short-term investments with maturities of three months or less. Changes in interest rates affect the interest income we earn, and therefore impact our cash flows and results of operations. In addition, any future borrowings under our revolving credit agreement would be exposed to interest rate risk due to the variable rate of the facility.
We currently do not engage in any interest rate hedging activity and currently have no intention to do so in the foreseeable future. However, in the future, in an effort to mitigate losses associated with these risks, we may at times enter into derivative financial instruments, although we have not historically done so. We do not, and do not intend to, engage in the practice of trading derivative securities for profit.
37
Table of Contents
Item 8. Consolidated Financial Statements and Supplementary Data.
38
Table of Contents
Report of Ernst & Young LLP, Independent Registered Public Accounting Firm
The Board of Directors and Stockholders of Lumber Liquidators Holdings, Inc.
We have audited the accompanying consolidated balance sheets of Lumber Liquidators Holdings, Inc. as of December 31, 2010 and 2009, and the related consolidated statements of income, stockholders’ equity, and cash flows for each of the three years in the period ended December 31, 2010. These financial statements are the responsibility of the Company’s management. Our responsibility is to express an opinion on these financial statements based on our audits.
We conducted our audits in accordance with the standards of the Public Company Accounting Oversight Board (United States). Those standards require that we plan and perform the audit to obtain reasonable assurance about whether the financial statements are free of material misstatement. An audit includes examining, on a test basis, evidence supporting the amounts and disclosures in the financial statements. An audit also includes assessing the accounting principles used and significant estimates made by management, as well as evaluating the overall financial statement presentation. We believe that our audits provide a reasonable basis for our opinion.
In our opinion, the financial statements referred to above present fairly, in all material respects, the consolidated financial position of Lumber Liquidators Holdings, Inc. at December 31, 2010 and 2009, and the consolidated results of its operations and its cash flows for each of the three years in the period ended December 31, 2010, in conformity with U.S. generally accepted accounting principles.
We also have audited, in accordance with the standards of the Public Company Accounting Oversight Board (United States), Lumber Liquidators Holdings, Inc.’s internal control over financial reporting as of December 31, 2010, based on criteria established in Internal Control—Integrated Framework issued by the Committee of Sponsoring Organizations of the Treadway Commission and our report dated February 23, 2011 expressed an unqualified opinion thereon.
/s/ Ernst & Young LLP
Richmond, Virginia
February 23, 2011
39
Table of Contents
Report of Ernst & Young LLP, Independent Registered Public Accounting Firm, on
Internal Control over Financial Reporting
The Board of Directors and Stockholders of Lumber Liquidators Holdings, Inc.
We have audited Lumber Liquidators Holdings, Inc.’s internal control over financial reporting as of December 31, 2010, based on criteria established in Internal Control—Integrated Framework issued by the Committee of Sponsoring Organizations of the Treadway Commission (the COSO criteria). Lumber Liquidators Holdings, Inc.’s management is responsible for maintaining effective internal control over financial reporting, and for its assessment of the effectiveness of internal control over financial reporting included in the accompanying Management’s Annual Report on Internal Control over Financial Reporting. Our responsibility is to express an opinion on the company’s internal control over financial reporting based on our audit.
We conducted our audit in accordance with the standards of the Public Company Accounting Oversight Board (United States). Those standards require that we plan and perform the audit to obtain reasonable assurance about whether effective internal control over financial reporting was maintained in all material respects. Our audit included obtaining an understanding of internal control over financial reporting, assessing the risk that a material weakness exists, testing and evaluating the design and operating effectiveness of internal control based on the assessed risk, and performing such other procedures as we considered necessary in the circumstances. We believe that our audit provides a reasonable basis for our opinion.
A company’s internal control over financial reporting is a process designed to provide reasonable assurance regarding the reliability of financial reporting and the preparation of financial statements for external purposes in accordance with generally accepted accounting principles. A company’s internal control over financial reporting includes those policies and procedures that (1) pertain to the maintenance of records that, in reasonable detail, accurately and fairly reflect the transactions and dispositions of the assets of the company; (2) provide reasonable assurance that transactions are recorded as necessary to permit preparation of financial statements in accordance with generally accepted accounting principles, and that receipts and expenditures of the company are being made only in accordance with authorizations of management and directors of the company; and (3) provide reasonable assurance regarding prevention or timely detection of unauthorized acquisition, use or disposition of the company’s assets that could have a material effect on the financial statements.
Because of its inherent limitations, internal control over financial reporting may not prevent or detect misstatements. Also, projections of any evaluation of effectiveness to future periods are subject to the risk that controls may become inadequate because of changes in conditions, or that the degree of compliance with the policies or procedures may deteriorate.
In our opinion, Lumber Liquidators Holdings, Inc. maintained, in all material respects, effective internal control over financial reporting as of December 31, 2010, based on the COSO criteria.
We also have audited, in accordance with the standards of the Public Company Accounting Oversight Board (United States), the consolidated balance sheets of Lumber Liquidators Holdings, Inc. as of December 31, 2010 and 2009 and the related consolidated statements of income, stockholders’ equity and cash flows for each of the three years in the period ended December 31, 2010 and our report dated February 23, 2011 expressed an unqualified opinion thereon.
/s/ Ernst & Young LLP
Richmond, Virginia
February 23, 2011
40
Table of Contents
Lumber Liquidators Holdings, Inc.
Consolidated Balance Sheets
(in thousands, except share data)
| December 31, | ||||||||
| 2010 | 2009 | |||||||
| Assets |
||||||||
| Current Assets: |
||||||||
| Cash and Cash Equivalents |
$ | 34,830 | $ | 35,675 | ||||
| Merchandise Inventories |
155,131 | 133,342 | ||||||
| Prepaid Expenses |
4,837 | 5,988 | ||||||
| Other Current Assets |
8,007 | 4,356 | ||||||
| Total Current Assets |
202,805 | 179,361 | ||||||
| Property and Equipment, net |
35,314 | 20,491 | ||||||
| Deferred Income Taxes |
— | 2,002 | ||||||
| Other Assets |
4,171 | 4,026 | ||||||
| Total Assets |
$ | 242,290 | $ | 205,880 | ||||
| Liabilities and Stockholders’ Equity |
||||||||
| Current Liabilities: |
||||||||
| Accounts Payable |
$ | 33,744 | $ | 32,608 | ||||
| Customer Deposits and Store Credits |
12,039 | 9,805 | ||||||
| Accrued Compensation |
2,460 | 4,512 | ||||||
| Sales and Income Tax Liabilities |
2,859 | 2,770 | ||||||
| Other Current Liabilities |
5,585 | 5,566 | ||||||
| Total Current Liabilities |
56,687 | 55,261 | ||||||
| Deferred Rent |
2,746 | 2,185 | ||||||
| Deferred Tax Liability |
2,352 | — | ||||||
| Stockholders’ Equity: |
||||||||
| Common Stock ($0.001 par value; 35,000,000 authorized; 27,472,680 and 27,234,222 outstanding, respectively) |
27 | 27 | ||||||
| Additional Capital |
100,531 | 94,726 | ||||||
| Retained Earnings |
79,947 | 53,681 | ||||||
| Total Stockholders’ Equity |
180,505 | 148,434 | ||||||
| Total Liabilities and Stockholders’ Equity |
$ | 242,290 | $ | 205,880 | ||||
See accompanying notes to consolidated financial statements
41
Table of Contents
Lumber Liquidators Holdings, Inc.
Consolidated Statements of Income
(in thousands, except share data and per share amounts)
| Year Ended December 31, | ||||||||||||
| 2010 | 2009 | 2008 | ||||||||||
| Net Sales |
$ | 620,281 | $ | 544,568 | $ | 482,179 | ||||||
| Cost of Sales |
404,451 | 349,891 | 314,501 | |||||||||
| Gross Profit |
215,830 | 194,677 | 167,678 | |||||||||
| Selling, General and Administrative Expenses |
173,667 | 151,070 | 130,693 | |||||||||
| Operating Income |
42,163 | 43,607 | 36,985 | |||||||||
| Interest Expense |
— | 2 | 27 | |||||||||
| Other (Income) Expense |
(579 | ) | (500 | ) | (834 | ) | ||||||
| Income Before Income Taxes |
42,742 | 44,105 | 37,792 | |||||||||
| Provision for Income Taxes |
16,476 | 17,181 | 15,643 | |||||||||
| Net Income |
$ | 26,266 | $ | 26,924 | $ | 22,149 | ||||||
| Net Income per Common Share—Basic |
$ | 0.96 | $ | 1.00 | $ | 0.83 | ||||||
| Net Income per Common Share—Diluted |
$ | 0.93 | $ | 0.97 | $ | 0.82 | ||||||
| Weighted Average Common Shares Outstanding: |
||||||||||||
| Basic |
27,384,095 | 26,983,689 | 26,772,288 | |||||||||
| Diluted |
28,246,453 | 27,684,547 | 27,090,593 | |||||||||
See accompanying notes to consolidated financial statements
42
Table of Contents
Lumber Liquidators Holdings, Inc.
Consolidated Statements of Stockholders’ Equity
(in thousands, except share data)
| Common Stock | ||||||||||||||||||||
| Shares | Par Value |
Additional Capital |
Retained Earnings |
Total Stockholders’ Equity |
||||||||||||||||
| Balance December 31, 2007 |
26,752,118 | $ | 27 | $ | 87,553 | $ | 4,608 | $ | 92,188 | |||||||||||
| Stock-Based Compensation Expense |
— | — | 9 | — | 9 | |||||||||||||||
| Exercise of Stock Options |
26,500 | — | 203 | — | 203 | |||||||||||||||
| Release of Restricted Stock |
34,184 | — | — | — | — | |||||||||||||||
| Common Stock Purchased Pursuant to Equity Compensation Plans |
(15,911 | ) | — | (152 | ) | — | (152 | ) | ||||||||||||
| Net Income |
— | — | — | 22,149 | 22,149 | |||||||||||||||
| Balance December 31, 2008 |
26,796,891 | $ | 27 | $ | 87,613 | $ | 26,757 | $ | 114,397 | |||||||||||
| Stock-Based Compensation Expense |
— | — | 2,955 | — | 2,955 | |||||||||||||||
| Exercise of Stock Options |
393,199 | — | 3,281 | — | 3,281 | |||||||||||||||
| Excess Tax Benefits on Stock Option Exercises |
— | — | 1,200 | — | 1,200 | |||||||||||||||
| Release of Restricted Stock |
58,063 | — | — | — | — | |||||||||||||||
| Common Stock Purchased Pursuant to Equity Compensation Plans |
(13,931 | ) | — | (323 | ) | — | (323 | ) | ||||||||||||
| Net Income |
— | — | — | 26,924 | 26,924 | |||||||||||||||
| Balance December 31, 2009 |
27,234,222 | $ | 27 | $ | 94,726 | $ | 53,681 | $ | 148,434 | |||||||||||
| Stock-Based Compensation Expense |
— | — | 3,091 | — | 3,091 | |||||||||||||||
| Exercise of Stock Options |
206,821 | — | 1,796 | — | 1,796 | |||||||||||||||
| Excess Tax Benefits on Stock Option Exercises |
— | — | 1,307 | — | 1,307 | |||||||||||||||
| Release of Restricted Stock |
48,245 | — | — | — | — | |||||||||||||||
| Common Stock Purchased Pursuant to Equity Compensation Plans |
(16,608 | ) | — | (389 | ) | — | (389 | ) | ||||||||||||
| Net Income |
— | — | — | 26,266 | 26,266 | |||||||||||||||
| Balance December 31, 2010 |
27,472,680 | $ | 27 | $ | 100,531 | $ | 79,947 | $ | 180,505 | |||||||||||
See accompanying notes to consolidated financial statements
43
Table of Contents
Lumber Liquidators Holdings, Inc.
Consolidated Statements of Cash Flows
(in thousands)
| Year Ended December 31, | ||||||||||||
| 2010 | 2009 | 2008 | ||||||||||
| Cash Flows from Operating Activities: |
||||||||||||
| Net Income |
$ | 26,266 | $ | 26,924 | $ | 22,149 | ||||||
| Adjustments to Reconcile Net Income to Net Cash Provided by Operating Activities: |
||||||||||||
| Depreciation and Amortization |
5,773 | 4,714 | 4,350 | |||||||||
| Deferred Income Taxes |
4,300 | (956 | ) | (486 | ) | |||||||
| Stock-Based Compensation Expense |
3,091 | 2,955 | 9 | |||||||||
| Other |
— | — | (40 | ) | ||||||||
| Changes in Operating Assets and Liabilities: |
||||||||||||
| Merchandise Inventories |
(21,789 | ) | (44,611 | ) | (16,707 | ) | ||||||
| Accounts Payable |
1,136 | 17,235 | (281 | ) | ||||||||
| Customer Deposits and Store Credits |
2,234 | (613 | ) | 809 | ||||||||
| Prepaid Expenses and Other Current Assets |
(3,548 | ) | (155 | ) | (504 | ) | ||||||
| Other Assets and Liabilities |
(487 | ) | 2,319 | 62 | ||||||||
| Net Cash Provided by Operating Activities |
16,976 | 7,812 | 9,361 | |||||||||
| Cash Flows from Investing Activities: |
||||||||||||
| Purchases of Property and Equipment |
(20,535 | ) | (11,433 | ) | (6,560 | ) | ||||||
| Purchase of 1-800-HARDWOOD |
— | — | (800 | ) | ||||||||
| Net Cash Used in Investing Activities |
(20,535 | ) | (11,433 | ) | (7,360 | ) | ||||||
| Cash Flows from Financing Activities: |
||||||||||||
| Proceeds from Exercise of Stock Options |
1,796 | 3,281 | 203 | |||||||||
| Excess Tax Benefits on Stock Option Exercises |
1,307 | 1,200 | 40 | |||||||||
| Common Stock Purchased Pursuant to Equity Compensation Plans |
(389 | ) | (323 | ) | (152 | ) | ||||||
| Repayments of Long-Term Debt and Capital Lease Obligations |
— | (1 | ) | (121 | ) | |||||||
| Net Cash Provided by (Used In) Financing Activities |
2,714 | 4,157 | (30 | ) | ||||||||
| Net (Decrease) Increase in Cash and Cash Equivalents |
(845 | ) | 536 | 1,971 | ||||||||
| Cash and Cash Equivalents, Beginning of Year |
35,675 | 35,139 | 33,168 | |||||||||
| Cash and Cash Equivalents, End of Year |
$ | 34,830 | $ | 35,675 | $ | 35,139 | ||||||
See accompanying notes to consolidated financial statements
44
Table of Contents
Lumber Liquidators Holdings, Inc.
Notes to Consolidated Financial Statements
(amounts in thousands, except share data and per share amounts)
| NOTE 1. | SUMMARY OF SIGNIFICANT ACCOUNTING POLICIES |
Nature of Business
Lumber Liquidators Holdings, Inc. (the “Company”) is a multi-channel specialty retailer of hardwood flooring, and hardwood flooring enhancements and accessories, operating as a single business segment. The Company offers an extensive assortment of exotic and domestic hardwood species, engineered hardwoods and laminates direct to the consumer. The Company also features the renewable flooring products, bamboo and cork, and provides a wide selection of flooring enhancements and accessories, including moldings, noise-reducing underlay and adhesives. These products are primarily sold under the Company’s private label brands, including the premium Bellawood brand floors. The Company sells primarily to homeowners or to contractors on behalf of homeowners through a network of 223 store locations in primary or secondary metropolitan areas in 46 states at December 31, 2010. In addition to the store locations, the Company’s products may be ordered, and customer questions/concerns addressed, through both the call center in Toano, Virginia, and the website, www.lumberliquidators.com. The Company finishes the majority of the Bellawood products on its finishing line in Toano, Virginia, which along with the call center, corporate offices, and distribution center, represent the “Corporate Headquarters.”
Organization and Basis of Financial Statement Presentation
The consolidated financial statements of the Company, a Delaware corporation, include the accounts of its wholly owned subsidiaries, including Lumber Liquidators, Inc. (“LLI”). All significant intercompany transactions have been eliminated in consolidation.
Use of Estimates
The preparation of financial statements in conformity with accounting principles generally accepted in the United States requires management to make estimates and assumptions that affect the amounts reported in the consolidated financial statements and accompanying notes. Actual results could differ from those estimates.
Cash and Cash Equivalents
The Company considers all highly liquid investments with a maturity date of three months or less when purchased to be cash equivalents. The Company had cash equivalents of $17,050 and $27,022 at December 31, 2010 and 2009, respectively. The Company accepts a range of debit and credit cards, and these transactions are generally transmitted to a bank for reimbursement within 24 hours. The payments due from the banks for these debit and credit card transactions are generally received, or settle, within 24 – 48 hours of the transmission date. The Company considers all debit and credit card transactions that settle in less than seven days to be cash and cash equivalents. Amounts due from the banks for these transactions classified as cash and cash equivalents totaled $4,196 and $3,227 at December 31, 2010 and 2009, respectively.
Credit Programs
Credit is offered to the Company’s customers through a proprietary credit card, the Lumber Liquidators credit card, underwritten by third party financial institutions and at no recourse to the Company. As part of the credit program with GE Money Bank (GE), the Company’s customers may use their Lumber Liquidators credit card to tender installation services provided by the Company’s installation partner, The Home Service Store, Inc. (“HSS”). These HSS installation transactions are not processed through the Company’s point of sales system and are not reflected in net sales. GE funds HSS directly for these transactions and HSS is responsible for all credits and program fees. If GE is not able to collect net credits or fees from HSS within 60 days, the Company has agreed to indemnify GE against any losses related to HSS credits or fees. There are no maximum potential future payments under the guarantee. The Company is able to seek recovery from HSS of any amounts paid on their behalf. The Company believes that the risk of significant loss from the guarantee of these obligations is remote.
Prior to October 2009, the primary underwriter of the Lumber Liquidators credit card was HSBC Bank (“HSBC”). The Company terminated this agreement effective December 31, 2009. As a result of the termination, the Company transferred
45
Table of Contents
Lumber Liquidators Holdings, Inc.
Notes to Consolidated Financial Statements—(Continued)
(amounts in thousands, except share data and per share amounts)
$1,500 of cash to HSBC as prepayment for certain fees, returns or other net credits. In December 2010, HSBC refunded $350 to the Company. The Company has included $700 and $500 of the remaining amount in other assets at December 31, 2010 and 2009, respectively, and $70 and $1,000 of the remaining amount in prepaid expenses at December 31, 2010 and 2009, respectively.
A credit line is offered to the Company’s professional customers through the Lumber Liquidators Commercial Credit Program. This commercial credit program is underwritten by a third party financial institution, generally with no recourse to the Company.
Fair Value of Financial Instruments
The carrying amounts of financial instruments such as cash and cash equivalents, notes receivable, accounts payable and other liabilities approximate fair value because of the short-term nature of these items. Of these financial instruments, the cash equivalents are classified as Level 1 as defined in the Financial Accounting Standards Board (“FASB”) ASC 820 fair value hierarchy.
Merchandise Inventories
The Company values merchandise inventories at the lower of cost or market value. Merchandise cost is determined using the average cost method. All of the hardwood flooring purchased from vendors is either prefinished or unfinished, and in immediate saleable form. The Company adds the finish to, and boxes, various species of unfinished product, to produce certain proprietary products, primarily Bellawood, at its finishing facility. These finishing and boxing costs are included in the average unit cost of related merchandise inventory. The Company maintains an inventory reserve for loss or obsolescence, based on historical results and current sales trends. This reserve was $450 and $602 at December 31, 2010 and 2009, respectively.
Impairment of Long-Lived Assets
The Company evaluates potential impairment losses on long-lived assets used in operations when events and circumstances indicate that the assets may be impaired, and the undiscounted cash flows estimated to be generated by those assets are less than the carrying amounts of those assets. If impairment exists and the undiscounted cash flows estimated to be generated by those assets are less than the carrying amount of those assets, an impairment loss is recorded based on the difference between the carrying value and fair value of the assets. No impairment charges were recognized in 2010, 2009, or 2008.
Goodwill and Other Indefinite-Lived Intangibles
Other assets include $1,050 of goodwill and $800 for an indefinite-lived intangible asset for the phone number 1-800-HARDWOOD and related internet domain names. The Company evaluates these assets for impairment on an annual basis, or whenever events or changes in circumstance indicate that the asset carrying value exceeds its fair value. Based on the analysis performed, the Company has concluded that no impairment in the value of these assets has occurred.
Self Insurance
The Company is self-insured for certain employee health benefit claims. The Company estimates a liability for aggregate losses below stop-loss coverage limits based on estimates of the ultimate costs to be incurred to settle known claims and claims not reported as of the balance sheet date. The estimated liability is not discounted and is based on a number of assumptions and factors including historical trends, actuarial assumptions and economic conditions. This liability could be affected if future occurrences and claims differ from these assumptions and historical trends. As of December 31,
46
Table of Contents
Lumber Liquidators Holdings, Inc.
Notes to Consolidated Financial Statements—(Continued)
(amounts in thousands, except share data and per share amounts)
2010 and 2009, an accrual of $446 and $520 related to estimated claims was included in other current liabilities, respectively.
Recognition of Net Sales
The Company recognizes net sales for products purchased at the time the customer takes possession of the merchandise. Service revenue, primarily freight charges for in-home delivery, is recognized when the service has been rendered. The Company reports revenue net of sales and use taxes collected from customers and remitted to governmental taxing authorities. Net sales are reduced by an allowance for anticipated sales returns based on historical and current sales trends and experience. The sales returns allowance and related changes were not significant for 2010, 2009, or 2008.
The Company generally requires customers to pay a deposit, equal to approximately 50% of the retail sales value, when purchasing merchandise inventories not regularly carried in a given store location, or not currently in stock. These deposits are included in customer deposits and store credits until the customer takes possession of the merchandise.
Cost of Sales
Cost of sales includes the actual cost of the merchandise sold, the transportation costs from vendor to the Company’s distribution center or store location, any applicable finishing costs related to production of the Company’s proprietary brands, the transportation costs from the distribution center to the store locations, any inventory adjustments, including shrinkage, and the costs to produce samples.
The Company includes transportation costs for the delivery of products directly from stores to customers in cost of sales if delivered by third parties or in selling, general and administrative expenses (“SG&A”) if delivered by the Company’s delivery fleet. Costs related to the Company’s delivery fleet, which include delivery salaries, maintenance and depreciation, totaled approximately $115 in 2010, $577 in 2009, and $1,077 in 2008.
The Company offers a range of prefinished products with warranties on the durability of the finish ranging from 10 to 50 years. Warranty reserves are based primarily on claims experience, sales history and other considerations, and warranty costs are recorded in cost of sales. Warranty costs and changes to the warranty reserve were not significant for 2010, 2009, or 2008.
Advertising Costs
Advertising costs charged to SG&A were $49,797, $47,305, and $45,762 in 2010, 2009, and 2008, respectively. The Company uses various types of media to brand its name and advertise its products. Media production costs are generally expensed as incurred, except for direct mail, which is expensed when the finished piece enters the postal system. Media placement costs are generally expensed in the month the advertising occurs, except for contracted endorsements and sports agreements, which are generally expensed ratably over the contract period. Amounts paid in advance are included in prepaid expenses and totaled $1,227 and $2,401 at December 31, 2010 and 2009, respectively.
Store Opening Costs
Costs to open new store locations are charged to SG&A as incurred.
Depreciation and Amortization
Property and equipment is carried at cost and depreciated on the straight-line method over the estimated useful lives or lease terms of the related assets. The estimated useful lives for leasehold improvements are the shorter of the estimated useful lives or the remainder of the lease terms. For leases with optional renewal periods, the Company uses the original lease term, excluding optional renewal periods, to determine the appropriate estimated useful lives. Capitalized software costs, including
47
Table of Contents
Lumber Liquidators Holdings, Inc.
Notes to Consolidated Financial Statements—(Continued)
(amounts in thousands, except share data and per share amounts)
those related to the Company’s integrated information technology solution, are capitalized from the time that technological feasibility is established until the software is ready for use. The estimated useful lives are generally as follows:
| Years | ||
| Property and Equipment |
5 to 7 | |
| Computer Software and Hardware |
3 to 10 | |
| Leasehold Improvements |
1 to 15 |
Operating Leases
The Company has operating leases for its stores, Corporate Headquarters, supplemental distribution facilities and certain equipment. The lease agreements for certain stores contain rent escalation clauses and rent holidays. For scheduled rent escalation clauses during the lease terms or for rental payments commencing at a date other than the date of initial occupancy, the Company records minimum rental expenses in SG&A on a straight-line basis over the terms of the leases. The difference between the rental expense and rent paid is recorded as deferred rent in the consolidated balance sheets.
Stock-Based Compensation
The Company records compensation expense associated with stock options and other forms of equity compensation in accordance with FASB ASC 718. The Company issues incentive awards in the form of stock options and restricted stock awards to employees and non-employee directors. The Company recognizes expense for its stock-based compensation based on the fair value of the awards that are granted. Measured compensation cost is recognized ratably over the requisite service period of the related stock-based compensation award.
Income Taxes
Income taxes are accounted for in accordance with FASB ASC 740 (“ASC 740”). Income taxes are provided for under the asset and liability method and consider differences between the tax and financial accounting bases. The tax effects of these differences are reflected on the balance sheet as deferred income taxes and valued using the effective tax rate expected to be in effect when the differences reverse. ASC 740 also requires that deferred tax assets be reduced by a valuation allowance if it is more likely than not that some portion of the deferred tax asset will not be realized. In evaluating the need for a valuation allowance, the Company took into account various factors, including the expected level of future taxable income. If actual results differ from the assumptions made in the evaluation of the valuation allowance, a change in the valuation allowance will be recorded through income tax expense in the period such determination is made.
The Company classifies interest and penalties related to income tax matters as a component of income tax expense.
Net Income per Common Share
Basic net income per common share is determined by dividing net income by the weighted average number of common shares outstanding during the year. Diluted net income per common share is determined by dividing net income by the weighted average number of common shares outstanding during the year, plus the dilutive effect of common stock equivalents, including stock options and restricted stock awards. Common stock and common stock equivalents included in the computation represent shares issuable upon assumed exercise of outstanding stock options, release of restricted stock and conversion of redeemable preferred stock, except when the effect of their inclusion would be antidilutive.
| NOTE 2. | NOTES RECEIVABLE |
As of December 31, 2010, notes receivable from a merchandise vendor had an outstanding balance due to the Company of $867, of which $322 had been included in other current assets. As of December 31, 2009, the outstanding balance due to the Company was $994, of which $315 had been included in other current assets.
48
Table of Contents
Lumber Liquidators Holdings, Inc.
Notes to Consolidated Financial Statements—(Continued)
(amounts in thousands, except share data and per share amounts)
| NOTE 3. | PROPERTY AND EQUIPMENT |
Property and equipment consisted of:
| December 31, | ||||||||
| 2010 | 2009 | |||||||
| Property and Equipment |
$ | 25,314 | $ | 21,393 | ||||
| Computer Software and Hardware |
23,838 | 11,330 | ||||||
| Leasehold Improvements |
9,092 | 6,005 | ||||||
| 58,244 | 38,728 | |||||||
| Less: Accumulated Depreciation and Amortization |
22,930 | 18,237 | ||||||
| Property and Equipment, net |
$ | 35,314 | $ | 20,491 | ||||
Computer software and hardware costs capitalized of $15,225 and $3,897 relates to the Company’s integrated information technology solution as of December 31, 2010 and 2009, respectively. The Company began amortizing these assets in August 2010, and approximately $500 was recorded as amortization expense at December 31, 2010.
| NOTE 4. | REVOLVING CREDIT AGREEMENT |
A revolving credit agreement (the “Revolver”) providing for borrowings up to $25,000 is available to LLI through expiration on August 10, 2012. During 2010 and 2009, LLI did not borrow against the Revolver and at December 31, 2010 and 2009, there were no outstanding commitments under letters of credit. The Revolver is primarily available to fund inventory purchases, including the support of up to $5,000 for letters of credit, and for general operations. The Revolver is secured by LLI’s inventory, has no mandated payment provisions and a fee of 0.125% per annum, subject to adjustment based on certain financial performance criteria, on any unused portion of the Revolver. Amounts outstanding under the Revolver would be subject to an interest rate of LIBOR (reset on the 10th of the month) plus 0.50%, subject to adjustment based on certain financial performance criteria. The Revolver has certain defined covenants and restrictions, including the maintenance of certain defined financial ratios. LLI was in compliance with these financial covenants at December 31, 2010.
Interest payments on capital leases totaled $0, $2, and $4 in 2010, 2009, and 2008, respectively.
| NOTE 5. | LEASES |
The Company has operating leases for its stores, Corporate Headquarters, supplemental distribution facilities and certain equipment. The store location leases are operating leases and generally have five-year base periods with one or more five-year renewal periods.
The Company’s founder is the sole owner of ANO LLC and Wood on Wood Road, Inc., and he has a 50% membership interest in BMT Holdings, LLC (collectively, “ANO and Related Companies”). As of December 31, 2010, 2009 and 2008 the Company leased 27, 25 and 26 of its locations from ANO and Related Companies representing 12.1%, 13.4% and 17.3% of the total number of store leases in operation, respectively. In addition, the Company leases the Corporate Headquarters from ANO LLC under an operating lease with a base term running through December 31, 2019.
Rental expense for 2010, 2009, and 2008 was $13,784, $11,464, and $9,276, respectively, with rental expense attributable to ANO and Related Companies of $2,635, $2,531, and $2,505, respectively.
49
Table of Contents
Lumber Liquidators Holdings, Inc.
Notes to Consolidated Financial Statements—(Continued)
(amounts in thousands, except share data and per share amounts)
The future minimum rental payments under non-cancellable operating leases, segregating ANO and Related Companies leases from all other operating leases, were as follows at December 31, 2010:
| Operating Leases | ||||||||||||||||
| ANO and Related Companies | Store & Other Leases |
Total Operating Leases |
||||||||||||||
| Store Leases |
Headquarters Lease |
|||||||||||||||
| 2011 |
$ | 1,199 | $ | 1,096 | $ | 12,783 | $ | 15,078 | ||||||||
| 2012 |
1,024 | 1,129 | 11,193 | 13,346 | ||||||||||||
| 2013 |
948 | 1,163 | 9,525 | 11,636 | ||||||||||||
| 2014 |
620 | 1,198 | 7,717 | 9,535 | ||||||||||||
| 2015 |
392 | 1,233 | 5,351 | 6,976 | ||||||||||||
| Thereafter |
171 | 6,705 | 7,955 | 14,831 | ||||||||||||
| Total minimum lease payments |
$ | 4,354 | $ | 12,524 | $ | 54,524 | $ | 71,402 | ||||||||
| NOTE 6. | STOCK-BASED COMPENSATION |
Stock-based compensation expense included in SG&A expenses consisted of:
| Year Ended December 31, | ||||||||||||
| 2010 | 2009 | 2008 | ||||||||||
| Stock Options and Restricted Stock Awards |
$ | 2,962 | $ | 2,826 | $ | 2,840 | ||||||
| Variable Plan |
— | — | (2,960 | ) | ||||||||
| Regional Manager Plan |
129 | 129 | 129 | |||||||||
| Total |
$ | 3,091 | $ | 2,955 | $ | 9 | ||||||
Overview
The Company has an equity incentive plan for employees, non-employee directors and other service providers, the Lumber Liquidators Holdings, Inc. 2007 Equity Compensation Plan (the “2007 Plan”), from which it grants stock options and restricted stock awards. The total number of shares of common stock authorized for issuance under the 2007 Plan is 4.3 million. As of December 31, 2010, 1.4 million shares of common stock were available for future grants. Stock options granted under the 2007 Plan expire no later than ten years from the date of grant and the exercise price shall not be less than the fair market value of the shares on the date of grant. Vesting periods are assigned to stock options and restricted stock awards on a grant by grant basis at the discretion of the Board of Directors. The Company issues new shares of common stock upon exercise of stock options and vesting of restricted stock awards.
The Company also maintains the Lumber Liquidators Holdings, Inc. Outside Directors Deferral Plan (the “Deferral Plan”) under which each of the Company’s non-employee directors has the opportunity to annually elect to defer certain fees until his departure from the Board of Directors. A non-employee director may elect to defer up to 100% of his fees and have such fees invested in deferred stock units. Deferred stock units must be settled in common stock upon the director’s departure from the Board. There were 22,265 deferred stock units outstanding at December 31, 2010. There were no deferred stock units outstanding at December 31, 2009.
The Variable Plan
The Company was party to a stock-based agreement between our Company’s founder and his brother, a former regional manager, accounted for as a variable performance plan (the “Variable Plan”) in accordance with FASB ASC 718. The Variable Plan awarded the founder’s brother the right to an ownership percentage of common stock (the “Variable Right”), contributed by the founder. In conjunction with the IPO in November 2007, the Variable Right fully vested and became
50
Table of Contents
Lumber Liquidators Holdings, Inc.
Notes to Consolidated Financial Statements—(Continued)
(amounts in thousands, except share data and per share amounts)
exercisable. In accordance with the terms of the Variable Plan, the Company calculated that 853,853 shares of common stock had vested (the “Vested Shares”) and were exercisable under the Variable Right. The brother filed a demand for arbitration on December 7, 2007 related to the Vested Shares, and stock-based compensation expense for 2007 included an accrual of $2,960 as the Company’s best estimate of the ultimate value to be transferred from the Company’s founder to his brother via settlement or arbitration. The Variable Right was exercised on February 1, 2008. In December 2008, an arbitrator determined that the brother was entitled only to the Vested Shares, and the Company reversed the accrual of stock-based compensation expense related to the Variable Plan, which reduced 2008 stock-based compensation expense by $2,960, with an offset to additional capital.
The Regional Manager Plan
The Company maintains a stock unit plan for regional store management, the 2006 Stock Unit Plan for Regional Managers (the “2006 Regional Plan”). In 2006, certain Regional Managers were granted a total of 85,000 stock units vesting over approximately a five year period with the Company’s founder contributing the 85,000 shares of common stock necessary to provide for the exercise of the stock units. No additional grants of stock units are available under the 2006 Regional Plan. Through December 2010, all 85,000 stock units had vested and the Company’s founder had transferred the corresponding shares of common stock. Pursuant to the provisions of the 2006 Regional Plan, the Company withheld 20,134 shares of common stock from the Regional Managers at the fair market value on the vest dates for a total of $354, to cover applicable federal and state withholding taxes.
Stock Options
The following table summarizes activity related to stock options:
| Shares | Weighted Average Exercise Price |
Remaining Average Contractual Term (Years) |
Aggregate Intrinsic Value |
|||||||||||||
| Balance at December 31, 2007 |
1,966,847 | $ | 7.95 | 8.8 | $ | 2,038 | ||||||||||
| Granted |
288,760 | 10.47 | ||||||||||||||
| Exercised |
(26,500 | ) | 7.67 | |||||||||||||
| Forfeited |
(3,000 | ) | 16.55 | |||||||||||||
| Balance, December 31, 2008 |
2,226,107 | $ | 8.27 | 8.0 | $ | 5,199 | ||||||||||
| Granted |
317,141 | 11.17 | ||||||||||||||
| Exercised |
(393,199 | ) | 8.35 | |||||||||||||
| Forfeited |
(103,073 | ) | 10.22 | |||||||||||||
| Balance, December 31, 2009 |
2,046,976 | $ | 8.61 | 7.2 | $ | 37,237 | ||||||||||
| Granted |
289,026 | 24.35 | ||||||||||||||
| Exercised |
(206,821 | ) | 8.68 | |||||||||||||
| Forfeited |
(59,664 | ) | 13.24 | |||||||||||||
| Balance, December 31, 2010 |
2,069,517 | $ | 10.67 | 6.6 | $ | 29,635 | ||||||||||
| Exercisable at December 31, 2010 |
1,471,095 | $ | 8.03 | 5.8 | $ | 24,839 | ||||||||||
The aggregate intrinsic value is the difference between the exercise price and the closing price of the Company’s common stock on December 31. The intrinsic value of the stock options exercised during 2010 and 2009 was $3,742 and $4,380, respectively.
As of December 31, 2010, total unrecognized compensation cost related to unvested options was approximately $3,377, net of estimated forfeitures, which is expected to be recognized over a weighted average period of approximately 2.2 years.
51
Table of Contents
Lumber Liquidators Holdings, Inc.
Notes to Consolidated Financial Statements—(Continued)
(amounts in thousands, except share data and per share amounts)
The fair value of each stock option award is estimated by management on the date of the grant using the Black-Scholes-Merton option pricing model. The weighted average fair value of options granted during 2010, 2009 and 2008 was $11.44, $5.78, and $4.99, respectively.
The following are the ranges of assumptions for the periods noted:
| Year Ended December 31, |
||||||||||||
| 2010 | 2009 | 2008 | ||||||||||
| Expected dividend rate |
Nil | Nil | Nil | |||||||||
| Expected stock price volatility |
45 | % | 39-45 | % | 39 | % | ||||||
| Risk-free interest rate |
1.9-3.2 | % | 2.8-3.6 | % | 3.2-3.7 | % | ||||||
| Expected term of options |
3.5-7.5 years | 7.5 years | 7.5 years | |||||||||
The expected stock price volatility range is based on the historical volatilities of companies included in a peer group that was selected by management whose shares or options are publicly available. The volatilities are estimated for a period of time equal to the expected life of the related option. The risk-free interest rate is based on the implied yield of U.S. Treasury zero-coupon issues with an equivalent remaining term. The expected term of the options represents the estimated period of time until exercise and is determined by considering the contractual terms, vesting schedule and expectations of future employee behavior.
Restricted Stock Awards
The following table summarizes activity related to restricted stock awards:
| Shares | Weighted Average Grant Date Fair Value |
|||||||
| Nonvested, December 31, 2007 |
81,300 | $ | 8.95 | |||||
| Granted |
97,092 | 13.49 | ||||||
| Released |
(34,184 | ) | 12.46 | |||||
| Forfeited |
(11,435 | ) | 9.27 | |||||
| Nonvested, December 31, 2008 |
132,773 | $ | 11.33 | |||||
| Granted |
92,533 | 13.70 | ||||||
| Released |
(58,063 | ) | 13.33 | |||||
| Forfeited |
(22,013 | ) | 10.06 | |||||
| Nonvested, December 31, 2009 |
145,230 | $ | 12.19 | |||||
| Granted |
67,811 | 24.69 | ||||||
| Released |
(48,245 | ) | 24.63 | |||||
| Forfeited |
(22,715 | ) | 14.26 | |||||
| Nonvested, December 31, 2010 |
142,081 | $ | 13.60 | |||||
The fair value of restricted stock awards released during the years ended December 31, 2010, 2009, and 2008 was $1,188, $978, and $426, respectively. As of December 31, 2010, total unrecognized compensation cost related to unvested restricted stock awards was approximately $665, net of estimated forfeitures, which is expected to be recognized over a weighted average period of approximately 1.9 years.
52
Table of Contents
Lumber Liquidators Holdings, Inc.
Notes to Consolidated Financial Statements—(Continued)
(amounts in thousands, except share data and per share amounts)
| NOTE 7. | INCOME TAXES |
The provision for income taxes consists of the following:
| Year Ended December 31, | ||||||||||||
| 2010 | 2009 | 2008 | ||||||||||
| Current |
||||||||||||
| Federal |
$ | 10,231 | $ | 14,681 | $ | 12,955 | ||||||
| State |
1,945 | 3,456 | 3,174 | |||||||||
| Total Current |
12,176 | 18,137 | 16,129 | |||||||||
| Deferred |
||||||||||||
| Federal |
3,842 | (776 | ) | (390 | ) | |||||||
| State |
458 | (180 | ) | (96 | ) | |||||||
| Total Deferred |
4,300 | (956 | ) | (486 | ) | |||||||
| Total Provision for Income Taxes |
$ | 16,476 | $ | 17,181 | $ | 15,643 | ||||||
The reconciliation of significant differences between income tax expense applying the federal statutory rate of 35% and the actual income tax expense at the effective rate are as follows:
| Year Ended December 31, | ||||||||||||||||||||||||
| 2010 | 2009 | 2008 | ||||||||||||||||||||||
| Income Tax Expense at Federal Statutory Rate |
$ | 14,960 | 35.0 | % | $ | 15,437 | 35.0 | % | $ | 13,227 | 35.0 | % | ||||||||||||
| Increases (Decreases): |
||||||||||||||||||||||||
| State Income Taxes, Net of Federal Income Tax Benefit |
1,478 | 3.5 | % | 2,150 | 4.9 | % | 1,939 | 5.1 | % | |||||||||||||||
| Net Reduction of Deferred Tax Benefit Associated with the Variable Plan |
— | 0.0 | % | — | 0.0 | % | 638 | 1.7 | % | |||||||||||||||
| Other |
38 | 0.0 | % | (406 | ) | (0.9 | %) | (161 | ) | (0.4 | %) | |||||||||||||
| Total |
$ | 16,476 | 38.5 | % | $ | 17,181 | 39.0 | % | $ | 15,643 | 41.4 | % | ||||||||||||
Pursuant to the Variable Plan, the Variable Right fully vested in conjunction with the IPO and was exercised on February 1, 2008. At that time, the Company had no excess tax deductions from previous stock-based awards, and therefore recognized additional income tax expense related to the non-deductible portion of the Variable Plan’s cumulative compensation costs. This additional income tax expense was the result of a decrease in the fair value of the Vested Shares from the vest date to the exercise date. Subsequent stock option exercises during 2008 resulted in an excess tax benefit that reduced income tax expense.
53
Table of Contents
Lumber Liquidators Holdings, Inc.
Notes to Consolidated Financial Statements—(Continued)
(amounts in thousands, except share data and per share amounts)
The tax effects of temporary differences that result in significant portions of the deferred tax accounts are as follows:
| December 31, | ||||||||
| 2010 | 2009 | |||||||
| Deferred Tax Liabilities: |
||||||||
| Prepaid Expenses |
$ | 271 | $ | 209 | ||||
| Depreciation and Amortization |
6,943 | 2,146 | ||||||
| Total Deferred Tax Liabilities |
7,214 | 2,355 | ||||||
| Deferred Tax Assets: |
||||||||
| Stock-Based Compensation Expense |
3,341 | 3,274 | ||||||
| Reserves |
2,032 | 1,864 | ||||||
| Employee Benefits |
316 | 1,176 | ||||||
| Inventory Capitalization |
1,435 | 1,402 | ||||||
| Other |
97 | 49 | ||||||
| Total Deferred Tax Assets |
7,221 | 7,765 | ||||||
| Net Deferred Tax Asset |
$ | 7 | $ | 5,410 | ||||
The Company made income tax payments of $14,282, $15,273, and $15,112 in 2010, 2009, and 2008, respectively.
The Company files income tax returns with the U.S. federal government and various state jurisdictions. In the normal course of business, the Company is subject to examination by federal and state taxing authorities. The Internal Revenue Service has completed audits of the Company’s federal income tax returns for the years through 2007.
| NOTE 8. | PROFIT SHARING PLAN |
The Company maintains a profit-sharing plan, qualified under Section 401(k) of the Internal Revenue Code, for all eligible employees. Through 2009, employees were eligible to participate following the completion of one year of service and attainment of age 21. As of January 1, 2010, employees are eligible to participate following the completion of three months of service and attainment of age 21. The Company matches 50% of employee contributions up to 6% of eligible compensation. The Company’s matching contributions, included in SG&A, totaled $520, $404, and $344 in 2010, 2009, and 2008, respectively.
| NOTE 9. | NET INCOME PER COMMON SHARE |
The following table sets forth the computation of basic and diluted net income per common share:
| Year Ended December 31, | ||||||||||||
| 2010 | 2009 | 2008 | ||||||||||
| Net Income |
$ | 26,266 | $ | 26,924 | $ | 22,149 | ||||||
| Weighted Average Common Shares Outstanding—Basic |
27,384,095 | 26,983,689 | 26,772,288 | |||||||||
| Effect of Dilutive Securities: |
||||||||||||
| Common Stock Equivalents |
862,358 | 700,858 | 318,305 | |||||||||
| Weighted Average Common Shares Outstanding—Diluted |
28,246,453 | 27,684,547 | 27,090,593 | |||||||||
| Net Income per Common Share—Basic |
$ | 0.96 | $ | 1.00 | $ | 0.83 | ||||||
| Net Income per Common Share—Diluted |
$ | 0.93 | $ | 0.97 | $ | 0.82 | ||||||
54
Table of Contents
Lumber Liquidators Holdings, Inc.
Notes to Consolidated Financial Statements—(Continued)
(amounts in thousands, except share data and per share amounts)
The following have been excluded from the computation of Weighted Average Common Shares Outstanding—Diluted because the effect would be anti-dilutive:
| As of December 31, | ||||||||||||
| 2010 | 2009 | 2008 | ||||||||||
| Stock Options |
287,857 | 10,436 | 435,760 | |||||||||
| Restricted Stock Awards |
— | — | 5,800 | |||||||||
| NOTE 10. | RELATED PARTY TRANSACTIONS |
As described in Note 5, the Company leases a number of its store locations and Corporate Headquarters from ANO and Related Companies.
| NOTE 11. | COMMITMENTS AND CONTINGENCIES |
The Company is, from time to time, subject to claims and disputes arising in the normal course of business. In the opinion of management, while the outcome of any such claims and disputes cannot be predicted with certainty, the ultimate liability of the Company in connection with these matters is not expected to have a material adverse effect on the Company’s results of operations, financial position or cash flows.
On September 3, 2009, a former store manager and a current assistant store manager at the time (together, the “Plaintiffs”) filed a putative class action suit against LLI in the Superior Court of California in and for the County of Alameda. The Plaintiffs allege that with regard to certain groups of current and former employees in LLI’s California stores, LLI violated California law by failing to calculate and pay overtime wages properly, provide meal breaks, compensate for unused vacation time, reimburse for certain expenses and maintain required employment records. The Plaintiffs also claim that LLI did not calculate and pay overtime wages properly for certain of LLI’s non-exempt employees, both in and out of California, in violation of federal law. In their suit, the Plaintiffs seek compensatory damages, certain statutory penalties, costs, attorney’s fees and injunctive relief. LLI removed the case to the United States District Court for the Northern District of California. No class has been certified with regard to any of the alleged causes of action. LLI is vigorously defending the claims in this suit including class certification. While there is a reasonable possibility that a material loss may be incurred, the Company cannot estimate the loss or range of loss, if any, to the Company at this time.
On or about September 7, 2010, a former store manager filed an action against LLI in the United States District Court for the Middle District of Florida. In the complaint, the former store manager alleges that LLI breached an alleged contract for the payment of a commission and violated the FLSA by failing to pay him for overtime hours worked. In addition, he asserts a purported collective action on behalf of similarly situated LLI employees alleging that LLI denied them overtime wages in violation of the FLSA. No class has been certified with regard to the purported collective action. LLI intends to defend the claims in this suit vigorously including collective action certification. While there is a reasonable possibility that a material loss may be incurred, the Company cannot estimate the loss or range of loss, if any, to the Company at this time.
55
Table of Contents
Lumber Liquidators Holdings, Inc.
Notes to Consolidated Financial Statements—(Continued)
(amounts in thousands, except share data and per share amounts)
| NOTE 12. | CONDENSED QUARTERLY FINANCIAL INFORMATION (unaudited) |
The following tables present the Company’s unaudited quarterly results for 2010 and 2009.
| Quarter Ended | ||||||||||||||||
| March 31, 2010 |
June 30, 2010 |
September 30, 2010 |
December 31, 2010 |
|||||||||||||
| (dollars in thousands, except per share amounts) | ||||||||||||||||
| Net Sales |
$ | 151,195 | $ | 168,674 | $ | 147,192 | $ | 153,220 | ||||||||
| Gross Profit |
53,504 | 58,540 | 51,761 | 52,025 | ||||||||||||
| Selling, General and Administrative Expenses |
42,213 | 43,863 | 44,909 | 42,682 | ||||||||||||
| Operating Income |
11,291 | 14,677 | 6,852 | 9,343 | ||||||||||||
| Net Income |
$ | 6,968 | $ | 9,093 | $ | 4,284 | $ | 5,921 | ||||||||
| Net Income per Common Share—Basic |
$ | 0.26 | $ | 0.33 | $ | 0.16 | $ | 0.22 | ||||||||
| Net Income per Common Share—Diluted |
$ | 0.25 | $ | 0.32 | $ | 0.15 | $ | 0.21 | ||||||||
| Number of Stores Opened in Quarter |
11 | 6 | 10 | 10 | ||||||||||||
| Comparable Store Net Sales Increase (Decrease) |
8.0 | % | 5.5 | % | (5.7 | %) | 1.2 | % | ||||||||
| Quarter Ended | ||||||||||||||||
| March 31, 2009 |
June 30, 2009 |
September 30, 2009 |
December 31, 2009 |
|||||||||||||
| (dollars in thousands, except per share amounts) | ||||||||||||||||
| Net Sales |
$ | 123,852 | $ | 143,116 | $ | 140,520 | $ | 137,080 | ||||||||
| Gross Profit |
44,562 | 50,578 | 51,184 | 48,353 | ||||||||||||
| Selling, General and Administrative Expenses |
36,295 | 39,247 | 38,727 | 36,801 | ||||||||||||
| Operating Income |
8,267 | 11,331 | 12,457 | 11,552 | ||||||||||||
| Net Income |
$ | 5,093 | $ | 6,939 | $ | 7,761 | $ | 7,131 | ||||||||
| Net Income per Common Share—Basic |
$ | 0.19 | $ | 0.26 | $ | 0.29 | $ | 0.26 | ||||||||
| Net Income per Common Share—Diluted |
$ | 0.19 | $ | 0.25 | $ | 0.28 | $ | 0.25 | ||||||||
| Number of Stores Opened in Quarter |
10 | 8 | 9 | 9 | ||||||||||||
| Comparable Store Net Sales Increase (Decrease) |
(5.8 | %) | (1.8 | %) | 1.9 | % | 5.5 | % | ||||||||
56
Table of Contents
Item 9. Changes in and Disagreements with Accountants on Accounting and Financial Disclosure.
None.
Item 9A. Controls and Procedures.
An evaluation was performed under the supervision and with the participation of our management, including our Chief Executive Officer (principal executive officer) and Chief Financial Officer (principal financial officer), of the effectiveness of our disclosure controls and procedures, as defined in Rules 13a-15(e) and 15d-15(e) under the Securities Exchange Act of 1934, as amended (Exchange Act), as of the end of the period covered by this report. Based on that evaluation, our management, including our Chief Executive Officer and Chief Financial Officer, concluded that our disclosure controls and procedures were effective as of December 31, 2010 and designed to ensure that information required to be disclosed by us in reports that we file or submit under the Exchange Act, is recorded, processed, summarized and reported within the time periods specified in the rules and forms of the SEC and that such information is accumulated and communicated to our management, including our Chief Executive Officer and Chief Financial Officer, as appropriate to allow timely decisions regarding required disclosure.
Management’s Annual Report on Internal Control Over Financial Reporting
Our management is responsible for establishing and maintaining adequate internal control over financial reporting as defined in Rules 13a-15(f) and 15d-15(f) under the Exchange Act. Our internal control over financial reporting is designed to provide reasonable assurance regarding the reliability of financial reporting and the preparation of financial statements for external purposes in accordance with U.S. generally accepted accounting principles.
Because of its inherent limitations, internal control over financial reporting may not prevent or detect misstatements. Therefore, even those systems determined to be effective can provide only reasonable assurance of achieving their control objectives.
Our management assessed the effectiveness of our internal control over financial reporting as of December 31, 2010. In making this assessment, our management used the criteria set forth by the Committee of Sponsoring Organizations of the Treadway Commission (COSO) in Internal Control—Integrated Framework. Based on our assessment and those criteria, management believes that we maintained effective internal control over financial reporting as of December 31, 2010.
Our independent registered public accounting firm, Ernst & Young LLP, has issued a report on our internal controls over financial reporting as of December 31, 2010. See “Item 8. Consolidated Financial Statements and Supplementary Data.”
Changes in Internal Control over Financial Reporting
We have made significant changes to our internal control over financial reporting to address the implementation of the SAP system that occurred during the third quarter of 2010. Our third quarter 2010 implementation included point-of-sale, warehouse management, merchandising, product allocation, general ledger and related management reporting systems. Our internal controls impacting these processes and systems, including information technology general controls, significantly changed or were modified in the third and fourth quarters of 2010.
None.
57
Table of Contents
Item 10. Directors, Executive Officers and Corporate Governance.
The information required by this Item is incorporated by reference from the definitive proxy statement for our 2011 annual meeting of shareholders, which will be filed no later than 120 days after December 31, 2010.
Code of Ethics
We have a Code of Conduct, which applies to all employees, officers and directors of Lumber Liquidators Holdings, Inc. and its direct and indirect subsidiaries. Our Code of Conduct meets the requirements of a “code of ethics” as defined by Item 406 of Regulation S-K, and applies to our Chief Executive Officer, Chief Financial Officer (who is both our principal financial and principal accounting officer), as well as all other employees. Our Code of Conduct also meets the requirements of a code of conduct under Rule 303A.10 of the NYSE Listed Company Manual. Our Code of Conduct is posted on our website at www.lumberliquidators.com in the “Corporate Governance” section of our Investor Relations home page.
Item 11. Executive Compensation.
The information required by this Item is incorporated by reference from the definitive proxy statement for our 2011 annual meeting of shareholders, which will be filed no later than 120 days after December 31, 2010.
Item 12. Security Ownership of Certain Beneficial Owners and Management and Related Stockholder Matters.
The information required by this Item is incorporated by reference from the definitive proxy statement for our 2011 annual meeting of shareholders, which will be filed no later than 120 days after December 31, 2010.
Item 13. Certain Relationships, Related Transactions and Director Independence.
The information required by this Item is incorporated by reference from the definitive proxy statement for our 2011 annual meeting of shareholders, which will be filed no later than 120 days after December 31, 2010.
Item 14. Principal Accountant Fees and Services.
The information required by this Item is incorporated by reference from the definitive proxy statement for our 2011 annual meeting of shareholders, which will be filed no later than 120 days after December 31, 2010.
58
Table of Contents
Item 15. Exhibits and Financial Statement Schedules.
1. Financial Statements
The following financial statements are submitted in Part II, Item 8 of this annual report:
2. Financial Statement Schedules
All financial statement schedules have been omitted because the required information is either included in the financial statements or the notes thereto or is not applicable.
3. Exhibits
The exhibits listed on the accompanying Exhibit Index are filed or incorporated by reference as part of this report.
59
Table of Contents
Pursuant to the requirements of Section 13 or 15(d) of the Securities Exchange Act of 1934, as amended, the registrant has duly caused this report to be signed on its behalf by the undersigned, thereunto duly authorized on February 23, 2011.
| LUMBER LIQUIDATORS HOLDINGS, INC. | ||
| By: |
/s/ JEFFREY W. GRIFFITHS | |
| Jeffrey W. Griffiths Chief Executive Officer | ||
Pursuant to the requirements of the Securities and Exchange Act of 1934, this report has been signed below by the following persons on behalf of the registrant and in the capacities indicated on February 23, 2011.
| Signature |
Title | |
| /S/ JEFFREY W. GRIFFITHS Jeffrey W. Griffiths |
Chief Executive Officer and Director (Principal Executive Officer) | |
| /S/ DANIEL E. TERRELL Daniel E. Terrell |
Chief Financial Officer (Principal Financial and Principal Accounting Officer) | |
| /S/ THOMAS D. SULLIVAN Thomas D. Sullivan |
Chairman of the Board | |
| /S/ MACON F. BROCK, JR. Macon F. Brock, Jr. |
Director | |
| /S/ DOUGLAS T. MOORE Douglas T. Moore |
Director | |
| /S/ JOHN M. PRESLEY John M. Presley |
Director | |
| /S/ PETER B. ROBINSON Peter B. Robinson |
Director | |
| /S/ MARTIN F. ROPER Martin F. Roper |
Director | |
| /S/ RICHARD D. TADLER Richard D. Tadler |
Director | |
60
Table of Contents
EXHIBIT INDEX
| Exhibit Number |
Exhibit Description | |
| 2.01 | Agreement of Merger and Plan of Reorganization among Lumber Liquidators, Inc., Lumber Liquidators Holdings, Inc., and Lumber Liquidators Merger Sub, Inc., dated December 29, 2009 (filed as Exhibit 2.1 to the Company’s current report on Form 8-K, filed on January 4, 2010 (File No. 001-33767), and incorporated by reference) | |
| 3.01 | Certificate of Incorporation of Lumber Liquidators Holdings, Inc. (filed as Exhibit 3.1 to the Company’s current report on Form 8-K, filed on January 4, 2010 (File No. 001-33767), and incorporated by reference) | |
| 3.02 | By-Laws of Lumber Liquidators Holdings, Inc. (filed as Exhibit 3.2 to the Company’s current report on Form 8-K, filed on January 4, 2010 (File No. 001-33767), and incorporated by reference) | |
| 4.01 | Form of Certificate of Common Stock of Lumber Liquidators Holdings, Inc. (filed as Exhibit 4.1 to the Company’s current report on Form 8-K, filed on January 4, 2010 (File No. 001-33767), and incorporated by reference) | |
| 10.01* | Lumber Liquidators 2007 Equity Compensation Plan (filed as Exhibit 10.1 to the Company’s Post-effective Amendment No. 1 to its Registration Statement on Form S-8, filed January 4, 2010 (File No. 333-147247), and incorporated by reference) | |
| 10.02* | Lumber Liquidators 2006 Equity Plan for Non-Employee Directors (filed as Exhibit 10.2 to the Company’s Post-effective Amendment No. 1 to its Registration Statement on Form S-8, filed January 4, 2010 (File No. 333-147247), and incorporated by reference) | |
| 10.03* | Lumber Liquidators 2004 Stock Option and Grant Plan (filed as Exhibit 10.3 to the Company’s Post-effective Amendment No. 1 to its Registration Statement on Form S-8, filed January 4, 2010 (File No. 333-147247), and incorporated by reference) | |
| 10.04* | Employment Agreement with Jeffrey W. Griffiths (filed as Exhibit 10.03 to the Company’s Registration Statement on Form S-1, filed April 23, 2007 (File No. 333-142309), and incorporated by reference) | |
| 10.05* | Employment Agreement with H. Franklin Marcus, Jr. (filed as Exhibit 10.04 to the Company’s Registration Statement on Form S-1, filed April 23, 2007 (File No. 333-142309), and incorporated by reference) | |
| 10.06* | Offer Letter Agreement with Robert M. Morrison (filed as Exhibit 10.05 to the Company’s Registration Statement on Form S-1, filed April 23, 2007 (File No. 333-142309), and incorporated by reference) | |
| 10.07* | Offer Letter Agreement with Marco Pescara (filed as Exhibit 10.06 to the Company’s Registration Statement on Form S-1, filed April 23, 2007 (File No. 333-142309), and incorporated by reference) | |
| 10.08* | Form of Non-Qualified Employee Stock Option Agreement, effective October 18, 2006 (filed as Exhibit 10.07 to the Company’s Registration Statement on Form S-1, filed April 23, 2007 (File No. 333-142309), and incorporated by reference) | |
| 10.09 | Lease by and between ANO LLC and Lumber Liquidators (relating to Toano facility) (filed as Exhibit 10.08 to the Company’s Amendment No. 1 to its Registration Statement on Form S-1, filed May 30, 2007 (File No. 333-142309), and incorporated by reference) | |
| 10.10* | Thomas D. Sullivan Stock Option Agreement and Lumber Liquidators, Inc. Guaranty Agreement, and amendment thereto (filed as Exhibit 10.09 to the Company’s Amendment No. 1 to its Registration Statement on Form S-1, filed May 30, 2007 (File No. 333-142309), and incorporated by reference) | |
| 10.11* | Form of Option Award Agreement, effective November 16, 2007 (filed as Exhibit 10.10 to the Company’s annual report on Form 10-K, filed on March 12, 2008 (File No. 001-33767), and incorporated by reference) | |
| 10.12* | Form of Restricted Stock Agreement, effective November 16, 2007 (filed as Exhibit 10.11 to the Company’s annual report on Form 10-K, filed on March 12, 2008 (File No. 001-33767), and incorporated by reference) | |
| 10.13* | Form of Option Award Agreement, effective December 31, 2010 | |
| 10.14* | Form of Restricted Stock Agreement, effective December 31, 2010 | |
61
Table of Contents
| Exhibit Number |
Exhibit Description | |
| 10.15* | Amendment to Executive Employment Agreement with Jeffrey W. Griffiths (filed as Exhibit 10.13 to the Company’s Form 10-Q, filed May 6, 2009 (File No. 001-33767), and incorporated by reference) | |
| 10.16* | Second Amendment to Executive Employment Agreement with Jeffrey W. Griffiths (filed as Exhibit 10.1 to the Company’s current report on Form 8-K, filed December 30, 2009 (File No. 001-33767), and incorporated by reference) | |
| 10.17* | Amended and Restated Annual Bonus Plan (filed as Exhibit 10.01 to the Company’s current report on Form 8-K, filed February 4, 2010 (File No. 001-33767), and incorporated by reference) | |
| 10.18* | Separation and Release Agreement with Andrew P. Shulklapper (filed as Exhibit 10.1 to the Company’s current report on Form 8-K, filed October 25, 2010 (File No. 001-33767), and incorporated by reference) | |
| 10.19* | Employment Agreement with Robert M. Lynch (filed as Exhibit 10.1 to the Company’s current report on Form 8-K, filed December 21, 2010 (File No. 005-83765), and incorporated by reference) | |
| 21.01 | Lumber Liquidators Holdings, Inc. Subsidiaries | |
| 23.01 | Consent of Ernst & Young LLP, Independent Registered Public Accounting Firm | |
| 31.01 | Certification of Principal Executive Officer of Lumber Liquidators Holdings, Inc. pursuant to Section 302 of the Sarbanes-Oxley Act of 2002 | |
| 31.02 | Certification of Principal Financial Officer of Lumber Liquidators Holdings, Inc. pursuant to Section 302 of the Sarbanes-Oxley Act of 2002 | |
| 32.01 | Certification of Principal Executive Officer and Principal Financial Officer of Lumber Liquidators Holdings, Inc. pursuant to Section 906 of the Sarbanes-Oxley act of 2002 | |
| * | Indicates a management contract or compensation plan, contract or agreement. |
62