Attached files
| file | filename |
|---|---|
| 8-K - FORM 8-K - CHARTER FINANCIAL CORP | chfn_8k12062013.htm |

1

Forward-Looking Statement 2 This presentation may contain certain forward-looking statements regarding our prospective performance and strategies within the meaning of Section 27A of the Securities Act of 1933, as amended and Section 21E of the Securities Exchange Act of 1934, as amended. We intend such forward-looking statements to be covered by the Safe Harbor Provision for forward-looking statements contained in the Private Securities Litigation Reform Act of 1995, and are including this statement for purposes of said safe harbor provision. Forward- looking statements can be identified by the use of words such as “estimate,” “project,” “believe,” “intend,” “anticipate,” “plan,” “seek,” “expect” and words of similar meaning. These forward-looking statements include, but are not limited to: statements of our goals, intentions and expectations; statements regarding our business plans, prospects, growth and operating strategies; statements regarding the asset quality of our loan and investment portfolios; and estimates of our risks and future costs and benefits. These forward-looking statements are based on current beliefs and expectations of our management and are inherently subject to significant business, economic and competitive uncertainties and contingencies, many of which are beyond our control. In addition, these forward-looking statements are subject to assumptions with respect to future business strategies and decisions that are subject to change. The following factors, among others, could cause actual results to differ materially from the anticipated results or other expectations expressed in the forward-looking statements: general economic conditions, either nationally or in our market areas, that are worse than expected; competition among depository and other financial institutions; changes in the interest rate environment that reduce our margins or reduce the fair value of financial instruments; adverse changes in the securities markets; changes in laws or government regulations or policies affecting financial institutions, including changes in regulatory fees and capital requirements; our ability to enter new markets successfully and capitalize on growth opportunities; our ability to successfully integrate acquired entities; our incurring higher than expected loan charge-offs with respect to assets acquired in FDIC-assisted acquisitions; changes in consumer spending, borrowing and savings habits; changes in accounting policies and practices, as may be adopted by the bank regulatory agencies and the Financial Accounting Standards Board; and changes in our organization, compensation and benefit plans. Because of these and other uncertainties, our actual future results may be materially different from the results indicated by these forward-looking statements. Readers are cautioned not to place undue reliance on the forward-looking statements contained herein, which speak only as of the date of this presentation. Except as required by applicable law or regulation, we do not undertake, and specifically disclaim any obligation to update any forward-looking statements that may be made from time to time by or on behalf of the Company. Please see “Risk Factors” beginning on page 19 of the Company’s Prospectus dated February 11, 2013.

Market Profile 3 NASDAQ: CHFN Recent Price1 (11/29/2013): $10.68 Shares Outstanding: 22.8 Million Market Capitalization (11/29/2013): $243.0 Million Price/Tangible Book Value2: 90% Total Assets (9/30/2013): $1.1 Billion 1- Source: Bloomberg 2- Based on September 30, 2013 tangible book value. November 29, 2013 market price.

Corporate Profile 4 Headquartered in West Point, Georgia Founded in 1954 as First Federal Savings and Loan Association Growth by de novo branch and acquisition Recent growth via three FDIC-assisted acquisitions (June ’09, March ’10, Sept ’11) Approximately 287 FTE’s servicing over 47,000 checking accounts 16 offices along I-85 & I-20 GA/AL footprint, including 3 offices in NW Florida September 30, 2013: Total Assets: $1.1 Billion Total Net Loans: $580 Million Total Deposits: $751 Million Total Capital: $274 Million

Overview of Management Team 5 Strong Experienced Management & Board of Directors Conservative Credit Continuously Profitable Since before 1990 Good Regulatory Relations M&A Experience … 5 Deals both Assisted & Unassisted Top Executives NAME POSITION (Banking/CharterBank) EXPERIENCE Robert Lee Johnson Chairman & CEO 31/29 Lee Washam President, CharterBank 29/13 Curtis R. Kollar Senior VP & CFO 26/21

6 Market Conditions • Defunct Traditional Textile Industry • KIA Motors Assembly Plant and Related Suppliers • Point University Moved from Atlanta to West Point • Regional Military Influence • Selective Lending Opportunities • Continued Challenges among Southeastern Banking Peers

7 Recent Accomplishments • Raised $142.9 Million in Gross Offering Proceeds Through April 8, 2013 Conversion Out of MHC Structure • Continued Profitability for Fiscal 2013 • Non-time Core Deposits Exceed 62% of Total Deposits at September 30, 2013 • Good/Stable Credit Quality

Capital Management Strategies • Post Capital Raise TCE of 25% at September 30, 2013 • Uses of Capital – Stock Repurchases – After One Year Restriction – Revenue Diversification and Growth – Dividends – Disciplined Acquisition Approach 8

Financial Information

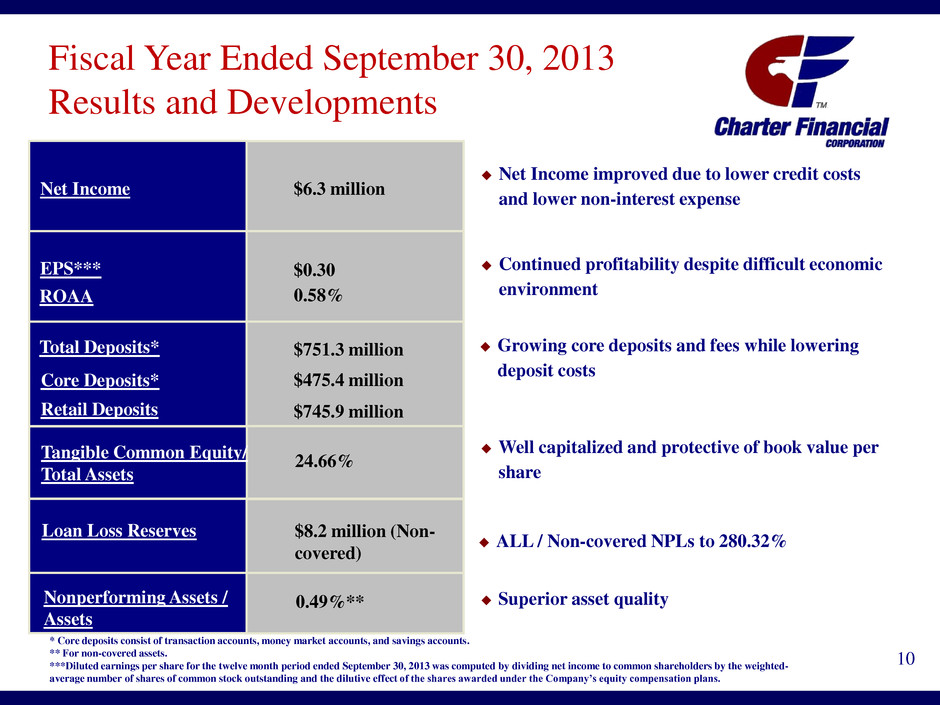
Fiscal Year Ended September 30, 2013 Results and Developments 10 Total Deposits* Tangible Common Equity/ Total Assets Net Income $6.3 million EPS*** $0.30 Loan Loss Reserves $8.2 million (Non- covered) ALL / Non-covered NPLs to 280.32% Continued profitability despite difficult economic environment Nonperforming Assets / Assets 0.49%** Superior asset quality 24.66% $751.3 million Growing core deposits and fees while lowering deposit costs Core Deposits* $475.4 million Retail Deposits $745.9 million * Core deposits consist of transaction accounts, money market accounts, and savings accounts. ** For non-covered assets. ***Diluted earnings per share for the twelve month period ended September 30, 2013 was computed by dividing net income to common shareholders by the weighted- average number of shares of common stock outstanding and the dilutive effect of the shares awarded under the Company’s equity compensation plans. ROAA 0.58% Net Income improved due to lower credit costs and lower non-interest expense Well capitalized and protective of book value per share

Balance Sheet Highlights 11 Note: Unless otherwise noted, the above chart displays information based on Charter’s fiscal year end, which is September 30. [1] Includes FDIC Acquisition of Neighborhood Community Bank. [2] Includes FDIC Acquisition of McIntosh Commercial Bank. [3] Includes FDIC Acquisition of First National Bank of Florida. [4] Core deposits consist of transaction accounts, money market accounts, and savings accounts. [5] Incremental capital raise of approximately $30 million (net). [6] Second step conversion and reorganization resulted in $142.9 million in gross offering proceeds. (Dollars in $000's) 2009 [1] 2010 [2] 2011 [3] 2012 2013 Total Assets $936,880 $1,186,082 $1,171,710 $1,032,220 $1,089,406 Loans, net 552,550 599,370 655,028 593,904 579,854 Legacy 462,786 451,231 419,979 427,676 470,863 Covered 89,764 148,138 235,050 166,228 108,991 Securities 206,061 133,183 158,737 189,379 215,118 Total Liabilities $838,623 $1,052,746 $1,032,294 $889,699 $815,628 Retail Deposits 463,566 739,691 883,389 779,397 745,900 Core [4] 216,902 313,170 447,176 456,292 475,426 Time 246,664 426,521 436,213 323,105 270,474 Total Borrowings 227,000 212,000 110,000 81,000 60,000 Total Equity $98,257 $135,788 [5] $139,416 $142,521 $273,778 [6]

Relative Balance Sheet Strength Source: SNL Financial. Public Banks Peer Group reflects available financial data as of most recent quarter. Public Banks Peer group comprised of banks and thrifts with total assets between $800 million and $4 billion. Excludes merger targets. *Nonperforming loans defined as nonaccrual loans plus loans 90 days past due and accruing. Excludes nonperforming assets covered by loss sharing agreements with FDIC. 12 *Exclu d es c o v e re d asset s Performance Versus Banking Peers September 30, 2013 Charter Financial Public Banks Corporation Peer Group Total Assets ($000s) $1,089,406 $1,379,270 Tangible Common Equity/ Total Assets 24.66% 8.87% NPLs / Total Loans 0.61% 1.36% Reserves / Loans 1.70% 1.55% Reserves / NPLs 2.80x 1.13x MRQ ROAA 0.33% 0.83%

Funding Mix 13 32.1% Funding by Type ($ Million) At September 30, 2013 Average cost of deposits for the three months ended September 30, 2013: 0.55% Deposits by Type • Core Deposits – Transaction, Savings & Money Market Accounts Time Deposits (Excluding Wholesale Deposits) 36% Savings & Money Market 23% Transaction Accounts 39% Wholesale Time Deposits 2% $0 $200 $400 $600 $800 $1,000 $1,200 Sep-04 Sep-05 Sep-06 Sep-07 Sep-08 Sep-09 Sep-10 Sep-11 Sep-12 Sep-13 Core Deposits Retail CD's Wholesale Funding 55% 21% 24% 46% 25% 29% 64% 17% 19% 48% 27% 25% 26% 30% 44% 30% 41% 29% 43% 13% 44% $710 $703 $1,021 $825 $1,035 $881 11% 37% 52% $811 8% 59% 33% $702$688 $687 19% 17% 64%

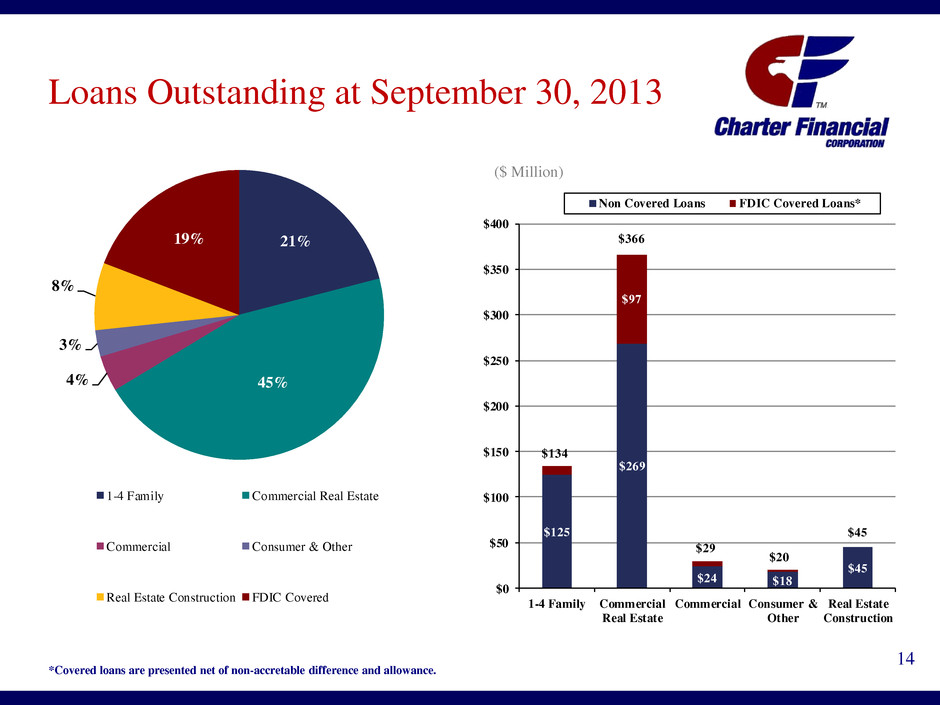
Loans Outstanding at September 30, 2013 14 *Covered loans are presented net of non-accretable difference and allowance. ($ Million) 21% 45%4% 3% 8% 19% 1-4 Family Commercial Real Estate Commercial Consumer & Other Real Estate Construction FDIC Covered $125 $269 $24 $18 $45 $97 $0 $50 $100 $150 $200 $250 $300 $350 $400 1-4 Family Commercial Real Estate Commercial Consumer & Other Real Estate Construction Non Covered Loans FDIC Covered Loans* $134 $366 $29 $20 $45

Non-performing Loans / Total Loans* 15 Note: The above chart displays information based on Charter’s fiscal year end, which is September 30. *Total loans for CHFN exclude covered loans. Public Banks Peer group comprised of banks and thrifts with total assets between $800 million and $4 billion. Excludes merger targets. 0.00% 0.50% 1.00% 1.50% 2.00% 2.50% 3.00% 9/30/2008 9/30/2009 9/30/2010 9/30/2011 9/30/2012 9/30/2013 CHFN Public Banks Peer Group At 2008 2009 2010 2011 2012 9/30/13 NPAs / Total Non-Covered Assets (%) 1.68% 2.16% 2.33% 1.99% 0.69% 0.49% COs / Average Non-Covered Loans (%) 0.24 0.71 0.90 0.48 0.86 0.32 ALLL Non-Covered Loans / NPLs (x) 0.77x 0.70x 0.84x 0.80x 2.38x 2.80x llowance / Total Loans (%) 1.89% 1.97% 2.12% 2.19% 1.87% 1.70%

Asset Quality – Non-Covered 16 ($ Million) $0 $5 $10 $15 $20 $25 9/30/2008 9/30/2009 9/30/2010 9/30/2011 9/30/2012 9/30/2013 REO Non Accrual 90+ Days Delinquent and Accruing 30-89 Days Delinquent and Accruing $13 $18 $21 $16 $6 $5

Loan Delinquency Overview 17 [1] Covered loan balances are net of non-accretable differences and allowance for covered loan losses and have not been reduced by $4.9 million of accretable discounts and discounts on acquired performing loans. Loan Delinquency - Non Covered Loans as of September 30, 2013 Greater than Loans > 90 30-89 Days 90 Days Total Total Days (Dollars in 000s) Past Due Past Due Past Due Current Loans Accruing 1-4 family residential real estate $1,116 $47 $1,163 $123,407 $124,570 $47 Commercial real estate 525 837 1,362 268,248 269,610 0 Commercial 113 0 113 23,661 23,774 0 Real estate construction 37 0 37 44,616 44,653 0 Consumer and other 145 0 145 17,400 17,545 0 Total $1,936 $884 $2,820 $477,332 $480,152 $47 Greater than Loans > 90 30-89 Days 90 Days Total Total Days (Dollars in 000s) Past Due Past Due Past Due Current Loans [1] Accruing 1-4 family residential real estate $415 $938 $1,353 $7,992 $9,345 $938 Commercial real estate 2,948 6,927 9,875 87,261 97,136 6,927 Commercial 534 611 1,145 3,951 5,096 611 Consumer and other 3 98 101 2,188 2,289 98 Total $3,900 $8,574 $12,474 $101,392 $113,866 $8,574 Loan Delinquency - Covered Loans as of September 30, 2013

Securities Portfolio 18 Reflects estimated fair value as of September 30, 2013. Total Securities Available for Sale of $215 Million Portfolio Maximum - 4 year duration +300bp rate change environment ($ Million) 6.9% 2.3% 79.6% 4.6% 1.0% 0.6% 5.0% Pre-refunded Municipals - $14.9 U.S. Agencies - $5.0 U.S. Agency MBS - $171.3 U.S. Agency CMO - $9.9 Private Label: Investment Grade - $2.0 Private Label: Split Rating - $1.2 Private Label: Non-Investment Grade - $10.8

Income Statement Highlights 19 Note: The above chart displays information based on Charter’s fiscal year end, which is September 30. (Dollars in $000s) 2009 2010 2011 2012 2013 Net Interest Income $17,741 $27,201 $30,559 $37,512 $35,275 Provision for Non Covered Loan Losses $4,550 $5,800 $1,700 $3,300 $1,400 Provision for Covered Loan Losses $0 $420 $1,200 $1,202 $89 Non-Interest Income $12,012 $17,510 $9,291 $12,912 $11,653 Non-Interest Expense $22,581 $30,469 $33,950 $40,305 $36,314 Income Tax Expense $306 $2,087 $695 $639 $2,869 Net Income $2,316 $5,935 $2,305 $4,979 $6,256

Return on Average Assets 20 Note: The above chart displays information based on Charter’s fiscal year end, which is September 30. 0.27% 0.56% 0.22% 0.46% 0.58% 0.00% 0.20% 0.40% 0.60% 0.80% 1.00% FY 2009 FY 2010 FY 2011 FY 2012 FY 2013 ROAA

5.48% 5.24% 5.64% 5.38% 5.35% 4.61% 4.01% 3.22% 2.55% 1.85% 1.23% 0.95% 2.32% 2.35% 3.19% 3.59% 4.17% 3.82% 0.00% 1.00% 2.00% 3.00% 4.00% 5.00% 6.00% FY 2008 FY 2009 FY 2010 FY 2011 FY 2012 FY 2013 Yield on Interest Earning Assets Cost of Interest Bearing Liabilities Net Interest Margin Net Interest Margin Trends 21 Notes: The above chart displays information based on Charter’s fiscal year end, which is September 30. The Company’s September 30, 2013 net interest margin benefited by 0.76% from accretion of purchase discount on acquired loans for the quarter ended. The remaining $4.9 million in accretable discounts are to be accreted over the next 3 years.

Net Operating Revenue Net Interest Income + Noninterest Income 22 Note: The above chart displays information based on Charter’s fiscal year end, which is September 30. The efficiency ratio represents non-interest expense divided by the sum of net interest income and non-interest income. ($ Million) $30 $45 $40 $50 $47 75.9% 79.2% 85.3% 79.9% 77.4% 70.0% 72.0% 74.0% 76.0% 78.0% 80.0% 82.0% 84.0% 86.0% 88.0% $0 $10 $20 $30 $40 $50 $60 FY 2009 FY 2010 FY 2011 FY 2012 FY 2013 Net Operating Revenue Efficiency Ratio

Noninterest Expense 23 Note: The above chart displays information based on Charter’s fiscal year end, which is September 30. ($ Million) $0 $5 $10 $15 $20 $25 $30 $35 $40 $45 FY 2008 FY 2009 FY 2010 FY 2011 FY 2012 FY 2013 Marketing Professional Services Occupancy Other Salaries and Benefits $20.3 $22.6 $30.5 $34.0 $40.3 $36.3 22.4% 17.9% 50.8% 48.0% 21.7% 21.6% 46.4% 21.1% 21.5% 21.7% 22.8% 45.3% 44.5% 26.0% 20.5% 56.4% 14.0% 21.7%

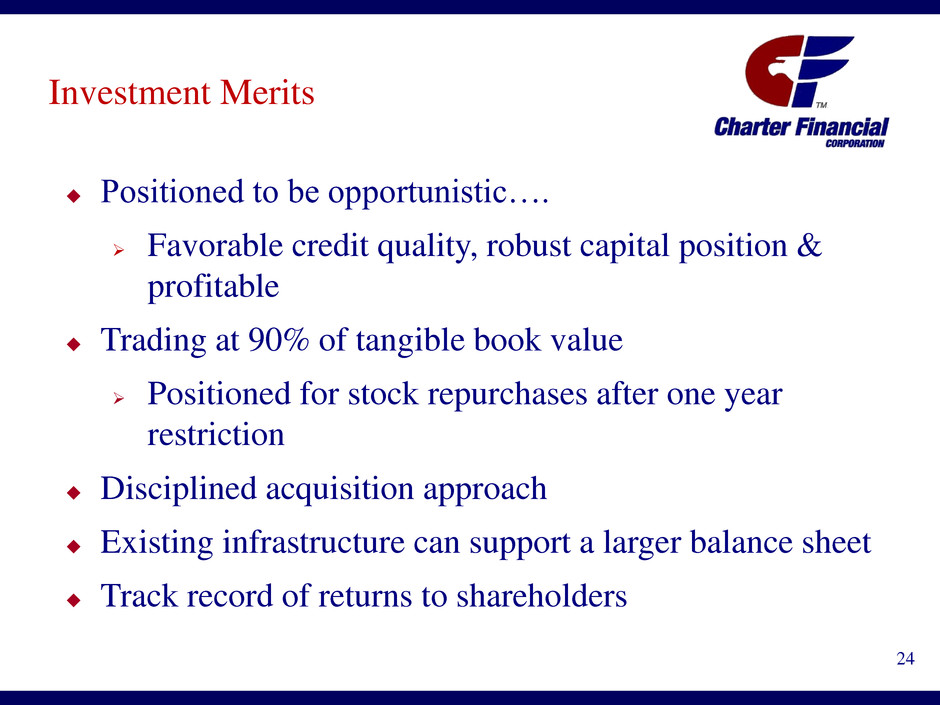
Investment Merits Positioned to be opportunistic…. Favorable credit quality, robust capital position & profitable Trading at 90% of tangible book value Positioned for stock repurchases after one year restriction Disciplined acquisition approach Existing infrastructure can support a larger balance sheet Track record of returns to shareholders 24

Robert L. Johnson Chief Executive Officer bjohnson@charterbank.net (706) 645-3249 Curtis R. Kollar Senior Vice President and Chief Financial Officer ckollar@charterbank.net (706) 645-3237 25 Investor Contacts 1233 O. G. Skinner Drive West Point, Georgia 31833 1-800-763-4444 www.charterbk.com

Appendix

Board & Executive Team 27 Current Position(s) Held With Director Term Name Charter Financial Corporation Age (1) Since (2) Expires Jane W. Darden Director 62 1988 2015 Thomas M. Lane Director 58 1996 2015 Edward D. Smith Director 38 2011 2013 Curti M. Johnson Director, Senior Vice President & General Counsel 53 2007 2013 Robert L. Johnson Chairman of the Board and Chief Executive Officer 59 1986 2014 David Z. Cauble, III Director 60 1996 2014 David L. Strobel Director 61 2003 2014 Executive Officers Who Are Not Directors Curtis R. Kollar Senior Vice President and Chief Financial Officer 60 Le Washam President of CharterBank 51 ____________________________________ (1) As of December 31, 2012. (2) Includes service as a director of CharterBank prior to its mutual-to-stock conversion.

End of Presentation
