Attached files
| file | filename |
|---|---|
| 8-K - CURRENT REPORT OF MATERIAL EVENTS OR CORPORATE CHANGES - Monogram Residential Trust, Inc. | a13-24734_18k.htm |
Exhibit 99.1
|
|
Behringer Harvard Multifamily REIT I, Inc. Q3 Update Call Allegro – Addison, TX (a wholly owned community ) |
|
|
Forward-Looking Statements This presentation contains forward-looking statements, including discussion and analysis of the financial condition of Behringer Harvard Multifamily REIT I, Inc. (the “REIT”) and its subsidiaries and relating to the occurrence and timing of the REIT’s self-management transaction and other matters. These forward-looking statements are not historical facts but are the intent, belief or current expectations of the REIT’s management based on their knowledge and understanding of the REIT’s business and industry. Words such as “may,” “anticipates,” “expects,” “intends,” “plans,” “believes,” “seeks,” “estimates,” “would,” “could,” “should” and variations of these words and similar expressions are intended to identify forward-looking statements. We intend that such forward-looking statements be subject to the safe harbor provisions created by Section 27A of the Securities Act of 1933, as amended (the “Securities Act”), and Section 21E of the Securities Exchange Act of 1934, as amended (the “Exchange Act”). These statements are not guarantees of future performance and are subject to risks, uncertainties and other factors, some of which are beyond our control, are difficult to predict and could cause actual results to differ materially from those expressed or forecasted in the forward-looking statements. Forward-looking statements that were true at the time made may ultimately prove to be incorrect or false. We caution you not to place undue reliance on forward-looking statements, which reflect the REIT’s management's view only as of the date of this presentation. We undertake no obligation to update or revise forward-looking statements to reflect changed assumptions the occurrence of unanticipated events or changes to future operating results. |
|
|
Forward-Looking Statements Factors that could cause actual results to vary materially from any forward-looking statements made in this presentation include, but are not limited to: absence of a public market for the REIT’s securities; limited operating history; limited transferability and lack of liquidity; risks associated with lending activities; no assurance that distributions will continue to be made or that any particular rate of distribution will be maintained; until the proceeds from an offering are invested and generating cash flow from operating activities, some or all of the distributions will be paid from other sources, which may be deemed a return of capital, such as from the proceeds of an offering, cash advances by the advisor, cash resulting from a waiver of asset management fees, proceeds from the sales of assets, and borrowings in anticipation of future cash flow from operating activities, which could result in less proceeds to make investments in real estate; reliance on the program’s advisor; payment of significant fees to the advisor and their affiliates; potential conflicts of interest; lack of diversification in property holdings; market and economic challenges experienced by the U.S. economy or real estate industry as a whole and the local economic conditions in the markets in which our properties are located; the REIT’s ability to make accretive investments in a diversified portfolio of assets; availability of cash flow from operating activities for distribution; the REIT’s level of debt and the terms and limitations imposed on the REIT by its debt agreements; the availability of credit generally, and any failure to obtain debt financing at favorable terms or a failure to satisfy the conditions and requirements of that debt; the ability to secure resident leases at favorable rental rates; the ability to raise future capital through equity and debt security offerings and through joint venture arrangements; the ability to retain our executive officers and other key personnel of our advisor, our property manager and their affiliates; conflicts of interest arising out of our relationships with our advisor and its affiliates; the ability to successfully transition to a self-managed company; unfavorable changes in laws or regulations impacting our business, our assets or our key relationships; factors that could affect our ability to qualify as a real estate investment trust; potential development risks and construction delays; the potential inability to retain current tenants and attract new tenants due to a competitive real estate market; risk that a program’s operating results will be affected by economic and regulatory changes that have an adverse impact on a program’s investments; risks related to investments in distressed properties or debt include possible default under the original loan; unforeseen increases in operating and capital expenses; declines in real estate values; and, lack of availability of due diligence information. These risks may impact the REIT’s financial condition, operating results, returns to its shareholders, and ability to make distributions as stated in the REIT’s offering. Investment in securities of Behringer Harvard real estate programs is subject to substantial risks and may result in the loss of principal invested. Real Estate programs are not suitable for all investors. The forward looking statements should be read in light of these and other risk factors identified in the “Risk Factors” section of the REIT’s our Annual Report on Form 10-K for the year ended December 31, 2012 and in subsequent Quarterly Reports on Form 10-Q, as filed with the Securities and Exchange Commission. |
|
|
Questions? Live question and answer session after prepared remarks During the call, please e-mail questions to: bhreit@behringerharvard.com |

|
|
Today’s Presenters Robert S. Aisner Chief Executive Officer Mark T. Alfieri President and Chief Operating Officer Howard S. Garfield Chief Financial Officer |

|
|
Q3 Highlights Key operating metrics continue to improve Expenses related to self-management transaction impacted quarterly MFFO Sold one property for gross sales price of $35.3 million and recognized a $12.7 million gain on sale Deployed $157 million in development construction/acquisitions Acquired four development properties: The Alexan, Brickell, Shady Grove and Mission Gorge Closed on one new mezzanine loan with TDI Richardson |
|
|
U.S. Multifamily Rent Growth and Occupancies Source: Witten Advisors Used with permission from Witten Advisors LLC. Forecast 85% 90% 95% 100% 1Q95 1Q96 1Q97 1Q98 1Q99 1Q00 1Q01 1Q02 1Q03 1Q04 1Q05 1Q06 1Q07 1Q08 1Q09 1Q10 1Q11 1Q12 1Q13 1Q14 1Q15 1Q16 Occupancy -5% 0% 5% 10% Year-Year Effective Rent Growth Equilibrium Occupancy Occupancy Occupancy Forecast Rent Growth Rent Growth Forecast |
|
|
Annualized Multifamily Starts Used with permission from Witten Advisors LLC. Source: U.S. Department of Commerce; Witten Advisors 250 0 100 200 300 400 Jan-92 Jan-93 Jan-94 Jan-95 Jan-96 Jan-97 Jan-98 Jan-99 Jan-00 Jan-01 Jan-02 Jan-03 Jan-04 Jan-05 Jan-06 Jan-07 Jan-08 Jan-09 Jan-10 Jan-11 Jan-12 Jan-13 5+ Multifamily Units (monthly data, annualized, 000) Total 5+ Monthly Starts Rate Annualized, SA 3-Month Average |
|
|
Net Completions and Absorption Source: Witten Advisors Used with permission from Witten Advisors LLC. -300,000 -200,000 -100,000 0 100,000 200,000 300,000 400,000 1995 1996 1997 1998 1999 2000 2001 2002 2003 2004 2005 2006 2007 2008 2009 2010 2011 2012 2013 2014 2015 2016 Rental Apartment Units Net Absorption New Completions Net Completions |
|
|
Our Strategy Grow revenues and NOI through proactive property management Continuing to optimize rents and occupancy to grow revenues and NOI Keep focus on reduction or containment of operating costs Deploy remaining capital in development program Acquire new investments at cost Higher going-in yield than many stabilized acquisitions Make selective multifamily-related loans Take advantage of good interest rates and funding gaps from traditional sources Make opportunistic acquisitions of multifamily assets Emphasis on urban locations, highly amenitized Complete transition to self-management |
|
|
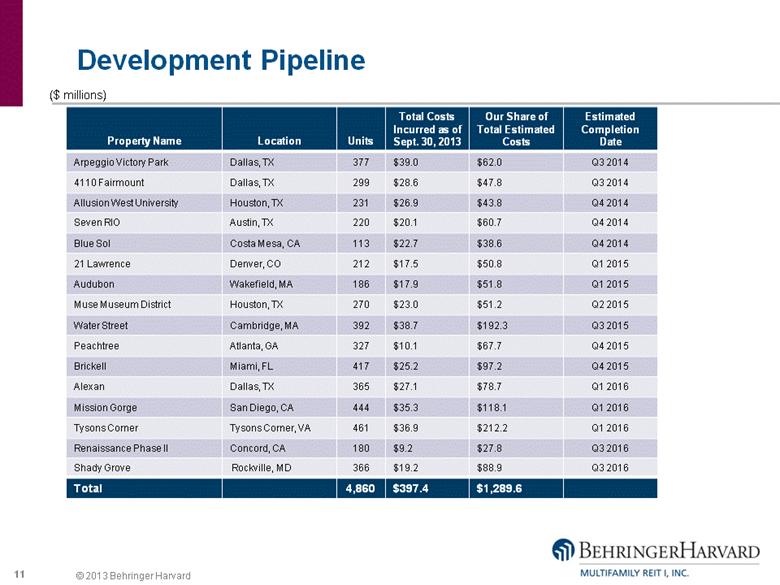
Development Pipeline Property Name Location Units Total Costs Incurred as of Sept. 30, 2013 Our Share of Total Estimated Costs Estimated Completion Date Arpeggio Victory Park Dallas, TX 377 $39.0 $62.0 Q3 2014 4110 Fairmount Dallas, TX 299 $28.6 $47.8 Q3 2014 Allusion West University Houston, TX 231 $26.9 $43.8 Q4 2014 Seven RIO Austin, TX 220 $20.1 $60.7 Q4 2014 Blue Sol Costa Mesa, CA 113 $22.7 $38.6 Q4 2014 21 Lawrence Denver, CO 212 $17.5 $50.8 Q1 2015 Audubon Wakefield, MA 186 $17.9 $51.8 Q1 2015 Muse Museum District Houston, TX 270 $23.0 $51.2 Q2 2015 Water Street Cambridge, MA 392 $38.7 $192.3 Q3 2015 Peachtree Atlanta, GA 327 $10.1 $67.7 Q4 2015 Brickell Miami, FL 417 $25.2 $97.2 Q4 2015 Alexan Dallas, TX 365 $27.1 $78.7 Q1 2016 Mission Gorge San Diego, CA 444 $35.3 $118.1 Q1 2016 Tysons Corner Tysons Corner, VA 461 $36.9 $212.2 Q1 2016 Renaissance Phase II Concord, CA 180 $9.2 $27.8 Q3 2016 Shady Grove Rockville, MD 366 $19.2 $88.9 Q3 2016 Total 4,860 $397.4 $1,289.6 ($ millions) |
|
|
Vara Acquisition – Case Study A six-story, 202-unit community acquired in July Located in the Mission district of San Francisco At acquisition, construction was complete but the property was not occupied Desirable location near a BART station in a neighborhood that has undergone rapid transformation and gentrification Purchase was partially financed using proceeds from the sale of a Portland property Projected rent growth rates much higher in San Francisco At acquisition on July 19th, property was vacant. As of November 18th the property was over 79% occupied |
|
|
Development Investments in Lease Up Property Name Location Units Total Costs Incurred as of Sept. 30, 2013 Completion Date Percentage Occupied as of Sept. 30, 2013 Percentage Occupied as of Nov. 18, 2013 Allegro Phase II Addison, TX 121 $15.2 Q4 2013 66.9% 93.4% The Franklin Delray Delray Beach, FL 180 $33.3 Q4 2013 27.7% 51.1% Total 301 $48.5 ($ millions) |
|
|
Loan Investments Property Name Investment Type Location Units Total Commitment Amounts Advanced at Sept. 30, 2013 Fixed Interest Rate Maturity Date Jefferson at One Scottsdale Mezzanine loan Scottsdale, AZ 388 $22.7 $22.7 14.5% December 2015 The Domain (1) Mezzanine loan Houston, TX 320 $10.5 $10.5 14.0% April 2014 Kendall Square Mezzanine loan Miami-Dade County, FL 321 $12.3 $12.3 15.0% January 2016 Jefferson Creekside (2) Mezzanine loan Allen, TX 444 $14.1 $14.1 14.5% August 2015 Jefferson Center Mezzanine loan Richardson, TX 360 $15.0 $7.0 15.0% September 2016 Total 1,833 $74.6 $66.6 14.5% ($ millions) Loan was repaid subsequent to September 30, 2013 (2) Represents 100% of the loan balance, the REIT‘s ownership is 55% . |
|
|
Geographic Distribution of Investments 56 Investments 33 Operating Properties 18 Developments 5 Mezzanine Loans Data is as of September 30, 2013. Gross GAAP costs reflect 100% of the properties regardless of the Company’s ownership and represent total property costs before depreciation or amortization. |
|
|
Current Portfolio vs. Future Portfolio Total Property Costs * These amounts include total estimated costs for equity development investments as of September 30, 2013 and could be subject to change based on market conditions, dispositions and future investment activity. |
|
|
Rental Income Growth – 2012 vs. 2013 |
|
|
Same Store Trends There were 29 stabilized comparable properties in the 3rd quarter year over year comparison. Monthly rental revenue per unit has been calculated based on the leases in effect as of September 30, 2012 and 2013 for the applicable comparable properties. Monthly rental revenue per unit only includes base rents for the occupied units, including affordable housing payments and subsidies, and does not include other charges for storage, parking, pets, cleaning, clubhouse or other miscellaneous amounts. |
|
|
*Reconciliations of Loss from continuing operations to Same Store Net Operating Income can be found in the Current Report on Form 8-K filed on November 21, 2013 with the Securities and Exchange Commission. A copy of this filing is available on the website maintained for us at www.behringerharvard.com. Same Store Net Operating Income* Trends There were 29 stabilized comparable properties in the 3rd quarter year over year comparison. |
|
|
Performance Comparison with Exchange Listed Apartment REITs Same Store Q3 2013 vs. Q3 2012 Company Name Ticker SS Revenue Change (%) SS Expense Change (%) SS NOI Change (%) Associated Estates AEC 3.0 -1.7 6.1 AIMCO* AIV 4.4 1.6 5.9 Avalon Bay AVB 3.9 3.3 4.2 BRE Properties BRE 4.6 3.2 5.3 Camden CPT 4.3 2.1 5.6 Equity Residential EQR 4.1 3.1 4.5 Essex ESS 6.5 2.8 8.4 Home Properties HME 2.6 1.4 3.2 Mid-America MAA 4.0 3.3 4.6 Post Properties PPS 3.2 3.7 2.8 UDR UDR 4.9 2.6 6.0 Lowest 2.6 -1.7 2.8 Average 4.1 2.3 5.2 Highest 6.5 3.7 8.4 Behringer Harvard Multifamily REIT I 6.0 3.6 7.6 * Reflects AIMCO’s conventional same store change (excludes affordable component). Source: SNL |
|
|
Total Rental Revenue Note: Includes consolidated and unconsolidated joint venture communities. |
|
|
GAAP Net Income(Loss) Attributable to Common Stockholders |
|
|
MFFO* Trends *Reconciliations of Net Loss to FFO to MFFO can be found in the Current Report on Form 8-K filed on November 21, 2013 with the Securities and Exchange Commission. A copy of this filing is available on the website maintained for us at www.behringerharvard.com. **Weighted average number of common shares outstanding were 168.9 million and 166.4 million for the quarter ended September 30, 2013 and 2012, respectively, and 168.6 million and 165.8 million for the nine months ended September 30, 2013 and 2012, respectively. |
|
|
Cash Flow from Operations Year to date growth due to: Improvements in operations Increase in average rent Excludes proceeds from sales 27% Increase |
|
|
Debt Financing Obtained a $53.5 million construction loan with a fixed rate of 4.0%(1) As of 9/30/13, the REIT’s weighted average interest rate was 3.7% Note: Includes 100% of property debt balances regardless of our ownership. (1) Represents The Alexan construction loan. As of September 30, 2013, $12.6 million has been drawn. |
|
|
Net Property Investment vs. Cash Available (property investments less debt) |
|
|
Multifamily REIT I, Inc. Investments Burnham Pointe – Chicago, IL The Cameron – Silver Spring, MD Uptown Post Oak – Houston, TX Bailey’s Crossing– Alexandria, VA Burnham Pointe, Uptown Post Oak, and The Reserve at La Vista Walk are wholly owned communities. Bailey’s Crossing, The Cameron, and Skye 2905 Urban Flats are joint venture owned communities. The Reserve at La Vista Walk – Atlanta, GA Skye 2905 Urban Flats – Denver, CO |
|
|
Questions? Press *1 to enter the queue Please ask one question and a follow-up question Re-enter the queue to ask further questions You may also e-mail questions to: bhreit@behringerharvard.com |
|
|
Playback Information Investors may dial toll free (855) 859-2056 and use conference ID 83612491 to access a playback of today’s call Representatives may log on to the password protected portion of the Behringer Harvard website (www.behringerharvard.com) for a playback of today’s call Replays will be available through Friday, December 27, 2013 |