Attached files
| file | filename |
|---|---|
| 8-K - 8-K - Beneficial Mutual Bancorp Inc | a13-24146_18k.htm |
Exhibit 99.1
|
|
BENEFICIAL MUTUAL BANCORP SANDLER O’NEILL & PARTNERS EAST COAST FINANCIAL SERVICES CONFERENCE NOVEMBER 14, 2013 |
|
|
2 SAFE HARBOR STATEMENT THIS PRESENTATION MAY CONTAIN PROJECTIONS AND OTHER “FORWARD-LOOKING STATEMENTS” WITHIN THE MEANING OF THE FEDERAL SECURITIES LAWS. THESE STATEMENTS ARE NOT HISTORICAL FACTS, RATHER STATEMENTS BASED ON THE CURRENT EXPECTATIONS OF BENEFICIAL MUTUAL BANCORP, INC. (THE “COMPANY”) REGARDING ITS BUSINESS STRATEGIES, INTENDED RESULTS AND FUTURE PERFORMANCE. FORWARD-LOOKING STATEMENTS ARE PRECEDED BY TERMS SUCH AS “EXPECTS,” “BELIEVES,” “ANTICIPATES,” “INTENDS” AND SIMILAR EXPRESSIONS. MANAGEMENT’S ABILITY TO PREDICT RESULTS OR THE EFFECT OF FUTURE PLANS OR STRATEGIES IS INHERENTLY UNCERTAIN. FACTORS THAT COULD AFFECT ACTUAL RESULTS INCLUDE INTEREST RATE TRENDS, THE GENERAL ECONOMIC CLIMATE IN THE MARKET AREA IN WHICH THE COMPANY OPERATES, AS WELL AS NATIONWIDE, THE COMPANY’S ABILITY TO CONTROL COSTS AND EXPENSES, COMPETITIVE PRODUCTS AND PRICING, LOAN DELINQUENCY RATES, CHANGES IN FEDERAL AND STATE LEGISLATION AND REGULATION AND OTHER FACTORS THAT MAY BE DESCRIBED IN THE COMPANY’S FILINGS WITH THE SECURITIES AND EXCHANGE COMMISSION, INCLUDING ITS ANNUAL REPORTS ON FORM 10-K AND QUARTERLY REPORTS ON FORM 10-Q AND OTHER REQUIRED FILINGS. THESE FACTORS SHOULD BE CONSIDERED IN EVALUATING THE FORWARD-LOOKING STATEMENTS AND UNDUE RELIANCE SHOULD NOT BE PLACED ON SUCH STATEMENTS. THE COMPANY ASSUMES NO OBLIGATION TO UPDATE ANY FORWARD-LOOKING STATEMENTS. THIS PRESENTATION INCLUDES INTERIM AND UNAUDITED FINANCIALS, WHICH ARE SUBJECT TO FURTHER REVIEW BY THE COMPANY’S INDEPENDENT ACCOUNTANTS. |
|
|
3 PRESENTATION TOPICS OUR MARKET CURRENT FOCUS Q3 2013 FINANCIAL HIGHLIGHTS OTHER MATTERS |
|
|
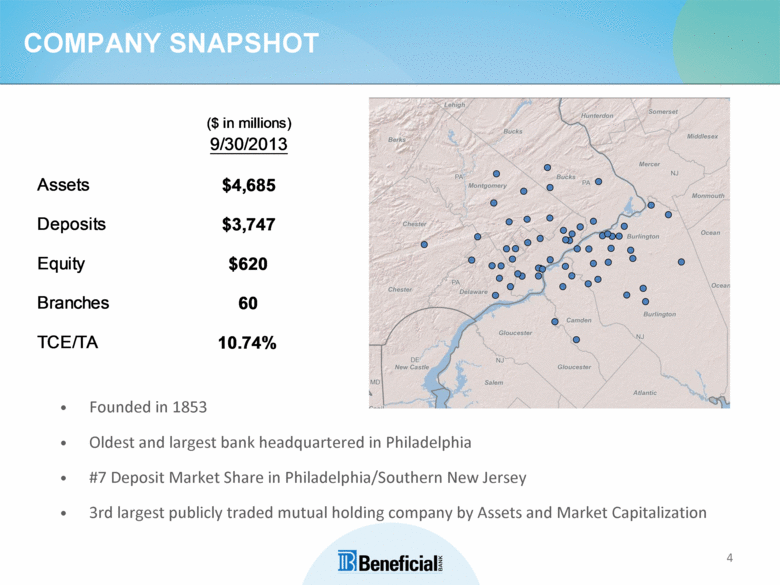
4 COMPANY SNAPSHOT Founded in 1853 Oldest and largest bank headquartered in Philadelphia #7 Deposit Market Share in Philadelphia/Southern New Jersey 3rd largest publicly traded mutual holding company by Assets and Market Capitalization ($ in millions) 9/30/2013 Assets Deposits Equity Branches TCE/TA $4,685 $3,747 $620 60 10.74% |
|
|
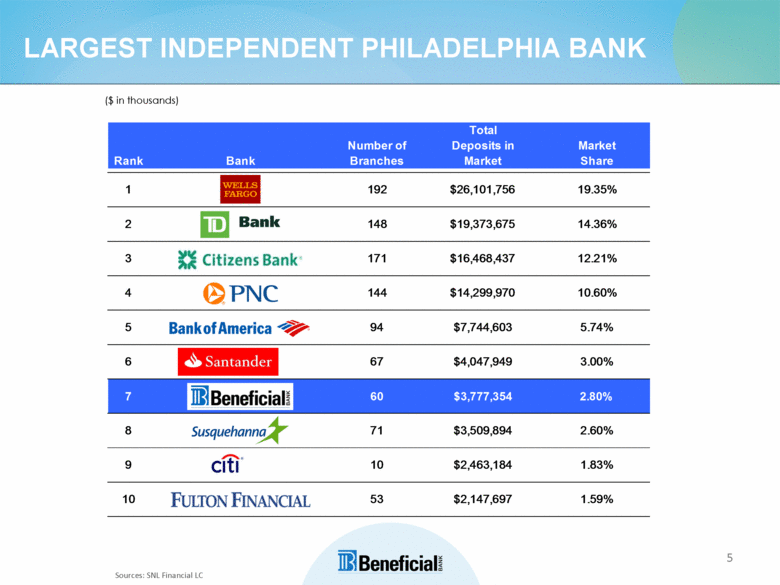
5 LARGEST INDEPENDENT PHILADELPHIA BANK Sources: SNL Financial LC ($ in thousands) Rank Bank Number of Branches Total Deposits in Market Market Share 192 148 171 144 94 67 60 71 10 53 $26,101,756 $19,373,675 $16,468,437 $14,299,970 $7,744,603 $4,047,949 $3,777, 354 $3,509,894 $2,463,184 $2,147,697 19.35% 14.36% 12.21% 10.60% 5.74% 3.00% 2.80% 2.60% 1.83% 1.59% |
|
|
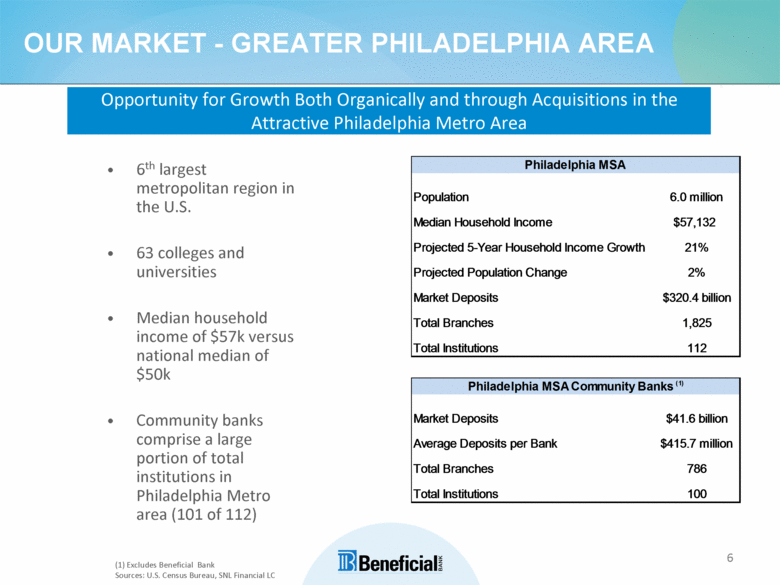
6 OUR MARKET - GREATER PHILADELPHIA AREA (1) Excludes Beneficial Bank Sources: U.S. Census Bureau, SNL Financial LC Opportunity for Growth Both Organically and through Acquisitions in the Attractive Philadelphia Metro Area 6th largest metropolitan region in the U.S. 63 colleges and universities Median household income of $57k versus national median of $50k Community banks comprise a large portion of total institutions in Philadelphia Metro area (101 of 112) Population Total Institutions112 Philadelphia MSA Total Branches1,825 Market Deposits$320.4 billion Projected Population Change 2% Projected 5-Year Household Income Growth21% Median Household Income $57,132 6.0 million Market Deposits$41.6 billion Average Deposits per Bank$415.7 million Total Branches 786 100 Total institutions Philadelphia MSA Community Banks (1) |
|
|
7 OUR MARKET – GREATER PHILADELPHIA AREA We operate in a dynamic medium between regional and super regional competitors, and local community banks Large enough to compete with the largest financial institutions There are 112 banking institutions in the Philadelphia Metro Area including Beneficial 83 of these institutions have less than 10 branch locations Only 10 of these institutions including Beneficial have more than 50 branch locations Beneficial is positioned to take advantage of marketplace consolidation Enough pre-second step capital for another acquisition to either enhance existing branch footprint or strategically grow in other key Philadelphia/Southern New Jersey markets Also targeting fee based businesses such as specialty finance, wealth management and insurance |
|
|
8 PRESENTATION TOPICS OUR MARKET CURRENT FOCUS Q3 2013 FINANCIAL HIGHLIGHTS OTHER MATTERS |
|
|
9 CURRENT FOCUS – PROFITABILITY & ASSET QUALITY Improve profitability Investing in talent, brand and technology which may result in lower profitability in the short-term, but we believe will drive future profitability and value to shareholders Expanding C&I and CRE teams to organically grow loan portfolio Investing in new small business platform and growing small business lending team Increasing focus and coverage of our mortgage banking team Improving balance sheet mix Loan and deposit pricing Focused on operating efficiency and cost structure Asset quality Continue to reduce non-performing asset levels Improvement in asset quality metrics resulting in provision for loan loss reduction Maintaining strong reserves to total loans and non-performing loans Maintaining prudent underwriting standards for new originations |
|
|
10 CURRENT FOCUS – COMMERICAL LENDING New Commercial Lending Organizational Structure in place Created separate Commercial Real Estate and C&I teams, as well as a new Business Development group Recruiting/building Commercial Real Estate, C&I, and Small Business lending teams (goal of adding 12-15 new lenders) Targeting in-market relationship building and maximizing opportunities from existing relationships |
|
|
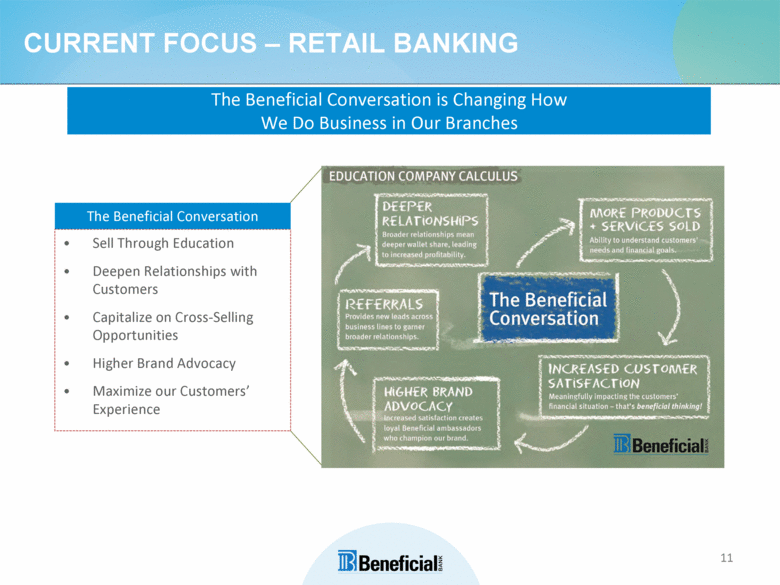
11 CURRENT FOCUS – RETAIL BANKING The Beneficial Conversation is Changing How We Do Business in Our Branches Sell Through Education Deepen Relationships with Customers Capitalize on Cross-Selling Opportunities Higher Brand Advocacy Maximize our Customers’ Experience The Beneficial Conversation |
|
|
12 CURRENT FOCUS – MARKETING/BRAND Launched a new marketing campaign and brand refresh in October: “YOUR KNOWLEDGE BANK” Highlighting Beneficial’s commitment to financial education Initiative is focused on communicating our core mission to provide customers with the tools, knowledge and guidance to help them do what’s right and make wise financial decisions |
|
|
13 CURRENT FOCUS – RETAIL BANKING Continue to provide superior customer service as recognized by J.D. Power and Associates as # 1 in Retail Banking in the Mid-Atlantic Region and # 2 in the U.S. Align our products and services to our customers’ needs Mobile Banking – New BenMobile application launched during the quarter Bill Pay Remote Deposit Capture Devon and Springfield campuses opened in the first quarter of 2013. Two additional campuses being constructed late 2013; early 2014. Improve pricing and mix of deposits |
|
|
14 CURRENT FOCUS – MORTGAGE BANKING Dedicated team of mortgage banking lenders (12) Continue to build team out in all counties throughout our footprint with the goal of doubling the group by the end of 2014 Representatives develop relationships in our footprint and support our branch network; no out-of-market origination $147.5 million of mortgage originations as of September 30, 2013 |
|
|
15 CURRENT FOCUS – CAPITAL & OPERATIONS Capital Strength Maintain strong capital levels to allow strategic flexibility Continue fundamental organic growth Exceed all current and future regulatory requirements (BASEL III) Capital Management Active balance sheet management Invest into profitable businesses Share repurchases Operations Invest in and leverage IT platform to improve efficiency and control Enhance risk management and compliance functions to respond to changing regulations which will put some pressure on profitability in the short-term |
|
|
16 PRESENTATION TOPICS OUR MARKET CURRENT FOCUS Q3 2013 FINANCIAL HIGHLIGHTS OTHER MATTERS |
|
|
17 Q3 2013 HIGHLIGHTS Reduced non-performing loans, excluding government guaranteed student loans, by $27.1 million, or 35%, to $50.3 million, as compared to September 30, 2012 Net charge-offs decreased by 51.3% to $3.3 million, as compared to the quarter ended September 30, 2012 As a result of the improvement in our asset quality metrics, the provision for loan loss was reduced by $5.5 million and $10.5 million for the quarter and nine months ended September 30, 2013, compared to the prior year Launched a new marketing campaign, “Your Knowledge Bank”, and brand refresh designed to highlight the Bank’s commitment to financial education Introduced the New BenMobile application, bringing online features including balance transfers and remote deposit capture to our Mobile Banking customers |
|
|
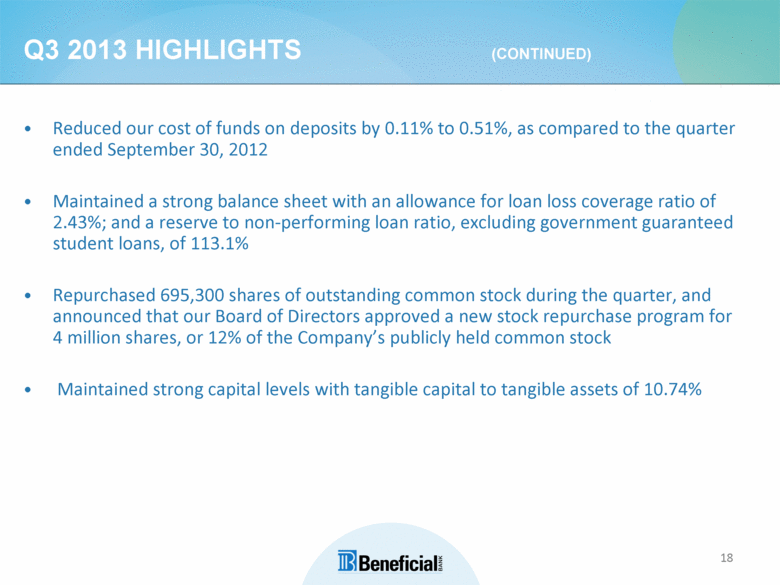
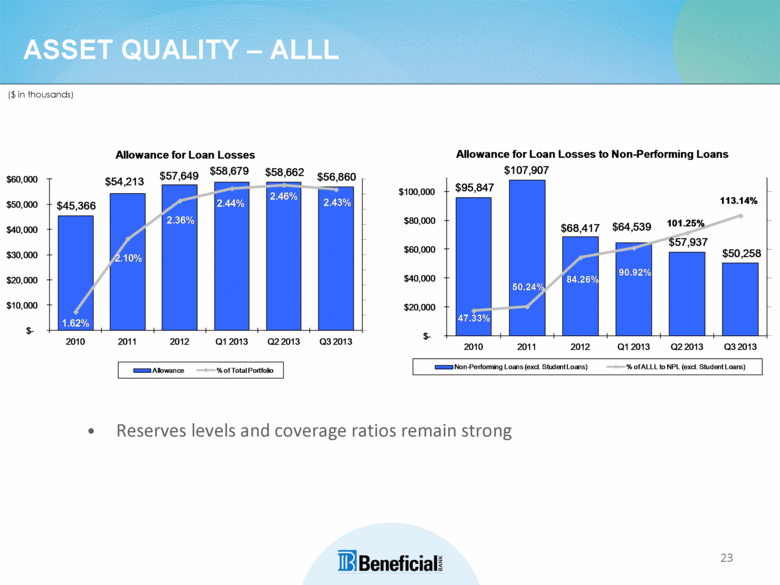
18 Q3 2013 HIGHLIGHTS (CONTINUED) Reduced our cost of funds on deposits by 0.11% to 0.51%, as compared to the quarter ended September 30, 2012 Maintained a strong balance sheet with an allowance for loan loss coverage ratio of 2.43%; and a reserve to non-performing loan ratio, excluding government guaranteed student loans, of 113.1% Repurchased 695,300 shares of outstanding common stock during the quarter, and announced that our Board of Directors approved a new stock repurchase program for 4 million shares, or 12% of the Company’s publicly held common stock Maintained strong capital levels with tangible capital to tangible assets of 10.74% |
|
|
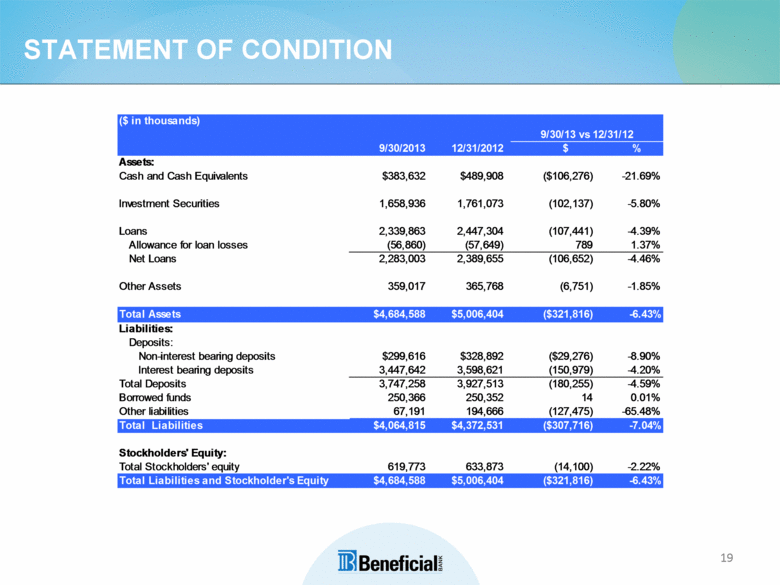
19 STATEMENT OF CONDITION ($ in thousands) |
|
|
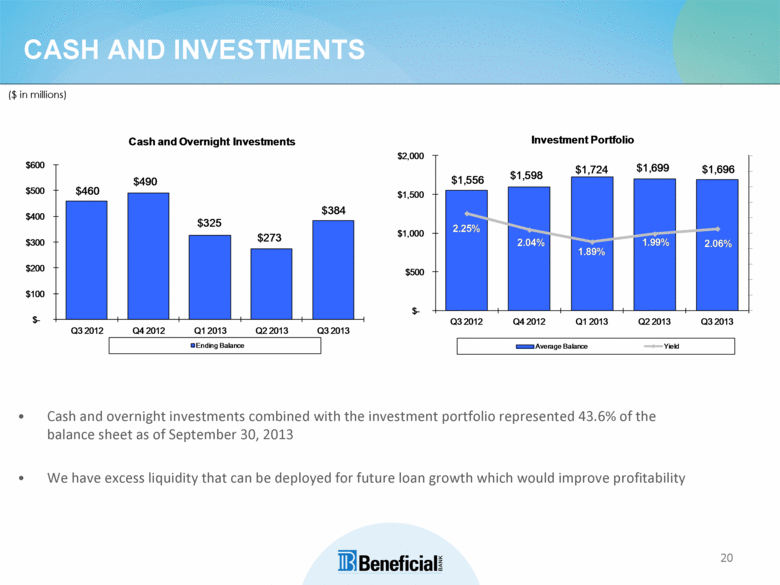
20 CASH AND INVESTMENTS ($ in millions) Cash and overnight investments combined with the investment portfolio represented 43.6% of the balance sheet as of September 30, 2013 We have excess liquidity that can be deployed for future loan growth which would improve profitability |
|
|
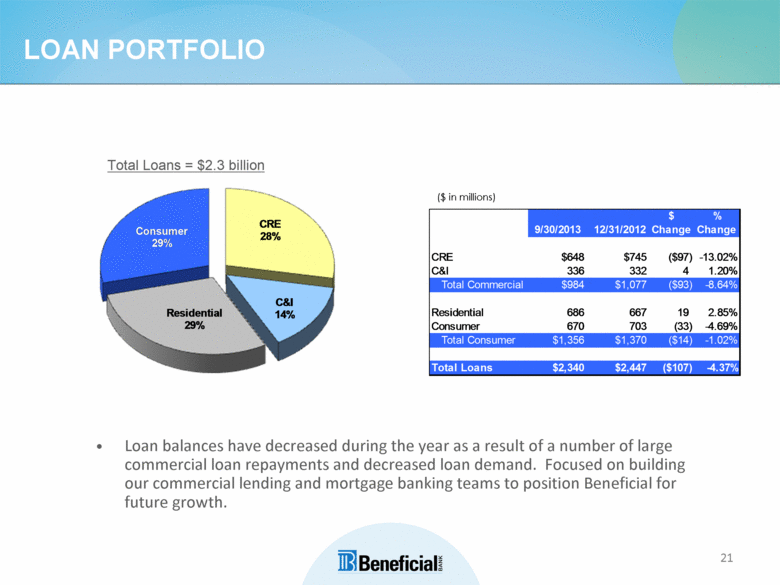
21 LOAN PORTFOLIO Total Loans = $2.3 billion ($ in millions) Loan balances have decreased during the year as a result of a number of large commercial loan repayments and decreased loan demand. Focused on building our commercial lending and mortgage banking teams to position Beneficial for future growth. |
|
|
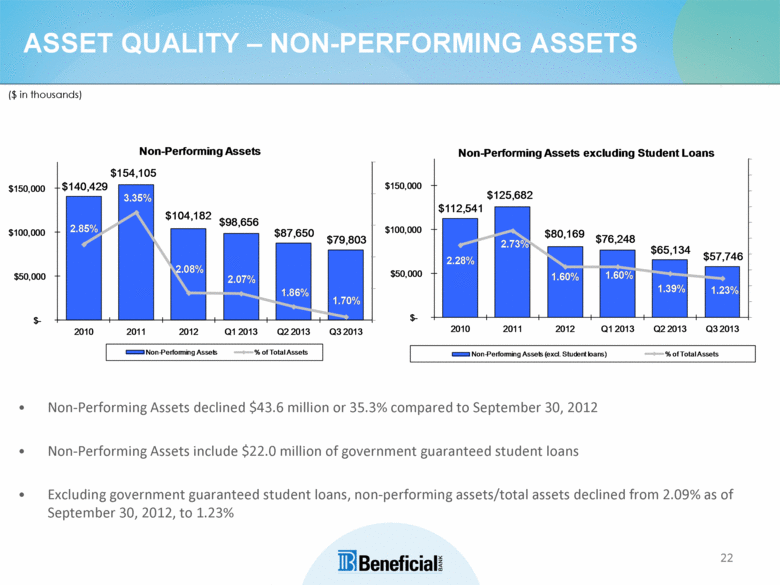
22 ASSET QUALITY – NON-PERFORMING ASSETS ($ in thousands) Non-Performing Assets declined $43.6 million or 35.3% compared to September 30, 2012 Non-Performing Assets include $22.0 million of government guaranteed student loans Excluding government guaranteed student loans, non-performing assets/total assets declined from 2.09% as of September 30, 2012, to 1.23% |
|
|
23 ASSET QUALITY – ALLL ($ in thousands) Reserves levels and coverage ratios remain strong |
|
|
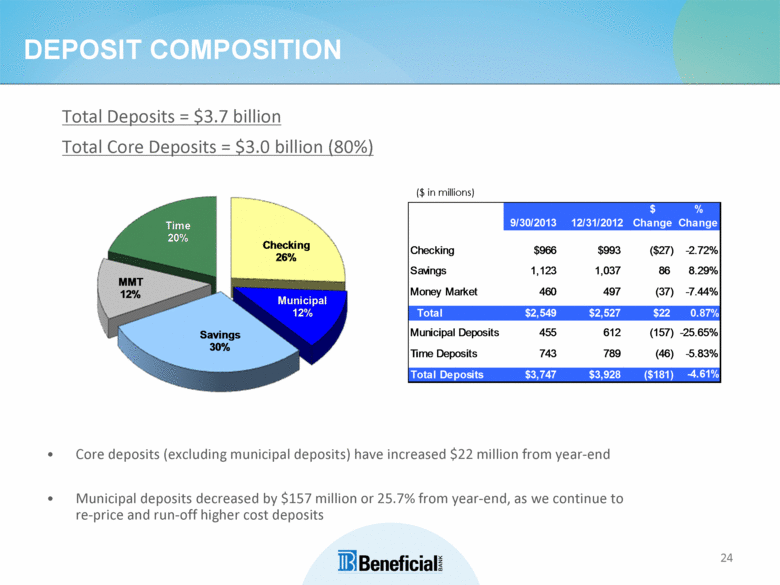
24 DEPOSIT COMPOSITION ($ in millions) Total Deposits = $3.7 billion Total Core Deposits = $3.0 billion (80%) Core deposits (excluding municipal deposits) have increased $22 million from year-end Municipal deposits decreased by $157 million or 25.7% from year-end, as we continue to re-price and run-off higher cost deposits |
|
|
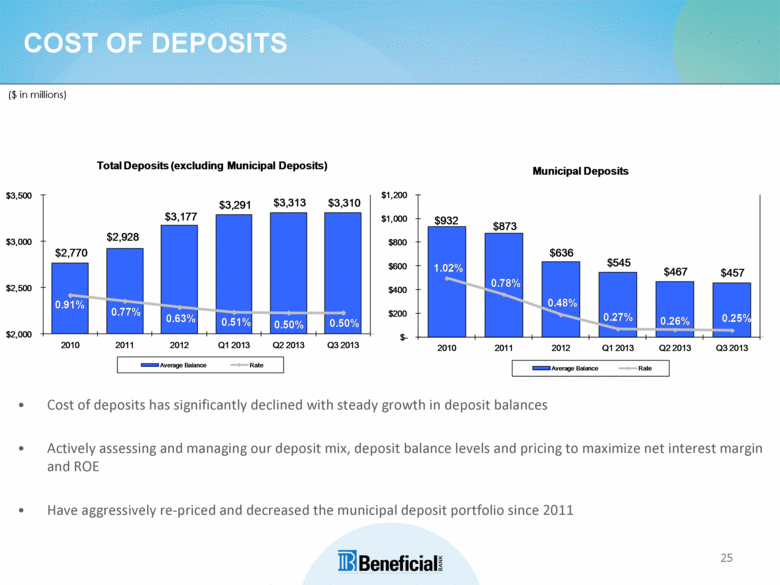
25 COST OF DEPOSITS ($ in millions) Cost of deposits has significantly declined with steady growth in deposit balances Actively assessing and managing our deposit mix, deposit balance levels and pricing to maximize net interest margin and ROE Have aggressively re-priced and decreased the municipal deposit portfolio since 2011 $3,500 $3,000 $2,500 $2,000 $2,770 $2,928 $3,177 $3,291 $3,313 $3,310 $200 $400 $600 $800 $1,000 $1,200 $- $932 $873 $636 $545 $467 $457 1.02% 0.78% 0.48% 0.27% 0.26% 0.25% 0.91% 0.77% 0.63% 0.51% 0.50% 0.50% 201020112012Q1 2013Q2 2013Q3 2013 2010 2011 2012Q1 2013Q2 2013Q3 2013 |
|
|
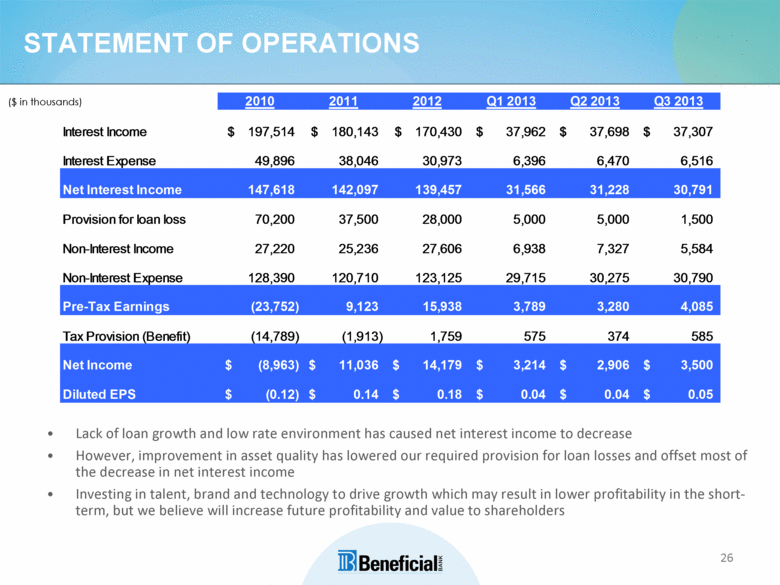
26 STATEMENT OF OPERATIONS Lack of loan growth and low rate environment has caused net interest income to decrease However, improvement in asset quality has lowered our required provision for loan losses and offset most of the decrease in net interest income Investing in talent, brand and technology to drive growth which may result in lower profitability in the short-term, but we believe will increase future profitability and value to shareholders ($ in thousands) 2010 2011 2012Q1 2013Q2 2013Q3 2013 Interest Income Interest Expense 49,896 38,046 30,973 6,396 6,470 6,516 $197,514$ $180,143 $ 170,430 $ 37,962 $ 37,698 $ 37,307 Net Interest Income 147,618 142,097 139,457 31,566 31,228 30,791 Provision for loan loss70,200 37,500 28,000 5,000 5,000 1,500 Non-Interest Income 27,220 25,236 27,606 6,938 7,327 5,584 Non-Interest Expense 128,390 120,710 123,125 29,715 30,275 30,790 Pre-Tax Earnings (23,752) 9,123 15,938 3,789 3,280 4,085 Tax Provision (Benefit) (14,789) (1,913) 1,759 575 374 585 Net Income (8,963) $11,036 $14,179 $3,214 $2,906 $3,500 Diluted EPS $(0.12) $0.14 $0.18 $0.04 $0.04 $0.05 |
|
|
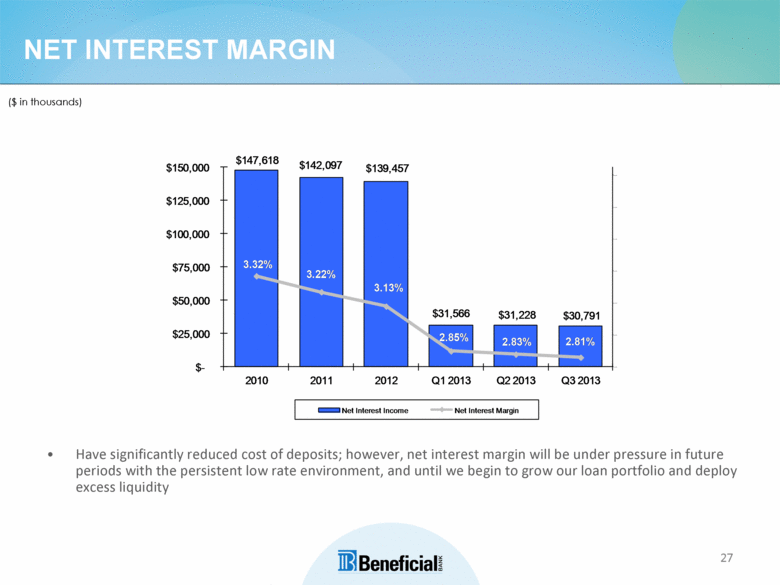
27 NET INTEREST MARGIN Have significantly reduced cost of deposits; however, net interest margin will be under pressure in future periods with the persistent low rate environment, and until we begin to grow our loan portfolio and deploy excess liquidity ($ in thousands) $-$25,000 $50,000 $75,000 $100,000 $125,000 $150,000 $147,618 $142,097 $139,457 $31,566 $31,228 $30,791 2010 2011 2012Q1 2013Q2 2013Q3 2013 3.32% 3.22% 3.13% 2.85% 2.83% 2.81% |
|
|
28 CAPITAL LEVELS REMAIN STRONG ($ in millions) Tangible Common Equity to Tangible Assets Tier 1 Risked Based Capital 2010 2011 2012Q3 2013 10.16% 11.30% 10.30% 10.74% 0 100 200 300 400 500 600 2010 2011 2012Q3 2013 $432 $443 $455 $467 15.69% 18.09% 20.92% 19.23% $296 $313 $333 $267 $147 $142 $134 $165 Tier 1 Leverage Total Risk Based Capital Ratio 0 100 200 300 400 500 600 0 100 200 300 400 500 600 2010 2011 2012Q3 2013 $432 $443 $455 $467 $243 $229 $239 $228 $189 $214 $216 8.89% 9.67% 9.53% 10.25% $467 $473 $484 $49 22.18% $191 $229 20.50% 19.35% $248 $272 16.95% $244 $236 $223 Well Capitalized Excess Actual Ratio Well Capitalized Excess Actual Ratio Well Capitalized Excess Actual Ratio |
|
|
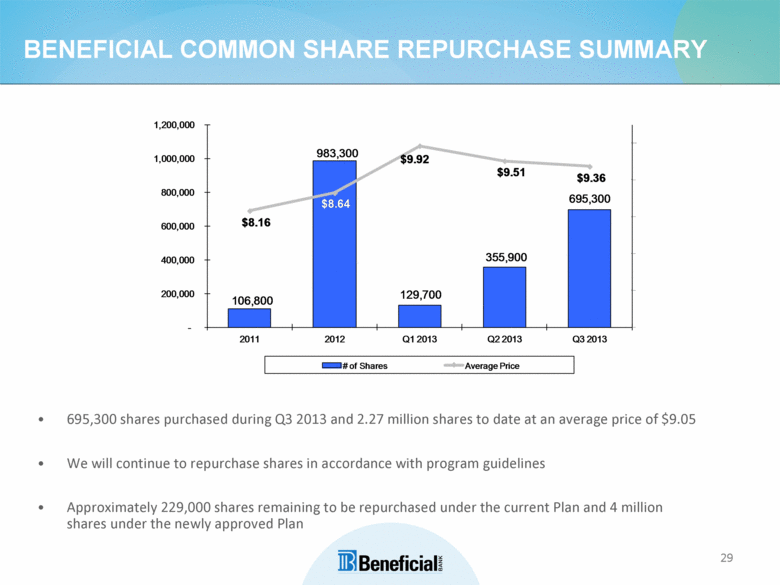
29 BENEFICIAL COMMON SHARE REPURCHASE SUMMARY 695,300 shares purchased during Q3 2013 and 2.27 million shares to date at an average price of $9.05 We will continue to repurchase shares in accordance with program guidelines Approximately 229,000 shares remaining to be repurchased under the current Plan and 4 million shares under the newly approved Plan - 200,000 400,000 600,000 800,000 1,000,000 1,200,000 2011 2012 Q1 2013 Q2 2013 Q3 2013 106,800 129,700 355,900 695,300 $8.16 983,300 $8.64 $9.92 $9.51 $9.36 # of Shares Average Price |
|
|
30 PRESENTATION TOPICS OUR MARKET CURRENT FOCUS Q3 2013 FINANCIAL HIGHLIGHTS OTHER MATTERS |
|
|
31 OTHER MATTERS Beneficial was notified by the U.S. Department of Justice (the “DOJ”) that it had initiated an investigation of the Bank under the Equal Credit Opportunity Act and the Fair Housing Act The investigation resulted from a referral by the Federal Deposit Insurance Corporation (FDIC) and focuses on the Bank’s origination of home equity and mortgage loans Since the investigation is in its early stages, we cannot predict the eventual outcome of the DOJ investigation or any impact on our future operations or financial results We hired outside counsel and an economist to conduct an internal investigation, and at this time to the best of our knowledge we are not aware of any wrongdoing Until the investigation is completed, it is unlikely that Beneficial will be filing any regulatory applications related to strategic expansion or regarding a second step conversion, which the Board had been actively evaluating |
|
|
32 |

