Attached files
| file | filename |
|---|---|
| 8-K - 8-K - WireCo WorldGroup Inc. | q3_investorxcallxslides.htm |

Investor Call Q3 2013 Review

Cautionary Statement Forward-Looking Statements This presentation contains statements that relate to future events and expectations and as such constitute forward-looking statements. Forward-looking statements include those containing such words as “anticipates,” “estimates,” “expects,” “forecasts,” “intends,” “outlook,” “plans,” “projects,” “should,” “targets,” “will,” or other words of similar meaning. All statements that reflect our expectations, assumptions, or projections about the future other than statements of historical fact are forward-looking statements. Our risk factors are included in Item IA of our annual report on Form 10-K for the year ended December 31, 2012. We disclaim any obligation to update publicly any forward-looking statements, whether in response to new information, future events or otherwise, except as required by applicable law. Non-GAAP Financial Measures Some of the information included in this presentation is derived from our consolidated financial information but is not presented in our financial statements prepared in accordance with U.S. generally accepted accounting principles (GAAP). Certain of these data are considered “Non-GAAP Financial Measures” under SEC rules. These Non-GAAP Financial Measures supplement our GAAP disclosures and should not be considered an alternative to the GAAP measure. Reconciliations to the most directly comparable GAAP financial measures can be found in the Appendix to this presentation. These Non-GAAP Financial Measures are provided as a means to enhance communications with security holders by providing additional information regarding our operating results and liquidity. Management uses these Non-GAAP Financial Measures in evaluating the company’s performance and in determining debt covenant calculations. Any reference during the discussion today to EBITDA means Adjusted EBITDA or Acquisition Adjusted EBITDA, for which we have provided reconciliations in the Appendix. 2

WireCo WorldGroup Overview Steel (77%) Large diameter, highly engineered rope and electrical signal transmission cable Engineered specialty wire products used in general industrial end markets Highly engineered, made-to-order synthetic ropes and technical products that have strength characteristics of steel but weigh significantly less Synthetic (23%) 3 Highly engineered plastic molding from recycled materials used in a variety of industrial, structural and oil and gas applications Rope (72% of Sales) Broad Product Offering Specialty Wire (16% of Sales) Engineered Products (12% of Sales) Rope: Diverse End Market Applications Oil & Gas Commercial & Industrial Fishing Marine Mining Structures 3 Note: Product as a % of Q3 2013 sales

Q3 Performance 4 Q3 Revenue increased over Q2 ‒ Q3’13 revenue $203.8 million vs. Q2’13 of $189.8 EBITDA Growth with improved margins ‒ Generated quarterly EBITDA growth of $4.7 million or 15.2% growth vs. Q2’13 ‒ Improved margins 16.3% in Q2’13 versus 17.5% Q3’13 - cost management Free Cash Flow of $33 million; working capital reductions ‒ Reduced $12 million of working capital from prior quarter ‒ Dropped NWC as % of sales from 40.3% in Q2 to 39.1% in Q3 Continued focused on key management initiatives ‒ Build leadership ‒ Sales growth ‒ Margin improvement ‒ Cash generation
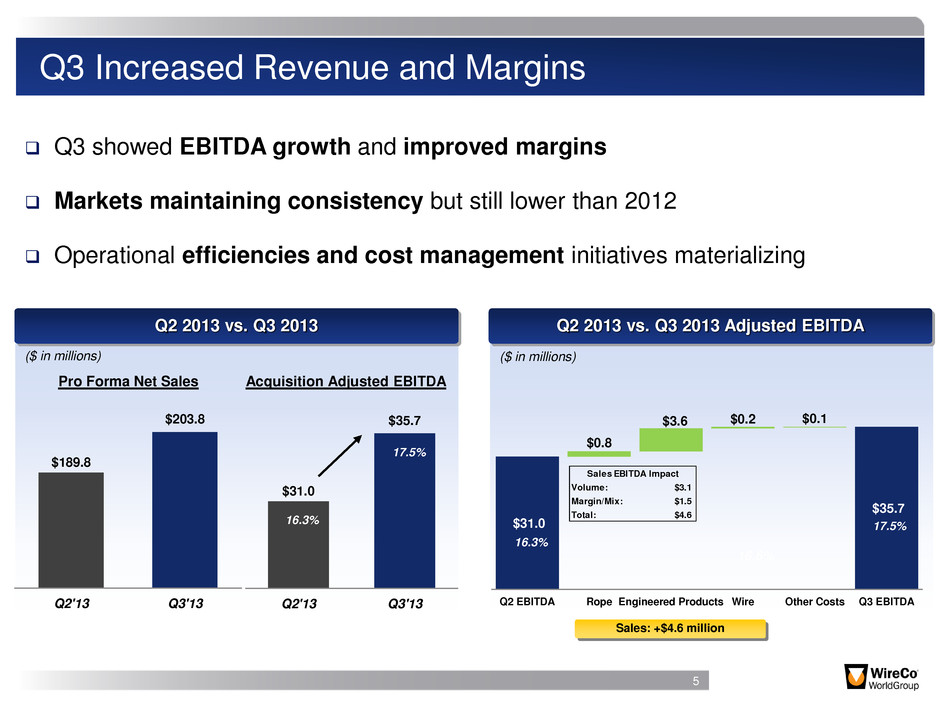
$189.8 $203.8 Q2'13 Q3'13 $31.0 $35.7 Q2'13 Q3'13 Q3 Increased Revenue and Margins 5 Q3 showed EBITDA growth and improved margins Markets maintaining consistency but still lower than 2012 Operational efficiencies and cost management initiatives materializing ($ in millions) Q2 2013 vs. Q3 2013 Adjusted EBITDA Sales: +$4.6 million Q2 2013 vs. Q3 2013 16.3% 17.5% 16.6% 17.5% Pro Forma Net Sales Acquisition Adjusted EBITDA 16.3% $31.0 $35.7 $0.8 $3.6 $0.2 $0.1 Q2 EBITDA Rope Engineered Products Wire Other Costs Q3 EBITDA 16.3% 17.5% ($ in millions) Sales EBITDA Impact Volume: $3.1 Margin/Mix: $1.5 Total: $4.6

$333 $321 Q2'13 Q3'13 Q3 Free Cash Flow Generation of $33 Million 6 High conversion of EBITDA to free cash flow ($33.3 million FCF) Working Capital reductions produced positive free cash flow $3 million non-cash impact from inventory optimization ($ in millions) 16.3% 17.5% 40.3% 39.1% $889.3 $856.0 Q2'13 Q3'13 Q2 2013 vs. Q3 2013 Net Debt Q2 2013 vs. Q3 2013 Adjusted Working Capital $33.3M Free Cash Flow $12M Reduction ($ in millions) ($ in millions)

226 246 233 242 253 253 268 248 239 244 235 123 123 124 134 127 130 144 137 128 150 139 100 110 120 130 140 150 160 200 210 220 230 240 250 260 270 280 Q1'11 Q2'11 Q3'11 Q4'11 Q1'12 Q2'12 Q3'12 Q4'12 Q1'13 Q2'13 Q3'13 DSI $ ( in m illio ns) Inventory, net Days sales in inventory (DSI) Linear (Inventory, net) Q1'11 Q2'11 Q3'11 Q4'11 Q1'12 Q2'12 Q3'12 Q4'12 Q1'13 Q2'13 Q3'13 n/a n/a n/a 34.1% 36.6% 37.6% 38.0% 36.3% 38.0% 40.3% 39.1% NWC % of TTM Sales Working Capital Reductions Successful in Q3 7 Working Capital decreased by $12 million from Q2 2013 Successfully reduced working capital to 39% of sales Increased accountability for Inventory and Accounts Receivable; opportunity in Accounts Payable A/P Inventory Working Capital A/R 307 335 318 303 332 336 337 318 329 333 321 145 147 151 147 140 153 165 157 153 181 167 0 20 40 60 80 100 120 140 160 180 200 280 290 300 310 320 330 340 Q1 '11Q2 '11Q3 '11Q4 '11Q1 '12Q2 '12Q3 '12Q4 '12Q1 '13Q2 '13Q3 '13 Cash Conv ersion$ ( in m illio ns) NWC Cash conversion cycle Linear (NWC) 87 83 7 88 87 84 91 83 84 83 74 47 41 37 48 44 43 49 46 45 51 44 2 12 22 32 42 52 62 - 10 20 30 40 50 60 70 80 90 100 Q1 '11 Q2 '11 Q3' 11 Q4 ' 1 Q1 ' 2 Q2 ' 2 Q3 '12 Q4 '12 Q '13 Q2 '13 Q3 '13 DPO $ ( in m illion s) AP Days payables outstanding (DPO) Linear (AP) 168 172 155 149 166 167 160 153 174 172 160 70 65 64 61 65 66 70 66 70 82 71 2 12 22 32 42 52 62 72 82 92 135 140 145 150 155 160 165 170 175 180 Q1 '1 Q2 '1 ' 11 Q4 '11 Q1 '12 Q2 '12 Q3 '12 Q4 '12 Q1 '13 Q2 '13 Q3 '13 DSO $ ( in m illio ns) AR Days sales outstanding (DSO) Linear (AR)

Q3 Results Income Statement 2012 2013 Q3 Q4 Q1 Q2 Q3 Pro Forma Sales $204.1 $210.3 $222.6 $189.8 $203.8 Acq. Adjusted EBITDA $33.8 $33.9 $37.6 $31.0 $35.7 EBITDA Margin 16.6% 16.1% 16.9% 16.3% 17.5% Quarterly Sales Growth - 3.0% 5.8% (14.7%) 7.4% Quarterly EBITDA Growth - 0.0% 10.9% (17.6%) 15.2% ($ in millions) Free Cash Flow(2) - ($6) $1 ($17) $33 Adjusted Working Capital $337 $318 $329 $333 $321 NWC as % of Sales 38.0% 36.3% 38.0% 40.3% 39.1% Capital Expenditures $11 $15 $11 $7 $4 Cash Interest Payments $7 $31 $6 $31 $6 Free Cash Flow (1) (1) See appendix for Pro Forma sales, Adjusted EBITDA and Acquisition Adjusted EBITDA reconciliation. (2) Defined as change in net debt. (3) Defined as Inventory and Accounts Receivable less Accounts Payable. See appendix for adjusted working capital reconciliation. (4) Defined as NWC over LTM Sales (Pro forma). (5) See appendix for Net Debt reconciliation. (6) Calculation includes unrealized synergies and does not benefit from removal of restricted cash (according to debt covenants). (3) 8 (1) Net Debt(5) $867 $873 $872 $889 $856 Net Leverage(6) - 5.60x 5.70x 6.14x 5.94x Net Senior Secured Leverage(6) - 2.35x 2.39x 2.64x 2.43x Balance Sheet (4)
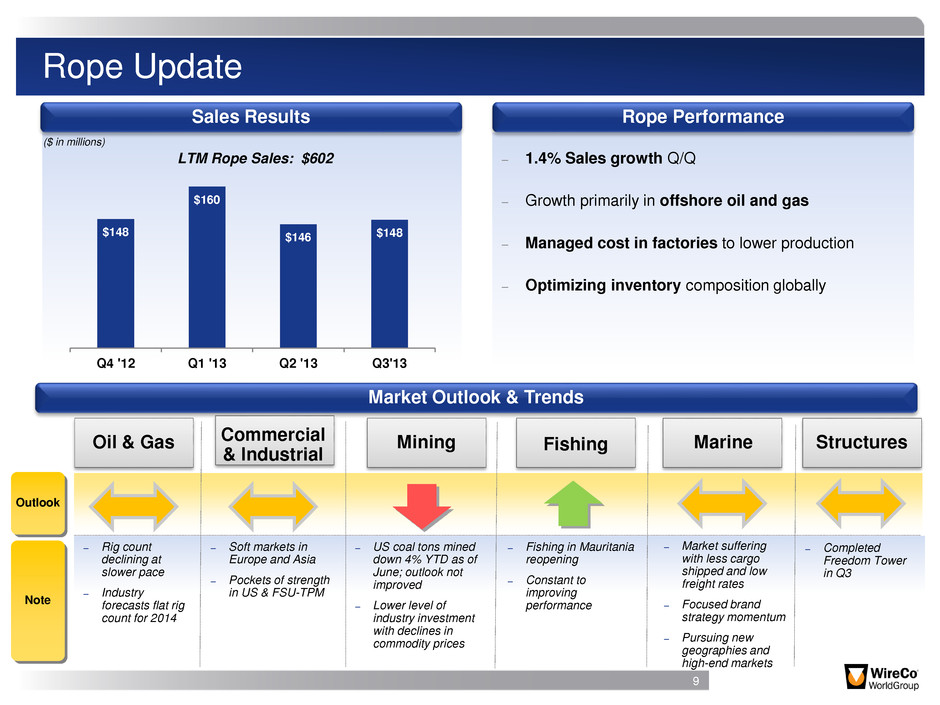
Rope Update 9 Sales Results – 1.4% Sales growth Q/Q – Growth primarily in offshore oil and gas – Managed cost in factories to lower production – Optimizing inventory composition globally Rope Performance ($ in millions) Market Outlook & Trends Oil & Gas Commercial & Industrial Fishing Marine Mining ─ Rig count declining at slower pace ─ Industry forecasts flat rig count for 2014 ─ Soft markets in Europe and Asia ─ Pockets of strength in US & FSU-TPM ─ US coal tons mined down 4% YTD as of June; outlook not improved ─ Lower level of industry investment with declines in commodity prices ─ Fishing in Mauritania reopening ─ Constant to improving performance ─ Market suffering with less cargo shipped and low freight rates ─ Focused brand strategy momentum ─ Pursuing new geographies and high-end markets Outlook Note Structures ─ Completed Freedom Tower in Q3 $148 $160 $146 $148 Q4 '12 Q1 '13 Q2 '13 Q3'13 LTM Rope Sales: $602
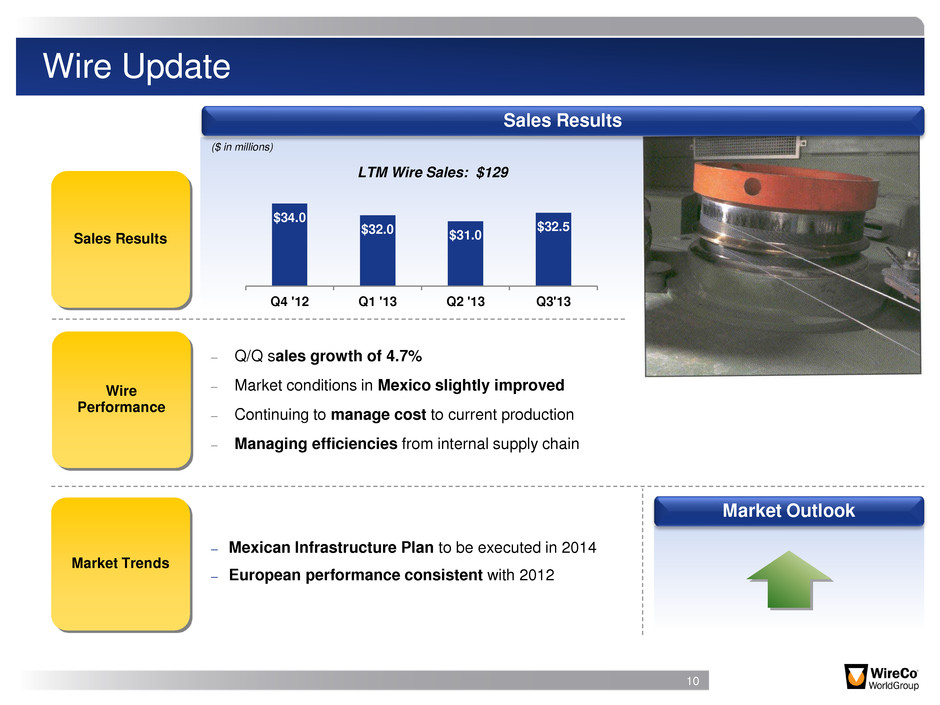
$34.0 $32.0 $31.0 $32.5 Q4 '12 Q1 '13 Q2 '13 Q3'13 Wire Update 10 Sales Results Sales Results LTM Wire Sales: $129 ─ Mexican Infrastructure Plan to be executed in 2014 ─ European performance consistent with 2012 Market Trends ($ in millions) – Q/Q sales growth of 4.7% – Market conditions in Mexico slightly improved – Continuing to manage cost to current production – Managing efficiencies from internal supply chain Wire Performance Market Outlook
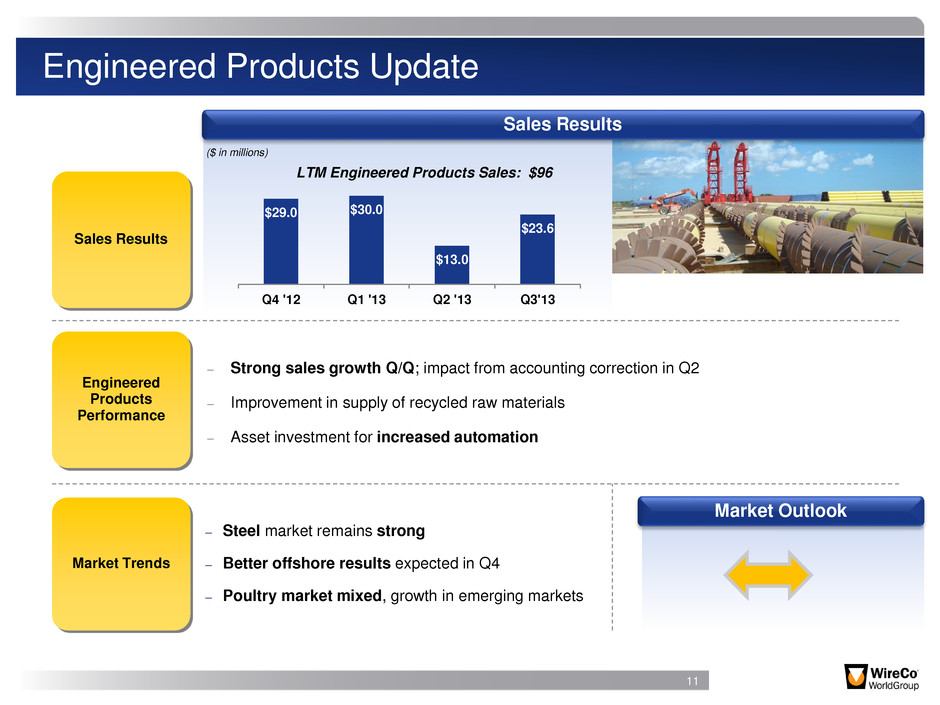
$29.0 $30.0 $13.0 $23.6 Q4 '12 Q1 '13 Q2 '13 Q3'13 Engineered Products Update 11 Sales Results Sales Results LTM Engineered Products Sales: $96 Market Trends ─ Steel market remains strong ─ Better offshore results expected in Q4 ─ Poultry market mixed, growth in emerging markets ($ in millions) – Strong sales growth Q/Q; impact from accounting correction in Q2 – Improvement in supply of recycled raw materials – Asset investment for increased automation Engineered Products Performance Market Outlook
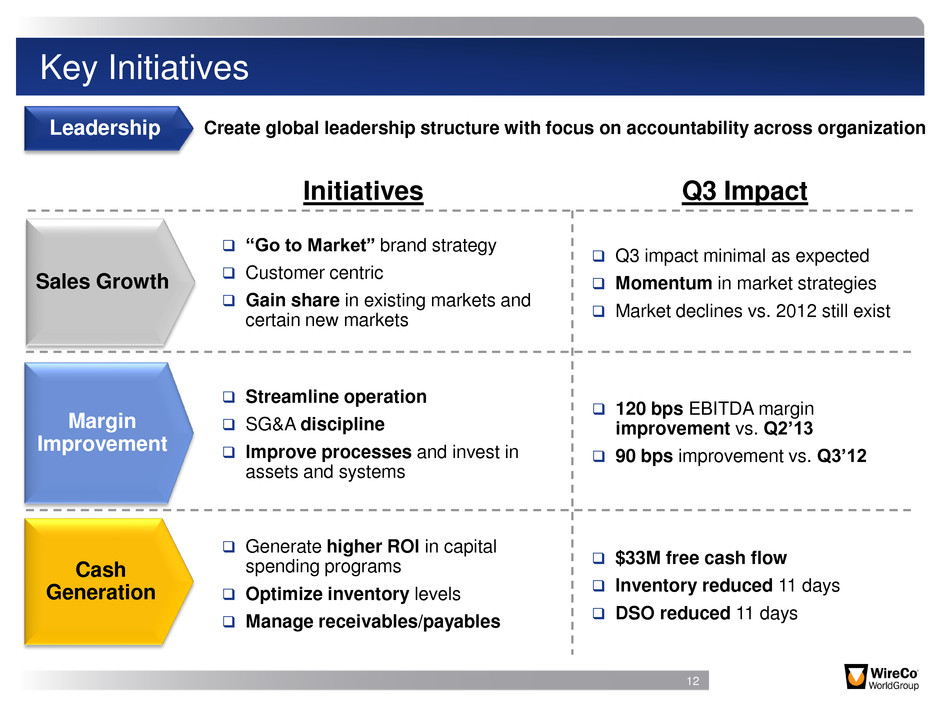
Key Initiatives Streamline operation SG&A discipline Improve processes and invest in assets and systems Margin Improvement Leadership Create global leadership structure with focus on accountability across organization Sales Growth Q3 impact minimal as expected Momentum in market strategies Market declines vs. 2012 still exist Cash Generation Generate higher ROI in capital spending programs Optimize inventory levels Manage receivables/payables 12 Initiatives Q3 Impact “Go to Market” brand strategy Customer centric Gain share in existing markets and certain new markets 120 bps EBITDA margin improvement vs. Q2’13 90 bps improvement vs. Q3’12 $33M free cash flow Inventory reduced 11 days DSO reduced 11 days
Questions 13 Investing to build a world class organization for sustainable long-term growth
Non-GAAP Reconciliations

Non-GAAP Reconciliations Pro Forma Sales Reconciliation ($000s) Q3 2012 Net sales as reported (GAAP) 200,786$ Lankhorst pre-acquisition net sales 3,293 Pro forma net sales 204,079$ 15

Non-GAAP Reconciliations EBITDA Reconciliation ($000s) Q3 2012 Q4 2012 Q1 2013 Q2 2013 Q3 2013 LTM Net Loss (GAAP) (6,308)$ (7,955)$ (11,369)$ (13,437)$ (644)$ (33,405)$ Plus: Interest expense, net 19,248 20,597 20,107 20,350 19,991 81,045 Income tax expense (benefit) 2,366 2,892 (1,439) 2,792 5,632 9,877 Depreciation and amortization 12,879 15,013 13,777 14,542 14,436 57,768 Equity in loss of non-consolidated affiliates, net 370 2,436 34 (9) 1 2,462 Foreign currency exchange losses (gains), net (13,969) (6,235) 10,854 (836) (14,417) (10,634) Share-based compensation 269 659 634 1,091 1,993 4,377 Other expense (income), net 127 (1,553) 119 (857) 1,164 (1,127) Loss on extinguishment of debt 2,358 - - - - - Acquisition costs 4,533 639 33 337 - 1,009 Purchase accounting (inventory step-up and other) 6,776 1,695 923 838 393 3,849 Bank fees 555 638 311 909 389 2,247 Management and advisory fees 867 890 1,037 1,297 1,220 4,444 Reorganization and restructuring charges 1,292 3,509 1,962 3,589 2,005 11,065 Sarbanes-Oxley implementation 237 380 231 - 282 893 Effect of inventory optimization program - - - - 2,970 2,970 Other adjustments 13 258 349 376 264 1,247 Adjusted EBITDA (Non-GAAP) 31,613 33,863 37,563 30,982 35,679 138,087 Lankhorst pre-acquisition Adjusted EBITDA 2,220 - - - - - Correction of immaterial error - - (1,436) 1,436 - - Acquisition Adjusted EBITDA (Non-GAAP) 33,833$ 33,863$ 36,127$ 32,418$ 35,679$ 138,087$ 16
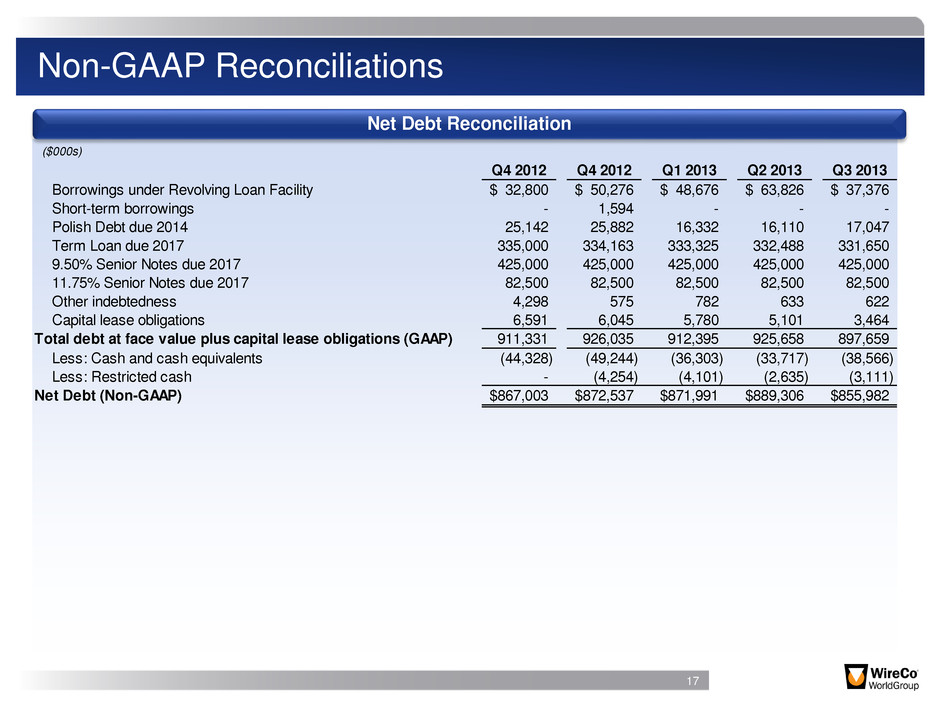
Non-GAAP Reconciliations Net Debt Reconciliation ($000s) Q4 2012 Q4 2012 Q1 2013 Q2 2013 Q3 2013 Borrowings under Revolving Loan Facility 32,800$ 50,276$ 48,676$ 63,826$ 37,376$ Short-term borrowings - 1,594 - - - Polish Debt due 2014 25,142 25,882 16,332 16,110 17,047 Term Loan due 2017 335,000 334,163 333,325 332,488 331,650 9.50% Senior Notes due 2017 425,000 425,000 425,000 425,000 425,000 11.75% Senior Notes due 2017 82,500 82,500 82,500 82,500 82,500 Other indebtedness 4,298 575 782 633 622 Capit l lease obligations 6,591 6,045 5,780 5,101 3,464 Total debt at face value plus capital lease obligations (GAAP) 911,331 926,035 912,395 925,658 897,659 Less: Cash and cash equivalents (44,328) (49,244) (36,303) (33,717) (38,566) Less: Restricted cash - (4,254) (4,101) (2,635) (3,111) Net Debt (Non-GAAP) 867,003$ 872,537$ 871,991$ 889,306$ 855,982$ 17

Non-GAAP Reconciliations Adjusted Working Capital Reconciliation ($ in millions) Q1 2011 Q2 2011 Q3 2011 Q4 2011 Q1 2012 Q2 2012 Q3 2012 Q4 2012 Q1 2013 Q2 2013 Q3 2013 Accounts Receivable as reported 104$ 105$ 117$ 109$ 121$ 121$ 160$ 153$ 174$ 172$ 160$ Drumet pre-acquisition A/R 16 17 - - - - - - - - - Lankhorst pre-acquisition A/R 48 50 38 40 45 46 - - - - - Pro forma Accounts Receivable 168 172 155 149 166 167 160 153 174 172 160 Inventories, net as reported 153 166 178 188 192 191 268 248 239 244 235 Drumet pre-acquisition Inventory 17 17 - - - - - - - - - Lankhorst pre-acquisition Inventory 56 63 55 54 61 62 - - - - - Pro forma Inventories, net 226 246 233 242 253 253 268 248 239 244 235 Accounts Payable as reported 48 46 48 60 57 54 91 83 84 83 74 Drumet pre-acquisktion A/P 8 8 - - - - - - - - - Lankhorst pre-acquisition A/P 31 29 22 28 30 30 - - - - - Pro forma Accounts Payable 87 83 70 88 87 84 91 83 84 83 74 Adjusted Working Capital (Non-GAAP) 307$ 335$ 318$ 303$ 332$ 336$ 337$ 318$ 329$ 333$ 321$ 18
