Attached files
| file | filename |
|---|---|
| 8-K - 8-K - MITEL NETWORKS CORP | d626272d8k.htm |
| EX-99.1 - EX-99.1 - MITEL NETWORKS CORP | d626272dex991.htm |
Exhibit 99.2

Mitel & Aastra Technologies Announce Plans to Merge
A Newly Created $Billion Company
#1 Market Share in Western Europe US$100M Cloud Business
Large Global Customer Footprint with 60 Million End Users Strongly Positions Mitel for Transition to Cloud Services
November 11th, 2013
Exhibit 99.2
SAFE HARBOR STATEMENT
Forward Looking Statements
Some of the statements in this document are forward-looking statements (or forward-looking information) within the meaning of applicable U.S. and Canadian securities laws. These include statements using the words target, outlook, may, will, should, could, estimate, continue, expect, intend, plan, predict, potential, project and anticipate, and similar statements which do not describe the present or provide information about the past. There is no guarantee that the expected events or expected results will actually occur. Such statements reflect the current views of management of Mitel and Aastra and are subject to a number of risks and uncertainties. These statements are based on many assumptions and factors, including general economic and market conditions, industry conditions, corporate approvals, regulatory approvals, operational factors and other factors. Any changes in such assumptions or factors could cause actual results to differ materially from current expectations. All forward-looking statements attributable to Mitel and Aastra, or persons acting on their behalf, and are expressly qualified in their entirety by the cautionary statements set forth in this paragraph. Undue reliance should not be placed on such statements. Forward-looking statements speak only as of the date they are made. In addition, material risks that could cause results of operations to differ include the merged company’s ability to achieve or sustain profitability in the future; fluctuations in the quarterly and annual revenues and operating results; fluctuations in foreign exchange rates; current and ongoing global economic instability; intense competition; reliance on channel partners for a significant component of sales; dependence upon a small number of outside contract manufacturers to manufacture products; the ability to successfully integrate the acquisition and realize certain synergies; and, our ability to implement and achieve our business strategies successfully. Additional risks are described under the heading “Risk Factors” in Mitel’s Annual Report on Form 10-K and Aastra’s Annual Information Form. Except as required by law, we do not have any intention or obligation to update or to publicly announce the results of any revisions to any of the forward-looking statements to reflect actual results, future events or developments, changes in assumptions or changes in other factors affecting the forward-looking statements. You are advised, however, to consult any further public disclosures made by Mitel and Aastra on related subjects in reports and communications filed on Electronic Data-Gathering, Analysis, and Retrieval (EDGAR) or System for Electronic Document Analysis and Retrieval (SEDAR).
Non-GAAP Financial Measurements
This presentation includes references to non-GAAP financial measures including adjusted EBITDA, non-GAAP income and non-GAAP operating expenses. Non-GAAP financial measures do not have any standardized meaning and are therefore unlikely to be comparable to similar measures presented by other companies. We use these non-GAAP financial measures to assist management and investors in understanding our past financial performance and prospects for the future, including changes in our operating results, trends and marketplace performance, exclusive of unusual events or factors which do not directly affect what we consider to be our core operating performance. Non-GAAP measures are among the primary indicators management uses as a basis for our planning and forecasting of future periods. Investors are cautioned that non-GAAP financial measures should not be relied upon as a substitute for financial measures prepared in accordance with generally accepted accounting principles. Please see the reconciliation of non-GAAP financial measures to the most directly comparable U.S. GAAP measure included in this presentation and, if not contained in this presentation, contained in Mitel’s Reports on Form 8-K which have been filed with the 2 U.S. Securities and Exchange Commission on June 24, 2013 (fiscal 2013) and August 29, 2013 (Q1 of fiscal 2014).
Transaction Overview
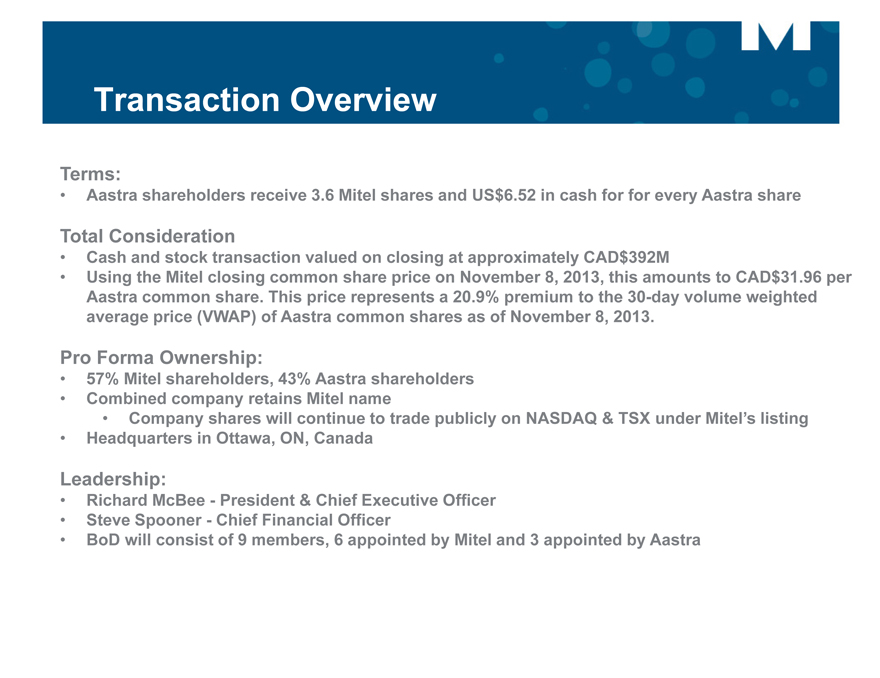
Terms:
Aastra shareholders receive 3.6 Mitel shares and US$6.52 in cash for for every Aastra share
Total Consideration
Cash and stock transaction valued on closing at approximately CAD$392M
Using the Mitel closing common share price on November 8, 2013, this amounts to CAD$31.96 per Aastra common share. This price represents a 20.9% premium to the 30-day volume weighted average price (VWAP) of Aastra common shares as of November 8, 2013.
Pro Forma Ownership:
57% Mitel shareholders, 43% Aastra shareholders
Combined company retains Mitel name
Company shares will continue to trade publicly on NASDAQ & TSX under Mitel’s listing
Headquarters in Ottawa, ON, Canada
Leadership:
Richard McBee—President & Chief Executive Officer
Steve Spooner—Chief Financial Officer
BoD will consist of 9 members, 6 appointed by Mitel and 3 appointed by Aastra
Transaction Overview
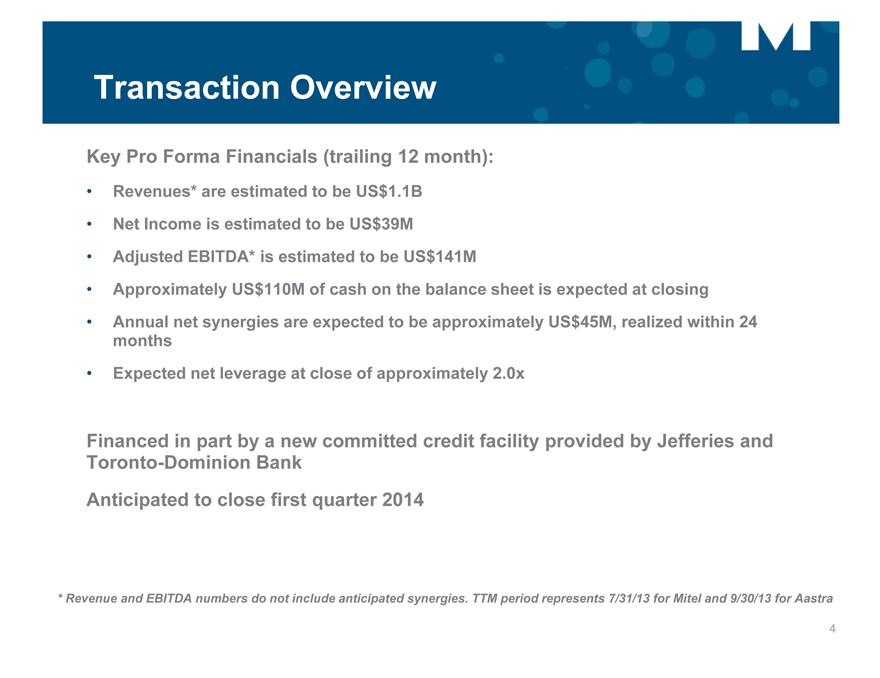
Key Pro Forma Financials (trailing 12 month):
Revenues* are estimated to be US$1.1B
Net Income is estimated to be US$39M
Adjusted EBITDA* is estimated to be US$141M
Approximately US$110M of cash on the balance sheet is expected at closing
Annual net synergies are expected to be approximately US$45M, realized within 24 months
Expected net leverage at close of approximately 2.0x
Financed in part by a new committed credit facility provided by Jefferies and Toronto-Dominion Bank Anticipated to close first quarter 2014
* Revenue and EBITDA numbers do not include anticipated synergies. TTM period represents 7/31/13 for Mitel and 9/30/13 for Aastra
4
Mitel Overview
Provides business communications and collaboration software and services to the SMB market worldwide
Strong presence in North America and the UK
Channel sales model with 1,600 partners globally
~9,000 SME and Enterprise customers in over 100 countries
Installed base of over 10 million end users
More than 300,000 cloud users
Strong financial profile
- One of the most profitable enterprise communications companies
- LTM 7/31/13 Revenue: US$580.0M
- Gross margin and EBITDA margin expansion over past several years
~1,800 employees
1,700 patent portfolio and a leader in virtualized solutions
5
Aastra Overview
Develops and delivers communications products and applications for the global enterprise and SMB market
Strong presence in Europe, holds #1 / #2 position in several key markets
Channel partners in more than 100 countries and more than 1,000 resellers
Installed base of over 50 million end users
Strong financial profile
- 62 consecutive profitable quarters
- LTM 9/30/13 Revenue: US$571.1M
- Strong cash generation over the past several years
~1,900 employees
Emerging cloud business gaining traction
6
Creating a Leading Provider of Business Communications & Collaboration Solutions
Delivers As A Combined Company:
Expanded Geographic Footprint & Market Leadership
Comprehensive Solution Portfolio
Enhanced Scale & Attractive Synergy Potential
Leading Cloud Capabilities
Deleveraged Balance Sheet
Attractive Operating Model/Cash Flow Generation
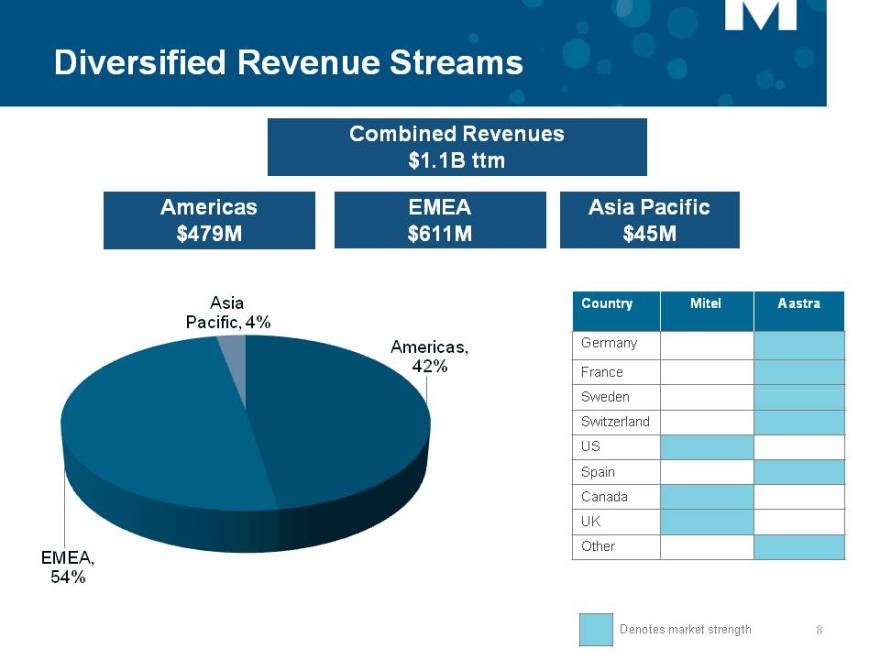
Diversified Revenue Streams
Combined Revenues $1.1B ttm
Americas EMEA Asia Pacific $479M $611M $45M
Asia
Pacific, 4%
Americas,
42%
EMEA,
54%
Country Mitel Aastra
Germany
France
Sweden
Switzerland
US
Spain
Canada
UK
Other
Denotes market strength
8
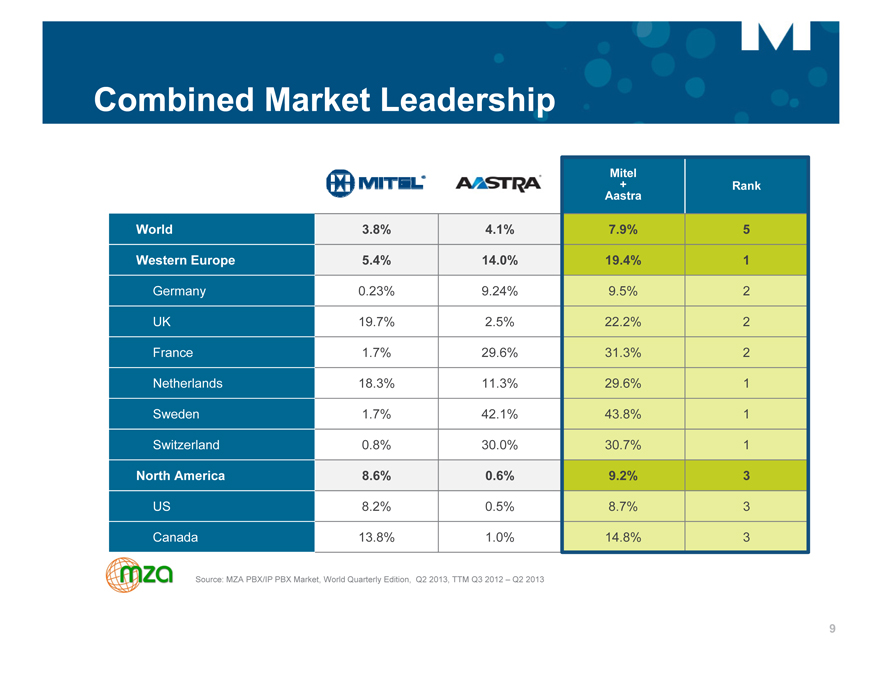
Combined Market Leadership
Mitel
+ Rank
Aastra
World 3.8% 4.1% 7.9% 5
Western Europe 5.4% 14.0% 19.4% 1
Germany 0.23% 9.24% 95% 2
UK 19.7% 2.5% 22.2% 2
France 1.7% 29.6% 31.3% 2
Netherlands 18.3% 11.3% 29.6% 1
Sweden 1.7% 42.1% 43.8% 1
Switzerland 0.8% 30.0% 30.7% 1
US 8.2% 0.5% 8.7% 3
Canada 13.8% 1.0% 14.8% 3
North America 8.6% 0.6% 9.2% 3
Source: MZA PBX/IP PBX Market, World Quarterly Edition, Q2 2013, TTM Q3 2012 – Q2 2013
9
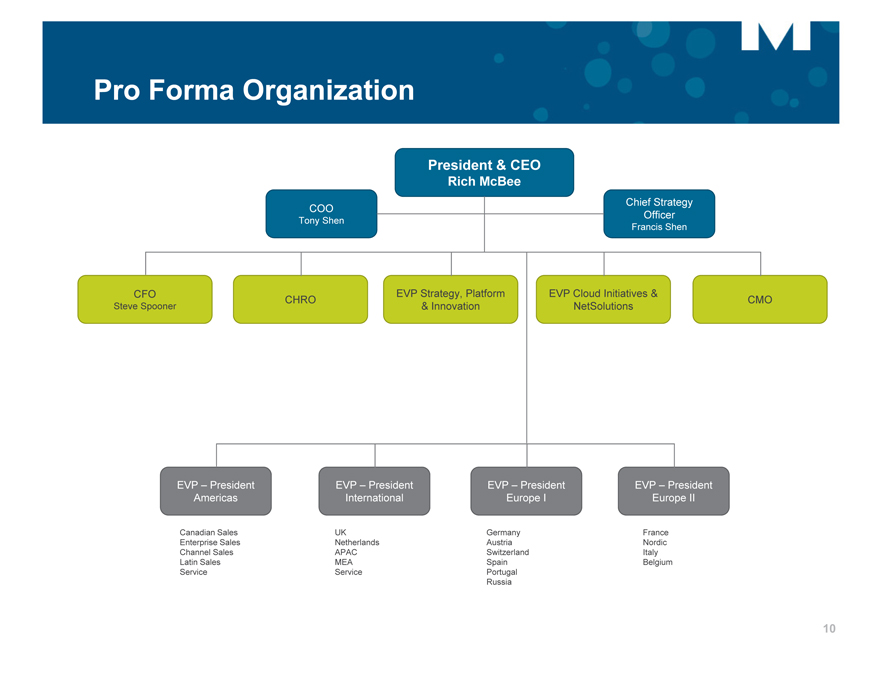
Pro Forma Organization
President & CEO
Rich McBee
COO Chief Strategy
Tony Shen Officer
Francis Shen
EVP Strategy, Platform EVP Cloud Initiatives &
CHRO CMO CFO
Steve Spooner & Innovation NetSolutions
EVP – President EVP – President EVP – President EVP – President
Americas International Europe I Europe II
Canadian Sales UK Germany France
Enterprise Sales Netherlands Austria Nordic
Channel Sales APAC Switzerland Italy
Latin Sales MEA Spain Belgium
Service Service Portugal
Russia
10

Financial Overview
Financial Information Presentation
Mitel financial information is presented as reported in their U.S. and Canadian public filings, available on EDGAR and SEDAR. The financial information has been prepared under U.S. GAAP and is in U.S. dollars .
Aastra financial information is presented as reported in their Canadian public filings, available on SEDAR. The financial information has been prepared under IFRS and has been converted to U.S. dollars using the closing CAD/USD rate of 0.9531.
The combined company is expected to use U.S. dollars as the reporting currency and report under U.S. GAAP.
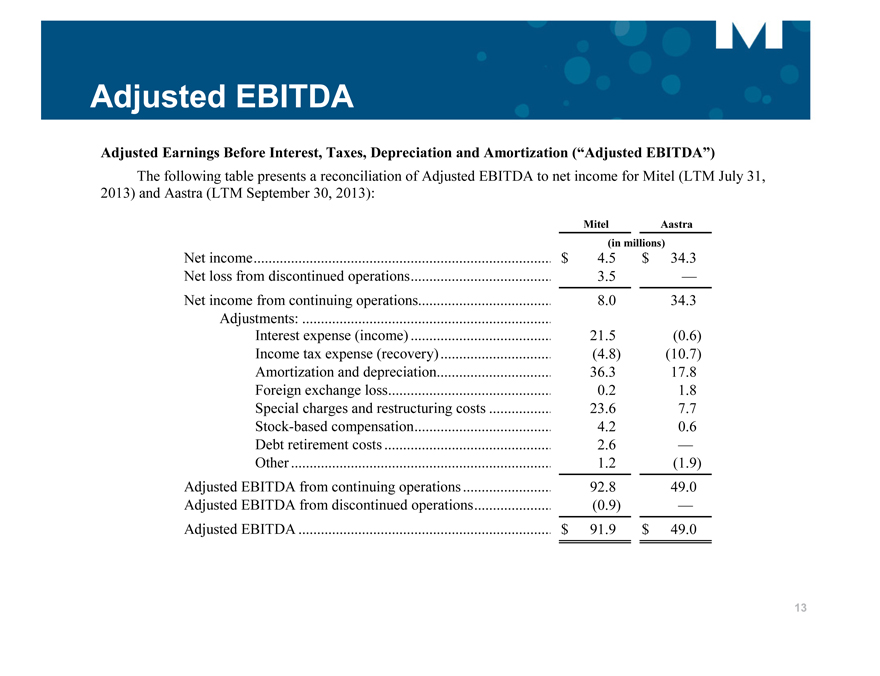
Adjusted EBITDA
Adjusted Earnings Before Interest, Taxes, Depreciation and Amortization (“Adjusted EBITDA”)
The following table presents a reconciliation of Adjusted EBITDA to net income for Mitel (LTM July 31,
2013) and Aastra (LTM September 30, 2013):
Mitel Aastra
(in millions)
Net income $ 4.5 $ 34.3
Net loss from discontinued operations 3.5 —
Net income from continuing operations 8.0 34.3
Adjustments:
Interest expense (income) 21.5 (0.6)
Income tax expense (recovery) (4.8) (10.7)
Amortization and depreciation 36.3 17.8
Foreign exchange loss 0.2 1.8
Special charges and restructuring costs 23.6 7.7
Stock-based compensation 4.2 0.6
Debt retirement costs 2.6 —
Other 1.2 (1.9)
Adjusted EBITDA from continuing operations 92.8 49.0
Adjusted EBITDA from discontinued operations (0.9) —
Adjusted EBITDA $ 91.9 $ 49.0
13
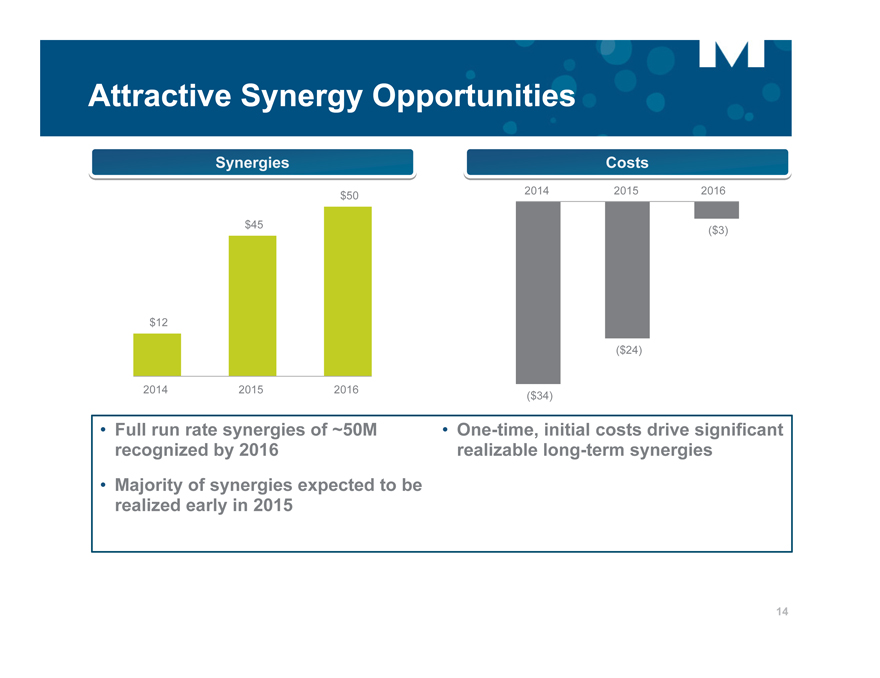
Attractive Synergy Opportunities
Synergies Costs
$50 2014 2015 2016
$45 ($3)
$12
($24)
2014 2015 2016 ($34)
Full run rate synergies of ~50M One-time, initial costs drive significant
recognized by 2016 realizable long-term synergies
Majority of synergies expected to be
realized early in 2015
14
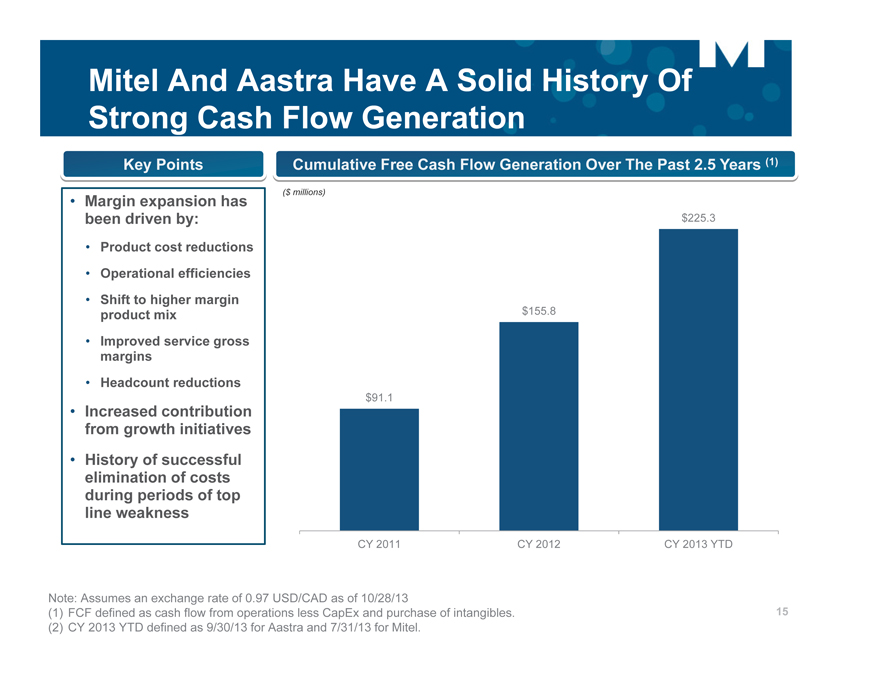
Mitel And Aastra Have A Solid History Of
Strong Cash Flow Generation
Key Points Cumulative Free Cash Flow Generation Over The Past 2.5 Years (1)
($ millions)
• Margin expansion has
been driven by: $225.3
• Product cost reductions
• Operational efficiencies
• Shift to higher margin
product mix $155.8
• Improved service gross
margins Headcount reductions
$91.1
• Increased contribution
from growth initiatives
• History of successful
elimination of costs
during periods of top
line weakness
CY 2011 CY 2012 CY 2013 YTD
Note: Assumes an exchange rate of 0.97 USD/CAD as of 10/28/13
(1) FCF defined as cash flow from operations less CapEx and purchase of intangibles. 15
(2) CY 2013 YTD defined as 9/30/13 for Aastra and 7/31/13 for Mitel.
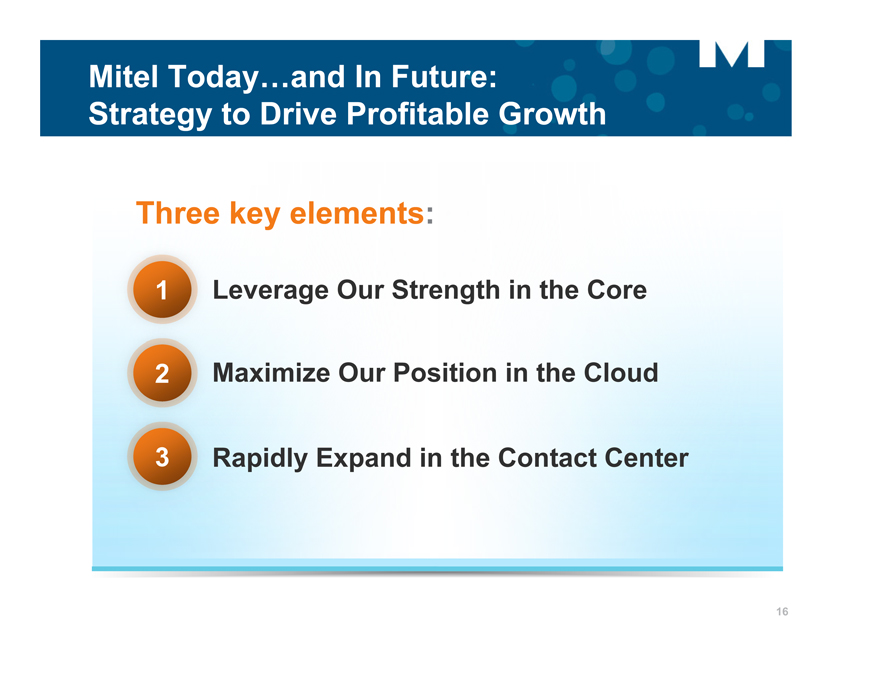
Mitel Today…and In Future: Strategy to Drive Profitable Growth
Three key elements:
1 Leverage Our Strength in the Core
2 Maximize Our Position in the Cloud
3 Rapidly Expand in the Contact Center
16
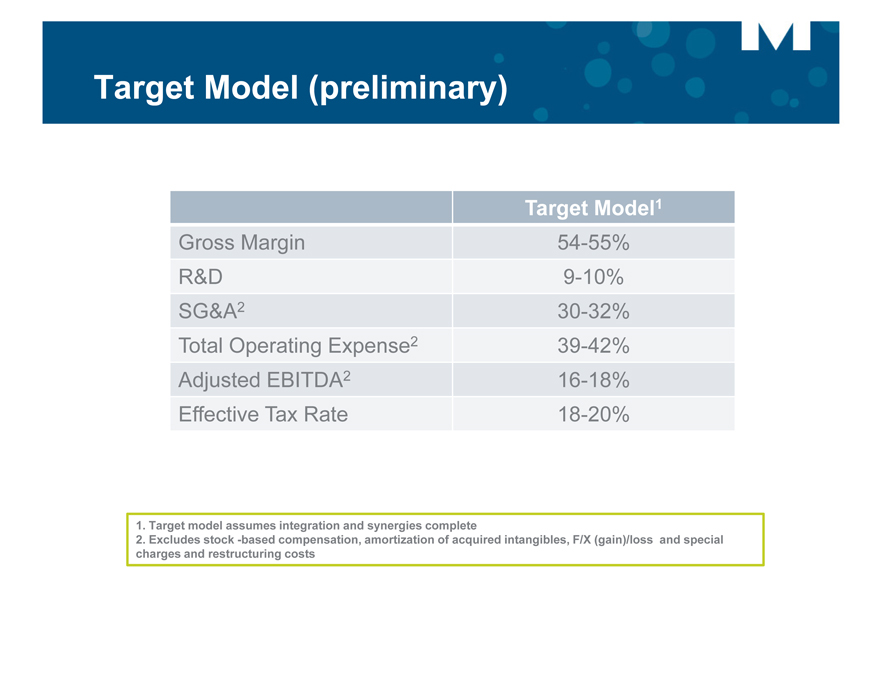
Target Model (preliminary)
Target Model 1
Gross Margin 54-55% R&D 9-10% SG&A2 30-32% Total Operating Expense2 39-42% Adjusted EBITDA2 16-18% Effective Tax Rate 18-20%
1. Target model assumes integration and synergies complete
2. Excludes stock -based compensation, amortization of acquired intangibles, F/X (gain)/loss and special charges and restructuring costs
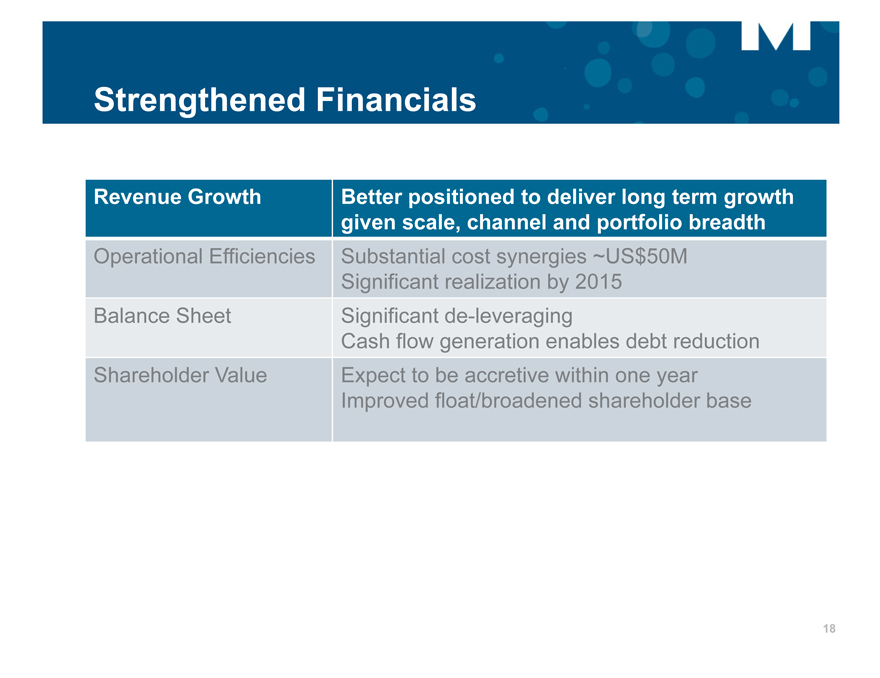
Strengthened Financials
Revenue Growth Better positioned to deliver long term growth given scale, channel and portfolio breadth
Operational Efficiencies Substantial cost synergies ~US$50M Significant realization by 2015 Balance Sheet Significant de-leveraging Cash flow generation enables debt reduction Shareholder Value Expect to be accretive within one year Improved float/broadened shareholder base
18
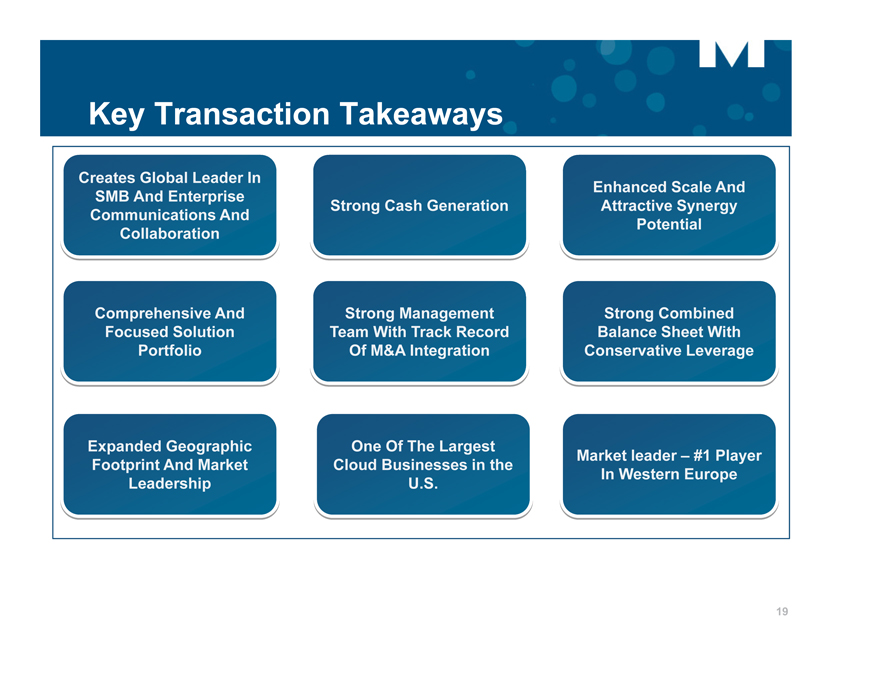
Key Transaction Takeaways
Creates Global Leader In
SMB And Enterprise Enhanced Scale And
Communications And Strong Cash Generation Attractive Synergy
Collaboration Potential
Comprehensive And Strong Management Strong Combined
Focused Solution Team With Track Record Balance Sheet With
Portfolio Of M&A Integration Conservative Leverage
Expanded Geographic One Of The Largest
Footprint And Market Cloud Businesses in the Market leader – #1 Player
Leadership U.S. In Western Europe
19
Mitel & Aastra Technologies Announce Plans to Merge
A Newly Created $Billion Company
#1 Market Share in Western Europe US$100M cloud business
Large Global Customer Footprint with 60 Million End Users Strongly Positions Mitel for Transition to Cloud Services
November 11th, 2013