Attached files
| file | filename |
|---|---|
| EX-10.12(D) - EX-10.12(D) - MITEL NETWORKS CORP | d452685dex1012d.htm |
| EX-32.2 - EX-32.2 - MITEL NETWORKS CORP | d452685dex322.htm |
| EX-32.1 - EX-32.1 - MITEL NETWORKS CORP | d452685dex321.htm |
| EX-31.2 - EX-31.2 - MITEL NETWORKS CORP | d452685dex312.htm |
| EX-31.1 - EX-31.1 - MITEL NETWORKS CORP | d452685dex311.htm |
| EX-23.1 - EX-23.1 - MITEL NETWORKS CORP | d452685dex231.htm |
| EX-21.1 - EX-21.1 - MITEL NETWORKS CORP | d452685dex211.htm |
Table of Contents
UNITED STATES
SECURITIES AND EXCHANGE COMMISSION
Washington, D.C. 20549
Form 10-K
| ☒ | ANNUAL REPORT PURSUANT TO SECTION 13 OR 15(d) OF THE SECURITIES EXCHANGE ACT OF 1934 |
For the Fiscal Year Ended December 31, 2017
OR
| ☐ | TRANSITION REPORT PURSUANT TO SECTION 13 OR 15(d) OF THE SECURITIES EXCHANGE ACT OF 1934 |
For the transition period from to
Commission File Number: 001-34699
MITEL NETWORKS CORPORATION
(Exact name of Registrant as specified in its charter)
| Canada | 3661 | 98-0621254 | ||
| (State or other jurisdiction of incorporation or organization) |
(Primary Standard Industrial Classification Code Number) |
(I.R.S. Employer Identification No.) |
350 Legget Drive
Ottawa, Ontario
Canada K2K 2W7
(613) 592-2122
(Address, including zip code, and telephone number, including area code, of Registrant’s principal executive offices)
Securities registered pursuant to Section 12(b) of the Act:
| Title of each class |
Name of each exchange on which registered | |
| Common Shares, no par value | NASDAQ Stock Market Toronto Stock Exchange |
Securities registered pursuant to Section 12(g) of the Act:
None.
Indicate by check mark if the registrant is a well-known seasoned issuer, as defined in Rule 405 of the Securities Act. Yes ☒ No ☐
Indicate by check mark if the registrant is not required to file reports pursuant to Section 13 or Section 15(d) of the Act. Yes ☐ No ☒
Indicate by check mark whether the registrant: (1) has filed all reports required to be filed by Section 13 or 15(d) of the Securities Exchange Act of 1934 during the preceding 12 months (or for such shorter period that the registrant was required to file such reports), and (2) has been subject to such filing requirements for the past 90 days. Yes ☒ No ☐
Indicate by check mark whether the registrant has submitted electronically and posted on its corporate web site, if any, every Interactive Data File required to be submitted and posted pursuant to Rule 405 of Regulation S-T during the preceding 12 months (or for such shorter period that the registrant was required to submit and post such files). Yes ☒ No ☐
Indicate by check mark if disclosure of delinquent filers pursuant to Item 405 of Regulation S-K is not contained herein, and will not be contained, to the best of registrant’s knowledge, in definitive proxy or information statements incorporated by reference in Part III of this Form 10-K or any amendment to this Form 10-K. ☒
Indicate by check mark whether the Registrant is a large accelerated filer, an accelerated filer, a non-accelerated filer, a smaller reporting company, or an emerging growth company. See the definitions of “large accelerated filer,” “accelerated filer,” “smaller reporting company” and “emerging growth company” in Rule 12b-2 of the Exchange Act (Check one):
| Large accelerated filer | ☒ | Accelerated Filer | ☐ | |||
| Non-accelerated filer | ☐ (do not check if a smaller reporting company) | Smaller reporting company | ☐ | |||
| Emerging growth company | ☐ | |||||
If an emerging growth company, indicate by check mark if the Registrant has elected not to use the extended transition period for complying with any new or revised financial accounting standards provided pursuant to Section 13(a) of the Exchange Act. ☐
Indicate by check mark whether the registrant is a shell company (as defined in Rule 12b-2 of the Act). Yes ☐ No ☒
The aggregate market value of the shares of the registrant’s common stock held by non-affiliates on June 30, 2017 (the last business day of the registrant’s most recently completed second fiscal quarter) was $753,980,368.05.
As of February 26, 2018, there were 120,292,765 common shares outstanding.
DOCUMENTS INCORPORATED BY REFERENCE
Portions of the registrant’s Proxy Statement for the 2018 Annual Meeting of the shareholders of Mitel Networks Corporation are incorporated herein by reference in Part III of this Annual Report on Form 10-K to the extent stated herein. Such Proxy Statement will be filed with the Securities and Exchange Commission within 120 days of the registrant’s fiscal year ended December 31, 2017.
Table of Contents
MITEL NETWORKS CORPORATION
2017 FORM 10–K ANNUAL REPORT
Table of Contents
All dollar amounts quoted in this Report are provided in United States dollars, unless otherwise stated. All references to
websites contained herein do not constitute incorporation by reference of information contained on such websites and such
information should not be considered part of this document.
CAUTIONARY NOTE REGARDING FORWARD-LOOKING STATEMENTS
This Annual Report on Form 10-K, including the “Management’s Discussion and Analysis of Financial Condition and Results of Operations,” contains forward-looking statements regarding future events and our future results that are subject to the safe harbors created under the Securities Act of 1933 (the “Securities Act”) and the Securities Exchange Act of 1934 (the “Exchange Act”). All statements other than statements of historical facts are statements that could be deemed forward-looking statements. These statements are based on current expectations, estimates, forecasts, and projections about the industries in which we operate and the beliefs and assumptions of our management. Words such as “expects,” “anticipates,” “targets,” “goals,” “projects,” “intends,” “plans,” “believes,” “seeks,” “estimates,” “continues,” “endeavors,” “strives,” “may,” “will,” “should,” “could,” “outlook,” and variations of such words, and similar expressions are intended to identify such forward-looking statements. In addition, any statements that refer to projections of our future financial performance, our anticipated growth and trends in our businesses, and other characterizations of future events or circumstances are forward-looking statements. Readers are cautioned that these forward-looking statements are only predictions and are subject to risks, uncertainties, and assumptions that are difficult to predict, including those identified below, under “Item 1A. Risk Factors,” and elsewhere herein. Therefore, actual results may differ materially and adversely from those expressed in any forward-looking statements. We undertake no obligation to revise or update any forward-looking statements for any reason.
Certain information contained in this Report, including information regarding future financial results, performance and plans, expectations, and objectives of management, constitute forward-looking information within the meaning of Canadian securities laws and forward-looking statements within the meaning of the Private Securities Litigation Reform Act of 1995. We refer to all of these as forward-looking statements. In particular, this Report contains forward-looking statements pertaining to, among other matters: the inherent uncertainty associated with financial or other projections; the integration of Mitel and ShoreTel and the ability to recognize the anticipated benefits from the acquisition of ShoreTel; the anticipated size of the markets and continued demand for our products and services; the impact of competitive products and pricing and disruption to the combined business that could result from the acquisition of ShoreTel; access to available financing on a timely basis and on reasonable terms; risks associated with the non-cash consideration received by us in connection with the divestment of the Mobile business unit; our ability to achieve or sustain profitability in the future; fluctuations in quarterly and annual revenues and operating results; fluctuations in foreign exchange rates; current and ongoing global economic instability, political unrest and related sanctions; intense competition; our reliance on channel partners for a significant component of our sales; our dependence upon a small number of outside contract manufacturers to manufacture our products; and, our ability to successfully implement and achieve our business strategies, including our growth of the company through acquisitions and the integration of recently acquired businesses and realization of synergies, including the acquisition of ShoreTel. Forward-looking statements are subject to a variety of known and unknown risks, uncertainties, assumptions and other factors that could cause actual events or results to differ from those expressed or implied by the forward-looking statements.
These statements reflect our current views with respect to future events and are based on assumptions and factors and subject to risks and uncertainties. We operate in a very competitive and rapidly changing environment. New risks emerge from time to time. In making these statements we have made certain assumptions. While we believe our plans, intentions, expectations, assumptions and strategies reflected in these forward-looking statements are reasonable, we cannot assure you that these plans, intentions, expectations assumptions and strategies will be achieved. Our actual results, performance or achievements could differ materially from those contemplated, expressed or implied by the forward-looking statements contained in this Report, as a result of various factors, including the risks and uncertainties discussed below.
All forward-looking statements attributable to us or persons acting on our behalf are expressly qualified in their entirety by the cautionary statements set forth in this Report. Except as required by law, we are under no obligation to update any forward-looking statement, whether as a result of new information, future events or otherwise.
Table of Contents
| Item 1. | Business |
We are a global provider of cloud and on-site business communications and collaboration solutions. Through our software product development, we help more than 70 million end users around the world, including more than a million cloud-based Unified Communications as a Service (UCaaS) subscribers, to seamlessly connect, collaborate and provide innovative solutions to their customers. Our global customer base leverages Mitel innovation every day in approximately 100 countries and has helped us become:
| • | the #2 market share leader worldwide for UCaaS; |
| • | the #1 global market share leader for unified communications in Europe; and |
| • | the #4 provider of business communications in the world. |
Our strategy is built on the principle of putting customers first and providing an exceptional customer experience. We do that by providing a seamless technology path that will enable businesses to communicate, collaborate and participate in the digital transformation and application economy that is reshaping business models and competition globally. Since 2011, we have fundamentally reoriented our company from an on-site or premise-based unified communications and telephony business to become a diverse global market leader with established positions in next-generation cloud and enterprise markets.
As a result of both our organic in-house development and our merger and acquisition activity, we believe that we are uniquely positioned to offer customers globally a comprehensive portfolio of complementary and interoperable communications and collaboration solutions.
In the third quarter of 2017, we completed the acquisition of ShoreTel, accelerating our move-to-the-cloud strategy by investing further and faster into the UCaaS market as businesses worldwide increasingly look for cloud and cloud-capable solutions to digitally transform their businesses.
Our software, applications and services enable customers to upgrade and enhance their communications environments at their own pace, whether in a cloud or on-site enterprise environment. Our solutions generally interoperate with various systems supplied by other vendors, including global market leaders such as VMware, Microsoft, Salesforce.com, Google, Amazon Web Services and Rackspace. This interoperability allows our customers to utilize their existing communications infrastructure and gives them the flexibility to choose the solutions that best address their individual business needs. We have also designed our software, applications and end-user devices to allow access to our solutions from mobile devices. Our mobile applications are compatible and available for use on some of the world’s leading mobile devices, including those from Apple and Samsung. We complement our communications solutions with support, professional and managed services for our customers that range from planning and design through to implementation.
Our cloud-based communications services and solutions (reported as the Cloud segment) provide a full range of private, public, hybrid and mobile Software as a Service (SaaS) solutions for businesses of all sizes. This offering includes UCaaS solutions, which enable businesses to consume and pay for their communications services on a monthly subscription basis.
Our broad range of on-site unified communications and collaboration (UCC) solutions (reported as the Enterprise segment) enables us to address and support the full spectrum of technology specifications – from digital to IP, from platforms to services, and for fixed or mobile end-user devices. Our enterprise solutions include the latest virtualized, cloud-enabled and software-based capabilities and desktop and mobile applications to enable businesses of all sizes to take advantage of the most advanced technology developments while maximizing their current communications investments.
We have invested heavily in the research and development (R&D) of our IP-based communications and collaboration solutions to take advantage of the worldwide shift from traditional digital communications systems to cloud, mobile and application-based solutions. We believe our early and sustained R&D has positioned us to capitalize on the industry shift from legacy systems to IP and cloud communications solutions, including UCC solutions used in desktop and mobile environments. We control a global patent portfolio of more than 1,600 patents and pending applications. We believe our R&D provides us with the enhanced knowledge to anticipate expected market trends and to meet the current and future needs of our customers and channel partners.
With a global geographic footprint, we are structured around three primary geographic markets defined as the Americas, which includes the United States, Canada and the Caribbean and Latin America; EMEA, which includes the continent of Europe, the Middle East and Africa; and Asia Pacific, which includes the continent of Asia and the Pacific region, including Australia and New Zealand.
1
Table of Contents
Segments
Our business is organized into Cloud and Enterprise segments.
Cloud Segment
The Cloud segment includes a comprehensive family of cloud-based communications products, services and applications that, in most cases, are consumed by customers on a monthly subscription basis (as a fixed operational expense) with the option to rent phones, aiming to eliminate the need for organizations to buy and maintain a phone system on their premises. Primarily offered under the “MiCloud” brand, the portfolio includes a full suite of cloud-based UCC solutions (voice services, dial plans, audio conferencing, voicemail, call center functionality, video conferencing, along with team collaboration applications) that provide seamless mobility and reliability, and are built to suit small and growing businesses along with large-scale enterprises. MiCloud solutions and services are sold in a direct and indirect model for the consumption of end users and partners alike. The portfolio also enables partners and service providers to create highly optimized service offerings they can host themselves or through a Mitel-operated data center.
Enterprise Segment
The Enterprise segment includes our products, services and applications that support customers that prefer private cloud or on-site or deployments. Primarily offered under the “MiVoice” brand, the Enterprise portfolio integrates voice, unified communications and collaboration applications, and contact center applications on fixed and mobile networks across a wide range of end-user devices, such as desk phones, mobile phones, tablets, desktop and laptop computers. This includes our IP-based telephony platforms, desktop devices, in-building mobile devices, UCC and contact center applications that are primarily deployed on the customer’s premises. Our on-site portfolio is typically sold as an initial sale of hardware and software, with ongoing recurring revenue from hardware and software maintenance and other managed services that we may also offer.
Mitel Product Portfolio—Overview
By offering a comprehensive portfolio of solutions and services, including cloud and on-site enterprise communications products and solutions, UCC and contact center applications and a variety of value-added service offerings, Mitel aims to offer our customers flexibility, freedom of choice and a seamless path to the cloud as and when they choose. Our portfolio includes:
| Cloud |
On-site | |
| MiCloud Office |
Business IP and digital phones (wired and wireless) | |
| MiCloud Business |
MiVoice communications platforms | |
| MiCloud Flex (formerly MiCloud Enterprise) |
MiVoice Connect (formerly Connect ONSITE) | |
| MiCloud Connect (formerly Connect Cloud) |
MiCollab UCC applications | |
| MiCloud Contact Center |
MiContact Center applications | |
| MiCloud for Service Providers |
IPedge / CIX communications platforms | |
| Clearspan |
Service offerings | |
Partnerships
One important result of the evolution of integrated communications and cloud solutions is the simplicity with which products and services, from a variety of sources, can be easily integrated to provide a better solution for customers. By partnering with others, we can concentrate on our core areas of expertise while leveraging the capabilities of our channel partners for the benefit of customers. We have four key types of technology partnerships: strategic alliances, operational partners, affiliates and solution alliances.
Customers
Our customers include more than 70 million business end users, ranging from the smallest business to the largest enterprise, and include more than a million UCaaS subscribers. No single customer accounted for more than 10% of our revenues from continuing operations in fiscal 2017. We have also developed a comprehensive understanding of certain vertical markets, such as hospitality, education, government, healthcare, and retail. Our solutions can be tailored to meet the business communications needs of these and other vertical markets.
2
Table of Contents
Competition
We compete in the cloud and on-site enterprise communications markets, providing products and services for transporting data, voice and video traffic across intranets, extranets, mobile networks and the internet. These markets are characterized by rapid change, converging technologies and a migration to networking and communications solutions that offer relative advantages. These market factors represent both an opportunity and a competitive threat to us. We compete with numerous vendors in each product category. The overall number of our competitors providing niche product solutions may increase. Also, the identity and composition of competitors may change as we increase our activity in our new product markets. As we continue to expand globally, we may see new competition in different geographic regions.
Competitors for our Cloud solutions include hosted and cloud services providers, such as Avaya, Inc., Atos SE, Broadsoft, Inc. (which entered into a definitive agreement in October 2017 to be acquired by Cisco Systems), Cisco Systems, Inc., 8X8, Inc., Fuze, Inc., j2 Global, Inc., Ribbon Communications, RingCentral, Inc., Verizon Communications Inc., Vonage Holdings Corp., West IP Communications, Inc., and other hosted PBX providers. In our wholesale cloud offerings, we also face competition from AT&T, Inc. and other communications service providers.
Competitors for our Enterprise solutions are primarily from two groups of vendors: Traditional IP communications vendors; and software vendors that are adding communications and collaboration solutions to their offerings. We compete against many traditional IP communications vendors, including Alcatel-Lucent Enterprise, Ascom Holding AG, Avaya, Inc., Atos SE, Cisco Systems, Inc., Enghouse Interactive, Ericsson-LG, Genesys Telecommunications Laboratories, Inc., Grandstream Networks, Inc., Huawei Technologies Co., Ltd, NEC Corporation, Panasonic Corporation, Polycom, Inc., Snom Technology GmbH, VTech Holdings Limited and Yealink Inc. We also compete with software vendors who, in recent years, have expanded their offerings to address the UCC market. This group of competitors includes Microsoft Corporation, Google LLC, and Slack.
Some of these companies compete across many of our product lines, while others are primarily focused in a specific product area. New ventures to create products that do or could compete with our products are regularly formed. In addition, some of our competitors may have greater resources, including technical and engineering resources, than we do. As we expand into new markets, we will face competition not only from our existing competitors but also from other competitors, including existing companies with strong technological, marketing and sales positions in those markets. We also sometimes face competition from resellers and distributors of our products. Companies with which we have strategic alliances in some areas may be competitors in other areas, and in our view this trend may increase. In addition, because the market for our products is subject to rapid technological change as the market evolves, we may face competition in the future from companies that do not currently compete in our markets, including companies that currently compete in other sectors of the information technology, communications and software industries.
Sales and Marketing
Our products, solutions and services are primarily sold through an indirect go-to-market model. We address the needs of business customers in approximately 100 countries through over 4,000 channel partners, distribution partners and master agents. We believe our extensive channel partner network, combined with our corporate and regional support, allows us to scale our business for volume and sell our solutions globally, resulting in an efficient cost-of-sale model. We recruit our channel partners with a focus on expanding go-to-market coverage and securing the skills needed to successfully sell, implement and support our communications solutions.
Research and Development
Our customers are at the center of our R&D program. We regularly seek to introduce new products, features, applications and services to address the requirements of our customers. We put the customer at the center of everything we do. Our history of success in software-based cloud and enterprise communications solutions has provided us with the foundation for continued innovation. In recent years, we have increasingly invested in cloud-based R&D to support our rapidly growing cloud business. Our R&D personnel are skilled with deep domain expertise in the diverse areas of telecommunications, IP networking, unified communications, Contact Center solutions software and vertical applications. We work to continuously improve our R&D efforts through operational measurement, adoption of best practices, effective partnerships and investment in our people.
As of December 31, 2017, we had approximately 900 employees working in our R&D department on cloud and enterprise solutions. Our global R&D workforce is located predominantly in North America, Europe, and India.
Please see Item 6, “Selected Financial Data”, of Part II in this Annual Report for the amount spent during each of the last five fiscal years on R&D activities determined in accordance with U.S. generally accepted accounting principles, or GAAP.
3
Table of Contents
Manufacturing and Supply Chain Management
A significant amount of our cloud and enterprise portfolios consists of appliances and desktop devices. Our objective is to deliver high-quality and unique products to our customers and channel partners while optimizing our operational cost structure and ensuring continuity of supply. To meet this objective, we leverage our contract manufacturers to protect supply continuity and facilitate manufacturing portability across manufacturers.
We primarily use high-volume contract manufacturers. Our primary contract manufacturers are Flex Ltd. and Celestica, Inc. We also utilize a number of smaller contract manufacturers for our legacy product portfolio.
In order to maintain our continuity of supply and reduce supply chain barriers, our strategy for several years has been to procure our high-volume products from a number of contract manufacturers. For our new high-volume products, we implement portable designs by limiting the use of custom and sole source components and by adhering to industry-standard Design For Manufacture and Design For Test guidelines. We manage our own product distribution facilities either directly or through the use of third-party logistics management specialists, all of which are managed by our logistics team. This is implemented with geographically diverse points of distribution, with our principal facilities located in the United States, Canada, the United Kingdom, France, Germany and Switzerland.
Intellectual Property
Our intellectual property assets include patents, industrial designs, trademarks, proprietary software, copyrights, domain names, operating and instruction manuals, trade secrets and confidential business information. These assets are important to our competitiveness and we continue to expand our intellectual property portfolio in order to protect our rights in new technologies and markets. We have a broad portfolio of more than 1,600 patents and pending applications, covering more than 500 inventions, in areas such as Voice over IP, collaboration, presence, messaging and mobility.
We leverage our intellectual property by asserting our rights in certain patented technologies. Certain companies have licensed or offered to purchase patents within our portfolio.
Our solutions contain software applications and hardware components that are either developed and owned by us or licensed to us by third parties. The majority of the software code embodied in our products has been developed internally and is owned by us.
In some cases, we have obtained non-exclusive licenses from third parties to use, integrate and distribute with our products certain packaged software, as well as customized software. This third-party software is either integrated into our own software applications or sold as separate self-contained applications, such as voicemail or unified messaging. The majority of the software that we license is packaged software that is made generally available and has not been customized for our specific purpose. If any of our third-party licenses were to terminate, our options would be to either license a functionally equivalent software application or develop the functionally equivalent software application ourselves.
We have also entered into a number of non-exclusive license agreements with third parties to use, integrate and distribute certain operating systems, digital signal processors and semiconductor components as part of our communications platforms. If any of these third-party licenses were to terminate, we would look to license functionally equivalent technology from another supplier.
It is our general practice to include confidentiality and non-disclosure provisions in the agreements entered into with our employees, consultants, manufacturers, end users, channel partners and others to attempt to limit access to and distribution of our proprietary information. In addition, it is our practice to enter into agreements with employees that include an assignment to us of all intellectual property developed in the course of their employment.
The risks associated with patents and intellectual property are more fully discussed in “Item 1A. Risk Factors—Risks Related to Intellectual Property”.
Employees
We had a total of approximately 3,820 employees worldwide as of December 31, 2017. We consider our relationship with our employees to be positive. Competition for technical personnel in the industry in which we compete is intense. We believe that our future success depends in part on our continued ability to hire, integrate, and retain qualified personnel. To date, we believe that we have been successful in recruiting qualified employees, but there is no assurance that we will continue to be successful in the future.
4
Table of Contents
For financial information on our business segments for the last three fiscal years, see “Item 8. Financial Statements and Supplementary Data.” For geographic information, see “Segment Information – Geographic Information” in note 22 to the consolidated financial statements in “Item 8 – Financial Statements and Supplementary Data.”
Availability of Information
We were incorporated on January 12, 2001 under the Canada Business Corporations Act (CBCA) with our headquarters in Ottawa, Canada. The mailing address of our principal executive offices is 350 Legget Drive, Ottawa, Ontario Canada K2K 2W7, and our telephone number at that location is (613) 592-2122. Our website is www.mitel.com.
We make available, through our website for investors (http://investor.mitel.com), our annual reports on Form 10-K, quarterly reports on Form 10-Q, current reports on Form 8-K and amendments to those reports filed or furnished pursuant to Section 13(a) or 15(d) of the Exchange Act, as soon as reasonably practical after electronically filing such material with the Securities and Exchange Commission (SEC) and with Canadian securities regulators. The reference to our website address does not constitute incorporation by reference of the information contained on the website and should not be considered part of this document. All such filings are available free of charge.
5
Table of Contents
| Item 1A. | Risk Factors |
You should carefully consider the risks below, as well as all of the other information contained in this Report and our financial statements and the related notes included elsewhere in this Report, in evaluating our company and our business. Any of these risks could materially adversely affect our business, financial condition and results of operations and the trading price of our common shares. See “Cautionary Note Regarding Forward-Looking Statements” at the beginning of this Report for additional risks.
Risks Relating to our Business
Our quarterly and annual revenues and operating results have historically fluctuated and the results of one period may not provide a reliable indicator of our future performance.
Our quarterly and annual revenues and operating results have historically fluctuated and are not necessarily indicative of results to be expected in future periods. A number of factors may cause our financial results to fluctuate significantly from period to period, including:
| • | general economic and capital markets conditions; |
| • | the fact that an individual order or contract can represent a substantial amount of revenues for that period; |
| • | the size, timing and shipment of individual orders or customer subscriptions; |
| • | changes in pricing or discount levels by us or our competitors; |
| • | changes in foreign currency exchange rates; |
| • | the mix of products and services sold by us; |
| • | the timing of the announcement, introduction and delivery of new products, programs, services and product enhancements by us or our competitors; |
| • | the ability to execute on our strategy and operating plans; |
| • | the effect of acquisitions and dispositions; |
| • | actual events, circumstances, outcomes and amounts differing from judgments, assumptions and estimates used in determining the values of certain assets (including the amounts of related valuation allowances), liabilities and other items reflected in our consolidated financial statements; |
| • | changes in tax laws, regulations or accounting rules; |
| • | our ability to maintain appropriate inventory levels and purchase commitments; |
| • | the overall movement toward industry consolidation among both our competitors and our customers; |
| • | slowing sales or variations in sales rates by our channel partners to their customers; |
| • | in our cloud segment, customer discontinuance or reduction of their subscriptions, our ability to accurately predict those changes and costs we may incur acquiring new customers as a result; |
| • | changes to our global organization and retention of key personnel; |
| • | fluctuations in our gross margins, and the factors that contribute to such fluctuations; |
| • | changes in the underlying factors and assumptions used in determining stock-based compensation; |
| • | long and variable sales cycles and or regulatory approval cycles; and |
| • | material security breaches or service interruptions due to cyberattacks or infrastructure failures or unavailability. |
As a result of the above factors, a quarterly or yearly comparison of our results of operations is not necessarily meaningful. Prior results are not necessarily indicative of results to be expected in future periods. If our operating results are below the expectations of the stock market, securities analysts or investors, or below any financial guidance we may provide to the market, our share price will likely decline.
6
Table of Contents
If we do not successfully execute our strategic operating plan, or if our strategic operating plan is flawed, our business could be negatively affected.
Each year, we review and update our strategic operating plan, which provides a road map for implementing our business strategy for the next three years. Allocation of resources, investment decisions, product life cycles, process improvements, strategic alliances and acquisitions are based on this plan. In developing the strategic plan, we make certain assumptions including, but not limited to, those related to the market environment, customer demand, evolving technologies, competition, market consolidation, the global economy and our overall strategic operating plan for the upcoming fiscal year. If we do not successfully execute on our strategic operating plan, or if actual results vary significantly from our assumptions, our business could be adversely impacted. Potential adverse impacts include, but are not limited to, investments made in research and development that do not develop into commercially successful products, lower revenues due to our sales focus not being aligned with customer demand or an inability to compete effectively against competitors, operating inefficiencies, or unsuccessful strategic alliances or acquisitions.
We have made strategic acquisitions and may make strategic acquisitions in the future. We may not be successful in operating or integrating these acquisitions or in completing acquisitions that we may agree to make in the future.
In September 2017, we acquired ShoreTel, Inc. As part of our business strategy, we may consider further acquisitions of, or significant investments in, businesses that offer complementary or adjacent products, services and technologies. Mergers and acquisitions of technology companies are inherently risky. Strategic acquisitions or investments could materially adversely affect our operating results and the price of our common shares. Strategic acquisitions and investments, including but not limited to the acquisition of ShoreTel, involve significant risks and uncertainties, including:
| • | unanticipated costs and liabilities; |
| • | difficulties in marketing and integrating new products, software, businesses, operations and technology infrastructure in an efficient, effective and secure manner, including the integration of businesses where a portion or all of the business is in an adjacent industry; |
| • | the inability to achieve synergy and cost reduction targets assumed at the time of acquisition; |
| • | difficulties in maintaining customer and key supplier relations; |
| • | the potential loss of key employees of the acquired businesses, including as a result of cultural differences between the acquired company and our own; |
| • | the diversion of the attention of our senior management from the operation of our daily business; |
| • | the potential adverse effect on our net debt and liquidity position as a result of all or a portion of an acquisition purchase price being paid in cash; |
| • | the potential significant increase of our interest expense, leverage and debt service requirements if we incur additional debt to pay for an acquisition; |
| • | the potential issuance of securities that would dilute our shareholders’ percentage ownership; |
| • | the potential to incur restructuring and other related expenses, including significant transaction costs that may be incurred regardless of whether a potential strategic acquisition or investment is completed; |
| • | the inability to maintain uniform standards, controls, policies and procedures, including the inability to establish and maintain adequate internal controls over financial reporting; |
| • | difficulties in entering markets in which we have no or limited direct prior experience and where competitors in such markets have stronger market positions; |
| • | potential impairment charges on higher levels of goodwill and intangible assets as a result of impairment testing performed on a regular basis; |
| • | higher amortization expenses related to acquired definite-lived intangible assets; and |
| • | becoming subject to intellectual property or other litigation. |
In addition, as part of our business strategy, we may consider dispositions of assets that do not form part of our core business. Many of the risks described above can also apply to any such dispositions. As well, in connection with dispositions, we may be subject to additional risks, including risks relating to post-closing indemnification provisions and risks relating to the receipt by us of non-cash consideration, including risks related to our ability to realize on the expected value of any non-cash consideration received in connection with a disposition. For example, part of the consideration that we received in connection with the sale of the Mobile
7
Table of Contents
business unit included a $35 million non-interest bearing promissory note and an equity interest in the limited partnership that owns the Mobile business unit. We may not be able to realize on the expected value of the non-cash portion of the consideration received, including because the promissory note may not be repaid in full, or at all, and we may not receive any distributions on the limited partnership units.
Our inability to successfully operate and integrate newly acquired businesses appropriately, effectively and in a timely manner, our inability to realize upon the expected benefits of any asset acquisition or disposition, or our inability to successfully complete acquisitions or dispositions that we may agree to make in the future, could have a material adverse effect on our ability to take advantage of future growth opportunities and other advances in technology, as well as on our revenues, gross margins and expenses. No assurance can be given that any particular acquisition or disposition will be completed or that our previous or future acquisitions or dispositions will be successful or will not materially adversely affect our financial condition or operating results. Prior acquisitions have resulted in a wide range of outcomes.
Our operating results may be adversely affected by unfavorable economic and market conditions in key markets, particularly the United States, Germany, the United Kingdom, France, Sweden, Switzerland and elsewhere in Europe.
Challenging economic conditions worldwide, particularly in the United States and in Europe, have, from time to time, contributed, and may continue to contribute, to slowdowns in the communications industry at large, as well as in specific segments and markets in which we operate, resulting in, but not limited to:
| • | reduced demand for our products; |
| • | increased price competition for our products; |
| • | risk of excess and obsolete inventories; |
| • | risk of supply constraints; |
| • | risk of manufacturing capacity; |
| • | higher overhead costs as a percentage of revenue; and |
| • | higher interest expense. |
The global macroeconomic environment is challenging and volatile. Instability in the global credit markets, central bank monetary policies, the instability in the geopolitical environment in many parts of the world and other disruptions, such as changes in energy costs, the United Kingdom’s ongoing process of withdrawal from the European Union, regulatory and policy uncertainty in the United States, and uncertainty surrounding international trade arrangements, such as NAFTA, may adversely impact global economic conditions. If global economic and market conditions, or economic conditions in key markets remain uncertain, we may experience material impacts on our business, operating results, and financial condition.
Our financial results may be adversely affected by fluctuations in exchange rates.
Our financial statements are presented in U.S. dollars while a significant portion of our revenue is earned, and a substantial portion of our operating expenses are payable, in currencies other than the U.S. dollar, in particular the Euro, British pound sterling, Canadian dollar, Swedish krona, Australian dollar, and Swiss franc. Due to the substantial volatility of currency exchange rates, exchange rate fluctuations may have an adverse impact on our future revenues or expenses presented in our financial statements.
We use financial instruments, principally forward foreign currency contracts, to partially mitigate our foreign currency exposure. These contracts generally require us to purchase or sell certain foreign currencies with or for U.S. dollars at contracted rates. These financial instruments only partially mitigate our foreign currency exposure, leaving a significant portion of our revenues and operating expenses subject to exchange rate fluctuations. As a result, foreign currency fluctuations may have an adverse impact on our future revenues, operating expenses and results of operations. In addition, we may be exposed to credit loss in the event of non-performance by the counterparties to the financial instruments.
We expect gross margin percentage to vary over time, and our level of product gross margin may not be sustainable.
Our gross margin percentage has historically fluctuated, primarily as the result of acquisitions, changes in product mix, changes in production costs and price competition. Our current gross margin percentage may not be sustainable and our gross margin percentage may decrease. A decrease in gross margin percentage can be the result of numerous factors, including:
| • | acquisitions with a lower gross margin percentage than Mitel; |
8
Table of Contents
| • | changes in customer, geographic, or product mix, including mix of configurations within each product group; |
| • | introduction of new products, including products with price-performance advantages; |
| • | our ability to reduce production costs; |
| • | entry into new markets or growth in lower margin markets, including markets with different pricing and cost structures; |
| • | additional sales discounts; |
| • | changes in the financial health of contract manufacturers or suppliers or increases in related material, component, labor or other manufacturing and inventory related costs; |
| • | the timing of revenue recognition and revenue deferrals; |
| • | a decrease in revenues, while certain distribution costs remain fixed; |
| • | lower than expected benefits from value engineering; |
| • | increased price competition; |
| • | changes in distribution channels; |
| • | increased warranty costs; and |
| • | overall execution of our strategy and operating plans. |
If any of these factors, or other factors unknown to us at this time, occur then our gross margin percentage could be adversely affected, which could lead to an adverse effect, which could be material on our business, financial condition and results of operations.
We rely on our channel partners (which includes our wholesale distribution channel) for a significant component of our sales and so disruptions to, or our failure to effectively develop and manage, our distribution channel and the processes and procedures that support it, could have a material adverse effect on our ability to generate revenues.
Our future success is highly dependent upon establishing and maintaining successful relationships with a variety of channel partners. A substantial portion of our revenues is derived through and dependent upon our channel partners, most of which also sell our competitors’ products. In addition, many potential channel partners have established relationships with our competitors and may not be willing to invest the time and resources required to train their staff to effectively market our solutions and services. The loss of, or reduction in, sales to these channel partners could materially reduce our revenues. Our competitors may in some cases be effective in causing our channel partners or potential channel partners to favor their products or prevent or reduce sales of our solutions. If we fail to maintain relationships with these channel partners, fail to develop new relationships with channel partners in new markets or expand the number of channel partners in existing markets, fail to manage, train or provide appropriate incentives to existing channel partners or if these channel partners are not successful in their sales efforts, sales of our solutions may decrease and our operating results would suffer.
We face intense competition from many competitors and we may not be able to compete effectively against these competitors.
The market for our solutions is highly competitive. In addition, because the market for our solutions is subject to rapidly changing technologies, we may face competition in the future from companies that do not currently compete in our business communications market, including companies that currently compete in other sectors of the information technology, communications or software markets, including mobile communications companies or communications companies that serve residential customers, rather than business customers.
Several of our existing competitors have, and many of our future potential competitors may have, greater financial, personnel, research, project management and other resources, more well-established brands or reputations and broader customer bases than we have. As a result, these competitors may be in a stronger position to respond more effectively to potential acquisitions and other market opportunities, new or emerging technologies and changes in customer requirements. Some of these competitors may also have customer bases that are more diversified than ours and therefore may be less affected by an economic downturn in a particular region. Competitors with greater resources may also be able to offer lower prices, additional products or services or other incentives that we do not offer or cannot match.
9
Table of Contents
Competition from existing and potential market entrants may take many forms:
| • | To the extent our competitors supply products that compete with our own, it is possible these competitors could design their technologies to be closed or proprietary systems that are incompatible with our products or work less effectively with our products than their own. As a result, customers would have an incentive to purchase products that are compatible with the products and technologies of our competitors over our products. A lack of interoperability may result in significant redesign costs, and harm relations with our customers; |
| • | To the extent our competitors offer sales models, such as a subscription based models, that compete with our own offerings, it is possible that these offerings may be more attractive to our customers. As a result, customers may prefer our competitors’ products over our products; |
| • | Our competitors may provide large bundled offerings that incorporate applications and products similar to those that we offer; and |
| • | If our competitors offer deep discounts on certain products or services in an effort to recapture or gain market share, we may be required to lower our prices or offer other favorable terms to compete effectively, which would reduce our revenues and gross margins and could adversely affect our operating results and financial condition. |
Please see Item 1, “Business—Competition” in Part I in this Annual Report for a list of our competitors.
Industry consolidation may lead to increased competition and may harm our operating results.
There has been a trend toward industry consolidation in our markets for several years. We expect this trend to continue as companies attempt to strengthen or hold their market positions in an evolving industry and as companies are acquired or are unable to continue all or a portion of their operations. Companies that are strategic alliance partners in some areas of our business may acquire or form alliances with our competitors, thereby reducing their business with us. We believe that industry consolidation may result in stronger competitors that are better able to compete as sole-source vendors for customers. This could materially adversely affect our business, operating results and financial condition.
Our solutions may fail to keep pace with rapidly changing technology, evolving industry standards and customer demands and requirements.
The markets in which we operate are characterized by rapid, and sometimes disruptive, technological developments, evolving industry standards, frequent new product introduction and enhancements and changes in customer requirements. Our products and services, or third-party solutions with which our products interface, can evolve rapidly and in ways we may not anticipate. The process of anticipating trends and evolving industry standards and developing new solutions is complex and uncertain, and if we fail to accurately identify, predict and respond to our customers’ changing needs, and emerging technological trends, our business could be harmed. We commit significant resources to developing new solutions before knowing whether our investments will result in solutions that the market will accept.
Our operating results may be adversely affected if the market opportunity for our products and services does not develop in the ways that we anticipate, if our products become incompatible with third-party solutions or if other technologies become more accepted or standard in our industry.
We are dependent on our customers’ decisions to purchase our solutions.
Our business remains dependent on customer decisions to migrate their legacy communications infrastructures to solutions based on newer technology. While these investment decisions are often driven by macroeconomic factors, customers may also delay the purchase of newer technology due to a range of other factors, including prioritization of other IT projects, delays or failures to meet certifications requirements of certain of our customers and the weighing of the costs and benefits of deploying new infrastructures and devices. The purchase of our solutions among new or existing customers may not grow at the rates we currently anticipate.
A breach of the security of our information systems, those of our third-party providers, or other parties that we do business with, could adversely affect our operating results.
In the current environment, there are numerous and evolving risks to cybersecurity and privacy, including criminal hackers, state-sponsored intrusions, industrial espionage, employee malfeasance, and human or technological error. Computer hackers and others routinely attempt to breach the security of technology products, services, and systems such as ours, and those of customers, third-party contractors and vendors, and some of those attempts may be successful. We are not immune to these types of intrusions.
10
Table of Contents
Our products, services, network systems, and servers may store, process or transmit proprietary information and sensitive or confidential data, including valuable intellectual property and personal information, of ours and of our employees, customers and other third parties. We are also subject to existing and proposed laws and regulations, as well as government policies and practices, related to cybersecurity, privacy and data protection and cross-border data transfer regulations worldwide.
Although we take cybersecurity seriously and devote significant resources and deploy protective network security tools and devices, data encryption and other security measures to prevent unwanted intrusions and to protect our systems, products and data, we have and will continue to experience cyber-attacks of varying degrees in the conduct of our business. As a result, our network may be subject to unauthorized access, viruses, embedded malware and other malicious software programs. Such intrusions may result in unauthorized access to or disclosure, modification, misuse, loss, or destruction of company, customer, or other third-party data or systems, the theft of sensitive or confidential data including intellectual property and business and personal information, system disruptions, access to our financial reporting systems, operational interruptions, product or shipment disruptions or delays, and delays in or cessation of the services we offer.
Any such breaches or unauthorized access to our networks, our products or services, or those of third-party products incorporated into our solutions, could ultimately result in significant legal and financial exposure, litigation, regulatory and enforcement action, and loss of valuable company intellectual property. Such breaches could also cause damage to our reputation, impact the market’s perception of us and of the products and services that we offer, and cause an overall loss of confidence in the security of our products and services, resulting in a potentially material adverse effect on our business, revenues and results of operations, as well as customer attrition.
In addition, the cost and operational consequences of investigating, remediating, eliminating and putting in place additional information technology (IT) tools and devices designed to prevent actual or perceived security breaches, as well as the costs to comply with any notification obligations resulting from such a breach, could be significant. Further, due to the growing sophistication of the techniques used to obtain unauthorized access to or to sabotage networks and systems, which change frequently and often are not detected immediately by existing antivirus and other detection tools, we may be unable to anticipate these techniques or to implement adequate preventative measures. We can make no assurance that we will be able to detect, prevent, timely and adequately address or mitigate such cyber-attacks or security breaches. Our cyber-risk insurance coverage and limits may not be sufficient to compensate for losses or damages that may occur.
Other risks that may result from interruptions to our business due to cyber-attacks are discussed in the risk factor entitled “Business interruptions could adversely affect our operations.”
Our business may be harmed if we infringe intellectual property rights of third parties.
There is considerable patent and other intellectual property development activity in our industry. Our success depends, in part, upon not infringing intellectual property rights owned by others. Our competitors, as well as a number of individuals, patent holding companies and consortiums, own, or claim to own, intellectual property relating to our industry. Our solutions may infringe the patents or other intellectual property rights of third parties. We cannot determine with certainty whether any existing third-party patent, or the issuance of new third-party patents, would require us to alter our solutions, obtain licenses, pay royalties or discontinue the sale of the affected applications and products. Our competitors may use their patent portfolios in an increasingly offensive manner in the future. We are currently and periodically involved in patent infringement disputes with third parties, including claims that have been made against us for the payment of licensing fees. We have received notices in the past, and we may receive additional notices in the future, containing allegations that our solutions are subject to patents or other proprietary rights of third parties, including competitors, patent holding companies and consortiums. Current or future negotiations with third parties to establish license or cross-license arrangements, or to renew existing licenses, may not be successful and we may not be able to obtain or renew a license on satisfactory terms, or at all. If required licenses cannot be obtained, or if existing licenses are not renewed, litigation could have a material adverse effect on our business.
Our success also depends upon our customers’ ability to use our products. In the past, claims of patent infringement have been asserted against some of our channel partners based on their use of our solutions, and there may be similar claims made in the future. We generally agree to indemnify and defend our channel partners and direct customers to the extent a claim for infringement is brought against our customers with respect to our solutions.
Aggressive patent litigation is common in our industry and can be disruptive. Infringement claims (or claims for indemnification resulting from infringement claims) have been and may in the future be asserted or prosecuted against us, our channel partners or our customers by third parties. Some of these third parties, including our competitors, patent holding companies and consortiums, have, or have access to, substantially greater resources than we do and may be better able to sustain the costs of complex patent litigation. Whether or not the claims against us, our channel partners or our customers, or those that may be brought in the future, have merit, we
11
Table of Contents
may be subject to costly and time-consuming legal proceedings. Such claims could also harm our reputation and divert our management’s attention from operating our business. If these claims are successfully asserted against us, we could be required to pay substantial damages (including enhanced damages and attorneys’ fees if infringement is found to be willful). We could also be forced to obtain a license, which may not be available on acceptable terms, if at all, forced to redesign our solutions to make them non-infringing, which redesign may not be possible or, if possible, costly and time-consuming, or prevented from selling some or all of our solutions.
Our success is, in part, dependent on our intellectual property. Our inability or failure to secure, protect and maintain our intellectual property could seriously harm our ability to compete and our financial success.
Our success depends in part on the intellectual property in the solutions that we develop and sell. We rely upon a combination of copyright, patent, trade secrets, trademarks, confidentiality procedures and contractual provisions to protect our proprietary technology. Our present protective measures may not be enforceable or adequate to prevent misappropriation of our technology or independent third-party development of the same or similar technology. Even if our patents are held valid and enforceable, others may be able to design around these patents or develop products competitive to our products but that are outside the scope of our patents.
Any of our patents may be challenged, invalidated, circumvented or rendered unenforceable. We may not be successful should one or more of our patents be challenged for any reason. If our patent claims are rendered invalid or unenforceable, or narrowed in scope, the patent coverage afforded to our solutions could be impaired, which could significantly impede our ability to market our products, negatively affect our competitive position and materially adversely affect our business and operating results.
Pending or future patent applications held by us may not result in an issued patent, or if patents are issued to us, such patents may not provide meaningful protection against competitors or against competitive technologies. We may not be able to prevent the unauthorized disclosure or use of our technical knowledge or trade secrets by consultants, vendors, former employees and current employees, despite the existence of nondisclosure and confidentiality agreements and other contractual restrictions. Furthermore, many foreign jurisdictions offer less protection of intellectual property rights than the United States, Canada and the European Union, and the protection provided to our proprietary technology by the laws of these and other foreign jurisdictions may not be sufficient to protect our technology. Preventing the unauthorized use of our proprietary technology may be difficult, time consuming and costly, in part because it may be difficult to discover unauthorized use by third parties. Litigation may be necessary to enforce our intellectual property rights, to protect our trade secrets, to determine the validity and scope of our proprietary rights, or to defend against claims of unenforceability or invalidity. Any litigation, whether successful or unsuccessful, could result in substantial costs and diversion of management resources and could have a material adverse effect on our business, results of operations and financial condition regardless of its outcome.
Some of the software used with our products, as well as that of some of our customers, may be derived from so-called “open source” software that is made generally available to the public by its authors and/or other third parties. Such open source software is often made available to us under licenses, such as the GNU General Public License, that impose certain obligations on us in the event we were to make derivative works of the open source software. These obligations may require us to make source code for the derivative works available to the public, or license such derivative works under an open source license or another particular type of license, potentially granting third parties certain rights to the software, rather than the forms of license customarily used to protect our intellectual property. Failure to comply with such obligations can result in the termination of our distribution of products that contain the open source code or the public dissemination of any enhancements that we made to the open source code. We may also incur legal expenses in defending against claims that we did not abide by such open source licenses. In the event the copyright holder of any open source software or another party in interest were to successfully establish in court that we had not complied with the terms of a license for a particular work, we could be subject to potential damages and could be required to release the source code of that work to the public, grant third parties certain rights to the source code or stop distribution of that work. Any of these outcomes could disrupt our distribution and sale of related products and materially adversely affect our business.
We rely on trade secrets and other forms of non-patent intellectual property protection. If we are unable to protect our trade secrets, other companies may be able to compete more effectively against us.
We rely on trade secrets, know-how and technology that are not protected by patents to maintain our competitive position. We try to protect this information by entering into confidentiality agreements with parties that have access to it, such as our partners, collaborators, employees and consultants. Any of these parties may breach these agreements and we may not have adequate remedies for any specific breach. In addition, our trade secrets may otherwise become known or be independently discovered by competitors. To the extent that our partners, collaborators, employees and consultants use intellectual property owned by others in their work for us, disputes may arise as to the rights to the related or resulting know-how and inventions. If any of our trade secrets, know-how or other technologies not protected by a patent were to be disclosed to, or independently developed by, a competitor, our business, financial condition and results of operations could be materially adversely affected.
12
Table of Contents
We may be subject to damages resulting from claims that we, or our employees, have wrongfully used or disclosed alleged trade secrets or other proprietary information of their former employers.
Many of our employees may have been previously employed at other companies which provide integrated communications solutions, including our competitors or potential competitors. We may be subject to claims that these employees, or we, have inadvertently or otherwise used or disclosed trade secrets or other proprietary information of their former employers. Litigation may be necessary to defend against these claims. Even if we are successful in defending against these claims, litigation could result in substantial costs and be a distraction to management. If we fail in defending such claims, in addition to paying monetary claims, we may lose valuable intellectual property rights or personnel. A loss of key personnel or their work product could hamper or prevent our ability to commercialize certain product candidates, which would adversely affect our commercial development efforts, business, financial condition and results of operations.
Our business requires a significant amount of cash and we may require additional sources of funds if our sources of liquidity are unavailable or insufficient to fund our operations.
We may not generate sufficient cash from operations to meet anticipated working capital requirements, execute our strategic operating plans, support additional capital expenditures or take advantage of acquisition opportunities. In order to finance our business, we may need to utilize available borrowings under our available credit facilities. Our ability to continually access our facilities is conditional upon our compliance with covenants contained in the terms governing these facilities. We may not be in compliance with such covenants in the future. We may need to secure additional sources of funding if our cash and borrowings under our revolving credit facility are unavailable or insufficient to finance our operations. Such funding may not be available on terms satisfactory to us, or at all. In addition, any proceeds from the issuance of debt may be required to be used, in whole or in part, to make mandatory payments under our credit agreements. If we were to incur higher levels of debt, we would require a larger portion of our operating cash flow to be used to pay principal and interest on our indebtedness. The increased use of cash to pay indebtedness could leave us with insufficient funds to finance our operating activities, such as R&D expenses and capital expenditures. In addition, any new debt instruments may contain covenants or other restrictions that affect our business operations. If we were to raise additional funds by selling equity securities, the relative ownership of our existing investors could be diluted or the new investors could obtain terms more favorable than previous investors.
We have a significant amount of debt. This debt contains customary default clauses, a breach of which may result in acceleration of the repayment of some or all of this debt.
As at December 31, 2017, we had $633.6 million outstanding under our senior secured credit facilities. The senior credit facilities consist of an initial $150.0 million term loan, a $300.0 million incremental term loan and a $350.0 million revolving facility. The term loan and revolving credit facility mature in March 2022 and the incremental term loan matures in September 2023. The credit agreement relating to these facilities has customary default clauses. In the event we were to default on this credit agreement, and were unable to cure or obtain a waiver of default, the repayment of our debt owing under this credit agreement may be accelerated. If acceleration were to occur, we would be required to secure alternative sources of equity or debt financing to be able to repay the debt. Alternative financing may not be available on terms satisfactory to us, or at all. New debt financing may require the cooperation and agreement of our existing lenders. If acceptable alternative financing were unavailable, we would have to consider alternatives to fund the repayment of the debt, including the sale of part or all of the business, which sale may occur at a distressed price.
The agreements governing our indebtedness contain restrictions and limitations that could significantly impact our ability to operate our business.
The agreements governing our indebtedness contain covenants that place limitations on the dollar amounts paid or other actions relating to:
| • | payments in respect of, or redemptions or acquisitions of, debt or equity issued by us or our subsidiaries, including the payment of dividends on our common shares; |
| • | incurring additional indebtedness; |
| • | incurring guarantee obligations; |
| • | engaging in sales or other dispositions of assets; |
13
Table of Contents
| • | creating liens on assets; |
| • | entering into sale and leaseback transactions; |
| • | making investments, loans or advances; |
| • | entering into hedging transactions; |
| • | engaging in mergers, consolidations or sales of all or substantially all of our assets; and |
| • | engaging in certain transactions with affiliates. |
In addition, we are required to maintain a maximum consolidated total net leverage ratio and minimum interest coverage ratio as set forth in the agreements governing such indebtedness. Our ability to comply with these covenant in future periods will depend on our ongoing financial and operating performance, which in turn will be subject to economic conditions and to financial, market and competitive factors, many of which are beyond our control. The ability to comply with these covenant in future periods will also depend on our ability to successfully implement our overall business strategy and realize contemplated acquisition synergies.
Our working capital requirements and cash flows are subject to fluctuation which could have an adverse effect on us.
Our working capital requirements and cash flows have historically been, and are expected to continue to be, subject to quarterly and yearly fluctuations, depending on a number of factors. If we are unable to manage fluctuations in cash flow, our business, operating results and financial condition may be materially adversely affected. For example, if we are unable to effectively manage fluctuations in our cash flows, we may be unable to make required interest payments on our indebtedness. Key factors which could result in cash flow fluctuations include:
| • | the level of sales and the related margins on those sales; |
| • | the timing of, and amount paid for, acquisitions; |
| • | the timing of receivables collections; |
| • | the timing and volume of sales of leases to third-party funding sources and the timing and volume of any repurchase obligations in respect of such sales; |
| • | the timing and size of capital expenditures; |
| • | the timing and size of purchase of inventory and related components; |
| • | the size of the annual mandatory excess cash flow repayments on our senior secured credit facilities; |
| • | the timing of payment on payables and accrued liabilities; |
| • | the effect of foreign exchange rate fluctuations on foreign currency cash flows; and |
| • | costs associated with potential restructuring actions. |
If any of these aforementioned factors were to occur, our cash flow could be negatively impacted and have a material adverse effect on our liquidity position and financial condition.
Because we depend upon a small number of outside contract manufacturers, our operations could be delayed or interrupted if we encounter problems with these contractors.
We do not have any internal manufacturing capabilities, and we rely upon a limited number of contract manufacturers. Our ability to ship products to our customers could be delayed or interrupted as a result of a variety of factors relating to our contract manufacturers, including:
| • | failure to effectively manage our contract manufacturer relationships; |
| • | our contract manufacturers experiencing delays, disruptions or quality control problems in their manufacturing operations; |
| • | lead-times for required materials and components varying significantly and being dependent on factors such as the specific supplier, contract terms and the demand for each component at a given time; |
14
Table of Contents
| • | under-estimating our requirements, resulting in our contract manufacturers having inadequate materials and components required to produce our products, or overestimating our requirements, resulting in charges assessed by the contract manufacturers or liabilities for excess inventory, each of which could negatively affect our gross margins; and |
| • | the possible absence of adequate capacity and reduced control over component availability, quality assurances, delivery schedules, manufacturing yields and costs. |
We are also exposed to risks relating to the financial viability of our contract manufacturers as a result of business and industry risks that affect those manufacturers. In order to finance their businesses during economic downturns or otherwise, our contract manufacturers may need to secure additional sources of equity or debt financing. Such funding may not be available on terms satisfactory to them, or at all, which could result in a material disruption to our production requirements.
If any of our contract manufacturers are unable or unwilling to continue manufacturing our products in required volumes and quality levels, we will have to identify, qualify, select and implement acceptable alternative manufacturers, which would likely be time consuming and costly. In particular, certain contract manufacturers are sole manufacturing sources for certain of our products. A failure of our contract manufacturers to satisfy our manufacturing needs on a timely basis, as a result of the factors described above or otherwise, could result in a material disruption to our business until another manufacturer is identified and able to produce the same products, which could take a substantial amount of time, during which our results of operations, financial condition and reputation among our customers and within our industry could be materially and adversely affected. In addition, alternate sources may not be available to us or may not be in a position to satisfy our production requirements on a timely basis or at commercially reasonable prices and quality. Therefore, any significant interruption in manufacturing could result in us being unable to deliver the affected products to meet our customer orders.
We depend on sole source and limited source suppliers for key components. If these components are not available on a timely basis, or at all, we may not be able to meet scheduled product deliveries to our customers.
We depend on sole source and limited source suppliers for key components of our products. In addition, our contract manufacturers often acquire these components through purchase orders and may have no long-term commitments regarding supply or pricing from their suppliers. Lead times for various components may lengthen, which may make certain components scarce. As component demand increases and lead-times become longer, our suppliers may increase component costs. We also depend on anticipated product orders to determine our materials requirements. Lead times for limited source materials and components can be as long as six months, vary significantly and depend on factors such as the specific supplier, contract terms and demand for a component at a given time. From time to time, shortages in allocations of components have resulted in delays in filling orders. Shortages and delays in obtaining components in the future could impede our ability to meet customer orders. Any of these sole source or limited source suppliers could stop producing the components, cease operations entirely, or be acquired by, or enter into exclusive arrangements with, our competitors. As a result, these sole source and limited source suppliers may stop selling their components to our contract manufacturers at commercially reasonable prices, or at all. Any such interruption, delay or inability to obtain these components from alternate sources at acceptable prices and within a reasonable amount of time would adversely affect our ability to meet scheduled product deliveries to our customers and reduce margins realized by us.
Delay in the delivery of, or lack of access to, software or other intellectual property licensed from our suppliers could adversely affect our ability to develop and deliver our solutions on a timely and reliable basis.
Our business may be harmed by a delay in delivery of software applications from one or more of our suppliers. Many of our solutions are designed to include software or other intellectual property licensed from third parties. It may be necessary in the future to seek or renew licenses relating to various components in our solutions. These licenses may not be available on acceptable terms, or at all. Moreover, the inclusion in our solutions of software or other intellectual property licensed from third parties on a non-exclusive basis could limit our ability to protect our proprietary rights to our solutions. Non-exclusive licenses also allow our suppliers to develop relationships with, and supply similar or the same software applications to, our competitors. Our software licenses could terminate in the event of a bankruptcy or insolvency of a software supplier or other third-party licensor. Our software licenses could also terminate in the event such software infringes third-party intellectual property rights. We have not entered into source code escrow agreements with every software supplier or third-party licensor, and we could lose the ability to use such licensed software or implement it in our solutions in the event the licensor breaches its obligations to us. In the event that software suppliers or other third-party licensors terminate their relationships with us, are unable to fill our orders on a timely basis or their licenses are otherwise terminated, we may be unable to deliver the affected products to meet our customer orders.
15
Table of Contents
Our operations in international markets involve inherent risks that we may not be able to control.
We do business in approximately 100 countries. Accordingly, our results could be materially and adversely affected by a variety of uncontrollable and changing factors relating to international business operations, including:
| • | macroeconomic conditions adversely affecting geographies where we do business; |
| • | foreign currency exchange rates; |
| • | geopolitical developments, such as the United Kingdom’s ongoing process of withdrawal from the European Union, and uncertainty surrounding international trade arrangements, such as NAFTA; |
| • | political or social unrest or economic instability in a specific country or region; |
| • | economic sanctions imposed by or against countries where we do business; |
| • | higher costs of doing business in foreign countries; |
| • | infringement claims on foreign patents, copyrights or trademark rights; |
| • | difficulties in staffing and managing operations across disparate geographic areas; |
| • | difficulties associated with enforcing agreements and intellectual property rights through foreign legal systems; |
| • | trade protection measures and other regulatory requirements; |
| • | adverse tax consequences; |
| • | unexpected changes in legal and regulatory requirements; |
| • | military conflict, terrorist activities, natural disasters and medical epidemics; and |
| • | our ability to recruit and retain channel partners in foreign jurisdictions. |
Changes in our provision for income taxes or adverse outcomes resulting from examination of our income tax returns could adversely affect our results.
Our provision for income taxes is subject to volatility and could be adversely affected by numerous factors, including:
| • | earnings being lower than anticipated in countries that have lower tax rates and higher than anticipated in countries that have higher tax rates; |
| • | changes in the valuation of our deferred tax assets and liabilities; |
| • | expiration of R&D tax credits and loss carryforwards; |
| • | expiration of or lapses in tax incentives; |
| • | transfer pricing adjustments; |
| • | tax effects of nondeductible compensation; |
| • | tax costs related to intercompany realignments; |
| • | changes in accounting principles; and |
| • | changes in tax laws and regulations, treaties, or interpretations thereof, including possible changes to the taxation of earnings of our foreign subsidiaries, the deductibility of expenses attributable to foreign income, or the foreign tax credit rules. US tax reform legislation was enacted on December 22, 2017. Some of the specific details have yet to be clarified and therefore, management has estimated the implications based on the best information available. Therefore, there may be further impacts on the Company as further clarification and interpretation of certain aspects of the US Tax Reform are released. |
Significant judgment is required to determine the recognition and measurement prescribed in the accounting guidance for uncertainty in income taxes. The Organization for Economic Co-operation and Development (OECD), an international association of countries including the United States, is contemplating changes to numerous long-standing tax principles. These contemplated changes, if finalized and adopted by countries, will increase tax uncertainty and may adversely affect our provision for income taxes. Further, as a result of certain of our ongoing employment and capital investment actions and commitments, our income in certain countries is subject to reduced tax rates. Our failure to meet these commitments could adversely impact our provision for income taxes.
16
Table of Contents
We are also subject to the periodic examination of our income tax returns by the Internal Revenue Service and other tax authorities. We regularly assess the likelihood of adverse outcomes resulting from these examinations to determine the adequacy of our provision for income taxes. There can be no assurance that the outcomes from such examinations will not have an adverse effect on our operating results and financial condition.
Transfer pricing rules may adversely affect our income tax expense.
We conduct business operations in various jurisdictions and through legal entities in Canada, the United States, throughout Europe and elsewhere. We and certain of our subsidiaries provide solutions and services to, and undertake certain significant transactions with, other subsidiaries in different jurisdictions. The tax laws of many of these jurisdictions have detailed transfer pricing rules which require that all transactions with non-resident related parties be priced using arm’s length pricing principles. Contemporaneous documentation must exist to support this pricing. The taxation authorities in the jurisdictions where we carry on business could challenge our transfer pricing policies. International transfer pricing is an area of taxation that depends heavily on the underlying facts and circumstances and generally involves a significant degree of judgment. If any of these taxation authorities are successful in challenging our transfer pricing policies, our income tax expense may be adversely affected and we could also be subjected to interest and penalty charges. Any increase in our income tax expense and related interest and penalties could have a significant impact on our future earnings and future cash flows.
Credit and commercial risks and exposures could increase if the financial condition of our customers declines.
Most of our sales are on an open credit basis. We monitor individual customer payment capability in granting such open credit arrangements, seek to limit such open credit to amounts we believe the customers can pay and maintain reserves we believe are adequate to cover exposure for doubtful accounts.
Impairment of our goodwill or other assets would negatively affect our results of operations.
As of December 31, 2017, our goodwill was $535.9 million and identifiable intangible assets were approximately $420.8 million, which together represent a significant portion of the assets recorded on our consolidated balance sheet. Goodwill is reviewed for impairment at least annually. If an impairment is deemed to exist, we would write-down the recorded value of goodwill to its fair value. Other intangible assets that are deemed to have finite useful lives are amortized over their useful lives but must be reviewed for impairment when events or changes in circumstances indicate that the carrying amount of these assets may not be recoverable. If an impairment is deemed to exist, we would write-down the recorded value of intangible assets to their recoverable values. As a result, we may be required to record a goodwill or intangible asset impairment charge in the future, in particular if our operating results are below expectations, and these write-downs could harm our business and results of operations. Further, we cannot be assured that future inventory, investment, license, fixed asset or other asset write-downs will not happen. If future write-downs do occur, they could harm our business and results of operations. Assessing whether impairment indicators exist, performing the annual goodwill impairment test and, if required, calculating the fair value or recoverable value of assets, requires significant judgment.
Quality issues, which may be difficult to detect, may occur in our solutions.
We sell highly complex solutions that included hardware, software and services. Our solutions may contain design flaws or other quality issues that can interfere with expected performance. Although we undertake a number of quality assurance measures to reduce such risks, product quality or service performance issues may arise and, as a result, negatively affect our reputation. Furthermore, if significant warranty obligations or remediation costs arise due to reliability or quality issues, our operating results and financial position could be negatively impacted by costs associated with fixing software or hardware defects, high service and warranty expenses, high inventory obsolescence expense, delays in collecting accounts receivable or declining sales to existing and new customers.
17
Table of Contents
Our business may suffer if our strategic alliances are not successful.
We have a number of strategic alliances and continue to pursue strategic alliances with other companies. The objectives and goals for a strategic alliance can include one or more of the following: technology exchange, product development, joint sales and marketing, or new-market creation. If a strategic alliance fails to perform as expected or if the relationship is terminated, we could experience delays in product availability or impairment of our relationships with customers, and our ability to develop new solutions in response to industry trends or changing technology may be impaired. In addition, we may face increased competition if a third party acquires one or more of our strategic alliances or if our competitors enter into additional successful strategic relationships.
Our future success depends on our existing key personnel.
Our success is dependent upon the services of key personnel throughout our organization, including the members of our senior management and software and engineering staff, as well as the expertise of our directors. Competition for highly skilled directors, management, R&D and other employees is intense in our industry and we may not be able to attract and retain highly qualified directors, management, and R&D personnel and other employees in the future. In order to improve productivity, a portion of our compensation to employees and directors is in the form of equity-based incentives such as restricted stock units and stock options, and as a consequence, a depression in the value of our common shares could make it difficult for us to motivate and retain employees and recruit additional qualified directors and personnel. All of the foregoing may negatively impact our ability to retain or attract employees, which may adversely impact our ability to implement a management succession plan as and if required and on a timely basis. We currently do not maintain corporate life insurance policies on the lives of our directors or any of our key employees. In addition, companies in our industry whose employees accept positions with competitors frequently claim that competitors have engaged in improper hiring practices. We have received these claims in the past and may receive additional claims to this effect in the future.
Business interruptions could adversely affect our operations.
Our operations and those of our suppliers, contract manufacturers and outsourced service providers are vulnerable to interruption by fire, earthquake, hurricane, flood or other natural disaster, power loss, computer viruses, cyber security breaches, computer systems failure, telecommunications failure, quarantines, national catastrophe, terrorist activities, war and other events beyond our control. In particular, as we look to continue to develop our cloud segment, interruptions or delays in service from our third-party data center hosting facilities as a result of these vulnerabilities could impair the delivery of our subscriptions, result in interruptions in our service, require us to issue credits or pay penalties and harm our business. Our disaster recovery plans may not be sufficient to address these interruptions. The coverage or limits of our business interruption insurance may not be sufficient to compensate for any losses or damages that may occur.
We rely on carriers and network service providers to provide network capacity and connectivity, the absence or disruption of which may adversely affect our cloud segment.
We purchase network capacity wholesale from carriers, which we resell to our customers in various retail offerings. If any of these carriers or network service providers experience disruptions to their operations, even if only for a limited time, cease operations, or otherwise terminate the services that we depend on, the delay in switching our technology to another carrier or network service provider, if available, and qualifying them could have a material adverse effect on our business, financial condition or operating results. The rates we pay to our carriers and network service providers may also increase, which may reduce our profitability and increase the retail price of our service.
Any impairment of the performance of our solutions or problems in providing our network services to our customers, even if for a limited time, could have an adverse effect on our business, financial condition and operating results.
Changing laws and increasingly complex corporate governance and public disclosure requirements could have an adverse effect on our business and operating results.
Changing laws, regulations and standards, including those relating to corporate governance, social/environmental responsibility, import and export requirements, data privacy, global anticorruption and public disclosure regulations, have created additional compliance requirements for us, our contract manufacturers, our OEM partners and certain other suppliers. Our efforts to comply with these requirements have resulted in an increase in expenses and a diversion of management’s time from other business activities. While we believe we are compliant with laws and regulations in jurisdictions where we do business, we must continue to monitor and assess our compliance in the future, and we must also continue to expand our compliance procedures. For example, although we implement policies and procedures designed to facilitate compliance with global anticorruption laws, our employees, channel partners, contractors and agents, as well as those companies to which we outsource certain of our business operations, may take actions in violation of our policies. Any failures in these procedures in the future, even if prohibited by our policies, could result in time-consuming and costly activities, potential fines and penalties, and diversion of management time, all of which could hurt our business.
18
Table of Contents
Our products and services are subject to various federal, state, local, and foreign laws and regulations. Compliance with current laws and regulations has not had a material adverse effect on our financial condition. However, new laws and regulations or new or different interpretations of existing laws and regulations could deny or delay our access to certain markets or require us to incur costs or become the basis for new or increased liabilities that could have a material adverse effect on our financial condition and results of operations.
The telecommunications industry is regulated by the Federal Communications Commission in the United States and similar government agencies in other countries and is subject to changing political, economic, and regulatory influences. Changes in telecommunications requirements, or regulatory requirements in other industries in which we operate now or in the future, in the United States or other countries could materially adversely affect our business, operating results, and financial condition, including our managed services offering. Further, changes in the regulation of our activities, such as increased or decreased regulation affecting prices, could also have a material adverse effect upon our business and results of operations.
Adverse resolution of litigation or governmental investigations may harm our operating results or financial condition.
We are a party to lawsuits in the normal course of our business. We may also be the subject of governmental investigations from time to time. Litigation and governmental investigations can be expensive, lengthy and disruptive to normal business operations. Moreover, the results of complex legal proceedings or governmental investigations are difficult to predict. An unfavorable resolution of lawsuits or governmental investigations could have a material adverse effect on our business, operating results or financial condition.
We are exposed to risks inherent in our defined benefit pension plans.
We operate defined benefit plans primarily in the U.K., France, Germany and Switzerland (the “U.K Plan”, the “France Plan”, the “Germany Plan” and the “Switzerland Plan”, respectively). At December 31, 2017, the total projected benefit obligation for these plans of $417.6 million exceeded plan assets of $297.5 million resulting in a pension liability of $120.1 million.
The U.K. Plan is a partially funded defined benefit plan, which was closed to new members in 2001 and was closed to new service in November 2012. Under the France Plan, retirees generally benefit from a lump sum payment upon retirement or departure. Under the Germany Plan, retirees generally benefit from the receipt of a perpetual annuity at retirement, based on their years of service and ending salary. The Switzerland Plan is a partially funded multiple-employer pension plan. Under the Switzerland Plan, retirees generally benefit from the receipt of a perpetual annuity at retirement based on an accrued value at the date of retirement. The accrued value is related to the actual returns on contributions during the working period. As the plan is a multiple-employer plan, the consolidated financial statements include our pro-rata share of assets, projected benefit obligation and pension benefit cost. Our contributions and benefit payments for the defined benefit plans for the year ended December 31, 2017 are included in note 24 to the consolidated financial statements of Mitel in Item 8 of this Report (Consolidated Financial Statements). The contributions required to fund benefit obligations are based on actuarial valuations, which themselves are based on assumptions and estimates about the long-term operation of the plan, including mortality rates of members, the performance of financial markets and interest rates. Our funding requirements for future years may increase from current levels depending on the net liability position of our plans. In addition, if the actual experience of the plans differs from our assumptions, the net liability could increase and additional contributions may be required. Changes to pension legislation in the respective countries may also adversely affect our funding requirements. Increases in the net pension liability or increases in future cash contributions would adversely affect our cash flows and results from operations.
Our operating results may be impacted by our ability to sell leases derived from our managed services offering, or a breach of our obligations in respect of such sales.
In the event of defaults by lease customers under leases that have been sold, financial institutions that purchased the pool of such leases may require us to repurchase the remaining unpaid portion of such sold leases, subject to certain annual limitations on recourse for credit losses. The size of credit losses may impact our ability to sell future pools of leases.
Under the terms of the program agreements governing the sale of these pools of leases, we are subject to ongoing obligations in connection with the servicing of the underlying leases. If we are unable to perform these obligations or are otherwise in default under a program agreement, and are unable to cure or obtain a waiver of such default, we could be required by the purchaser to repurchase the entire unpaid portion of the leases sold to such purchaser, which could have an adverse effect on our cash flows and financial condition.
19
Table of Contents
The risks associated with Sarbanes-Oxley regulatory compliance, particularly related to an acquisition, may have a material adverse effect on us.
We are required to document and test our internal control over financial reporting pursuant to Section 404 of the United States Sarbanes-Oxley Act of 2002, so that our management can certify as to the effectiveness of our internal controls over financial reporting and our public accounting firm can render an opinion on the effectiveness of our internal controls over financial reporting. Following any acquisitions, we will need to timely and effectively implement the internal controls necessary to satisfy the requirements of Section 404 of the Sarbanes-Oxley Act of 2002, which requires annual management assessments of the effectiveness of internal controls over financial reporting. In performing our evaluation of internal control over financial reporting as of December 31, 2017, management excluded the operations of ShoreTel, which was acquired on September 25, 2017. We intend to extend our Sarbanes-Oxley Section 404 compliance program to include the ShoreTel business beginning in 2018. We may experience delays in implementing or be unable to implement the required internal financial reporting controls and procedures, which could result in enforcement actions, the assessment of penalties and civil suits, failure to meet reporting obligations and other material and adverse events that could have a negative effect on the market price for our common shares. In addition, if material weaknesses in our internal controls are identified or we acquire companies with a material weakness, we could be subject to regulatory scrutiny and a loss of public confidence.
Risks Related to our Common Shares
Our share price in the past has been volatile, and may continue to be volatile or may decline regardless of our operating performance, and investors may not be able to resell shares at or above the price at which they purchased the shares.
Our common shares are publicly traded on The NASDAQ Stock Market, or NASDAQ, and the Toronto Stock Exchange, or TSX. At times, the share price has been volatile. The market price of our common shares may fluctuate significantly in response to numerous factors, many of which are beyond our control and which may be accentuated due to the relatively low average daily trading volume in our common shares. The factors include:
| • | fluctuations in the overall stock market; |
| • | our quarterly operating results; |
| • | the exercise of options and subsequent sales of shares by option holders, including those held by our senior management and other employees; |
| • | departures of key personnel; |
| • | future announcements concerning our, or our competitors’, business; |
| • | the failure of securities analysts to cover our company and/or changes in financial forecasts and recommendations by securities analysts; |
| • | a rating downgrade or other negative action by a ratings organization; |
| • | fluctuations in foreign exchange rates; |
| • | actual or anticipated developments in our competitors’ businesses or the competitive landscape generally; |
| • | litigation involving us, our industry, or both; |
| • | general market, economic and political conditions; |
| • | regulatory developments; and |
| • | natural disasters, terrorist attacks and acts of war. |
In addition, at various times, the stock markets, including NASDAQ and TSX, have experienced extreme price and volume fluctuations that have affected the market prices of equity securities of many technology companies. Stock prices of many technology companies have fluctuated in a manner unrelated or disproportionate to the operating performance of those companies. In the past, stockholders have initiated securities class action litigation following declines in stock prices of technology companies. Any future litigation may subject us to substantial costs, divert resources and the attention of management from our business, which could harm our business and operating results.
Some of our directors have interests that may be different than our interests.
We do business with certain companies that are related parties, such as Wesley Clover International Corporation (“WCIC”) and its subsidiaries. WCIC is controlled by Dr. Matthews. Our directors owe fiduciary duties, including the duties of loyalty and confidentiality, to us. Our directors that serve on the boards of companies that we do business with also owe similar fiduciary duties to such other companies. The duties owed to us could conflict with the duties such directors owe to these other companies.
20
Table of Contents
Our articles of incorporation and certain anti-trust and foreign investment legislation may reduce the likelihood of a change of control occurring.
Provisions of our articles of incorporation and Canadian and U.S. law may delay or impede a change of control transaction. Our articles of incorporation permit us to issue an unlimited number of common and preferred shares. Limitations on the ability to acquire and hold our common shares may be imposed under the Hart-Scott-Rodino Act, the Competition Act (Canada) and other applicable antitrust legislation. Such legislation generally permits the relevant governmental authorities to review any acquisition of control over or of significant interest in us, and grants the authority to challenge or prevent an acquisition on the basis that it would, or would be likely to, result in a substantial prevention or lessening of competition. In addition, the Investment Canada Act subjects an “acquisition of control” of a “Canadian business” (as those terms are defined therein) by a non-Canadian to government review if prescribed financial thresholds are exceeded. A reviewable acquisition may not proceed unless the relevant Minister is satisfied that the investment is likely to be of net benefit to Canada. The foregoing could prevent or delay a change of control and may deprive our shareholders of the opportunity to sell their common shares at a control premium.
You may be unable to bring actions or enforce judgments against us or certain of our directors and officers under U.S. federal securities laws.
We are incorporated under the laws of Canada, and our principal executive offices are located in Canada. Many of our officers reside principally in Canada and a substantial portion of our assets and all or a substantial portion of the assets of these persons are located outside the United States. Consequently, it may not be possible for you to effect service of process within the United States upon us or those persons. Furthermore, it may not be possible for you to enforce judgments obtained in U.S. courts based upon the civil liability provisions of the U.S. federal securities laws or other laws of the United States against us or those persons. Shareholders should not assume that Canadian courts would (1) enforce judgments of U.S. courts obtained in actions against the Company, its directors or officers predicated upon the civil liability provisions of U.S. federal securities laws or the securities or “blue sky” laws of any state within the United Sates or (2) would enforce, in original actions, liabilities against the Company, its director or officers predicated upon the US federal securities laws or any such state securities or “blue sky” laws.
| Item 1B. | Unresolved Staff Comments |
None.
| Item 2. | Properties |
Our world headquarters is a 264,000 square foot leased facility located in Ottawa, Canada, which also includes a sales office, warehouse and distribution facility, and research and development center. In addition, we lease a large number of sales offices, warehouse and distribution facilities and research and development centers throughout the world totaling an additional approximately 1,530,000 square feet, which include the following:
| • | Regional headquarters in Caldicot, the United Kingdom and Dallas, the United States. |
| • | Sales offices, which often include demonstration and training centers, throughout the rest of the world, including Europe and North America. |
| • | Warehouse and distribution facilities, primarily in Canada, Germany, Switzerland, the United Kingdom and the United States. |
| • | Research and development centers, primarily in Canada, Germany, India, Sweden and the United States. |
| Item 3. | Legal Proceedings |
We are a party to a number of legal proceedings, claims or potential claims arising in the normal course of and incidental to our business. Management expects that any monetary liability or financial impact of such claims or potential claims to which we might be subject after settlement agreement or final adjudication would not be material to our consolidated financial position, results of operations or cash flows.
| Item 4. | Mine Safety Disclosure |
Not Applicable.
21
Table of Contents
| Item 5. | Market for the Registrant’s Common Equity, Related Stockholder Matters and Issuer Purchases of Equity Securities |
Our common shares are traded on the NASDAQ (trading symbol: MITL) and the TSX (trading symbol: MNW). The following table presents the high and low sale prices on the NASDAQ for our common shares for the periods indicated:
| High | Low | |||||||
| Year ended December 31, 2016 |
||||||||
| First Quarter |
$ | 8.34 | $ | 5.91 | ||||
| Second Quarter |
$ | 8.35 | $ | 5.94 | ||||
| Third Quarter |
$ | 8.52 | $ | 5.81 | ||||
| Fourth Quarter |
$ | 7.91 | $ | 6.34 | ||||
| Year ended December 31, 2017 |
||||||||
| First Quarter |
$ | 7.39 | $ | 6.40 | ||||
| Second Quarter |
$ | 7.75 | $ | 6.21 | ||||
| Third Quarter |
$ | 8.94 | $ | 6.99 | ||||
| Fourth Quarter |
$ | 9.13 | $ | 7.13 | ||||
The following table presents the high and low sale prices on the TSX for our common shares for the periods indicated (in Canadian dollars):
| High | Low | |||||||
| Year ended December 31, 2016 |
||||||||
| First Quarter |
$ | 10.79 | $ | 8.60 | ||||
| Second Quarter |
$ | 10.80 | $ | 7.78 | ||||
| Third Quarter |
$ | 11.10 | $ | 7.56 | ||||
| Fourth Quarter |
$ | 10.58 | $ | 8.50 | ||||
| Year ended December 31, 2017 |
||||||||
| First Quarter |
$ | 9.69 | $ | 8.59 | ||||
| Second Quarter |
$ | 10.39 | $ | 8.50 | ||||
| Third Quarter |
$ | 11.23 | $ | 8.86 | ||||
| Fourth Quarter |
$ | 11.55 | $ | 9.17 | ||||
The graph below shows Mitel Networks Corporation’s cumulative 68 month total shareholder return on its common shares and the cumulative total returns of the NASDAQ Composite index and the NASDAQ Telecommunications index. The graph tracks the performance of a $100 investment in our common share and in each index (with the reinvestment of all dividends) from April 30, 2012 to December 31, 2017.
22
Table of Contents
COMPARISON OF 68 MONTH CUMULATIVE TOTAL RETURN*
Among Mitel Networks Corporation, the NASDAQ Composite Index
and the NASDAQ Telecommunications Index
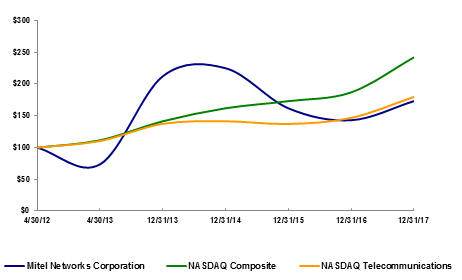
| * | $100 invested on 4/30/12 in stock or index, including reinvestment of dividends. Fiscal year ending December 31. |
| 4/30/12 | 4/30/13 | 12/31/13 | 12/31/14 | 12/31/15 | 12/31/16 | 12/31/17 | ||||||||||||||||||||||
| Mitel Networks Corporation |
100.00 | 73.68 | 212.42 | 225.05 | 161.89 | 143.16 | 173.26 | |||||||||||||||||||||
| NASDAQ Composite |
100.00 | 111.60 | 141.54 | 161.99 | 173.22 | 187.08 | 242.14 | |||||||||||||||||||||
| NASDAQ Telecommunications |
100.00 | 110.45 | 137.47 | 141.51 | 137.17 | 146.88 | 179.84 | |||||||||||||||||||||
The stock price performance included in this graph is not necessarily indicative of future stock price performance.
Shareholders
As of February 26, 2018, we had 1,302 shareholders of record (as registered shareholders), as determined by the Company based on information supplied by Computershare Investor Services, Inc.
Because many of our common shares are held by brokers and other institutions on behalf of shareholders, we are unable to estimate the total number of beneficial shareholders represented by these record holders.
23
Table of Contents
Dividend Policy
We have never declared or paid, nor do we anticipate paying for the foreseeable future, cash dividends on our common shares. Any determination to pay dividends to holders of our common shares in the future will be at the discretion of our Board of Directors and will depend on many factors, including our financial condition, earnings, legal requirements and other factors as our Board of Directors deems relevant. In addition, our outstanding credit agreement limits our ability to pay dividends and we may in the future become subject to debt instruments or other agreements that further limit our ability to pay dividends.
Share Buyback Program
On December 19, 2016, we announced that our Board of Directors approved, subject to regulatory approvals, a share buyback program pursuant to a normal course issuer bid under Canadian securities laws and in compliance with safe harbors under applicable U.S. securities laws. The regulatory approval was received on March 7, 2017. We did not purchase any of our common shares during the fourth quarter of 2017. For the year ended December 31, 2017, Mitel repurchased and cancelled 4.9 million common shares at a total cost of $35.7 million. The normal course issuer bid expires on March 8, 2018.
We may purchase our common shares, from time to time, if we believe that the market price of our common shares is attractive and that the purchase would be an appropriate use of corporate funds and in the best interests of the Company. Our outstanding credit agreement includes certain restrictions on share buybacks and we may in the future become subject to debt instruments or other agreements that further limit our ability to complete share buybacks.
Securities Authorized for Issuance Under Equity Compensation Plans
For a description of the Company’s equity incentive plans, see “Common Shares – Stock Option Plans” in note 16 to the consolidated financial statements in “Item 8 – Financial Statements and Supplementary Data.”
24
Table of Contents
| Item 6. | Selected Financial Data |
The following tables present our selected historical consolidated financial and other data and should be read in conjunction with “Management’s Discussion and Analysis of Financial Condition and Results of Operations” and our historical Consolidated Financial Statements and notes thereto included elsewhere in this Report. Our historical consolidated financial information may not be indicative of our future performance. Our Consolidated Financial Statements are reported in U.S. dollars and have been prepared in accordance with U.S. GAAP (“GAAP”).
| Year Ended December 31, 2017(1) |
Year Ended December 31, 2016 |
Year Ended December 31, 2015 |
Year Ended December 31, 2014(2) |
Eight Months Ended December 31, 2013(3) |
Year Ended April 30, 2013 |
|||||||||||||||||||
| (in millions, except per share data) | ||||||||||||||||||||||||
| Consolidated Statement of Operations Data |
||||||||||||||||||||||||
| Revenues |
$ | 1,059.1 | $ | 987.6 | $ | 1,025.8 | $ | 1,104.0 | $ | 357.3 | $ | 576.9 | ||||||||||||
| Cost of revenues |
480.2 | 455.6 | 480.6 | 513.9 | 153.3 | 256.3 | ||||||||||||||||||
|
|
|
|
|
|
|
|
|
|
|
|
|
|||||||||||||
| Gross margin |
578.9 | 532.0 | 545.2 | 590.1 | 204.0 | 320.6 | ||||||||||||||||||
|
|
|
|
|
|
|
|
|
|
|
|
|
|||||||||||||
| Expenses (income): |
||||||||||||||||||||||||
| Selling, general and administrative |
367.9 | 339.8 | 331.0 | 344.7 | 132.1 | 198.7 | ||||||||||||||||||
| Research and development |
104.5 | 96.5 | 102.2 | 118.3 | 38.3 | 55.7 | ||||||||||||||||||
| Special charges and restructuring costs |
83.4 | 70.8 | 47.5 | 72.7 | 14.6 | 21.8 | ||||||||||||||||||
| Amortization of acquisition-related intangible assets |
54.9 | 35.1 | 48.2 | 53.4 | 16.5 | 22.3 | ||||||||||||||||||
| Income from termination fee received |
— | (60.0 | ) | — | — | — | — | |||||||||||||||||
|
|
|
|
|
|
|
|
|
|
|
|
|
|||||||||||||
| 610.7 | 482.2 | 528.9 | 589.1 | 201.5 | 298.5 | |||||||||||||||||||
|
|
|
|
|
|
|
|
|
|
|
|
|
|||||||||||||
| Operating income (loss) |
(31.8 | ) | 49.8 | 16.3 | 1.0 | 2.5 | 22.1 | |||||||||||||||||
| Interest expense |
(18.7 | ) | (16.8 | ) | (17.8 | ) | (21.0 | ) | (17.1 | ) | (19.7 | ) | ||||||||||||
| Debt retirement and other debt costs |
(18.0 | ) | (2.1 | ) | (9.6 | ) | (16.2 | ) | (0.6 | ) | (2.6 | ) | ||||||||||||
| Other income (expense), net |
(0.1 | ) | 2.8 | 20.7 | 6.0 | (0.4 | ) | 1.3 | ||||||||||||||||
| Income tax recovery (expense) |
20.3 | 1.3 | (3.1 | ) | 22.9 | 10.1 | 8.8 | |||||||||||||||||
|
|
|
|
|
|
|
|
|
|
|
|
|
|||||||||||||
| Net income (loss) from continuing operations |
(48.3 | ) | 35.0 | 6.5 | (7.3 | ) | (5.5 | ) | 9.9 | |||||||||||||||
| Net loss from discontinued operations, net of income tax |
(1.4 | ) | (252.3 | ) | (27.2 | ) | — | — | (3.7 | ) | ||||||||||||||
|
|
|
|
|
|
|
|
|
|
|
|
|
|||||||||||||
| Net income (loss) |
$ | (49.7 | ) | $ | (217.3 | ) | $ | (20.7 | ) | $ | (7.3 | ) | $ | (5.5 | ) | $ | 6.2 | |||||||
|
|
|
|
|
|
|
|
|
|
|
|
|
|||||||||||||
| Net income (loss) per common share — Basic: |
||||||||||||||||||||||||
| Net income (loss) per share from continuing operations |
$ | (0.40 | ) | $ | 0.29 | $ | 0.06 | $ | (0.08 | ) | $ | (0.10 | ) | $ | 0.19 | |||||||||
| Net loss per share from discontinued operations |
$ | (0.01 | ) | $ | (2.08 | ) | $ | (0.24 | ) | $ | — | $ | — | $ | (0.07 | ) | ||||||||
| Net income (loss) per common share |
$ | (0.41 | ) | $ | (1.79 | ) | $ | (0.18 | ) | $ | (0.08 | ) | $ | (0.10 | ) | $ | 0.12 | |||||||
| Net income (loss) per common share — Diluted: |
||||||||||||||||||||||||
| Net income (loss) per share from continuing operations |
$ | (0.40 | ) | $ | 0.28 | $ | 0.06 | $ | (0.08 | ) | $ | (0.10 | ) | $ | 0.18 | |||||||||
| Net loss per share from discontinued operations |
$ | (0.01 | ) | $ | (2.01 | ) | $ | (0.24 | ) | $ | — | $ | — | $ | (0.07 | ) | ||||||||
| Net income (loss) per common share |
$ | (0.41 | ) | $ | (1.73 | ) | $ | (0.18 | ) | $ | (0.08 | ) | $ | (0.10 | ) | $ | 0.11 | |||||||
| Other Financial Data |
||||||||||||||||||||||||
| Adjusted EBITDA(4): |
||||||||||||||||||||||||
| Adjusted EBITDA from continuing operations |
$ | 144.6 | $ | 129.6 | $ | 149.1 | $ | 166.9 | $ | 46.2 | $ | 85.0 | ||||||||||||
| Adjusted EBITDA from discontinued operations |
(12.2 | ) | 32.0 | 19.0 | — | — | (1.3 | ) | ||||||||||||||||
|
|
|
|
|
|
|
|
|
|
|
|
|
|||||||||||||
| Adjusted EBITDA |
$ | 132.4 | $ | 161.6 | $ | 168.1 | $ | 166.9 | $ | 46.2 | $ | 83.7 | ||||||||||||
|
|
|
|
|
|
|
|
|
|
|
|
|
|||||||||||||
25
Table of Contents
| Year Ended December 31, 2017(1) |
Year Ended December 31, 2016 |
Year Ended December 31, 2015 |
Year Ended December 31, 2014(2) |
Eight Months Ended December 31, 2013(3) |
Year Ended April 30, 2013 |
|||||||||||||||||||
| (in millions, except per share data) | ||||||||||||||||||||||||
| Consolidated Balance Sheet Data |
||||||||||||||||||||||||
| Cash and cash equivalents |
$ | 43.3 | $ | 97.3 | $ | 82.2 | $ | 111.3 | $ | 40.2 | $ | 69.0 | ||||||||||||
| Total assets |
$ | 1,630.5 | $ | 1,561.4 | $ | 1,856.6 | $ | 1,278.8 | $ | 620.5 | $ | 656.4 | ||||||||||||
| Total debt, including capital leases |
$ | 629.1 | $ | 586.0 | $ | 645.3 | $ | 309.8 | $ | 269.5 | $ | 288.1 | ||||||||||||
| Common shares and additional paid-in capital |
$ | 1,466.0 | $ | 1,482.2 | $ | 1,463.2 | $ | 1,254.3 | $ | 850.2 | $ | 844.2 | ||||||||||||
| Warrants |
$ | 39.1 | $ | 39.1 | $ | 39.1 | $ | 39.1 | $ | 39.1 | $ | 39.1 | ||||||||||||
| Total shareholders’ equity |
$ | 345.7 | $ | 382.9 | $ | 604.9 | $ | 447.8 | $ | 118.4 | $ | 84.0 | ||||||||||||
| (1) | Includes the operations of ShoreTel from date of acquisition of September 25, 2017, as disclosed in note 3 to the Consolidated Financial Statements. |
| (2) | Includes the operations of Aastra from date of acquisition of January 31, 2014. |
| (3) | In January 2014, Mitel changed its fiscal year end from April 30 to December 31, effective for the eight months ended December 31, 2013. |
| (4) | The following table presents a reconciliation of Adjusted EBITDA, a non-GAAP measure, to net income (loss), the most directly comparable GAAP measure, for each of the periods indicated: |
| Year Ended December 31, 2017 |
Year Ended December 31, 2016 |
Year Ended December 31, 2015 |
Year Ended December 31, 2014 |
Eight Months Ended December 31, 2013 |
Year Ended April 30, 2013 |
|||||||||||||||||||
| (in millions) | ||||||||||||||||||||||||
| Net income (loss) |
$ | (49.7 | ) | $ | (217.3 | ) | $ | (20.7 | ) | $ | (7.3 | ) | $ | (5.5 | ) | $ | 6.2 | |||||||
| Net loss from discontinued operations |
1.4 | 252.3 | 27.2 | — | — | 3.7 | ||||||||||||||||||
|
|
|
|
|
|
|
|
|
|
|
|
|
|||||||||||||
| Net income (loss) from continuing operations |
(48.3 | ) | 35.0 | 6.5 | (7.3 | ) | (5.5 | ) | 9.9 | |||||||||||||||
| Adjustments: |
||||||||||||||||||||||||
| Interest expense |
18.7 | 16.8 | 17.8 | 21.0 | 17.1 | 19.7 | ||||||||||||||||||
| Income tax expense (recovery) |
(20.3 | ) | (1.3 | ) | 3.1 | (22.9 | ) | (10.1 | ) | (8.8 | ) | |||||||||||||
| Amortization and depreciation |
76.0 | 54.4 | 69.3 | 75.9 | 25.5 | 35.8 | ||||||||||||||||||
| Foreign exchange loss (gain) |
2.2 | (1.9 | ) | (18.8 | ) | (3.9 | ) | 0.5 | (0.2 | ) | ||||||||||||||
| Special charges and restructuring costs |
83.4 | 70.8 | 47.5 | 72.7 | 14.6 | 21.8 | ||||||||||||||||||
| Stock-based compensation |
14.4 | 13.7 | 11.2 | 6.1 | 3.1 | 4.2 | ||||||||||||||||||
| Debt retirement and other debt costs |
18.0 | 2.1 | 9.6 | 16.2 | 0.6 | 2.6 | ||||||||||||||||||
| Purchase accounting |
1.5 | — | 2.9 | 9.1 | — | — | ||||||||||||||||||
| Other (2) |
(1.0 | ) | (60.0 | ) | — | — | 0.4 | — | ||||||||||||||||
|
|
|
|
|
|
|
|
|
|
|
|
|
|||||||||||||
| Adjusted EBITDA from continuing operations |
144.6 | 129.6 | 149.1 | 166.9 | 46.2 | 85.0 | ||||||||||||||||||
| Adjusted EBITDA from discontinued operations (3) |
(12.2 | ) | 32.0 | 19.0 | — | — | (1.3 | ) | ||||||||||||||||
|
|
|
|
|
|
|
|
|
|
|
|
|
|||||||||||||
| Adjusted EBITDA |
$ | 132.4 | $ | 161.6 | $ | 168.1 | $ | 166.9 | $ | 46.2 | $ | 83.7 | ||||||||||||
|
|
|
|
|
|
|
|
|
|
|
|
|
|||||||||||||
| (1) | In accordance with the fair value provisions applicable to the accounting for business combinations, acquired deferred revenue relating to acquisitions is recorded on the opening balance sheet at an amount that is generally lower than the historical carrying value. Although this purchase accounting requirement has no impact on the Company’s business or cash flow, it impacts the Company’s reported GAAP revenue in the reporting periods following the acquisition. In order to provide investors with financial information that facilitates comparison of results, the Company provides non-GAAP financial measures which exclude the impact of the purchase accounting adjustments. The Company believes that this non-GAAP financial adjustment is useful to investors because it allows investors to compare reports of financial results of the Company as the revenue reductions related to acquired contracts will not recur when similar software maintenance and service contracts are recorded in future periods. |
26
Table of Contents
| (2) | Other for the year ended December 31, 2017 consists of accretion of interest and for the year ended December 31, 2016 consists of income from termination fee received from Polycom as discussed in “Significant Events and Recent Developments — 2016” under the “Overview” section in “Management’s Discussion and Analysis of Financial Condition and Results of Operations” below. |
| (3) | The reconciliation of net loss from discontinued operations to Adjusted EBITDA from discontinued operations for the year ended April 30, 2013 consists of special charges and restructuring costs of $1.6 million, impairment of goodwill of $1.9 million and income tax recovery of $1.1 million. The reconciliation of net loss from discontinued operations to Adjusted EBITDA from discontinued operations for the year ended December 31, 2015 consists of interest expense of $14.6 million, income tax recovery of $13.7 million, amortization and depreciation of $29.8 million, special charges and restructuring costs of $7.1 million, stock-based compensation of $1.6 million and purchase accounting adjustments of $6.8 million. The reconciliation of net loss from discontinued operations to Adjusted EBITDA from discontinued operations for the year ended December 31, 2016 consists of interest expense of $22.0 million, income tax recovery of $14.3 million, amortization and depreciation of $46.3 million, special charges and restructuring costs of $13.2 million, stock-based compensation of $3.1 million, purchase accounting adjustments of $1.2 million and goodwill impairment of $212.8 million. The reconciliation of net loss from discontinued operations to Adjusted EBITDA from discontinued operations for the year ended December 31, 2017 consists of interest expense of $3.7 million, income tax recovery of $6.6 million and a gain on disposal of $7.9 million. |
We define Adjusted EBITDA as net income (loss), adjusted for the items as noted in the above tables. Adjusted EBITDA is not a measure calculated in accordance with GAAP. Adjusted EBITDA should not be considered as an alternative to net income, income from operations or any other measure of financial performance calculated and presented in accordance with GAAP. You should evaluate these adjustments and the reasons we consider them appropriate, as well as the material limitations of non-GAAP measures and the manner in which we compensate for those limitations.
We use Adjusted EBITDA:
| • | as a measure of operating performance; |
| • | for planning purposes, including the preparation of our annual operating budget; |
| • | to allocate resources to enhance the financial performance of our business; and |
| • | in communications with our board of directors concerning our financial performance. |
We believe that the use of Adjusted EBITDA provides consistency and facilitates period to period comparisons, and may facilitate comparisons with other companies in our industry, many of which use similar non-GAAP financial measures to supplement their GAAP results. Where applicable, we also present and use Adjusted EBITDA from continuing operations and Adjusted EBITDA from discontinued operations, using the same methodology as described above.
We believe Adjusted EBITDA may also be useful to investors in evaluating our operating performance because securities analysts use Adjusted EBITDA as a supplemental measure to evaluate the overall operating performance of companies. Our investor and analyst presentations also include Adjusted EBITDA. However, we also caution you that other companies in our industry may calculate Adjusted EBITDA or similarly titled measures differently than we do, which limits the usefulness of Adjusted EBITDA as a comparative measure.
Moreover, although Adjusted EBITDA is frequently used by investors and securities analysts in their evaluations of companies, Adjusted EBITDA and similar non-GAAP measures have limitations as analytical tools, and you should not consider them in isolation or as a substitute for an analysis of our results of operations as reported under GAAP.
Some of the limitations of Adjusted EBITDA are that it does not reflect:
| • | cash requirements for interest expense; |
| • | cash requirements for income taxes; |
| • | foreign exchange gains or losses; |
| • | cash payments made in connection with litigation settlements; |
| • | significant cash payments made in connection with special charges and restructuring costs; |
| • | significant cash receipts related to termination fees received in connection with terminated acquisitions; |
| • | employee stock-based compensation; and |
| • | cash requirements for the replacement of assets that have been depreciated or amortized. |
27
Table of Contents
We compensate for the inherent limitations associated with using Adjusted EBITDA through disclosure of such limitations, presentation of our financial statements in accordance with GAAP and reconciliation of Adjusted EBITDA to the most directly comparable GAAP measure, net income (loss).
| Item 7. | Management’s Discussion and Analysis of Financial Condition and Results of Operations |
The following discussion of the financial condition and results of operations of the Company should be read in conjunction with the Consolidated Financial Statements and accompanying notes included elsewhere in this Report. All amounts are expressed in U.S. dollars unless otherwise noted. The following discussion includes forward-looking statements that are not historical facts but reflect our current expectation regarding future results. Actual results may differ materially from the results discussed in the forward-looking statements because of a number of risks and uncertainties, including the matters discussed below. Please refer to “Risk Factors” included elsewhere in this Report for a further description of risks and uncertainties affecting our business and financial results. Historical trends should not be taken as indicative of future operations and financial results.
Overview
Mitel is a global provider of business communications and collaboration software, services and solutions. Our communications solutions meet the needs of customers in over 100 countries. We operate as two business units: Enterprise and Cloud.
Enterprise
Our Enterprise segment sells and supports products and services for premise-based customers. This includes the Company’s premise-based IP and TDM telephony platforms, desktop devices and unified communications and collaboration (“UCC”) and contact center applications that are deployed on the customer’s premise. Premise-based sales are sold as an initial sale of hardware and software, with ongoing recurring revenue from hardware and software maintenance and other managed services that we may also offer.
Cloud
The Cloud segment sells and supports products that are deployed in a cloud environment and billed on a monthly recurring basis. The Cloud segment is comprised of a retail offering and a wholesale offering. The retail cloud offering provides hosted cloud and related services directly to the end user. The Company is paid a monthly recurring fee for these services, which include UCC applications, voice and data telecommunications and desktop devices. The wholesale offering enables service providers to provide a range of hosted communications offerings to their end customers. The hosted offering includes hosted PBX, voice and video calling, SIP Trunking, voicemail, call center, audio conferencing and video and web collaboration services. The wholesale cloud offering is also sold to large enterprise customers who run their own data centers in private cloud or hybrid cloud networks with management provided by Mitel, or one of Mitel’s channel partners. Revenue in the wholesale cloud offering is billed as monthly recurring fees.
Significant Events and Recent Developments — 2017
Termination of Shareholders Agreement
On December 6, 2017, Mitel and certain shareholders of Mitel entered into a termination agreement to terminate a shareholders agreement between and among such shareholders and Mitel dated April 27, 2010. The shareholders agreement provided for certain matters relating to the management of Mitel and granted certain rights to, and imposed certain obligations on, such shareholders with respect to their ownership of common shares of Mitel.
Mitel acquires ShoreTel
On September 25, 2017, Mitel completed the acquisition of ShoreTel for cash consideration totaling $531.4 million. ShoreTel was a provider of unified video, voice and content communications solutions, primarily in the U.S., with revenues of $357.8 million for the twelve months ended June 30, 2017. Mitel financed the acquisition and associated transaction expenses using a combination of cash on hand from the combined business, drawings on our existing revolving credit facility and proceeds from a $300.0 million Incremental Term Loan, maturing in September 2023. The acquisition is further described in note 3 to the Consolidated Financial Statements.
28
Table of Contents
Mitel implements a share buyback program
On March 9, 2017, the Company initiated a common share buyback program by filing a Notice of Intention to Make a Normal Course Issuer Bid (the “Notice”). Pursuant to the Notice, Mitel may purchase up to 7.8 million Mitel common shares, representing approximately 10% of its public float. For the year ended December 31, 2017, Mitel repurchased and cancelled 4.9 million common shares at a total cost of $35.7 million. The share buyback program expires on March 8, 2018.
Mitel completes the refinancing of its senior credit facilities
On March 9, 2017, Mitel refinanced its senior secured credit facilities. The new credit facilities were comprised of an initial $150.0 million term loan and a $350.0 million revolving credit facility. Proceeds of $150.0 million from the term loan along with initial amounts drawn on the revolving credit facility of $95.0 million and cash on hand, were used to repay the remaining principal and accrued interest outstanding under the prior credit facilities, as well as fees and expenses related to the new financing.
In September 2017, in conjunction with the acquisition of ShoreTel, as described above, the credit facilities were amended primarily to allow for a $300.0 million incremental term loan (together with the term loan and revolving credit facility, the “2017 Credit Facilities”). The 2017 Credit Facilities are further described in note 13 to the Consolidated Financial Statements.
Mitel divests its Mobile business unit — February 2017
On December 18, 2016, Mitel entered into a definitive agreement to divest its Mobile business unit to the parent company of Xura, Inc. (“Xura”) for approximately $350.0 million in cash, a $35.0 million non-interest bearing promissory note and an equity interest in Sierra Private Investments L.P., the limited partnership that will own both Xura and the Mobile business unit. The transaction closed on February 28, 2017 and the cash proceeds were primarily used to repay debt. The cash portion of the purchase price was subject to adjustments for closing net working capital, indebtedness and net advances to the business unit between December 31, 2016 and the closing of the transaction.
As a result of the divestiture, the operations of the Mobile business unit have been classified as discontinued operations on the consolidated statements of operations and the assets and liabilities of the Mobile business unit have been classified as assets and liabilities held for sale at December 31, 2016. A description of the divestiture and the operating results of the Mobile business unit are further described in note 4 to the Consolidated Financial Statements.
29
Table of Contents
U.S. Tax Reform
On December 22, 2017, the U.S. Tax Cuts and Jobs Act of 2017 (“the Act”) was signed into legislation. Key provisions of the Act are as follows:
| • | U.S. Federal Corporate Income Tax Rate Reduction from 35% to 21% effective January 1, 2018 |
| • | Interest deductibility is limited to 30% of earnings, before interest, taxes, depreciation and amortization from 2018 to 2021 and 30% of earnings before interest and taxes of after 2021 |
| • | Immediate expensing of 100% of the cost of new investments made in qualified depreciable assets after September 27, 2017 |
| • | Deemed repatriation of foreign earnings previously deferred for U.S. tax purposes |
As a result of the Act, a non-cash income tax recovery of $2.9 million was recorded resulting from the revaluation of the existing U.S. deferred income tax assets and deferred income tax liabilities at the lower income tax rate. This revaluation was recorded at the time the Act was signed. The company has also applied a portion of its net operating losses, in lieu of payment of a transition tax, for the deemed repatriation of foreign earnings. This impact was an increase to non-cash income tax expense of $2.8 million.
The Company is still analyzing certain aspects of the Act, which could potentially affect the measurement of these balances or potentially give rise to new deferred tax amounts. Further adjustments, if any, will be recorded by the Company during the measurement period in 2018 as permitted by SEC Staff Accounting Bulletin 118, Income tax Accounting Implications of the Tax Cuts and Jobs Act. The Act provides that the measurement period must be completed by December 22, 2018.
As a result of the Act, the Company expects to experience a lower effective incomes tax rate on its U.S. net income (loss) in the future.
Significant Events and Recent Development — 2016
Mitel receives $60.0 million termination fee — July 2016
On April 15, 2016, Mitel and Polycom, Inc. (“Polycom”) (NYSE:PLCM) entered into a definitive merger agreement under which Mitel agreed to acquire all of the outstanding shares of Polycom common stock in a cash and stock transaction. On July 7, 2016, Polycom’s board of directors notified Mitel that it had received a binding offer from a third party to acquire Polycom and that Polycom’s board of directors had concluded that such offer constituted a “Company Superior Proposal” under its merger agreement with Mitel. Later on July 7, 2016, Mitel waived its right to renegotiate the consideration payable to Polycom stockholders under the merger agreement. On July 8, 2016, Polycom paid Mitel a termination fee of $60.0 million and the merger agreement was terminated. The termination fee was recorded as Income from Termination Fee Received on the consolidated statement of operations.
Prepayments of term loan — January 2016, March 2016, June 2016 and July 2016
We made prepayments on our prior term loan of $25.0 million in January 2016, $15.0 million in March 2016, $13.6 million in June 2016 and $11.5 million in July 2016.
Significant Events and Recent Developments — 2015
Acquisition of Tiger — June 2015
On June 1, 2015, we completed the acquisition of TigerTMS Ltd. (“Tiger”) for expected total estimated consideration of $6.6 million. Tiger is a global provider of software, cloud and applications-based solutions for the hospitality industry. Tiger’s revenues were approximately $10.0 million for the year ended December 31, 2014, and were primarily generated in Europe, the Middle East and the United States. Mitel’s financial results include the results of Tiger from the date of acquisition.
Acquisition of Mavenir and refinancing of credit agreement — April 2015
On April 29, 2015, we completed our exchange offer to acquire all of the outstanding shares of common stock of Mavenir. The aggregate consideration paid by us in connection with the acquisition of Mavenir was $545.3 million, which included $353.3 million of cash and 19.7 million Mitel common shares valued at $189.2 million. In conjunction with the acquisition we refinanced our January 2014 Credit Facilities. These credit facilities consisted of a $660.0 million term loan and a $50.0 million revolving credit facility (the “April 2015 Credit Facilities”). Proceeds of $653.4 million (net of original discount of $6.6 million), along with cash on
30
Table of Contents
hand, were used to repay the remaining $279.1 million principal outstanding under the January 2014 Credit Facilities, to repay the remaining $26.9 million principal outstanding under Mavenir’s credit facilities, for the cash consideration paid for the acquisition of Mavenir, as well as accrued interest, fees and expenses paid in connection with the refinancing and the acquisition of Mavenir. The financial results of Mitel’s Mobile business unit consisted of the results of Mavenir from the date of acquisition. Further details of the acquisition are included in note 3 to the Consolidated Financial Statements.
In December 2016, we entered into a definitive agreement to divest the Mobile business unit, as described above, and, on February 28, 2017, the sale was completed.
Prepayment of term loan — February 2015
We made a prepayment on our prior term loan of $25.0 million in February 2015.
Operating Results
Our revenues for the year ended December 31, 2017 were $1,059.1 million, as compared to $987.6 million for the year ended December 31, 2016. Revenues for the year ended December 31, 2017 includes $93.6 million of revenue contributed by ShoreTel, acquired on September 25, 2017. Excluding ShoreTel, revenues decreased by 2.2% as a decrease in Enterprise product and service revenues in the U.S. was partially offset by higher cloud recurring revenues. Our operating loss was $31.8 million for the year ended December 31, 2017 compared to operating income of $49.8 million for the year ended December 31, 2016. The operating income for the year ended December 31, 2016 was largely driven by the $60.0 million income from termination fee, as discussed in “Significant Events and Recent Developments — 2016” under the “Overview” section above. Excluding the income from termination fee, the increase in operating loss was largely driven by higher special charges and restructuring costs due to the acquisition of ShoreTel.
Industry Trends
Our industry is dynamic and highly competitive, with changes in both technologies and business models. We believe that each industry shift is an opportunity to conceive new products, new technologies, or new ideas that can further transform the industry and our business. Through a broad range of research and development activities, we seek to identify and address the changing demands of customers, industry trends, and competitive forces.
Key Performance Indicators
Key performance indicators that we use to manage our business and evaluate our financial results and operating performance include: revenues, gross margins, operating costs, operating income, net income, cash flows from operations, and Adjusted EBITDA.
Revenue performance is evaluated from both a reportable segment and geographical perspective by comparing our actual results against both management forecasts and prior period results. Our revenues by geographic segment are described in note 22 to the Consolidated Financial Statements.
Gross margin performance is evaluated from a reportable segment perspective by comparing our actual results against both management forecasts and prior period results.
Operating expenses, operating income (loss) and net income (loss) are each evaluated by comparing our actual results against both management forecasts and prior period results.
Cash flow from operations is the key performance indicator with respect to cash flows. As part of monitoring cash flow from operations, we also monitor our days sales outstanding, our inventory turns and our days expenses in payables outstanding.
Adjusted EBITDA, a non-GAAP measure, is evaluated by comparing actual results to management forecasts and prior period results. For a definition and explanation of Adjusted EBITDA, as well as a reconciliation of Adjusted EBITDA to net income (loss), see Item 6, “Selected Financial Data”.
In addition to the above indicators, from time to time, we also monitor performance in the following areas:
| • | status of key customer contracts; |
| • | the achievement of expected milestones of our key R&D projects; and |
| • | the achievement of our key strategic initiatives. |
31
Table of Contents
In an effort to ensure we are creating value for and maintaining strong relationships with our customers, we monitor the status of key customer contracts to monitor customer service levels. With respect to our R&D projects, we measure content, quality and timeliness against project plans.
Sources of Revenues and Expenses
The following describes our primary sources of revenues and expenses:
We generate revenues primarily from the sale of enterprise communications systems and related services (collectively, a “Solution”), through channel partners and directly to enterprise customers. A typical Solution consists of a combination of IP phones, switches, software applications and support, which may include installation and training. A Solution may be deployed on the customer’s premises (premise-based solution) or deployed in a cloud environment (cloud-based solution).
Enterprise segment revenue
The Enterprise segment generates revenues primarily from sales of multiple-element Solutions, typically as an upfront sale. For each element of a typical Solution, revenue is recognized separately on the pro-rata share of the total sale price, based on the relative selling price of each element. The significant elements of a typical sale are as follows:
Enterprise segment product revenue — hardware and software:
The Company recognizes hardware and software revenue when the product is shipped or upon product acceptance where the agreement contains product acceptance terms that are more than perfunctory.
Enterprise segment service revenue — installation and training:
The Company recognizes revenue related to installation and training upon delivery of the services.
Enterprise segment service revenue — post-contract support:
Post-contract support consists primarily of maintenance revenue and software assurance revenue, which generate revenue under contracts that generally range from one to five years. For maintenance revenue, the Company provides various levels of support for installed systems for a fixed annual fee. For software assurance revenue, the Company provides software upgrades on a when and if available basis and software support for a fixed annual fee. In certain jurisdictions, maintenance and software assurance is bundled as post-contract support. Revenue from post-contract support is recognized ratably over the contractual period.
Cloud segment revenue
The Cloud segment generates recurring revenues from sales of multiple-element Solutions. These Solutions are sold under a monthly recurring billing model. A portion of the monthly recurring billing in the United States will also often include billing for voice and data telecommunication services. When the Solution is sold as a monthly recurring billing model, the revenue is recognized monthly, as the services are provided.
Cost of revenues
Cost of revenues for the Enterprise and Cloud segments is comprised of product and service costs. Product cost of revenues is primarily comprised of cost of goods purchased from third-party electronics manufacturing services as well as inventory provisions, engineering costs, warranty costs and other supply chain management costs. Depreciation of property and equipment relating to cost of revenues activities is also included in cost of revenues. Service cost of revenues is primarily comprised of labor costs. Cloud cost of revenues also includes amounts paid to network service providers for network services used by our customers.
Sales, General and Administrative Expenses (“SG&A”)
SG&A expenses consist primarily of costs relating to our sales and marketing activities, including salaries and related expenses, advertising, trade shows and other promotional activities and materials, administrative and finance functions, legal and professional fees, insurance and other corporate and overhead expenses. Depreciation of property and equipment relating to SG&A activities is also included.
32
Table of Contents
Research and Development Expenses
R&D expenses consist primarily of salaries and related expenses for engineering personnel, materials and subcontract service costs. Depreciation and amortization of assets relating to R&D activities are included in R&D expenses.
Special Charges and Restructuring Costs
Special charges and restructuring costs consist of costs related to restructuring and integration activities as well as acquisition-related costs. Restructuring and integration costs generally relate to workforce reductions and facility reductions incurred to eliminate duplication of activities as a result of acquisitions or to improve operational efficiency. Costs related to workforce reductions are recorded when we have committed to a plan of termination and we have notified employees of the terms of the plan. Costs related to facility reductions primarily consist of lease termination obligations for vacant facilities, which generally include the remaining payments on an operating lease. Lease termination obligations are reduced for probable future sublease income. In addition, restructuring and integration costs include professional services and consulting services incurred to complete the integration acquisitions, which are expensed as incurred. Acquisition-related costs consist of direct incremental costs incurred related to diligence activities and closing costs, and are expensed as incurred.
Income from termination fee received
Income from termination fee received consists of the $60.0 million termination fee from Polycom in July 2016 as discussed in “Significant Events and Recent Developments — 2016” under the “Overview” section above.
Amortization of acquisition-related intangible assets
Amortization of acquisition-related intangible assets consists of the amortization of intangible assets acquired through acquisitions. The acquisition-related intangible assets consist primarily of trade names, developed technology and customer relationships and are amortized on a straight-line basis over their respective useful lives of up to seven years.
Comparability of Periods
Our functional currency is the U.S. dollar and our Consolidated Financial Statements are prepared with U.S. dollar reporting currency using the current rate method. Assets and liabilities of subsidiaries with a functional currency other than the U.S. dollar are translated into U.S. dollars at the exchange rates in effect at the balance sheet date while revenue and expense items are translated at the monthly average exchange rates for the relevant period. The resulting unrealized gains and losses have been included as part of the cumulative foreign currency translation adjustment which is reported as other comprehensive income. Changes in foreign-exchange rates from period to period can have a significant impact on our results of operations and financial position, which may also make the comparability of periods complex.
The results of operations from acquisitions are included in our results from operations from the date of acquisition. In addition, we have incurred various costs related to acquisitions and the integration of those acquisitions, which have been recorded in special charges and restructuring costs.
33
Table of Contents
Results of Operations — Year Ended December 31, 2017 Compared to Year Ended December 31, 2016
The following table sets forth our comparative results of operations, both in dollars and as a percentage of total revenues:
| Year Ended December 31, | Change | |||||||||||||||||||||||
| 2017 | 2016 | |||||||||||||||||||||||
| Amounts | % of Revenue |
Amounts | % of Revenue |
Amount | % | |||||||||||||||||||
| (in millions, except percentages and per share amounts) | ||||||||||||||||||||||||
| Revenues |
$ | 1,059.1 | 100.0 | % | $ | 987.6 | 100.0 | % | $ | 71.5 | 7.2 | |||||||||||||
| Cost of revenues |
480.2 | 45.3 | % | 455.6 | 46.1 | % | 24.6 | 5.4 | ||||||||||||||||
|
|
|
|
|
|
|
|||||||||||||||||||
| Gross margin |
578.9 | 54.7 | % | 532.0 | 53.9 | % | 46.9 | 8.8 | ||||||||||||||||
|
|
|
|
|
|
|
|||||||||||||||||||
| Selling, general and administrative |
367.9 | 34.7 | % | 339.8 | 34.4 | % | 28.1 | 8.3 | ||||||||||||||||
| Research and development |
104.5 | 9.9 | % | 96.5 | 9.8 | % | 8.0 | 8.3 | ||||||||||||||||
| Special charges and restructuring costs |
83.4 | 7.9 | % | 70.8 | 7.2 | % | 12.6 | 17.8 | ||||||||||||||||
| Amortization of acquisition-related intangible assets |
54.9 | 5.2 | % | 35.1 | 3.6 | % | 19.8 | 56.4 | ||||||||||||||||
| Income from termination fee received |
— | — | (60.0 | ) | (6.1 | )% | 60.0 | * | ||||||||||||||||
|
|
|
|
|
|
|
|||||||||||||||||||
| 610.7 | 57.7 | % | 482.2 | 48.9 | % | 128.5 | 26.6 | |||||||||||||||||
|
|
|
|
|
|
|
|||||||||||||||||||
| Operating income (loss) |
(31.8 | ) | (3.0 | )% | 49.8 | 5.0 | % | (81.6 | ) | * | ||||||||||||||
| Interest expense |
(18.7 | ) | (1.8 | )% | (16.8 | ) | (1.7 | )% | (1.9 | ) | 11.3 | |||||||||||||
| Debt retirement and other debt costs |
(18.0 | ) | (1.7 | )% | (2.1 | ) | (0.2 | )% | (15.9 | ) | * | |||||||||||||
| Other income (expense) |
(0.1 | ) | — | 2.8 | 0.3 | % | (2.9 | ) | * | |||||||||||||||
| Income tax recovery (expense) |
20.3 | 1.9 | % | 1.3 | 0.1 | % | 19.0 | * | ||||||||||||||||
|
|
|
|
|
|
|
|||||||||||||||||||
| Net income (loss) from continuing operations |
(48.3 | ) | (4.6 | )% | 35.0 | 3.5 | % | (83.3 | ) | * | ||||||||||||||
| Net loss from discontinued operations, net of income tax |
(1.4 | ) | (0.1 | )% | (252.3 | ) | (25.5 | )% | 250.9 | * | ||||||||||||||
|
|
|
|
|
|
|
|||||||||||||||||||
| Net loss |
$ | (49.7 | ) | (4.7 | )% | $ | (217.3 | ) | (22.0 | )% | $ | 167.6 | * | |||||||||||
|
|
|
|
|
|
|
|||||||||||||||||||
| Adjusted EBITDA (a non-GAAP measure) |
||||||||||||||||||||||||
| Adjusted EBITDA from continuing operations |
$ | 144.6 | 13.7 | % | $ | 129.6 | 13.1 | % | $ | 15.0 | 11.6 | |||||||||||||
| Adjusted EBITDA from discontinued operations |
(12.2 | ) | (1.2 | )% | 32.0 | 3.2 | % | (44.2 | ) | * | ||||||||||||||
|
|
|
|
|
|
|
|||||||||||||||||||
| Adjusted EBITDA |
$ | 132.4 | 12.5 | % | $ | 161.6 | 16.4 | % | $ | (29.2 | ) | (18.1 | ) | |||||||||||
|
|
|
|
|
|
|
|||||||||||||||||||
| Net income (loss) per common share — Basic |
||||||||||||||||||||||||
| Net income (loss) per share from continuing operations |
$ | (0.40 | ) | $ | 0.29 | |||||||||||||||||||
| Net loss per share from discontinued operations |
$ | (0.01 | ) | $ | (2.08 | ) | ||||||||||||||||||
| Net loss per common share |
$ | (0.41 | ) | $ | (1.79 | ) | ||||||||||||||||||
| Net income (loss) per common share —Diluted |
||||||||||||||||||||||||
| Net income (loss) per share from continuing operations |
$ | (0.40 | ) | $ | 0.28 | |||||||||||||||||||
| Net loss per share from discontinued operations |
$ | (0.01 | ) | $ | (2.01 | ) | ||||||||||||||||||
| Net loss per common share |
$ | (0.41 | ) | $ | (1.73 | ) | ||||||||||||||||||
| * | The comparison is not meaningful. |
34
Table of Contents
Revenues
Our reportable segments are determined in accordance with how our management views and evaluates our business and are described further in note 22 to the Consolidated Financial Statements. The following tables set forth revenues by business segment in dollars and as a percentage of total revenues:
| Year ended December 31, | Change | |||||||||||||||||||||||
| 2017 | 2016 | |||||||||||||||||||||||
| Revenues | % of Revenues |
Revenues | % of Revenues |
Amount | % | |||||||||||||||||||
| (in millions, except percentages) | ||||||||||||||||||||||||
| Enterprise — Product |
$ | 613.6 | 57.9 | % | $ | 599.2 | 60.7 | % | $ | 14.4 | 2.4 | |||||||||||||
| Enterprise — Services |
271.3 | 25.6 | % | 273.0 | 27.6 | % | (1.7 | ) | (0.6 | ) | ||||||||||||||
|
|
|
|
|
|
|
|
|
|
|
|||||||||||||||
| Total Enterprise revenues |
884.9 | 83.5 | % | 872.2 | 88.3 | % | 12.7 | 1.5 | ||||||||||||||||
| Cloud segment — Recurring |
175.7 | 16.6 | % | 115.4 | 11.7 | % | 60.3 | 52.3 | ||||||||||||||||
| Purchase accounting adjustments |
(1.5 | ) | (0.1 | )% | — | — | (1.5 | ) | * | |||||||||||||||
|
|
|
|
|
|
|
|
|
|
|
|||||||||||||||
| $ | 1,059.1 | 100.0 | % | $ | 987.6 | 100.0 | % | 71.5 | 7.2 | |||||||||||||||
|
|
|
|
|
|
|
|||||||||||||||||||
| * | The comparison is not meaningful. |
Our revenues for the year ended December 31, 2017 increased to $1,059.1 million compared to revenues of $987.6 million for the year ended December 31, 2016, primarily as the result of the ShoreTel acquisition on September 25, 2017. Excluding the results of ShoreTel, our revenues decreased by 2.2% to $965.5 million for the year ended December 31, 2017. The decrease was due to lower revenue in our Enterprise segment, which was partially offset by growth in our Cloud segment.
Our revenues are affected by changes in foreign exchange rates. In the year ended December 31, 2017, the U.S dollar was stronger against the British pound sterling by an average of 5.6% and weaker against the Euro by an average of 1.8%, when compared to the year ended December 31, 2016. We estimate that for year ended December 31, 2017, the change in foreign exchange rates accounted for an absolute 0.6% of the decrease in revenues when compared to the year ended December 31, 2016.
Enterprise Segment
Total Enterprise revenues increased by $12.7 million, or 1.5%, due to the acquisition of ShoreTel. Excluding the results of ShoreTel, Enterprise segment product revenues for the year ended December 31, 2017 decreased by $17.6 million, or 2.9%, as a result of the unfavorable impact of foreign exchange rates and lower volumes, partially due to customers migrating to a cloud recurring model, while Enterprise segment services revenues decreased by $20.3 million, or 7.4%, due primarily to the unfavorable impact of foreign exchange rates, lower installation revenues due to timing of new projects and lower volumes.
Cloud segment
Cloud segment recurring revenues increased by $60.3 million, or 52.3%, largely due to the acquisition of ShoreTel. Excluding the results of ShoreTel, Cloud segment recurring revenues increased by $15.8 million, or 13.7% due to the acquisition of new customers.
Purchase accounting adjustments
Purchase accounting adjustments result in a reduction in revenue and are presented separately to reflect the nature of the adjustment. In accordance with the fair value provisions applicable to the accounting for business combinations, acquired deferred revenue relating to acquisitions was recorded on the opening balance sheet at an amount that was lower than the historical carrying value. The purchase accounting adjustment reflects the revenue that would have otherwise been recognized had the contract been recorded at the historical carrying value as the revenue reductions related to acquired contracts will not recur when similar software maintenance and service contracts are recorded in future periods. Although the purchase accounting adjustments have no impact on the Company’s business or cash flow, they adversely impact the Company’s reported GAAP revenue in the reporting periods following the acquisition. Purchase accounting adjustments for the year-ended December 31, 2017 relate to the September 2017 acquisition of ShoreTel.
35
Table of Contents
Gross Margin
The following table sets forth gross margin, both in dollars and as a percentage of revenues:
| Year ended December 31, | Change | |||||||||||||||||||||||
| 2017 | 2016 | |||||||||||||||||||||||
| Gross Margin |
% of Segment Revenues |
Gross Margin |
% of Segment Revenues |
Amount | Absolute% | |||||||||||||||||||
| (in millions, except percentages) | ||||||||||||||||||||||||
| Enterprise — Product |
$ | 340.8 | 55.5 | % | $ | 343.2 | 57.3 | % | $ | (2.4 | ) | (1.8 | ) | |||||||||||
| Enterprise — Services |
150.1 | 55.3 | % | 131.0 | 48.0 | % | 19.1 | 7.3 | ||||||||||||||||
|
|
|
|
|
|
|
|
|
|
|
|||||||||||||||
| Total Enterprise gross margin |
490.9 | 55.5 | % | 474.2 | 54.4 | % | 16.7 | 1.1 | ||||||||||||||||
| Cloud segment — Recurring |
89.5 | 50.9 | % | 57.8 | 50.1 | % | 31.7 | 0.8 | ||||||||||||||||
| Purchase accounting adjustments |
(1.5 | ) | * | — | — | (1.5 | ) | * | ||||||||||||||||
|
|
|
|
|
|
|
|
|
|
|
|||||||||||||||
| $ | 578.9 | 54.7 | % | $ | 532.0 | 53.9 | % | 46.9 | 0.8 | |||||||||||||||
|
|
|
|
|
|
|
|||||||||||||||||||
| * | The comparison is not meaningful. |
For the year ended December 31, 2017, overall gross margin percentage increased by an absolute 0.8% to 54.7% when compared to the year ended December 31, 2016, due primarily to higher gross margins in Enterprise services, as described below.
For the year ended December 31, 2017, Enterprise segment product gross margin percentage decreased by an absolute 1.8% to 55.5% due to lower revenues, as certain cost of sales are fixed. Enterprise segment services gross margin percentage increased by an absolute 7.3% to 55.3% due primarily to realized synergies over the last 12 months.
For the year ended December 31, 2017, Cloud segment recurring gross margin percentage increased by an absolute 0.8% to 50.9%, due largely to the effect of higher revenues, as certain costs of sales are fixed.
We expect gross margin percentage to remain relatively consistent in the near term. However, gross margin percentage could be higher or lower as a result of a number of factors including variations in revenue mix, competitive pricing pressures, foreign currency movements in regions where revenues are denominated in currencies other than the U.S. dollar, utilization of our professional services personnel and efficiencies in installing our products, and global economic conditions, among other factors.
Operating Expenses
Selling, General and Administrative (“SG&A”)
SG&A expenses increased to 34.7% of revenues for the year ended December 31, 2017 compared to 34.4% of revenues for the year ended December 31, 2016, an increase of $28.1 million in absolute dollars. Our SG&A expenses for the year ended December 31, 2017 included $14.4 million of stock-based compensation expense (year ended December 31, 2016 — $13.7 million). The increase in stock-based compensation was primarily due to the additional expense from restricted stock units granted during the year. For the year ended December 31, 2017, SG&A expenses include $28.8 million of expenses relating to the operations of ShoreTel, acquired on September 25, 2017. Excluding the results of ShoreTel from the date of acquisition, SG&A expense decreased by $0.7 million due to realized savings from restructuring activities undertaken in the last twelve months, which were partially offset by investments to support cloud-related growth initiatives.
We continue to monitor our cost base closely in an effort to keep our future operating expenditures in line with future revenue levels. SG&A expenses as a percentage of revenues is highly dependent on revenue levels and could vary significantly depending on actual revenues achieved in future years.
Research and Development
R&D expenses increased to 9.9% of revenues for the year ended December 31, 2017 compared to 9.8% of revenues for the year ended December 31, 2016, an increase of $8.0 million in absolute dollars. For the year ended December 31, 2017, R&D expenses include $16.1 million of expenses relating to the operations of ShoreTel, acquired on September 25, 2017. Excluding the results of ShoreTel from the date of acquisition, R&D expense decreased by $8.1 million due to realized savings from restructuring activities undertaken in the last twelve months, which were partially offset by investments to support cloud-related growth initiatives.
36
Table of Contents
We have historically invested heavily in R&D, which we believe positions us well with a broad range of cloud and enterprise-based communications solutions. Our R&D expenses in absolute dollars can fluctuate depending on the timing and number of development initiatives in any given period. R&D expenses as a percentage of revenues is highly dependent on revenue levels and could vary significantly depending on actual revenues achieved.
Special Charges and Restructuring Costs
Special charges and restructuring costs of $83.4 million were recorded in the year ended December 31, 2017. The costs consisted of $46.4 million of employee-related charges, $1.3 million of facility-reduction related charges, $17.3 million of integration-related charges and $18.4 million of acquisition-related charges. The employee-related charges consisted of termination and related costs in connection with headcount reductions of approximately 375 people, primarily in North America and Europe. Integration-related charges include professional fees and incidental costs relating to the integration of acquisitions. Acquisition-related charges consisted primarily of legal and advisory fees, including costs incurred relating to the acquisition of ShoreTel, as discussed in “Significant Events and Recent Developments — 2017” under the “Overview” section above.
At December 31, 2017, our remaining workforce reduction liability of $19.5 million consists primarily of salary and related benefits expected to be paid within one year. Our remaining lease termination obligations liability will be reduced over the remaining term of the leases, with $3.0 million of the total outstanding $4.1 million expected to be paid within one year.
We recorded special charges and restructuring costs of $70.8 million in the year ended December 31, 2016. The costs consisted of $20.2 million of employee-related charges, $1.6 million of facility-related charges, $19.5 million of integration-related charges as well as $29.5 million of acquisition-related charges. The employee-related charges consisted of termination and related costs in connection with headcount reductions of approximately 150 people, primarily in North America and Europe. Integration-related charges include professional fees and incidental costs relating to the integration of acquisitions. Acquisition-related charges consisted primarily of legal and advisory fees, including termination payments incurred relating to the terminated acquisition of Polycom as discussed in “Significant Events and Recent Developments — 2016” under the “Overview” section above. In connection with the termination, the Company received a termination fee of $60.0 million from Polycom, which is recorded separately in the consolidated statement of operations.
We expect to incur additional costs in the future to gain operating efficiencies. The timing and potential amount of such costs will depend on several factors, including future revenue levels and opportunities for operating efficiencies identified by management. In addition, we expect to incur additional costs for acquisition-related activities. The timing and potential amount of such costs will depend on several factors, including acquisition opportunities identified by management.
Amortization of acquisition-related intangible assets
For the year ended December 31, 2017 amortization of acquisition-related intangible assets increased to $54.9 million compared to $35.1 million for the year ended December 31, 2016. The increase is due primarily to acquired intangible assets relating to the acquisition of ShoreTel on September 25, 2017.
Income from termination fee received
In July 2016, we received a $60.0 million termination fee from Polycom in connection with the termination of the transaction as discussed in “Significant Events and Recent Developments — 2016” under the “Overview” section above. The fee was recorded as income in the third quarter of 2016.
Operating Income (Loss)
We reported an operating loss of $31.8 million for the year ended December 31, 2017 compared to operating income of $49.8 million for the year ended December 31, 2016. The operating income for the year ended December 31, 2016 was largely due to the $60.0 million income from termination fee received, as described above. Excluding the income from termination fee received, the higher operating loss was largely driven by higher special charges and restructuring costs and higher amortization of acquired intangibles due to the acquisition of ShoreTel, which was partially offset by operating income from the acquisition of ShoreTel.
37
Table of Contents
Non-Operating Expenses
Interest Expense
Interest expense from continuing operations was $18.7 million for the year ended December 31, 2017 compared to $16.8 million in the same period of 2016. The increase in interest expense was due to higher debt levels as a result of the September 25, 2017 acquisition of ShoreTel, partially offset by a lower effective interest rate as a result of the refinancing of our credit agreement in March 2017, as discussed under “Significant Events and Recent Developments — 2017” under the “Overview” section above.
For the year ended December 31, 2017, interest expense of $3.7 million has been classified as discontinued operations (year ended December 31, 2016 – $22.0 million). This represents interest on the approximately $350.0 million of term loan that was repaid using proceeds from the sale of the Mobile business unit on February 28, 2017, as discussed in “Significant Events and Recent Developments — 2017” under the “Overview” section above.
Our interest expense may fluctuate from period to period depending on the movement in the LIBOR (for the Incremental Term Loan, only when the LIBOR is above the 1.00 % floor) and depending on our level of indebtedness.
Debt Retirement and Other Debt Costs
We recorded debt retirement and other debt costs of $18.0 million for the year ended December 31, 2017 relating to the write-off the unamortized debt issue costs and unamortized original issue discount as a result of the repayment of our prior credit facilities in March 2017, as discussed in “Significant Events and Recent Developments — 2017” under the “Overview” section above.
We recorded debt retirement and other debt costs of $2.1 million for the year ended December 31, 2016 due to write-offs of the pro-rata share of unamortized debt issue costs and original issue discount as a result of $65.1 million of prepayments of our term loan made during 2016, as discussed in “Significant Events and Recent Developments — 2016” under the “Overview” section above.
Other Income (Expense)
For the year ended December 31, 2017, we recorded other expense of $0.1 million compared to other income of $2.8 million for the year ended December 31, 2016. The other loss for the year ended December 31, 2017 was primarily due to foreign exchange loss of $2.2 million, which was partially offset by $1.0 million of accretion of interest on the note received from the sale of our Mobile business in February 2017, as discussed in “Significant Events and Recent Developments — 2017” under the “Overview” section above. The other income for the year ended December 31, 2016 was primarily due to foreign exchange gain of $1.9 million.
Income Tax Recovery (Expense)
We recorded a net tax recovery of $20.3 million for the year ended December 31, 2017 compared to $1.3 million for the year ended December 31, 2016. The tax recovery was primarily due to research and development tax credits and the tax effect of restructuring.
During the years ended December 31, 2017 and December 31, 2016, there was no significant change in our assessment of the likelihood of the Company’s ability to generate future taxable income to realize deferred tax assets in various jurisdictions. At December 31, 2017, there continues to be a valuation allowance of $97.1 million (December 31, 2016 — $96.3 million) against deferred tax assets, primarily in the U.K. and the U.S. Future changes in estimates of taxable income could result in a significant change to the valuation allowance.
Net Income (Loss) from Continuing Operations
Our net loss from continuing operations for the year ended December 31, 2017 was $48.3 million compared to net income of $35.0 million for the year ended December 31, 2016. The higher net loss from continuing operations in 2017 was due to a higher operating loss, interest expense and debt retirement costs, partially offset by an income tax recovery, as described above.
Net Loss from Discontinued Operations, net of income tax
In December 2016, Mitel entered into a definitive agreement to divest the Mobile business unit and, on February 28, 2017, the sale was completed, as discussed in “Significant Events and Recent Developments—2017” under the “Overview” section above. As a result, the operations of the Mobile business unit have been reported on the consolidated statements of operations as discontinued operations. Summarized financial information for the Mobile business unit, up to the date of sale of February 28, 2017, are shown below, in millions:
38
Table of Contents
| Year Ended December 31 |
||||||||
| 2017(1) | 2016 | |||||||
| Revenues |
$ | 8.0 | $ | 186.4 | ||||
| Cost of revenues |
(6.3 | ) | (81.8 | ) | ||||
| Selling, general and administrative expenses |
(5.5 | ) | (34.5 | ) | ||||
| Research and development expenses |
(8.4 | ) | (48.4 | ) | ||||
| Special charges and restructuring costs |
— | (13.2 | ) | |||||
| Amortization of acquisition-related intangible assets |
— | (40.4 | ) | |||||
| Interest expense(2) |
(3.7 | ) | (22.0 | ) | ||||
| Goodwill impairment |
— | (212.8 | ) | |||||
| Other income |
— | 0.1 | ||||||
| Gain on disposal |
7.9 | — | ||||||
|
|
|
|
|
|||||
| Loss from discontinued operations, before income taxes |
(8.0 | ) | (266.6 | ) | ||||
| Income tax recovery |
6.6 | 14.3 | ||||||
|
|
|
|
|
|||||
| Comprehensive loss |
$ | (1.4 | ) | $ | (252.3 | ) | ||
|
|
|
|
|
|||||
| (1) | Operating results for the year ended December 31, 2017 consist of the operations up to the date of close, February 28, 2017. |
| (2) | Interest expense allocated to discontinued operations consists of the pro-rata allocation of interest expense on long-term debt that was repaid from the net proceeds of the sale of the Mobile business unit. |
The Company recorded a gain on disposal of $7.9 million in the first quarter of 2017 consisting of the fair value of consideration received of $378.0 million, less the carrying value of net assets of $362.9 million (which includes cash divested of $30.8 million), costs to sell incurred in the first quarter of 2017 of $2.6 million and liabilities for representations, warranties and indemnifications of $4.6 million. The fair value of consideration received of $378.0 million consisted of cash proceeds of $351.1 million received on February 28, 2017, proceeds from the net working capital adjustment of $16.6 million, received in May 2017, and the fair value of the non-interest bearing promissory note and units acquired of $10.3 million.
Further information on the divestiture is included in note 4 to the Consolidated Financial Statements.
Net Loss
Our net loss for the year ended December 31, 2017 was $49.7 million compared to a net loss of $217.3 million for the year ended December 31, 2016. The decrease in net loss was due to the lower net loss from discontinued operations, which was partially offset by a higher loss from continuing operations, as described above.
Other Comprehensive Income (Loss)
Other comprehensive income for the year ended December 31, 2017 consists of income of $19.5 million related to pension liability adjustments and income of $3.4 million due to foreign currency translation adjustments. The decrease in pension liability and corresponding other comprehensive income was primarily due to an increase actual asset returns in excess of the expected returns.
Other comprehensive loss for the year ended December 31, 2016 consists of a loss of $22.2 million related to pension liability adjustments and a loss of $1.5 million due to foreign currency translation adjustments. The increase in pension liability and corresponding other comprehensive loss was primarily due to an increase in the projected benefit obligation from a decrease in the discount rates. The discount rate assumption was determined using prevailing rates available on high-quality, fixed income debt instruments in the jurisdiction of each respective plan.
Adjusted EBITDA
Adjusted EBITDA from continuing operations was $144.6 million for the year ended December 31, 2017 compared to $129.6 million for the year ended December 31, 2016, an increase of $15.0 million. The increase was primarily due to the September 25, 2017 acquisition of ShoreTel. Adjusted EBITDA from discontinued operations was ($12.2) million for the year ended December 31, 2017 compared to $32.0 million for the year ended December 31, 2016, a decrease of $44.2 million. The decrease was
39
Table of Contents
due primarily to 2016 including a full year of operations of the Mobile business unit, while 2017 only included the results of operations up to the date of sale, February 28, 2017. Adjusted EBITDA, a non-GAAP measure, was $132.4 million for the year ended December 31, 2017 compared to $161.6 million for the year ended December 31, 2016, a decrease of $29.2 million. The decrease was driven by the changes in Adjusted EBITDA from continuing operations and discontinued operations described above.
For a definition and explanation of Adjusted EBITDA and why we believe it is useful in evaluating our financial condition, as well as a reconciliation of Adjusted EBITDA to the most directly comparable GAAP measure, net income, see Item 6, “Selected Financial Data”.
40
Table of Contents
Results of Operations — Year Ended December 31, 2016 Compared to Year Ended December 31, 2015
The following table sets forth our comparative results of operations, both in dollars and as a percentage of total revenues:
| Year Ended December 31, | Change | |||||||||||||||||||||||
| 2016 | 2015 | |||||||||||||||||||||||
| Amounts | % of Revenue |
Amounts | % of Revenue |
Amount | % | |||||||||||||||||||
| (in millions, except percentages and per share amounts) | ||||||||||||||||||||||||
| Revenues |
$ | 987.6 | 100.0 | % | $ | 1,025.8 | 100.0 | % | $ | (38.2 | ) | (3.7 | ) | |||||||||||
| Cost of revenues |
455.6 | 46.1 | % | 480.6 | 46.9 | % | (25.0 | ) | (5.2 | ) | ||||||||||||||
|
|
|
|
|
|
|
|||||||||||||||||||
| Gross margin |
532.0 | 53.9 | % | 545.2 | 53.1 | % | (13.2 | ) | (2.4 | ) | ||||||||||||||
|
|
|
|
|
|
|
|||||||||||||||||||
| Selling, general and administrative |
339.8 | 34.4 | % | 331.0 | 32.3 | % | 8.8 | 2.7 | ||||||||||||||||
| Research and development |
96.5 | 9.8 | % | 102.2 | 10.0 | % | (5.7 | ) | (5.6 | ) | ||||||||||||||
| Special charges and restructuring costs |
70.8 | 7.2 | % | 47.5 | 4.6 | % | 23.3 | 49.1 | ||||||||||||||||
| Amortization of acquisition-related intangible assets |
35.1 | 3.6 | % | 48.2 | 4.7 | % | (13.1 | ) | (27.2 | ) | ||||||||||||||
| Income from termination fee received |
(60.0 | ) | (6.1 | )% | — | — | (60.0 | ) | * | |||||||||||||||
|
|
|
|
|
|
|
|||||||||||||||||||
| 482.2 | 48.8 | % | 528.9 | 51.6 | % | (46.7 | ) | (8.8 | ) | |||||||||||||||
|
|
|
|
|
|
|
|||||||||||||||||||
| Operating income |
49.8 | 5.0 | % | 16.3 | 1.6 | % | 33.5 | * | ||||||||||||||||
| Interest expense |
(16.8 | ) | (1.7 | )% | (17.8 | ) | (1.7 | )% | 1.0 | (5.6 | ) | |||||||||||||
| Debt retirement and other debt costs |
(2.1 | ) | (0.2 | )% | (9.6 | ) | (0.9 | )% | 7.5 | * | ||||||||||||||
| Other income |
2.8 | 0.3 | % | 20.7 | 2.0 | % | (17.9 | ) | * | |||||||||||||||
| Income tax recovery (expense) |
1.3 | 0.1 | % | (3.1 | ) | (0.3 | )% | 4.4 | * | |||||||||||||||
|
|
|
|
|
|
|
|||||||||||||||||||
| Net income from continuing operations |
35.0 | 3.5 | % | 6.5 | 0.6 | % | 28.5 | * | ||||||||||||||||
| Net loss from discontinued operations, net of income tax |
(252.3 | ) | (25.5 | )% | (27.2 | ) | (2.7 | )% | (225.1 | ) | * | |||||||||||||
|
|
|
|
|
|
|
|||||||||||||||||||
| Net loss |
$ | (217.3 | ) | (22.0 | )% | $ | (20.7 | ) | (2.0 | )% | $ | (196.6 | ) | * | ||||||||||
|
|
|
|
|
|
|
|||||||||||||||||||
| Adjusted EBITDA (a non-GAAP measure) |
||||||||||||||||||||||||
| Adjusted EBITDA from continuing operations |
$ | 129.6 | 13.1 | % | $ | 149.1 | 14.5 | % | $ | (19.5 | ) | (13.1 | ) | |||||||||||
| Adjusted EBITDA from discontinued operations |
32.0 | 3.3 | % | 19.0 | 1.9 | % | 13.0 | * | ||||||||||||||||
|
|
|
|
|
|
|
|||||||||||||||||||
| Adjusted EBITDA |
$ | 161.6 | 16.4 | % | $ | 168.1 | 16.4 | % | $ | (6.5 | ) | (3.9 | ) | |||||||||||
|
|
|
|
|
|
|
|||||||||||||||||||
| Net income (loss) per common share — Basic |
||||||||||||||||||||||||
| Net income per share from continuing operations |
$ | 0.29 | $ | 0.06 | ||||||||||||||||||||
| Net loss per share from discontinued operations |
$ | (2.08 | ) | $ | (0.24 | ) | ||||||||||||||||||
| Net loss per common share |
$ | (1.79 | ) | $ | (0.18 | ) | ||||||||||||||||||
| Net income (loss) per common share —Diluted |
||||||||||||||||||||||||
| Net income per share from continuing operations |
$ | 0.28 | $ | 0.06 | ||||||||||||||||||||
| Net loss per share from discontinued operations |
$ | (2.01 | ) | $ | (0.24 | ) | ||||||||||||||||||
| Net loss per common share |
$ | (1.73 | ) | $ | (0.18 | ) | ||||||||||||||||||
| * | The comparison is not meaningful. |
41
Table of Contents
Revenues
Our reportable segments are determined in accordance with how our management views and evaluates our business and are described further in note 22 to the Consolidated Financial Statements. The following tables set forth revenues by business segment in dollars and as a percentage of total revenues:
| Year ended December 31, | Change | |||||||||||||||||||||||
| 2016 | 2015 | |||||||||||||||||||||||
| Revenues | % of Revenues |
Revenues | % of Revenues |
Amount | % | |||||||||||||||||||
| (in millions, except percentages) | ||||||||||||||||||||||||
| Enterprise — Product |
$ | 599.2 | 60.7 | % | $ | 661.3 | 64.5 | % | $ | (62.1 | ) | (9.4 | ) | |||||||||||
| Enterprise — Services |
273.0 | 27.6 | % | 265.0 | 25.8 | % | 8.0 | 3.0 | ||||||||||||||||
|
|
|
|
|
|
|
|
|
|
|
|||||||||||||||
| Total Enterprise revenues |
872.2 | 88.3 | % | 926.3 | 90.3 | % | (54.1 | ) | (5.8 | ) | ||||||||||||||
| Cloud segment — Recurring |
115.4 | 11.7 | % | 102.4 | 10.0 | % | 13.0 | 12.7 | ||||||||||||||||
| Purchase accounting adjustments |
— | — | (2.9 | ) | (0.3 | )% | 2.9 | * | ||||||||||||||||
|
|
|
|
|
|
|
|
|
|
|
|||||||||||||||
| $ | 987.6 | 100.0 | % | $ | 1,025.8 | 100.0 | % | (38.2 | ) | (3.7 | ) | |||||||||||||
|
|
|
|
|
|
|
|||||||||||||||||||
| * | The comparison is not meaningful. |
Our revenues for the year ended December 31, 2016 were $987.6 million compared to revenues of $1,025.8 million for the year ended December 31, 2015. The decrease in revenues was due to lower volumes in our Enterprise segment and the effect of foreign exchange, which were partially offset by growth in our Cloud segment.
For the year ended December 31, 2016 when compared to the year ended December 31, 2015, there was a general weakening of foreign currencies when compared against the U.S. dollar. In particular, the British pound sterling was weaker against the U.S. dollar by an average of 11.0%. In June 2016, the U.K. held a European Union (“E.U.”) membership referendum, the result of which was a majority vote in favor of the U.K. leaving the E.U. The British pound sterling weakened against the U.S. dollar by approximately 11% in the week following the referendum and continued to weaken throughout the rest of 2016. In total, we estimate that the change in foreign exchange rates accounted for an absolute 1.7% of the 3.7% decrease in revenues.
Enterprise Segment
When compared to the year ended December 31, 2015, Enterprise segment product revenues decreased by $62.1 million, or 9.4%, to $599.2 million as a result of the unfavorable impact of foreign exchange rates, lower volumes and customers migrating to a cloud recurring model, with monthly payments over a fixed term. Enterprise segment services revenues increased by $8.0 million, or 3.0%, to $273.0 million due to higher installation and professional services activity.
Cloud segment
For the year ended December 31, 2016, Cloud segment recurring revenues increased by $13.0 million, or 12.7%, to $115.4 million. The increased revenue in 2016 resulted from both new and existing customers transitioning to our recurring cloud solutions.
Purchase accounting adjustments
Purchase accounting adjustments result in a reduction in revenue and are presented separately to reflect the nature of the adjustment. In accordance with the fair value provisions applicable to the accounting for business combinations, acquired deferred revenue relating to acquisitions was recorded on the opening balance sheet at an amount that was lower than the historical carrying value. The purchase accounting adjustment reflects the revenue that would have otherwise been recognized had the contract been recorded at the historical carrying value as the revenue reductions related to acquired contracts will not recur when similar software maintenance and service contracts are recorded in future periods. Although the purchase accounting adjustments have no impact on the Company’s business or cash flow, they adversely impact the Company’s reported GAAP revenue in the reporting periods following the acquisition. Purchase accounting adjustments for the year-ended December 31, 2015 relate to the January 2014 acquisition of Aastra.
42
Table of Contents
Gross Margin
The following table sets forth gross margin, both in dollars and as a percentage of revenues:
| Year ended December 31, | Change | |||||||||||||||||||||||
| 2016 | 2015 | |||||||||||||||||||||||
| Gross Margin |
% of Segment Revenues |
Gross Margin |
% of Segment Revenues |
Amount | Absolute % | |||||||||||||||||||
| (in millions, except percentages) | ||||||||||||||||||||||||
| Enterprise — Product |
$ | 343.2 | 57.3 | % | $ | 375.3 | 56.8 | % | $ | (32.1 | ) | 0.5 | ||||||||||||
| Enterprise — Services |
131.0 | 48.0 | % | 124.3 | 46.9 | % | 6.7 | 1.1 | ||||||||||||||||
|
|
|
|
|
|
|
|
|
|
|
|||||||||||||||
| Total Enterprise gross margin |
474.2 | 54.4 | % | 499.6 | 53.9 | % | (25.4 | ) | 0.5 | |||||||||||||||
| Cloud segment — Recurring |
57.8 | 50.1 | % | 48.5 | 47.4 | % | 9.3 | 2.7 | ||||||||||||||||
| Purchase accounting adjustments |
— | — | (2.9 | ) | * | 2.9 | * | |||||||||||||||||
|
|
|
|
|
|
|
|
|
|
|
|||||||||||||||
| $ | 532.0 | 53.9 | % | $ | 545.2 | 53.1 | % | (13.2 | ) | 0.8 | ||||||||||||||
|
|
|
|
|
|
|
|||||||||||||||||||
| * | The comparison is not meaningful. |
For the year ended December 31, 2016, overall gross margin percentage increased by an absolute 0.8% to 53.9% compared to 53.1% for the year ended December 31, 2015, due to stronger gross margins in the Enterprise and Cloud segments, as described below.
For the year ended December 31, 2016, Enterprise segment product gross margin percentage increased by an absolute 0.5% to 57.3% and Enterprise segment services gross margin percentage increased by an absolute 1.1% to 48.0% as realized synergies over the last 12 months were partially offset by the effect of unfavorable changes in foreign exchange rates (as a lower percentage of cost of sales is denominated in British pound sterling when compared to the percentage of revenues denominated in British pound sterling) and the effect of lower volumes as certain cost of sales are fixed.
For the year ended December 31, 2016, Cloud segment recurring gross margin percentage increased by an absolute 2.7% to 50.1% due largely to the effect of higher sales, as certain costs of sales are fixed.
Operating Expenses
Selling, General and Administrative (“SG&A”)
SG&A expenses increased to 34.4% of revenues for the year ended December 31, 2016 compared to 32.3% of revenues for the year ended December 31, 2015, an increase of $8.8 million in absolute dollars. Our SG&A expenses for the year ended December 31, 2016 included $13.7 million of stock-based compensation expense (year ended December 31, 2015 — $11.2 million). The increase in stock-based compensation was due to the additional expense from restricted stock units granted during the year. The increase in SG&A in absolute dollars was primarily due to additional spending in the Cloud segment to support growth initiatives, which were partially offset by realized synergies from the integration of acquisitions as well as the effect of changes in foreign currency exchange rates due to the stronger U.S dollar in 2016 when compared to 2015.
We continue to monitor our cost base closely in an effort to keep our future operating expenditures in line with future revenue levels. SG&A expenses as a percentage of revenues is highly dependent on revenue levels and could vary significantly depending on actual revenues achieved in future years.
Research and Development
R&D expenses decreased to 9.8% of revenues for the year ended December 31, 2016 compared to 10.0% of revenues for the year ended December 31, 2015, a decrease of $5.7 million in absolute dollars. The decrease was largely driven by realized synergies from the integration of acquisitions as well as the effect of changes in foreign currency exchange rates due to the stronger U.S dollar in 2016 when compared to 2015.
43
Table of Contents
Special Charges and Restructuring Costs
We recorded special charges and restructuring costs of $70.8 million in the year ended December 31, 2016. The costs consisted of $20.2 million of employee-related charges, $1.6 million of facility-related charges, $19.5 million of integration-related charges as well as $29.5 million of acquisition-related charges. The employee-related charges consisted of termination and related costs in connection with headcount reductions of approximately 150 people, primarily in North America and Europe. Integration-related charges include professional fees and incidental costs relating to the integration of acquisitions. Acquisition-related charges consisted primarily of legal and advisory fees, including termination payments incurred relating to the terminated acquisition of Polycom as discussed in “Significant Events and Recent Developments — 2016” under the “Overview” section above. In connection with the termination, the Company received a termination fee of $60.0 million from Polycom, which is recorded separately in the consolidated statement of operations.
Special charges and restructuring costs of $47.5 million were recorded in the year ended December 31, 2015. The costs consisted of $16.4 million of employee-related charges, $1.7 million of facility-reduction related charges, $16.9 million of integration-related charges and $12.5 million of acquisition-related charges. The employee-related charges consisted of costs related to headcount reductions of approximately 150 people, primarily in North America and Europe. Facility-reduction related charges consisted primarily of lease termination obligations for facilities, primarily in North America. Integration-related charges primarily consist of professional fees and incidental costs relating to the integration of acquisitions. Acquisition-related charges consisted primarily of legal and advisory fees incurred to close the April 2015 acquisition of Mavenir.
Amortization of acquisition-related intangible assets
In the year ended December 31, 2016 amortization of acquisition-related intangible assets decreased to $35.1 million compared to $48.2 million for the year ended December 31, 2015. The decrease is due primarily to certain acquired intangible assets from historical acquisitions becoming fully amortized over the last year.
Income from termination fee received
In July 2016, we received a $60.0 million termination fee from Polycom in connection with the termination of the transaction as discussed in “Significant Events and Recent Developments — 2016” under the “Overview” section above. The fee was recorded as income in the third quarter of 2016.
Operating Income
We reported operating income of $49.8 million for the year ended December 31, 2016 compared to $16.3 million for the year ended December 31, 2015. The increase in operating income was driven by income from termination fee received in connection with the terminated Polycom acquisition, which was in excess of the special charges and restructuring costs recorded related to the transaction. Excluding special charges and restructuring costs and the income from the termination fee, operating income for the year ended December 31, 2016 decreased by $3.2 million compared with the 2015 comparable period primarily due to lower revenues, which were offset by a higher gross margin percentage and lower amortization of acquired intangibles, as described above.
Non-Operating Expenses
Interest Expense
Interest expense for continuing operations was $16.8 million for the year ended December 31, 2016 compared to $17.8 million for the year ended December 31, 2015. In addition, for the year ended December 31, 2016, interest expense of $22.0 million was reclassified as discontinued operations, which consists of interest expense on the approximate $350.0 million of term loan that was repaid in connection with the sale of the Mobile business unit (year ended December 31, 2015—$14.6 million of interest expense).
The increase in total interest expense was due to higher debt levels and a higher interest rate margin as the result of the refinancing of our credit facilities in April 2015.
Debt Retirement and Other Debt Costs
We recorded debt retirement costs of $2.1 million for the year ended December 31, 2016 due to write-offs of the pro-rata share of unamortized debt issue costs and original issue discount as a result of $65.1 million of prepayments of our term loan made during 2016, as discussed in “Significant Events and Recent Developments — 2016” under the “Overview” section above.
44
Table of Contents
We recorded debt retirement costs of $9.6 million for the year ended December 31, 2015 primarily as a result of the refinancing of our credit agreement in April 2015 as well as prepayments of our credit facilities during 2015. In the first quarter of 2015, we recorded debt retirement and other debt costs of $0.7 million relating to a write-off of the pro-rata share of unamortized debt issue costs and original issue discount as a result of a $25.0 million prepayment of our term loan in February 2015. In the second quarter of 2015, we recorded debt retirement and other debt costs of $8.4 million relating to a write-off of the unamortized debt issue costs and unamortized original issue discount as a result of the repayment of our prior credit facilities in April 2015. In the third quarter of 2015, we recorded debt retirement and other debt costs of $0.5 million for expenses relating to the September 2015 amendment of our April 2015 Credit Facilities as discussed in “Significant Events and Recent Developments — 2015” under the “Overview” section above.
Other Income
For the year ended December 31, 2016, we recorded other income of $2.8 million compared to other income of $20.7 million during the year ended December 31, 2015. The other income for the years ended December 31, 2016 and 2015 was primarily due to foreign exchange gains of $1.9 million and $18.8 million, respectively. The $18.8 million foreign exchange gains for the year ended December 31, 2015 related primarily to intercompany balances and were fully offset by foreign currency translation adjustments recorded in other comprehensive loss, resulting in no net economic effect to the Company.
Income Tax Recovery (Expense)
We recorded a net tax recovery of $1.3 million for the year ended December 31, 2016 compared to a net tax expense of $3.1 million for the year ended December 31, 2015. The tax recovery was primarily due to research and development tax credits and the tax effect of restructuring.
During the years ended December 31, 2016 and December 31, 2015, there was no significant change in our assessment of the likelihood of the Company’s ability to generate future taxable income to realize deferred tax assets in various jurisdictions.
Net Income from Continuing Operations
Our net income from continuing operations for the year ended December 31, 2016 was $35.0 million compared to net income of $6.5 million for the year ended December 31, 2015. The increase in net income from continuing operations was due primarily to higher operating income and lower debt retirement costs, partially offset by lower other income, as described above.
Net Loss from Discontinued Operations, net of income tax
In December 2016, Mitel entered into a definitive agreement to divest the Mobile business unit and, on February 28, 2017, the sale was completed, as discussed in “Significant Events and Recent Developments — 2016” under the “Overview” section above. As a result, the operations of the Mobile business unit have been reported on the consolidated statements of operations as discontinued operations. Summarized financial information for the Mobile business unit, up to the date of sale, is shown below, in millions:
| Year Ended December 31, 2016 |
Year Ended December 31, 2015(1) |
|||||||
| Revenues |
$ | 186.4 | $ | 131.9 | ||||
| Cost of revenues |
(81.8 | ) | (63.2 | ) | ||||
| Selling, general and administrative expenses |
(34.5 | ) | (32.0 | ) | ||||
| Research and development expenses |
(48.4 | ) | (29.2 | ) | ||||
| Special charges and restructuring costs |
(13.2 | ) | (7.1 | ) | ||||
| Amortization of acquisition-related intangible assets |
(40.4 | ) | (26.9 | ) | ||||
| Interest expense(2) |
(22.0 | ) | (14.6 | ) | ||||
| Goodwill impairment |
(212.8 | ) | — | |||||
| Other income |
0.1 | 0.2 | ||||||
|
|
|
|
|
|||||
| Loss from discontinued operations, before income taxes |
(266.6 | ) | (40.9 | ) | ||||
| Income tax recovery |
14.3 | 13.7 | ||||||
|
|
|
|
|
|||||
| Net loss from discontinued operations, net of income tax |
$ | (252.3 | ) | $ | (27.2 | ) | ||
|
|
|
|
|
|||||
| (1) | Operating results for the year ended December 31, 2015 consist of the operations from the date of acquisition, April 29, 2015. |
| (2) | Interest expense allocated to discontinued operations consists of the pro-rata allocation of interest expense on long-term debt that was repaid from the net proceeds of the sale of the Mobile business unit. |
45
Table of Contents
Revenues for the mobile business unit increased from $131.9 million in fiscal 2015 to $186.4 in 2016. A portion of the increase is due to fiscal 2015 including results of operations only from the time of acquisition of the Mobile business unit on April 29, 2015. On a pro-forma basis, including the operations of the Mobile business unit for a full twelve months of operations in 2015, Mobile business unit revenues were $176.2 million. The increase in revenues in 2016 when compared to the pro forma results for 2015 is due primarily to new installations.
For the year ended December 31, 2016, the loss from discontinued operations, before taxes, consists of a loss from operations of $31.9 million, interest expense of $22.0 million, other income of $0.1 million and an impairment of goodwill of $212.8 million, as described under critical accounting policies, below. For the year ended December 31, 2015, the loss from discontinued operations, before taxes, consists of a loss from operations of $26.5 million, interest expense of $14.6 million and other income of $0.2 million.
Further information on the divestiture is included in note 4 to the Consolidated Financial Statements.
Net Loss
Our net loss for the year ended December 31, 2016 was $217.3 million compared to a net loss of $20.7 million for the year ended December 31, 2015. The increase in net loss was due to the higher net loss from discontinued operations, which offset higher income from continuing operations, as described above.
Other Comprehensive Income (Loss)
Other comprehensive loss for the year ended December 31, 2016 includes a loss of $22.2 million related to pension liability adjustments and a loss of $1.5 million due to foreign currency translation adjustments. The increase in pension liability and corresponding other comprehensive loss was primarily due to an increase in the projected benefit obligation from a decrease in the discount rates. The discount rate assumption was determined using prevailing rates available on high-quality, fixed income debt instruments in the jurisdiction of each respective plan.
Other comprehensive loss of $21.0 million for the year ended December 31, 2015 was due primarily to foreign currency translation adjustments of $29.1 million as result of significant changes in foreign currency exchange rates during the year, in particular the Euro and the British pound weakening against the U.S. dollar.
Adjusted EBITDA
Adjusted EBITDA from continuing operations was $129.6 million for the year ended December 31, 2016 compared to $149.1 million for the year ended December 31, 2015, a decrease of $19.5 million. The decrease was primarily due to lower sales in our Enterprise segment, as described above. Adjusted EBITDA from discontinued operations was $32.0 million for the year ended December 31, 2016 compared to $19.0 million for the year ended December 31, 2015, an increase of $13.0 million. The increase was due primarily to 2016 including a full year of operations of the Mobile business unit, while 2015 only included the results of operations since the date of acquisition, April 29, 2015, as well as higher revenues, as described above. Adjusted EBITDA, a non-GAAP measure, was $161.6 million for the year ended December 31, 2016 compared to $168.1 million for the year ended December 31, 2015, a decrease of $6.5 million. The decrease was driven by lower Adjusted EBITDA from continuing operations.
For a definition and explanation of Adjusted EBITDA and why we believe it is useful in evaluating our financial condition, as well as a reconciliation of Adjusted EBITDA to the most directly comparable GAAP measure, net income, see Item 6, “Selected Financial Data”.
46
Table of Contents
Cash Flows — Comparison of the Year Ended December 31, 2017 to Year Ended December 31, 2016
Below is a summary of results of cash flows and a discussion of results for the year ended December 31, 2017 compared to the year ended December 31, 2016.
| Year Ended December 31, 2017 |
Year Ended December 31, 2016 |
Change | ||||||||||
| (in millions) | ||||||||||||
| Net cash provided by (used in) |
||||||||||||
| Operating activities |
$ | 36.7 | $ | 99.7 | $ | (63.0 | ) | |||||
| Investing activities |
(93.3 | ) | (17.3 | ) | (76.0 | ) | ||||||
| Financing activities |
(6.5 | ) | (69.0 | ) | 62.5 | |||||||
| Effect of exchange rate changes on cash and cash equivalents |
5.6 | (4.2 | ) | 9.8 | ||||||||
|
|
|
|
|
|
|
|||||||
| Increase (decrease) in cash and cash equivalents |
$ | (57.5 | ) | $ | 9.2 | $ | (66.7 | ) | ||||
|
|
|
|
|
|
|
|||||||
| Total cash and cash equivalents, end of year |
$ | 43.3 | $ | 100.8 | $ | (57.5 | ) | |||||
|
|
|
|
|
|
|
|||||||
Cash Provided by Operating Activities
Cash generated from operating activities for the year ended December 31, 2017 was $36.7 million compared with $99.7 million for the year ended December 31, 2016. The decrease in cash flows from operations was largely due to lower operating income during the year, including the year ended December 31, 2016 including the $60.0 million termination fee received from Polycom in connection with the termination of the transaction as discussed in “Significant Events and Recent Developments — 2016” under the “Overview” section above.
Cash Used in Investing Activities
Net cash used for investing activities was $93.3 million for the year ended December 31, 2017 compared to $17.3 million for the year ended December 31, 2016.
Net cash used in investing activities was $93.3 million in the year ended December 31, 2017 and consisted of $411.0 million of net cash paid for the acquisition of ShoreTel and $19.2 million of cash paid for additions of property, plant and equipment and is net of cash proceeds of $336.9 million relating to the sale of the Mobile business unit in the first quarter of 2017. On September 25, 2017, Mitel acquired ShoreTel for net cash consideration of $411.0 million ($531.4 million of cash paid to ShoreTel shareholders, option holders and holders of ShoreTel restricted stock units, net of $120.4 million of cash acquired). In addition, we recorded net cash proceeds of $336.9 million from the February 2017 sale of the Mobile business unit, consisting of $351.1 million of cash proceeds at the time of sale and $16.6 million of additional cash proceeds received from the net working capital adjustment in May 2017, net of cash included in the divested business unit of $30.8 million. The acquisition of ShoreTel and the disposition of the Mobile business unit are described further under “Significant Events and Recent Developments – 2017” under the “Overview” section above.
The cash used for investing for the year ended December 31, 2016 consisted of additions to property, plant and equipment.
Cash Used in Financing Activities
For the year ended December 31, 2017, net cash used in financing activities was $6.5 million, compared to $69.0 million for the year ended December 31, 2016.
The net cash used in financing activities for the year ended December 31, 2017 was $6.5 million and consisted primarily of net borrowings $385.5 incurred to acquire ShoreTel in September 2017, partially offset by a net $346.6 million repayment from the refinancing of our prior credit facilities in the March 2017, and $35.7 million of cash paid to repurchase shares. In September 2017, we received proceeds of $298.5 million from the new Incremental Term Loan and incurred $87.0 million of new net borrowings under the revolving credit facility, both of which were used to fund the acquisition of ShoreTel, as described above. In March 2017, we repaid the $591.6 million outstanding on our prior credit facilities, using the $245.0 million proceeds from our new credit facility, $320.3 million of proceeds from the February 2017 sale of the Mobile business unit, as well as cash on hand.
The use of cash for the year ended December 31, 2016 consisted primarily of repayments of our term loan during the year as discussed in “Significant Events and Recent Developments — 2016” under the “Overview” section above.
Effect of Exchange Rate Changes on Cash
Our overall cash position was also impacted by exchange rate changes during the period, which increased cash by $5.6 million for the year ended December 31, 2017 compared to a decrease of $4.2 million for the year ended December 31, 2016.
47
Table of Contents
Cash Flows — Comparison of the Year Ended December 31, 2016 to Year Ended December 31, 2015
Below is a summary of results of cash flows and a discussion of results for the year ended December 31, 2016 compared to the year ended December 31, 2015.
| Year Ended December 31, 2016 |
Year Ended December 31, 2015 |
Change | ||||||||||
| (in millions) | ||||||||||||
| Net cash provided by (used in) |
||||||||||||
| Operating activities |
$ | 99.7 | $ | 54.6 | $ | 45.1 | ||||||
| Investing activities |
(17.3 | ) | (362.9 | ) | 345.6 | |||||||
| Financing activities |
(69.0 | ) | 292.8 | (361.8 | ) | |||||||
| Effect of exchange rate changes on cash and cash equivalents |
(4.2 | ) | (4.2 | ) | — | |||||||
|
|
|
|
|
|
|
|||||||
| Increase (decrease) in cash and cash equivalents |
$ | 9.2 | $ | (19.7 | ) | $ | 28.9 | |||||
|
|
|
|
|
|
|
|||||||
| Total cash and cash equivalents, end of year |
$ | 100.8 | $ | 91.6 | $ | 9.2 | ||||||
|
|
|
|
|
|
|
|||||||
Cash Provided by Operating Activities
Cash generated from operating activities for the year ended December 31, 2016 was $99.7 million compared with $54.6 million for the year ended December 31, 2015. The higher cash flows from operations was largely due to the year ended December 31, 2015 having unfavorable changes in non-cash assets and liabilities, in particular due to changes in accounts payable and accrued liabilities due to the timing of cash payments.
Cash Used in Investing Activities
Net cash used for investing activities was $17.3 million for the year ended December 31, 2016 compared to net cash used of $362.9 million for the year ended December 31, 2015.
The cash used for investing for the year ended December 31, 2016 consisted of additions to property, plant and equipment.
The cash used in investing activities for the year ended December 31, 2015 consists of $346.7 million for acquisitions, consisting of $343.2 million for the April 2015 acquisition of Mavenir (cash paid of $353.3 million, net of cash acquired of $10.1 million) and $3.5 million for the June 2015 acquisition of Tiger (cash paid of $4.8 million net of cash acquired of $1.3 million), as well as additions to property, equipment and intangible assets of $16.2 million.
Cash Provided by (Used in) Financing Activities
For the year ended December 31, 2016, net cash used in financing activities was $69.0 million, compared to cash provided by financing activities of $292.8 million for the year ended December 31, 2015.
The use of cash for the year ended December 31, 2016 consisted primarily of repayments of our term loan during the year as discussed in “Significant Events and Recent Developments — 2016” under the “Overview” section above.
The cash provided by financing activities in the year ended December 31, 2015 consisted primarily of net proceeds from the April 2015 refinancing as discussed in “Significant Events and Recent Developments — 2015” under the “Overview” section above, partially offset by a $25.0 million repayment of our then-existing term loan made in February 2015.
During the year ended December 31, 2016, we drew and subsequently repaid various amounts of up to $21.0 million on our revolving credit facility. The total of all amounts drawn and subsequently repaid during the year was $83.0 million (years ended December 31, 2015 and 2014 — $21.0 million and nil, respectively).
Effect of Exchange Rate Changes on Cash
Our overall cash position was also impacted by exchange rate changes during the period, which decreased cash by $4.2 million for the year ended December 31, 2016 compared to a decrease of $4.2 million for the year ended December 31, 2015.
48
Table of Contents
Liquidity and Capital Resources
As of December 31, 2017, our liquidity consisted primarily of cash and cash equivalents of $43.3 million and a $350.0 million revolving credit facility, of which $190.0 million was drawn. At December 31, 2017, we had $443.6 million of term loans outstanding under our 2017 Credit Facilities and had stated shareholders’ equity of $345.7 million.
Cash and Cash Equivalents
At December 31, 2017 and December 31, 2016, our cash equivalents consist of short-term, investment-grade commercial paper and government debt. We classify our cash equivalents as current based on their nature and their availability for use in current operations.
We follow an investment policy where our excess cash is invested in investment-grade commercial paper and government debt, generally with a maturity of less than three months. There is no limit on the investments in the federal governments of Canada, the U.S. or the U.K. We diversify our portfolio by limiting the amount invested in any other single institution.
Credit Facilities
Our senior credit facilities consist of a $350.0 million revolving credit facility, maturing March 2022, an initial $150.0 million Term Loan, maturing March 2022 and an initial Incremental Term Loan of $300.0 million, maturing September 2023. The 2017 Credit Facilities contain certain affirmative and negative covenants, including a maximum Leverage Ratio and a minimum Interest Coverage Ratio. The Term Loan and Incremental Term Loan require quarterly principal repayments, as well as annual repayments of excess cash flow. The 2017 credit facilities are further described in note 13 to the Consolidated Financial Statements.
In March 2017, we refinanced our prior senior credit facilities. The new credit facilities were comprised of an initial $150.0 million term loan and a $350.0 million revolving credit facility. Proceeds of $150.0 million from the term loan along with initial amounts drawn on the revolving credit facility of $95.0 million and cash on hand, were used to repay the remaining principal and accrued interest outstanding under the prior credit facilities, as well as fees and expenses related to the new financing.
In September 2017, in conjunction with the acquisition of ShoreTel, the credit facilities were amended to allow for a $300.0 million incremental term loan (together with the term loan and revolving credit facility, the “2017 Credit Facilities”) as well as other corresponding changes as the result of the acquisition.
Defined Benefit Plans
We have defined benefit plans, primarily in the U.K., France, Germany and Switzerland. The total liability decreased to $120.1 million at December 31, 2017 from $145.5 million at December 31, 2016 due primarily to a decrease in the projected benefit obligation as a result of an increase in the discount rate during 2017.
Our defined benefit pension plan in the U.K. is in place for a number of our past and present employees in the U.K. The plan has been closed to new members since 2001 and closed to new service since 2012. The plan is partially funded. At December 31, 2017, the plan had an unfunded pension liability of $85.8 million (December 31, 2016 — $98.7 million). Contributions to fund the benefit obligations under this plan are based on actuarial valuations, which themselves are based on certain assumptions about the long-term operations of the plan, including the life expectancy of members, the performance of the financial markets and interest rates. The amount of annual employer contributions required to fund the pension deficit annually is determined every three years, in accordance with U.K. regulations. In June 2013, the Company’s annual funding requirement to fund the pension deficit for 2014 was determined to be $4.3 million (£3.2 million), and increases at an annual rate of 3% for the calendar years 2015 and 2016. In September 2016, the Company’s annual funding requirement to fund the pension deficit was determined to be $7.4 million (£5.5 million) for the remainder of 2016 (on a pro-rata basis) and for 2017, 2018 and 2019.
We have a partially funded multiple-employer pension plan in Switzerland. In Switzerland, retirees generally benefit from the receipt of a perpetual annuity at retirement based on an accrued value at the date of retirement. The accrued value is related to the actual returns on contributions during the working period. At December 31, 2017, a liability of $8.0 million was recorded for Mitel’s pro-rata share of the pension liability (December 31, 2016 – $22.6 million).
At December 31, 2017, we had unfunded pension liabilities in other jurisdictions, including France and Germany, totaling $26.3 million (December 31, 2016 – $24.2 million). In France, retirees generally benefit from a lump sum payment upon retirement or departure. In Germany, retirees generally benefit from the receipt of a perpetual annuity at retirement, based on their years of service and ending salary.
49
Table of Contents
Liquidity
We believe that with our existing cash balances and undrawn revolving credit facility we will have sufficient liquidity to support our business operations for the next 12 months. However, we may elect to seek additional funding at any time. Our future capital requirements will depend on many factors, including our rate of revenue growth, the timing and extent of spending on restructuring and integration actions, the timing and extent of spending to support product development efforts and expansion of sales and marketing, the timing of introductions of new products and enhancements to existing products, market acceptance of our products, changes in foreign exchange rates and the cost, timing and success of potential acquisitions. Additional equity or debt financing may not be available on acceptable terms or at all. In addition, any proceeds from the issuance of debt may be required to be used, in whole or in part, to make mandatory payments under the applicable existing credit agreement.
Contractual Obligations
The following table sets forth our contractual obligations as of December 31, 2017:
| Payments Due by Fiscal Year | ||||||||||||||||||||||||||||
| Contractual Obligations |
2018 | 2019 | 2020 | 2021 | 2022 | Thereafter | Total | |||||||||||||||||||||
| (in millions) | ||||||||||||||||||||||||||||
| Long-term debt obligations – principal (1) |
$ | 13.3 | $ | 14.3 | $ | 17.1 | $ | 18.0 | $ | 286.7 | $ | 284.2 | $ | 633.6 | ||||||||||||||
| Long-term debt obligations – fees and expenses (2) |
32.8 | 32.1 | 31.5 | 30.5 | 19.1 | 11.4 | 157.4 | |||||||||||||||||||||
| Capital lease obligations (3) |
4.0 | 2.7 | 1.3 | 0.1 | — | — | 8.1 | |||||||||||||||||||||
| Operating lease obligations (4) |
26.7 | 20.6 | 16.2 | 10.6 | 7.8 | 16.2 | 98.1 | |||||||||||||||||||||
| Defined benefit plan contributions (5) |
7.4 | 7.4 | — | — | — | — | 14.8 | |||||||||||||||||||||
|
|
|
|
|
|
|
|
|
|
|
|
|
|
|
|||||||||||||||
| Total |
$ | 84.2 | $ | 77.1 | $ | 66.1 | $ | 59.2 | $ | 313.6 | $ | 311.8 | $ | 912.0 | ||||||||||||||
|
|
|
|
|
|
|
|
|
|
|
|
|
|
|
|||||||||||||||
| (1) | Represents principal repayments under the 2017 Credit Facilities. Amounts outstanding on the revolving credit facility are assumed to be repaid upon maturity. No amounts have been included for the annual excess cash flow repayment, which begins in 2019, as an estimate is not practicable. |
| (2) | Represents interest and commitment fees on amounts outstanding under the 2017 Credit Facilities. Interest on the outstanding amounts is based on LIBOR plus an applicable margin, as described in note 13 to the Consolidated Financial Statements. For the purposes of this table, the interest was calculated using the three-month LIBOR at December 31, 2017 and an applicable margin of 3.25% for amounts outstanding on our revolving credit facility and Term Loan, which is based on our Consolidated Total Net Leverage Ratio at December 31, 2017. For amounts outstanding on our Incremental Term Loan, interest is based on an applicable margin of 3.75%. Included in long-term debt obligations – interest and fees is a 0.40% commitment fee on the undrawn portion of the revolving credit facility. |
| (3) | Represents the principal and interest payments for capital lease obligations. Interest rates on these obligations range from 5.1% to 5.9%. |
| (4) | Operating lease obligations exclude payments to be received by us under sublease arrangements. |
| (5) | Represents the expected contribution to our U.K. defined benefit pension plan. The amount of annual employer contributions required to fund the U.K. plan’s deficit is determined every three years in accordance with U.K. regulations. Future funding requirements after calendar year 2019 are dependent on the unfunded pension liability and the time period over which the deficit is amortized and have been excluded from the table. Total estimated employer cash contributions under the unfunded defined benefit plans in France and Germany and the multiple-employer plan in Switzerland are dependent on the timing of benefit payments and plan funding levels and have been excluded from the above table. Further information on these plans is included in note 24 to the Consolidated Financial Statements. |
Total contractual obligations listed do not include contractual obligations recorded on the balance sheet as current liabilities, except for those associated with a long-term liability. Contractual obligations also exclude $21.3 million of non-current tax liabilities primarily relating to uncertain tax positions due to the uncertainty of the timing of any potential payments.
Purchase orders or contracts for the purchase of raw materials and other goods and services are not included in the table above. We are not able to determine the aggregate amount of such purchase orders that represent contractual obligations as, in many instances, purchase orders may represent authorizations to purchase rather than binding agreements.
50
Table of Contents
Off-Balance Sheet Arrangements
We have the following significant off-balance sheet arrangements:
Letters of Credit
We had $5.6 million in letters of credit, bank guarantees or similar instruments outstanding as of December 31, 2017 (December 31, 2016 — $6.2 million).
Intellectual Property Indemnification Obligations
We enter into agreements on a regular basis with customers and suppliers that include limited intellectual property indemnification obligations that are customary in the industry. These obligations generally require us to compensate the other party for certain damages and costs incurred as a result of third-party intellectual property claims arising from these transactions. The nature of these intellectual property indemnification obligations prevents us from making a reasonable estimate of the maximum potential amount we could be required to pay to our customers and suppliers. Historically, we have not made any significant indemnification payments under such agreements and no amount has been accrued in the Consolidated Financial Statements with respect to these obligations.
Off-balance Sheet Lease Obligations
We offer our customers lease financing and other services under our managed services offering. We fund this offering, which we have branded as the TotalSolution® program, in part through the sale to financial institutions of rental payment streams under the leases. Such financial institutions have the option to require us to repurchase such income streams, subject to limitations, in the event of defaults by lease customers and, accordingly, we maintain reserves based on loss experience and past due accounts. In addition, such financial institutions have the option to require us to repurchase such income streams upon any uncured breach by us under the terms of the underlying sale agreements. At December 31, 2017, sold payments remaining unbilled net of lease recourse reserves, which represents the total balance of leases that is not included in our balance sheet, were $31.4 million (December 31, 2016 — $38.3 million).
Critical Accounting Policies
The preparation of our Consolidated Financial Statements and related disclosures in conformity with GAAP requires us to make estimates and assumptions about future events that can have a material impact on the amounts reported in our Consolidated Financial Statements and accompanying notes. The determination of estimates requires the use of assumptions and the exercise of judgment and as such actual results could differ from those estimated. Our significant accounting policies are described in note 2 to our Consolidated Financial Statements. The following critical accounting policies are those that we believe require a high level of subjectivity and judgment and have a material impact on our financial condition and operating performance:
Revenue Recognition
Our sales arrangements in all of our segments often involve multiple elements, including hardware, software, installation and other professional services and post-contract technical support. Unbundling the multiple-element arrangements using the relative selling price hierarchy requires a significant amount of judgment. In particular, to determine the relative selling price of each element in a multiple-element arrangement, we first determine whether Vendor Specific Objective Evidence (“VSOE”) of selling price exists for each element. Where VSOE of selling price does not exist for an element, we then look to third-party evidence of selling price. However, third-party evidence is not generally available as our product offerings differ from those of our competitors and competitor pricing is often not available. In such cases where VSOE and third-party evidence cannot establish a selling price, we estimate the selling price for an element by determining the price at which we would transact if the products or services were to be sold on a standalone basis. In establishing the estimated selling price, management judgment is involved and we consider a number of factors including, but not limited to, geographies, customer segments and pricing practices.
Sales-Type Leases
In a sales-type lease transaction, hardware revenues are recognized at the present value of the payments allocated to the equipment lease element at the time of system sale. The costs of systems installed under these sales-type leases are recorded as costs of sales. The net rental streams are sold to financial institutions on a regular basis with the income streams discounted by prevailing like-term rates at the time of sale. Gains or losses resulting from the resale of net rental payments from such leases are recorded as net sales. We establish and maintain reserves against potential recourse following the sale of sales-type leases based upon historical loss
51
Table of Contents
experience, past due accounts and specific account analysis. The allowance for uncollectible minimum lease payments and recourse liability at the end of the year represents reserves against the entire lease portfolio. Management reviews the adequacy of the allowance on a regular basis and adjusts the allowance as required. These reserves are either netted in the accounts receivable, netted in the current and long-term components of “Net investments in sales-type leases” on the balance sheet, or, for off-balance sheet leases, recorded as a lease recourse liability and included in long term liabilities on our balance sheet.
Our total reserve for losses related to the entire lease portfolio, including amounts classified as accounts receivable on our balance sheet, was 4.9% of the ending aggregate lease portfolio as of December 31, 2017 compared to 4.7% at December 31, 2016. The reserve is based on a review of past write-off experience and a review of the accounts receivable aging as of the end of the period. We believe our reserves are adequate to cover future potential write-offs. Should, however, the financial condition of our customers deteriorate in the future, additional reserves in amounts that could be material to the financial statements could be required.
Allowance for Doubtful Accounts
Our allowance for doubtful accounts is based on our assessment of the collectability of customer accounts. A considerable amount of judgment is required in order to make this assessment, including a detailed analysis of the aging of our accounts receivable and the current credit worthiness of our customers and an analysis of historical bad debts and other adjustments. If there is a deterioration of a major customer’s credit worthiness or actual defaults are higher than our historical experience, our estimate of the recoverability of amounts due could be adversely affected. We review in detail our allowance for doubtful accounts on a quarterly basis and adjust the allowance amount estimate to reflect actual portfolio performance and change in future portfolio performance expectations. As of December 31, 2017 and 2016, the provision represented 6.9% and 6.0% of gross receivables, respectively.
Goodwill
We assess goodwill for impairment on an annual basis, or more frequently if circumstances warrant. An impairment charge is recorded if the implied fair value of goodwill of a reporting unit is less than the carrying value of goodwill for that unit. At December 31, 2017, our reporting units were our reported operating segments: Enterprise and Cloud.
Our methodology for estimating the fair value of the Enterprise and Cloud reporting units primarily considers estimated future revenues and cash flows for those reporting units along with many other assumptions, as quoted stock market prices are not available for these individual reporting units. Our valuation approach includes a detailed valuation analysis of both the Company as a whole and the reporting units.
In performing the annual goodwill impairment test we considered three generally accepted approaches for valuing a business: the income, market and cost approaches. Based on the nature of our business and the Enterprise and Cloud reporting units’ current and expected financial performance, we determined that the market approach was the most appropriate method for estimating the fair value of these reporting units under the first step of the analysis. For the market approach, we analyzed the valuation indicators that our market capitalization implies, including enterprise value to Adjusted EBITDA and enterprise value to revenue. Consideration of these factors inherently involves a significant amount of judgment, and significant changes in the underlying assumptions used may result in fluctuations in the value of goodwill that is supported.
We have historically performed our annual goodwill impairment test the first day of our fiscal fourth quarter. The result of our annual impairment tests, performed on October 1, 2017, 2016 and 2015, resulted in no impairment charge for our Enterprise and Cloud segments. The fair value of each of these reporting units exceeded its carrying value by a significant margin.
Erosion in capital markets, material reductions in our expected cash flow forecasts, significant reductions in our market capitalization or a significant decline in economic conditions, in addition to changes to the underlying assumptions used in our valuation approach described above, could all lead to future impairment in goodwill.
On December 18, 2016, Mitel entered into a definitive agreement to divest its Mobile business unit and, on February 28, 2017, the sale was completed, as discussed in “Significant Events and Recent Developments — 2017” under the “Overview” section above. Based on the definitive agreement, the fair value of the Mobile business unit, which at the time was a separate reporting unit and operating segment, was determined to be approximately $375.0 million, consisting of cash proceeds of $350.0 million, fair value of the promissory note and units acquired of $10.0 million and working capital and other adjustments of approximately $15.0 million.
As a result of the fair value of consideration to be received being lower than the carrying value of the business unit, the company completed the second step of its goodwill impairment test for the reporting unit. The second step consists of allocating the fair value of the reporting unit to the assets and liabilities of the reporting unit as if it had been acquired in a business combination and the purchase price was equivalent to the fair value of the reporting unit. The excess of the fair value of the reporting unit over the amounts assigned to its assets and liabilities is referred to as the implied fair value of goodwill. This implied fair value of goodwill was less than the carrying value of goodwill and, as a result, a goodwill impairment charge of $212.8 million was recorded in the fourth quarter of 2016 to reduce the carrying value of goodwill to the implied fair value.
52
Table of Contents
The operations of the Mobile business unit, including the impairment of goodwill, are classified as discontinued operations on the consolidated statements of operations.
Special Charges and Restructuring Costs
Special charges and restructuring costs consist of costs related to restructuring and integration activities as well as acquisition-related costs. Restructuring and integration costs generally relate to workforce reductions and facility reductions incurred to eliminate duplication of activities as a result of acquisitions or to improve operational efficiency. Costs related to workforce reductions are recorded when the company has committed to a plan of termination and notified the employees of the terms of the plan. Costs related to facility reductions primarily consist of lease termination obligations for vacant facilities, which generally include the remaining payments on an operating lease. Lease termination obligations are reduced for probable future sublease income. Because we are required to project sublease income for many years into the future, management used considerable judgment in determining certain estimates relating to the timing, availability and amount of sublease income that we expect to receive. In addition, restructuring and integration costs include professional services and consulting services incurred to complete the integration acquisitions, which are expensed as incurred. Acquisition-related costs consist of direct incremental costs incurred related to diligence activities and closing costs, and are expensed as incurred.
Income Taxes
We have significant net deferred tax assets resulting from operating loss carryforwards, tax credit carryforwards and deductible temporary differences that may reduce taxable income in future periods. Valuation allowances have been established for deferred tax assets based on a “more likely than not” threshold. We assess the likelihood that our deferred tax assets will be recovered from our ability to generate sufficient future taxable income, and to the extent that recovery is not believed to be more likely than not, a valuation allowance is recorded. Future changes in estimates of taxable income could result in a significant change to the valuation allowance.
In the year ended December 31, 2017, we updated our assessment of the realizability of our deferred tax assets. At December 31, 2017, as a result of uncertainty regarding the future utilization of certain deferred tax assets, there continues to be a valuation allowance of $97.1 million (December 31, 2016 — $96.3 million) against deferred tax assets primarily in the U.K. and U.S.
On December 22, 2017, the US Tax Cuts and Jobs Act of 2017 (“the Act”) was signed into legislation. The Act includes a broad range of legislative changes including a reduction of the U.S. federal corporate income tax rate from 35% to 21% effective January 1, 2018, limitations on the deductibility of interest, treatment of deferred foreign income upon transition for deemed repatriation, and 100% expensing of qualified property.
As a result of the Act being enacted during 2017, the Company is required to revalue its United States deferred income tax assets and liabilities based on the new 21% tax rate. The Company has recognized a $2.9 million income tax recovery in 2017 as a result of the revaluation of its U.S. deferred income tax assets and its deferred income tax liabilities.
The Company has provisionally revalued all of its U.S. deferred tax assets and liabilities, as described in note 23 to the Consolidated Financial Statements. However, the Company is still analyzing certain aspects of the Act, which could potentially affect the measurement of these balances or potentially give rise to new deferred tax amounts. Adjustments, if any, will be recorded by the Company during the measurement period in 2018.
Numerous taxing authorities in the jurisdictions in which we do business are increasing their scrutiny of various tax positions taken by businesses. We believe that we maintain adequate tax reserves to offset the potential tax liabilities that may arise upon audit in these jurisdictions. If such amounts ultimately prove to be unnecessary, the resulting reversal of such reserves would result in tax benefits being recorded in the period the reserves are no longer deemed necessary. If such amounts ultimately prove to be less than the ultimate assessment, a future charge to expense would result.
Pension Costs
We operate a defined benefit plans primarily in the U.K. (“U.K. Plan”), France (“France Plan”), Germany (“Germany Plan”) and Switzerland (“Switzerland Plan”).
53
Table of Contents
Our U.K. Plan is partially funded and was closed to new members in 2001 and was closed to new service in November 2012. Under the France Plan, retirees generally benefit from a lump sum payment upon retirement or departure. Under the Germany Plan, retirees generally benefit from the receipt of a perpetual annuity at retirement, based on their years of service and ending salary.
The Switzerland Plan is a partially funded multiple-employer pension plan in Switzerland. Under the Switzerland Plan, retirees generally benefit from the receipt of a perpetual annuity at retirement based on an accrued value at the date of retirement. The accrued value is related to the actual returns on contributions during the working period. As the plan is a multiple-employer plan, the Consolidated Financial Statements include our pro-rata share of assets, projected benefit obligation and pension benefit cost.
For all of our defined benefit plans, the pension liability and pension costs are developed from actuarial valuations. Inherent in these valuations are key assumptions including discount rates, inflation rates, expected return on plan assets and life expectancy of the members. In estimating the discount rates and expected returns, we considered market conditions at the valuation date of December 31, 2017. Material changes in our pension benefit costs may occur in the future as a result of changes to these assumptions or market conditions.
Stock-Based Compensation for Stock options
The fair value of the stock options granted is estimated on the grant date using the Black-Scholes option-pricing model for each award and is recognized over the employees’ requisite service period, which is generally the vesting period. We estimate the volatility of our common shares using the historical volatility of our common shares. The fair value of the restricted stock units granted is based on the stock price on the day of grant and is recognized over the employees’ requisite service period, which is generally the vesting period.
Based on these assumptions, stock-based compensation expense reduced our results of operations by $14.4 million for the year ended December 31, 2017 (year ended December 31, 2016 — $16.8 million). As of December 31, 2017, there was $32.0 million of unrecognized stock-based compensation expense (December 31, 2016 — $31.8 million). We expect these awards to be recognized over a weighted average period of 2.6 years (December 31, 2016 — 2.5 years).
Significant Recent Accounting Pronouncements
Revenue recognition
In May 2014, the FASB issued ASU 2014-09 “Revenue from Contracts with Customers” to provide a single comprehensive model for entities to use in accounting for revenue arising from contracts with customers. The ASU supersedes most current revenue recognition guidance, including industry-specific guidance. The FASB subsequently issued ASU 2015-14, ASU 2016-08 and ASU 2016-12, which clarified the guidance, provided scope improvements and amended the effective date of ASU 2014-09. As a result, ASU 2014-09 becomes effective for the Company in the first quarter of 2018, with early adoption permitted. The Company will adopt these ASUs in the first quarter of 2018.
The ASU permits two methods of adoption: retrospectively to each prior reporting period presented (full retrospective method), or retrospectively with the cumulative effect of initially applying the guidance recognized at the date of initial application (the cumulative catch-up transition method). The company anticipates adopting the standard using the full retrospective method to restate each prior reporting period presented. The Company is completing its assessment and has progressed in the implementation of the standard, including the review of significant contracts. The adoption of the standard could impact the timing of revenue recognition and the timing of the recognition of expenses directly related to revenue contracts.
Leases
In February 2016, the FASB issued ASU 2016-02 “Leases” to increase transparency and comparability among organizations by recognizing lease assets and lease liabilities on the balance sheet and disclosing key information about leasing arrangements. For operating leases, the ASU requires a lessee to recognize a right-of-use asset and a lease liability, initially measured at the present value of the lease payments, on its balance sheet. The ASU retains the current accounting for lessors and does not make significant changes to the recognition, measurement, and presentation of expenses and cash flows by a lessee. The ASU is effective for the Company for fiscal years beginning after December 15, 2018, including interim periods within those fiscal years. Early adoption is permitted. The Company continues to evaluate the effect of the adoption of this ASU but expects the adoption will result in an increase in the assets and liabilities on the consolidated balance sheets for operating leases and will likely have an insignificant impact on the consolidated statements of earnings.
54
Table of Contents
Credit losses on financial instruments
In June 2016, the FASB issued ASU 2016-13 “Financial Instruments – Credit Losses” to improve information on credit losses for financial assets and net investment in leases that are not accounted for at fair value through net income. The ASU replaces the current incurred loss impairment methodology with a methodology that reflects expected credit losses. The ASU is effective for the Company for fiscal years beginning after December 15, 2019, including interim periods within those fiscal years. Early adoption is permitted beginning in fiscal years beginning after December 15, 2018. The Company is currently evaluating the effect the adoption of this ASU will have on its consolidated financial statements.
| Item 7A. | Quantitative and Qualitative Disclosures About Market Risk |
Market risk is the risk of loss in our future earnings due to adverse changes in financial markets. We are exposed to market risk from changes in foreign exchange rates and interest rates. Inflation has not had a significant impact on our results of operations.
Foreign Currency Risk
We are exposed to currency rate fluctuations related primarily to our future net cash flows from operations in Euros, British pounds sterling, Canadian dollars, Swedish krona, Australian dollars, Indian Rupees and Swiss francs. We have used, and may use in the future, foreign currency forward contracts to mitigate the short-term impact of currency fluctuations on certain foreign currency receivables, payables and intercompany balances. These contracts are not entered into for speculative purposes and are not treated as hedges for accounting purposes. We also have used, and may use in the future, forward contracts to hedge certain probable future cash flows. These forward contracts are not entered into for speculative purposes and, when qualifying, are treated as hedges for accounting purposes.
At December 31, 2017, the Company had a net unrealized loss on fair value adjustments on the outstanding forward contracts used for cash flow hedging of $0.2 million. As of December 31, 2017, a 5.0% appreciation in the U.S. dollar would have resulted in an additional unrealized gain of $2.7 million on those foreign currency forward contracts and a 5.0% depreciation in the U.S. dollar would have resulted in an additional unrealized loss of $2.7 million on those foreign currency forward contracts.
Interest Rate Risk
In accordance with our corporate policy, cash equivalent and short-term investment balances are primarily comprised of high-grade commercial paper and money market instruments with original maturity dates of less than three months. Due to the short-term maturity of these investments, we are not subject to significant interest rate risk with respect to these investments.
We are exposed to interest rate risk on our 2017 Credit Facilities consisting of a revolving credit facility, a term loan and an incremental term loan. The $350.0 million revolving credit facility bears interest at a rate of LIBOR plus an applicable margin and matures in April 2022. If the entire revolving credit facility was drawn, each 1.0% adverse change in LIBOR would currently result in an additional $3.5 million of interest expense per year. The term loan, with $144.4 million outstanding at December 31, 2017, bears interest at a rate of LIBOR plus an applicable margin. The impact of each 1.0% adverse change in LIBOR on the term loan, would result in an additional $1.4 million in interest expense per year. The incremental term loan, with $299.2 million outstanding at December 31, 2017, bears interest at a rate of LIBOR plus an applicable margin and LIBOR has a floor of 1.00%. The impact of each 1.0% adverse change in LIBOR on the incremental term loan, would result in an additional $3.0 million in interest expense per year.
In addition, our defined benefit pension plans are exposed to changes in interest rate risk through their investment in bonds and the discount rate assumption. The interest rates on our obligations under capital leases are fixed and therefore not subject to interest rate risk.
Credit Risk
Our financial assets that are exposed to credit risk consist primarily of cash and cash equivalents, accounts receivable, other receivables, sales-type lease receivables as well as assets held by our defined benefit pension plans. In addition, we are exposed to credit risk through our recourse obligations on sold sales-type leases. Cash equivalents are invested in government and commercial paper with investment grade credit rating. We are exposed to normal credit risk from customers. We have a large number of diverse customers to minimize concentrations of credit risk and no customer represented greater than 10% of our accounts receivable or revenues.
55
Table of Contents
| Item 8. | Financial Statements and Supplementary Data |
Management is responsible for preparation of the Consolidated Financial Statements and other related financial information included in this Report. The Consolidated Financial Statements have been prepared in conformity with accounting principles generally accepted in the United States, incorporating management’s reasonable estimates and judgments, where applicable.
56
Table of Contents
INDEX TO CONSOLIDATED FINANCIAL STATEMENTS
| Page | ||||
| 58 | ||||
| 61 | ||||
| 62 | ||||
| 63 | ||||
| 64 | ||||
| 65 | ||||
| 66 | ||||
| 103 | ||||
57
Table of Contents
Report of Independent Registered Public Accounting Firm
To the Shareholders and the Board of Directors of Mitel Networks Corporation
Opinion on the Financial Statements
We have audited the accompanying consolidated balance sheets of Mitel Networks Corporation and subsidiaries (the “Company”) as of December 31, 2017 and 2016, the related consolidated statements of operations, comprehensive income (loss), shareholder’s equity, and cash flows, for each of the three years in the period ended December 31, 2017, and the related notes and the schedule listed in the Index at Item 15 (collectively referred to as the “financial statements”). In our opinion, the financial statements present fairly, in all material respects, the financial position of the Company as of December 31, 2017 and 2016, and the results of its operations and its cash flows for each of the three years in the period ended December 31, 2017, in conformity with accounting principles generally accepted in the United States of America.
We have also audited, in accordance with the standards of the Public Company Accounting Oversight Board (United States) (PCAOB), the Company’s internal control over financial reporting as of December 31, 2017, based on criteria established in Internal Control — Integrated Framework (2013) issued by the Committee of Sponsoring Organizations of the Treadway Commission and our report dated February 27, 2018 expressed an unqualified opinion on the Company’s internal control over financial reporting.
Basis for Opinion
These financial statements are the responsibility of the Company’s management. Our responsibility is to express an opinion on the Company’s financial statements based on our audits. We are a public accounting firm registered with the PCAOB and are required to be independent with respect to the Company in accordance with the U.S. federal securities laws and the applicable rules and regulations of the Securities and Exchange Commission and the PCAOB.
We conducted our audits in accordance with the standards of the PCAOB. Those standards require that we plan and perform the audit to obtain reasonable assurance about whether the financial statements are free of material misstatement, whether due to error or fraud. Our audits included performing procedures to assess the risks of material misstatement of the financial statements, whether due to error or fraud, and performing procedures that respond to those risks. Such procedures included examining, on a test basis, evidence regarding the amounts and disclosures in the financial statements. Our audits also included evaluating the accounting principles used and significant estimates made by management, as well as evaluating the overall presentation of the financial statements. We believe that our audits provide a reasonable basis for our opinion.
/s/ Deloitte LLP
Chartered Professional Accountants
Licensed Public Accountants
February 27, 2018
We have served as the Company’s auditor since 2002.
58
Table of Contents
Report of Independent Registered Public Accounting Firm
To the Shareholders and the Board of Directors of Mitel Networks Corporation
Opinion on Internal Control over Financial Reporting
We have audited the internal control over financial reporting of Mitel Networks Corporation and subsidiaries (the “Company”) as of December 31, 2017, based on criteria established in Internal Control—Integrated Framework (2013) issued by the Committee of Sponsoring Organizations of the Treadway Commission (COSO). In our opinion, the Company maintained, in all material respects, effective internal control over financial reporting as of December 31, 2017, based on criteria established in Internal Control — Integrated Framework (2013) issued by COSO.
We have also audited, in accordance with the standards of the Public Company Accounting Oversight Board (United States) (PCAOB), the consolidated financial statements as of and for the year ended December 31, 2017, of the Company and our report dated February 27, 2018, expressed an unqualified opinion on those financial statements.
As described in Management’s Annual Report on Internal Control over Financial Reporting, management excluded from its assessment the internal control over financial reporting at ShoreTel, Inc. (“ShoreTel”), which was acquired on September 25, 2017 and whose financial statements include assets of $81.1 million, liabilities of $121.5 million, revenues of $93.6 million, and net loss of $14.9 million as of and for the year ended December 31, 2017. Accordingly, our audit did not include the internal control over financial reporting at ShoreTel.
Basis for Opinion
The Company’s management is responsible for maintaining effective internal control over financial reporting and for its assessment of the effectiveness of internal control over financial reporting, included in the accompanying Management’s Annual Report on Internal Control over Financial Reporting. Our responsibility is to express an opinion on the Company’s internal control over financial reporting based on our audit. We are a public accounting firm registered with the PCAOB and are required to be independent with respect to the Company in accordance with the U.S. federal securities laws and the applicable rules and regulations of the Securities and Exchange Commission and the PCAOB.
We conducted our audit in accordance with the standards of the PCAOB. Those standards require that we plan and perform the audit to obtain reasonable assurance about whether effective internal control over financial reporting was maintained in all material respects. Our audit included obtaining an understanding of internal control over financial reporting, assessing the risk that a material weakness exists, testing and evaluating the design and operating effectiveness of internal control based on the assessed risk, and performing such other procedures as we considered necessary in the circumstances. We believe that our audit provides a reasonable basis for our opinion.
Definition and Limitations of Internal Control over Financial Reporting
A company’s internal control over financial reporting is a process designed to provide reasonable assurance regarding the reliability of financial reporting and the preparation of financial statements for external purposes in accordance with accounting principles generally accepted in the United States of America. A company’s internal control over financial reporting includes those policies and procedures that (1) pertain to the maintenance of records that, in reasonable detail, accurately and fairly reflect the transactions and dispositions of the assets of the company; (2) provide reasonable assurance that transactions are recorded as necessary to permit preparation of financial statements in accordance with accounting principles generally accepted in the United States of America , and that receipts and expenditures of the company are being made only in accordance with authorizations of management and directors of the company; and (3) provide reasonable assurance regarding prevention or timely detection of unauthorized acquisition, use, or disposition of the company’s assets that could have a material effect on the financial statements.
Because of its inherent limitations, internal control over financial reporting may not prevent or detect misstatements. Also, projections of any evaluation of effectiveness to future periods are subject to the risk that controls may become inadequate because of changes in conditions, or that the degree of compliance with the policies or procedures may deteriorate.
59
Table of Contents
/s/ Deloitte LLP
Chartered Professional Accountants
Licensed Public Accountants
February 27, 2018
60
Table of Contents
MITEL NETWORKS CORPORATION
(incorporated under the laws of Canada)
(in U.S. dollars, millions)
| December 31, 2017 |
December 31, 2016 |
|||||||
| ASSETS |
||||||||
| Current assets: |
||||||||
| Cash and cash equivalents |
$ | 43.3 | $ | 97.3 | ||||
| Accounts receivable (net of allowance for doubtful accounts of $17.9 and $11.8, respectively) |
241.0 | 186.3 | ||||||
| Sales-type lease receivables (net) (note 5) |
4.0 | 5.8 | ||||||
| Inventories (net) (note 6) |
84.2 | 74.9 | ||||||
| Other current assets (note 7) |
78.7 | 57.7 | ||||||
| Assets of component held for sale, current (note 4) |
— | 121.3 | ||||||
|
|
|
|
|
|||||
| 451.2 | 543.3 | |||||||
| Non-current portion of sales-type lease receivables (net) (note 5) |
5.7 | 6.7 | ||||||
| Deferred tax asset (note 23) |
127.9 | 185.2 | ||||||
| Property and equipment (net) (note 8) |
53.2 | 39.1 | ||||||
| Identifiable intangible assets (net) (note 9) |
420.8 | 100.4 | ||||||
| Goodwill (note 10) |
535.9 | 346.3 | ||||||
| Other non-current assets |
35.8 | 7.9 | ||||||
| Assets of component held for sale, non-current (note 4) |
— | 332.5 | ||||||
|
|
|
|
|
|||||
| $ | 1,630.5 | $ | 1,561.4 | |||||
|
|
|
|
|
|||||
| LIABILITIES AND SHAREHOLDERS’ EQUITY |
||||||||
| Current liabilities: |
||||||||
| Accounts payable and accrued liabilities (note 11) |
$ | 260.8 | $ | 200.6 | ||||
| Current portion of deferred revenue |
160.8 | 88.0 | ||||||
| Current portion of long-term debt (note 13) |
17.1 | 38.9 | ||||||
| Liabilities of component held for sale, current (note 4) |
— | 58.3 | ||||||
|
|
|
|
|
|||||
| 438.7 | 385.8 | |||||||
| Long-term debt (note 13) |
612.0 | 547.1 | ||||||
| Long-term portion of deferred revenue |
64.1 | 39.4 | ||||||
| Deferred tax liability (note 23) |
13.9 | 10.0 | ||||||
| Pension liability (note 24) |
120.1 | 145.5 | ||||||
| Other non-current liabilities |
36.0 | 25.9 | ||||||
| Liabilities of component held for sale, non-current (note 4) |
— | 24.8 | ||||||
|
|
|
|
|
|||||
| 1,284.8 | 1,178.5 | |||||||
|
|
|
|
|
|||||
| Commitments, guarantees and contingencies (notes 14 and 15) |
||||||||
| Shareholders’ equity: |
||||||||
| Common shares, without par value and additional paid-in capital — unlimited shares authorized; issued and outstanding: 120.1 and 122.0, respectively (note 16) |
1,466.0 | 1,482.2 | ||||||
| Warrants (note 18) |
39.1 | 39.1 | ||||||
| Accumulated deficit |
(990.6 | ) | (946.7 | ) | ||||
| Accumulated other comprehensive loss |
(168.8 | ) | (191.7 | ) | ||||
|
|
|
|
|
|||||
| 345.7 | 382.9 | |||||||
|
|
|
|
|
|||||
| $ | 1,630.5 | $ | 1,561.4 | |||||
|
|
|
|
|
|||||
(The accompanying notes are an integral part of these Consolidated Financial Statements)
61
Table of Contents
MITEL NETWORKS CORPORATION
(incorporated under the laws of Canada)
CONSOLIDATED STATEMENTS OF OPERATIONS
(in U.S. dollars, millions, except per share amounts)
| Year Ended December 31, 2017 |
Year Ended December 31, 2016 |
Year Ended December 31, 2015 |
||||||||||
| Revenues |
$ | 1,059.1 | $ | 987.6 | $ | 1,025.8 | ||||||
| Cost of revenues |
480.2 | 455.6 | 480.6 | |||||||||
|
|
|
|
|
|
|
|||||||
| Gross margin |
578.9 | 532.0 | 545.2 | |||||||||
|
|
|
|
|
|
|
|||||||
| Expenses (income): |
||||||||||||
| Selling, general and administrative |
367.9 | 339.8 | 331.0 | |||||||||
| Research and development |
104.5 | 96.5 | 102.2 | |||||||||
| Special charges and restructuring costs (note 20) |
83.4 | 70.8 | 47.5 | |||||||||
| Amortization of acquisition-related intangible assets |
54.9 | 35.1 | 48.2 | |||||||||
| Income from termination fee received (note 28) |
— | (60.0 | ) | — | ||||||||
|
|
|
|
|
|
|
|||||||
| 610.7 | 482.2 | 528.9 | ||||||||||
|
|
|
|
|
|
|
|||||||
| Operating income (loss) |
(31.8 | ) | 49.8 | 16.3 | ||||||||
| Interest expense |
(18.7 | ) | (16.8 | ) | (17.8 | ) | ||||||
| Debt retirement and other debt costs (note 13) |
(18.0 | ) | (2.1 | ) | (9.6 | ) | ||||||
| Other income (expense) (note 27) |
(0.1 | ) | 2.8 | 20.7 | ||||||||
|
|
|
|
|
|
|
|||||||
| Income (loss) from continuing operations, before income taxes |
(68.6 | ) | 33.7 | 9.6 | ||||||||
| Current income tax recovery (expense) (note 23) |
(6.2 | ) | (15.7 | ) | (15.6 | ) | ||||||
| Deferred income tax recovery (expense) (note 23) |
26.5 | 17.0 | 12.5 | |||||||||
|
|
|
|
|
|
|
|||||||
| Net income (loss) from continuing operations |
(48.3 | ) | 35.0 | 6.5 | ||||||||
| Net loss from discontinued operations, net of income tax (note 4) |
(1.4 | ) | (252.3 | ) | (27.2 | ) | ||||||
|
|
|
|
|
|
|
|||||||
| Net loss |
$ | (49.7 | ) | $ | (217.3 | ) | $ | (20.7 | ) | |||
|
|
|
|
|
|
|
|||||||
| Net income (loss) per common share — Basic: |
||||||||||||
| Net income (loss) per share from continuing operations |
$ | (0.40 | ) | $ | 0.29 | $ | 0.06 | |||||
| Net loss per share from discontinued operations |
$ | (0.01 | ) | $ | (2.08 | ) | $ | (0.24 | ) | |||
| Net loss per share |
$ | (0.41 | ) | $ | (1.79 | ) | $ | (0.18 | ) | |||
| Net income (loss) per common share — Diluted: |
||||||||||||
| Net income (loss) per share from continuing operations |
$ | (0.40 | ) | $ | 0.28 | $ | 0.06 | |||||
| Net loss per share from discontinued operations |
$ | (0.01 | ) | $ | (2.01 | ) | $ | (0.24 | ) | |||
| Net loss per share |
$ | (0.41 | ) | $ | (1.73 | ) | $ | (0.18 | ) | |||
| Weighted-average number of common shares outstanding (note 19): |
||||||||||||
| Basic |
120.7 | 121.5 | 113.7 | |||||||||
| Diluted |
120.7 | 125.5 | 118.0 | |||||||||
(The accompanying notes are an integral part of these Consolidated Financial Statements)
62
Table of Contents
MITEL NETWORKS CORPORATION
(incorporated under the laws of Canada)
CONSOLIDATED STATEMENTS OF COMPREHENSIVE INCOME (LOSS)
(in U.S. dollars, millions)
| Year Ended December 31, 2017 |
Year Ended December 31, 2016 |
Year Ended December 31, 2015 |
||||||||||
| Net loss |
$ | (49.7 | ) | $ | (217.3 | ) | $ | (20.7 | ) | |||
| Other comprehensive income (loss): |
||||||||||||
| Foreign currency translation adjustments |
3.4 | (1.5 | ) | (29.1 | ) | |||||||
| Pension liability adjustments, net of tax of $3.1, $4.7 and $4.4, respectively (note 24) |
19.5 | (22.2 | ) | 8.1 | ||||||||
|
|
|
|
|
|
|
|||||||
| 22.9 | (23.7 | ) | (21.0 | ) | ||||||||
|
|
|
|
|
|
|
|||||||
| Comprehensive loss |
$ | (26.8 | ) | $ | (241.0 | ) | $ | (41.7 | ) | |||
|
|
|
|
|
|
|
|||||||
(The accompanying notes are an integral part of these Consolidated Financial Statements)
63
Table of Contents
MITEL NETWORKS CORPORATION
(incorporated under the laws of Canada)
CONSOLIDATED STATEMENTS OF SHAREHOLDERS’ EQUITY
(in U.S. dollars, millions)
| Number of Common Shares |
Common Shares and Additional Paid-in Capital |
Warrants | Accumulated Deficit |
Accumulated Other Comprehensive Income (Loss) |
Total Shareholders’ Equity |
|||||||||||||||||||
| Balance at December 31, 2014 |
100.1 | $ | 1,254.3 | $ | 39.1 | $ | (708.7 | ) | $ | (147.0 | ) | $ | 437.7 | |||||||||||
|
|
|
|
|
|
|
|
|
|
|
|
|
|||||||||||||
| Comprehensive loss |
— | — | — | (20.7 | ) | (21.0 | ) | (41.7 | ) | |||||||||||||||
| Exercise of stock options and vesting of restricted stock units |
1.0 | 4.1 | — | — | — | 4.1 | ||||||||||||||||||
| Stock-based compensation |
— | 12.8 | — | — | — | 12.8 | ||||||||||||||||||
| Issuance of shares (note 3) |
19.7 | 189.2 | — | — | — | 189.2 | ||||||||||||||||||
| Stock options issued as consideration for the acquisition of Mavenir (note 3) |
— | 2.8 | — | — | — | 2.8 | ||||||||||||||||||
|
|
|
|
|
|
|
|
|
|
|
|
|
|||||||||||||
| Balance at December 31, 2015 |
120.8 | $ | 1,463.2 | $ | 39.1 | $ | (729.4 | ) | $ | (168.0 | ) | $ | 604.9 | |||||||||||
| Comprehensive loss |
— | — | — | (217.3 | ) | (23.7 | ) | (241.0 | ) | |||||||||||||||
| Exercise of stock options and vesting of restricted stock units |
1.2 | 2.2 | — | — | — | 2.2 | ||||||||||||||||||
| Stock-based compensation |
— | 16.8 | — | — | — | 16.8 | ||||||||||||||||||
|
|
|
|
|
|
|
|
|
|
|
|
|
|||||||||||||
| Balance at December 31, 2016 |
122.0 | $ | 1,482.2 | $ | 39.1 | $ | (946.7 | ) | $ | (191.7 | ) | $ | 382.9 | |||||||||||
|
|
|
|
|
|
|
|
|
|
|
|
|
|||||||||||||
| Adoption of new accounting standard |
— | (5.8 | ) | — | 5.8 | — | — | |||||||||||||||||
| Comprehensive income (loss) |
— | — | — | (49.7 | ) | 22.9 | (26.8 | ) | ||||||||||||||||
| Repurchase of shares |
(4.9 | ) | (35.7 | ) | — | — | — | (35.7 | ) | |||||||||||||||
| Exercise of stock options and vesting of restricted stock units |
3.0 | 10.9 | — | — | — | 10.9 | ||||||||||||||||||
| Stock-based compensation |
— | 14.4 | — | — | — | 14.4 | ||||||||||||||||||
|
|
|
|
|
|
|
|
|
|
|
|
|
|||||||||||||
| Balance at December 31, 2017 |
120.1 | $ | 1,466.0 | $ | 39.1 | $ | (990.6 | ) | $ | (168.8 | ) | $ | 345.7 | |||||||||||
|
|
|
|
|
|
|
|
|
|
|
|
|
|||||||||||||
(The accompanying notes are an integral part of these Consolidated Financial Statements)
64
Table of Contents
MITEL NETWORKS CORPORATION
(incorporated under the laws of Canada)
CONSOLIDATED STATEMENTS OF CASH FLOWS
(in U.S. dollars, millions)
| Year Ended December 31, 2017 |
Year Ended December 31, 2016 |
Year Ended December 31, 2015 |
||||||||||
| CASH PROVIDED BY (USED IN) |
||||||||||||
| Operating activities: |
||||||||||||
| Net loss |
$ | (49.7 | ) | $ | (217.3 | ) | $ | (20.7 | ) | |||
| Adjustments to reconcile net loss to net cash provided by operating activities: |
||||||||||||
| Amortization and depreciation |
76.0 | 100.7 | 99.1 | |||||||||
| Stock-based compensation |
14.4 | 16.8 | 12.8 | |||||||||
| Deferred income tax recovery |
(33.0 | ) | (27.3 | ) | (24.0 | ) | ||||||
| Goodwill impairment (note 4) |
— | 212.8 | — | |||||||||
| Non-cash portion of debt retirement and other debt costs |
18.0 | 2.1 | 9.6 | |||||||||
| Accretion of interest |
(1.0 | ) | — | — | ||||||||
| Gain on divestiture of the Mobile business unit (note 4) |
(7.9 | ) | — | — | ||||||||
| Non-cash movements in provisions |
10.2 | 8.2 | 2.7 | |||||||||
| Change in non-cash operating assets and liabilities, net (note 21) |
9.7 | 3.7 | (24.9 | ) | ||||||||
|
|
|
|
|
|
|
|||||||
| Net cash provided by operating activities |
36.7 | 99.7 | 54.6 | |||||||||
|
|
|
|
|
|
|
|||||||
| Investing activities: |
||||||||||||
| Additions to property, equipment and intangible assets |
(19.2 | ) | (17.3 | ) | (16.2 | ) | ||||||
| Acquisitions, net of cash acquired (note 3) |
(411.0 | ) | — | (346.7 | ) | |||||||
|
Proceeds from sale of discontinued operations, net of cash
divested |
336.9 | — | — | |||||||||
|
|
|
|
|
|
|
|||||||
| Net cash used in investing activities |
(93.3 | ) | (17.3 | ) | (362.9 | ) | ||||||
|
|
|
|
|
|
|
|||||||
| Financing activities: |
||||||||||||
| Proceeds from issuance of long-term debt (note 13) |
448.5 | — | 653.4 | |||||||||
| Repayment of long-term debt (note 13) |
(598.0 | ) | (65.1 | ) | (307.4 | ) | ||||||
| Repayment of acquired long-term debt (note 3) |
— | — | (30.4 | ) | ||||||||
| Borrowings under the revolving credit facility |
505.5 | 83.0 | 21.0 | |||||||||
| Repayments of the revolving credit facility |
(315.5 | ) | (83.0 | ) | (21.0 | ) | ||||||
| Payment of debt issue costs and other debt costs (note 13) |
(16.1 | ) | — | (19.6 | ) | |||||||
| Repayment of capital lease liabilities and other long-term debt |
(6.1 | ) | (6.1 | ) | (7.3 | ) | ||||||
| Proceeds from issuance of common shares from option exercises |
10.9 | 2.2 | 4.1 | |||||||||
| Repurchase of common shares |
(35.7 | ) | — | — | ||||||||
|
|
|
|
|
|
|
|||||||
| Net cash provided by (used in) financing activities |
(6.5 | ) | (69.0 | ) | 292.8 | |||||||
|
|
|
|
|
|
|
|||||||
| Effect of exchange rate changes on cash and cash equivalents |
5.6 | (4.2 | ) | (4.2 | ) | |||||||
|
|
|
|
|
|
|
|||||||
| Increase (decrease) in cash and cash equivalents |
(57.5 | ) | 9.2 | (19.7 | ) | |||||||
| Total cash and cash equivalents, beginning of year |
100.8 | 91.6 | 111.3 | |||||||||
|
|
|
|
|
|
|
|||||||
| Total cash and cash equivalents, end of year |
43.3 | 100.8 | 91.6 | |||||||||
| Less: cash and cash equivalents classified as assets of component held for sale, end of year |
— | 3.5 | 9.4 | |||||||||
|
|
|
|
|
|
|
|||||||
| Cash and cash equivalents of continuing operations, end of year |
$ | 43.3 | $ | 97.3 | $ | 82.2 | ||||||
|
|
|
|
|
|
|
|||||||
(Note 21 contains supplemental cash flow information)
(The accompanying notes are an integral part of these Consolidated Financial Statements)
65
Table of Contents
MITEL NETWORKS CORPORATION
(incorporated under the laws of Canada)
NOTES TO THE CONSOLIDATED FINANCIAL STATEMENTS
(in U.S. dollars, millions, except per share amounts)
1. BACKGROUND AND NATURE OF OPERATIONS
Mitel Networks Corporation (“Mitel” or the “Company”) is a global provider of enterprise and cloud collaboration software and services. Through direct and indirect channels as well as strategic technology partnerships, the Company serves customers in the United States (“U.S.”) and the rest of North and South America (collectively, the “Americas”), Europe, Middle East and Africa (collectively, “EMEA”) and Asia-Pacific regions.
2. ACCOUNTING POLICIES
a) Basis of Presentation
These Consolidated Financial Statements have been prepared by the Company in accordance with accounting principles generally accepted in the United States of America (“GAAP”) and the rules and regulations of the U.S. Securities and Exchange Commission (the “SEC”) for the preparation of financial statements.
b) Basis of Consolidation
The Consolidated Financial Statements include the accounts of the Company and of its subsidiary companies. Intercompany transactions and balances have been eliminated on consolidation.
c) Use of Estimates
The preparation of the Company’s Consolidated Financial Statements in conformity with GAAP requires management to make estimates and assumptions that affect the reported amounts of assets, liabilities, revenues and expenses during the reporting periods.
Estimates and assumptions are used for, but not limited to, the determination of the fair values of assets and liabilities acquired through acquisitions, the fair value of investments, allowance for doubtful accounts, inventory allowances, goodwill impairment assessments, estimated useful lives of property, equipment and intangible assets, accruals, lease recourse liability, warranty costs, sales returns, pension liability, contingencies, special charges and restructuring costs, income taxes, the valuation of stock options and estimated selling prices for certain elements in multiple-element arrangements. Estimates and assumptions are reviewed periodically and the effects of revisions are reflected in the Consolidated Financial Statements in the period that they are determined. Actual results and outcomes could differ from these estimates.
d) Foreign Currency Translation
The parent company’s functional currency is the U.S. dollar and the Consolidated Financial Statements of the Company are prepared with the U.S. dollar as the reporting currency. Assets and liabilities of foreign operations with a functional currency other than the U.S. dollar are translated from foreign currencies into U.S. dollars at the exchange rates in effect at the balance sheet date while revenue and expense items are translated at the average exchange rate for the period. The resulting unrealized gains and losses are included as part of the cumulative foreign currency translation adjustment that is reported as part of other comprehensive income.
Monetary assets and liabilities denominated in currencies foreign to the functional currency of each entity are translated into the functional currency using exchange rates in effect at the balance sheet date. All non-monetary assets and liabilities are translated at the exchange rates prevailing at the date the assets were acquired or the liabilities incurred. Revenue and expense items are translated at the average exchange rate for the period. Foreign exchange gains and losses resulting from the translation of these accounts are included in the determination of net income for the period. For the year ended December 31, 2017, the Company recorded a foreign exchange loss of $2.2 (years ended December 31, 2016 and 2015 — gain of $1.9 and $18.8, respectively), which is included in other income (expense) on the consolidated statement of operations. The foreign exchange gain for the year ended December 31, 2015 related primarily to intercompany balances and was offset by foreign currency translation adjustments recorded in other comprehensive loss, resulting in no significant net economic effect to the Company.
66
Table of Contents
e) Revenue Recognition
General
The Company generates revenues primarily from the sale of communications systems and related services (collectively, a “Solution”), through channel partners and directly to end-customers. A typical Solution consists of a combination of IP phones, switches, software applications and support, which may include installation and training. A Solution may be deployed on the customer’s premise (premise-based solution, sold through our Enterprise segment) or deployed in a cloud environment and billed on a monthly-basis (cloud-based solution, sold through our Cloud segment).
Enterprise segment revenue
The Enterprise segment generates revenues primarily from sales of multiple-element Solutions, typically as an upfront sale.
For multiple-element arrangements, the Company allocates the total arrangement consideration to each separable element of an arrangement based upon the relative selling price of each element and revenue is recognized upon delivery or completion of each element. The relative selling price is determined using Vendor Specific Objective Evidence (“VSOE”) of selling price, when available. Where VSOE of selling price cannot be established, the Company attempts to determine the selling price for the deliverables using third-party evidence. Generally, third-party evidence is not available as the Company’s product offerings differ from those of its competitors and competitor pricing is often not available. In such cases where VSOE and third-party evidence cannot establish a selling price, the Company estimates the selling price for an element by determining the price at which the Company would transact if the products or services were to be sold on a standalone basis. In establishing the estimated selling price, the Company considers a number of factors including, but not limited to, geographies, customer segments and pricing practices.
Product revenue is recognized when persuasive evidence of an arrangement exists, delivery has occurred, title and risk of loss have been transferred to the customer, the fee is fixed or determinable, and collection is reasonably assured. Service revenue is recognized when persuasive evidence of an arrangement exists, the service has been provided, the fee is fixed or determinable, and collection is reasonably assured.
The Company’s core enterprise software (“essential software”) is integrated with hardware and function together to deliver the essential functionality of the integrated system product. The Company also sells software applications (“non-essential software”), which provide increased features and functions but are not essential to the overall functionality of the integrated system products.
The elements of a typical multiple-element Solution are as follows:
Product Revenue — Hardware and Essential Software
The Company recognizes hardware and essential software revenue when the product is shipped or upon product acceptance where the agreement contains product acceptance terms that are more than perfunctory. Where hardware and essential software is an element in a multiple-element arrangement, relative selling price is established using an estimated selling price.
Non-Essential Software
The Company recognizes non-essential software revenue when delivery has occurred in accordance with the terms and conditions of the contract. Where non-essential software deliverables are an element in a multiple-element arrangement, relative selling price of all non-essential software as a group is established using an estimated selling price. The Company then recognizes revenue for the non-essential software deliverables using industry-specific software revenue recognition guidance. In particular, where VSOE of fair value is not available for post-contract support, the relative selling price of the non-essential software is deferred and recognized ratably over the contractual period of the post-contract support.
Installation and Training
The Company recognizes revenue related to installation and training upon delivery of the services. Where installation and training are elements in a multiple-element arrangement, relative selling price is established using an estimated selling price.
Post-Contract Support
Post-contract support consists primarily of maintenance revenue and software assurance revenue, which generate revenue under contracts that generally range from one to five years. For maintenance revenue, the Company provides various levels of support for installed systems for a fixed annual fee. For software assurance revenue, the Company provides software upgrades on a when and if available basis and software support for a fixed annual fee. In certain jurisdictions, maintenance and software assurance is bundled as post-contract support. Revenue from post-contract support is recognized ratably over the contractual period.
67
Table of Contents
Where post-contract support is an element in a multiple-element arrangement, relative selling price is established using VSOE of selling price based on volume and pricing of standalone sales within a narrow range. Where VSOE is not available for post-contract support sold with non-essential software, the relative selling price of the non-essential software is deferred and recognized ratably over the contractual period of the post-contract support. Where VSOE is not available for all other solutions, generally third-party evidence of selling price is also not available and the Company establishes an estimated selling price by determining the price at which the Company would transact if the service was to be sold on a standalone basis.
Return Rights
Sales to the Company’s channel partners generally provide for 30-day return rights, and include a restocking fee. In addition, certain agreements with distributors include stock rotation rights. A reserve for estimated product returns and stock rotation rights is recorded based on historical experience as a reduction of sales at the time product revenue is recognized.
Distribution agreements
Sales to value-added distributors generally include limited stock-rotation, price protection and return rights. The Company maintains a reserve for such rights based on its historical experience. Where a distributor’s return rights are not limited and are outside the Company’s control, the Company defers revenue recognition until such time as the product is sold to an end customer by the distributor.
Sales-type leases
A portion of the Company’s direct sales of Solutions in the U.S. is made through sales-type leases. The discounted present values of minimum rental payments, net of provisions for continuing administration and other expenses over the lease period, are allocated to each element of the sale and recorded as revenue consistent with the revenue recognition policies described above.
After the initial sale, the rental streams are often sold to funding sources with the income streams discounted by prevailing like-term rates at the time of sale. Gains or losses resulting from the sale of net rental payments from such leases are recorded as net revenues. The Company establishes and maintains reserves against potential recourse following the re-sales based upon historical loss experience, past due accounts and specific account analysis. The allowance for uncollectible minimum lease payments and recourse liability at the end of the period represents reserves against the entire lease portfolio. Management reviews the adequacy of the allowance on a regular basis and adjusts the allowance as required. These reserves are either netted in the accounts receivable, current and long-term components of sales-type lease receivables on the consolidated balance sheets, or included in the other non-current liabilities on the consolidated balance sheets for the estimated recourse liability for lease streams sold.
Cloud segment revenue
The Cloud segment generates recurring revenues from sales of multiple-element Solutions under a monthly recurring billing model. A portion of the monthly recurring billing in the U.S. will also often include billing for voice and data telecommunication services. Revenue is recognized monthly as the services are provided.
f) Cash and Cash Equivalents
Cash and cash equivalents are highly liquid investments that have terms to maturity of three months or less at the time of acquisition, and generally consist of cash on hand and investment-grade marketable securities. Cash equivalents are carried at amortized cost, which approximates their fair value. At December 31, 2017, the Company had cash of $42.3 (December 31, 2016 — $96.2) and cash equivalents of $1.0 (December 31, 2016 — $1.1). In addition, at December 31, 2016, cash and cash equivalents of $3.5 relating to our Mobile segment (note 4) were included in assets held for sale.
g) Restricted Cash
Restricted cash represents cash provided to support letters of credit outstanding and to support certain of the Company’s credit facilities. Restricted cash is presented within other current assets on the consolidated balance sheets.
68
Table of Contents
h) Allowance for Doubtful Accounts
The allowance for doubtful accounts represents the Company’s best estimate of probable losses that may result from the inability of its customers to make required payments. Additional provisions or allowances for doubtful accounts are recorded for sales-type leases, discussed in part (e) of this note under Enterprise segment revenue — Sales-type leases. Reserves are established and maintained against estimated losses based upon historical loss experience, past due accounts, and specific account analysis. The Company regularly reviews the level of allowances for doubtful accounts and adjusts the level of allowances as needed. Consideration is given to accounts past due as well as other risks in the current portion of the accounts.
i) Inventories
Inventories are valued at the lower of cost (calculated on a first-in, first-out basis, which is approximated by standard cost) and net realizable value. The Company provides inventory allowances based on estimated excess and obsolete inventories.
j) Property and Equipment
Property and equipment are initially recorded at cost. Depreciation is provided on a straight-line basis over the anticipated useful lives of the assets. Estimated lives range from two to ten years for equipment. Amortization of leasehold improvements is computed using the shorter of the remaining lease term or the useful life of the asset, generally five years.
The Company performs reviews for the impairment of property and equipment whenever events or changes in circumstances indicate that the carrying amount of an asset may not be recoverable. In assessing the impairment, the Company compares projected undiscounted net cash flows associated with the related asset or group of assets over their estimated remaining useful life against their carrying amounts. If the projected undiscounted net cash flows are not sufficient to recover the carrying value of the assets, the assets are written down to their estimated fair values based on expected discounted cash flows. Changes in the estimates and assumptions used in assessing projected cash flows could materially affect the results of management’s evaluation.
Assets leased on terms that transfer substantially all of the benefits and risks of ownership to the Company are accounted for as capital leases, as though the asset had been purchased outright and a liability incurred. All other leases are accounted for as operating leases.
k) Identifiable Intangible Assets and Goodwill
Intangible assets include patents, trademarks, customer relationships and acquired technology. Amortization is provided on a straight-line basis over the estimated useful lives of the assets. The Company periodically evaluates intangible assets for impairment whenever events or changes in circumstances indicate that the carrying amount of an asset may not be recoverable. Recoverability is assessed based on the carrying value of the asset and the undiscounted cash flows expected to result from the use and the eventual disposal of the asset. An impairment loss is recognized when the carrying amount is not recoverable.
Goodwill represents the excess of the purchase price over the estimated fair value of net tangible and intangible assets acquired in business combinations. Goodwill is not amortized, but is subject to annual impairment tests, or more frequently if circumstances indicate that it is more likely than not that the fair value of the reporting unit is below its carrying amount. The Company performs its annual goodwill impairment test on the first day of its fourth fiscal quarter, or October 1, of each year.
The Company performs a goodwill impairment test by comparing the fair value of each reporting unit against each reporting unit’s carrying amount, including goodwill. If the fair value exceeds the carrying amount, no impairment charge is recorded. If the fair value is less than the carrying amount, an impairment is recorded for the amount the carrying amount exceeds the fair value. Changes in the estimates and assumptions used in assessing the projected cash flows could materially affect the results of management’s evaluation.
l) Derivative Financial Instruments
The Company uses foreign currency forward contracts to manage the impact of currency fluctuations, primarily for fair value hedges on foreign currency receivables and payables and for cash flow hedges on probable future cash flows in foreign currencies. Derivative instruments that are not designated as accounting hedges or designated as fair value hedges are originally recorded at fair market value, with subsequent changes in fair value recorded in other income (expense) during the period of change. For derivative instruments that qualify for hedge accounting (generally cash flow hedges), gains or losses for the effective portion of the hedge are initially reported as a separate component of other comprehensive income (loss) and subsequently recorded in income when the hedged transaction occurs or when the hedge is no longer deemed effective.
69
Table of Contents
m) Income Taxes
Income taxes are accounted for using the asset and liability method. Under this approach, deferred tax assets and liabilities are determined based on differences between the carrying amounts and the tax basis of assets and liabilities, and are measured using enacted tax rates and laws. Deferred tax assets are recognized only to the extent that it is more likely than not that the future tax assets will be realized in the future.
The Company calculates certain tax liabilities based on the likely outcome of uncertain tax positions (“UTPs”) and records this amount as an expense or recovery during the year in which UTPs are identified. The Company also records interest and penalties associated with these UTPs. The Company classifies penalties and accrued interest related to income tax liabilities in income tax expense.
n) Research and Development
Research costs are charged to expense in the periods in which they are incurred. Software development costs are deferred and amortized when technological feasibility has been established, or otherwise are expensed as incurred. The Company has not deferred any software development costs during the years ended December 31, 2017, 2016 and 2015.
o) Defined Benefit Pension Plan
Pension expense under defined benefit pension plans are actuarially determined using the projected benefit method, and management’s best estimate assumptions. Pension plan assets are valued at fair value. The excess of any cumulative net actuarial gain (loss) over ten percent of the greater of the benefit obligation and the fair value of plan assets is amortized over the average remaining service life of its members, or in the case where the plan no longer grants service, over the life expectancy of its members. The under-funded status of the defined benefit pension plans is recognized as a liability on the consolidated balance sheets, with an offsetting adjustment made to accumulated other comprehensive income. The Company measures its plan assets and obligations at the year-end balance sheet date.
The discount rate assumption used reflects prevailing rates available on high-quality, fixed-income debt instruments. The assumption for long-term rate of return is based on the yield available on long-dated government and corporate bonds at the measurement date with an allowance for outperformance based on historical returns of each asset class.
p) Stock-Based Compensation
The Company has stock-based compensation plans for employees that consist of stock options, restricted share units (“RSUs”), and performance share units (“PSUs”) as described in note 16.
The Company grants stock options for a fixed number of shares with an exercise price at least equal to fair market value of the shares at the date of grant. Stock-based compensation expense for stock options is based on the fair value estimate made on the grant date using the Black-Scholes option-pricing model for each award and is recognized on a straight-line basis over the employee service period, which is the vesting period. The Company estimates the volatility of its stock for the Black-Scholes option-pricing model using historical volatility of the Company’s stock.
An RSU, once vested, entitles the holder to a Mitel common share issued out of treasury. RSUs vest one-quarter annually over 4 years. As RSUs are equity-settled, the grant-date fair value of RSUs is expensed on a straight-line basis over the vesting period of the award. The grant-date fair value is generally equal to the closing Mitel stock price on the day of grant.
PSUs are convertible into a variable number of Mitel common shares to the extent that a performance target is met at the end of the three-year term of the PSUs. The performance target for PSUs is a cumulative annual growth rate (“CAGR”) of Mitel stock traded on the NASDAQ stock exchange over the term of the PSUs, as described in note 16. As PSUs are equity-settled, the grant-date fair value is expensed on a straight-line basis over the term of the award.
Forfeitures for all awards are accounted for as they occur, through reversal of the previously recognized expense on the awards that were forfeited during the year.
q) Net Income per Common Share
Basic net income per common share is computed using the weighted-average number of common shares outstanding during the period. Diluted net income per common share is calculated using the treasury stock method when the impact is dilutive. To compute diluted net income per share, the weighted-average number of common shares outstanding is increased by the number of common shares that would be issued assuming the exercise of stock options and warrants and the issuance of outstanding RSUs and PSUs.
70
Table of Contents
r) Other Comprehensive Income (Loss)
Other comprehensive income (loss) includes unrealized gains and losses excluded from the consolidated statements of operations. These unrealized gains and losses consist of foreign currency translation adjustments, which are not adjusted for income taxes since they relate to indefinite investments in foreign subsidiaries, unrealized gains and losses on cash flow hedges, and changes in the unfunded status of defined benefit pension plans.
s) Advertising Costs
The cost of advertising is expensed as incurred, except for cooperative advertising obligations, which are expensed at the time the related sales are recognized and the advertising credits are earned. Cooperative advertising obligations are recorded as a reduction to revenue when the cooperative advertising obligation is estimated to be used for Mitel product or services and are recorded as selling, general and administrative expenses when the cooperative advertising obligation is estimated to be used for cooperative advertising of Mitel products and services. Advertising costs are recorded in selling, general and administrative expenses. For the year ended December 31, 2017, the Company incurred $10.0 in advertising costs (years ended December 31, 2016 and 2015 — $9.1 and $10.1, respectively), of which $5.6 related to cooperative advertising expenses (years ended December 31, 2016 and 2015 — $5.3 and $5.4, respectively).
t) Product Warranties
At the time revenue is recognized, a provision for estimated warranty costs is recorded as a component of cost of sales. The warranty accrual represents the Company’s best estimate of the costs necessary to settle future and existing claims on products sold as of the balance sheet date based on the terms of the warranty, which vary by customer and product, historical product return rates and estimated average repair costs. The Company periodically assesses the adequacy of its recorded warranty provisions and adjusts the amounts as necessary.
u) Special Charges and Restructuring Costs
Special charges and restructuring costs consist of costs related to restructuring and integration activities as well as acquisition-related costs. Restructuring costs generally relate to workforce reductions and facility reductions incurred to eliminate duplication of activities as a result of acquisitions or to improve operational efficiency. Costs related to workforce reductions are recorded when the company has committed to a plan of termination and notified the employees of the terms of the plan. Costs related to facility reductions primarily consist of lease termination obligations for vacant facilities, which generally include the remaining payments on an operating lease. Lease termination obligations are reduced for probable future sublease income. In addition, integration costs include professional services and consulting services incurred to complete the integration of acquisitions, which are expensed as incurred. Acquisition-related costs consist of incremental costs incurred for diligence activities and closing costs, and are expensed as incurred.
v) Accounting Pronouncements Adopted in 2017
Stock-based compensation
In March 2016, the Financial Accounting Standards Board (“FASB”) issued Accounting Standards Update (“ASU”) 2016-09 “Compensation – Stock Compensation” to simplify and improve accounting for stock-based compensation. The ASU, among other changes, allows for a policy election such that an entity can continue to estimate forfeitures at the time of grant or can account for forfeitures as they occur. The Company adopted this ASU in the first quarter of 2017 and has elected to account for forfeitures as they occur. The ASU requires a modified retrospective approach for the adoption. As a result, a cumulative-effect adjustment of $5.8 was recorded to additional paid-in capital and accumulated deficit as at January 1, 2017 to account for the elimination of the historical estimate of forfeitures on stock-based compensation awards.
Statement of cash flows
In August 2016, the FASB issued ASU 2016-15 “Statement of Cash Flows – Classification of Certain Cash Receipts and Cash Payments” to address diversity in practice on certain specific cash flow issues. The ASU is effective for the Company for fiscal years beginning after December 15, 2017, including interim periods within those fiscal years. The Company early-adopted this ASU on January 1, 2017 and the adoption did not have an effect on the consolidated financial statements.
71
Table of Contents
Simplifying the test for goodwill impairment
In January 2017, the FASB issued ASU 2017-04 “Intangibles – Goodwill and Other – Simplifying the Test for Goodwill Impairment” to simplify how an entity is required to test for goodwill impairment. As a result, an entity will perform its goodwill impairment test by comparing the carrying value of a reporting unit against the fair value and will record an impairment for the amount that the carrying value of a reporting unit exceeds the fair value. The ASU is effective prospectively for the Company for fiscal years beginning after December 15, 2019, including interim periods within those fiscal years. The Company early-adopted this ASU on January 1, 2017.
w) Accounting Pronouncements Issued, but not yet Adopted
Revenue recognition
In May 2014, the FASB issued ASU 2014-09 “Revenue from Contracts with Customers” to provide a single comprehensive model for entities to use in accounting for revenue arising from contracts with customers. The ASU supersedes most current revenue recognition guidance, including industry-specific guidance. The FASB subsequently issued ASU 2015-14, ASU 2016-08 and ASU 2016-12, which clarified the guidance, provided scope improvements and amended the effective date of ASU 2014-09. As a result, ASU 2014-09 becomes effective for the Company in the first quarter of 2018, with early adoption permitted. The Company will adopt these ASUs in the first quarter of 2018.
The ASU permits two methods of adoption: retrospectively to each prior reporting period presented (full retrospective method), or retrospectively with the cumulative effect of initially applying the guidance recognized at the date of initial application (the cumulative catch-up transition method). The company anticipates adopting the standard using the full retrospective method to restate each prior reporting period presented. The Company is completing its assessment and has progressed in the implementation of the standard, including the review of significant contracts. The adoption of the standard could impact the timing of revenue recognition and the timing of the recognition of expenses directly related to revenue contracts.
Leases
In February 2016, the FASB issued ASU 2016-02 “Leases” to increase transparency and comparability among organizations by recognizing lease assets and lease liabilities on the balance sheet and disclosing key information about leasing arrangements. For operating leases, the ASU requires a lessee to recognize a right-of-use asset and a lease liability, initially measured at the present value of the lease payments, on its balance sheet. The ASU retains the current accounting for lessors and does not make significant changes to the recognition, measurement, and presentation of expenses and cash flows by a lessee. The ASU is effective for the Company for fiscal years beginning after December 15, 2018, including interim periods within those fiscal years. Early adoption is permitted. The Company continues to evaluate the effect of the adoption of this ASU but expects the adoption will result in an increase in the assets and liabilities on the consolidated balance sheets for operating leases and will not likely have a significant impact on the consolidated statements of earnings.
Credit losses on financial instruments
In June 2016, the FASB issued ASU 2016-13 “Financial Instruments – Credit Losses” to improve information on credit losses for financial assets and net investment in leases that are not accounted for at fair value through net income. The ASU replaces the current incurred loss impairment methodology with a methodology that reflects expected credit losses. The ASU is effective for the Company for fiscal years beginning after December 15, 2019, including interim periods within those fiscal years. Early adoption is permitted beginning in fiscal years beginning after December 15, 2018. The Company is currently evaluating the effect the adoption of this ASU will have on its consolidated financial statements.
Income statement classification of net pension benefit costs
In March 2017, the FASB issued ASU 2017-07 “Improving the Presentation of Net Periodic Pension Cost and Net Periodic Postretirement Benefit Cost” to provide income statement classification guidance for components of the net benefit cost. The ASU requires that the service cost component be recorded in the same line as the other compensation costs for the relevant employee while the other components are to be recorded in a separate line item outside of income from operations and is to be adopted retrospectively. The ASU is effective for the Company for fiscal years beginning after December 15, 2017, including interim periods within those fiscal years and may be early-adopted. The Company expects the adoption will result in a reclassification of the non-service components of pension and post-retirement costs, primarily from selling general and administration expense to other income (loss) on the consolidated statement of operations. The Company’s pensions, including the net periodic cost, are disclosed in note 24.
72
Table of Contents
Statement of cash flows – presentation of restricted cash
In November 2016, the FASB issued ASU 2016-18 “Restricted Cash” to provide guidance on the presentation of restricted cash in the statement of cash flows. Currently, the statement of cash flows explained the change in cash and cash equivalents for the period. The ASU requires that the statement of cash flows explain the change in cash, cash equivalents and restricted cash for the period. The ASU is effective for the Company for fiscal years beginning after December 15, 2017, including interim periods within those fiscal years and may be early-adopted. The Company will adopt the ASU in the first quarter of 2018. The Company does not expect the adoption to have a material effect on the statements of cash flows as the Company’s restricted cash is not expected to be material.
3. ACQUISITIONS
a) ShoreTel – September 2017
On September 25, 2017, Mitel acquired ShoreTel, Inc. (“ShoreTel”) (NASDAQ:SHOR), a provider of unified video, voice and content communications solutions, primarily in the U.S., with revenues of $357.8 for the twelve months ended June 30, 2017. Mitel acquired all of the outstanding shares of common stock of ShoreTel in exchange for total consideration of $531.4, which includes amounts paid to cash out all in-the-money, vested ShoreTel stock options and all vested restricted stock units. In conjunction with the acquisition, the Company completed a refinancing of its long-term senior debt, as described in note 13.
Mitel management believes the transaction provides the Company with financial scale and operating leverage, in particular in the U.S. The transaction will allow the combined company to leverage the research and development workforce acquired as well as realize synergies. These factors contributed to the recognition of goodwill for the acquisition.
The Company is required to allocate the purchase price to tangible and identifiable intangible assets acquired and liabilities assumed based on their fair values. The excess of the purchase price over those fair values is recorded as goodwill. The purchase price and allocation of the purchase price is as follows:
| September 25, 2017 | ||||
| Net assets: |
||||
| Cash and cash equivalents |
$ | 120.4 | ||
| Accounts receivable(1) |
24.0 | |||
| Inventories |
13.1 | |||
| Other current assets |
12.6 | |||
| Property and equipment |
18.1 | |||
| Intangible assets – customer relationships(2)(4) |
215.4 | |||
| Intangible assets – developed technology(3)(4) |
155.8 | |||
| Goodwill(4) |
189.6 | |||
| Other non-current assets |
6.2 | |||
| Accounts payable and accrued liabilities |
(57.6 | ) | ||
| Current portion of deferred revenue |
(60.3 | ) | ||
| Long-term portion of deferred revenue |
(17.9 | ) | ||
| Deferred tax liability |
(84.3 | ) | ||
| Other non-current liabilities |
(3.7 | ) | ||
|
|
|
|||
| Net assets acquired |
$ | 531.4 | ||
|
|
|
|||
| Consideration given: |
||||
| Cash paid to ShoreTel shareholders in September 2017 |
$ | 521.0 | ||
| Cash paid to holders of ShoreTel options and restricted stock units in October 2017(5) |
10.4 | |||
|
|
|
|||
| Total consideration given |
$ | 531.4 | ||
|
|
|
|||
| (1) | Fair value of accounts receivable consists of gross contractual amounts receivable of $24.5, less best estimate of amounts not expected to be collected of $0.5. |
| (2) | Intangible assets – customer relationships are expected to be amortized over their estimated useful life of 5 years. |
| (3) | Intangible assets – developed technology is expected to be amortized over their estimated useful life of 5 years. |
| (4) | Neither the goodwill nor the intangible assets are expected to be deductible for tax purposes. |
| (5) | Cash paid to holders of ShoreTel vested, in-the-money options and vested, restricted stock units. |
73
Table of Contents
ShoreTel’s results of operations are included in the consolidated statements of operations of the combined entity from the date of acquisition. ShoreTel’s cloud recurring revenues are included in the Cloud segment while the remainder of the business is included in the Enterprise segment. The amount of revenue from the acquisition included in the Company’s results of operations for the year ended December 31, 2017 was $93.6. The amount of net loss from the acquisition included in the Company’s results of operations year ended December 31, 2017 was $14.9.
The following unaudited pro-forma financial information presents the Company’s consolidated financial results as if the acquisition had occurred on January 1, 2016:
| Year Ended December 31 | ||||||||
| 2017 | 2016 | |||||||
| Operations |
||||||||
| Revenues |
$ | 1,321.3 | $ | 1,335.8 | ||||
| Net loss |
$ | (136.8 | ) | $ | (328.6 | ) | ||
| Net loss per share |
$ | (1.13 | ) | $ | (2.70 | ) | ||
These pro-forma results have been prepared for comparative purposes only and are not necessarily indicative of the results of operations that actually would have resulted had the acquisition been effected at the beginning of the respective periods and are not necessarily representative of future results. The pro-forma results include the following adjustments:
| • | A reduction to revenue as a result of the valuation of the deferred revenue acquired being below ShoreTel’s historical book value. |
| • | Amortization of intangible assets that arose from the acquisition of $74.2 per year. |
| • | Increase to interest expense of approximately $21.0 per year as a result of the additional borrowings incurred to finance the acquisition. |
| • | A tax provision based on an estimated effective tax rate of nil as a result of unrecognized tax loss carryforwards. |
b) Mavenir – April 2015
On April 29, 2015, Mitel acquired Mavenir Systems, Inc. (“Mavenir”) (NYSE:MVNR), a global provider of software-based networking solutions for mobile carriers. Mitel acquired all of the outstanding common shares of Mavenir in exchange for $325.2 cash and 19.7 million Mitel shares. In addition, Mitel agreed to cash out all in-the-money, vested Mavenir stock options and, in exchange for all out-of-the-money and unvested Mavenir stock options, issue 2.5 million Mitel stock options with economically similar terms.
Mavenir’s results of operations were initially recorded in the Mobile segment from the date of acquisition. In December 2016, the Company entered into a definitive agreement to sell the Mobile segment, as described in note 4. As a result, the results of operations of the Mobile segment since the date of acquisition have been classified as discontinued operations on the consolidated statements of operations and the assets and liabilities of the Mobile segment have been classified as assets and liabilities held for sale on the consolidated balance sheets.
The Company is required to allocate the purchase price to tangible and identifiable intangible assets acquired and liabilities assumed based on their fair values. The excess of the purchase price over those fair values is recorded as goodwill. The purchase price and allocation of the purchase price is as follows:
| April 29, 2015 | ||||
| Net assets: |
||||
| Cash and cash equivalents |
$ | 10.1 | ||
| Accounts receivable(1) |
35.1 | |||
| Inventories(2) |
7.3 | |||
| Other current assets |
38.2 | |||
| Property and equipment |
9.0 | |||
| Intangible assets – customer relationships(3)(6) |
109.7 | |||
| Intangible assets – developed technology(4)(6) |
172.9 | |||
| Goodwill(5)(6) |
312.3 | |||
| Other non-current assets |
3.8 | |||
| Accounts payable and accrued liabilities |
(60.5 | ) | ||
74
Table of Contents
| April 29, 2015 | ||||
| Deferred revenue, current |
(20.0 | ) | ||
| Current portion of long-term debt(7) |
(27.2 | ) | ||
| Deferred revenue, non-current |
(0.3 | ) | ||
| Deferred tax liability |
(37.3 | ) | ||
| Other non-current liabilities |
(7.8 | ) | ||
|
|
|
|||
| Net assets acquired |
$ | 545.3 | ||
|
|
|
|||
| Consideration given: |
||||
| Cash paid to Mavenir shareholders |
$ | 325.2 | ||
| Cash paid to Mavenir optionholders(8) |
28.1 | |||
| Value of Mitel common shares issued to Mavenir shareholders(9) |
189.2 | |||
| Value of Mitel options relating to past service issued to Mavenir optionholders(10) |
2.8 | |||
|
|
|
|||
| Total consideration given |
$ | 545.3 | ||
|
|
|
|||
| (1) | Fair value of accounts receivable consists of gross contractual amounts receivable of $36.3, less best estimate of amounts not expected to be collected of $1.2. |
| (2) | Fair value of inventory consists of inventory with a historical cost of $8.5 less a historical provision of $1.2. |
| (3) | Intangible assets – customer relationships are expected to be amortized over the estimated useful life of the asset of 7 years. |
| (4) | Intangible assets – developed technology is expected to be amortized over the estimated useful life of the asset of 7 years. |
| (5) | Goodwill is allocated to the Mobile segment. |
| (6) | Neither the goodwill nor the intangible assets are deductible for tax purposes. |
| (7) | Long-term debt of Mavenir was repaid at closing. |
| (8) | Cash paid to Mavenir optionholders for vested, in-the-money options. |
| (9) | Fair value of the 19.7 million Mitel common shares issued to Mavenir shareholders valued at $189.2 based on the closing price of a Mitel common share on the NASDAQ stock market on April 28, 2015. |
| (10) | In exchange for all unvested in-the-money Mavenir stock options and all vested and unvested out-of-the-money Mavenir stock options, Mitel issued 2.5 million Mitel stock options with economically similar terms. Using a Black-Scholes valuation with assumptions consistent with grants made in the normal course as described in note 16, the fair value of the 2.5 million stock options totaled $13.0. Based on the vesting period of the original Mavenir stock options, $2.8 was determined to relate to past service and is considered part of the total consideration. The remaining amount was recorded as stock-based compensation expense by Mitel based on the vesting period. |
c) Tiger TMS – June 2015
On June 1, 2015, Mitel acquired all of the outstanding equity of Tiger TMS (“Tiger”), a global provider of software, cloud and applications-based solutions for the hospitality industry. Tiger recorded revenues of approximately $10.0 for the year ended December 31, 2014, which were primarily generated in Europe, the Middle East and the United States. Total consideration for the acquisition is estimated to be $6.6, consisting of $1.8 of cash paid on June 1, 2015, $3.0 paid in October 2015, $1.4 paid in January 2017 and an estimate of contingent consideration of $0.4. In addition, Mitel repaid $3.2 of long-term debt of Tiger at closing. Tiger’s results of operations are included in the consolidated statements of operations from the date of acquisition, June 1, 2015 and are included in the Enterprise segment.
4. DISCONTINUED OPERATIONS
On December 18, 2016, Mitel entered into a definitive agreement to divest its Mobile business unit to the parent company of Xura, Inc. (“Xura”) for $350.0 in cash, a $35.0 non-interest bearing promissory note and an equity interest in Sierra Private Investments L.P. (“Sierra”), the limited partnership that owns both Xura and the Mobile business unit. The transaction closed on February 28, 2017. The cash portion of the purchase price was subject to adjustments for closing working capital, indebtedness and net advances to the business unit between December 31, 2016 and the closing of the transaction. The $35.0 non-interest bearing note is repayable at the earlier of a re-financing or replacement in full of Sierra’s existing credit facility, and 10 years from the date of closing. The equity interest in Sierra is represented by units that have a right to participate in future distributions of Sierra, on a pro rata basis with other equity holders of Sierra, but that right to participate is only effective after substantially all other equity holders of Sierra have received distributions equivalent to an 8.5% internal rate of return on their invested capital and is subject to a cap on distributions of $125.0. Mitel does not have significant participatory rights and will not have significant influence over the combined company.
75
Table of Contents
The disposal of the Mobile business unit was considered a strategic shift away from the sale of software-based network solutions for mobile carriers. As a result, the operations of the Mobile business unit have been classified as discontinued operations on the consolidated statements of operations and the assets and liabilities of the Mobile business unit have been classified as assets and liabilities held for sale on the consolidated balance sheets.
Assets and liabilities held for sale for the Mobile business unit are as follows:
| December 31, 2016 |
||||
| Assets of component held for sale, current: |
||||
| Cash and cash equivalents |
$ | 3.5 | ||
| Accounts receivable |
83.2 | |||
| Inventories |
7.1 | |||
| Other current assets |
27.5 | |||
|
|
|
|||
| $ | 121.3 | |||
|
|
|
|||
| Assets of component held for sale, non-current: |
||||
| Property and equipment (net) |
13.8 | |||
| Identifiable intangible assets (net) |
215.3 | |||
| Goodwill |
99.5 | |||
| Other non-current assets |
3.9 | |||
|
|
|
|||
| $ | 332.5 | |||
|
|
|
|||
| Liabilities of component held for sale, current: |
||||
| Accounts payable and accrued liabilities |
$ | 43.3 | ||
| Current portion of deferred revenue |
14.6 | |||
| Current portion of long-term debt – capital leases |
0.4 | |||
|
|
|
|||
| $ | 58.3 | |||
|
|
|
|||
| Liabilities of component held for sale, non-current: |
||||
| Long-term debt – capital leases |
0.9 | |||
| Long-term portion of deferred revenue |
1.7 | |||
| Deferred tax liability |
14.3 | |||
| Other non-current liabilities |
7.9 | |||
|
|
|
|||
| $ | 24.8 | |||
|
|
|
|||
Summarized results of operations for the Mobile business unit are as follows:
| Year Ended December 31, 2017(1) |
Year Ended December 31, 2016 |
Year Ended December 31, 2015(2) |
||||||||||
| Revenues |
$ | 8.0 | $ | 186.4 | $ | 131.9 | ||||||
| Cost of revenues |
(6.3 | ) | (81.8 | ) | (63.2 | ) | ||||||
| Selling, general and administrative expenses and |
(5.5 | ) | (34.5 | ) | (32.0 | ) | ||||||
| Research and development expenses |
(8.4 | ) | (48.4 | ) | (29.2 | ) | ||||||
| Special charges and restructuring costs |
— | (13.2 | ) | (7.1 | ) | |||||||
| Amortization of acquisition-related intangible assets |
— | (40.4 | ) | (26.9 | ) | |||||||
| Interest expense(3) |
(3.7 | ) | (22.0 | ) | (14.6 | ) | ||||||
| Goodwill impairment |
— | (212.8 | ) | — | ||||||||
| Other income |
— | 0.1 | 0.2 | |||||||||
| Gain on disposal |
7.9 | — | — | |||||||||
|
|
|
|
|
|
|
|||||||
| Loss from discontinued operations, before income taxes |
(8.0 | ) | (266.6 | ) | (40.9 | ) | ||||||
| Income tax recovery |
6.6 | 14.3 | 13.7 | |||||||||
|
|
|
|
|
|
|
|||||||
| Net loss from discontinued operations, net of income tax |
(1.4 | ) | (252.3 | ) | (27.2 | ) | ||||||
|
|
|
|
|
|
|
|||||||
| (1) | Operating results for the year ended December 31, 2017 consist of the operations up to the date of close, February 28, 2017. |
| (2) | Operating results for the year ended December 31, 2015 consist of the operations from the date of acquisition, April 29, 2015. |
| (3) | Interest expense allocated to discontinued operations consists of the pro-rata allocation of interest expense on long-term debt that was repaid from the net proceeds of the sale of the Mobile business unit. |
76
Table of Contents
For the year ended December 31, 2017 the loss from discontinued operations includes amortization and depreciation of nil and stock based compensation of nil (year ended December 31, 2016 — $46.3 and $3.1, respectively, year ended December 31, 2015 — $29.8 and $1.6, respectively). The Mobile business unit incurred capital expenditures of $1.2 for the year ended December 31, 2017 (years ended December 31, 2016 and 2015 — $6.0 and $4.4, respectively). No other significant investing or financing cash flow items were recorded relating to the operations of the Mobile business unit since its acquisition on April 29, 2015.
Gain on disposal – 2017
The Company recorded a gain on disposal of $7.9 in the year ended December 31, 2017 consisting of the fair value of consideration received of $378.0, less the carrying value of net assets of $362.9 (which includes cash divested of $30.8 and is net of the 2016 goodwill impairment described below), costs to sell incurred in the first quarter of 2017 of $2.6 and liabilities for representations, warranties and indemnifications of $4.6, as described below. The fair value of consideration received of $378.0 consisted of cash proceeds of $351.1 received on February 28, 2017, proceeds from the net working capital and other closing adjustments of $16.6, received in May 2017, and the fair value of the non-interest bearing promissory note and units acquired of $10.3. The fair value of the promissory note was determined using a 10-year term and a discount rate based on management’s estimate of notes of similar risk and as a result is classified as Level 2 in the fair value measurement categories, as described in note 26. The fair value of the units was determined using certain unobservable inputs, including management’s estimate of the value of the combined entity and as a result is classified as Level 3 in the fair value measurement categories, as described in note 26.
Goodwill impairment – 2016
At December 31, 2016, based on the definitive agreement, the fair value of the Mobile business unit was determined to be approximately $375.0. As a result of the fair value of the business unit being lower than the carrying value of the business unit, the company completed the second step of its goodwill impairment test for the reporting unit. The second step consists of allocating the fair value of the reporting unit to the assets and liabilities of the reporting unit as if it had been acquired in a business combination and the purchase price was equivalent to the fair value of the reporting unit. The excess of the fair value of the reporting unit over the amounts assigned to its assets and liabilities is referred to as the implied fair value of goodwill. This implied fair value of goodwill was less than the carrying value of goodwill and, as a result, a goodwill impairment charge was recorded in the fourth quarter of 2016 to reduce the carrying value of goodwill to the implied fair value. After recording the goodwill impairment charge, the Mobile business unit’s carrying value was equal to its fair value less costs to sell.
Representations, warranties and indemnifications
The Company has provided the buyer with certain representations, warranties and indemnifications relating to the operations of the Mobile business unit, in particular relating to income taxes and sales taxes. As a result, the Company retained a liability at closing of $4.6, primarily for certain sales tax liabilities and uncertain tax positions relating to the Mobile business unit.
5. NET INVESTMENT IN SALES-TYPE LEASES
Net investment in sales-type leases represents the value of sales-type leases held under the TotalSolution® program in the U.S. The Company currently sells the rental payments due to the Company from some of the sales-type leases. The Company maintains reserves against its estimate of potential recourse for the balance of sales-type leases (recorded net, against the receivable) and for the balance of sold rental payments remaining unbilled (recorded separately as a lease recourse liability included in other non-current liabilities). The following table provides detail on the sales-type leases:
| December 31, 2017 | December 31, 2016 | |||||||||||||||||||||||
| Gross | Allowance | Net | Gross | Allowance | Net | |||||||||||||||||||
| Lease balances included in accounts receivable |
$ | 4.8 | $ | (1.1 | ) | $ | 3.7 | $ | 4.7 | $ | (1.0 | ) | $ | 3.7 | ||||||||||
| Current portion of investment in sales-type leases |
4.1 | (0.1 | ) | 4.0 | 6.0 | (0.2 | ) | 5.8 | ||||||||||||||||
| Non-current portion of investment in sales-type leases |
5.8 | (0.1 | ) | 5.7 | 6.9 | (0.2 | ) | 6.7 | ||||||||||||||||
|
|
|
|
|
|
|
|
|
|
|
|
|
|||||||||||||
| Total unsold sales-type leases (recorded as assets, net, on the consolidated balance sheets) |
14.7 | (1.3 | ) | 13.4 | 17.6 | (1.4 | ) | 16.2 | ||||||||||||||||
| Sold rental payments remaining unbilled |
32.4 | (1.0 | )(1) | 31.4 | 39.6 | (1.3 | )(1) | 38.3 | ||||||||||||||||
|
|
|
|
|
|
|
|
|
|
|
|
|
|||||||||||||
| Total of sales-type leases unsold and sold |
$ | 47.1 | $ | (2.3 | ) | $ | 44.8 | $ | 57.2 | $ | (2.7 | ) | $ | 54.5 | ||||||||||
|
|
|
|
|
|
|
|
|
|
|
|
|
|||||||||||||
| (1) | Allowance for sold rental payments is recorded as a lease recourse liability and included in other non-current liabilities on the consolidated balance sheets. |
77
Table of Contents
A sale of rental payments represents the total present value of the payment stream on the sale of the rental payments to third parties. For the year ended December 31, 2017, the Company sold $11.9 of rental payments and recorded gains on sale of those rental payments of $1.7 (years ended December 31, 2016 and 2015 – sold $29.2 and $16.1, respectively and recorded gains of $2.4 and $2.6, respectively). Sold rental payments remaining unbilled at the end of the period represents the total balance of leases that are not included on the consolidated balance sheets. The Company is compensated for administration and servicing of rental payments sold.
At December 31, 2017, future minimum lease payments related to the sold rental streams remaining unbilled are: 2018 — $14.5, 2019 — $9.9, 2020 — $5.3, 2021 — $2.2 and 2022 — $0.5.
At December 31, 2017, future minimum lease receipts due from customers related to the lease portfolio included in the December 31, 2017 consolidated balance sheet are: 2018 — $5.9, 2019 — $1.8, 2020 — $1.0, 2021 — $0.7 and 2022 — $0.5.
Financing Receivables
The Company considers its lease balances included in accounts receivable and its investment in sales-type leases to be financing receivables. Additional disclosures on the credit quality of the Company’s sold and unsold sales-type leases and lease balances included in accounts receivable are as follows:
Aging Analysis as of December 31, 2017
| Not past due | 1-90 days past due |
Greater than 90 days past due |
Total past due |
Total sales-type leases |
||||||||||||||||
| Lease balances included in accounts receivable |
$ | 2.2 | $ | 1.0 | $ | 1.6 | $ | 2.6 | $ | 4.8 | ||||||||||
| Investment in sold and unsold sales-type lease receivables |
36.0 | 6.1 | 0.2 | 6.3 | 42.3 | |||||||||||||||
|
|
|
|
|
|
|
|
|
|
|
|||||||||||
| Total gross sales-type leases |
38.2 | 7.1 | 1.8 | 8.9 | 47.1 | |||||||||||||||
| Allowance |
(0.8 | ) | (0.4 | ) | (1.1 | ) | (1.5 | ) | (2.3 | ) | ||||||||||
|
|
|
|
|
|
|
|
|
|
|
|||||||||||
| Total net sales-type leases |
$ | 37.4 | $ | 6.7 | $ | 0.7 | $ | 7.4 | $ | 44.8 | ||||||||||
|
|
|
|
|
|
|
|
|
|
|
|||||||||||
Aging Analysis as of December 31, 2016
| Not past due | 1-90 days past due |
Greater than 90 days past due |
Total past due |
Total sales-type leases |
||||||||||||||||
| Lease balances included in accounts receivable |
$ | 2.0 | $ | 1.7 | $ | 1.0 | $ | 2.7 | $ | 4.7 | ||||||||||
| Investment in sold and unsold sales-type lease receivables |
43.5 | 8.9 | 0.1 | 9.0 | 52.5 | |||||||||||||||
|
|
|
|
|
|
|
|
|
|
|
|||||||||||
| Total gross sales-type leases |
45.5 | 10.6 | 1.1 | 11.7 | 57.2 | |||||||||||||||
| Allowance |
(1.1 | ) | (0.8 | ) | (0.8 | ) | (1.6 | ) | (2.7 | ) | ||||||||||
|
|
|
|
|
|
|
|
|
|
|
|||||||||||
| Total net sales-type leases |
$ | 44.4 | $ | 9.8 | $ | 0.3 | $ | 10.1 | $ | 54.5 | ||||||||||
|
|
|
|
|
|
|
|
|
|
|
|||||||||||
Allowance for Credit Losses
The Company’s allowance for credit losses is based on management’s assessment of the collectability of customer accounts. A considerable amount of judgment is required to make this assessment including a detailed analysis of the aging of the lease receivables, the current creditworthiness of customers and an analysis of historical bad debts and other adjustments. If there is a
78
Table of Contents
deterioration of a major customer’s creditworthiness or actual defaults are higher than historical experience, the estimate of the recoverability of amounts due could be adversely affected. The Company reviews in detail the allowance for credit losses at each reporting period and adjusts the allowance estimate to reflect actual portfolio performance and any changes in future portfolio performance expectations.
The following table shows the activity of the allowance for credit losses on sales-type leases during the years ended December 31, 2017 and 2016:
| Year Ended December 31, 2017 |
Year Ended December 31, 2016 |
|||||||
| Allowance for credit losses on sales-type leases, opening |
$ | (2.7 | ) | $ | (3.7 | ) | ||
| Write-offs |
0.1 | 0.8 | ||||||
| Recoveries |
0.3 | 0.2 | ||||||
| Provision |
— | — | ||||||
|
|
|
|
|
|||||
| Allowance for credit losses on sales-type leases, closing |
$ | (2.3 | ) | $ | (2.7 | ) | ||
|
|
|
|
|
|||||
| Individually evaluated for impairment |
||||||||
| Sales-type leases individually evaluated for impairment, gross |
$ | 3.2 | $ | 3.2 | ||||
| Allowance against sales-type leases individually evaluated for impairment |
(1.4 | ) | (1.4 | ) | ||||
|
|
|
|
|
|||||
| Sales-type leases individually evaluated for impairment, net |
$ | 1.8 | $ | 1.8 | ||||
|
|
|
|
|
|||||
| Collectively evaluated for impairment |
||||||||
| Sales-type leases collectively evaluated for impairment, gross |
$ | 43.9 | $ | 54.0 | ||||
| Allowance against sales-type leases collectively evaluated for impairment |
(0.9 | ) | (1.3 | ) | ||||
|
|
|
|
|
|||||
| Sales-type leases collectively evaluated for impairment, net |
$ | 43.0 | $ | 52.7 | ||||
|
|
|
|
|
|||||
6. INVENTORIES
| December 31, 2017 | December 31, 2016 | |||||||
| Raw materials |
$ | 7.1 | $ | 7.3 | ||||
| Finished goods(1) |
81.6 | 69.7 | ||||||
| Service inventory |
7.2 | 6.4 | ||||||
| Less: provision for excess and obsolete inventory(1) |
(11.7 | ) | (8.5 | ) | ||||
|
|
|
|
|
|||||
| $ | 84.2 | $ | 74.9 | |||||
|
|
|
|
|
|||||
| (1) | At December 31, 2017, finished goods are recorded net of approximately $16.8 of historical inventory provision of acquisitions (December 31, 2016 — $11.5). This amount will decrease as the related inventory acquired is sold or written off. |
7. OTHER CURRENT ASSETS
| December 31, 2017 | December 31, 2016 | |||||||
| Prepaid expenses and deferred charges |
$ | 38.8 | $ | 26.0 | ||||
| Unbilled receivables |
6.4 | 5.3 | ||||||
| Due from related parties (note 12) |
0.2 | 0.3 | ||||||
| Income tax receivable |
9.3 | 10.5 | ||||||
| Other receivables |
22.4 | 14.7 | ||||||
| Restricted cash |
1.6 | 0.9 | ||||||
|
|
|
|
|
|||||
| $ | 78.7 | $ | 57.7 | |||||
|
|
|
|
|
|||||
79
Table of Contents
8. PROPERTY AND EQUIPMENT
| December 31, 2017 | December 31, 2016 | |||||||||||||||||||||||
| Cost | Accumulated amortization |
Net | Cost | Accumulated amortization |
Net | |||||||||||||||||||
| Property and Equipment |
$ | 208.3 | $ | (155.1 | ) | $ | 53.2 | $ | 163.0 | $ | (123.9 | ) | $ | 39.1 | ||||||||||
|
|
|
|
|
|
|
|
|
|
|
|
|
|||||||||||||
Depreciation expense on property and equipment recorded in the year ended December 31, 2017 amounted to $19.7 (years ended December 31, 2016 and 2015 — $17.5 and $19.3, respectively).
As of December 31, 2017, equipment included leased assets with cost of $17.0 (December 31, 2016 —$24.5) and net book value of approximately $7.7 (December 31, 2016 — $11.7).
9. IDENTIFIABLE INTANGIBLE ASSETS
| December 31, 2017 | December 31, 2016 | |||||||||||||||||||||||
| Cost | Accumulated amortization |
Net | Cost | Accumulated amortization |
Net | |||||||||||||||||||
| Developed technology |
$ | 325.7 | $ | (123.6 | ) | $ | 202.1 | $ | 169.9 | $ | (87.3 | ) | $ | 82.6 | ||||||||||
| Customer relationships |
237.1 | (22.7 | ) | 214.4 | 17.2 | (6.6 | ) | 10.6 | ||||||||||||||||
| Patents, trademarks and other |
35.7 | (31.4 | ) | 4.3 | 34.6 | (27.4 | ) | 7.2 | ||||||||||||||||
|
|
|
|
|
|
|
|
|
|
|
|
|
|||||||||||||
| $ | 598.5 | $ | (177.7 | ) | $ | 420.8 | $ | 221.7 | $ | (121.3 | ) | $ | 100.4 | |||||||||||
|
|
|
|
|
|
|
|
|
|
|
|
|
|||||||||||||
The cost amounts for customer relationships and developed technology represent the fair value of intangible assets upon acquisition. The assets are being amortized on a straight-line basis over their estimated useful lives of four to seven years. Patents, trademarks and other consists primarily of the cost to register and defend patents and are primarily amortized on a straight-line basis over their estimated useful lives of four to five years.
Amortization of identifiable intangible assets in the year ended December 31, 2017 was $56.6 (years ended December 31, 2016 and 2015 — $36.9 and $50.0, respectively). The estimated amortization expense, related to intangible assets in existence as of December 31, 2017, over the next five fiscal years is as follows: 2018 — $107.0, 2019 — $103.6, 2020 — $80.0, 2021 — $75.6 and 2022 — $54.9.
10. GOODWILL
The following table shows the activity relating to goodwill for the last three years:
| Goodwill, December 31, 2014 |
$ | 340.3 | ||
| Acquisition of Tiger (note 3) |
6.0 | |||
|
|
|
|||
| Goodwill, December 31, 2015 and 2016 |
$ | 346.3 | ||
|
|
|
|||
| Acquisition of ShoreTel (note 3) |
189.6 | |||
|
|
|
|||
| Goodwill, December 31, 2017 |
$ | 535.9 | ||
|
|
|
11. ACCOUNTS PAYABLE AND ACCRUED LIABILITIES
| December 31, 2017 | December 31, 2016 | |||||||
| Trade payables |
$ | 56.6 | $ | 45.5 | ||||
| Employee-related payables |
48.2 | 39.6 | ||||||
| Accrued liabilities |
91.0 | 75.5 | ||||||
| Restructuring, warranty and other provisions |
32.0 | 18.9 | ||||||
| Due to related parties (note 12) |
1.2 | 0.8 | ||||||
| Other payables |
31.8 | 20.3 | ||||||
|
|
|
|
|
|||||
| $ | 260.8 | $ | 200.6 | |||||
|
|
|
|
|
|||||
80
Table of Contents
12. RELATED PARTY TRANSACTIONS
Significant related party transactions not otherwise disclosed in the Consolidated Financial Statements consist of the following:
The Matthews Group
Dr. Terence Matthews (“Dr. Matthews”), a director of the Company, and certain entities controlled by Dr. Matthews (collectively, the “Matthews Group”) are shareholders of the Company. Significant transactions with the Matthews Group include the following:
Leased Properties
The Company leases its Ottawa-based headquarter facilities from the Matthews Group. For the year ended December 31, 2017, Mitel recorded lease payments for base rent and operating costs of $4.8 (years ended December 31, 2016 and 2015 — $4.6 and $4.3, respectively). The current lease expires on April 30, 2021.
Other
Other sales to and purchases from the Matthews Group arising in the normal course of the Company’s business were $0.7 and $3.8, respectively, for the year ended December 31, 2017 (year ended December 31, 2016 — $1.5 and $3.4, respectively; year ended December 31, 2015 — $2.5 and $3.7, respectively).
The amounts receivable and payable as a result of all of the above transactions are included in note 7 and note 11, respectively.
13. LONG-TERM DEBT
| December 31, 2017 | December 31, 2016 | |||||||
| Term Loan, five-year term, maturing March 2022 |
$ | 144.4 | $ | — | ||||
| Incremental Term Loan, six-year term, maturing September 2023 |
299.2 | — | ||||||
| Revolving credit facility, maturing March 2022 |
190.0 | — | ||||||
| Term loan, repaid in March 2017 |
— | 591.6 | ||||||
| Unamortized original issue discount |
(1.4 | ) | (4.7 | ) | ||||
| Unamortized debt issue costs |
(10.8 | ) | (12.6 | ) | ||||
| Capital leases |
7.7 | 11.7 | ||||||
|
|
|
|
|
|||||
| 629.1 | 586.0 | |||||||
| Less: current portion |
(17.1 | ) | (38.9 | ) | ||||
|
|
|
|
|
|||||
| $ | 612.0 | $ | 547.1 | |||||
|
|
|
|
|
|||||
At December 31, 2017, the senior credit facilities consist of an initial $150.0 term loan (“Term Loan”), a $300.0 incremental term loan (“Incremental Term Loan”) and a $350.0 revolving credit facility (together, the “2017 Credit Facilities”).
2017 Credit Facilities
On March 9, 2017, Mitel refinanced its senior secured credit facilities. The credit facilities were initially comprised of a $150.0 Term Loan and a $350.0 revolving credit facility. Proceeds of $150.0 from the Term Loan along with $95.0 initially drawn on the revolving credit facility and cash on hand, were used to repay the remaining principal and accrued interest outstanding under the prior credit facilities, as well as fees and expenses related to the new financing.
On September 25, 2017, Mitel amended its senior secured credit facilities to allow for a $300.0 Incremental Term Loan. The Incremental Term Loan, along with amounts drawn on the revolving credit facility and cash on hand from the combined company were used to finance the acquisition of ShoreTel, as described in note 3. The amendment also adjusted, among other items, the maximum Consolidated Total Net Leverage Ratio, as described below, and the applicable margin on the term loan and revolving credit facility.
81
Table of Contents
Costs incurred in March 2017 relating to the Term Loan were $2.0 and were recorded net against long-term debt and are being amortized over the term of the Term Loan. Costs incurred in March 2017 of $4.6 relating to the revolving credit facility were recorded as other non-current assets and are being amortized on a straight-line basis over the term of the revolving credit facility. Costs incurred in September 2017 of $9.5 relating to the Incremental Term Loan were recorded net against long-term debt and are being amortized over the term of the Incremental Term Loan.
The Term Loan, Incremental Term Loan and revolving credit facility bear interest at LIBOR plus an applicable margin or, at the option of the Company, a base rate plus an applicable margin. The Term Loan and revolving credit facility mature in March 2022 and the Incremental Term Loan matures in September 2023. The applicable margin on LIBOR borrowings under the Incremental Term Loan is 3.75%, with a LIBOR floor of 1.00%. The applicable margin and the undrawn commitment fee on the revolving credit facility and the applicable margin on the Term Loan are based on the Consolidated Total Net Leverage Ratio (the “Leverage Ratio”), as defined in the amended credit facility (the ratio of Consolidated Total Indebtedness, net of up to $50.0 of unrestricted cash, to the trailing twelve months Consolidated EBITDA, as defined in the amended credit facility), and are as follows:
| Consolidated Total Net Leverage Ratio |
Commitment Fee | Applicable Margin on Term Loan and Revolving Credit Facility LIBOR Rate Borrowings |
||||||
| Less than 1.25 |
0.25 | % | 1.75 | % | ||||
| Greater than or equal to 1.25 but less than 1.75 |
0.25 | % | 2.00 | % | ||||
| Greater than or equal to 1.75 but less than 2.25 |
0.30 | % | 2.25 | % | ||||
| Greater than or equal to 2.25 but less than 2.75 |
0.35 | % | 2.50 | % | ||||
| Greater than or equal to 2.75 but less than 3.25 |
0.35 | % | 3.00 | % | ||||
| Greater than or equal to 3.25 |
0.40 | % | 3.25 | % | ||||
The Company is required to make principal repayments on the Term Loan of $1.9 per quarter from June 2017 to March 2018, $2.8 per quarter from June 2018 to March 2020 and $3.8 per quarter from June 2020 to December 2021. The Company is required to make principal repayments on the Incremental Term Loan of $0.8 per quarter until maturity.
In addition, when the consolidated Leverage Ratio is above 2.00, the Company is required to make annual principal repayments on the Term Loan and Incremental Term Loan based on a percentage of excess cash flow (as defined in the 2017 Credit Facilities). The annual excess cash flow repayment is required to be paid within 100 days of the end of the fiscal year. The first annual excess cash flow payment is required to be paid within 100 days of December 31, 2018.
The Term Loan can be repaid without premium or penalty. The Incremental Term Loan can be repaid without premium or penalty any time after March 25, 2018. Prior to March 25, 2018, the Incremental Term Loan can be repaid with a penalty of 1% of principal where the repayment was due to a refinancing at a lower effective rate. The 2017 Credit Facilities have customary default clauses, such that repayment of the credit facilities may be accelerated in the event of a default that has neither been cured nor waived. The proceeds from the issuance of debt, and proceeds from the sale of Company assets, may also be required to be used, in whole or in part, to make mandatory prepayments under the 2017 Credit Facilities.
The 2017 Credit Facilities, as amended, contain affirmative and negative covenants, including: (a) periodic financial reporting requirements, (b) a maximum Leverage Ratio and a minimum Interest Coverage Ratio (the ratio of Consolidated EBITDA to Consolidated Interest Expense, both as defined in the credit facility) (c) limitations on the incurrence of subsidiary indebtedness and also the borrowers themselves, (d) limitations on liens, (e) limitations on investments, and (f) limitations on the payment of dividends and repurchases of shares. The Company was in compliance with these covenants at December 31, 2017. The maximum Leverage Ratio is as follows:
| Fiscal Quarters Ending |
Maximum Consolidated Leverage Ratio |
|||
| March 31, 2017 through June 30, 2017 |
3.50 | |||
| July 1, 2017 through June 30, 2018 |
4.25 | |||
| July 1, 2018 through September 30, 2018 |
3.75 | |||
| October 1, 2018 through December 31, 2018 |
3.50 | |||
| January 1, 2019 and thereafter |
3.25 | |||
82
Table of Contents
The maximum Leverage Ratio and actual Leverage Ratio are as follows:
| Period Ending |
Maximum Leverage Ratio |
Actual Leverage Ratio |
||||||
| March 31, 2017 |
3.50 | 1.17 | ||||||
| June 30, 2017 |
3.50 | 1.32 | ||||||
| September 30, 2017 |
4.25 | 3.52 | ||||||
| December 31, 2017 |
4.25 | 3.53 | ||||||
The minimum Interest Coverage Ratio throughout the term of the credit facility is 3.00. The Interest Coverage Ratio at December 31, 2017 was 7.58.
Prior credit facilities
In April 2015, in conjunction with the acquisition of Mavenir as described in note 3, Mitel refinanced its prior credit facilities. The new credit facilities consisted of an initial $660.0 term loan and a $50.0 revolving credit facility (the “April 2015 Credit Facilities”). Costs relating to the April 2015 Credit Facilities were $17.2, in addition to an original issue discount of $6.6. Costs of $15.5 and original issue discount of $6.6 related to the term loan were recorded net against the term loan and were being amortized over the term of the term loan. Costs of $1.7 relating to the revolving credit facility were recorded as other non-current assets and were being amortized on a straight-line basis over the term of the revolving credit facility. In addition, the Company expensed $8.4 of unamortized debt issue costs and unamortized original issue discount relating to the refinancing of the prior credit facilities.
In 2016, Mitel made prepayments on its term loan under the April 2015 Credit Facilities of $25.0 in January, $15.0 in March, $13.6 in June and $11.5 in July and recorded debt retirement costs totaling of $2.1 for the write-off of the pro-rata portion of unamortized debt issue costs and original issue discount relating to the prepayments.
In 2017, the April 2015 Credit Facilities were repaid as follows: repayments of $22.6 in January 2017, a repayment of $338.1 in March 2017 using proceeds from the divestiture of the Mobile business unit as described in note 4, and a repayment of $230.9 using proceeds from the March 2017 refinancing, as described above. As a result, in 2017, the Company expensed $18.0 of unamortized debt issue costs and unamortized original issue discount relating to the repayment of the prior credit facilities.
Capital leases
Interest expense related to capital leases was $0.5 for the year ended December 31, 2017 (years ended December 31, 2016 and 2015 — $0.6 and $0.7, respectively). Future minimum lease payments as of December 31, 2017 under capital leases total $8.1 of which $4.0, $2.7, $1.3 and $0.1 relate to years 2018 to 2021, respectively. Total interest costs of $0.4 are included in the total future lease payments.
Other
The Company has additional credit facilities totaling $15.6, of which $4.1 was utilized at December 31, 2017, primarily to provide letters of credit (December 31, 2016 — credit facilities totaling $16.9, of which $9.3 was utilized).
14. COMMITMENTS AND GUARANTEES
Operating Leases
The Company leases certain equipment and facilities under third-party operating leases. The Company is also committed under a related party facilities lease (see note 12). Rental expense for operating leases was as follows:
| Year Ended December 31, 2017 |
Year Ended December 31, 2016 |
Year Ended December 31, 2015 |
||||||||||
| Rental expense (1) |
||||||||||||
| Arms-length |
$ | 19.7 | $ | 17.1 | $ | 17.0 | ||||||
| Related party |
4.8 | 4.6 | 4.3 | |||||||||
|
|
|
|
|
|
|
|||||||
| Total |
$ | 24.5 | $ | 21.7 | $ | 21.3 | ||||||
|
|
|
|
|
|
|
|||||||
| (1) | Includes amounts paid to lessors for operating costs and is presented net of amounts that have been provided for under restructuring provisions. |
83
Table of Contents
Future minimum operating lease payments, primarily consisting of base rent for facilities, are as follows:
| Future Lease Payments(1) | ||||||||
| Fiscal year |
Arms-length | Related Party | ||||||
| 2018 |
$ | 24.3 | $ | 2.4 | ||||
| 2019 |
18.3 | 2.3 | ||||||
| 2020 |
14.0 | 2.2 | ||||||
| 2021 |
9.9 | 0.7 | ||||||
| 2022 |
7.8 | — | ||||||
| Thereafter |
16.2 | — | ||||||
|
|
|
|
|
|||||
| $ | 90.5 | $ | 7.6 | |||||
|
|
|
|
|
|||||
| (1) | Future lease payments are shown gross of the lease restructuring provision, as described in note 20. |
Guarantees
The Company has the following major types of guarantees:
Product Warranties
The Company provides its customers with standard warranties on hardware and software for periods up to 15 months. The following table details the changes in the warranty liability:
| Year Ended December 31, 2017 |
Year Ended December 31, 2016 |
|||||||
| Balance, beginning of year |
$ | 2.5 | $ | 4.1 | ||||
| Increase due to acquisitions |
0.5 | — | ||||||
| Warranty costs paid |
(1.5 | ) | (2.4 | ) | ||||
| Warranties expense |
1.7 | 0.8 | ||||||
|
|
|
|
|
|||||
| Balance, end of year |
$ | 3.2 | $ | 2.5 | ||||
|
|
|
|
|
|||||
Intellectual Property Indemnification Obligations
The Company enters, on a regular basis, into agreements with customers and suppliers that include limited intellectual property indemnification obligations that are customary in the industry. These guarantees generally require the Company to compensate the other party for certain damages and costs incurred as a result of third-party intellectual property claims arising from these transactions. The nature of these intellectual property indemnification obligations prevents the Company from making a reasonable estimate of the maximum potential amount it could be required to pay to its customers and suppliers. Historically, the Company has not made any significant indemnification payments under such agreements and no amount has been accrued in the Consolidated Financial Statements with respect to these guarantees.
Letters of Credit and Guarantees
Letters of credit, financial guarantees and other similar instruments are reviewed regularly, and the results of these reviews are considered in assessing the adequacy of the Company’s reserve for possible credit and guarantee losses. Letters of credit, bank guarantees and other similar instruments amounted to $5.6 as of December 31, 2017 (December 31, 2016 — $6.2). The estimated fair value of letters of credit, bank guarantees and similar instruments, which is equal to the fees paid to obtain the obligations, was not significant as of December 31, 2017 and 2016.
84
Table of Contents
15. CONTINGENCIES
The Company is party to legal proceedings, claims and potential claims arising in the normal course of business. The Company’s management and legal counsel estimate that any monetary liability or financial impact of such claims or potential claims to which the Company might be subject after final adjudication would not be material to the Consolidated Financial Statements. In circumstances where the outcome of the lawsuit is expected to be unfavorable, the Company has recorded a provision for the expected settlement amount. Where the expected settlement amount is a range, the Company has provided for the best estimate within that range. If no amount within the range is more likely, the Company has provided for the minimum amount of the range.
16. COMMON SHARES
Share Capital
At December 31, 2017, there were an unlimited number of common shares authorized and 120.1 million shares issued and outstanding (December 31, 2016 — 122.0 million shares issued and outstanding). The holders of common shares are entitled to one vote per share and are entitled to dividends if and when declared by the Board of Directors.
In March 2017, the Company’s board of directors authorized a common share buyback program. In a filing with the Toronto Stock Exchange (the “TSX”), the TSX has accepted the company’s Notice of Intention to Make a Normal Course Issuer Bid (the “Notice”). Pursuant to the Notice, Mitel may purchase up to 7.8 million Mitel common shares (the “Buyback Program”), representing approximately 10% of its public float. Mitel may purchase its common shares, from time to time, if it believes that the market price of its common shares is attractive and that the purchase would be an appropriate use of corporate funds and in the best interests of the Company. Common shares purchased pursuant to the Buyback Program are cancelled. The Buyback Program commenced on March 9, 2017 and will terminate no later than March 8, 2018.
For the year ended December 31, 2017, Mitel repurchased and cancelled 4.9 million common shares at a total cost of $35.7. For the year ended December 31, 2016, Mitel did not repurchase any of its common shares.
Shareholders’ Agreement
The Company, Francisco Partners GP II Management, LLC and certain of their affiliates (collectively, “the Francisco Group”) and the Matthews Group were parties to a shareholders’ agreement (the “Shareholders’ Agreement”). The Shareholders’ Agreement was terminated on December 6, 2017.
Under the Shareholders’ Agreement, the Francisco Group was entitled to nominate three members to the Board of Directors provided the Francisco Group controlled at least 15% of the outstanding common shares. If the Francisco Group controlled less than 15% but more than 10% of the outstanding common shares, it could nominate two directors and if it controlled less than 10% but more than 5%, it could nominate one director. The Matthews Group was entitled to nominate one member to the Board of Directors provided the Matthews Group controlled at least 5% of the outstanding common shares. In addition, the Francisco Group and the Matthews Group could nominate the Company’s Chief Executive Officer to serve as a member of the Board of Directors, provided the Francisco Group and the Matthews Group each controlled at least 5% of the outstanding common shares. The Matthews Group and Francisco Group also agreed to vote their shares in favor of the election of the other party’s nominees.
The Shareholders’ Agreement also provided that the Company would not take certain significant actions without the approval of the Francisco Group, so long as the Francisco Group controlled greater than 15% of the outstanding common shares.
Equity Incentive Plans
2017 Equity Incentive Plan
In the second quarter of 2017, the 2017 Omnibus Incentive Plan (the “2017 Plan”) was approved by the Company’s shareholders. The 2017 Plan permits grants of stock options, deferred share units, restricted stock units, performance share units and other stock-based awards.
Options granted under the 2017 Plan are generally granted for a fixed number of shares with an exercise price at least equal to the fair market value of the shares at the date of grant. Options granted vest 1/16 over each of the first 16 quarters, and expire seven years after the date of grant. Restricted Stock Units (“RSUs”) granted under the 2017 Plan vest 25% each year over four years. An RSU, once vested, entitles the holder to a Mitel common share issued out of treasury. Performance Share Units (“PSUs”) are convertible into a variable number of Mitel common shares to the extent that a performance target is met at the end of the term of the PSUs.
The Company’s Board of Directors has the discretion to amend general vesting provisions and the term of any award granted under the 2017 Plan, subject to limits contained in the 2017 Plan.
85
Table of Contents
The aggregate number of common shares that may be issued for all purposes pursuant to the 2017 Plan must not exceed 9.0 million common shares. Common shares subject to outstanding awards under the 2017 Plan which lapse, expire or are forfeited or terminated will, subject to plan limitations, again become available for grants under the 2017 Plan.
The number of stock-based awards available for grant under the Company’s 2017 Plan at December 31, 2017 was 7.9 million (December 31, 2016—2.7 million available for grant under the 2014 Equity Incentive Plan).
2014 Equity Incentive Plan
The 2014 Equity Incentive Plan (the “2014 Plan”) permitted grants of stock options, deferred share units, restricted stock units, performance share units and other stock-based awards, generally under similar terms to the 2017 Plan. Upon approval of the 2017 Plan, no further grants under the 2014 Plan could be made, however the 2014 Plan continues to govern outstanding stock options, RSUs and PSUs granted under the 2014 Plan. The Company’s Board of Directors has the discretion to amend general vesting provisions and the term of any award, subject to limits contained in the 2014 Plan.
2006 Equity Incentive Plan
The 2006 Equity Incentive Plan (the “2006 Plan”) permitted grants of stock options, deferred share units, restricted stock units, performance share units and other stock-based awards, generally under similar terms to the 2017 Plan. Upon approval of the 2014 Plan, no further grants under the 2006 Plan could be made, however the 2006 Plan continues to govern outstanding stock options and RSUs granted under the 2006 Plan. The Company’s Board of Directors has the discretion to amend general vesting provisions and the term of any award granted under the 2006 Plan, subject to limits contained in the 2006 Plan.
Stock Option Information
The following is a summary of the Company’s stock option activity:
| Year Ended December 31, 2017 |
Year Ended December 31, 2016 |
Year Ended December 31, 2015 |
||||||||||||||||||||||
| Number of Options |
Weighted Average Exercise Price |
Number of Options |
Weighted Average Exercise Price |
Number of Options |
Weighted Average Exercise Price |
|||||||||||||||||||
| Outstanding options: |
||||||||||||||||||||||||
| Balance, beginning of year |
8.3 | $ | 7.01 | 9.4 | $ | 6.97 | 6.8 | $ | 6.12 | |||||||||||||||
| Granted in the normal course |
0.2 | 6.51 | 1.0 | 7.17 | 1.6 | 9.19 | ||||||||||||||||||
| Granted in connection with the acquisition of Mavenir |
— | — | — | — | 2.5 | 7.50 | ||||||||||||||||||
| Exercised (1) |
(2.2 | ) | 4.81 | (0.5 | ) | 4.55 | (0.8 | ) | 5.14 | |||||||||||||||
| Forfeited |
(0.4 | ) | 8.36 | (0.6 | ) | 8.62 | (0.5 | ) | 7.86 | |||||||||||||||
| Expired |
(1.4 | ) | 8.81 | (1.0 | ) | 7.09 | (0.2 | ) | 7.64 | |||||||||||||||
|
|
|
|
|
|
|
|
|
|
|
|
|
|||||||||||||
| Balance, end of year |
4.5 | $ | 7.41 | 8.3 | $ | 7.01 | 9.4 | $ | 6.97 | |||||||||||||||
|
|
|
|
|
|
|
|
|
|
|
|
|
|||||||||||||
| Number of options exercisable |
3.4 | $ | 7.22 | 5.9 | $ | 6.58 | 5.2 | $ | 6.36 | |||||||||||||||
|
|
|
|
|
|
|
|
|
|
|
|
|
|||||||||||||
| (1) | The total intrinsic value of options exercised during the year ended December 31, 2017 was $6.7 (years ended December 31, 2016 and 2015 — $1.4 and $2.9, respectively). |
86
Table of Contents
The following table summarizes information about the Company’s stock options outstanding and exercisable at December 31, 2017:
| Total outstanding | Total exercisable | |||||||||||||||||||||||
| Exercise Price |
Number of Options |
Weighted- Average Remaining Contractual Life |
Aggregate Intrinsic Value (3) |
Number of Options |
Weighted- Average Remaining Contractual Life |
Aggregate Intrinsic Value (3) |
||||||||||||||||||
| $3.80 |
0.3 | 2.5 years | $ | 1.4 | 0.3 | 2.5 years | $ | 1.4 | ||||||||||||||||
| $7.17 |
0.8 | 5.2 years | 0.8 | 0.4 | 5.2 years | 0.4 | ||||||||||||||||||
| $9.70 |
0.7 | 4.2 years | — | 0.5 | 4.2 years | — | ||||||||||||||||||
| $10.11 |
0.5 | 3.3 years | — | 0.5 | 3.3 years | — | ||||||||||||||||||
| Other in-the-money options (1) |
1.2 | 2.5 years | 4.2 | 1.0 | 2.0 years | 3.9 | ||||||||||||||||||
| Other out-of-the-money options (2) |
1.0 | 4.0 years | — | 0.7 | 3.8 years | — | ||||||||||||||||||
|
|
|
|
|
|
|
|
|
|||||||||||||||||
| 4.5 | $ | 6.4 | 3.4 | $ | 5.7 | |||||||||||||||||||
|
|
|
|
|
|
|
|
|
|||||||||||||||||
| (1) | Other in-the-money options consists of all other remaining options outstanding where the exercise price is below the closing price of the Company’s common shares on December 31, 2017. No individual tranche included has more than 0.5 million options outstanding. The weighted average exercise price of options included in Other in-the-money options was $4.47 per share. |
| (2) | Other out-of-the-money options consists of all other remaining options outstanding where the exercise price is above the closing price of the Company’s common shares on December 31, 2017. No individual tranche included has more than 0.5 million options outstanding. The weighted average exercise price of options included in Other in-the-money options was $9.09 per share. |
| (3) | The aggregate intrinsic value of outstanding and exercisable stock options represents the amount by which the fair value of the common shares exceeds the exercise price of in-the-money options. The amount is based on the fair value of the shares at December 31, 2017 which is assumed to be the price that would have been received by the optionholders had all stock optionholders exercised and sold their options on December 31, 2017. |
Additional information with respect to unvested stock option activity is as follows:
| Year Ended December 31, 2017 |
Year Ended December 31, 2016 |
Year Ended December 31, 2015 |
||||||||||||||||||||||
| Number of Options |
Weighted Average Exercise Price |
Number of Options |
Weighted Average Exercise Price |
Number of Options |
Weighted Average Exercise Price |
|||||||||||||||||||
| Outstanding options: |
||||||||||||||||||||||||
| Unvested, beginning of year |
2.4 | $ | 8.11 | 4.2 | $ | 7.71 | 3.0 | $ | 6.39 | |||||||||||||||
| Granted in the normal course |
0.2 | 6.51 | 1.0 | 7.17 | 1.6 | 9.19 | ||||||||||||||||||
| Granted in connection with the acquisition of Mavenir (note 3) |
— | — | — | — | 2.5 | 7.50 | ||||||||||||||||||
| Vested |
(1.2 | ) | 7.79 | (2.2 | ) | 6.79 | (2.4 | ) | 6.80 | |||||||||||||||
| Forfeited |
(0.4 | ) | 8.36 | (0.6 | ) | 8.59 | (0.5 | ) | 7.86 | |||||||||||||||
|
|
|
|
|
|
|
|
|
|
|
|
|
|||||||||||||
| Unvested, end of year |
1.0 | $ | 8.07 | 2.4 | $ | 8.11 | 4.2 | $ | 7.71 | |||||||||||||||
|
|
|
|
|
|
|
|
|
|
|
|
|
|||||||||||||
The number of options expected to vest in the year ending December 31, 2018 is 0.6 million.
Restricted Stock Unit Information
Restricted stock units (“RSUs”) vest one-quarter annually over 4 years. An RSU, once vested, entitles the holder to a Mitel common share issued out of treasury. Additional information with respect to RSU activity is as follows:
| Year Ended December 31, 2017 |
Year Ended December 31, 2016 |
Year Ended December 31, 2015 |
||||||||||
| Number of RSUs outstanding: |
||||||||||||
| Beginning of year |
3.1 | 2.6 | 0.7 | |||||||||
| Granted |
2.7 | 1.8 | 2.2 | |||||||||
| Exercised |
(0.9 | ) | (0.7 | ) | (0.2 | ) | ||||||
| Forfeited |
(0.7 | ) | (0.6 | ) | (0.1 | ) | ||||||
|
|
|
|
|
|
|
|||||||
| End of year |
4.2 | 3.1 | 2.6 | |||||||||
|
|
|
|
|
|
|
|||||||
87
Table of Contents
The number of RSUs expected to vest in the year ending December 31, 2018 is 1.4 million.
Performance Share Units
In March 2017, the Company granted 0.4 million performance share units (“PSUs”). PSUs are convertible into common stock to the extent that the performance target is met. The performance target for PSUs is a cumulative annual growth rate (“CAGR”) of Mitel stock traded on the NASDAQ stock exchange over the term of the PSU. If the CAGR is less than 10%, then PSUs do not vest. If the CAGR is greater than 25%, the PSUs vest at a ratio of 2 common stock for each PSU. For CAGRs from 10% to 25%, the PSUs vest at ratio of between 0.5 and 2.0 common stocks for each PSU, depending on the CAGR. PSUs have a term of three years. At December 31, 2017, 0.4 million PSUs were outstanding (December 31, 2016 – nil).
Stock-based compensation expense
Stock-based compensation expense for stock options is based on the fair value of the stock options on the date of grant, calculated using the Black-Scholes option-pricing model, which is expensed on a straight-line basis over the vesting period. Assumptions used in the Black-Scholes option-pricing model are summarized as follows:
| Year Ended December 31, 2017 |
Year Ended December 31, 2016 |
Year Ended December 31, 2015 |
||||||||||
| Risk-free interest rate |
1.8 | % | 1.3 | % | 1.5 | % | ||||||
| Dividends |
0.0 | % | 0.0 | % | 0.0 | % | ||||||
| Expected volatility |
51.4 | % | 52.0 | % | 52.0 | % | ||||||
| Expected life of the options |
5 years | 5 years | 5 years | |||||||||
| Weighted average fair value per option |
$ | 2.92 | $ | 3.14 | $ | 4.18 | ||||||
Stock-based compensation expense for RSUs is based on the fair value on the date of grant, using the closing price of the Company’s stock on the day of grant, which is expensed on a straight-line basis over the vesting period.
Stock-based compensation expense for PSUs is based on the fair value on the date of grant, which is expensed on a straight-line basis over the term of the PSU.
Total stock-based compensation expense was $14.4 for the year ended December 31, 2017 (years ended December 31, 2016 and 2015 — $16.8 and $12.8, respectively). As of December 31, 2017, there was $32.0 of unrecognized stock-based compensation expense (December 31, 2016 — $31.8) that is expected to be recognized over a weighted average period of 2.6 years (December 31, 2016 — 2.5 years).
17. PREFERRED SHARES
At December 31, 2017 and December 31, 2016, there were an unlimited number of preferred shares authorized, issuable in series. At December 31, 2017 and December 31, 2016, there were nil preferred shares outstanding.
18. WARRANTS
The following table outlines the carrying value of warrants outstanding:
| December 31, 2017 | December 31, 2016 | |||||||
| Warrants issued in connection with government funding(1) |
$ | 39.1 | $ | 39.1 | ||||
|
|
|
|
|
|||||
| (1) | At December 31, 2017, there were 2.48 million warrants outstanding that were issued in connection with government funding (December 31, 2016 — 2.48 million). The warrants have an exercise price of nil, are exercisable at any time at the option of the holder and have no expiry date. |
88
Table of Contents
19. WEIGHTED AVERAGE COMMON SHARES OUTSTANDING
The following table sets forth the basic and diluted weighted average common shares outstanding for earnings per share calculations as disclosed on the consolidated statements of operations:
| Year Ended December 31, 2017 |
Year Ended December 31, 2016 |
Year Ended December 31, 2015 |
||||||||||
| Weighted average number of common shares outstanding, basic |
120.7 | 121.5 | 113.7 | |||||||||
| Dilutive effect of options |
— | 1.3 | 1.8 | |||||||||
| Dilutive effect of RSUs |
— | 0.2 | — | |||||||||
| Dilutive effect of warrants |
— | 2.5 | 2.5 | |||||||||
|
|
|
|
|
|
|
|||||||
| Weighted average number of common shares outstanding, diluted |
120.7 | 125.5 | 118.0 | |||||||||
|
|
|
|
|
|
|
|||||||
The following securities have been excluded in the computation of diluted earnings per share because to do so would have been anti-dilutive based on the terms of the securities:
| (Average number outstanding, in millions) |
Year Ended December 31, 2017 |
Year Ended December 31, 2016 |
Year Ended December 31, 2015 |
|||||||||
| Stock options |
3.7 | 5.1 | 4.4 | |||||||||
| RSUs |
0.8 | 2.0 | 2.2 | |||||||||
The following securities have been excluded from the diluted weighted average common shares outstanding because they were anti-dilutive based on having a net loss attributable to common shareholders from continuing operations for the following period:
| (Average number outstanding, in millions) |
Year Ended December 31, 2017 |
|||
| Stock options |
2.3 | |||
| Warrants |
2.5 | |||
| RSUs |
3.0 | |||
Additionally, for the year ended December 31, 2017, 0.4 million PSUs, which could potentially dilute earnings per share in the future, were also excluded from the above tables since they were contingently issuable and the conditions for issuance had not been met by the end of the period (year ended December 31, 2016 and 2015 – nil and nil, respectively).
20. SPECIAL CHARGES AND RESTRUCTURING COSTS
Special charges and restructuring costs of $83.4 were recorded in the year ended December 31, 2017. The costs consisted of $46.4 of employee-related charges, $1.3 of facility-reduction related charges, $17.3 of integration-related charges and $18.4 of acquisition-related charges. The employee-related charges consisted of termination and related costs in connection with headcount reductions of approximately 375 people, primarily in North America and Europe. Integration-related charges include professional fees and incidental costs relating to the integration of acquisitions. Acquisition-related charges consisted primarily of legal and advisory fees, including costs incurred relating to the acquisition of ShoreTel, as described in note 3.
Special charges and restructuring costs of $70.8 were recorded in the year ended December 31, 2016. The costs consisted of $20.2 of employee-related charges, $1.6 of facility-reduction related charges, $19.5 of integration-related charges and $29.5 of acquisition-related charges. The employee-related charges consisted of termination and related costs in connection with headcount reductions of approximately 150 people, primarily in North America and Europe. Integration-related charges include professional fees and incidental costs relating to the integration of acquisitions. Acquisition-related charges consisted primarily of legal and advisory fees, including termination payments incurred relating to the terminated acquisition of Polycom. In connection with the termination, the Company received a termination fee of $60.0 from Polycom, which is recorded separately in the consolidated statement of operations and is further described in note 28.
89
Table of Contents
Special charges and restructuring costs of $47.5 were recorded in the year ended December 31, 2015. The costs consisted of $16.4 of employee-related charges, $1.7 of facility-reduction related charges, $16.9 of integration-related charges and $12.5 of acquisition-related charges. The employee-related charges consisted of costs related to headcount reductions of approximately 150 people, primarily in North America and Europe. Facility-reduction related charges consisted primarily of lease termination obligations for facilities, primarily in North America. Integration-related charges primarily consist of professional fees and incidental costs relating to the integration of acquisitions. Acquisition-related charges consisted primarily of legal and advisory fees incurred to close the acquisition of Mavenir, as described in note 3.
At December 31, 2017, the workforce reduction liability of $19.5 and the current portion of the lease termination obligation liability of $3.0 are included in accounts payable and accrued liabilities, with the remaining non-current portion of the lease termination obligation liability of $1.1 included in other non-current liabilities. Employee-related and workforce reduction costs for the years ended December 31, 2017, 2016 and 2015 relate primarily to the Enterprise segment.
The following table summarizes details of the Company’s restructuring liabilities:
| Description |
Workforce Reduction |
Facility- Reduction Related, Including Lease Termination Obligations |
Total | |||||||||
| Balance of provision as of December 31, 2014 |
$ | 15.5 | $ | 7.6 | $ | 23.1 | ||||||
|
|
|
|
|
|
|
|||||||
| Year ended December 31, 2015: |
||||||||||||
| Charges |
16.4 | 1.7 | 18.1 | |||||||||
| Cash payments |
(18.2 | ) | (3.7 | ) | (21.9 | ) | ||||||
|
|
|
|
|
|
|
|||||||
| Balance of provision as of December 31, 2015 |
$ | 13.7 | $ | 5.6 | $ | 19.3 | ||||||
|
|
|
|
|
|
|
|||||||
| Year ended December 31, 2016: |
||||||||||||
| Charges |
20.2 | 1.6 | 21.8 | |||||||||
| Cash payments |
(25.2 | ) | (2.7 | ) | (27.9 | ) | ||||||
|
|
|
|
|
|
|
|||||||
| Balance of provision as of December 31, 2016 |
$ | 8.7 | $ | 4.5 | $ | 13.2 | ||||||
|
|
|
|
|
|
|
|||||||
| Year ended December 31, 2017: |
||||||||||||
| Charges |
46.4 | 1.3 | 47.7 | |||||||||
| Cash payments |
(35.6 | ) | (1.7 | ) | (37.3 | ) | ||||||
|
|
|
|
|
|
|
|||||||
| Balance of provision as of December 31, 2017 |
$ | 19.5 | $ | 4.1 | $ | 23.6 | ||||||
|
|
|
|
|
|
|
|||||||
21. SUPPLEMENTARY CASH FLOW INFORMATION
| Year Ended December 31, 2017 |
Year Ended December 31, 2016 |
Year Ended December 31, 2015 |
||||||||||
| Change in non-cash operating assets and liabilities: |
||||||||||||
| Accounts receivable and sales-type lease receivables |
$ | 34.5 | $ | 13.3 | $ | (20.1 | ) | |||||
| Inventories |
8.3 | 0.4 | (0.3 | ) | ||||||||
| Other current assets |
(2.5 | ) | (13.9 | ) | 14.2 | |||||||
| Other non-current assets |
(6.7 | ) | (1.4 | ) | 5.3 | |||||||
| Accounts payable and accrued liabilities |
(33.3 | ) | 12.3 | (41.9 | ) | |||||||
| Deferred revenue |
9.1 | (2.6 | ) | 18.8 | ||||||||
| Other non-current liabilities |
5.5 | (1.2 | ) | 0.5 | ||||||||
| Change in pension liability |
(5.2 | ) | (3.2 | ) | (1.4 | ) | ||||||
|
|
|
|
|
|
|
|||||||
| $ | 9.7 | $ | 3.7 | $ | (24.9 | ) | ||||||
|
|
|
|
|
|
|
|||||||
| Interest payments |
$ | 22.7 | $ | 36.5 | $ | 26.1 | ||||||
| Income tax payments |
$ | 7.3 | $ | 13.0 | $ | 16.3 | ||||||
| Disclosure of non-cash activities during the period: |
||||||||||||
| Property and equipment additions financed through capital lease |
$ | 0.8 | $ | 8.3 | $ | 4.0 | ||||||
90
Table of Contents
In addition, in April 2015, the Company acquired Mavenir for cash and share consideration, as disclosed in note 3.
22. SEGMENT INFORMATION
The Company’s Chief Executive Officer (“CEO”) has been identified as the chief operating decision maker. The CEO evaluates the performance of the segments and allocates resources based on information provided by the Company’s internal management system. During the third quarter of 2017, in conjunction with the acquisition of ShoreTel, the Company reorganized its business. As a result, the CEO now evaluates performance and allocates resources based on two key business units, Enterprise and Cloud. Therefore, beginning in the third quarter of 2017, the Company reported its financial performance based on the new segments, Enterprise and Cloud, as described below. Prior period amounts have been presented on the same basis.
The primary financial measures of performance of the segments are revenues and gross margin, which includes segment revenues less cost of revenues. The Company does not allocate operating expenses to its segments as management does not use this information to measure the performance of the individual operating segments. In addition, total asset and long-lived asset information by segment is not presented because the CEO does not use such segmented measures to allocate resources and assess performance. The accounting policies of reported segments are the same as those described in the summary of significant accounting policies. Revenue is generally directly attributed to the segments. Cost of revenue is directly charged to the segments in most cases and, in certain cases, on a pro-rata basis based on revenue.
The Enterprise segment sells and supports products and services for premise-based customers. This includes the Company’s premise-based IP and TDM telephony platforms, desktop devices and unified communications and collaboration (“UCC”) and contact center applications that are deployed on the customer’s premise. Premise-based sales are sold as an initial sale of hardware and software, with ongoing recurring revenue from hardware and software maintenance and other managed services that we may also offer.
The Cloud segment sells and supports products that are deployed in a cloud environment and billed on monthly recurring basis. The Cloud segment is comprised of a retail offering and a wholesale offering. The retail cloud offering provides hosted cloud and related services directly to the end user. The Company is typically paid a monthly recurring fee for these services, which include UCC applications, voice and data telecommunications and desktop devices. The wholesale offering, branded Powered by Mitel, enables service providers to provide a range of hosted communications offerings to their end customers. The hosted offering includes hosted PBX, voice and video calling, SIP Trunking, voicemail, call center, audio conferencing and video and web collaboration services. The wholesale cloud offering is also sold to large enterprise customers who run their own data centers in private cloud or hybrid cloud networks with management provided by Mitel, or one of Mitel’s channel partners. Revenue in the wholesale cloud offering is billed as monthly recurring fees.
The following table presents Enterprise product and service, and Cloud recurring revenues and gross margin for the Company’s operating segment:
| Year Ended December 31 | ||||||||||||
| 2017 | 2016 | 2015 | ||||||||||
| Revenues |
||||||||||||
| Enterprise – Product |
$ | 613.6 | $ | 599.2 | $ | 661.3 | ||||||
| Enterprise – Services |
271.3 | 273.0 | 265.0 | |||||||||
|
|
|
|
|
|
|
|||||||
| Total Enterprise revenues |
884.9 | 872.2 | 926.3 | |||||||||
| Cloud – Recurring |
175.7 | 115.4 | 102.4 | |||||||||
| Purchase accounting adjustments(1) |
(1.5 | ) | — | (2.9 | ) | |||||||
|
|
|
|
|
|
|
|||||||
| Total revenues |
$ | 1,059.1 | $ | 987.6 | $ | 1,025.8 | ||||||
|
|
|
|
|
|
|
|||||||
| Gross Margin |
||||||||||||
| Enterprise – Product |
$ | 340.8 | $ | 343.2 | $ | 375.3 | ||||||
| Enterprise – Services |
150.1 | 131.0 | 124.3 | |||||||||
|
|
|
|
|
|
|
|||||||
| Total Enterprise gross margin |
490.9 | 474.2 | 499.6 | |||||||||
| Cloud – Recurring |
89.5 | 57.8 | 48.5 | |||||||||
| Purchase accounting adjustments(1) |
(1.5 | ) | — | (2.9 | ) | |||||||
|
|
|
|
|
|
|
|||||||
| Total gross margin |
$ | 578.9 | $ | 532.0 | $ | 545.2 | ||||||
|
|
|
|
|
|
|
|||||||
91
Table of Contents
| (1) | In accordance with the fair value provisions applicable to the accounting for business combinations, acquired deferred revenue relating to acquisitions is recorded on the opening balance sheet of the acquired company at an amount that is generally lower than the historical carrying value. Although this purchase accounting requirement has no impact on the Company’s business or cash flow, it adversely impacts the Company’s revenue in the reporting periods following the acquisition and has been presented separately. As a result, the Company’s chief operating decision maker reviews and evaluates this segment measure of revenue separately from the Enterprise and Cloud segments. |
Goodwill information by segment is as follows:
| December 31, 2017 |
||||
| Enterprise |
$ | 275.6 | ||
| Cloud |
260.3 | |||
|
|
|
|||
| $ | 535.9 | |||
|
|
|
|||
Geographic Information
The Company reviews revenues by geography as follows:
| • | Americas, consisting of the continents of North America and South America; |
| • | EMEA, consisting of the continent of Europe, including Russia, as well as the Middle East and Africa; |
| • | Asia-Pacific, consisting of the continent of Asia and the pacific region, including Australia and New Zealand. |
Revenues from external customers are attributed to the following countries based on location of the customers:
| Year Ended December 31, 2017 |
Year Ended December 31, 2016 |
Year Ended December 31, 2015 |
||||||||||
| Canada |
$ | 29.0 | $ | 29.9 | $ | 34.1 | ||||||
| United States |
488.6 | 430.0 | 431.6 | |||||||||
| Rest of Americas |
11.4 | 12.2 | 17.4 | |||||||||
|
|
|
|
|
|
|
|||||||
| Americas |
529.0 | 472.1 | 483.1 | |||||||||
|
|
|
|
|
|
|
|||||||
| Germany |
115.0 | 118.5 | 118.3 | |||||||||
| U.K. |
93.9 | 93.3 | 94.4 | |||||||||
| Rest of EMEA |
288.9 | 272.4 | 304.8 | |||||||||
|
|
|
|
|
|
|
|||||||
| EMEA |
497.8 | 484.2 | 517.5 | |||||||||
|
|
|
|
|
|
|
|||||||
| Asia-Pacific |
33.8 | 31.3 | 28.1 | |||||||||
| Purchase price accounting(1) |
(1.5 | ) | — | (2.9 | ) | |||||||
|
|
|
|
|
|
|
|||||||
| $ | 1,059.1 | $ | 987.6 | $ | 1,025.8 | |||||||
|
|
|
|
|
|
|
|||||||
| (1) | In accordance with the fair value provisions applicable to the accounting for business combinations, acquired deferred revenue relating to acquisitions is recorded on the opening balance sheet of the acquired company at an amount that is generally lower than the historical carrying value. Although this purchase accounting requirement has no impact on the Company’s business or cash flow, it adversely impacts the Company’s revenues and gross margin in the reporting periods following the acquisition and has been presented separately. |
Concentrations
The Company sells its products and services to a broad set of enterprises ranging from large, multinational enterprises, to small and mid-sized enterprises. Management believes that the Company is exposed to minimal concentration risk since the majority of its business is conducted with companies in numerous diverse industries. The Company performs periodic credit evaluations of its customers’ financial condition and generally does not require collateral for its accounts receivable. In some cases, the Company will require payment in advance or security in the form of letters of credit or third-party guarantees. As at and for the years ended December 31, 2017, 2016 and 2015 no single customer accounted for more than 10 percent of the Company’s revenues or accounts receivable.
92
Table of Contents
Four independent suppliers manufacture a significant portion of the Company’s products. The Company is not obligated to purchase products from these specific suppliers in any specific quantity, except as the Company outlines in forecasts or orders for products required to be manufactured by these companies. The Company’s supply agreements with these suppliers results in a concentration that, if suddenly eliminated, could have an adverse effect on the Company’s operations. While the Company believes that alternative sources of supply would be available, disruption of its primary sources of supply could create a temporary, adverse effect on product shipments.
23. INCOME TAXES
Details of income taxes are as follows:
| Year Ended December 31, 2017 |
Year Ended December 31, 2016 |
Year Ended December 31, 2015 |
||||||||||
| Income (loss) from continuing operations before income taxes: |
||||||||||||
| Canadian |
$ | 16.7 | $ | 88.9 | $ | 176.2 | ||||||
| Foreign |
(85.3 | ) | (55.2 | ) | (166.6 | ) | ||||||
|
|
|
|
|
|
|
|||||||
| $ | (68.6 | ) | $ | 33.7 | $ | 9.6 | ||||||
|
|
|
|
|
|
|
|||||||
| Current income tax recovery (expense): |
||||||||||||
| Canadian |
$ | 0.1 | $ | (0.1 | ) | $ | (1.1 | ) | ||||
| Foreign |
(6.3 | ) | (15.6 | ) | (14.5 | ) | ||||||
|
|
|
|
|
|
|
|||||||
| $ | (6.2 | ) | $ | (15.7 | ) | $ | (15.6 | ) | ||||
|
|
|
|
|
|
|
|||||||
| Deferred income tax recovery (expense): |
||||||||||||
| Canadian |
$ | (2.6 | ) | $ | (14.2 | ) | $ | (3.5 | ) | |||
| Foreign |
29.1 | 31.2 | 16.0 | |||||||||
|
|
|
|
|
|
|
|||||||
| $ | 26.5 | $ | 17.0 | $ | 12.5 | |||||||
|
|
|
|
|
|
|
|||||||
The income tax recovery (expense) reported differs from the amount computed by applying the Canadian rates to the income (loss) before income taxes. The reasons for these differences and their tax effects are as follows:
| Year Ended December 31, 2017 |
Year Ended December 31, 2016 |
Year Ended December 31, 2015 |
||||||||||
| Expected tax rate |
26.5 | % | 26.5 | % | 26.5 | % | ||||||
|
|
|
|
|
|
|
|||||||
| Expected tax recovery (expense) |
$ | 18.2 | $ | (8.9 | ) | $ | (2.5 | ) | ||||
| Foreign tax rate differences |
9.0 | 2.1 | 4.4 | |||||||||
| Net change in valuation allowance on deferred tax assets |
(9.5 | ) | 3.2 | 2.5 | ||||||||
| Permanent differences |
6.0 | (5.2 | ) | (2.7 | ) | |||||||
| Revaluation of U.S. tax due to U.S. tax reform |
2.9 | — | — | |||||||||
| Tax credits and other adjustments |
(6.3 | ) | 10.1 | (4.8 | ) | |||||||
|
|
|
|
|
|
|
|||||||
| Income tax recovery (expense) |
$ | 20.3 | $ | 1.3 | $ | (3.1 | ) | |||||
|
|
|
|
|
|
|
|||||||
On December 22, 2017, the U.S. Tax Cuts and Jobs Act of 2017 (“the Act”) was signed into legislation. The Act includes a broad range of legislative changes including a reduction of the U.S. federal corporate income tax rate from 35% to 21% effective January 1, 2018, limitations on the deductibility of interest and 100% expensing of qualified property. As a result of the Act being enacted during 2017, the Company is required to revalue its U.S. deferred tax assets and liabilities based on the new 21% tax rate. The Company has recognized $2.9 of income tax recovery in 2017 as a result of the revaluation of its US deferred income tax assets and deferred income tax liabilities.
93
Table of Contents
As discussed above, the Company has provisionally revalued all of its U.S. deferred tax assets and liabilities based on the rates that they are expected to reverse at in the future, which is generally 21% for U.S. federal tax purposes. The December 31, 2017 balances of deferred tax assets and deferred tax liabilities that have been revalued are $88.7 and $95.4, respectively. The Company is still analyzing certain aspects of the Act, which could potentially affect the measurement of these balances or potentially give rise to new deferred tax amounts. Further adjustments, if any, will be recorded by the Company during the measurement period in 2018.
The tax effect of components of the deferred tax assets and liabilities are as follows:
| December 31, 2017 |
December 31, 2016 |
|||||||
| Assets (liabilities): |
||||||||
| Net operating loss and credit carryforwards |
$ | 177.4 | $ | 101.3 | ||||
| Capital loss carryforwards |
42.3 | 69.0 | ||||||
| Allowance for doubtful accounts |
2.7 | 1.9 | ||||||
| Inventories |
3.3 | 3.5 | ||||||
| Restructuring and other provisions |
9.7 | 18.0 | ||||||
| Pension liability |
20.5 | 25.8 | ||||||
| Revenue recognition |
17.1 | 21.9 | ||||||
| Intangibles |
(75.1 | ) | 15.8 | |||||
| Long-term debt and other |
0.4 | — | ||||||
| Lease obligations |
13.5 | 13.7 | ||||||
| Property and equipment |
(0.7 | ) | 0.6 | |||||
|
|
|
|
|
|||||
| Total gross deferred tax assets net of total deferred tax liabilities |
211.1 | 271.5 | ||||||
|
|
|
|
|
|||||
| Valuation allowance |
(97.1 | ) | (96.3 | ) | ||||
|
|
|
|
|
|||||
| Net deferred tax assets |
$ | 114.0 | $ | 175.2 | ||||
|
|
|
|
|
|||||
The Company updates its assessment of the realizability of its deferred tax assets at each reporting period. At December 31, 2017, as a result of uncertainty regarding the future utilization of certain deferred tax assets, there is a valuation allowance of $97.1 against deferred tax assets primarily in the United Kingdom and United States (December 31, 2016 — $96.3). Future changes in estimates of taxable income could result in a significant change to the valuation allowance.
For the years ended December 31, 2017, 2016 and 2015, there were no significant changes to the assessment of the realizability of the Company’s deferred tax assets.
The Company had the following tax-effected loss carryforwards and tax credits:
| December 31, 2017 | ||||||||
| Year of Expiry |
Tax Losses |
Tax Credits |
||||||
| 2018 |
$ | 5.1 | $ | 0.9 | ||||
| 2019 |
5.7 | 1.1 | ||||||
| 2020 |
0.4 | 1.2 | ||||||
| 2021-2034 |
76.5 | 71.7 | ||||||
| Indefinite |
3.3 | 53.8 | ||||||
|
|
|
|
|
|||||
| Total |
$ | 91.0 | $ | 128.7 | ||||
|
|
|
|
|
|||||
These tax loss carryforwards primarily relate to operations in the U.S. and France. Tax credit carryforwards primarily relate to operations in the U.S. and Canada. The U.S. has an annual restriction on the utilization of tax-effected loss carryforwards and tax credits of $26.7.
The Company operates in multiple jurisdictions throughout the world and its returns are subject to ongoing examinations by certain taxing authorities in those jurisdictions. The Company regularly assesses the status of these examinations and the potential for adverse outcomes to determine the adequacy of the provisions for income taxes. The Company believes that it has adequately provided for tax adjustments that are probable as a result of any ongoing or future examinations.
94
Table of Contents
The Company has undistributed earnings of its foreign subsidiaries which are considered to be indefinitely reinvested and accordingly no provision for income taxes has been provided. The determination of the amount of unrecognized deferred income tax liability for undistributed earnings is not practicable. If circumstances change and it becomes apparent that some or all of the undistributed earnings of the Company’s foreign subsidiaries will be remitted to a parent company, the Company will record a tax liability.
Uncertain Tax Positions
The following table reconciles the activity related to the Company’s unrecognized tax benefits, which are included in other non-current liabilities in the consolidated balance sheets:
| Year Ended December 31, 2017 |
Year Ended December 31, 2016 |
|||||||
| Opening balance |
$ | 21.2 | $ | 19.0 | ||||
| Increase related to current year tax positions |
10.1 | 4.8 | ||||||
| Increase due to acquisitions |
7.2 | — | ||||||
| Reductions due to lapse in statute of limitations |
(1.2 | ) | (1.4 | ) | ||||
| Settlements |
(0.4 | ) | (1.3 | ) | ||||
| Other, including effect of foreign exchange |
1.0 | 0.1 | ||||||
|
|
|
|
|
|||||
| Closing balance(1) |
$ | 37.9 | $ | 21.2 | ||||
|
|
|
|
|
|||||
| (1) | At December 31, 2017 and 2016, $20.5 and $9.5, respectively of the closing unrecognized tax benefits are recorded net against deferred tax assets. |
The amount of unrecognized tax benefits at December 31, 2017 that would affect the effective tax rate, if recognized, was $11.6 (December 31, 2016 — $11.7).
The Company recognizes any interest and penalties related to unrecognized tax benefits in income tax expense. As of December 31, 2017, in addition to the unrecognized tax benefits above, the Company has a balance of $3.9 (December 31, 2016 — $3.1) for the potential payment of interest and penalties. For the year ended December 31, 2017, the Company expensed $1.2 (years ended December 31, 2016 and 2015 — $0.8 and $0.7, respectively) for the potential payment of interest and penalties.
The Company routinely engages in discussions and negotiations with tax authorities regarding tax matters in various jurisdictions throughout the year. The Company believes it is reasonably possible that certain federal, foreign, and state tax matters may be concluded in the next 12 months. The Company estimates that the unrecognized tax benefits inclusive of interest at December 31, 2017 are expected to be reduced by approximately $1.4 in the next 12 months.
The Company or its subsidiaries file income tax returns in a significant number of countries. These tax returns are subject to examination by local taxing authorities. The following summarizes the open years by major jurisdiction: Canada — 2011 to 2017 and for specific types of transactions from 2011 to 2012; the U.S. — 2014 to 2017; Germany — 2014 to 2017; France — 2014 to 2017; Sweden — 2011 to 2017; Switzerland — 2012 to 2017; and the U.K. — 2011 to 2017.
At December 31, 2017, the Company is presently under audit in France for the 2011 tax year, Canada for the 2011 through 2015 tax years and in the U.S. for 2013 and 2016. The resolution of tax matters in these jurisdictions is not expected to be material to the Consolidated Financial Statements. During the year, the Company settled a tax audit in Italy, which did not have a material impact on the Consolidated Financial Statements.
24. PENSION PLANS
The Company maintains defined contribution pension plans or defined benefit plans that cover a significant portion of its employees.
Defined Contribution Plans
The Company contributes to defined contribution pension plans on the basis of the percentage specified in each plan. The costs of the defined contribution plans are expensed as incurred. For the year ended December 31, 2017, the Company made contributions to these plans of $12.8 (years ended December 31, 2016 and 2015 — $12.1 and $11.9, respectively).
95
Table of Contents
Defined Benefit Plans
Description of defined benefit plans
The Company’s projected benefit obligation and plan assets, by defined benefit plan, at December 31, 2017 were as follows:
| U.K. Plan | Switzerland Plan | All Other | Total | |||||||||||||
| Projected benefit obligation |
$ | 292.2 | $ | 99.1 | $ | 26.3 | $ | 417.6 | ||||||||
| Plan assets |
206.4 | 91.1 | — | 297.5 | ||||||||||||
|
|
|
|
|
|
|
|
|
|||||||||
| Pension liability |
$ | 85.8 | $ | 8.0 | $ | 26.3 | $ | 120.1 | ||||||||
|
|
|
|
|
|
|
|
|
|||||||||
The Company’s projected benefit obligation and plan assets, by defined benefit plan, at December 31, 2016 were as follows:
| U.K. Plan | Switzerland Plan | All Other | Total | |||||||||||||
| Projected benefit obligation |
$ | 269.3 | $ | 110.9 | $ | 24.2 | $ | 404.4 | ||||||||
| Plan assets |
170.6 | 88.3 | — | 258.9 | ||||||||||||
|
|
|
|
|
|
|
|
|
|||||||||
| Pension liability |
$ | 98.7 | $ | 22.6 | $ | 24.2 | $ | 145.5 | ||||||||
|
|
|
|
|
|
|
|
|
|||||||||
U.K. Plan
The Company operates a partially funded defined benefit plan in the U.K. (“U.K. Plan”), which was closed to new members in 2001 and was closed to new service in November 2012.
Switzerland Plan
The Company operates a partially funded multiple-employer pension plan in Switzerland (“Switzerland Plan”). Under the Switzerland Plan, retirees generally benefit from the receipt of a perpetual annuity at retirement based on an accrued value at the date of retirement. The accrued value is related to the actual returns on contributions during the working period. As the plan is a multiple-employer plan, the Consolidated Financial Statements include the Company’s pro-rata share of assets, projected benefit obligation and pension benefit cost.
Other
The Company operates unfunded defined benefit plans related to France, Italy and Germany (“France Plan”, “Italy Plan” and “Germany Plan”, respectively). Under the France Plan and Italy Plan, retirees generally benefit from a lump sum payment upon retirement or departure. Under the Germany Plan, retirees generally benefit from the receipt of a perpetual annuity at retirement, based on their years of service and ending salary.
The defined benefit plan disclosures below are provided in aggregate for all defined benefit plans, unless otherwise noted.
Plan assets and projected benefit obligation information
The change in aggregate projected benefit obligation and plan assets was as follows:
| Year Ended December 31, 2017 |
Year Ended December 31, 2016 |
Year Ended December 31, 2015 |
||||||||||
| Change in projected benefit obligation: |
||||||||||||
| Benefit obligation at beginning of year |
$ | 404.4 | $ | 392.2 | $ | 406.2 | ||||||
| Service cost |
2.2 | 2.6 | 3.3 | |||||||||
| Interest cost |
8.7 | 10.5 | 11.5 | |||||||||
| Employee contributions |
1.3 | 1.6 | 1.9 | |||||||||
| Actuarial loss (gain) |
(12.2 | ) | 69.9 | (8.0 | ) | |||||||
| Benefits paid |
(8.7 | ) | (9.0 | ) | (8.5 | ) | ||||||
| Plan curtailment |
(4.0 | ) | (4.2 | ) | (0.3 | ) | ||||||
| Plan amendment |
(4.3 | ) | — | — | ||||||||
| Settlements |
(4.2 | ) | (2.9 | ) | — | |||||||
| Foreign exchange |
34.4 | (56.3 | ) | (13.9 | ) | |||||||
|
|
|
|
|
|
|
|||||||
| Benefit obligation at end of year |
$ | 417.6 | $ | 404.4 | $ | 392.2 | ||||||
|
|
|
|
|
|
|
|||||||
96
Table of Contents
| Year Ended December 31, 2017 |
Year Ended December 31, 2016 |
Year Ended December 31, 2015 |
||||||||||
| Change in plan assets: |
||||||||||||
| Fair value of plan assets at beginning of year |
$ | 258.9 | $ | 265.6 | $ | 270.1 | ||||||
| Actual return on plan assets |
19.8 | 32.1 | 2.3 | |||||||||
| Employer contributions |
8.5 | 7.3 | 7.1 | |||||||||
| Employee contributions |
1.3 | 1.6 | 1.9 | |||||||||
| Benefits paid |
(8.4 | ) | (8.7 | ) | (8.2 | ) | ||||||
| Settlements |
(4.4 | ) | (3.2 | ) | — | |||||||
| Foreign exchange |
21.8 | (35.8 | ) | (7.6 | ) | |||||||
|
|
|
|
|
|
|
|||||||
| Fair value of plan assets at end of year |
$ | 297.5 | $ | 258.9 | $ | 265.6 | ||||||
|
|
|
|
|
|
|
|||||||
| Net pension liability |
$ | 120.1 | $ | 145.5 | $ | 126.6 | ||||||
|
|
|
|
|
|
|
|||||||
97
Table of Contents
The following table provides the Company’s aggregate accumulated benefit obligation:
| December 31, 2017 |
December 31, 2016 |
December 31, 2015 |
||||||||||
| Accumulated benefit obligation |
410.5 | 395.2 | 380.8 | |||||||||
Periodic benefit cost
The aggregate net periodic benefit cost was as follows:
| Year Ended December 31, 2017 |
Year Ended December 31, 2016 |
Year Ended December 31, 2015 |
||||||||||
| Current service cost — defined benefit |
$ | 2.2 | $ | 2.6 | $ | 3.3 | ||||||
| Interest cost |
8.7 | 10.5 | 11.5 | |||||||||
| Expected return on plan assets |
(9.3 | ) | (10.3 | ) | (10.9 | ) | ||||||
| Curtailment and settlement loss (gain), net of unrecognized actuarial loss |
(1.2 | ) | 0.2 | (0.3 | ) | |||||||
| Recognized actuarial loss |
3.4 | 2.2 | 2.1 | |||||||||
|
|
|
|
|
|
|
|||||||
| Net periodic defined benefit cost |
$ | 3.8 | $ | 5.2 | $ | 5.7 | ||||||
|
|
|
|
|
|
|
|||||||
Assumptions
The following assumptions were used to determine the periodic pension expense for the U.K. Plan:
| Year Ended December 31, 2017 |
Year Ended December 31, 2016 |
Year Ended December 31, 2015 |
||||||||||
| Discount rate |
2.70 | % | 3.95 | % | 3.70 | % | ||||||
| Inflation rate |
3.25 | % | 3.15 | % | 3.00 | % | ||||||
| Investment returns assumption |
4.15 | % | 5.15 | % | 4.85 | % | ||||||
The following assumptions were used to determine the net present value of the projected pension obligation for the U.K. Plan:
| December 31, 2017 |
December 31, 2016 |
December 31, 2015 |
||||||||||
| Discount rate |
2.55 | % | 2.70 | % | 3.95 | % | ||||||
| Inflation rate |
3.20 | % | 3.25 | % | 3.15 | % | ||||||
| (1) | As a result of the U.K. Plan’s November 2012 pension curtailment, members no longer earn benefits for current service and therefore the compensation rate increase and average remaining service life are not factors in determining the net present value of accrued pension benefits. |
The following assumptions were used to determine the periodic pension expense for the Switzerland Plan:
| Year Ended December 31, 2017 |
Year Ended December 31, 2016 |
Year Ended December 31, 2015 |
||||||||||
| Discount rate |
0.60 | % | 0.85 | % | 1.20 | % | ||||||
| Inflation rate |
1.00 | % | 1.00 | % | 1.40 | % | ||||||
| Investment returns assumption |
2.00 | % | 2.30 | % | 2.50 | % | ||||||
98
Table of Contents
The following assumptions were used to determine the net present value of the projected pension obligation for the Switzerland Plan:
| Year Ended December 31, 2017 |
Year Ended December 31, 2016 |
Year Ended December 31, 2015 |
||||||||||
| Discount rate |
0.60 | % | 0.60 | % | 0.85 | % | ||||||
| Inflation rate |
1.00 | % | 1.00 | % | 1.00 | % | ||||||
| Compensation increase rate |
1.50 | % | 1.50 | % | 1.50 | % | ||||||
| Average remaining service life of employees |
10 years | 10 years | 11 years | |||||||||
Estimated future benefit payments
The table below reflects the total benefits expected to be paid in each of the next five years and in the aggregate for the subsequent five years.
| Benefit Payments |
||||
| 2018 |
9.2 | |||
| 2019 |
9.2 | |||
| 2020 |
9.5 | |||
| 2021 |
9.8 | |||
| 2022 |
10.5 | |||
| 2023-2027 |
55.9 | |||
Contributions
The Company expects to make annual employer contributions of $7.4 (£5.5) to fund the U.K. Plan deficit in 2018 and 2019. The amount of annual employer contributions required to fund the pension deficit is determined every three years in accordance with U.K. regulations. The Company expects to make employer contributions of $1.2 to fund the Switzerland Plan in 2018.
Plan assets
The Company’s target allocation and actual pension plan asset allocation by asset category for the U.K Plan were as follows:
| December 31, 2017 Actual |
December 31, 2017 Target (1) |
December 31, 2016 Actual |
December 31, 2016 Target (1) |
|||||||||||||
| Cash |
2 | % | 0 | % | 2 | % | 0 | % | ||||||||
| Equities |
62 | % | 58 | % | 64 | % | 58 | % | ||||||||
| Debt securities |
36 | % | 42 | % | 34 | % | 42 | % | ||||||||
| (1) | Under the current statement of investment principles of the plan, the target allocation includes a 25% allocation to liability-driven investments (“LDI” funds) and 30% to diversified target return funds. These allocations have been assigned to the equity and debt security targets based on the investments held at December 31, 2017 and December 31, 2016. |
The Company’s target allocation and actual pension plan asset allocation by asset category for the Switzerland Plan were as follows:
| December 31, 2017 Actual |
December 31, 2017 Target |
December 31, 2016 Actual |
December 31, 2016 Target |
|||||||||||||
| Cash |
13 | % | 5 | % | 8 | % | 2 | % | ||||||||
| Debt securities |
18 | % | 27 | % | 20 | % | 32 | % | ||||||||
| Real estate |
34 | % | 37 | % | 42 | % | 40 | % | ||||||||
| Equities |
27 | % | 24 | % | 23 | % | 20 | % | ||||||||
| Other |
8 | % | 7 | % | 7 | % | 6 | % | ||||||||
99
Table of Contents
The investment objectives of the pension portfolio of assets are designed to generate returns that will enable the fund to meet its future obligations. The performance benchmark for the investment managers is to earn in excess of the index return in those asset categories, which are actively managed. In setting the overall expected rate of return, the various percentages of assets held in each asset class together with the investment return expected from that class are taken into account. For cash and bonds, the rate used is that derived from an appropriate index at the valuation date. For equities and real estate, a model is used based on historical outperformance compared to bonds. For the year ended December 31, 2017, the assumption of equity outperformance compared to bonds was 3.5% (years ended December 31, 2016 and 2015 — 3.5% and 3.5%, respectively) and the assumption of real estate outperformance compared to bonds was 2.0% (years ended December 31, 2016 and 2015 – 2.0% and 2.0%, respectively).
The following table discloses the major category of fair value (as described in note 26):
| Fair Value Measurement at December 31, 2017 | ||||||||||||||||
| Quoted Price in Active Markets for Identical Instruments |
Significant Other Observable Inputs |
Significant Unobservable Inputs |
Total | |||||||||||||
| Level 1 | Level 2 | Level 3 | ||||||||||||||
| Assets |
||||||||||||||||
| Cash |
$ | 16.7 | $ | — | $ | — | $ | 16.7 | ||||||||
| Equities |
— | 151.4 | — | 151.4 | ||||||||||||
| Bonds |
— | 91.1 | — | 91.1 | ||||||||||||
| Real estate |
— | — | 31.0 | 31.0 | ||||||||||||
| Other |
— | — | 7.3 | 7.3 | ||||||||||||
|
|
|
|
|
|
|
|
|
|||||||||
| $ | 16.7 | $ | 242.5 | $ | 38.3 | $ | 297.5 | |||||||||
|
|
|
|
|
|
|
|
|
|||||||||
| Fair Value Measurement at December 31, 2016 | ||||||||||||||||
| Quoted Price in Active Markets for Identical Instruments |
Significant Other Observable Inputs |
Significant Unobservable Inputs |
Total | |||||||||||||
| Level 1 | Level 2 | Level 3 | ||||||||||||||
| Assets |
||||||||||||||||
| Cash |
$ | 11.3 | $ | — | $ | — | $ | 11.3 | ||||||||
| Equities |
— | 129.3 | — | 129.3 | ||||||||||||
| Bonds |
— | 75.0 | — | 75.0 | ||||||||||||
| Real estate |
— | — | 37.1 | 37.1 | ||||||||||||
| Other |
— | — | 6.2 | 6.2 | ||||||||||||
|
|
|
|
|
|
|
|
|
|||||||||
| $ | 11.3 | $ | 204.3 | $ | 43.3 | $ | 258.9 | |||||||||
|
|
|
|
|
|
|
|
|
|||||||||
25. FOREIGN CURRENCY, CREDIT AND INTEREST RATE RISK
Foreign currency risk
The Company operates globally, and therefore incurs expenses in currencies other than its various functional currencies and its U.S. dollar reporting currency. The Company has used, and may use in the future, foreign currency forward contracts to hedge the fair value of certain assets and liabilities as well as to hedge likely future cash flows denominated in a currency other than the functional currency of the entity. The Company does not enter into forward contracts for speculative purposes.
Fair value hedging
The Company has used, and may use in the future, foreign currency forward contracts to minimize the short-term impact of currency fluctuations on foreign currency receivables, payables and intercompany balances. Foreign currency contracts used to hedge the fair value of foreign currency receivables, payables and intercompany balances are recorded at fair value, with changes in the fair value recorded as other income (expense) in the consolidated statements of operations. At December 31, 2017 and 2016, all of the Company’s outstanding forward contracts used for fair value hedging had a term of one month or less.
100
Table of Contents
At December 31, 2017, to hedge the fair value of certain assets and liabilities, the Company held forward contracts to buy Canadian dollars, Swedish kronor and U.S. dollars at fixed rates on a notional amount of $7.5, $2.2, and $53.6 U.S. dollars, respectively and to sell Australian dollars, Euros, Swiss francs, British pounds and Norwegian kroner at fixed rates on a notional amount of $2.2, $17.2, $34.9, $6.5 and $2.3 U.S. dollars, respectively. At December 31, 2017, the Company had a net unrealized loss on fair value adjustments on the outstanding forward contracts used for fair value hedging of $0.5.
At December 31, 2016, to hedge the fair value of certain assets and liabilities, the Company held forward contracts to buy Canadian dollars, Indian rupee, Indonesia rupiah and U.S. dollars at fixed rates on a notional amount of $7.8, $7.4, $3.8 and $81.4 U.S. dollars, respectively and to sell Australian dollars, Euros, Swiss francs, Singapore dollars and Swedish kronor at fixed rates on a notional amount of $8.4, $54.8, $10.2, $10.3 and $16.7 U.S. dollars, respectively. At December 31, 2016, the Company had a net unrealized loss on fair value adjustments on the outstanding forward contracts used for fair value hedging of $0.2.
Cash flow hedging
The Company has used, and may use in the future, foreign currency forward contracts to hedge probable future cash flows. Cash flow hedges are assessed for effectiveness at the time of inception and again at each reporting period. Foreign currency forward contracts that are assessed as effective are recorded at fair value at each reporting period, with changes in the fair value recorded through other comprehensive income (loss) in the consolidated statements of operations, net of tax. When foreign currency forward contracts are settled, the unrealized gain or loss is removed from accumulated other comprehensive income (loss) and recorded as an increase or decrease to the hedged transaction.
For the years ended December 31, 2017, 2016 and 2015, the Company did not enter into any forward contracts for cash flow hedging purposes.
Credit risk
The Company’s financial assets that are exposed to credit risk consist primarily of cash and cash equivalents, restricted cash, accounts receivable, other receivables, sales-type lease receivables, sold rental payments remaining unbilled, and assets held by the defined benefit pension plan. Cash is generally held in banks with an investment grade rating. Cash equivalents are invested in government and commercial paper with investment grade credit rating. The Company is exposed to normal credit risk from customers. However, the Company has a large number of diverse customers to minimize concentrations of credit risk. As at and for the years ended December 31, 2017, 2016 and 2015 no single customer accounted for more than 10 percent of the Company’s revenues or accounts receivable.
Interest rate risk
As described in note 13, the Company is exposed to interest rate risk primarily on its credit facilities which bear interest at LIBOR. As a result, the Company is exposed to changes in interest rates. The Company periodically reviews its exposure to interest rate risk and determines what actions, if any, should be taken to mitigate the risk.
In addition, the Company’s defined benefit plans, as described in note 24, are exposed to changes in interest rate risk through their investment in bonds and the discount rate assumptions.
The Company is not exposed to any other significant interest rate risk due to the short-term maturity of its monetary assets and current liabilities. The Company’s sales-type lease receivables have fixed future cash flows and are therefore not exposed to significant interest rate risk.
26. FAIR VALUE MEASUREMENTS
The Company’s financial assets and liabilities carried at fair value are measured using one of the following three categories:
Level 1: Quoted market prices in active markets for identical assets or liabilities.
Level 2: Observable market based inputs or unobservable inputs that are corroborated by market data.
Level 3: Unobservable inputs that are not corroborated by market data.
101
Table of Contents
Assets/Liabilities Measured at Fair Value on a Recurring Basis
The Company’s cash equivalents, as described in note 2, are valued using the category Level 2. The Company does not have any other significant financial assets or liabilities measured at fair value on a recurring basis, other than the investments held by defined benefit pension plans, as described in note 24.
Fair Value of Financial Instruments
The Company’s financial instruments include cash and cash equivalents, restricted cash, accounts receivable, accounts payable, amounts due to (from) related parties, net investment in sales-type leases and long-term debt. Due to the short-term maturity of cash, restricted cash, accounts receivable, accounts payable and amounts due to (from) related parties, the carrying value of these instruments is a reasonable estimate of their fair value. At December 31, 2017, the fair value of the term loan, as described in note 13, was approximately 100% of the principal balance.
27. OTHER INCOME, NET
Other income for the year ended December 31, 2017 includes a foreign exchange loss of $2.2 (years ended December 31, 2016 and 2015 — gains of $1.9 and $18.8, respectively). The foreign exchange gain for the year ended December 31, 2015 related primarily to intercompany balances and was offset by foreign currency translation adjustments recorded in other comprehensive loss, resulting in no significant net economic effect to the Company.
28. INCOME FROM TERMINATION FEE RECEIVED
On April 15, 2016, Mitel and Polycom, Inc. (“Polycom”) (NYSE:PLCM) entered into a definitive merger agreement under which Mitel agreed to acquire all of the outstanding shares of Polycom common stock in a cash and stock transaction. On July 7, 2016, Polycom’s board of directors notified Mitel that it had received a binding offer from a third party to acquire Polycom and that Polycom’s board of directors concluded that such offer constituted a “Company Superior Proposal” under its merger agreement with Mitel. Later on July 7, 2016, Mitel waived its right to renegotiate the consideration payable to Polycom stockholders under the merger agreement. On July 8, 2016, Polycom paid Mitel a termination fee of $60.0 and the merger agreement was terminated. The termination fee has been recorded as Income from Termination Fee Received on the consolidated statement of operations.
29. QUARTERLY FINANCIAL DATA (UNAUDITED)
The following table summarizes the Company’s information on total revenue, gross margin, net income (loss) and earnings per share by quarter for the fiscal years ended December 31, 2017 and 2016. This data was derived from the Company’s unaudited consolidated financial statements.
| Q1 2016 |
Q2 2016 |
Q3 2016 |
Q4 2016 |
Q1 2017 |
Q2 2017 |
Q3 2017(1) |
Q4 2017(1) |
|||||||||||||||||||||||||
| (in millions, except per share data) | ||||||||||||||||||||||||||||||||
| Revenue |
$ | 233.0 | $ | 260.3 | $ | 234.5 | $ | 259.8 | $ | 223.1 | $ | 238.6 | $ | 241.5 | $ | 355.9 | ||||||||||||||||
| Gross margin |
123.8 | 143.2 | 124.7 | 140.3 | 119.1 | 129.5 | 133.0 | 197.3 | ||||||||||||||||||||||||
| Net income (loss) from continuing operations |
(11.8 | ) | (0.9 | ) | 33.8 | 13.9 | (19.7 | ) | (0.1 | ) | (26.8 | ) | (1.7 | ) | ||||||||||||||||||
| Net income (loss) from discontinued operations |
(10.6 | ) | (9.9 | ) | (8.7 | ) | (223.1 | ) | (1.4 | ) | — | — | — | |||||||||||||||||||
| Net income (loss) |
(22.4 | ) | (10.8 | ) | 25.1 | (209.2 | ) | (21.1 | ) | (0.1 | ) | (26.8 | ) | (1.7 | ) | |||||||||||||||||
| Earnings per share – diluted |
(0.19 | ) | (0.09 | ) | 0.20 | (1.66 | ) | (0.17 | ) | — | (0.23 | ) | (0.01 | ) | ||||||||||||||||||
| (1) | Includes the operations of ShoreTel from date of acquisition of September 25, 2017, as disclosed in note 3 to the Consolidated Financial Statements. |
102
Table of Contents
VALUATION AND QUALIFYING ACCOUNTS
AS OF DECEMBER 31, 2017
(in U.S. dollars, millions)
| Description |
Balance, Beginning of Year |
Charged to expenses |
Other (1) | Deductions | Balance, End of Year |
|||||||||||||||
| Year Ended December 31, 2015 |
||||||||||||||||||||
| Allowance for doubtful accounts, excluding amounts related to lease receivables |
$ | 12.0 | $ | 4.0 | $ | — | $ | (2.2 | ) | $ | 13.8 | |||||||||
| Allowance for sales-type leases and lease recourse liability |
$ | 4.3 | $ | — | $ | — | $ | (0.6 | ) | $ | 3.7 | |||||||||
| Provision for excess and obsolete inventory |
$ | 5.4 | $ | 1.9 | $ | — | $ | (1.0 | ) | $ | 6.3 | |||||||||
| Year Ended December 31, 2016 |
||||||||||||||||||||
| Allowance for doubtful accounts, excluding amounts related to lease receivables |
$ | 13.8 | $ | 3.1 | $ | — | $ | (6.1 | ) | $ | 10.8 | |||||||||
| Allowance for sales-type leases and lease recourse liability |
$ | 3.7 | $ | (0.2 | ) | $ | — | $ | (0.8 | ) | $ | 2.7 | ||||||||
| Provision for excess and obsolete inventory |
$ | 6.3 | $ | 3.0 | $ | — | $ | (0.8 | ) | $ | 8.5 | |||||||||
| Year Ended December 31, 2017 |
||||||||||||||||||||
| Allowance for doubtful accounts, excluding amounts related to lease receivables |
$ | 10.8 | $ | 5.6 | $ | 0.4 | $ | — | $ | 16.8 | ||||||||||
| Allowance for sales-type leases and lease recourse liability |
$ | 2.7 | $ | (0.3 | ) | $ | — | $ | (0.1 | ) | $ | 2.3 | ||||||||
| Provision for excess and obsolete inventory |
$ | 8.5 | $ | 3.2 | $ | — | $ | — | $ | 11.7 | ||||||||||
| (1) | Primarily relates to foreign exchange |
103
Table of Contents
| Item 9. | Changes in and Disagreements with Accountants on Accounting and Financial Disclosure |
None.
| Item 9A. | Controls and Procedures |
Disclosure Controls and Procedures
Our management carried out an evaluation, with the participation of the CEO and Chief Financial Officer, or CFO, of the effectiveness of our disclosure controls and procedures as of December 31, 2017. Based upon that evaluation, our CEO and CFO concluded that our disclosure controls and procedures were effective to provide reasonable assurance that information required to be disclosed by us in reports that we file or submit under the Exchange Act, is recorded, processed, summarized and reported, within the time period specified in the rules and forms of the SEC.
For purposes of this section, the term disclosure controls and procedures means controls and other procedures of an issuer that are designed to ensure that information required to be disclosed by the issuer in the reports that it files or submits under the Act is recorded, processed, summarized and reported, within the time periods specified in the Commission’s rules and forms. Disclosure controls and procedures include, without limitation, controls and procedures designed to ensure that information required to be disclosed by an issuer in the reports that it files or submits under the Act is accumulated and communicated to the issuer’s management, including its principal executive and principal financial officers, or persons performing similar functions, as appropriate to allow timely decisions regarding required disclosure. There are inherent limitations to the effectiveness of any system of disclosure controls and procedures, including the possibility of human error and the circumvention or overriding of the controls and procedures. Accordingly, even effective disclosure controls and procedures can only provide reasonable assurance of achieving their control objectives, and management necessarily is required to use its judgment in evaluating the cost-benefit relationship of possible disclosure controls and procedures.
Management’s Annual Report on Internal Control over Financial Reporting
Our management is responsible for establishing and maintaining adequate internal control over financial reporting and for the assessment of the effectiveness of internal control over financial reporting.
Internal control over financial reporting is a process designed by, or under the supervision of, the CEO and CFO, or persons performing similar functions, and effected by our board of directors, management and other personnel, to provide reasonable assurance regarding the reliability of financial reporting and the preparation of financial statements for external purposes in accordance with U.S. GAAP. Because of its inherent limitations, internal control over financial reporting may not prevent or detect misstatements. Also, projections of any evaluation of effectiveness to future periods are subject to the risk that controls may become inadequate because of changes in conditions, or that the degree of compliance with the policies or procedures may deteriorate.
As of December 31, 2017, our management, including the CEO and CFO, completed their evaluation of the effectiveness of our internal control over financial reporting. This evaluation was based on the criteria set forth in the Internal Control-Integrated Framework (2013) issued by the Committee of Sponsoring Organizations of the Treadway Commission. Management identified no material weaknesses that existed in the design or operation of our internal control over financial reporting and concluded that our internal control over financial reporting was effective as of December 31, 2017. In performing the evaluation of internal control over financial reporting as of December 31, 2017, management has excluded ShoreTel, a company acquired in a business combination on September 25, 2017. Assets of approximately $81.1 million and liabilities of approximately $121.5 million related to the ShoreTel business were included in Mitel’s consolidated balance sheet at December 31, 2017 and total revenues of approximately $93.6 million and a net loss of approximately $14.9 million were included in the consolidated statement of operations for the year ended December 31, 2017 (representing operations of the ShoreTel business from the acquisition date of September 25, 2017).
The effectiveness of our internal control over financial reporting as of December 31, 2017 has been audited by Deloitte LLP, independent registered public accounting firm, as stated in their report on internal control over financial reporting, which is included in Part II, Item 8 of this Report.
Changes in internal controls over financial reporting
The acquisition of ShoreTel on September 25, 2017, represents a material change in internal control over financial reporting since management’s last assessment of the Company’s internal control over financial reporting which was completed as of December 31, 2016. The ShoreTel business utilizes separate information and accounting systems and processes. The Company intends to extend its Sarbanes-Oxley Section 404 compliance program to include the ShoreTel business beginning in 2018.
104
Table of Contents
Other than the acquisition of ShoreTel, there were no significant changes in the Company’s internal control over financial reporting during the year ended December 31, 2017 that have materially affected, or are reasonably likely to materially affect, the Company’s internal control over financial reporting.
| Item 9B. | Other Information |
None.
105
Table of Contents
| Item 10. | Directors, Executive Officers and Corporate Governance |
The information required by this item is incorporated by reference to our Proxy Statement for the 2018 Annual Meeting of the shareholders of Mitel (the “Annual Meeting”) to be filed with the SEC within 120 days of our fiscal year ended December 31, 2017.
Our Board of Directors has adopted a Code of Business Conduct of the Company (the “Code”) applicable to all officers, directors and employees (including our Chief Executive Officer and Chief Financial Officer), which is available on our website (http://investor.mitel.com/) under “Corporate Governance.” If we make any substantive amendments to the Code or grant any waiver, including any implicit waiver, from a provision of the Code to our Chief Executive Officer or Chief Financial Officer, we will disclose the nature of the amendment or waiver on that website or in a report on Form 8-K.
| Item 11. | Executive Compensation |
The information required by this item is incorporated by reference to our Proxy Statement for the Annual Meeting to be filed with the SEC within 120 days of our fiscal year ended December 31, 2017.
| Item 12. | Security Ownership of Certain Beneficial Owners and Management and Related Stockholder Matters |
The information required by this item is incorporated by reference to our Proxy Statement for the Annual Meeting to be filed with the SEC within 120 days of our fiscal year ended December 31, 2017.
| Item 13. | Certain Relationships and Related Transactions, and Director Independence |
The information required by this item is incorporated by reference to our Proxy Statement for the Annual Meeting to be filed with the SEC within 120 days of our fiscal year ended December 31, 2017.
| Item 14. | Principal Accounting Fees and Services |
The information required by this item is incorporated by reference to our Proxy Statement for the Annual Meeting to be filed with the SEC within 120 days of our fiscal year ended December 31, 2017.
106
Table of Contents
| Item 15. | Exhibits and Financial Statement Schedules |
1. (1) and (2) — The following Consolidated Financial Statements of the Company are included in Item 8 herein.
| (A) | Reports of Independent Registered Public Accounting Firm |
| (B) | Consolidated Balance Sheets — As of December 31, 2017 and December 31, 2016 |
| (C) | Consolidated Statements of Operations — Years ended December 31, 2017, December 31, 2016, and December 31, 2015. |
| (D) | Consolidated Statements of Comprehensive Income (Loss) — Years ended December 31, 2017, December 31, 2016, and December 31, 2015. |
| (E) | Consolidated Statements of Shareholders’ Equity — Years ended December 31, 2017, December 31, 2016, and December 31, 2015. |
| (F) | Consolidated Statements of Cash Flows — Years ended December 31, 2017, December 31, 2016, and December 31, 2015. |
| (G) | Notes to the Consolidated Financial Statements. |
(3) Listing of Exhibits — See Exhibit Index.
The management contracts or compensatory plans or arrangements required to be filed as exhibits to this Report are denoted in the Exhibit Index.
| 2. | Our consolidated valuation of qualifying accounts (Schedule II) financial statement schedule is included in Item 8 herein. |
All other schedules for which provision is made in the applicable accounting regulations of the SEC are not required under the related instructions, are inapplicable, or the information has been disclosed elsewhere.
| 3. | Exhibits filed with this report are listed in the Exhibit Index. |
| Item 16 | Form 10-K Summary |
None.
107
Table of Contents
EXHIBIT INDEX
108
Table of Contents
109
Table of Contents
110
Table of Contents
| 32.1* | Certification by CEO pursuant to Section 906 of the Sarbanes-Oxley Act of 2002. | |||
| 32.2* | Certification by CFO pursuant to Section 906 of the Sarbanes-Oxley Act of 2002. | |||
| 101* | The following materials from Mitel Network Corporation’s Report on Form 10-K for the year ended December 31, 2017, formatted in XBRL (eXtensible Business Reporting Language): (i) Consolidated Balance Sheets at December 31, 2017 and December 31, 2016; (ii) Consolidated Statements of Operations for the years ended December 31, 2017, 2016 and 2015; (iii) Consolidated Statements of Comprehensive Income (Loss) for the years ended December 31, 2017, 2016 and 2015; (iv) Consolidated Statements of Shareholders’ Equity for the years ended December 31, 2017, 2016 and 2015; (v) Consolidated Statements of Cash Flows for the years ended December 31, 2017, 2016 and 2015; and (vi) Notes to the Consolidated Financial Statements. | |||
| + | Portions of this document have been granted “Confidential Treatment” by the Secretary of the SEC. |
| * | Filed herewith. |
111
Table of Contents
Pursuant to the requirements of Section 13 or 15(d) of the Securities Exchange Act of 1934, the Registrant has duly caused this report to be signed on its behalf by the undersigned, thereunto duly authorized on February 27, 2018.
| MITEL NETWORKS CORPORATION | ||
| By: | /s/ Steven E. Spooner | |
| Steven E. Spooner | ||
| Chief Financial Officer | ||
| (Principal Financial and Accounting Officer) | ||
Pursuant to the requirements of the Securities Exchange Act of 1934, this report has been signed by the following persons on behalf of the Registrant in the capacities and on the dated indicated.
| Signature |
Title |
Date | ||
| /s/ Richard D. McBee |
Chief Executive Officer & President (Principal Executive Officer) and Director |
February 27, 2018 | ||
| Richard D. McBee | ||||
| /s/ Dr. Terence H. Matthews Dr. Terence H. Matthews |
Chairman of the Board | February 27, 2018 | ||
| /s/ Peter D. Charbonneau Peter D. Charbonneau |
Director | February 27, 2018 | ||
| /s/ Benjamin H. Ball Benjamin H. Ball |
Director | February 27, 2018 | ||
| /s/ Sudhakar Ramakrishna Sudhakar Ramakrishna |
Director | February 27, 2018 | ||
| /s/ John P. McHugh John P. McHugh |
Director | February 27, 2018 | ||
| /s/ David Williams David Williams |
Director | February 27, 2018 | ||
| /s/ Martha H. Bejar Martha H. Bejar |
Director | February 27, 2018 | ||