Attached files
| file | filename |
|---|---|
| 8-K - SHENANDOAH TELECOMMUNICATIONS CO 8-K 11-1-2013 - SHENANDOAH TELECOMMUNICATIONS CO/VA/ | form8k.htm |
November 1, 2013 3Q 2013 Earnings Conference Call Exhibit 99.1
* Safe Harbor Statement This presentation includes “forward-looking statements” within the meaning of Section 27A of the Securities Act and Section 21E of the Securities Exchange Act of 1934, as amended, regarding, among other things, our business strategy, our prospects and our financial position. These statements can be identified by the use of forward-looking terminology such as “believes,” “estimates,” “expects,” “intends,” “may,” “will,” “should,” “could,” or “anticipates” or the negative or other variation of these similar words, or by discussions of strategy or risks and uncertainties. These statements are based on current expectations of future events. If underlying assumptions prove inaccurate or unknown risks or uncertainties materialize, actual results could vary materially from the Company’s expectations and projections. Important factors that could cause actual results to differ materially from such forward-looking statements include, without limitation, risks related to the following: Increasing competition in the communications industry; and A complex and uncertain regulatory environment. A further list and description of these risks, uncertainties and other factors can be found in the Company’s SEC filings which are available online at www.sec.gov, www.shentel.com or on request from the Company. The Company does not undertake to update any forward-looking statements as a result of new information or future events or developments.

* Use of Non-GAAP Financial Measures Included in this presentation are certain non-GAAP financial measures that are not determined in accordance with US generally accepted accounting principles. These financial performance measures are not indicative of cash provided or used by operating activities and exclude the effects of certain operating, capital and financing costs and may differ from comparable information provided by other companies, and they should not be considered in isolation, as an alternative to, or more meaningful than measures of financial performance determined in accordance with US generally accepted accounting principles. These financial performance measures are commonly used in the industry and are presented because Shentel believes they provide relevant and useful information to investors. Shentel utilizes these financial performance measures to assess its ability to meet future capital expenditure and working capital requirements, to incur indebtedness if necessary, return investment to shareholders and to fund continued growth. Shentel also uses these financial performance measures to evaluate the performance of its businesses and for budget planning purposes.

* Chris French President and CEO

* Q3’13 Highlights Net Income Growth Increased 394% to $6.7 million Adjusted OIBDA increased 12% to $28.7 million Revenue Growth Revenue grew 6.4% over Q3’12 to $77.5 million Customer Growth 9/30/12 9/30/13 Change Wireless 381,321 400,336 +19,015 Cable (RGUs) 114,762 118,805 +4,043

* Wireless Highlights PCS Customers (000s) Postpaid Growth Postpaid customers up 3.4% over last 12 months Prepaid Growth Prepaid customers up 8.3% over last 12 months Operating Income Increase Improvement of $7.2 million, or 87.9%

* Cable Highlights Upgrades of 2010 Acquisitions Finished Revenue Growth Operating revenues grew 8.0% over Q3’12 118,805 RGUs at 9/30/2013, up 3.5% over Q3’12 Adjusted OIBDA $1.2 million, up 13% from Q3’12

* Tail End of Significant Capital Expenditures Acquisitions Upgrades Reduced CapEx 2008-2010 2010-2013 2014 Cable Upgraded acquired networks to offer “Triple Play” with robust high speed data offering Streamline network to gain operating efficiency Wireless Investing heavily in upgrading wireless networks to 4G LTE as part of the Sprint Network Vision project Capital Expenditures should decrease after network upgrades are complete We Are Here Cable Acquired various cable assets in West Virginia, Maryland and Virginia Many assets had been neglected by former owners Wireless Acquired right to portion of 50,000 Virgin Mobile customers and began selling Virgin Mobile and Boost prepaid
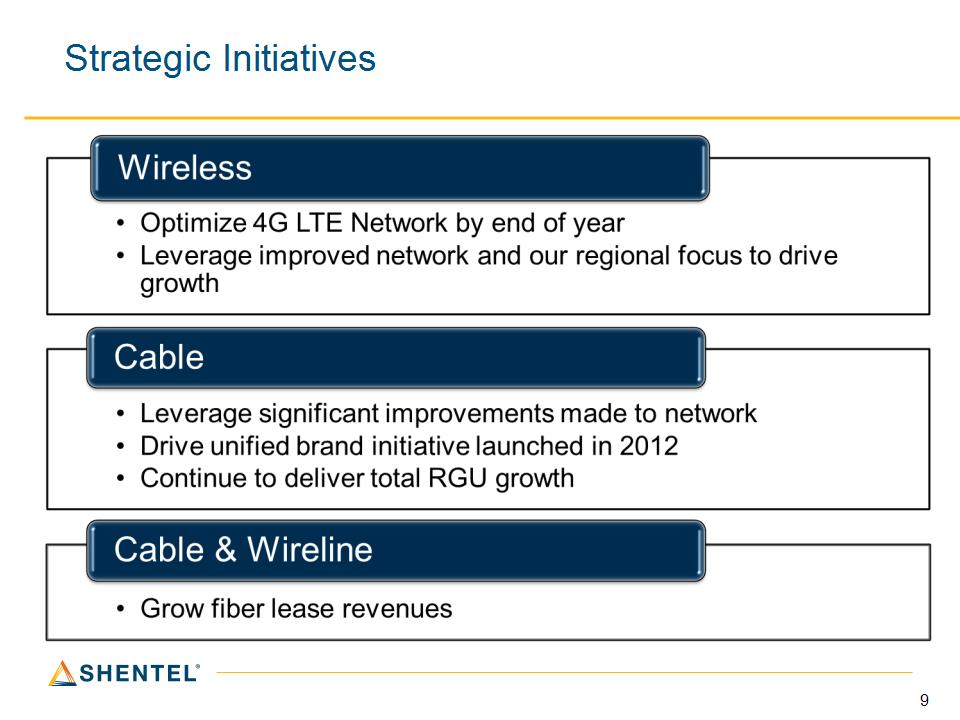
* Strategic Initiatives

* Adele Skolits VP of Finance and CFO
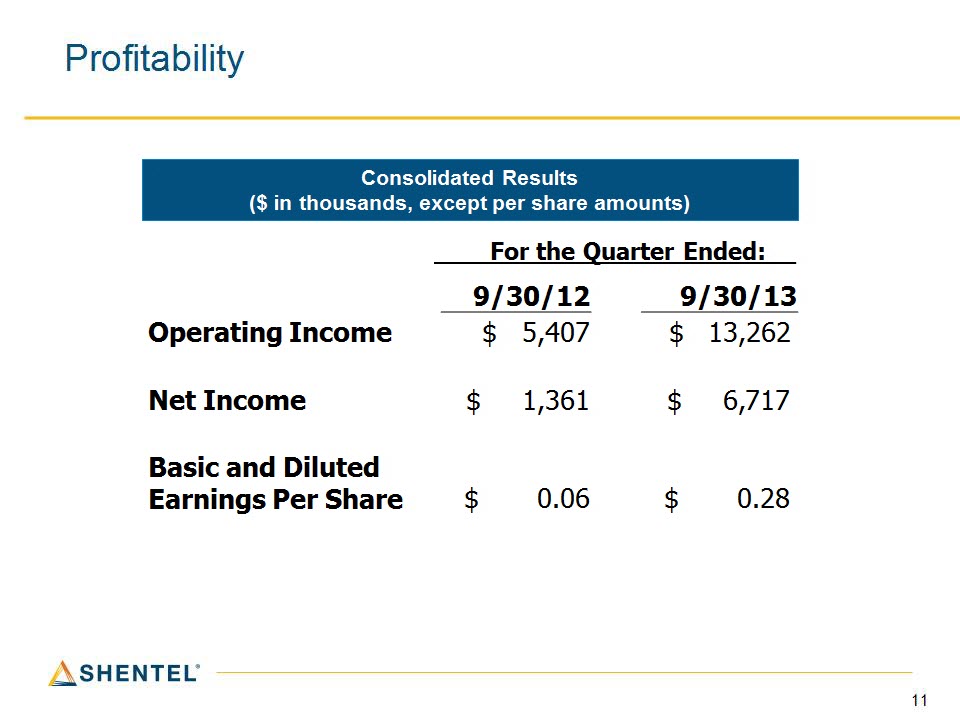
* Profitability Consolidated Results ($ in thousands, except per share amounts) 9/30/12 9/30/13 Operating Income $ 5,407 $ 13,262 Net Income $ 1,361 $ 6,717 Basic and Diluted Earnings Per Share $ 0.06 $ 0.28 For the Quarter Ended:__
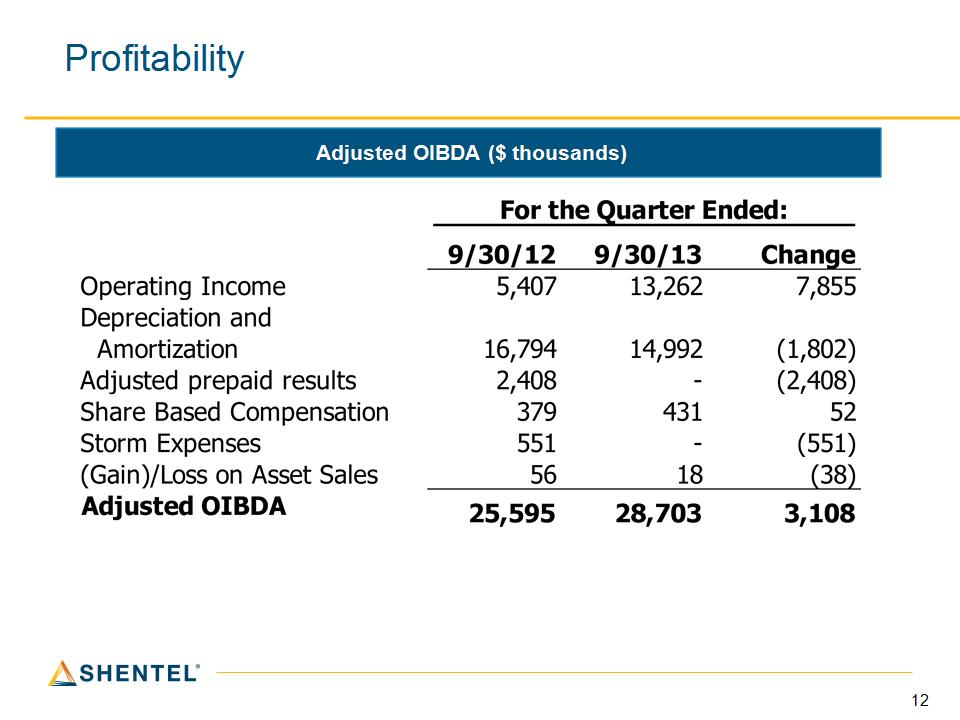
* Profitability Adjusted OIBDA ($ thousands)

* Adjusted OIBDA by Segment ($ millions)

* Wireless Segment – Change in Adjusted OIBDA Q3’13 vs. Q3’12 ($ millions)
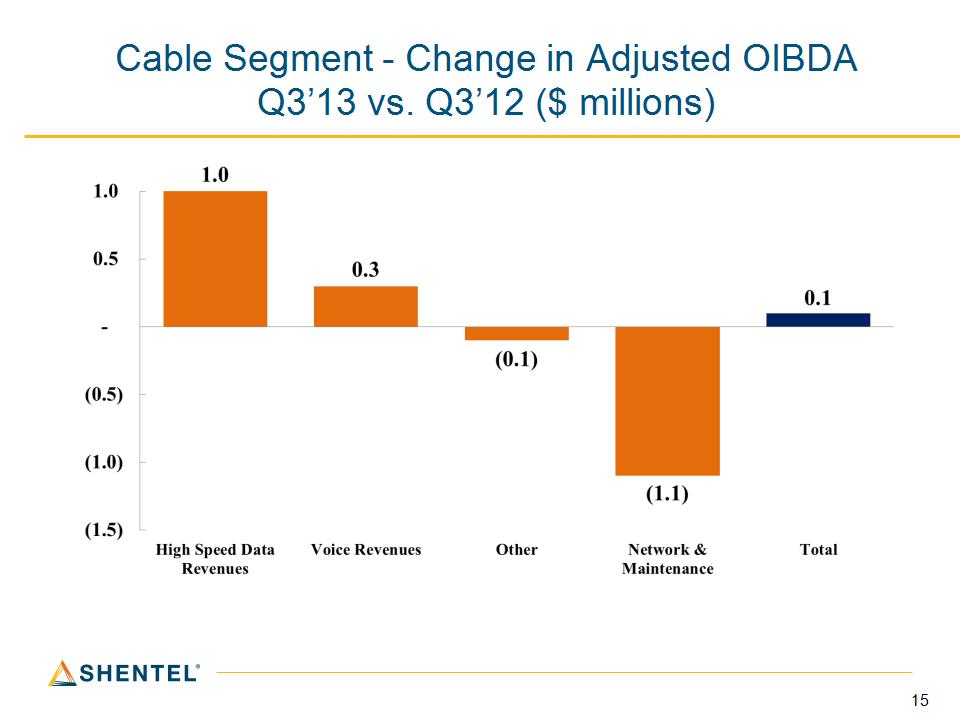
* Cable Segment – Change in Adjusted OIBDA Q3’13 vs. Q3’12 ($ millions)

* Earle MacKenzie EVP and COO

* Wireless Segment
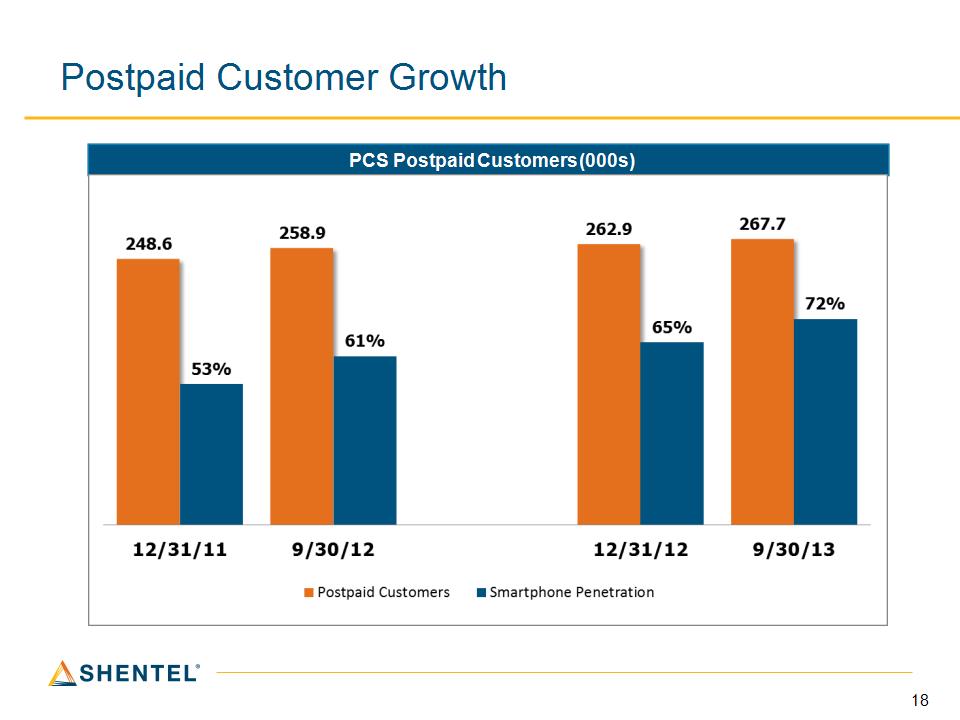
* Postpaid Customer Growth PCS Postpaid Customers (000s)

* Postpaid Customer Additions Gross Additions - Postpaid Net Additions - Postpaid Net adds of 1,370 in Q3 2013 versus 3,842 in Q3 2012 Q3 2013 churn of 1.80% down from 1.89% in Q3 2012 Shentel-controlled channels produced 55% of gross adds in Q3 2013 and 47% in Q3 2012
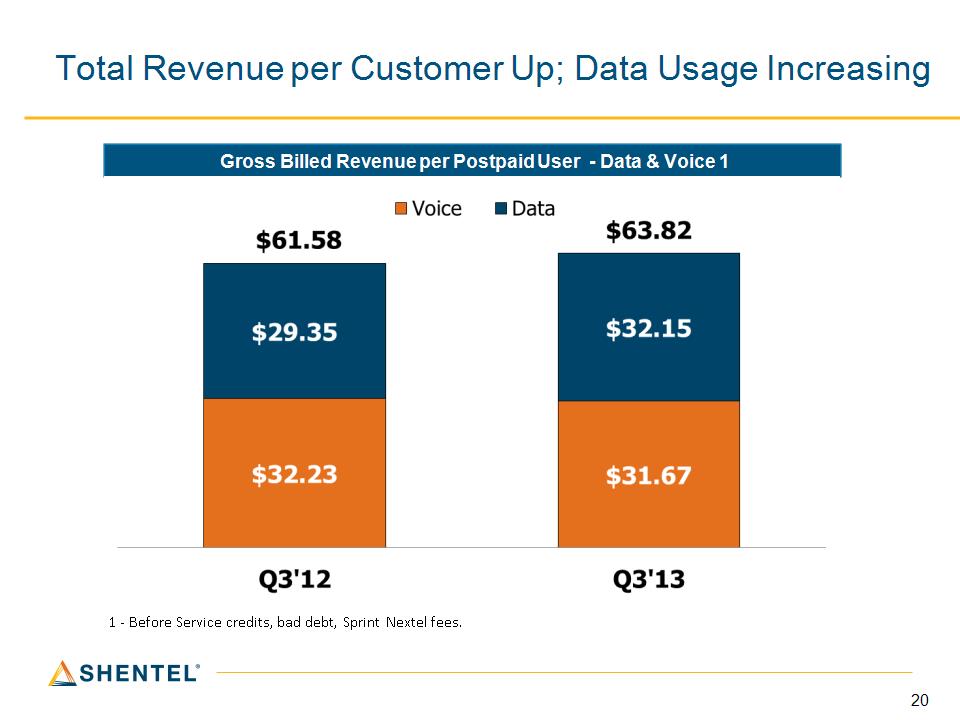
* Total Revenue per Customer Up; Data Usage Increasing Gross Billed Revenue per Postpaid User – Data & Voice 1 1 – Before Service credits, bad debt, Sprint Nextel fees.

* PCS Revenues Annual Gross Billed Revenues - Postpaid ($ millions) * *Net service fee increased from 12% to 14% effective 8/1/2013

* PCS Prepaid Statistics Gross Additions (000s) Cumulative Customers (000s) *The loss of customers in Q2’13 related to more stringent governmental requirements for customers renewing their eligibility for the government subsidized Assurance program.

* PCS Prepaid Statistics Churn % Average Gross Billed Revenue
* Cable Segment

* Cable - RGU Growth by Quarter Customers *74,726 75,386 74,798 75,573 *74,557 75,324 RGU's/Customer 1.51 1.52 1.54 1.54 1.56 1.58 * College students disconnect during summer
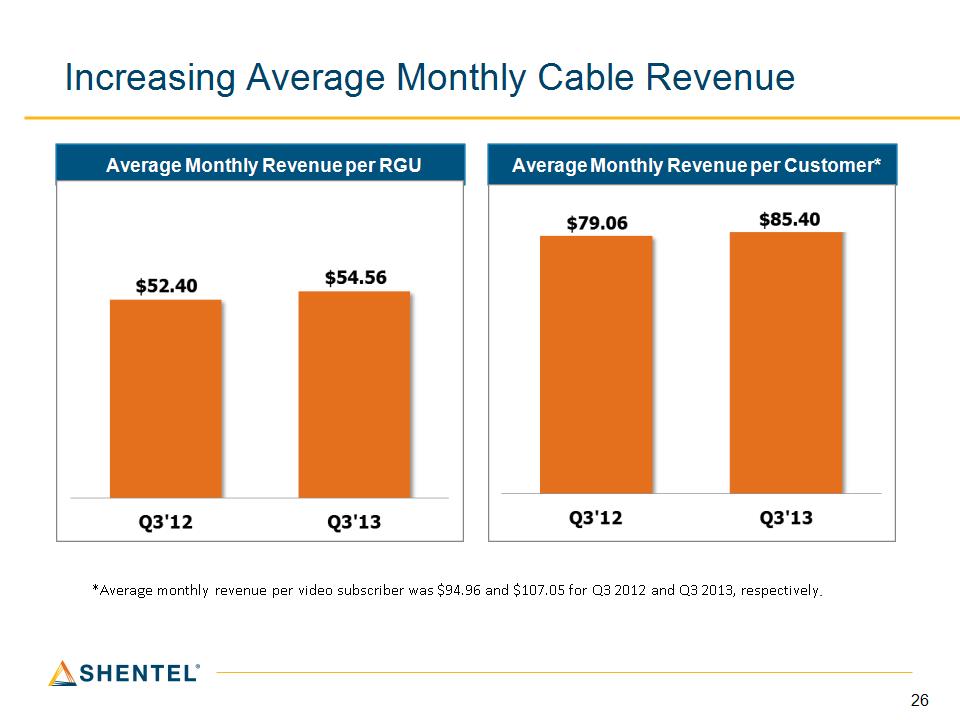
* Increasing Average Monthly Cable Revenue Average Monthly Revenue per RGU Average Monthly Revenue per Customer* *Average monthly revenue per video subscriber was $94.96 and $107.05 for Q3 2012 and Q3 2013, respectively.

* Key Operational Results – Cable Note: Video homes passed includes 16K homes located in Shenandoah County, VA, where internet and voice services are provided by the Wireline segment.

* Wireline Segment
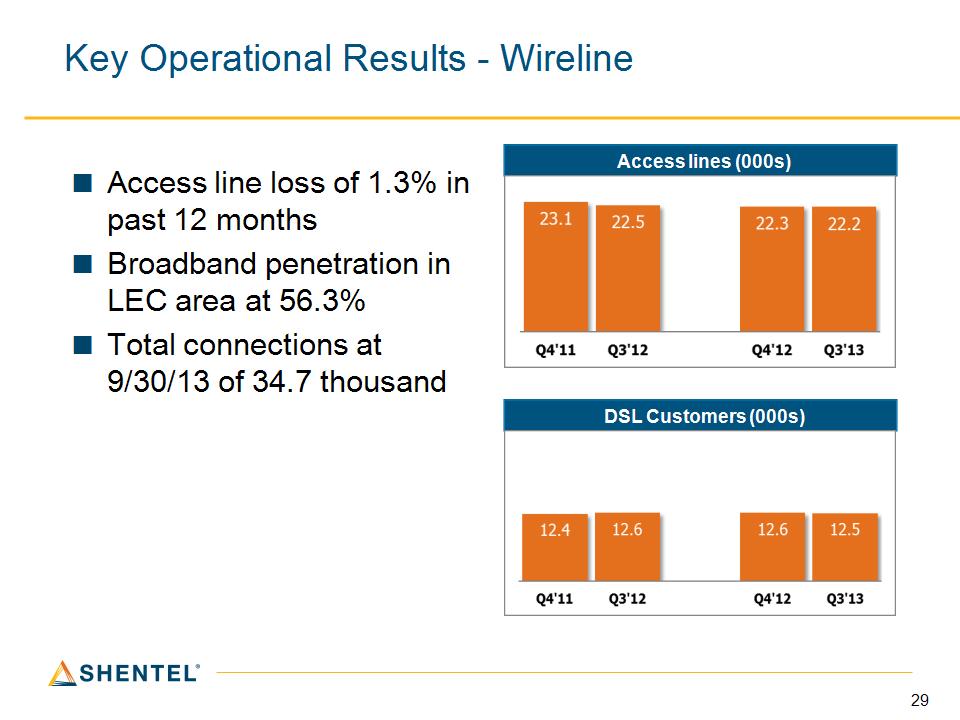
* Key Operational Results - Wireline Access line loss of 1.3% in past 12 months Broadband penetration in LEC area at 56.3% Total connections at 9/30/13 of 34.7 thousand Access lines (000s) DSL Customers (000s)

* Investing in the Future Revised 2013 estimate to $102.4 million. Approximately $17 million of planned FY’13 spend is being shifted into 2014. Capex should decrease significantly in 2014. Capex Spending ($ millions) * Capex spending for 2012 included $24.7 million of contracted commitments that was included in accounts payable at 12/31/12.

* Q&A

* Appendix
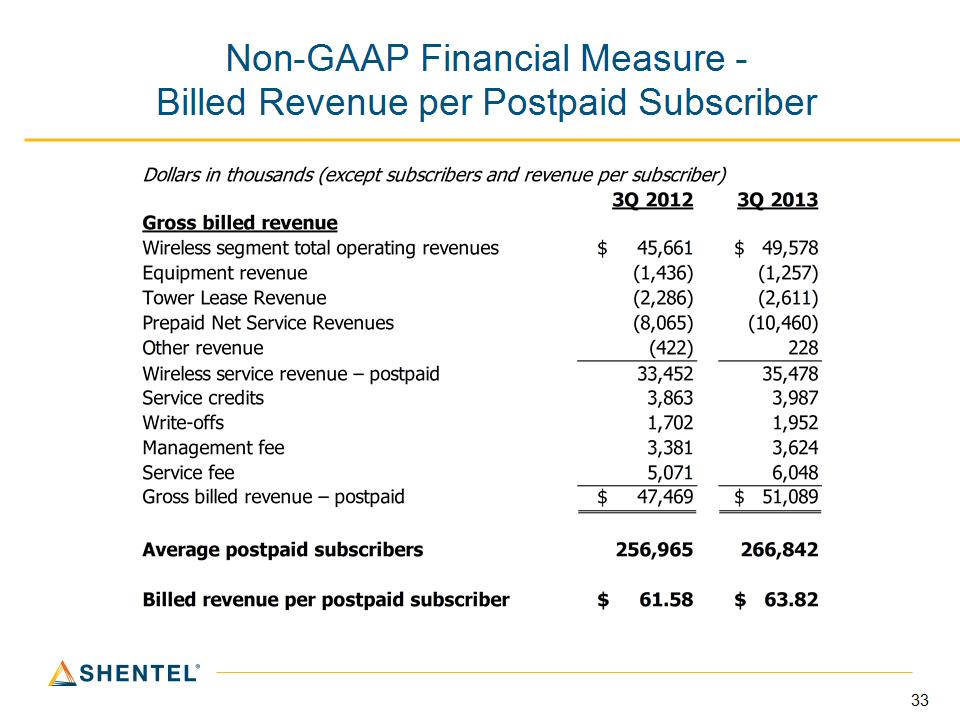
* Non-GAAP Financial Measure – Billed Revenue per Postpaid Subscriber

* Postpaid PCS Customers Top Picks Q3 2013 Top Service Plans – 81% of Gross Adds Top Devices – New Activations – All Channels Everything Data 1500 46% Unlimited, My Way 27% Everything Data 450 9% Samsung Galaxy S III 32% iPhone 23% Samsung Galaxy S4 12% Smartphones made up 72% of the Postpaid base in Q3 2013, up from 65% in Q4 2012 and 61% in Q3 2012. * * New Service Plan offered in Q3 2013
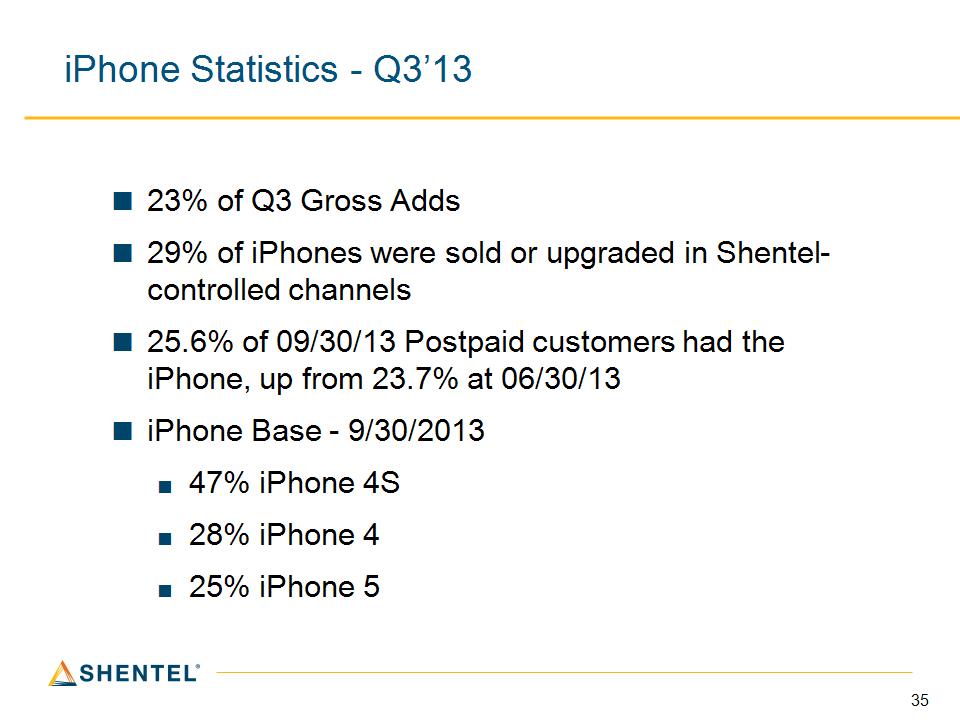
* iPhone Statistics – Q3’13 23% of Q3 Gross Adds 29% of iPhones were sold or upgraded in Shentel-controlled channels 25.6% of 09/30/13 Postpaid customers had the iPhone, up from 23.7% at 06/30/13 iPhone Base - 9/30/2013 47% iPhone 4S 28% iPhone 4 25% iPhone 5

* Non-GAAP Financial Measure – Average Monthly Cable Revenue
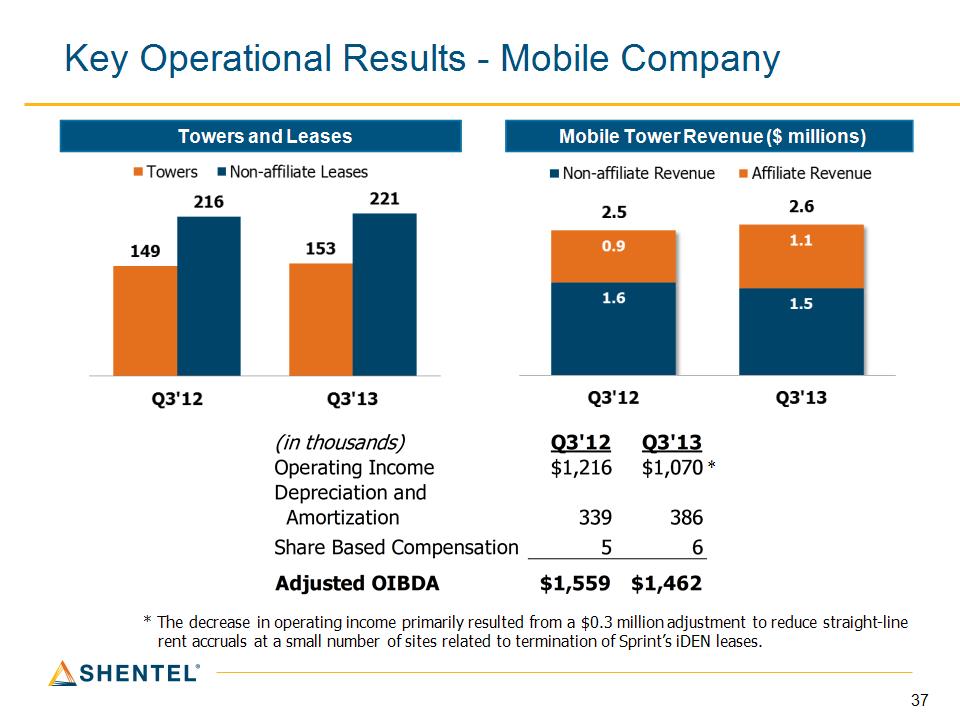
* Key Operational Results – Mobile Company Mobile Tower Revenue ($ millions) Towers and Leases * * The decrease in operating income primarily resulted from a $0.3 million adjustment to reduce straight-line rent accruals at a small number of sites related to termination of Sprint’s iDEN leases.

* Wireline Statistics – Fiber Sales ($ millions) Fiber Lease Revenue