Attached files
| file | filename |
|---|---|
| EX-99.1 - PRESS RELEASE - CommunityOne Bancorp | cob3q13prv6final1.htm |
| 8-K - 8-K - CommunityOne Bancorp | a8kfor3q13earningsrelease.htm |

CommunityOne Bancorp October 31, 2013 Third Quarter 2013 Earnings Presentation
Presenters Brian Simpson Chief Executive Officer David Nielsen Chief Financial Officer Neil Machovec Chief Credit Officer 2
Forward Looking Statements & Other Information Forward Looking Statements This presentation contains certain forward-looking statements within the safe harbor rules of the federal securities laws. These statements generally relate to COB’s financial condition, results of operations, plans, objectives, future performance or business. They usually can be identified by the use of forward-looking terminology, such as “believes,” “expects,” or “are expected to,” “plans,” “projects,” “goals,” “estimates,” “may,” “should,” “could,” “would,” “intends to,” “outlook” or “anticipates,” or variations of these and similar words, or by discussions of strategies that involve risks and uncertainties. Forward looking statements are subject to risks and uncertainties, including but not limited to, those risks described in COB’s Annual Report on Form 10-K for the year ended December 31, 2012 under the section entitled “Item 1A, Risk Factors,” and in the Quarterly Reports of Form 10-Q and other reports that are filed by COB with the Securities and Exchange Commission. You are cautioned not to place undue reliance on these forward-looking statements, which are subject to numerous assumptions, risks and uncertainties, and which change over time. These forward-looking statements speak only as of the date of this presentation. Actual results may differ materially from those expressed in or implied by any forward looking statements contained in this presentation. We assume no duty to revise or update any forward-looking statements, except as required by applicable law. Non-GAAP Financial Measures In addition to the results of operations presented in accordance with Generally Accepted Accounting Principles (GAAP), COB management uses and this presentation contains or references, certain non-GAAP financial measures, such as core earnings, core noninterest expense, core noninterest expense to average assets, core noninterest income, tangible shareholders’ equity, pro forma ALL and fair value mark, Granite purchased impaired loan ALL and FV mark, and Granite purchased contractual loan ALL and FV mark. COB believes these non-GAAP financial measures provide information useful to investors in understanding our underlying operational performance and our business and performance trends as they facilitate comparisons with the performance of others in the financial services industry; however, these non-GAAP financial measures should not be considered an alternative to GAAP. The non-GAAP financial measures contained within this presentation should be read in conjunction with the audited financial statements and analysis as presented in COB’s Annual Report on Form 10-K as well as the unaudited financial statements and analyses as presented in COB’s Quarterly Reports on Form 10-Q. A reconciliation of non-GAAP measures to the most directly comparable GAAP measure is included within tables in the presentation or with the appendix to this presentation. 3
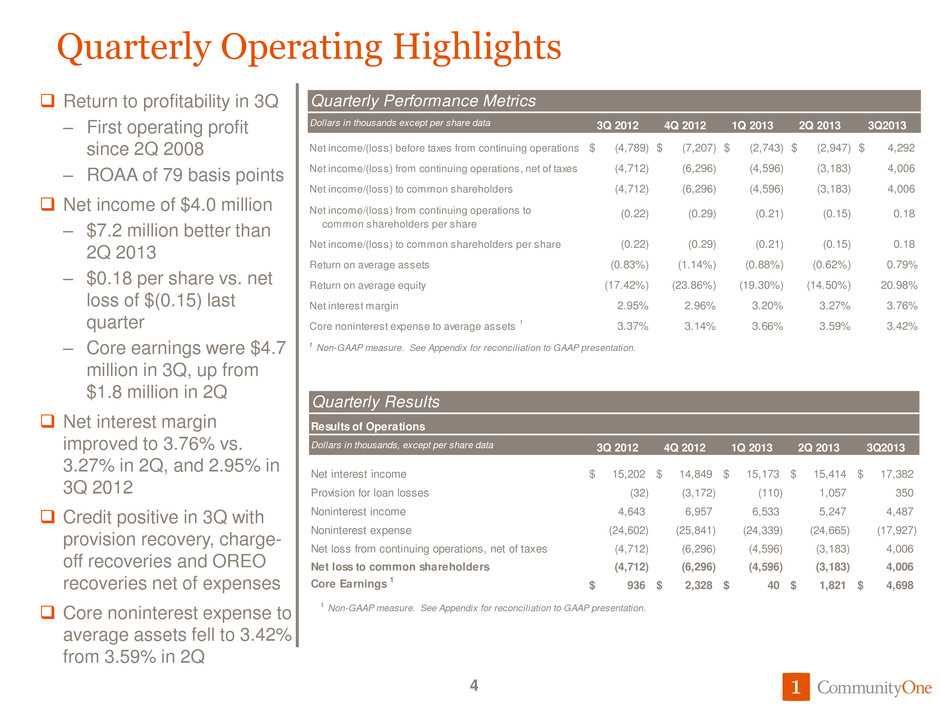
Quarterly Operating Highlights Return to profitability in 3Q – First operating profit since 2Q 2008 – ROAA of 79 basis points Net income of $4.0 million – $7.2 million better than 2Q 2013 – $0.18 per share vs. net loss of $(0.15) last quarter – Core earnings were $4.7 million in 3Q, up from $1.8 million in 2Q Net interest margin improved to 3.76% vs. 3.27% in 2Q, and 2.95% in 3Q 2012 Credit positive in 3Q with provision recovery, charge- off recoveries and OREO recoveries net of expenses Core noninterest expense to average assets fell to 3.42% from 3.59% in 2Q 4 Quarterly Performance Metrics Dollars in thousands except per share data 3Q 2012 4Q 2012 1Q 2013 2Q 2013 3Q2013 Net income/(loss) before taxes from continuing operations (4,789)$ (7,207)$ (2,743)$ (2,947)$ 4,292$ Net income/(loss) from continuing operations, net of taxes (4,712) (6,296) (4,596) (3,183) 4,006 Net income/(loss) to common shareholders (4,712) (6,296) (4,596) (3,183) 4,006 (0.22) (0.29) (0.21) (0.15) 0.18 Net income/(loss) to common shareholders per share (0.22) (0.29) (0.21) (0.15) 0.18 Return on average assets (0.83%) (1.14%) (0.88%) (0.62%) 0.79% Return on average equity (17.42%) (23.86%) (19.30%) (14.50%) 20.98% Net interest margin 2.95% 2.96% 3.20% 3.27% 3.76% Core noninterest expense to average assets 1 3.37% 3.14% 3.66% 3.59% 3.42% 1 Non-GAAP measure. See Appendix for reconciliation to GAAP presentation. Net income/(loss) from continuing operations to common shareholders per share Quarterly Results Results of Operations Dollars in thousands, except per share data 3Q 2012 4Q 2012 1Q 2013 2Q 2013 3Q2013 Net interest income 15,202$ 14,849$ 15,173$ 15,414$ 17,382$ Provisi for loan losses (32) ( , 72) (110) 1,057 350 Noninterest income 4,643 6,957 6,533 5,247 4,487 Noninterest expense (24,602) (25,841) (24,339) (24,665) (17,927) Net loss from continuing operations, net of taxes (4,712) (6,296) (4,596) (3,183) 4,006 Net loss to common shareholders (4,712) (6,296) (4,596) (3,183) 4,006 936$ 2,328$ 40$ 1,821$ 4,698$ 1 Non-GAAP measure. See Appendix for reconciliation to GAAP presentation. Core Earnings 1
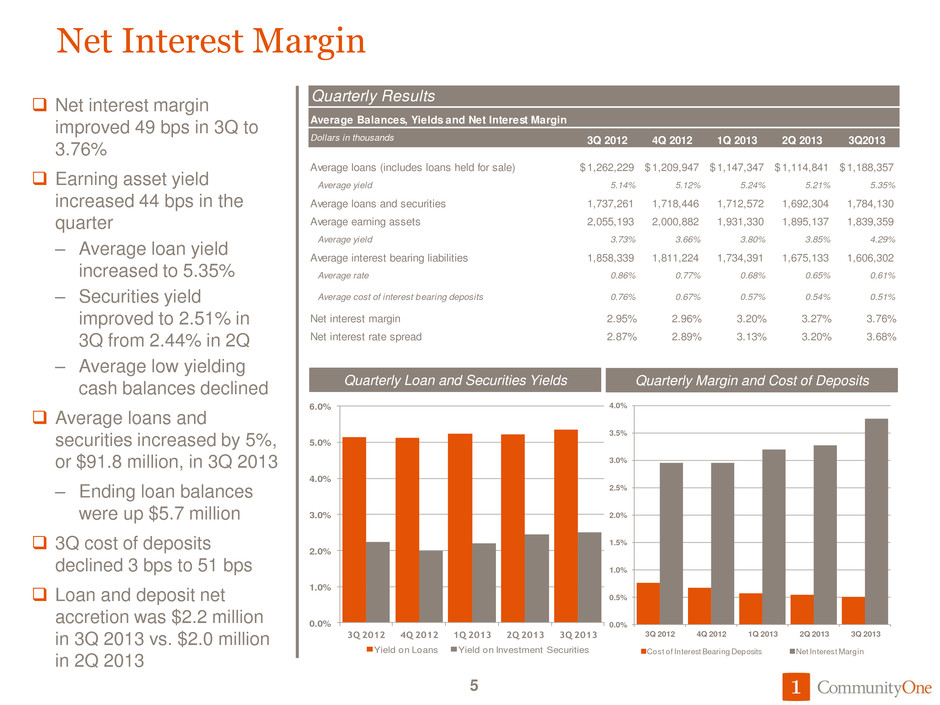
Net Interest Margin Net interest margin improved 49 bps in 3Q to 3.76% Earning asset yield increased 44 bps in the quarter – Average loan yield increased to 5.35% – Securities yield improved to 2.51% in 3Q from 2.44% in 2Q – Average low yielding cash balances declined Average loans and securities increased by 5%, or $91.8 million, in 3Q 2013 – Ending loan balances were up $5.7 million 3Q cost of deposits declined 3 bps to 51 bps Loan and deposit net accretion was $2.2 million in 3Q 2013 vs. $2.0 million in 2Q 2013 5 Quarterly Results Average Balances, Yields and Net Interest Margin Dollars in thousands 3Q 2012 4Q 2012 1Q 2013 2Q 2013 3Q2013 Average loans (includes loans held for sale) 1,262,229$ 1,209,947$ 1,147,347$ 1,114,841$ 1,188,357$ Average yield 5.14% 5.12% 5.24% 5.21% 5.35% Average loans and securities 1,737,261 1,718,446 1,712,572 1,692,304 1,784,130 Average earning assets 2,055,193 2,000,882 1,931,330 1,895,137 1,839,359 Average yield 3.73% 3.66% 3.80% 3.85% 4.29% Average interest bearing liabilities 1,858,339 1,811,224 1,734,391 1,675,133 1,606,302 Average rate 0.86% 0.77% 0.68% 0.65% 0.61% Average cost of interest bearing deposits 0.76% 0.67% 0.57% 0.54% 0.51% Net interest margin 2.95% 2.96% 3.20% 3.27% 3.76% Net interest rate spread 2.87% 2.89% 3.13% 3.20% 3.68% 0.0% 1.0% 2.0% 3.0% 4.0% 5.0% 6.0% 3Q 2012 4Q 2012 1Q 2013 2Q 2013 3Q 2013 Yield on Loans Yield on Investment Securities 0.0% 0.5% 1.0% 1.5% 2.0% 2.5% 3.0% 3.5% 4.0% 3Q 2012 4Q 2012 1Q 2013 2Q 2013 3Q 2013 Cost of Interest Bearing D posits Net Interest Margin Quarterly Loan and Securities Yields Quarterly Margin and Cost of Deposits
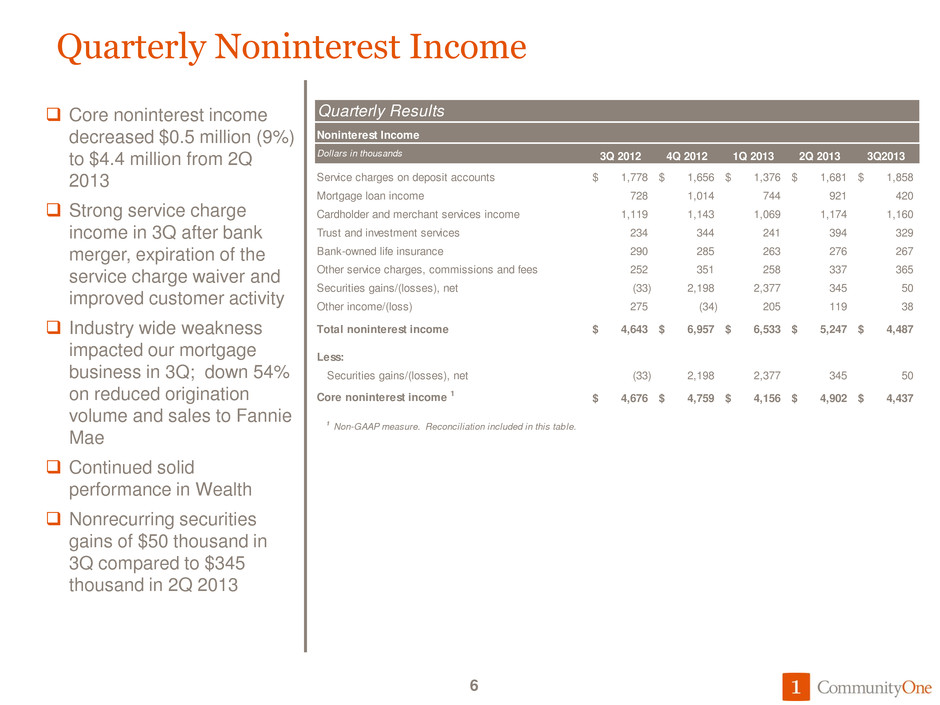
Quarterly Noninterest Income Core noninterest income decreased $0.5 million (9%) to $4.4 million from 2Q 2013 Strong service charge income in 3Q after bank merger, expiration of the service charge waiver and improved customer activity Industry wide weakness impacted our mortgage business in 3Q; down 54% on reduced origination volume and sales to Fannie Mae Continued solid performance in Wealth Nonrecurring securities gains of $50 thousand in 3Q compared to $345 thousand in 2Q 2013 6 Quarterly Results Noninterest Income Dollars in thousands 3Q 2012 4Q 2012 1Q 2013 2Q 2013 3Q2013 Service charges on deposit accounts 1,778$ 1,656$ 1,376$ 1,681$ 1,858$ Mortgage loan income 728 1,014 744 921 420 Cardholder and merchant services income 1,119 1,143 1,069 1,174 1,160 Trust and investment services 234 344 241 394 329 Bank-owned life insurance 290 285 263 276 267 Other service charges, commissions and fees 252 351 258 337 365 Securities gains/(losses), net (33) 2,198 2,377 345 50 Other income/(loss) 275 (34) 205 119 38 Total noninterest income 4,643$ 6,957$ 6,533$ 5,247$ 4,487$ Less: Securities gains/(losses), net (33) 2,198 2,377 345 50 Core noninterest income 1 4,676$ 4,759$ 4,156$ 4,902$ 4,437$ 1 Non-GAAP measure. Reconciliation included in this table.
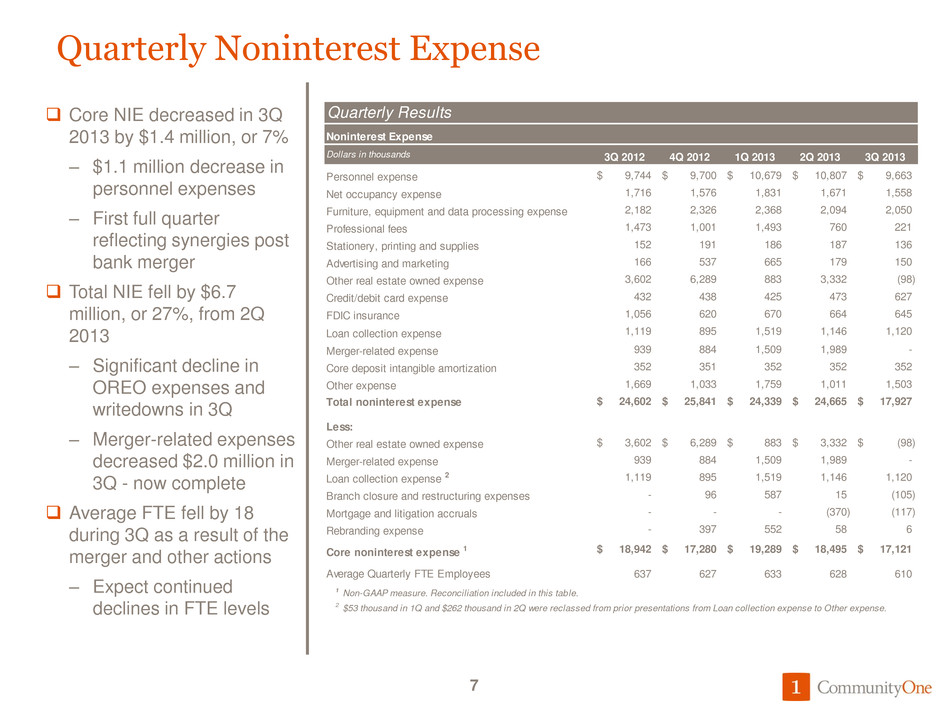
Quarterly Noninterest Expense Core NIE decreased in 3Q 2013 by $1.4 million, or 7% – $1.1 million decrease in personnel expenses – First full quarter reflecting synergies post bank merger Total NIE fell by $6.7 million, or 27%, from 2Q 2013 – Significant decline in OREO expenses and writedowns in 3Q – Merger-related expenses decreased $2.0 million in 3Q - now complete Average FTE fell by 18 during 3Q as a result of the merger and other actions – Expect continued declines in FTE levels 7 Quarterly Results Noninterest Expense Dollars in thousands 3Q 2012 4Q 2012 1Q 2013 2Q 2013 3Q 2013 Personnel expense 9,744$ 9,700$ 10,679$ 10,807$ 9,663$ Net occupancy expense 1,716 1,576 1,831 1,671 1,558 Furniture, equipment and data processing expense 2,182 2,326 2,368 2,094 2,050 Professional fees 1,473 1,001 1,493 760 221 Stationery, printing and supplies 152 191 186 187 136 Advertising and marketing 166 537 665 179 150 Other real estate owned expense 3,602 6,289 883 3,332 (98) Credit/debit card expense 432 438 425 473 627 FDIC insurance 1,056 620 670 664 645 Loan collection expense 1,119 895 1,519 1,146 1,120 Merger-related expense 939 884 1,509 1,989 - Core deposit intangible amortization 352 351 352 352 352 Other expense 1,669 1,033 1,759 1,011 1,503 Total noninterest expense 24,602$ 25,841$ 24,339$ 24,665$ 17,927$ Less: Other real estate owned expense 3,602$ 6,289$ 883$ 3,332$ (98)$ Merger-related expense 939 884 1,509 1,989 - Loan collection expense 2 1,119 895 1,519 1,146 1,120 Branch closure and restructuring expenses - 96 587 15 (105) Mortgage and litigation accruals - - - (370) (117) Rebranding expense - 397 552 58 6 Core noninterest expense 1 18,942$ 17,280$ 19,289$ 18,495$ 17,121$ Average Quarterly FTE Employees 637 627 633 628 610 1 Non-GAAP measure. Reconciliation included in this table. 2 $53 thousand in 1Q and $262 thousand in 2Q were reclassed from prior presentations from Loan collection expense to Other expense.
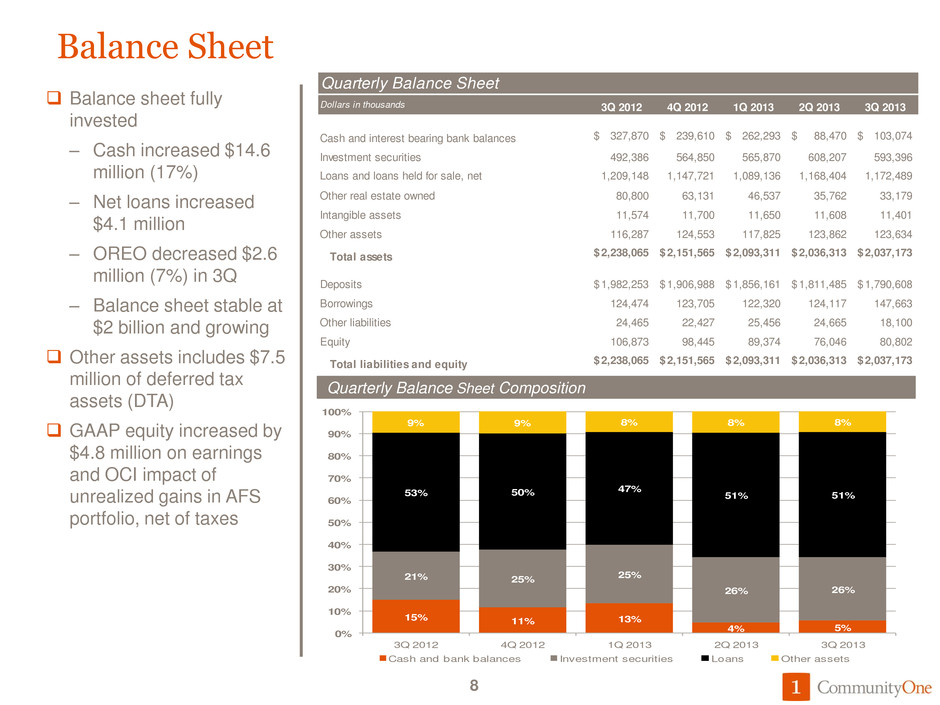
Balance Sheet Balance sheet fully invested – Cash increased $14.6 million (17%) – Net loans increased $4.1 million – OREO decreased $2.6 million (7%) in 3Q – Balance sheet stable at $2 billion and growing Other assets includes $7.5 million of deferred tax assets (DTA) GAAP equity increased by $4.8 million on earnings and OCI impact of unrealized gains in AFS portfolio, net of taxes 8 15% 11% 13% 4% 5% 21% 25% 25% 26% 26% 53% 50% 47% 51% 51% 9% 9% 8% 8% 8% 0% 10% 20% 30% 40% 50% 60% 70% 80% 90% 100% 3Q 2012 4Q 2012 1Q 2013 2Q 2013 3Q 2013 Cash and bank balances Investment securities Loans Other assets Quarterly Balance Sheet Composition Quarterly Balance Sheet Dollars in thousands 3Q 2012 4Q 2012 1Q 2013 2Q 2013 3Q 2013 Cash and interest bearing bank balances 327,870$ 239,610$ 262,293$ 88,470$ 103,074$ Investment securities 492,386 564,850 565,870 60 ,207 593,396 Loans and loans held for sale, net 1,209,148 1,147,721 1,089,136 1,168,404 1,172,489 Other real estate owned 80,800 63,131 46,537 35,762 33,179 Intangible assets 11,574 11,700 11,650 11,608 11,401 Other assets 116,287 124,553 117,825 123,862 123,634 Total assets 2,238,065$ 2,151,565$ 2,093,311$ 2,036,313$ 2,037,173$ Deposits 1,982,253$ 1,906,988$ 1,856,161$ 1,811,485$ 1,790,608$ Borrowings 124,474 123,705 122,320 124,117 147,663 24,465 22,427 25,456 24,665 18,100 Equity 106,873 98,445 89,374 76,046 80,802 Total liabilities and equity 2,238,065$ 2,151,565$ 2,093,311$ 2,036,313$ 2,037,173$ Other liabilities
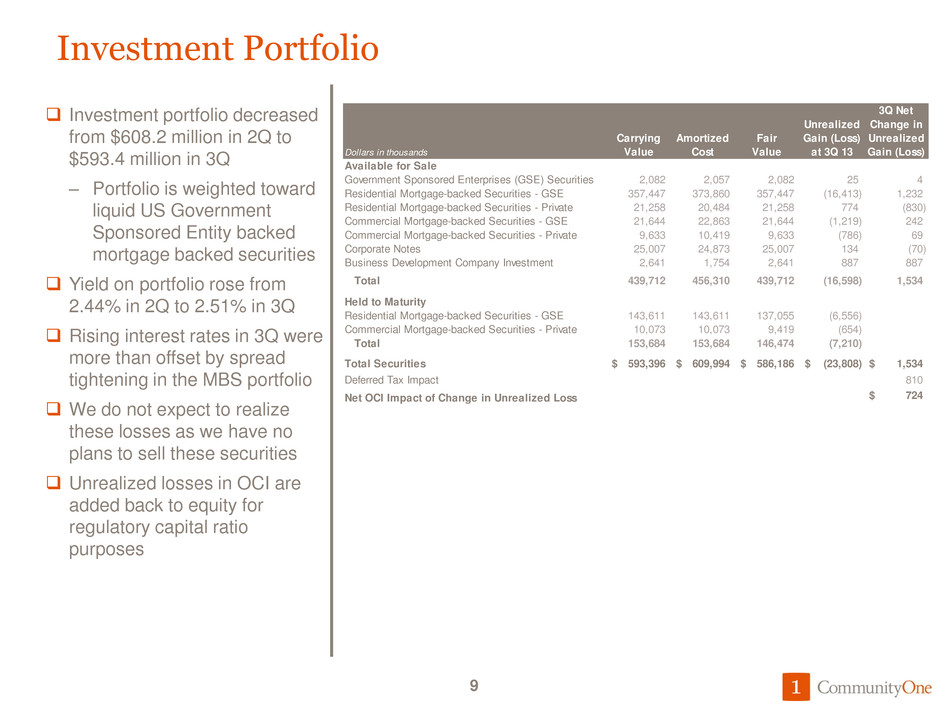
Investment Portfolio Investment portfolio decreased from $608.2 million in 2Q to $593.4 million in 3Q – Portfolio is weighted toward liquid US Government Sponsored Entity backed mortgage backed securities Yield on portfolio rose from 2.44% in 2Q to 2.51% in 3Q Rising interest rates in 3Q were more than offset by spread tightening in the MBS portfolio We do not expect to realize these losses as we have no plans to sell these securities Unrealized losses in OCI are added back to equity for regulatory capital ratio purposes 9 Dollars in thousands Carrying Value Amortized Cost Fair Value Unrealized Gain (Loss) at 3Q 13 3Q Net Change in Unrealized Gain (Loss) Available for Sale Government Sponsored Enterprises (GSE) Securities 2,082 2,057 2,082 25 4 Residential Mortgage-backed Securities - GSE 357,447 373,860 357,447 (16,413) 1,232 Residential Mortgage-backed Securities - Private 21,258 20,484 21,258 774 (830) Commercial Mortgage-backed Securities - GSE 21,644 22,863 21,644 (1,219) 242 Commercial Mortgage-backed Securities - Private 9,633 10,419 9,633 (786) 69 Corporate Notes 25,007 24,873 25,007 134 (70) Business Development Company Investment 2,641 1,754 2,641 887 887 Total 439,712 456,310 439,712 (16,598) 1,534 Held to Maturity Residential Mortgage-backed Securities - GSE 143,611 143,611 137,055 (6,556) Commercial Mortgage-backed Securities - Private 10,073 10,073 9,419 (654) Total 153,684 153,684 146,474 (7,210) Total Securities 593,396$ 609,994$ 586,186$ (23,808)$ 1,534$ Deferred Tax Impact 810 Net OCI Impact of Change in Unrealized Loss 724$
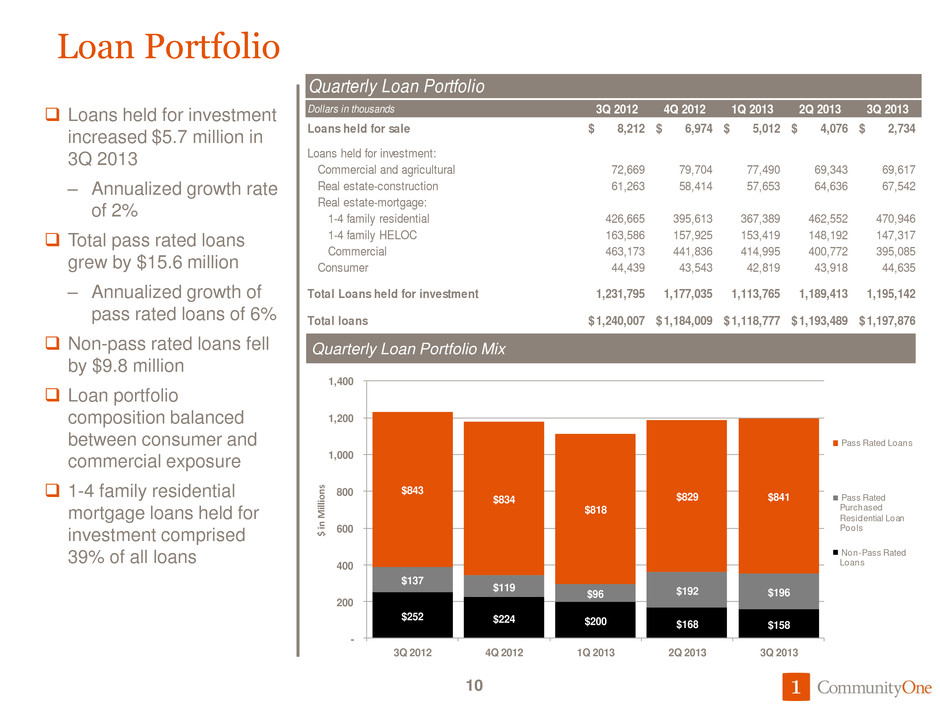
Loan Portfolio Loans held for investment increased $5.7 million in 3Q 2013 – Annualized growth rate of 2% Total pass rated loans grew by $15.6 million – Annualized growth of pass rated loans of 6% Non-pass rated loans fell by $9.8 million Loan portfolio composition balanced between consumer and commercial exposure 1-4 family residential mortgage loans held for investment comprised 39% of all loans 10 Quarterly Loan Portfolio Mix $252 $224 $200 $168 $158 $137 $119 $96 $192 $196 $843 $834 $818 $829 $841 - 200 400 600 800 1,000 1,200 1,400 3Q 2012 4Q 2012 1Q 2013 2Q 2013 3Q 2013 $ in M illion s Pass Rated Loans Pass Rated Purchased Residential Loan Pools Non-Pass Rated Loans Quarterly Loan Portfolio Dollars in thousands 3Q 2012 4Q 2012 1Q 2013 2Q 2013 3Q 2013 Loans held for sale 8,212$ 6,974$ 5,012$ 4,076$ 2,734$ Loans held for investment: Commercial and agricultural 72,669 79,704 77,490 69,343 69,617 Real estate-construction 61,263 58,414 57,653 64,636 67,542 Real estate-mortgage: 1-4 family residential 426,665 395,613 367,389 62,552 470,946 1-4 family HELOC 163,586 157,925 153,419 148,192 147,317 Commercial 463,173 441,836 414,995 400,772 395,085 Consumer 44,439 43,543 42,819 43,918 44,635 Total Loans held for investment 1,231,795 1,177,035 1,113,765 1,189,413 1,195,142 Total loans 1,240,007$ 1,184,009$ 1,118,777$ 1,193,489$ 1,197,876$
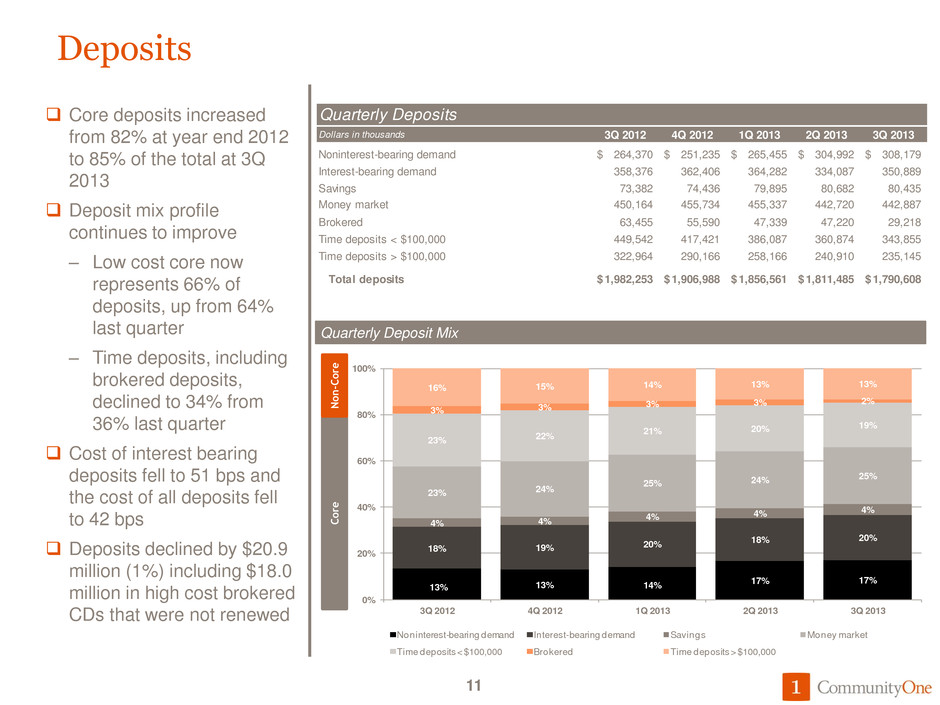
13% 13% 14% 17% 17% 18% 19% 20% 18% 20% 4% 4% 4% 4% 4% 23% 24% 25% 24% 25% 23% 22% 21% 20% 19% 3% 3% 3% 3% 2% 16% 15% 14% 13% 13% 0% 20% 40% 60% 80% 100% 3Q 2012 4Q 2012 1Q 2013 2Q 2013 3Q 2013 Noninterest-bearing demand Interest-bearing demand Savings Money market Time deposits < $100,000 Brokered Time deposits > $100,000 Deposits Core deposits increased from 82% at year end 2012 to 85% of the total at 3Q 2013 Deposit mix profile continues to improve – Low cost core now represents 66% of deposits, up from 64% last quarter – Time deposits, including brokered deposits, declined to 34% from 36% last quarter Cost of interest bearing deposits fell to 51 bps and the cost of all deposits fell to 42 bps Deposits declined by $20.9 million (1%) including $18.0 million in high cost brokered CDs that were not renewed 11 Quarterly Deposit Mix Co re N o n -Co re Quarterly Deposits Dollars in thousands 3Q 2012 4Q 2012 1Q 2013 2Q 2013 3Q 2013 Noninterest-bearing demand 264,370$ 251,235$ 265,455$ 304,992$ 308,179$ Interest-bearing demand 358,376 362,406 364,282 334,087 350,889 Savings 73,382 74,436 79,895 80,682 80,435 Money market 450,164 455,734 455,337 442,720 442,887 Brokered 63,455 55,590 47,339 47,220 29,218 Time deposits < $100,000 449,542 417,421 386,087 360,874 343,855 Time deposits > $100,000 322,964 290,166 258,166 240,910 235,145 Total deposits 1,982,253$ 1,906,988$ 1,856,561$ 1,811,485$ 1,790,608$
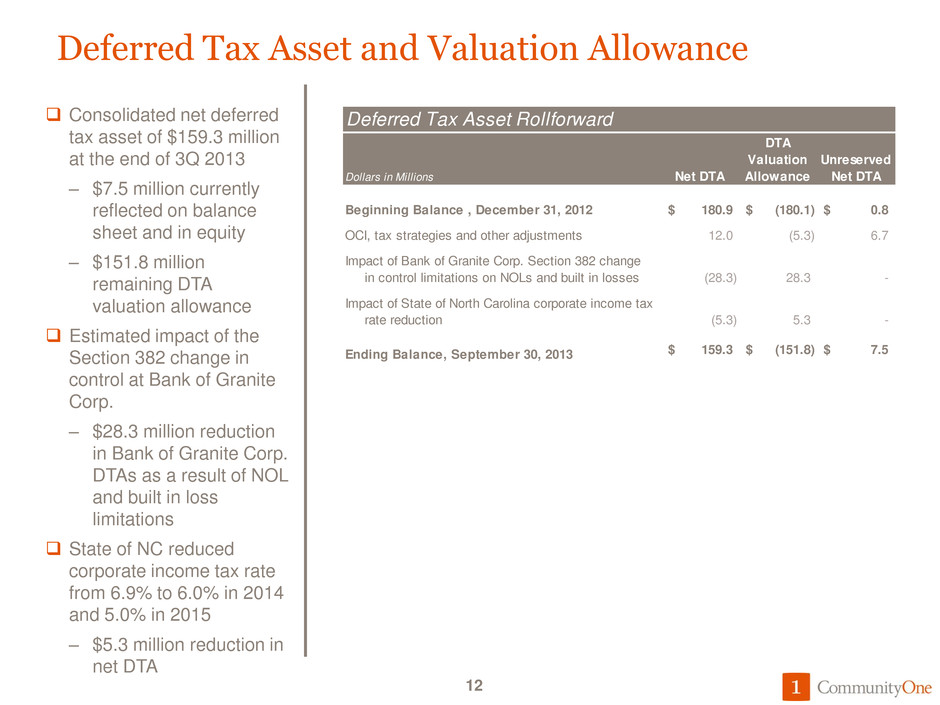
Deferred Tax Asset and Valuation Allowance Consolidated net deferred tax asset of $159.3 million at the end of 3Q 2013 – $7.5 million currently reflected on balance sheet and in equity – $151.8 million remaining DTA valuation allowance Estimated impact of the Section 382 change in control at Bank of Granite Corp. – $28.3 million reduction in Bank of Granite Corp. DTAs as a result of NOL and built in loss limitations State of NC reduced corporate income tax rate from 6.9% to 6.0% in 2014 and 5.0% in 2015 – $5.3 million reduction in net DTA 12 Deferred Tax Asset Rollforward Dollars in Millions Net DTA DTA Valuation Allowance Unreserved Net DTA Beginning Balance , December 31, 2012 180.9$ (180.1)$ 0.8$ OCI, tax strategies and other adjustments 12.0 (5.3) 6.7 (28.3) 28.3 - (5.3) 5.3 - Ending Balance, September 30, 2013 159.3$ (151.8)$ 7.5$ Impact of Bank of Granite Corp. Section 382 change in control limitations on NOLs and built in losses Impact of State of North Carolina corporate income tax rate reduction
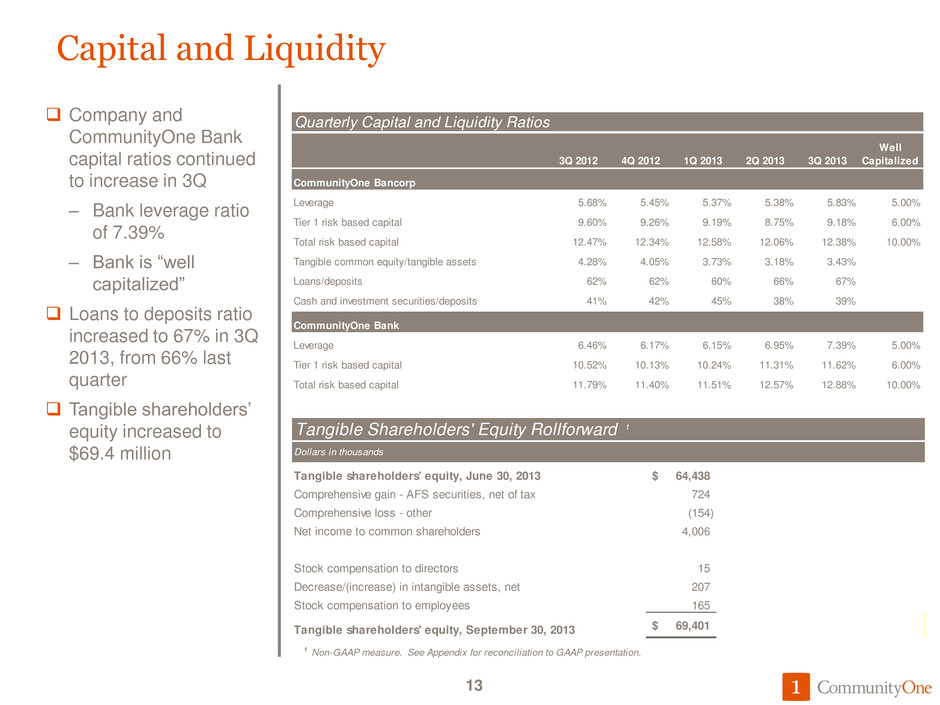
Capital and Liquidity Company and CommunityOne Bank capital ratios continued to increase in 3Q – Bank leverage ratio of 7.39% – Bank is “well capitalized” Loans to deposits ratio increased to 67% in 3Q 2013, from 66% last quarter Tangible shareholders’ equity increased to $69.4 million 13 Quarterly Capital and Liquidity Ratios 3Q 2012 4Q 2012 1Q 2013 2Q 2013 3Q 2013 Well Capitalized CommunityOne Bancorp Leverage 5.68% 5.45% 5.37% 5.38% 5.83% 5.00% Tier 1 risk based capital 9.60% 9.26% 9.19% 8.75% 9.18% 6.00% Total risk based capital 12.47% 12.34% 12.58% 12.06% 12.38% 10.00% Tangible common equity/tangible assets 4.28% 4.05% 3.73% 3.18% 3.43% Loans/deposits 62% 62% 60% 66% 67% Cash and investment securities/deposits 41% 42% 45% 38% 39% CommunityOne Bank Leverage 6.46% 6.17% 6.15% 6.95% 7.39% 5.00% Tier 1 risk based capital 10.52% 10.13% 10.24% 11.31% 11.62% 6.00% Total risk based capital 11.79% 11.40% 11.51% 12.57% 12.88% 10.00% T gible Shareholders' Equity Rollforward 1 Dollars i thousands Tangible shareholders' equity, June 30, 2013 64,438$ Comprehensive gain - AFS securities, net of tax 724 Comprehensive loss - other (154) N t income to common shareholders 4,006 Stock compensation to directors 15 Decrease/(increase) in intangible assets, net 207 Stock compensation to employees 165 Tangible shareholders' equity, September 30, 2013 69,401$ 1 Non-GAAP measure. See Appendix for reconciliation to GAAP presentation.
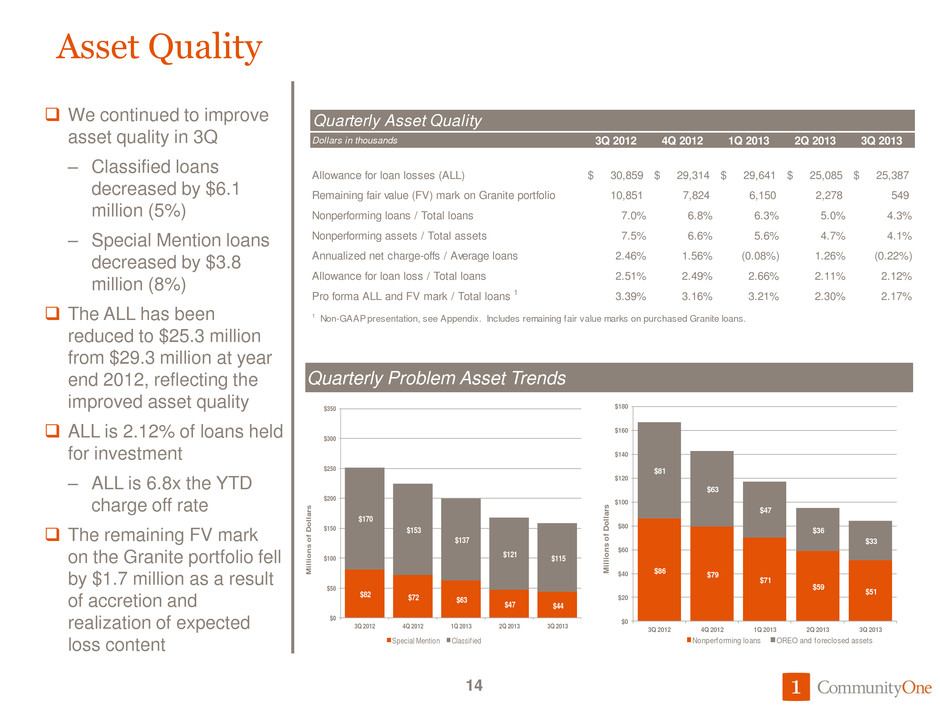
$82 $72 $63 $47 $44 $170 $153 $137 $121 $115 $0 $50 $100 $150 $200 $250 $300 $350 3Q 2012 4Q 2012 1Q 2013 2Q 2013 3Q 2013 M il li o n s o f D o ll ar s Special Mention Classif ied Asset Quality We continued to improve asset quality in 3Q – Classified loans decreased by $6.1 million (5%) – Special Mention loans decreased by $3.8 million (8%) The ALL has been reduced to $25.3 million from $29.3 million at year end 2012, reflecting the improved asset quality ALL is 2.12% of loans held for investment – ALL is 6.8x the YTD charge off rate The remaining FV mark on the Granite portfolio fell by $1.7 million as a result of accretion and realization of expected loss content 14 Quarterly Problem Asset Trends $86 $79 $71 $59 $51 $81 $63 $47 $36 $33 $0 $20 $40 $60 $80 $100 $120 $140 $160 $180 3Q 2012 4Q 2012 1Q 2013 2Q 2013 3Q 2013 M ill io ns o f D ol la rs Nonperforming loans OREO and foreclosed assets Quarterly Asset Quality Dollars in thousands 3Q 2012 4Q 2012 1Q 2013 2Q 2013 3Q 2013 Allowance for loan losses (ALL) 30,859$ 29,314$ 29,641$ 25,085$ 25,387$ Remaining fair value (FV) mark on Granite portfolio 10,851 7,824 6,150 2,278 549 Nonperforming loans / Total loans 7.0% 6.8% 6.3% 5.0% 4.3% Nonperforming assets / Total assets 7.5% 6.6% 5.6% 4.7% 4.1% Annualized net charge-offs / Average loans 2.46% 1.56% (0.08%) 1.26% (0.22%) Allowance f r loan loss / Total loans 2.51% 2.49% 2.66% 2.11% 2.12% Pro forma ALL and FV mark / Total loans 1 3.39% 3.16% 3.21% 2.30% 2.17% 1 Non-GAAP presentation, see Appendix. Includes remaining fair value marks on purchased Granite loans.
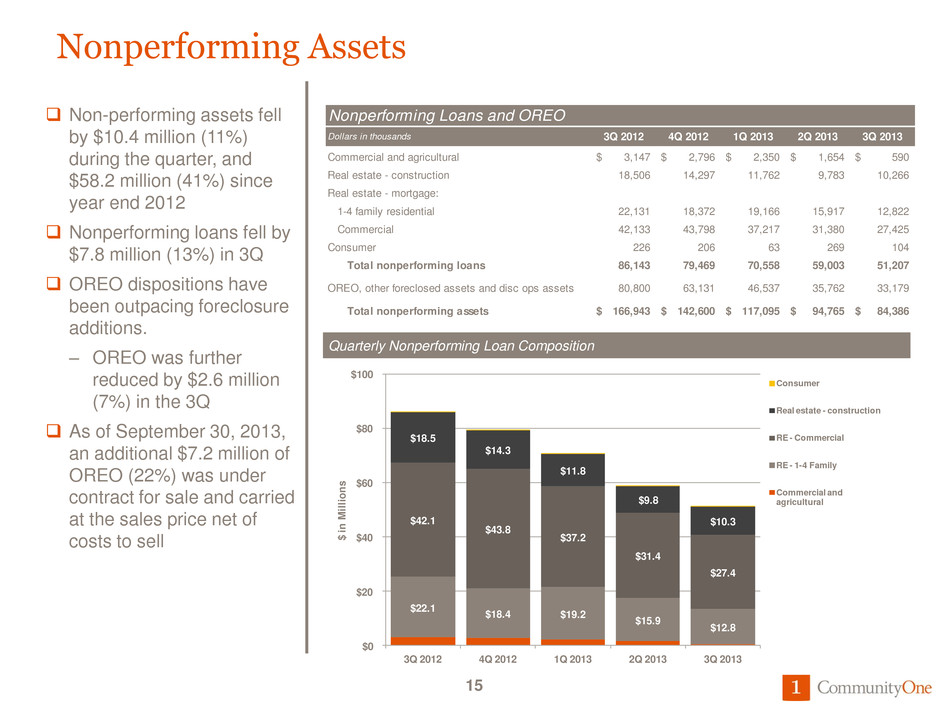
Nonperforming Assets Non-performing assets fell by $10.4 million (11%) during the quarter, and $58.2 million (41%) since year end 2012 Nonperforming loans fell by $7.8 million (13%) in 3Q OREO dispositions have been outpacing foreclosure additions. – OREO was further reduced by $2.6 million (7%) in the 3Q As of September 30, 2013, an additional $7.2 million of OREO (22%) was under contract for sale and carried at the sales price net of costs to sell 15 Quarterly Nonperforming Loan Composition $22.1 $18.4 $19.2 $15.9 $12.8 $42.1 $43.8 $37.2 $31.4 $27.4 $18.5 $14.3 $11.8 $9.8 $10.3 $0 $20 $40 $60 $80 $100 3Q 2012 4Q 2012 1Q 2013 2Q 2013 3Q 2013 $ i n Mi lli on s Consumer Real estate - construction RE - Commercial RE - 1-4 Family Commercial and agricultural Nonperforming Loans and OREO Dollars in thousands 3Q 2012 4Q 2012 1Q 2013 2Q 2013 3Q 2013 Commercial and agricultural 3,147$ 2,796$ 2,350$ 1,654$ 590$ Real estate - construction 18,506 14,297 11,762 9,783 10,266 Real estate - mortgage: 1-4 family residential 22,131 18,372 19,166 15,917 12,822 Commercial 42,133 43,798 37,217 31,380 27,425 Consumer 226 206 63 269 104 Total nonperforming loans 86,143 79,469 70,558 59,003 51,207 OREO, other foreclosed assets and disc ops assets 80,800 63,131 46,537 35,762 33,179 Total nonperforming assets 166,943$ 142,600$ 117,095$ 94,765$ 84,386$
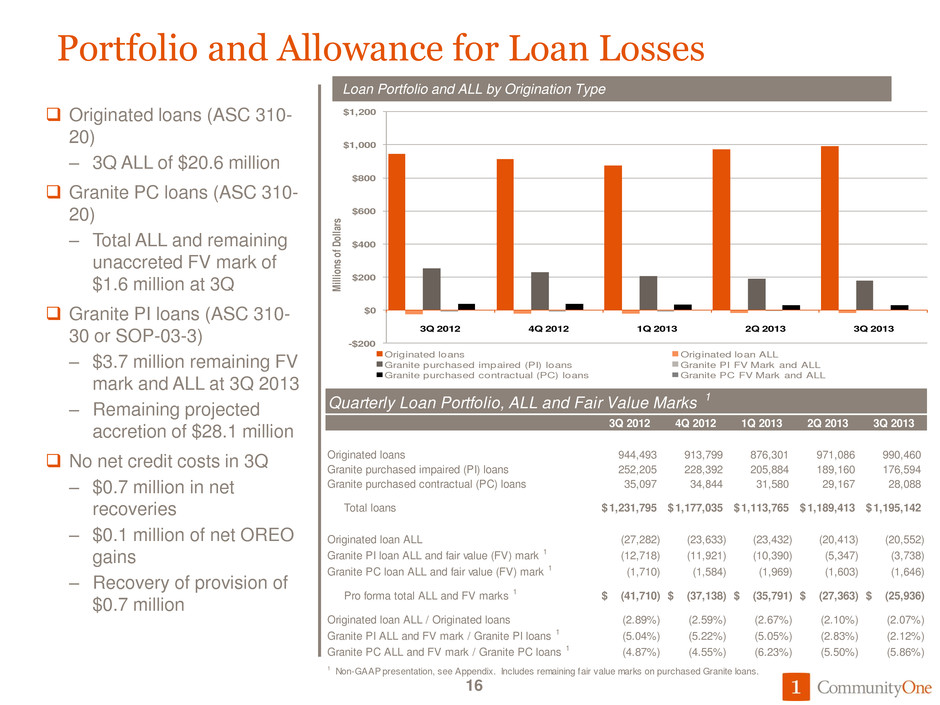
Portfolio and Allowance for Loan Losses Originated loans (ASC 310- 20) – 3Q ALL of $20.6 million Granite PC loans (ASC 310- 20) – Total ALL and remaining unaccreted FV mark of $1.6 million at 3Q Granite PI loans (ASC 310- 30 or SOP-03-3) – $3.7 million remaining FV mark and ALL at 3Q 2013 – Remaining projected accretion of $28.1 million No net credit costs in 3Q – $0.7 million in net recoveries – $0.1 million of net OREO gains – Recovery of provision of $0.7 million 16 Loan Portfolio and ALL by Origination Type -$200 $0 $200 $400 $600 $800 $1,000 $1,200 3Q 2012 4Q 2012 1Q 2013 2Q 2013 3Q 2013 Mi llio ns of Do lla rs Originated loans Originated loan ALL Granite purchased impaired (PI) loans Granite PI FV Mark and ALL Granite purchased contractual (PC) loans Granite PC FV Mark and ALL Quarterly Loan Portfolio, ALL and Fair Value Marks 1 3Q 2012 4Q 2012 1Q 2013 2Q 2013 3Q 2013 Originated loans 944,493 913,799 876,301 971,086 990,460 Granite purchased impaired (PI) loans 252,205 228,392 205,884 189,160 176,594 Granite purchased contractual (PC) loans 35,097 34,844 31,580 29,167 28,088 Total loans 1,231,795$ 1,177,035$ 1,113,765$ 1,189,413$ 1,195,142$ Originated loan ALL (27,282) (23,633) (23,432) (20,413) (20,552) Granite PI loan ALL and fair value (FV) mark 1 (12,718) (11,921) (10,390) (5,347) (3,738) Granite PC loan ALL and f ir value (FV) mark 1 (1,710) (1,584) (1,969) (1,603) (1,646) Pro forma total ALL and FV marks 1 (41,710)$ (37,138)$ (35,791)$ (27,363)$ (25,936)$ Originated loan ALL / Originated loans (2.89%) (2.59%) (2.67%) (2.10%) (2.07%) Granite PI ALL and FV mark / Granite PI loans 1 (5.04%) (5.22%) (5.05%) (2.83%) (2.12%) Granite PC ALL and FV mark / Granite PC loans 1 (4.87%) (4.55%) (6.23%) (5.50%) (5.86%) 1 Non-GAAP presentation, see Appendix. Includes remaining fair value marks on purchased Granite loans.
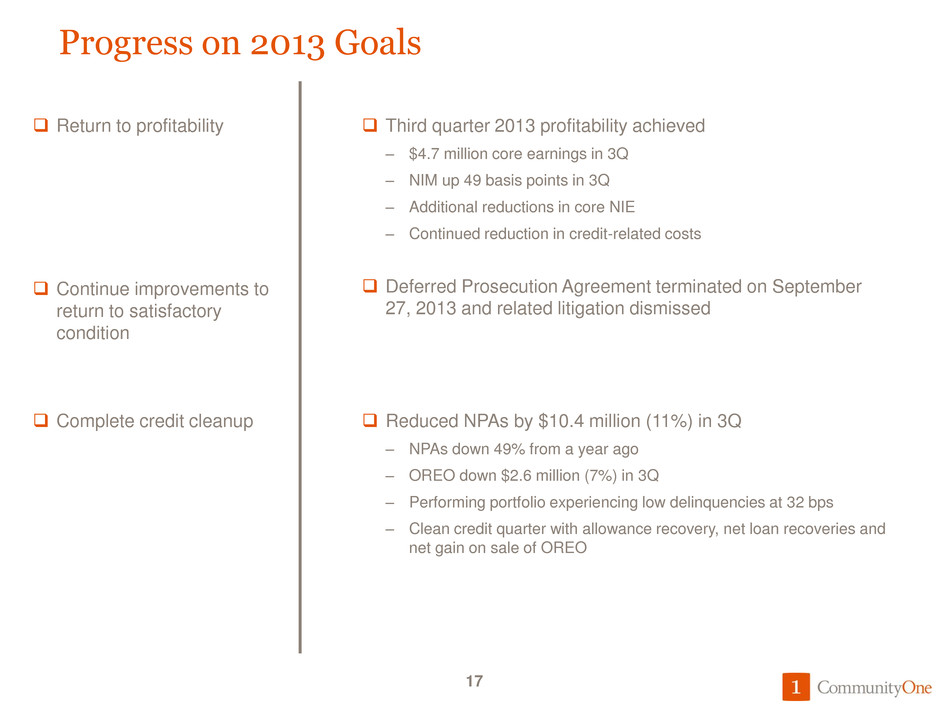
17 Deferred Prosecution Agreement terminated on September 27, 2013 and related litigation dismissed Continue improvements to return to satisfactory condition Reduced NPAs by $10.4 million (11%) in 3Q – NPAs down 49% from a year ago – OREO down $2.6 million (7%) in 3Q – Performing portfolio experiencing low delinquencies at 32 bps – Clean credit quarter with allowance recovery, net loan recoveries and net gain on sale of OREO Complete credit cleanup Third quarter 2013 profitability achieved – $4.7 million core earnings in 3Q – NIM up 49 basis points in 3Q – Additional reductions in core NIE – Continued reduction in credit-related costs Return to profitability Progress on 2013 Goals 17
Appendix 18
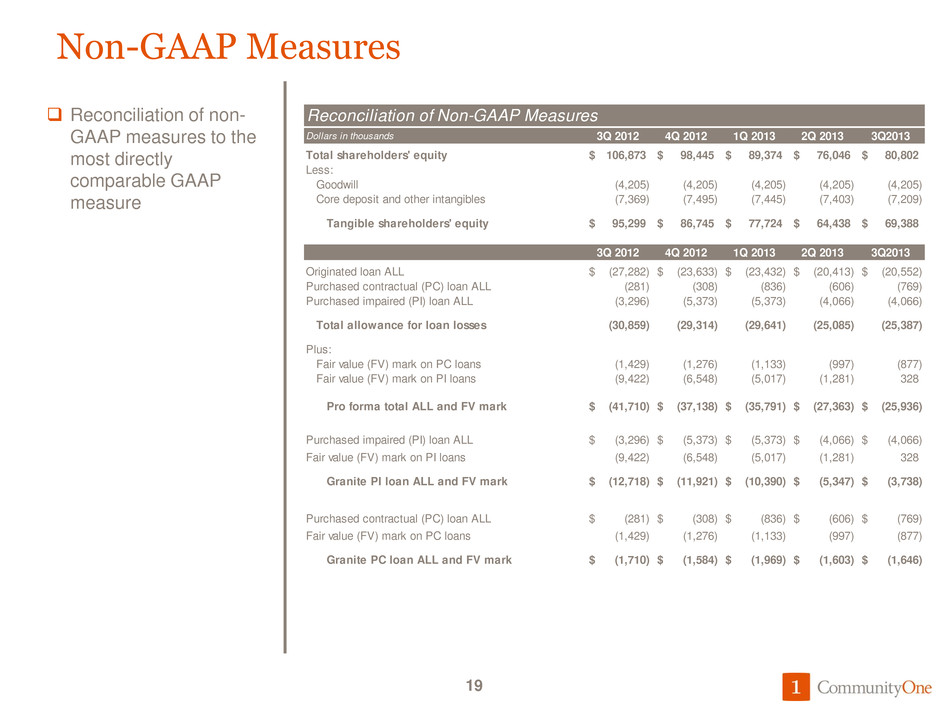
Non-GAAP Measures Reconciliation of non- GAAP measures to the most directly comparable GAAP measure 19 Reconciliation of Non-GAAP Measures Dollars in thousands 3Q 2012 4Q 2012 1Q 2013 2Q 2013 3Q2013 Total shareholders' equity 106,873$ 98,445$ 89,374$ 76,046$ 80,802$ Less: Goodwill (4,205) (4,205) (4,205) (4,205) (4,205) Core deposit and other intangibles (7,369) (7,495) (7,445) (7,403) (7,209) Tangible shareholders' equity 95,299$ 86,745$ 77,724$ 64,438$ 69,388$ 3Q 2012 4Q 2012 1Q 2013 2Q 2013 3Q2013 Originated loan ALL (27,282)$ (23,633)$ (23,432)$ (20,413)$ (20,552)$ Purchased contractual (PC) loan ALL (281) (308) (836) (606) (769) Purchased impaired (PI) loan ALL (3,296) (5,373) (5,373) (4,066) (4,066) Total allowance for loan losses (30,859) (29,314) (29,641) (25,085) (25,387) Plus: Fair value (FV) mark on PC loans (1,429) (1,276) (1,133) (997) (877) Fair value (FV) mark on PI loans (9,422) (6,548) (5,017) (1,281) 328 Pro forma total ALL and FV mark (41,710)$ (37,138)$ (35,791)$ (27,363)$ (25,936)$ Purchased impaired (PI) loan ALL (3,296)$ (5,373)$ (5,373)$ (4,066)$ (4,066)$ Fair value (FV) mark on PI loans (9,422) (6,548) (5,017) (1,281) 328 Granite PI loan ALL and FV mark (12,718)$ (11,921)$ (10,390)$ (5,347)$ (3,738)$ Purchased contractual (PC) loan ALL (281)$ (308)$ (836)$ (606)$ (769)$ Fair value (FV) mark on PC loans (1,429) (1,276) (1,133) (997) (877) Granite PC loan ALL and FV mark (1,710)$ (1,584)$ (1,969)$ (1,603)$ (1,646)$
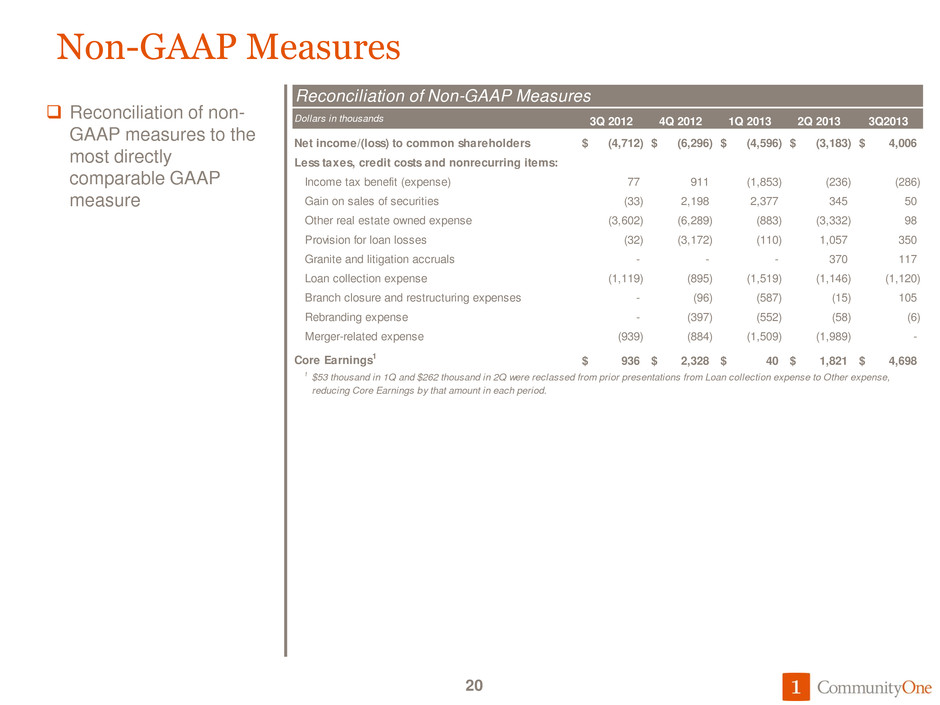
Non-GAAP Measures Reconciliation of non- GAAP measures to the most directly comparable GAAP measure 20 Reconciliation of Non-GAAP Measures Dollars in thousands 3Q 2012 4Q 2012 1Q 2013 2Q 2013 3Q2013 Net income/(loss) to common shareholders (4,712)$ (6,296)$ (4,596)$ (3,183)$ 4,006$ Less taxes, credit costs and nonrecurring items: TaxesIncome tax benefit (expense) 77 911 (1,853) (236) (286) Other real estate owned expenseGain on sales of securiti s (33) 2,198 2,377 345 50 Provision expenseOther real estate owned expense (3,602) (6,289) (883) (3,332) 98 Merger related expenseProvision for loan losses (32) (3,172) (110) 1,057 350 Granite and litigation accruals - - - 370 117 Loan collection expense (1,119) (895) (1,519) (1,146) (1,120) Branch closure and restructuring expenses - (96) (587) (15) 105 Rebranding expense - (397) (552) (58) (6) Merger-related expense (939) (884) (1,509) (1,989) - Core Earnings1 936$ 2,328$ 40$ 1,821$ 4,698$ 1 $53 thousand in 1Q and $262 thousand in 2Q were reclassed from prior presentations from Loan collection expense to Other expense, reducing Core Earnings by that amount in each period.
